Article

Land Use and Land Cover Changes: A Case Study in Nigeria

by
Olanrewaju H. Ologunde
1,*,
Mordiyah O. Kelani
2,
Moges K. Biru
1,
Abdullahi B. Olayemi
3 and
Márcio R. Nunes
1,*
1
Department of Soil, Water, and Ecosystem Sciences, Global Food Systems Institute, University of Florida, Gainesville, FL 32611, USA
2
Department of Forestry and Wildlife Management, Federal University of Agriculture, Abeokuta P.M.B. 2240, Nigeria
3
Department of Soil Science, Faculty of Agriculture, Institute for Agricultural Research, Ahmadu Bello University, Zaria P.M.B. 1044, Nigeria
*
Authors to whom correspondence should be addressed.
Land 2025, 14(2), 389; https://doi.org/10.3390/land14020389
Submission received: 13 January 2025 / Revised: 28 January 2025 / Accepted: 12 February 2025 / Published: 13 February 2025
(This article belongs to the Special Issue Advances in Land Use and Land Cover Mapping (Second Edition))

Abstract

:
Land Use and Land Cover (LULC) assessment is vital for achieving sustainable ecosystems. This study quantified and mapped the spatiotemporal LULC changes in Ado-Odo Ota Local Government Area of Ogun State, Nigeria, between 2015 and 2023. The LULC was classified into water, forest or thick bush, sparse vegetation, built-up, and bare land using Landsat images. Processing, classification, and image analysis were done using the ESRI ArcGIS Pro 3.3. LULC changed from 2015 to 2023, with built-up areas and sparse vegetation increasing by 138.2 km2 and 28.7 km2, respectively. In contrast, forest or thick bush, which had the greatest change among the LULC classes, decreased by 153.7 km2 over this period while bare land and water bodies decreased by 9.5 km2 and 3.8 km2, respectively. Forest or thick bush (201.0 km2) was converted to sparse vegetation, which reflects an increase in agricultural activities in the region. The conversion of about 109.8 km2 of vegetation and 3.7 km2 of water bodies to built-up areas highlights considerable urbanization. Overall, the increase in the built-up area highlights the need for sustainable land use practices to balance urban growth with ecological preservation, achievable through effective management and policy frameworks.

1. Introduction

Land is a finite natural resource that supports life on Earth, and its conservation and efficient utilization is vital. However, the burgeoning human population and global economic growth are strongly increasing the demand for land resources and changing the dynamics of land use and land cover (LULC) [1]. These terms are often used interchangeably, but land cover refers to the observed physical features of the Earth’s surface (e.g., forest, water, soil, infrastructure, etc.), while land use defines the changes in land cover resulting from human usage for habitat and economic gains [2]. The environmental degradation resulting from the change in LULC is almost irreversible, necessitating regular monitoring [2,3]. This also relates to the fact that land use is best measured by the changes in land cover [4].
LULC changes are driven by various factors including population pressure, industrialization, weather variability, and economic variables which collectively exacerbate environmental degradation [5]. The swift population growth and economic development over the past few decades have intensified the transformation of landscapes in urban regions. Global urban land area is projected to triple from 2000 to 2030 [6]. This growth is expected to rapidly increase in built-up areas including buildings, roads, and industrial facilities, thereby reducing green covers and LULC [7]. Although urbanization offers vast benefits including higher social networking, easier access to education and health facilities, and greater division of labor [8], it often contributes to LULC changes and environmental degradation [9,10,11]. Also, weather variation due to climate change further influences LULC by altering temperature and precipitation patterns, which disrupt ecosystems and affect human land-use decisions. For instance, rising temperatures and irregular rainfall contribute to vegetation shifts, reduced agricultural productivity, and increased conversion of forests to farmlands or urban spaces [12]. The combined influence of urbanization and climate change exacerbates poor water resource management, groundwater depletion, noise and chemical pollution, and microclimate warming, disproportionately affecting developing countries [13,14,15]. Therefore, understanding the extent and dynamics of land use change is crucial in designing effective strategies for sustainable land resource management and ecological resilience [7,16,17].
Monitoring LULC changes is crucial for understanding its drivers, dynamics, and impacts from precedent records of a particular area; it can provide scientific evidence and guidance for effective land resource use and environmental protection [13]. In this regard, geospatial techniques, such as remote sensing (RS) and geographic information systems (GIS), can provide high-resolution imagery and spatial data to monitor urban growth, assess infrastructure changes, and classify land cover types [14]. Furthermore, integrating satellite images with GIS allows detecting and visualizing the trends in land use changes over time, and making data-driven decisions for sustainable development [15]. These technologies are valuable for the timely detection of land degradation, in a small to large geographical location.
Nigeria’s population (227 million people) is ranked sixth in the world and is the most populous country in Africa (https://data.worldbank.org/; accessed on 27 December 2024). However, the country is faced with an acute level of food insecurity affecting about nine million people, with the projection to increase without effective mitigation strategies [17]. Achieving the food security goal is complicated by the large migration of young farmers from the rural community to the metropolis, coupled with the drastic change in land use and land cover change due to land resource misuse [16]. Consequently, LULC changes have become a pressing ecological challenge confronting many Nigerian states [18], though research attention in this area remains low [19].
Advancements in remote sensing and GIS techniques have enabled researchers to better understand the dynamics of land use changes in major cities, particularly state capitals where government interventions such as road construction, building projects, and job creation are concentrated [19,20,21]. These studies highlighted the urban degradation and potential loss of green vegetation in the capital regions of Nigeria and suggested prompt monitoring of LULC changes for sustainable urban planning. However, emerging and developing areas have received comparatively less research attention.
Ado-Odo Ota local government area (LGA) in Ogun state, Southwest Nigeria is rapidly industrializing and evolving into a major commercial hub. The area hosts large markets that contribute the highest Internally Generated Revenue (IGR) for the state [22,23]. This socioeconomic growth, however, has been linked to significant environmental challenges, including habitat destruction, soil degradation, water pollution, and increased erosion [23,24,25,26], adversely affecting human life and environmental quality. Despite these challenges, no assessment has been conducted to examine the LULC transformations in the area, i.e., quantifying the magnitude, patterns, and maps to show changes, which could be related to environmental degradation. Therefore, this study aims to quantify LULC changes in Ota LGA and produce geospatial maps covering the period from 2015 to 2023 using remote sensing and GIS techniques. By analyzing land use trends over time, this research will provide valuable insights for managing future changes and promoting both social and environmental sustainability, thereby contributing to the achievement of the sustainable development goal of improved life on land. It will also offer expert recommendations to mitigate the negative effects of urbanization, preserve biodiversity, and encourage sustainable land-use practices, ultimately improving the quality of life in the area.

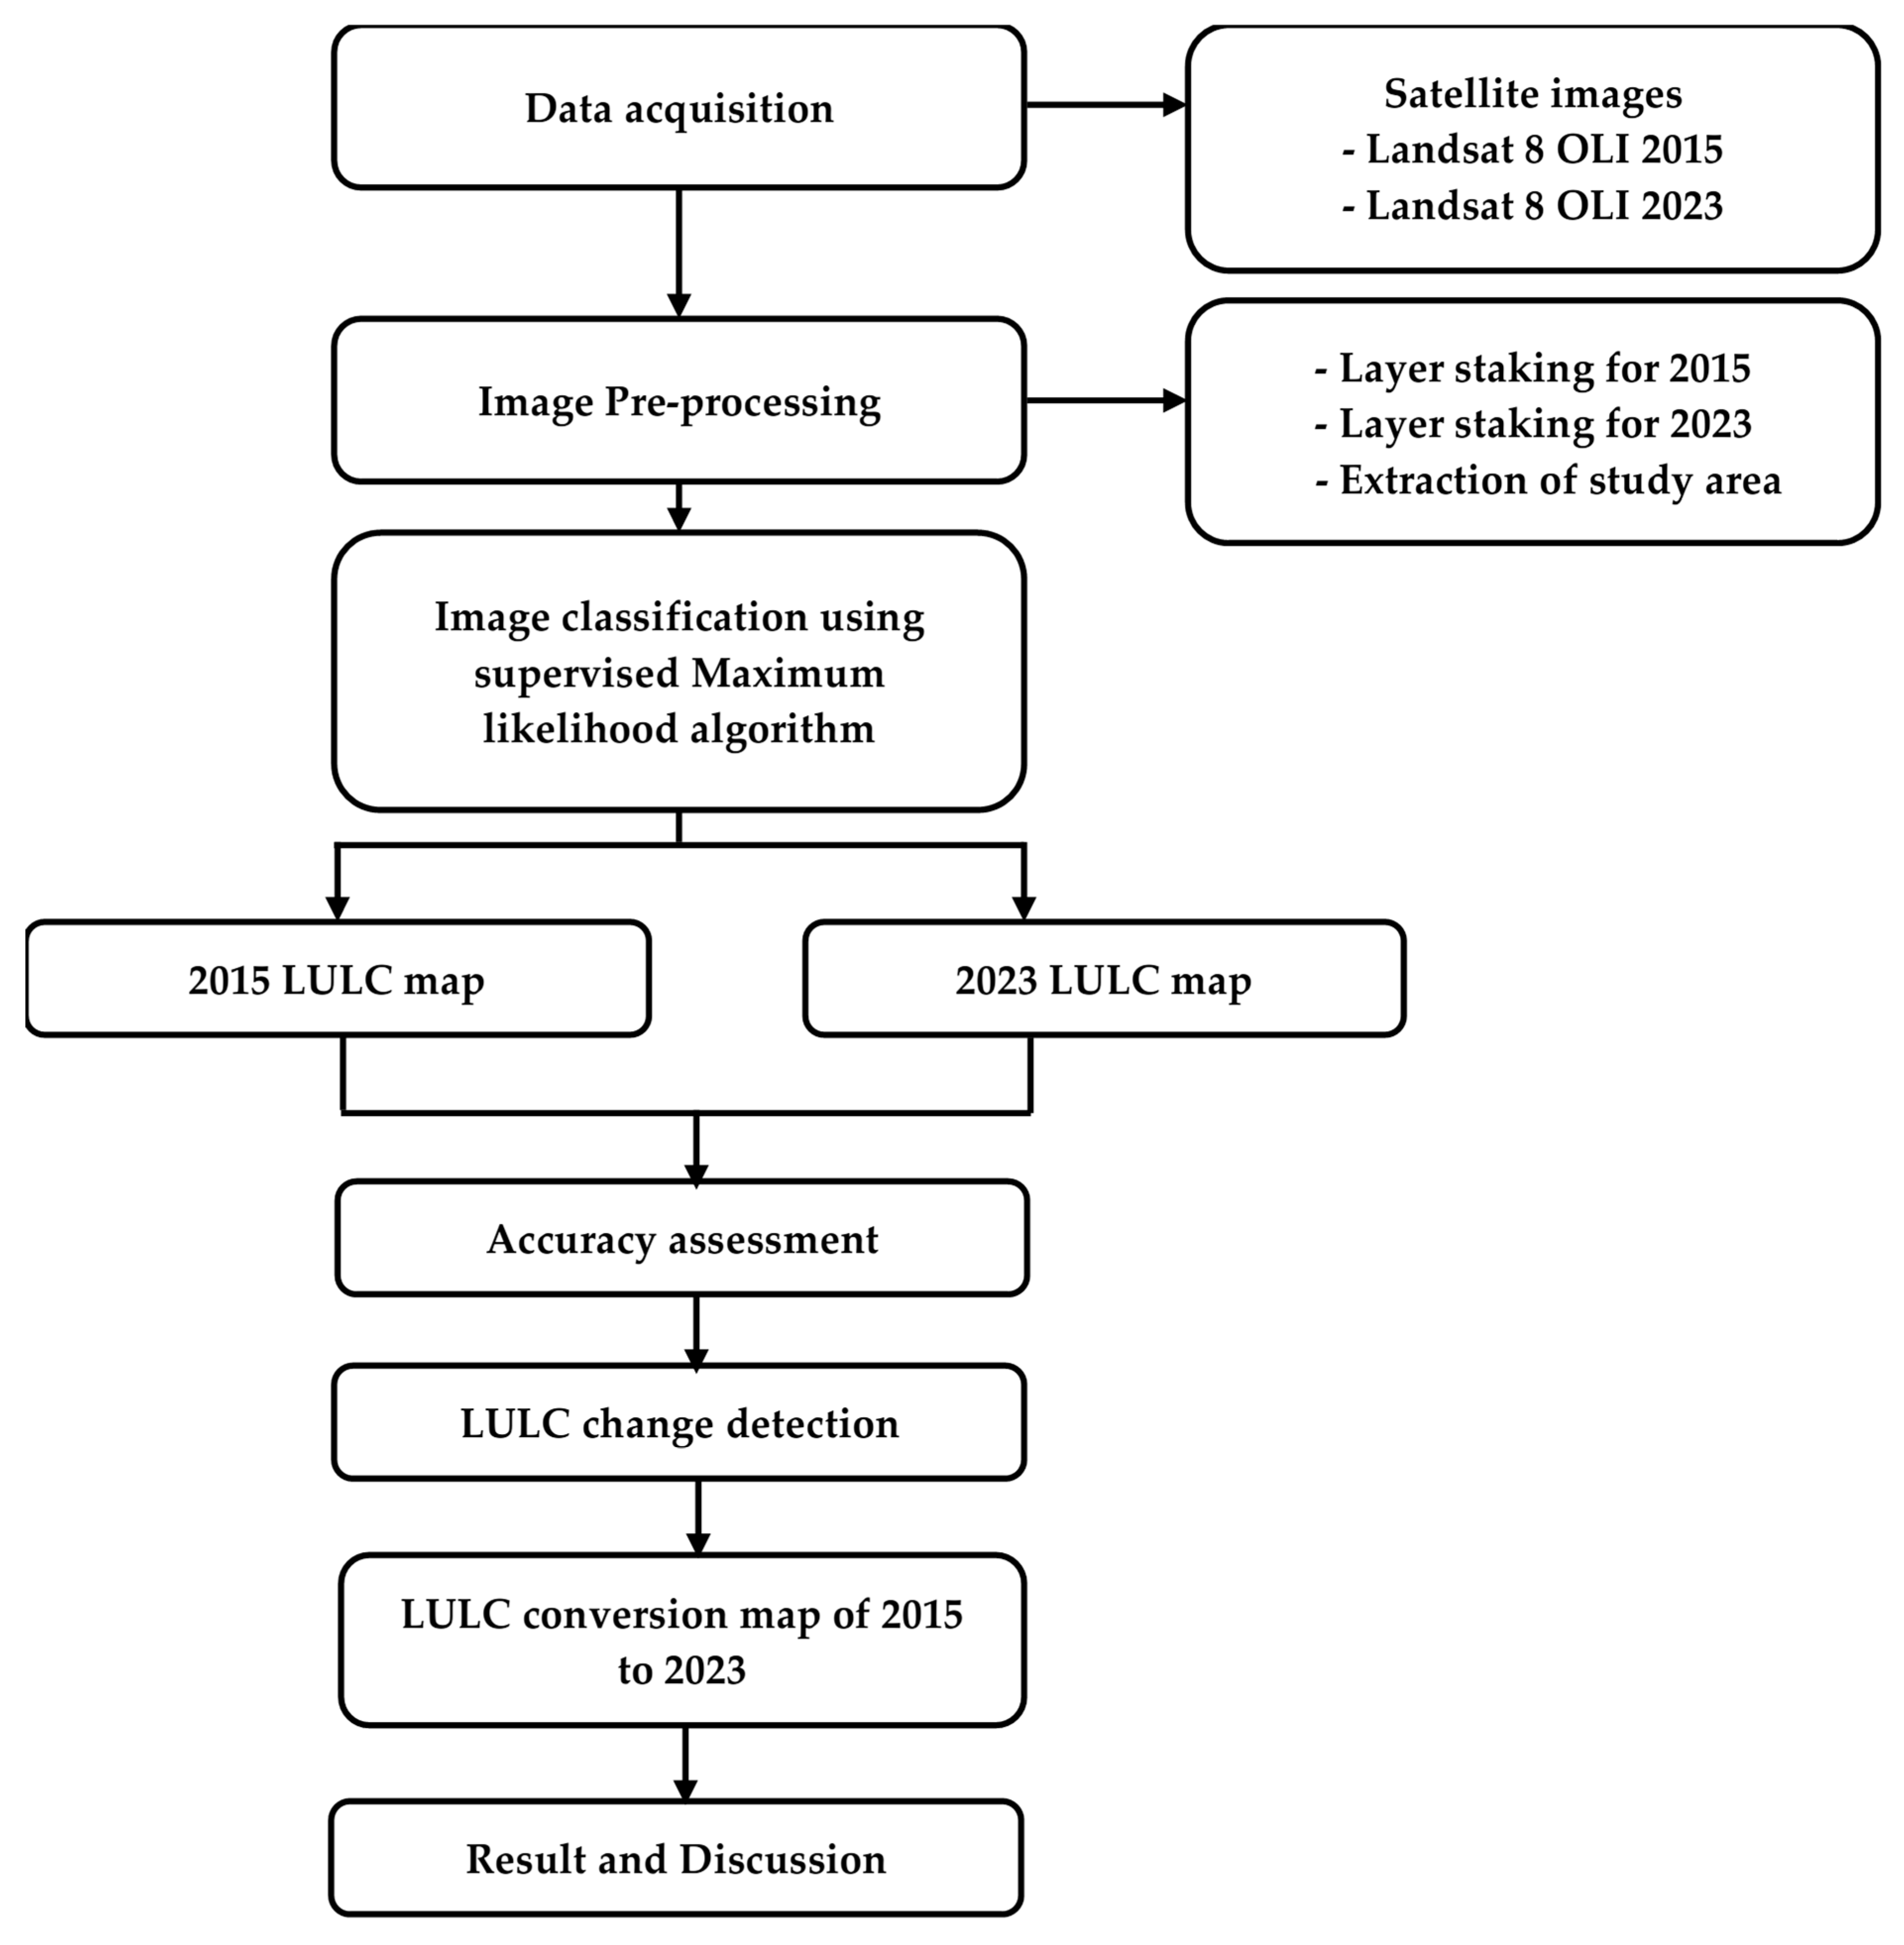
2. Materials and Methods

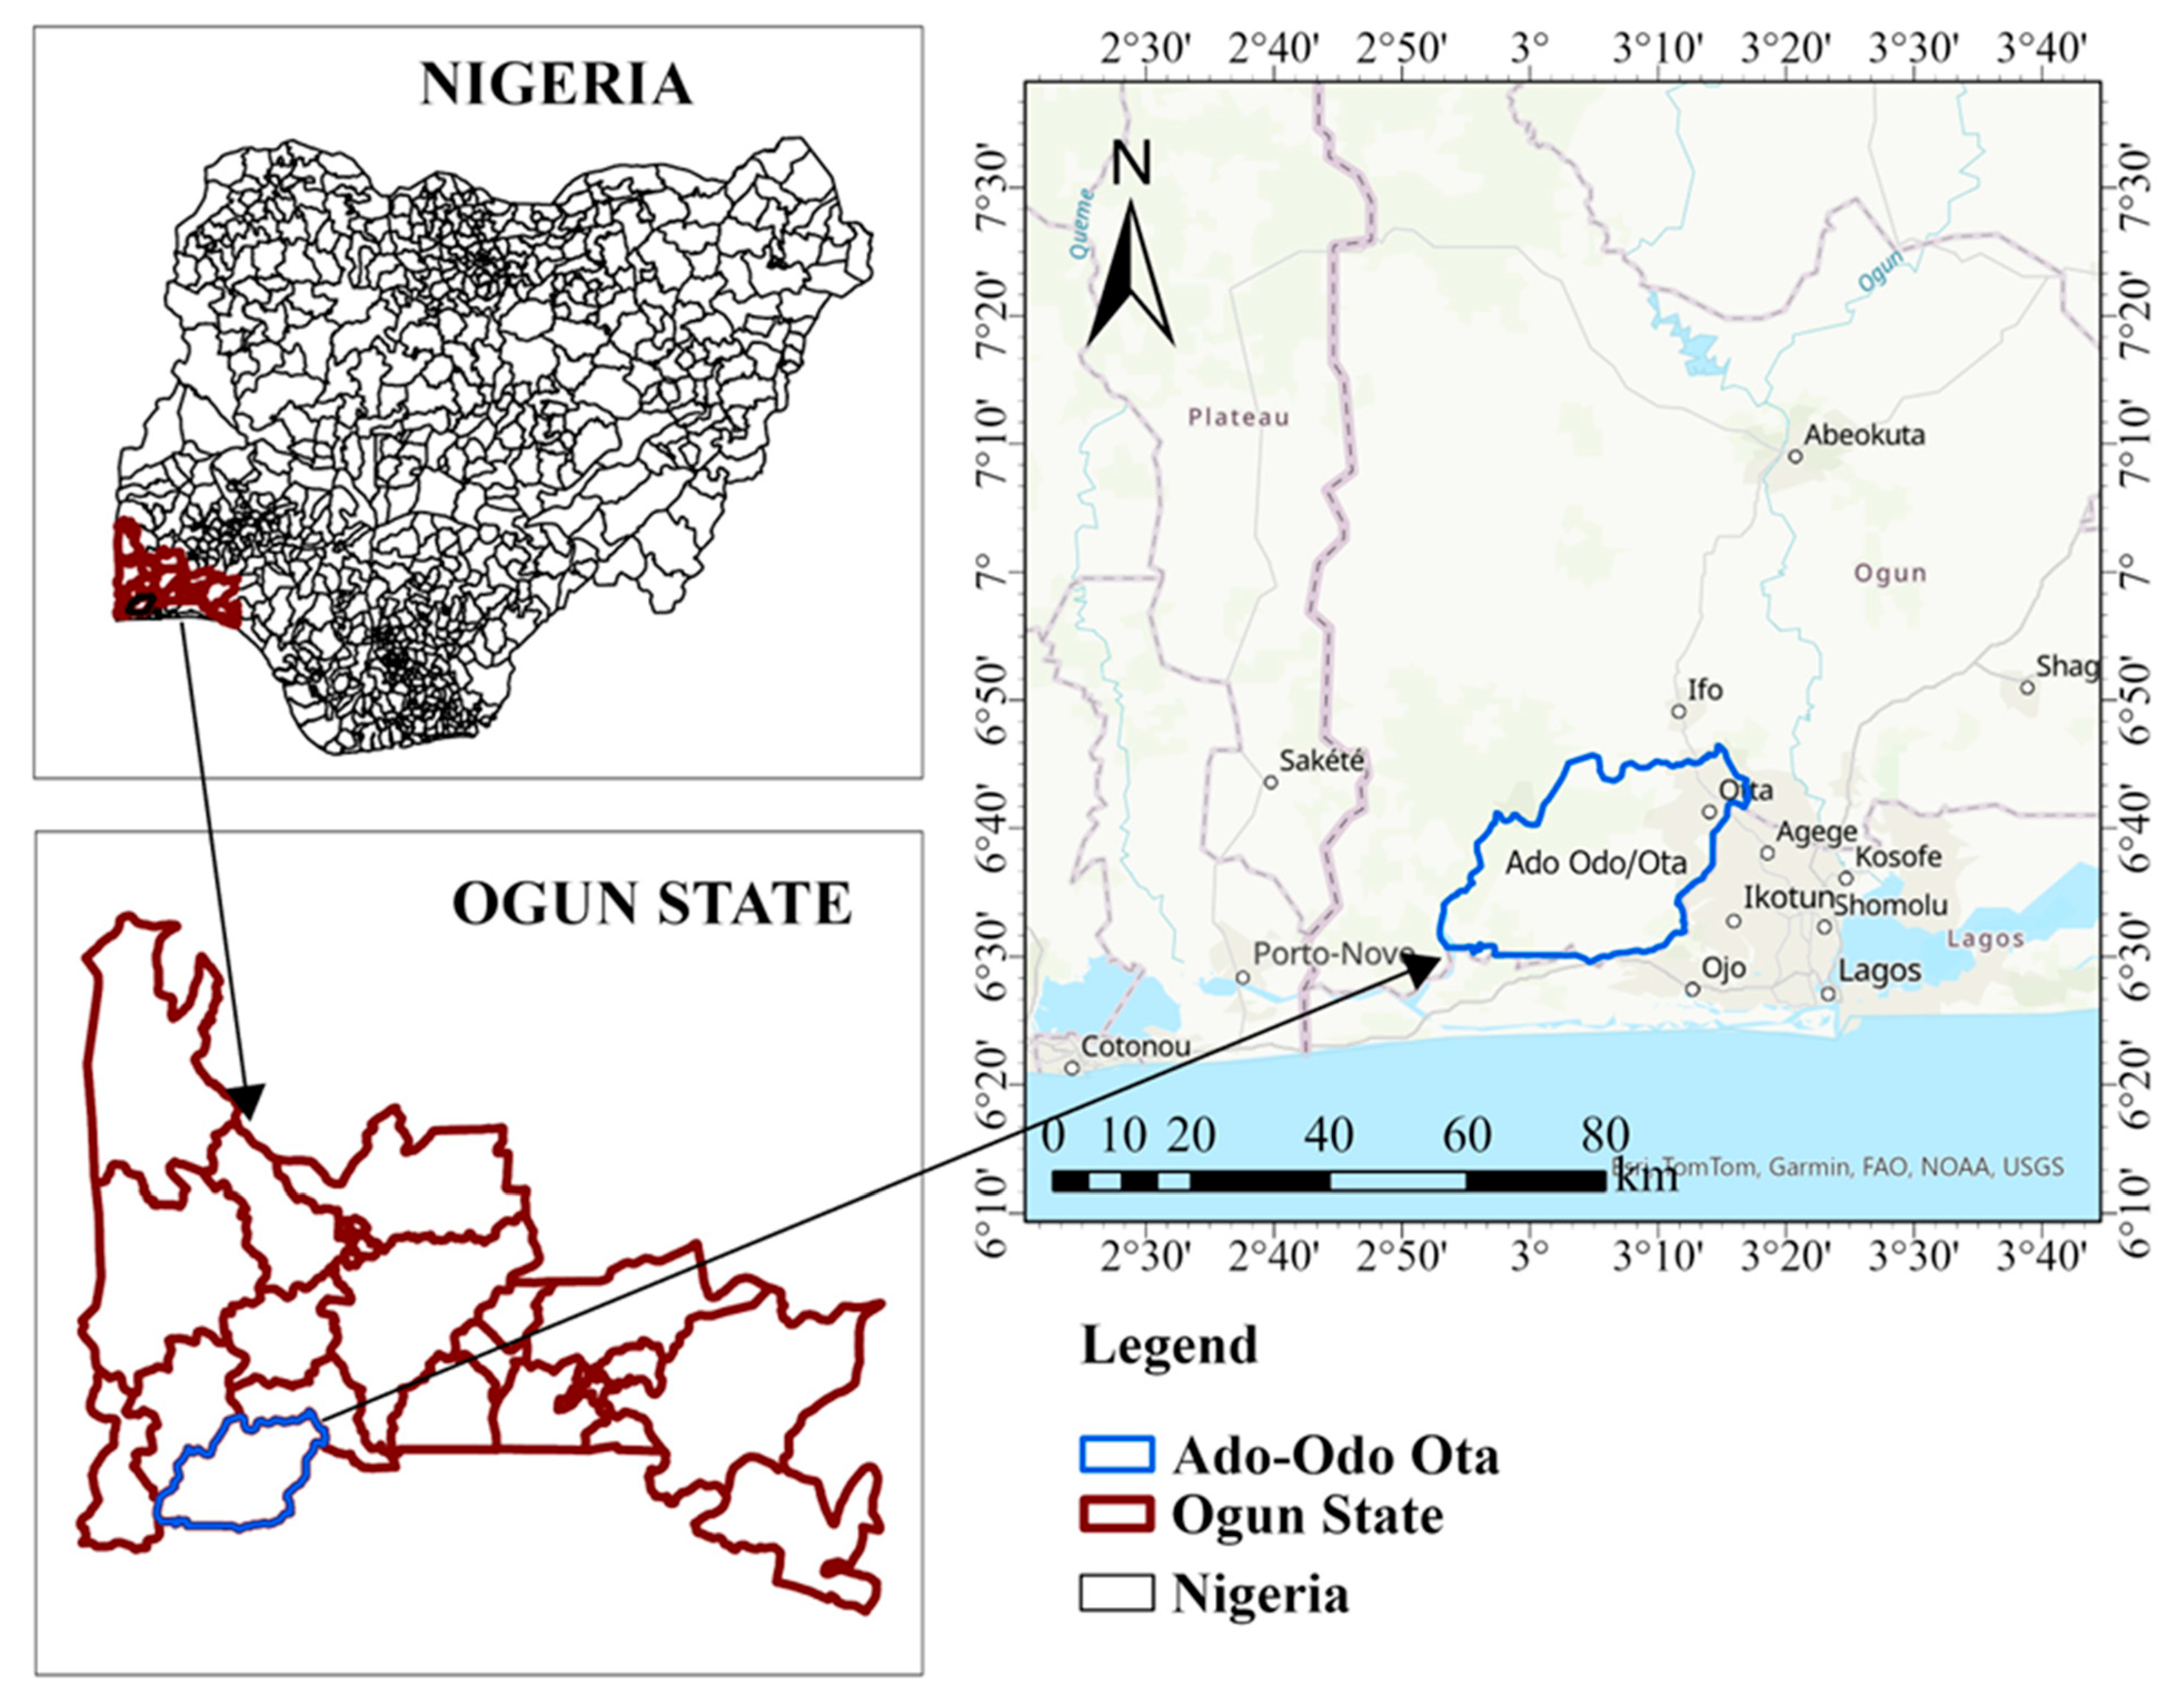
2.1. Description of the Study Area

The study area is Ado-Odo Ota Local Government Area (LGA), one of the 20 local governments in Ogun State, located in the Southwest region of Nigeria (Figure 1). Geographically, the LGA lies between 6°40′58.52″ N–7°00′00″ N of the Greenwich Meridian and Latitudes 3°8′53.87″ E–3°8′57.86″ E of the equator. The study is characterized by lowlands, valleys, and hills with sedimentary terrains [24]. The LGA is bordered by Lagos state to the east and south, Yewa south and Ifo Local Government areas to the north, and Ipokia Local Government to the west. Given the high industrial and commercial development in this region, there is a consequential increase in human population and pressure on land resources, making it pertinent to understudy land use and land cover changes to ensure sustainable land resource use.

2.2. Data Collection and Analysis

The methodological workflow to identify changes in Land Use and Land Cover (LULC) between 2015 and 2023 is shown in Figure 2, starting from data acquisition. Landsat 8 Operational Land Imager (OLI) satellite images of 30 m resolution, path 191 and row 55 were freely downloaded from the repositories of United States Geological Survey (USGS) through NASA’s Earth Observing System platform (https://earthexplorer.usgs.gov/; accessed on 26 October 2024) for the years of study. The images were obtained between December and February to obtain zero cloud images and were projected to the Universal Transverse Mercator (UTM) of the World Geodetic System (WGS84). Further details of the Landsat images are presented in Table 1.

2.3. Land Use and Land Cover Classification Method

The spectral bands 1 to 7 of the 11 bands of Landsat 8 OLI were composited to form a single image for each study year. The true color (band 4-3-2) composites were used to enhance the verification and interpretation of the LULC classes (Figure 3). These color composites were integrated with Google Earth to obtain training samples with reference to Google Earth, as described by [27]. The LULC of the study area was classified into five classes, namely, water bodies, sparse vegetation, forest or thick bush, bare land, and built-up (Table 2) using a pixel-based supervised classification approach. Supervised classification involves creating spectral signatures for known categories, allowing the software to assign each image pixel to the cover type with the closest matching signature [28]. To achieve this, Maximum Likelihood Classifier (MLC) was applied, which is well-suited and adopted for LULC classification [29,30]. MLC easily assesses pixel similarity and variance of a few numbers of classes and less spectral heterogeneity. It calculates the probability of each pixel belonging to a given spectral class and assigns it to the class with the highest probability [31]. This method enhances classification accuracy by incorporating the statistical distribution of training data for each category, producing a precise LULC map.

2.4. Land Use and Land Cover Accuracy Assessment

The accuracy assessment matrix provides insight into the correspondence between classified land uses and actual ground conditions [13]. The LULC classification accuracy assessment was conducted on the classified visual output and presented in a confusion matrix. Validation points were randomly and spatially distributed for accuracy testing using a stratified random sampling approach. Assessment points were allocated based on the area size of each LULC class. The generated sampling points were imposed on the high-resolution historical imagery from Google Earth Pro 7.3.6 to manually validate the sample location by zooming in to have a better view of the sample location of the two study time nodes [32]. The key accuracy metrics computed to evaluate classification performance were producer’s accuracy (Equation (1)), user’s accuracy (Equation (2)), overall accuracy (Equation (3)), and Kappa coefficient (Equation (4)) [29,33]. Producer’s accuracy (PA) assesses how often a class on the map is represented on the ground while user’s accuracy (UA) measures the reliability of the assigned pixel class on the map to that on the ground [34]. Kappa coefficient (Kappa) was measured to determine the inter-dependence between the classes, whereas overall accuracy (OA) measures classification success as the proportion of correctly classified pixels to total pixels [35].
P A % = x k k x + k × 100
U A % = x k k x k + × 100
O A   ( % ) = 1 N   k = 1 r n i × 100
k a p p a   % = N k = 1 r x k k k = 1 r x k + 1 ·   x + k N 2 k = 1 r x k k x k + 1 ·   x + k × 100
where N is the total pixel observations, r is the number of rows in the matrix, xkk is the number of observations in both row, and column k, x+k and xk+1 are the marginal totals of row k and column k, respectively.
The availability of high-quality satellite images with cloud-free views is a critical factor that influences the accuracy of LULC assessment [36,37]. Cloud-free images ensure unobstructed visibility of the Earth’s surface, allowing for precise identification and classification of land features [38]. For this reason, we were unable to assess the LULC changes in the preceding years of this study period and area due to the unavailability of data and poor image quality, until 2015.

2.5. Land Use and Land Cover Change Detection

LULC change detection is essential to quantify in an area the magnitude of change over a period [39,40]. Post-classification comparison was used to detect this change in LULC involving image classification and comparison between the different classes. This approach is beneficial because it reduces atmospheric effects and allows for a more precise categorization of LULC classes [41]. This was conducted by converting classified raster images into vector layers [29]. The relative change (RC; Equation (5)), percentage change (CPC; Equation (6)), and annual percentage change (APC; Equation (7)) were determined to understand the quantitative LULC changes of each LULC class.
R C   ( k m 2 ) = β 2 β 1
C P C   ( % ) = β 1 β 2 β 1 × 100
A P C % = β 2 β 1 ƞ × 100
where β1 and β2 are the areas of LULC at the initial and final study years in km2, and ƞ is the number of years between the study period.
The ESRI ArcGIS Pro 3.3 was used for image processing, classification, and analysis while Excel and R Studio were used to compute results and generate the graphs, respectively.

3. Results and Discussion

3.1. Classification Accuracy Assessment

Mapping processes that involve remote sensing and satellite images for LULC classification are prone to generalization of the pixels and contribute to bias and errors, necessitating post-classification assessment for confidence use of generated maps [42,43]. Table 3 presents the confusion matrix results used to assess the accuracy of LULC classification in this study. The overall and Kappa accuracies were 83.3% and 78.9% for 2015 and 84.1% and 79.8% for 2023, respectively. The statistical coefficient for Kappa and overall accuracies were greater than 70%, indicating the agreements between the generated and referenced LULC classifications [44,45]. The producer and user accuracies for the water LULC class were 100.0%. Sparse vegetation and forest or thick bush were also better classified with user and producer accuracies between 75–100%. The user accuracy performed better (70.0–100.0%) than the producer accuracy (63.6–87.5%) for built-up and bare land. The low producer accuracy of built-up and bare land classes can be due to the misclassification of both land use classes as the pixel color may be closely related [46]. User classification ranged from 70.0% (bare land class) to 100% (water). User accuracy is important to the end users of the maps in the field including the researchers and policymakers [28]. The high assessment coefficients produced by accuracy metrics obtained in this study are in consonance with previous studies that suggest the reliability of the LULC classification [31,45,47].

3.2. Temporal and Spatial Dynamics of Land Use and Land Cover

The changes in the LULC classes for 2015 and 2023 are presented in Figure 4 and Figure 5, respectively. In 2015, sparse vegetation accounted for 46.1% of the study area, followed by forest or thick bush (37.4%) and bare land cover (3.3%) (Figure 4). In 2023, the LULC classification followed the sequence; sparse vegetation (49.4%) > built-up (28.9%) > forest or thick bush (19.4%) > bare land (2.2%) > water bodies (0.1%) (Figure 5). The results indicated that the study area was predominantly covered by sparse vegetation and forest or thick bush in 2015, while sparse vegetation and built-up areas dominated in 2023. This confirms that changes in LULC are inevitable, possibly due to complex interactions between human activities and natural processes [36,37].
There was a significant shift in the trends of LULC classes from 2015 to 2023 (Table 4). The positive trend denotes an increase while the negative trend denotes a reduction for a particular LULC class. The result shows a marked decrease in forest or thick bush and bare land cover, with reductions of 153.66 km2 and 9.51 km2 by 2023, respectively (Table 4). This decline represents a substantial loss and translates, respectively, to a 4.2% and 6.0% decrease for forest or thick bush and bare land cover per year over eight years (Table 4). Similarly, the water class experienced a notable shrinkage, reducing to just 0.62 km2 in 2023. Conversely, the built-up area exhibited the greatest increase during the study period, expanding by 138.22 km2 (127.3%) (Table 4). Sparse vegetation also increased at a rate of 0.9% per year. Built-up areas showed the highest increase, whereas forest or thick bush experienced a significant reduction, suggesting a rapid trend of urban expansion and industrialization driven by economic growth. The highest increase in built-up areas among all studied land use types has already been reported and attributed to the changes to urbanization [13,48,49]. The social and economic developments in urban areas often coincide with rural-urban migration, leading to population surges in rapidly developing regions like Ado-Odo Ota local government area (LGA). As of the 2006 National Population Census, the LGA had a population of 527,242 and was estimated to have increased by approximately 70% in 2022 [50]. This confirms that the interaction between economic and population growth creates a pull factor that significantly influences migration patterns, driving people predominantly from regions of rural or low-income to high-income or urban areas [49]. Migration, driven by economic opportunities in urban areas, reshapes population distribution and accelerates urbanization [51].

3.3. Land Use and Land Cover Conversion Trend

Further analysis shows the conversion direction of each LULC category (Figure 6; Table 5). About 81.9% (88.99 km2) of the built-up area in 2015 remained unchanged in 2023 while sparse vegetation (109.76 km2) and bare land (26.73 km2) were greatly converted to built-up (Table 5). A larger percentage of water (84.3%) was converted to built-up while 15.0% (0.66 km2) remained unchanged in 2023. Forest or thick bush was predominantly converted to sparse vegetation amounting to about 63.8% (200.96 km2) of the total area in 2015. By 2023, about 50% (109.76 km2) of the built-up area expansion resulted from the conversion of sparse vegetation, indicating significant vegetative land degradation. Contributing factors may include the construction of residential buildings, industrial estates, road networks, religious settlements, and recreational facilities. The study location shares boundaries with Lagos state, which is a strong economic hub in Nigeria and West Africa; however, is faced with high living costs, transportation glitches, and accommodation challenges [52]. These distresses in the bordered regions could motivate populace migration, and the rapid urbanization shift to the stud area. Similarly, ref. [53] reported high urbanization across the border counties of Yunnan Province being an important pathway for economic exchanges between Southwest China and the countries of Southeast Asia. Urbanization-induced land cover changes exacerbate natural resource degradation and ecosystem disruptions [54,55]. For instance, impervious surfaces like concrete and asphalt hinder water infiltration, increasing surface runoff and flooding risks [18,56].
The forest or thick bush area was significantly reduced. However, largely converted to sparse vegetation land cover. This pattern likely reflects intensified agricultural activities to meet rising food demands in the study area [57]. Deforestation for agricultural production has been a major driver of forest loss globally, with agriculture accounting for approximately 70% of deforestation, and Nigeria leading in deforestation rates [58,59]. Beyond food production, forests are extensively cleared for energy and commercial purposes, including firewood and charcoal production, alongside the impacts of uncontrolled livestock grazing [60]. To balance agricultural demands with environmental sustainability, achieving food security goals requires the sustainable management of arable lands and minimizing further exploitation of forest resources.

3.4. Implications of Study

Forest cover and water bodies play critical roles in maintaining ecological balance by regulating water flow, controlling erosion, nutrient cycling, and providing habitats for diverse species [61,62,63]. Forests play a vital role as carbon sinks, sequestering atmospheric carbon dioxide and mitigating the effects of climate change. Water bodies, in turn, support biodiversity, facilitate nutrient distribution, and serve as critical resources for human and ecological sustenance. The interconnectedness of forests and water bodies enhances green ecosystems, ensuring the stability of environmental services that are fundamental for both natural systems and human livelihoods [64]. However, results from this study highlight alarming trends. Uncontrolled deforestation and unsustainable land management practices driven by urban expansion and agricultural intensification pose severe threats to achieving the Sustainable Development Goals (SDGs) related to climate action, biodiversity conservation, and sustainable livelihoods in urban and peri-urban areas. Such practices contribute to increased atmospheric carbon levels, soil degradation, water resource depletion, and significant biodiversity loss, thereby exacerbating environmental degradation and reducing ecosystem resilience [65,66]. In response to these challenges, the effective application of geospatial techniques and Land Use and Land Cover (LULC) mapping emerges as a critical tool for sustainable land management. By monitoring spatial and temporal changes, LULC assessments enable researchers, policymakers, and planners to identify areas of concern, predict future trends, and develop targeted strategies to mitigate environmental degradation. This is particularly vital in developing regions, where resource limitations and rapid urbanization often compound land management challenges. Implementing such measures can foster sustainable development by balancing economic growth with environmental conservation, ultimately safeguarding ecosystems and improving quality of life.

4. Conclusions

Assessing and mapping LULC changes are essential for developing strategies that support environmental conservation and socio-economic growth, particularly in rapidly urbanizing regions like Ado-Odo Ota in Ogun State, Nigeria. This research highlights significant LULC shifts between 2015 and 2023, with notable expansion in built-up areas primarily resulting from the conversion of sparse vegetation. Conversely, sparse vegetation increased due to the reduction of forest or thick bush cover. Water bodies also declined, largely converted to built-up areas. The reduction in forest cover and water bodies, alongside urban expansion, underscores the pace of urbanization, which may threaten natural resources and environmental stability. Although the increase in sparse vegetation likely reflects intensified agricultural activities, sustainable land management policies, such as effective land use planning and strengthened environmental governance, are needed to mitigate risks of environmental degradation and resource depletion. Future studies should integrate ground-truthing for enhanced validations and consider additional drivers of LULC change, including complex biotic and abiotic interactions. Parameters like digital elevation models, water indices, socio-economic parameters, and vegetation indices should be examined to provide a comprehensive understanding of landscape and ecosystem transformations.

Author Contributions

Conceptualization, O.H.O., M.O.K., M.K.B. and M.R.N.; Methodology, O.H.O. and M.K.B.; Software, O.H.O., M.O.K. and M.K.B.; Investigation, O.H.O., M.O.K. and M.K.B.; Visualization, O.H.O. and M.O.K.; Supervision, M.R.N.; Resources, M.R.N.; Writing—original draft, O.H.O. and M.O.K.; Writing—Review and Editing, O.H.O., M.K.B., M.R.N. and A.B.O. All authors have read and agreed to the published version of the manuscript.

Funding

This work was also supported in part by the USDA National Institute of Food and Agriculture, Research Capacity Fund (Hatch) project 7004188 (Hatch grant FLA-SWS-006289 to M.R.N.). The first author (O.H.O.) also appreciates the UF Institute of Food and Agricultural Sciences (IFAS) for the Doctoral support through the CALS Dean Scholarship.

Data Availability Statement

The datasets used for this study are freely accessible on the repositories of the United States Geological Survey (USGS) through NASA’s Earth Observing System platform: https://earthexplorer.usgs.gov/ (accessed on 26 October 2024).

Conflicts of Interest

The authors declare no conflict of interests.

References

  1. Hatab, A.A.; Cavinato, M.E.R.; Lindemer, A.; Lagerkvist, C.J. Urban Sprawl, Food Security and Agricultural Systems in Developing Countries: A Systematic Review of the Literature. Cities 2019, 94, 129–142. [Google Scholar] [CrossRef]
  2. Hussain, S.; Mubeen, M.; Ahmad, A.; Akram, W.; Hammad, H.M.; Ali, M.; Masood, N.; Amin, A.; Farid, H.U.; Sultana, S.R.; et al. Using GIS Tools to Detect the Land Use/Land Cover Changes during Forty Years in Lodhran District of Pakistan. Environ. Sci. Poll. Res. 2020, 27, 39676–39692. [Google Scholar] [CrossRef]
  3. Policelli, F.; Hubbard, A.; Jung, H.; Zaitchik, B.; Ichoku, C. Lake Chad Total Surface Water Area as Derived from Land Surface Temperature and Radar Remote Sensing Data. Remote Sens. 2018, 10, 252. [Google Scholar] [CrossRef]
  4. Winkler, K.; Fuchs, R.; Rounsevell, M.; Herold, M. Global Land Use Changes Are Four Times Greater than Previously Estimated. Nat. Commun. 2021, 12, 2501. [Google Scholar] [CrossRef] [PubMed]
  5. Su, H.; Qi, Z.; Wang, Q. Impacts of Land Use Characteristics on Extreme Heat Events: Insights from Explainable Machine Learning Model. Sustain. Cities Soc. 2025, 120, 106139. [Google Scholar] [CrossRef]
  6. United Nations. World Urbanization Prospects: The 2018 Revision (ST/ESA/SER.A/420). In Department of Economic and Social Affairs, Population Division (2019). 2019. Available online: https://population.un.org/wup/publications/ (accessed on 22 November 2024).
  7. Zhang, M.; Chen, E.; Zhang, C.; Liu, C.; Li, J. Multi-Scenario Simulation of Land Use Change and Ecosystem Service Value Based on the Markov–FLUS Model in Ezhou City, China. Sustainability 2024, 16, 6237. [Google Scholar] [CrossRef]
  8. Menashe-Oren, A.; Bocquier, P. Urbanization Is No Longer Driven by Migration in Low- and Middle-Income Countries (1985–2015). Popul. Dev. Rev. 2021, 47, 639–663. [Google Scholar] [CrossRef]
  9. Abebe, G.; Getachew, D.; Ewunetu, A. Analysing Land Use/Land Cover Changes and Its Dynamics Using Remote Sensing and GIS in Gubalafito District, Northeastern Ethiopia. SN Appl. Sci. 2022, 4, 30. [Google Scholar] [CrossRef]
  10. Lynch, L.; Kangas, M.; Ballut, N.; Doucet, A.; Schoenecker, K.; Johnson, P.; Gharehaghaji, M.; Minor, E.S. Changes in Land Use and Land Cover Along an Urban-Rural Gradient Influence Floral Resource Availability. Curr. Landsc. Ecol. Rep. 2021, 6, 46–70. [Google Scholar] [CrossRef]
  11. Li, L.; Lu, D.; Kuang, W. Examining Urban Impervious Surface Distribution and Its Dynamic Change in Hangzhou Metropolis. Remote Sens. 2016, 8, 265. [Google Scholar] [CrossRef]
  12. Higgins, S.I.; Conradi, T.; Muhoko, E. Shifts in Vegetation Activity of Terrestrial Ecosystems Attributable to Climate Trends. Nat. Geosci. 2023, 16, 147–153. [Google Scholar] [CrossRef]
  13. Wang, S.W.; Gebru, B.M.; Lamchin, M.; Kayastha, R.B.; Lee, W.K. Land Use and Land Cover Change Detection and Prediction in the Kathmandu District of Nepal Using Remote Sensing and GIS. Sustainability 2020, 12, 3925. [Google Scholar] [CrossRef]
  14. Liping, C.; Yujun, S.; Saeed, S. Monitoring and Predicting Land Use and Land Cover Changes Using Remote Sensing and GIS Techniques—A Case Study of a Hilly Area, Jiangle, China. PLoS ONE 2018, 13, e0200493. [Google Scholar] [CrossRef]
  15. Younes, A.; Ahmad, A.; Hanjagi, A.D.; Nair, A.M. Understanding Dynamics of Land Use & Land Cover Change Using GIS & Change Detection Techniques in Tartous, Syria. Eur. J. Geogr. 2023, 14, 20–41. [Google Scholar] [CrossRef]
  16. Okeleye, S.O.; Okhimamhe, A.A.; Sanfo, S.; Fürst, C. Impacts of Land Use and Land Cover Changes on Migration and Food Security of North Central Region, Nigeria. Land 2023, 12, 1012. [Google Scholar] [CrossRef]
  17. Edafe, O.D.; Osabuohien, E.; Matthew, O.; Olurinola, I.; Edafe, J.; Osabohien, R. Large-Scale Agricultural Land Investments and Food Security in Nigeria. Heliyon 2023, 9, e19941. [Google Scholar] [CrossRef] [PubMed]
  18. Obiahu, O.H.; Yan, Z.; Uchenna, U.B. Spatiotemporal Analysis of Land Use Land Cover Changes and Built-up Expansion Projection in Predominantly Dystric Nitosol of Ebonyi State, Southeastern, Nigeria. Environ. Chall. 2021, 4, 100145. [Google Scholar] [CrossRef]
  19. Oyedele, A.A.; Omosekeji, A.E.; Oyedele, K.; Oyedele, T. Spatio-Temporal Analysis of Land Use/Land Cover Dynamics in Abeokuta and Environs, Southwestern Nigeria. GeoJournal 2023, 88, 5815–5824. [Google Scholar] [CrossRef]
  20. Hundy, W.; Kwanga, G.M.; Dam, D. Assessment of Land Use and Land Cover Change Using GIS And Remote Sensing Techniques in Katsina-Ala Local Government Area of Benue State. J. Res. For. Wildl. Environ. 2021, 13, 195–204. [Google Scholar]
  21. Koko, A.F.; Han, Z.; Wu, Y.; Abubakar, G.A.; Bello, M. Spatiotemporal Land Use/Land Cover Mapping and Prediction Based on Hybrid Modeling Approach: A Case Study of Kano Metropolis, Nigeria (2020–2050). Remote Sens. 2022, 14, 6083. [Google Scholar] [CrossRef]
  22. Ayanda, O.I.; Bello, O.A.; Nwabuisi, O.I. Trace Metal Toxicity in Some Food Items in Three Major Markets in Ado-Odo/Ota LGA, Ogun State, Nigeria and Associated Health Implications. Afr. Health Sci. 2020, 20, 2050–2061. [Google Scholar] [CrossRef]
  23. Samuel, O.A.; Theophilus, T.I.; Praise God, E.C.; Winifred, A.U. Computation of Human Health Risk in Surface Water in Ado-Odo Ota, Ogun State, Nigeria. Data Brief 2018, 19, 1574–1583. [Google Scholar] [CrossRef] [PubMed]
  24. Joel, E.S.; Maxwell, O.; Adewoyin, O.O.; Olawole, O.C.; Arijaje, T.E.; Embong, Z.; Saeed, M.A. Investigation of Natural Environmental Radioactivity Concentration in Soil of Coastaline Area of Ado-Odo/Ota Nigeria and Its Radiological Implications. Sci. Rep. 2019, 9, 4219. [Google Scholar] [CrossRef] [PubMed]
  25. Ahaka, U.A.; Ola-David, O.; Okorie, U.E. Data Set on Moral Values and Parental Primary School Choice: A Study of Ado-Odo Ota, Local Government Area, Ogun State. Data Brief 2021, 37, 107193. [Google Scholar] [CrossRef] [PubMed]
  26. Zacchaeus, O.O.; Adeyemi, M.B.; Azeem Adedeji, A.; Adegoke, K.A.; Anumah, A.O.; Taiwo, A.M.; Ganiyu, S.A. Effects of Industrialization on Groundwater Quality in Shagamu and Ota Industrial Areas of Ogun State, Nigeria. Heliyon 2020, 6, e04353. [Google Scholar] [CrossRef] [PubMed]
  27. Tempa, K.; Ilunga, M.; Agarwal, A. Tashi Utilizing Sentinel-2 Satellite Imagery for LULC and NDVI Change Dynamics for Gelephu, Bhutan. Appl. Sci. 2024, 14, 1578. [Google Scholar] [CrossRef]
  28. Rwanga, S.S.; Ndambuki, J.M. Accuracy Assessment of Land Use/Land Cover Classification Using Remote Sensing and GIS. Int. J. Geosci. 2017, 8, 611–622. [Google Scholar] [CrossRef]
  29. Seyam, M.M.H.; Haque, M.R.; Rahman, M.M. Identifying the Land Use Land Cover (LULC) Changes Using Remote Sensing and GIS Approach: A Case Study at Bhaluka in Mymensingh, Bangladesh. Case Stud. Chem. Environ. Eng. 2023, 7, 100293. [Google Scholar] [CrossRef]
  30. Agus, F.; Prafanto, A.; Kamil, Z.A. Detecting Land Use Land Cover Using Supervised Maximum Likelihood Algorithm on Spatiotemporal Imagery in Samarinda, Indonesia. In IOP Conference Series: Earth and Environmental Science, Proceedings of the 3rd International Seminar of Natural Resources and Environmental Management 2023, Online, 27–28 July 2023; IOP Publishing: Bristol, UK, 2023; Volume 1266, p. 012085. [Google Scholar] [CrossRef]
  31. Njoku, E.A.; Tenenbaum, D.E. Quantitative Assessment of the Relationship between Land Use/Land Cover (LULC), Topographic Elevation and Land Surface Temperature (LST) in Ilorin, Nigeria. Remote Sens. Appl. 2022, 27, 100780. [Google Scholar] [CrossRef]
  32. Phan, D.C.; Trung, T.H.; Truong, V.T.; Sasagawa, T.; Vu, T.P.T.; Bui, D.T.; Hayashi, M.; Tadono, T.; Nasahara, K.N. First Comprehensive Quantification of Annual Land Use/Cover from 1990 to 2020 across Mainland Vietnam. Sci. Rep. 2021, 11, 9979. [Google Scholar] [CrossRef]
  33. Darem, A.A.; Alhashmi, A.A.; Almadani, A.M.; Alanazi, A.K.; Sutantra, G.A. Development of a Map for Land Use and Land Cover Classification of the Northern Border Region Using Remote Sensing and GIS. Egypt. J. Remote Sens. Space Sci. 2023, 26, 341–350. [Google Scholar] [CrossRef]
  34. Dash, P.; Sanders, S.L.; Parajuli, P.; Ouyang, Y. Improving the Accuracy of Land Use and Land Cover Classification of Landsat Data in an Agricultural Watershed. Remote Sens. 2023, 15, 4020. [Google Scholar] [CrossRef]
  35. Manandhar, R.; Odeh, I.O.A.; Ancev, T. Improving the Accuracy of Land Use and Land Cover Classification of Landsat Data Using Post-Classification Enhancement. Remote Sens. 2009, 1, 330–344. [Google Scholar] [CrossRef]
  36. Yulianto, F.; Nugroho, G.; Aruba Chulafak, G.; Suwarsono, S. Improvement in the Accuracy of the Postclassification of Land Use and Land Cover Using Landsat 8 Data Based on the Majority of Segment-Based Filtering Approach. Sci. World J. 2021, 2021, 6658818. [Google Scholar] [CrossRef] [PubMed]
  37. Vallet, A.; Dupuy, S.; Verlynde, M.; Gaetano, R. Generating High-Resolution Land Use and Land Cover Maps for the Greater Mariño Watershed in 2019 with Machine Learning. Sci. Data 2024, 11, 915. [Google Scholar] [CrossRef] [PubMed]
  38. Mashala, M.J.; Dube, T.; Mudereri, B.T.; Ayisi, K.K.; Ramudzuli, M.R. A Systematic Review on Advancements in Remote Sensing for Assessing and Monitoring Land Use and Land Cover Changes Impacts on Surface Water Resources in Semi-Arid Tropical Environments. Remote Sens. 2023, 15, 3926. [Google Scholar] [CrossRef]
  39. Moisa, M.B.; Busha Hinkosa, L.; Negasa, G.F.; Olika, G.; Ijigu, T.E.; Wedajo, Y.N.; Gurmessa, M.M.; Deribew, K.T.; Gemeda, D.O. GIS and Remote Sensing Based Analysis of Land Use and Land Cover Change in the Upper Anger Watershed, Western Ethiopia. Geol. Ecol. Landsc. 2023, 1–10. [Google Scholar] [CrossRef]
  40. Bufebo, B.; Elias, E. Land Use/Land Cover Change and Its Driving Forces in Shenkolla Watershed, South Central Ethiopia. Sci. World J. 2021, 2021, 9470918. [Google Scholar] [CrossRef] [PubMed]
  41. Yuan, F.; Sawaya, K.E.; Loeffelholz, B.C.; Bauer, M.E. Land Cover Classification and Change Analysis of the Twin Cities (Minnesota) Metropolitan Area by Multitemporal Landsat Remote Sensing. Remote Sens. Environ. 2005, 98, 317–328. [Google Scholar] [CrossRef]
  42. Arora, A.; Pandey, M.; Mishra, V.N.; Kumar, R.; Rai, P.K.; Costache, R.; Punia, M.; Di, L. Comparative Evaluation of Geospatial Scenario-Based Land Change Simulation Models Using Landscape Metrics. Ecol. Indic. 2021, 128, 107810. [Google Scholar] [CrossRef]
  43. Sisay, G.; Gesesse, B.; Fürst, C.; Kassie, M.; Kebede, B. Modeling of Land Use/Land Cover Dynamics Using Artificial Neural Network and Cellular Automata Markov Chain Algorithms in Goang Watershed, Ethiopia. Heliyon 2023, 9, e20088. [Google Scholar] [CrossRef] [PubMed]
  44. McHugh, M.L. Interrater Reliability: The Kappa Statistic. Biochem. Med. 2012, 22, 276–282. [Google Scholar] [CrossRef]
  45. Foody, G.M. Status of Land Cover Classification Accuracy Assessment. Remote Sens. Environ. 2002, 80, 185–201. [Google Scholar] [CrossRef]
  46. Awoniran, D.R.; Adewole, M.B.; Adegboyega, S.A.; Anifowose, A.Y.B. Assessment of Environmental Responses to Land Use/Land Cover Dynamics in the Lower Ogun River Basin, Southwestern Nigeria. Afr. J. Environ. Sci. Tech. 2014, 8, 152–165. [Google Scholar] [CrossRef]
  47. Basu, A.; Das, S. Afforestation, Revegetation, and Regeneration: A Case Study on Purulia District, West Bengal (India). Mod. Cartogr. Ser. 2021, 10, 497–524. [Google Scholar]
  48. Patra, S.; Sahoo, S.; Mishra, P.; Mahapatra, S.C. Impacts of Urbanization on Land Use /Cover Changes and Its Probable Implications on Local Climate and Groundwater Level. J. Urban. Mgt. 2018, 7, 70–84. [Google Scholar] [CrossRef]
  49. Andualem, T.G.; Peters, S.; Hewa, G.A.; Boland, J.; Myers, B.R. Spatiotemporal Trends of Urban-Induced Land Use and Land Cover Change and Implications on Catchment Surface Imperviousness. Appl. Water Sci. 2023, 13, 223. [Google Scholar] [CrossRef]
  50. City Population Population of Ado-Odo/Ota Local Government Area in Nigeria. 2024. Available online: https://citypopulation.de/ (accessed on 22 December 2024).
  51. Mallek, R.S.; Awad, A.; Ozturk, I.; ben Douissa, I. Infrastructure Development and Poverty Eradication in Sub-Saharan Africa; Its Effect and Transmission Channels. Cities 2024, 144, 104658. [Google Scholar] [CrossRef]
  52. Aliyu, A.; Amadu, L. Urbanization, Cities, and Health: The Challenges to Nigeria-A Review. Ann. Afr. Med. 2017, 16, 149. [Google Scholar] [CrossRef]
  53. Hu, Z.; Gong, J.; Li, J.; Li, R.; Zhang, Z.; Zhong, F.; Wen, C. Valuing the Coordinated Development of Urbanization and Ecosystem Service Value in Border Counties. J. Clean. Prod. 2023, 415, 137799. [Google Scholar] [CrossRef]
  54. Nath, B.; Ni-Meister, W.; Choudhury, R. Impact of Urbanization on Land Use and Land Cover Change in Guwahati City, India and Its Implication on Declining Groundwater Level. Groundw. Sustain. Dev. 2021, 12, 100500. [Google Scholar] [CrossRef]
  55. Tobore, A.; Shohan, A.A.A.; Oludare, A.; Alsulamy, S.; Kafy, A.-A.; Khedher, K.M. Spatial Analysis of Land Cover Changes for Detecting Environmental Degradation and Promoting Sustainability. Kuwait J. Sci. 2024, 51, 100197. [Google Scholar] [CrossRef]
  56. Balaian, S.K.; Sanders, B.F.; Abdolhosseini Qomi, M.J. How Urban Form Impacts Flooding. Nat. Commun. 2024, 15, 6911. [Google Scholar] [CrossRef]
  57. Fajobi, T.; Adeniran, A. Impact of Poor Land Utilization on Sustainable Human Development in Ado-Odo/Ota of Ogun State, Nigeria. Asian Res. J. Arts Social Sci. 2016, 1, 1–11. [Google Scholar] [CrossRef]
  58. FAO State of the World’s Forests. Forests and Agriculture: Land-Use Challenges and Opportunities; FAO: Rome, Italy, 2016; p. 126. [Google Scholar]
  59. Fasona, M.; Adeonipekun, P.A.; Agboola, O.; Akintuyi, A.; Bello, A.; Ogundipe, O.; Soneye, A.; Omojola, A. Incentives for Collaborative Governance of Natural Resources: A Case Study of Forest Management in Southwest Nigeria. Environ. Dev. 2019, 30, 76–88. [Google Scholar] [CrossRef]
  60. Odiji, C.A.; Ahmad, H.S.; Adepoju, M.O.; Odia, B.; Hamza, D.D.; Akpabio, W.E. Analysis and Prediction of Land Use/ Land Cover Changes and Its Impacts on the Corridors of Cattle Grazing Routes in Benue State, Nigeria. Geol. Ecol. Landsc. 2024, 8, 498–512. [Google Scholar] [CrossRef]
  61. Telo da Gama, J. The Role of Soils in Sustainability, Climate Change, and Ecosystem Services: Challenges and Opportunities. Ecologies 2023, 4, 552–567. [Google Scholar] [CrossRef]
  62. Shah, N.W.; Baillie, B.R.; Bishop, K.; Ferraz, S.; Högbom, L.; Nettles, J. The Effects of Forest Management on Water Quality. For. Ecol. Manag. 2022, 522, 120397. [Google Scholar] [CrossRef]
  63. Biru, M.K.; Bezie, A.; Kesete, N.; Tolessa, T. The Impact of Land Use and Land Cover (LULC) Dynamics on Soil Erosion and Sediment Yield in Ethiopia. Heliyon 2019, 5, e02981. [Google Scholar] [CrossRef]
  64. Nunes, L.J.R.; Meireles, C.I.R.; Pinto Gomes, C.J.; Almeida Ribeiro, N.M.C. Forest Contribution to Climate Change Mitigation: Management Oriented to Carbon Capture and Storage. Climate 2020, 8, 21. [Google Scholar] [CrossRef]
  65. Adla, K.; Dejan, K.; Neira, D.; Dragana, Š. Degradation of Ecosystems and Loss of Ecosystem Services. In One Health; Elsevier: Amsterdam, The Netherlands, 2022; pp. 281–327. [Google Scholar]
  66. Smith, T.; Boers, N. Global Vegetation Resilience Linked to Water Availability and Variability. Nat. Commun. 2023, 14, 498. [Google Scholar] [CrossRef]
Figure 1. Location of the study in Nigeria.
Land 14 00389 g001
Figure 2. Workflow of the land use land cover study.
Land 14 00389 g002
Figure 3. True color composite for 2015 (a) and 2023 (b).
Land 14 00389 g003
Figure 4. Spatial variation of LULC of the study area for 2015.
Land 14 00389 g004
Figure 5. Spatial variation of LULC of the study area for 2023.
Land 14 00389 g005
Figure 6. Conversion among the LULC classes from 2015 to 2023.
Land 14 00389 g006
Table 1. Details of Landsat image used for the current study.
SatelliteSensorAcquisition Date Path/
Row
Spatial ResolutionSpectral BandCloud Cover (%)Source
Landsat 8OLI10 February 2015191/55301 to 70https://earthexplorer.usgs.gov/
Landsat 8OLI14 December 2023191/55301 to 70https://earthexplorer.usgs.gov/
Table 2. Description of land use and land cover classes.
LULC ClassDescription
WaterAreas covered by water (lakes, streams, rivers, ponds, and swamps)
Built-upInclude man-made structures (residential, religious, commercial services, road networks, government, and institutional structures)
Bare landAreas with exposed soil surface, landfills, rock surface, and excavation sites
Sparse vegetationLow vegetative cover, including grassland, herbs, arable crop, farmland and garden
Forest or thick bushLand covered with plantations, natural vegetation, secondary forest, and different tree covers
Table 3. LULC accuracy assessment for the years 2015 and 2023.
Year20152023
LULCUA (%)PA (%)Kappa (%)OA (%)UA (%)PA (%)Kappa (%)OA (%)
Water100.0100.078.983.3100.0100.079.884.1
Built-up100.066.7 83.371.4
Bare land70.087.5 70.063.6
Forest or thick bush80.072.7 100.0100.0
Sparse vegetation75.093.9 76.288.9
UA = User accuracy; PA = Producer accuracy; Kappa = Kappa coefficient; OA = Overall accuracy.
Table 4. Land area of the LULC classes and change detection in the years 2015 and 2023.
Land Area (km2)
LULC
Class
20152023LULC Change
(2015–2023)
LULC Change
per Year
Percent Change (%)Percent Change per Year (%)
Bare land28.5319.03−9.51−1.06−33.30−4.10
Built-up108.58246.81138.2215.36127.3015.90
Forest or thick bush319.73166.08−153.66−17.07−48.10−6.00
Sparse vegetation394.09422.7928.713.197.300.90
Water4.380.62−3.76−0.42−85.84−10.70
Total855.32855.32
Table 5. Cross-tabulation of LULC of the study area.
Sum of Area Change (km2) LULC in 2023
LULC in 2015WaterBuilt-UpBare LandForest or Thick BushSparse VegetationTotal
Water0.663.680.000.000.024.36
Built-up0.0188.996.003.5113.11111.62
Bare land0.0026.732.490.061.1230.4
Forest or thick bush0.0014.601.2897.33200.96314.17
Sparse vegetation0.00109.7611.9468.49204.58394.77
Total0.67243.7621.71169.39419.79855.32
Disclaimer/Publisher’s Note: The statements, opinions and data contained in all publications are solely those of the individual author(s) and contributor(s) and not of MDPI and/or the editor(s). MDPI and/or the editor(s) disclaim responsibility for any injury to people or property resulting from any ideas, methods, instructions or products referred to in the content.

