Article

Structural and Rural Transformations and Poverty Reduction in Developing Asian Economies: An International Comparison Among China, the Philippines, and Vietnam

1
School of Economics, Beijing Institute of Technology, Beijing 100081, China
2
China Center for Agricultural Policy, Peking University, Beijing 100087, China
3
Southeast Asian Regional Center for Graduate Study and Research in Agriculture (SEARCA), Los Baños 4031, Laguna, Philippines
4
Center for Agricultural Policy, Institute for Policy and Strategy for Agriculture and Rural Development, Ministry of Agriculture and Rural Development, Hanoi 100000, Vietnam
*
Author to whom correspondence should be addressed.
Land 2025, 14(2), 350; https://doi.org/10.3390/land14020350
Submission received: 26 December 2024 / Revised: 4 February 2025 / Accepted: 5 February 2025 / Published: 8 February 2025

Abstract

:
In order to contribute to the body of knowledge on sustainable poverty reduction by exploring the relationship between rural and structural transformations and rural poverty incidence in Asian developing countries, this paper selected China, the Philippines, and Vietnam as case studies. Based on a comparison with the provincial data from those three countries, both the graphic and regression analysis suggest that structural and rural transformations matter in rural poverty reduction in these three countries. There is strong evidence showing that raising the share of non-agricultural GDP and the share of rural off-farm employment significantly contributes to rural poverty reduction in all three countries. More importantly, with the expansion of the non-farm sectors in both urban and rural areas, high-value agricultural share has a statistically significant and negative correlation with rural poverty in China and Vietnam over time, while such a negative correlation is much weaker or even does not exist in the Philippines. This paper further concludes with several implications for policymakers to promote inclusive structural and rural transformations.

1. Introduction

The overall economic structural transformation and rural transformation differ in the speeds and paths among countries. These transformations have strong implications for rural labor movement and poverty reduction [1]. The classical structural transformation in Europe and North America lasted for more than 100 years in the 19th and 20th centuries, and the recent similar but rapid structural transformation in some emerging countries in recent decades resulted in the large movement of rural labor from agriculture to industry and service. This type of transformation is generally favorable for inclusive rural development [1,2,3]. The speed of structural and rural transformation correlates with the growth rate of the national economy.
The developing countries in Asia as a whole also experienced rapid and inclusive structural and rural transformations but the speed and inclusiveness of the transformations differ largely among countries [2,4]. Some countries have witnessed remarkable structural and rural transformations and made impressive achievements in rural poverty reduction. For example, China has experienced fast structural and rural transformations since 1978. Meanwhile, the country dramatically decreased rural poverty from 97.5% in 1978 to zero in 2020 [5]. Malaysia has gone through rapid structural transformation, and together with the nation’s comprehensive rural development reforms, has likewise facilitated its rural transformation since the 1960s [6]. Malaysia’s incidence of rural poverty declined from 59% in 1970 to 0.4% in 2016 [7,8]. While Vietnam started its transformations later than China and Malaysia, the country nonetheless has undergone a similar process of rural transformation since the late 1980s that has resulted in a rural poverty incidence decreasing significantly from 66.4% in 1993 to 7.5% in 2016 [9,10]. For some of the other developing Asian countries, rural and structural transformation processes have been relatively slow, and so have their respective rates of rural poverty reduction [2].
Previous studies discussed the likely reasons underlying the huge performance differences of rural transformations in Asia, especially with respect to their paths and speed, which are mainly influenced by productivity growth and job creation in both rural and urban areas [2,11]. They found that fast structural transformation matters greatly in the achievement of rural poverty reduction in the course of rural transformation [2,12]. Structural transformation and rural transformation are complementary and reinforce each other with economic growth [2]. Rapid structural transformation creates a vast number of job opportunities for absorbing the surplus labor released from agriculture as the sector’s rapid growth continues in the process of rural transformation. As the cyclical process is sustained, the speed of rural transformation further accelerates; labor productivity is increased, and so are the food, raw materials, and labor resources to further fuel the structural transformation [2,13]. Moreover, empirical evidence from a number of case studies has indicated that countries that have experienced both rapid structural and rural transformations were able to reduce rural poverty quickly (e.g., China, Malaysia, and Vietnam) as compared to countries that have undergone relatively slow structural and rural transformations (e.g., India and the Philippines) [2,6,11,14,15,16,17].
Existing studies of rural transformation, however, have focused mainly on national-level analyses, ignoring the significant variation across regions within a country in terms of rural development and poverty incidence [12,18,19]. Huge regional disparity also exists in rural poverty reduction within a country. In China, for example, its western region had the highest rural poverty rate as compared to the rest of the country’s regions at 17.6% in 2012, lowered to 5.6% in 2017. China’s eastern coastal region, on the other hand, had basically eliminated the rural poverty incidence by 1999 [20]. In Malaysia, rural poverty was found to be most intensive in Kelantan at 67.1% (the highest among Malaysian provinces) in 1976 but steadily declined to 4.8% in 2009 [18]. In contrast, the occurrence of rural poverty in Sabah decreased at a slower speed from 58.3% to 19.7% during the same time period [18]. In Vietnam, the north mountain region had the highest rural poverty rate of 84.2% in 1993, which was reduced to 65.8% in 1998. The country’s southeast region (including Hồ Chí Minh City), on the other hand, had the lowest rate of rural poverty at 45.8%, which fell to 14.3% in the same period from 1993 to 1998 [21]. Similarly, for countries with relatively slow rural transformation, such as India, large variations in rural poverty are exhibited even within a state. For example, the Vindhya region of Madhya Pradesh in India had an average rural poverty ratio of 61.5% between 2004–2005 and 2009–2010, while the ratio in the Malwa region was 17.3% [19].
Comparing regional rural transformation trends among countries and understanding the speed and outcomes of such rural transformations at the regional level within a country are interesting studies to undertake for several reasons. First, the results from regional rural transformation analyses can supplement the results at the national level where the data used are already the averages of regional data. Second, regional-level analyses can provide a more granular explanation of the variations in the speed of transformations across regions and if such variations are correlated to the ability of a country to reduce its rural poverty level. These questions are difficult to answer in a national-level analysis. Third, comparing the similarities and differences in regional structural and rural transformations and the transformations’ outcomes, such as rural poverty reduction among countries, contributes to enriching the knowledge of rural transformation in developing countries. Fourth, clarifying regional disparities in the speed and inclusiveness of rural transformation and the multiple mechanisms at work in shaping these disparities can help grasp the socio–economic development trends and rules in structural and rural transformations. In addition, conducting a regional comparison study is meaningful for creating future policies tailored to different regions. Targeted policy measures at the regional level can promote rapid and inclusive structural and rural transformations across a country more effectively.
The goals of this paper are to analyze the path and speed of regional rural transformation and to explore the relationship between rural and structural transformations and rural poverty reduction in developing Asian countries. To achieve the above goals, we selected China, the Philippines, and Vietnam as case studies. The Philippines used to be one of the most advanced countries in Asia in the 1960s, while China and Vietnam were considered the least developed countries. However, both China and Vietnam have had remarkable overall economic growth and rural development since 1980 [2]. In 1960, the urban population share reached 30% in the Philippines; this number was about twice as much as that in China (16.2%) and Vietnam (14.7%). The Gross Domestic Product (GDP) per capita (PPP 2011 constant International USD) in the Philippines was more than seven times that in China. The advantage of the Philippines over other countries continued until the early 1980s. When China’s GDP growth began to pick up in the 1980s, its per capita GDP started to surpass that of the Philippines. The economy of the Philippines became significantly weak throughout the 1980s and 1990s. By 2020, the GDP per capita in China was about three times (measured in constant 2015 USD) of that in the Philippines [22]. The income gap between the Philippines and Vietnam has also significantly narrowed in the past three decades. The development trends in these countries are interesting to probe further, especially in terms of the impact of the structural and rural transformation processes they underwent and the specular reduction of their poverty incidence. The comparative analysis can generate significant experiences and lessons for these countries as well as other developing countries in the world.
The rest of this paper is organized as follows. Section 2 briefly discusses structural and rural transformations and rural poverty reduction in China, the Philippines, and Vietnam. Section 3 provides the description of data, study areas, and the definitions of rural transformation and the indicators measuring them in this paper. It also gives the methodology used in the analysis. Section 4 presents the general trends and variations of provincial/regional structural and rural transformations and rural poverty incidence by country. Section 5 analyzes and compares the correlations between structural and rural transformations and rural poverty reduction using the provincial/regional data of the three countries based on graphic illustration and regression estimation. Section 6 briefly discusses and compares the major institutions, policies, and investments that have affected rural transformation in these three countries. Section 7 concludes this study with several policy implications for future rural development in these countries.

2. Structural and Rural Transformations and Rural Poverty Reduction in China, the Philippines, and Vietnam

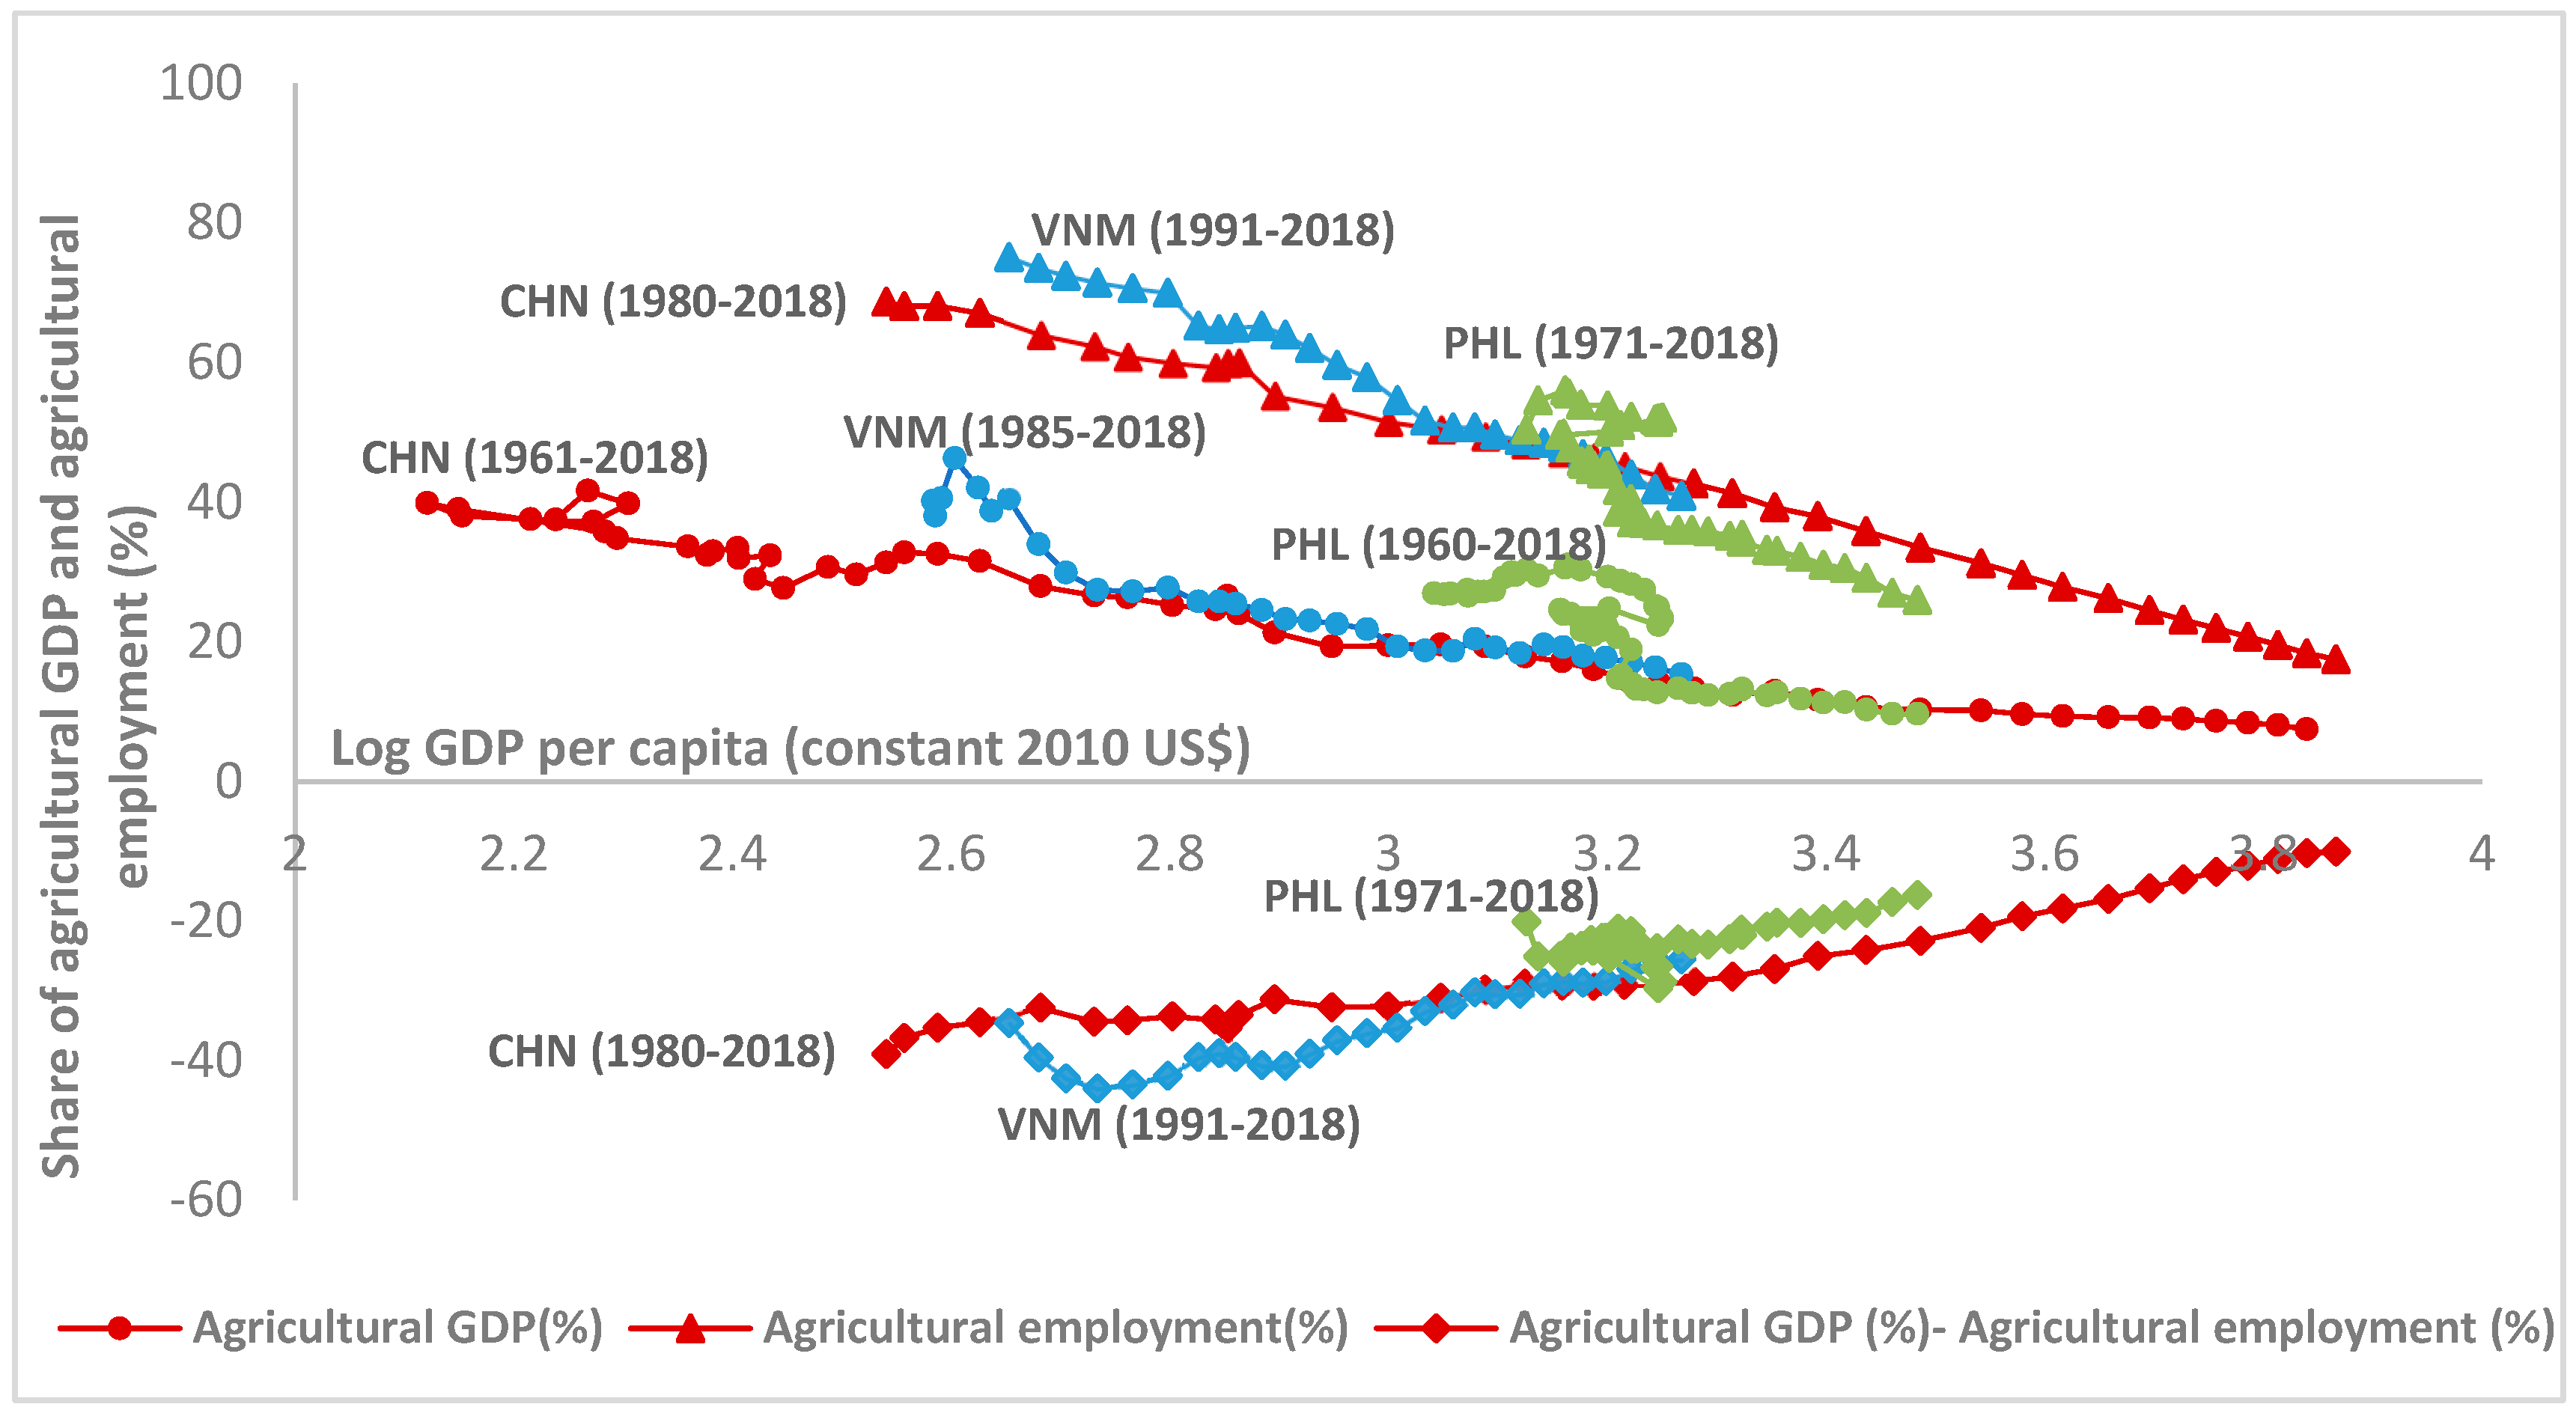
2.1. Structural and Rural Transformations in China, the Philippines, and Vietnam

Structural transformation processes, measured by changes in shares of agriculture in GDP and total employment in three countries, are shown in Figure 1. During the last few decades, the three countries have experienced a similar pattern of structural transformation. As labor productivity in agriculture is lower than that in other sectors of the economy, more labor, particularly rural labor, has been moving from the agricultural sector to the industry and service sectors in all three countries, which has resulted in the fall in the agricultural employment share in the economy. Meanwhile, the share of agriculture in the GDP has also been falling (Figure 1). It is worth noting that the falling agricultural GDP share with the growth of the economy is not only because of the higher growth of non-agricultural sectors compared to agriculture due to higher demand during economic growth but also because of the multiplier effect of agricultural growth [23]. That is, agricultural growth is not only reflected in the growth of agricultural production itself but also through the extension of the agricultural and food industrial chain and correlation effects (e.g., agricultural input industries and services), driving the growth of the industry and service sectors.
Figure 1 shows that while both the share of agricultural GDP and the share of agricultural employment have declined with economic growth, the decreasing share of agriculture in GDP is less than that of the employed labor in agriculture in all three countries. Thus, with the rising GDP per capita, the difference between these two shares declines (Figure 1). Among the three countries, China had the fastest structural transformation, with the share of agriculture in GDP declining from about 40% in the 1960s to approximately 7.0% in 2018. While the Philippines and Vietnam have also experienced structural transformation, the speed of structural transformation in the Philippines has been moderate since 1980 (in 1960, its share of agricultural GDP was already much lower than China and Vietnam).
China, the Philippines, and Vietnam have witnessed agricultural growth over recent decades. From 1991 to 2018, agricultural GDP increased in all three countries, with the fastest average annual growth rate in China (3.94%) and almost similar growth in Vietnam (3.77%) but a much slower growth in the Philippines (2.49%) (Table 1). During the same period, agricultural labor productivity’s annual growth was the highest in China (6.52%), followed by Vietnam (3.95%) and the Philippines (2.51%) (Table 1).
We use the share of non-cereal in agricultural output value as an indicator of rural transformation within agriculture, which observed significant variation in the path and speed of rural transformation among the three counties (Figure 2). Along with rapid agricultural growth, the rural sector in China has been transforming through a shift from grain-based production to more diversified and higher-value production, such as vegetables, fruits, livestock, and fish [12]. The value share of non-cereal production (non-cereal crops plus livestock and fishery) in agriculture (crops plus livestock) in China rose from an average of 58.9% in 1979–1988 to 79.4% in 2009–2018 (Figure 1). Following China, Vietnam has experienced a fast agricultural transformation since the launch of economic reforms, known as Doi Moi, in 1986. Agricultural productivity went up substantially thanks to intensified rice production and diversification into higher added value crops for export (such as coffee and rubber) [15]. There was a general upward trend in the share of non-cereal products in total agricultural output value in Vietnam from 56.9% in 1979–1988 to 65.3% in 2009–2018 (Figure 2). In stark contrast, the rural transformation in the Philippines moved in the opposite direction. Although the share of high-value production in agriculture in the Philippines was the highest among these three countries (slightly increased from 73.3% in 1979–1988 to 74.0% in 1989–1998) in 1979–1998, it declined to 72.9% in 1999–2008 and to 71.8% in 2009–2018 (Figure 2).
The off-farm employment of rural labor in these three countries also increased. A recent study shows that the share of rural labor’s non-farm employment in China rose from 9.3% in 1978 to 84.4% in 2018 [24]. Since the early 21st century, Vietnam has transferred 10% of the agricultural labor force to non-farm sectors every five years [25]. As of 2018, agriculture accounted for 37.6% of the rural labor force in Vietnam [26]. While in the Philippines, the share of the rural labor force employed in the non-agricultural sector slowly increased from 25.7% in 1975 to 35.8% in 1990 and to 41% in 2006, and was estimated to be about 49.97% in 2018 [27,28,29].

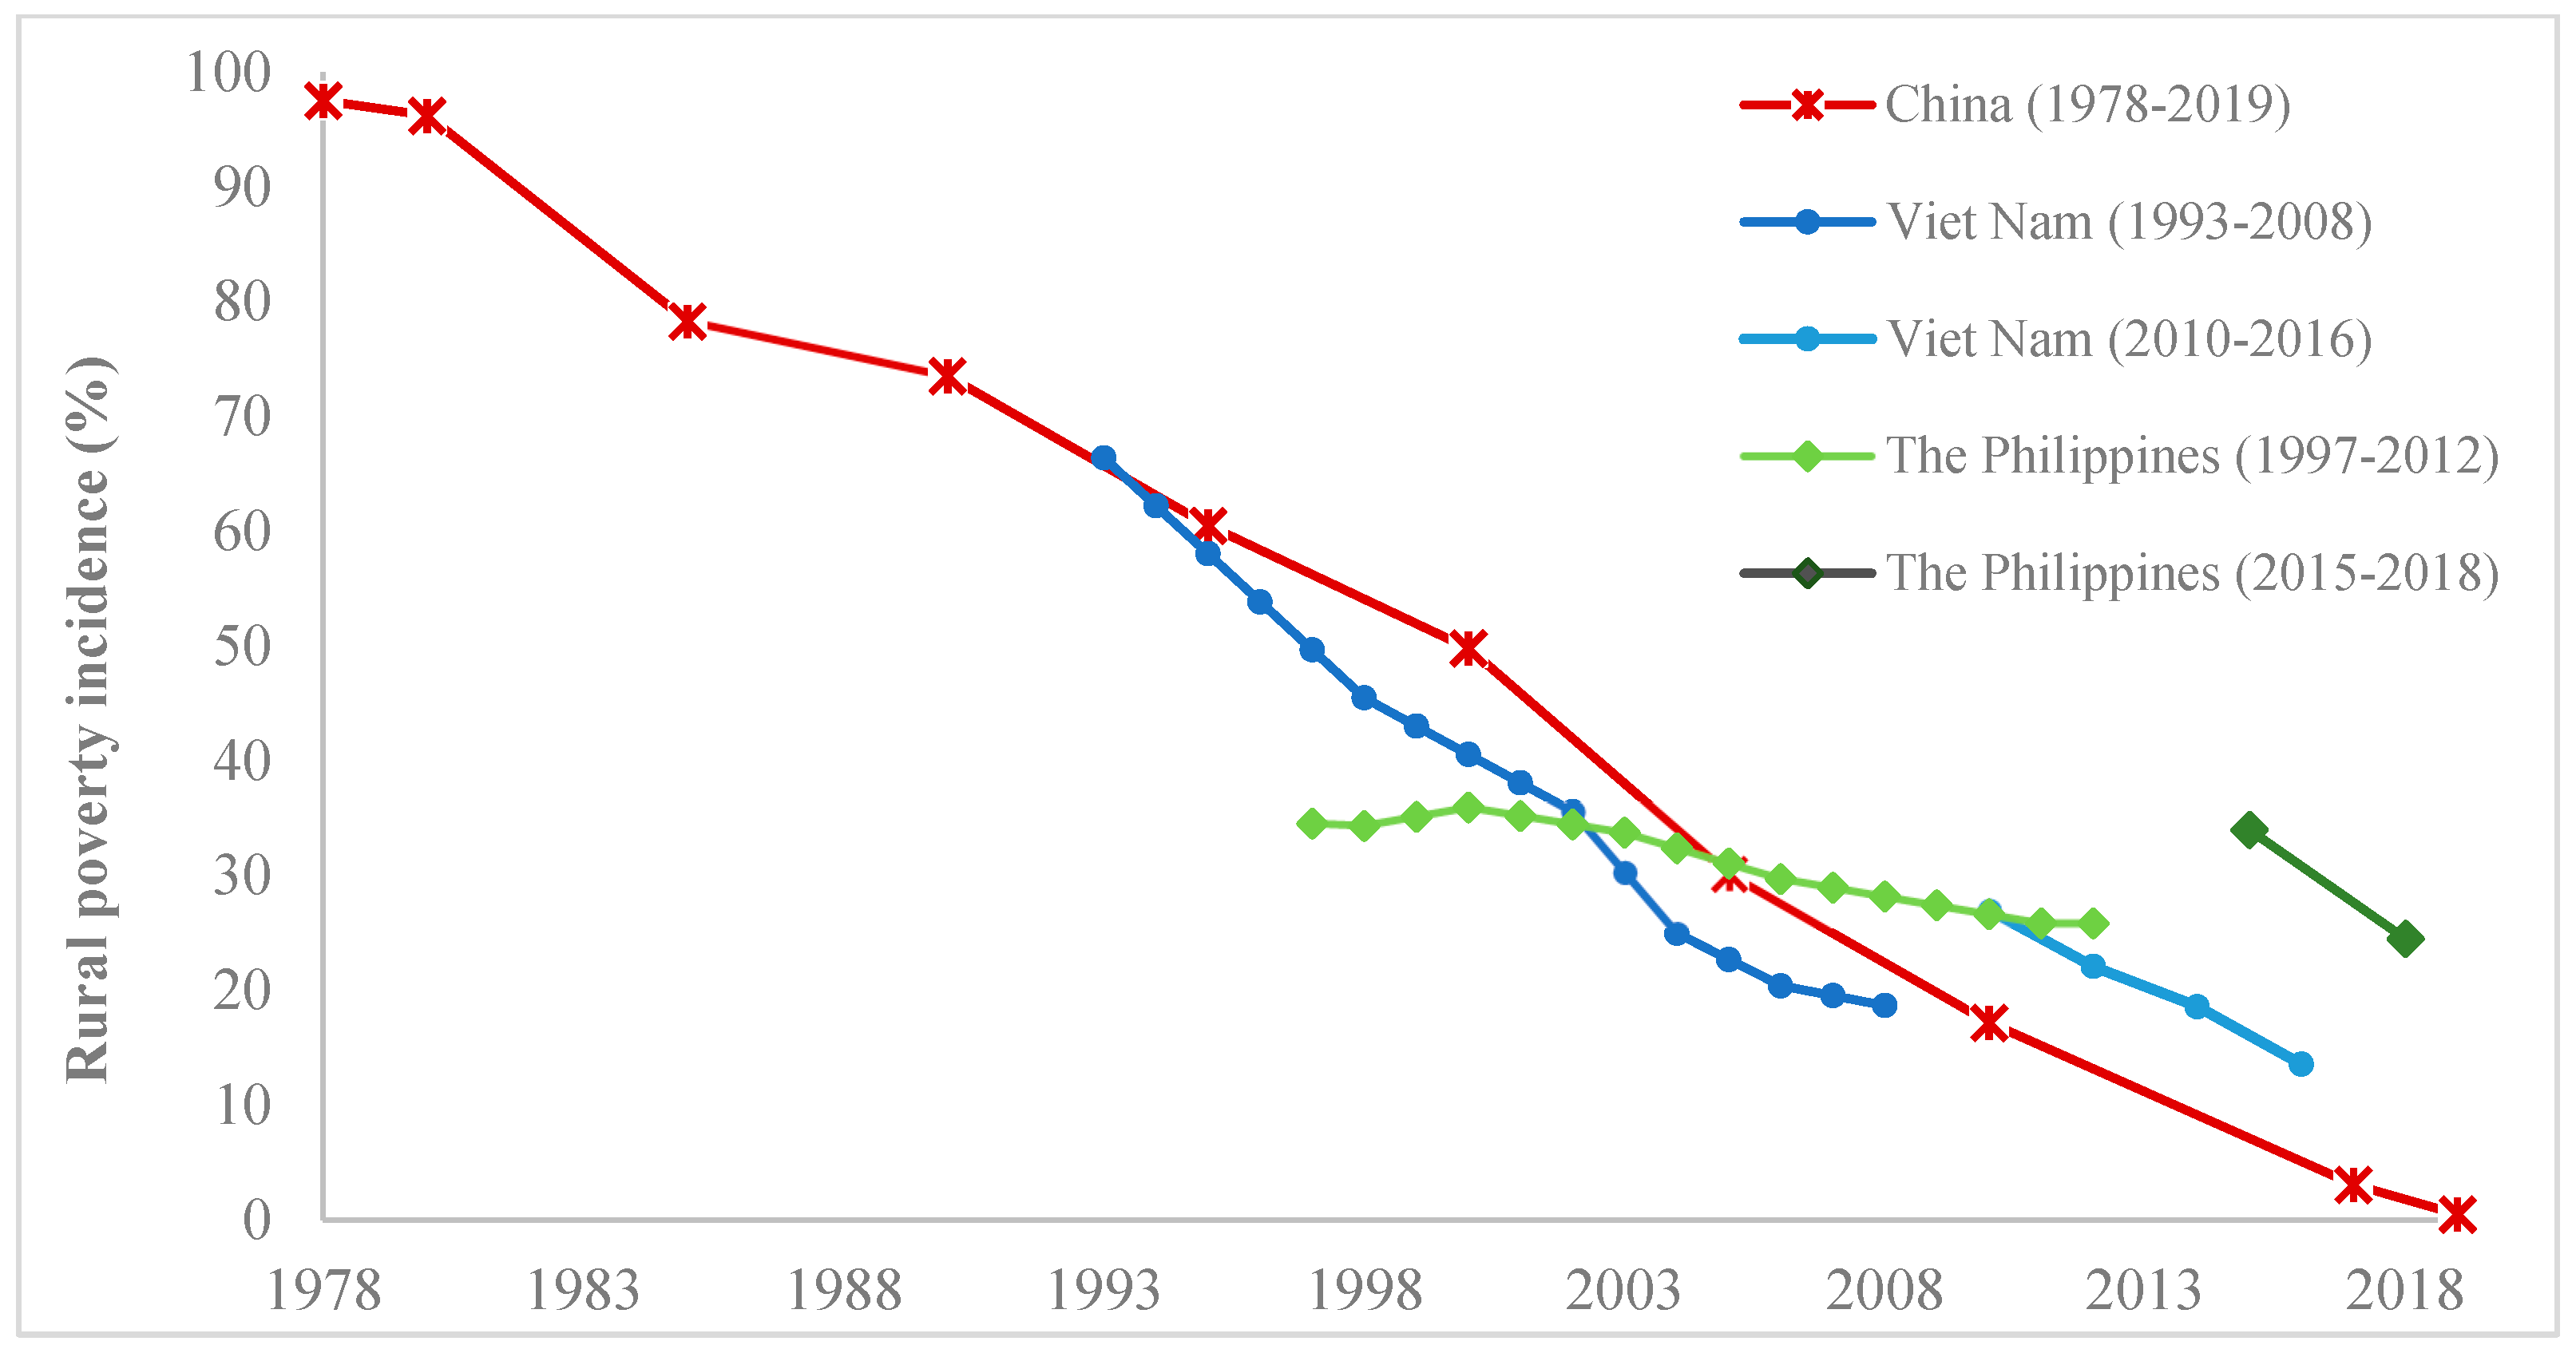
2.2. Rural Poverty Reduction in China, the Philippines, and Vietnam

With structural and rural transformations, China, the Philippines, and Vietnam have reduced rural poverty incidence. It can be seen from Figure 3, that the steep falls in the incidence of rural poverty have been seen in China and Vietnam. China played a leading role in poverty alleviation. It reduced rural poverty the fastest among the three countries. From 1978 to 2019, the rural population living in poverty fell by 0.7 billion in China, substantially decreasing the rural poverty rate from 97.5% to 0.5% (Figure 3). The achievement of rural poverty reduction is similarly remarkable in Vietnam. During the years 1993–2008, the rural poverty rate quickly declined from 66.4% to 18.7% (Figure 3). On the contrary, the Philippines made rather slow progress in reducing rural poverty. In 1997, based on the extreme poverty line of USD 1.25 a day defined by the World Bank, the incidence of rural poverty in the Philippines was 34.55%, the lowest among the three countries (49.96% in China and 49.68% in Vietnam under the same poverty standard). By 2016, the Philippines had become the country with the highest incidence of rural poverty (although the poverty standards of the three countries in Figure 3 were different in 2016, the national poverty line of the Philippines was close to that of Vietnam and lower than that of China).
According to the above analysis of the national data in Section 2, it can be found that the speeds of structural and rural transformations are positively correlated with the extent of rural poverty reduction. In other words, countries with faster structural and rural transformations are accompanied by faster rural poverty reduction. However, large regional disparities existing in each country are ignored to give a clearer picture of rural transformation in Asian developing countries. To better understand the path, speed, and inclusiveness of structural and rural transformations, this paper uses provincial/regional data from the three countries to make an international comparison.

3. Materials and Methods

3.1. Study Areas

To achieve the goals of this paper, an international comparison study was conducted using provincial data from China and Vietnam and regional data from the Philippines (due to the lack of a more disaggregate provincial data). Considering the fact that the pathway and the speed of rural transformation may differ among regions either within a country or across countries, the sample set analyzed in this paper is constructed by selecting provinces from each country according to the specificities and the economic development levels of the countries and regions.
In order to ensure the comparability of analysis across the three countries, provinces that mainly grow rice in the southern part of mainland China were covered considering the fact that grain production in the Philippines and Vietnam is dominated by paddy rice cultivation. In China, 13 provinces from the three regions (the middle–lower Yangtze, southwest China, and south China) are included in this international comparison study (see Table A1 in Appendix A).
For the Philippines, there are a total of 17 administrative regions but only 16 regions are selected since the National Capital Region (NCR) is no longer considered a primary agricultural area but a highly urbanized and industrialized one with a relatively high level of economic development as compared to the other regions of the country (see Table A1 in Appendix A)1.
In Vietnam, the metropolitan areas with a fast-growing population (e.g., Hà Nội, Hồ Chí Minh, Đà Nẵng, etc.) are also excluded. Additionally, provinces lacking the needed appropriate data are also not considered. Hence, for the Vietnam case study, only 37 provinces are selected, representing six regions, following the General Statistics Office (GSO) in light of their geographic location and the economic development level. These regions are the Red River Delta region, the northeast and northwest region, the northern Central Coast region, the southern Central Coast region, the Central Highland and southeast region, and the Mekong River Delta region (see Table A1 in Appendix A).

3.2. Indicators of Structural and Rural Transformations

To investigate the structural and rural transformations and their relationships with rural poverty reduction in the three selected Asian developing countries over the last few decades, the indicators measuring structural transformation, rural transformation, and rural poverty need to be clearly defined for this international comparison study.
For structural transformation, as suggested by previous studies [2,30,31], it is a process accompanied by the falling contribution of agriculture to GDP as well as accelerating urbanization and modernization. In structural transformation, agricultural growth and the divergence between labor productivity in agriculture and in nonagricultural sectors affect the share of agriculture in GDP and employment. Following the previous literature, the share of non-agricultural GDP is chosen as the indicator of structural transformation.
By definition, within the agricultural sector, rural transformation is a gradually transforming process, with agricultural production moving from cereal-dominated to more diversified and commercialized high-value commodities, including non-grain crop cultivation, livestock, and fisheries [2,32]. Therefore, the share of the output value of non-cereal commodities in the total agricultural output value is used as an indicator for rural transformation within agriculture. Meanwhile, rural transformation involves the rising productivity of inputs within the agriculture sector [2]. With improving agricultural productivity, labor has been released from farming and moved towards the rural non-farm sector. Thus, rural transformation can be also characterized by a process in which rural labor employment gradually shifts from farming to non-farming with a growth in agricultural labor productivity. In this regard, the share of off-farm employment in rural employment is used as another indicator to measure the level of rural transformation.
The outcomes of rural and structural transformations are often measured by a set of indicators including income growth, inclusiveness (e.g., poverty reduction, changes in income distribution, and gender inclusion), food security, and sustainability [2]. This paper focuses on the changes in rural poverty during the structural and rural transformations. Hence, rural poverty incidence measured as the rural poverty headcount ratio at the national poverty line (% of rural population) is selected as the indicator of rural poverty in this paper (Table 2). National poverty is the amount of income estimated by the government that a person needs in order to maintain an acceptable standard of living, considering the national socio–economic conditions.

3.3. Methodology and Data

To investigate the potential correlation between provincial/regional rural and structural transformations and rural poverty, the graphic analysis is first adopted. As it is assumed that rural poverty incidence changes monotonically over structural/rural transformation and the speed of rural poverty reduction varies, an exponential function is used to fit the relationship between structural and rural transformations and rural poverty incidence. Moreover, to further compare the correlation between provincial structural and rural transformations and rural poverty incidence in China, the Philippines, and Vietnam, a linear regression analysis is separately performed with the pooled data set of these three countries, using OLS and fixed effects (FE) methods.
For China, the annual data of 13 provinces from 2000 to 2017 are collected. In total, there are 234 observations. For the Philippines, the data from 16 regions between 1994 to 2016 are analyzed. The Philippines released its regional data on rural poverty incidence once every three years during the period of 1995 to 2016. Thus, the total number of observations in the Philippines is 141 after dropping the missing values. In the case of Vietnam, there are 37 provinces. The Vietnamese government announced the data on provincial rural poverty incidence every year, from 2012 to 2016. But during the period of 2002 to 2010, this was announced every two years. Therefore, Vietnam has 370 observations.

4. Provincial/Regional Structural Transformations and Rural Poverty Incidence in China, the Philippines, and Vietnam

4.1. Provincial Structural Transformation in China, the Philippines, and Vietnam

Figure 4a–c presents the shares of agricultural GDP and employment based on province/regional data in China, the Philippines, and Vietnam during the period from 1990 to 2017. In general, with the growth in per capita GDP, the shares of agriculture in both GDP and total employment have declined in three countries. Meanwhile, the difference between those two shares has decreased over time, which shows a general trend of convergence of the shares of agricultural GDP and employment in provinces in all three countries.
However, the convergence of agriculture’s share in GDP and its labor share in total employment differs largely among countries. According to Figure 4, China has experienced the fastest structural transformation, accompanied by the fastest economic growth. The difference between the two shares declined quickly with the rising per capita income. This is not the case in the Philippines, where the convergence of the two shares has been least visible. It is worth noting that the regions of the Philippines had the highest average level of per capita GDP in 1990 among these three countries. However, the slow structural transformation in the Philippines failed to boost, primarily, the manufacturing sector to create job opportunities to absorb the surplus labor released from agriculture. Agriculture’s share in total employment did not fall faster than its share in GDP, which thereby resulted to the relatively slow agricultural productivity growth in the Philippines.
Moreover, the gap between agricultural GDP and employment shares still differed largely among provinces/regions within each country by 2017. While a few advanced provinces (e.g., Zhejiang and Jiangsu in China, Central Luzon, and Calabarzon in the Philippines and An Giang and Tiền Giang in Vietnam) have lowered the difference between these shares close to zero, the gap remained relatively high (about 40%) in some less developed provinces/regions (e.g., Yunnan and Guangxi in China, CAR and Zamboanga Peninsula in the Philippines, and Bắc Kạn, Yên Bái, and Lào Cai in Vietnam).

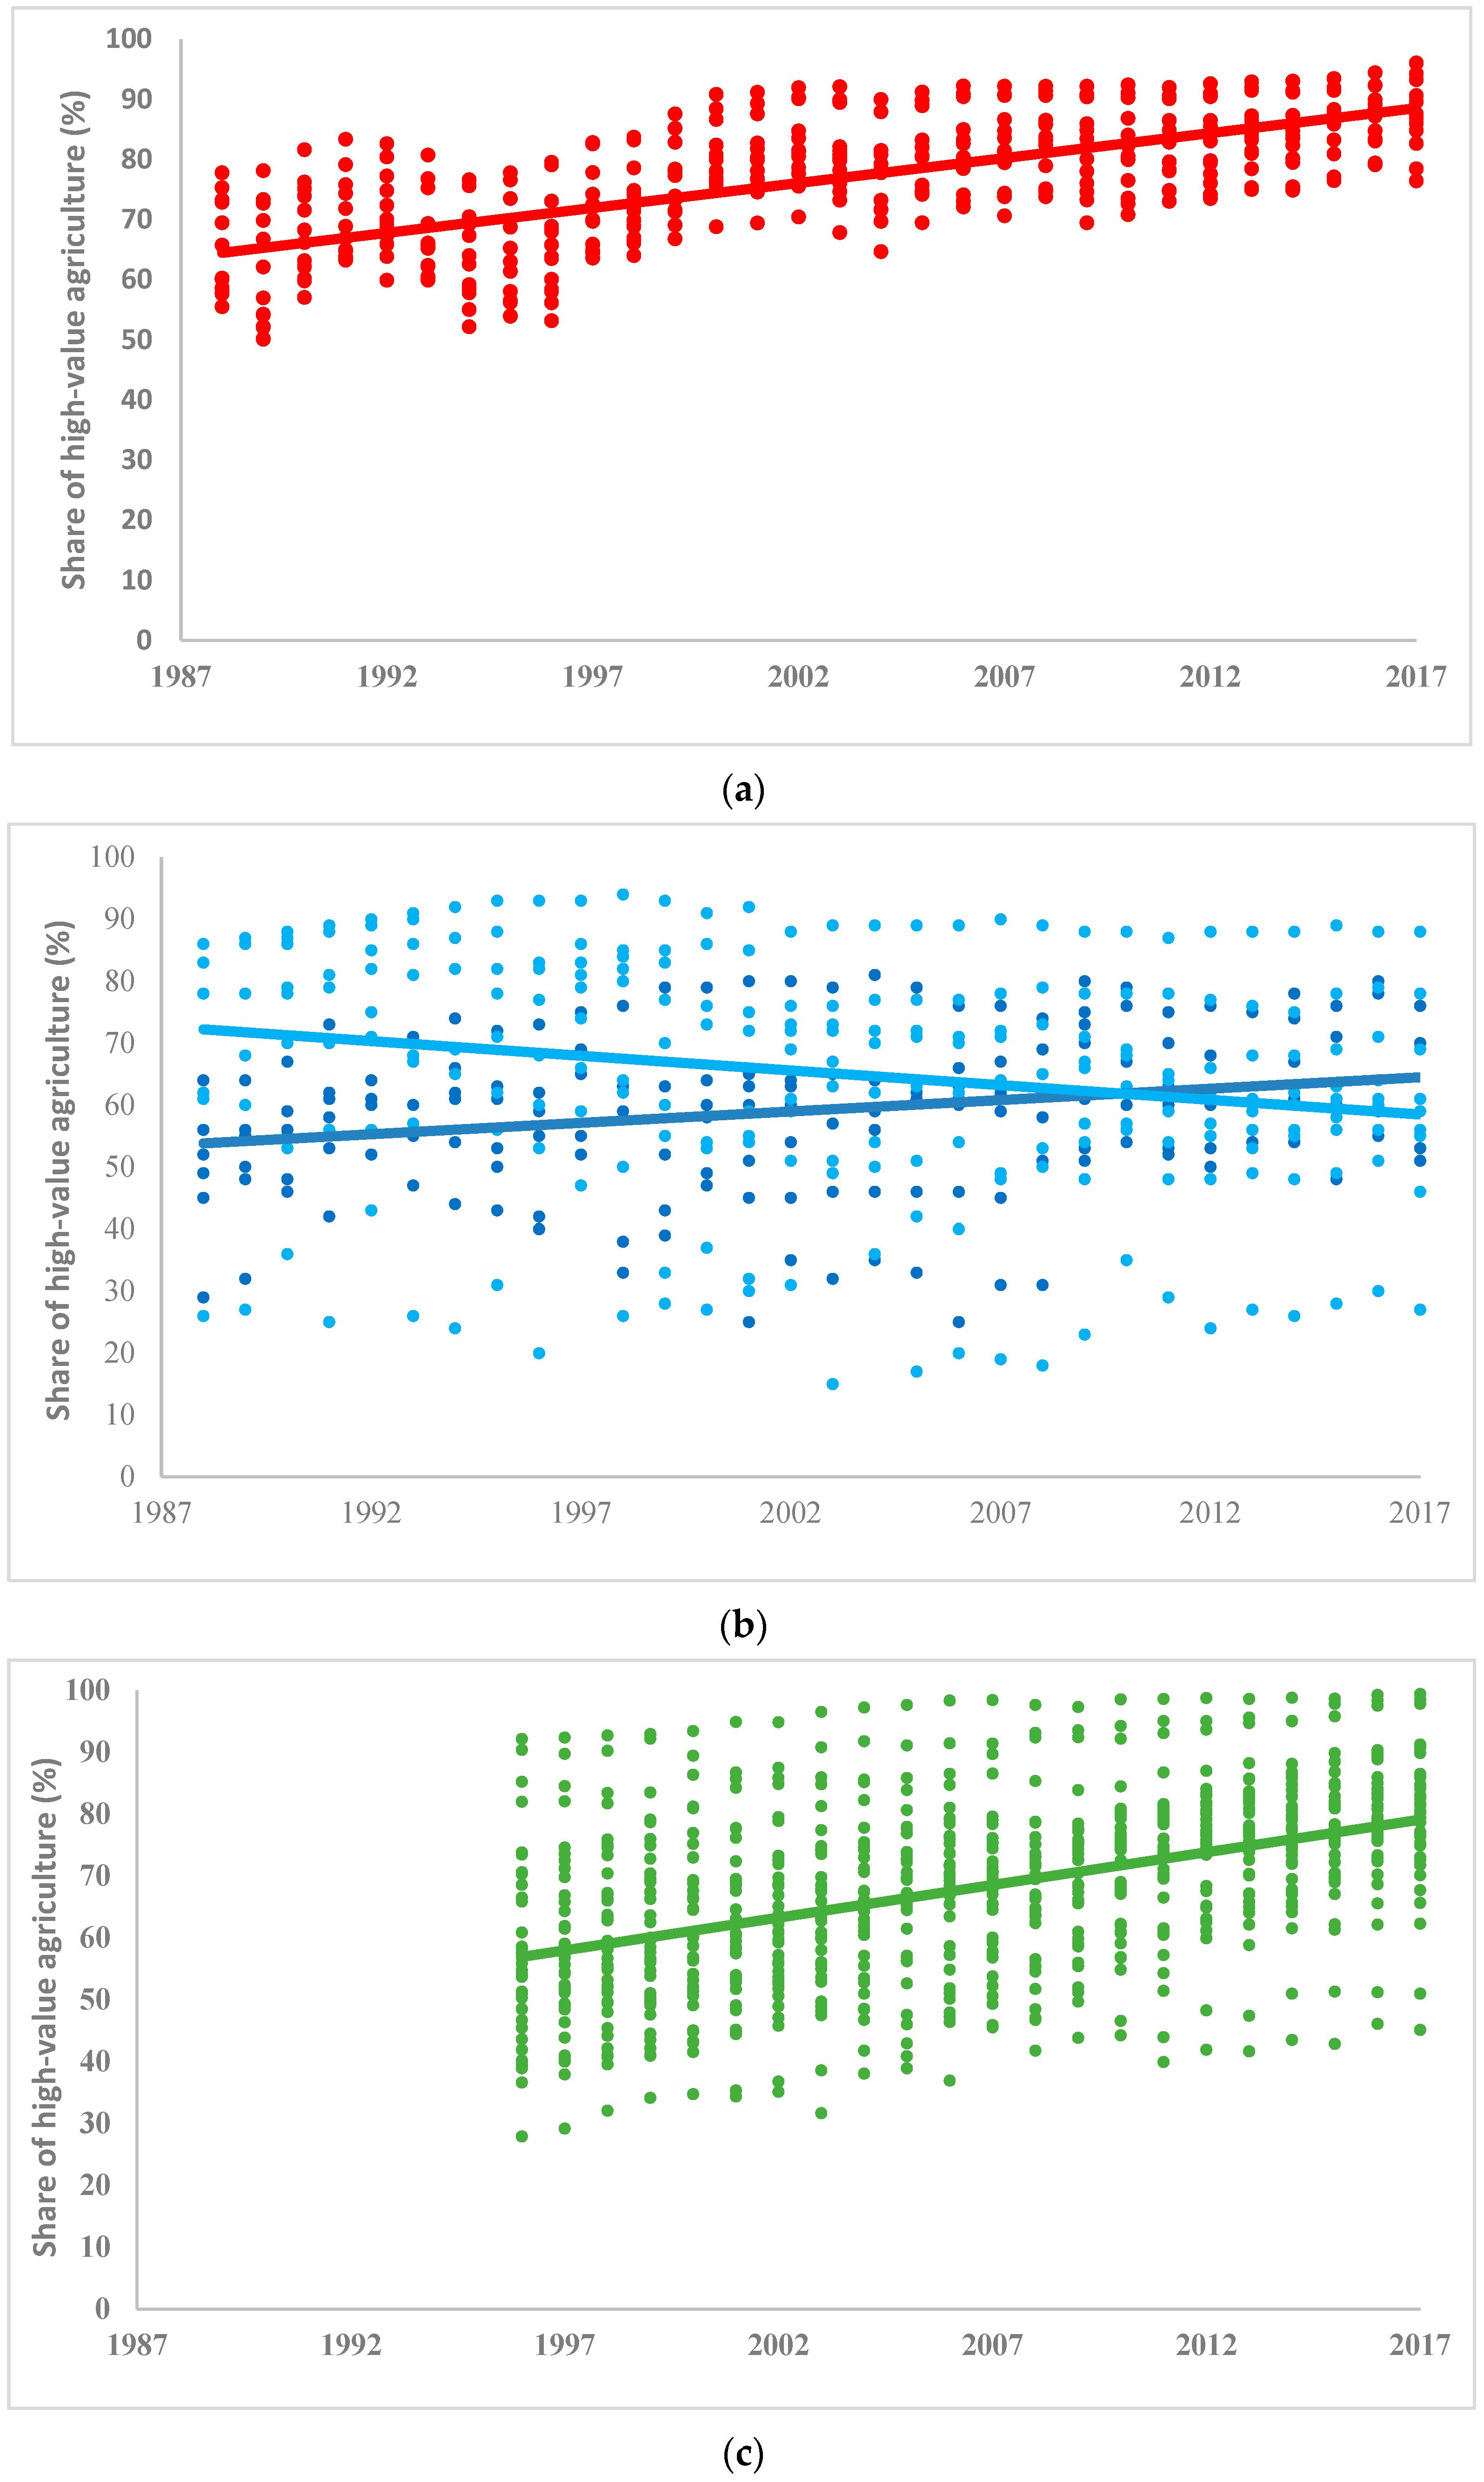
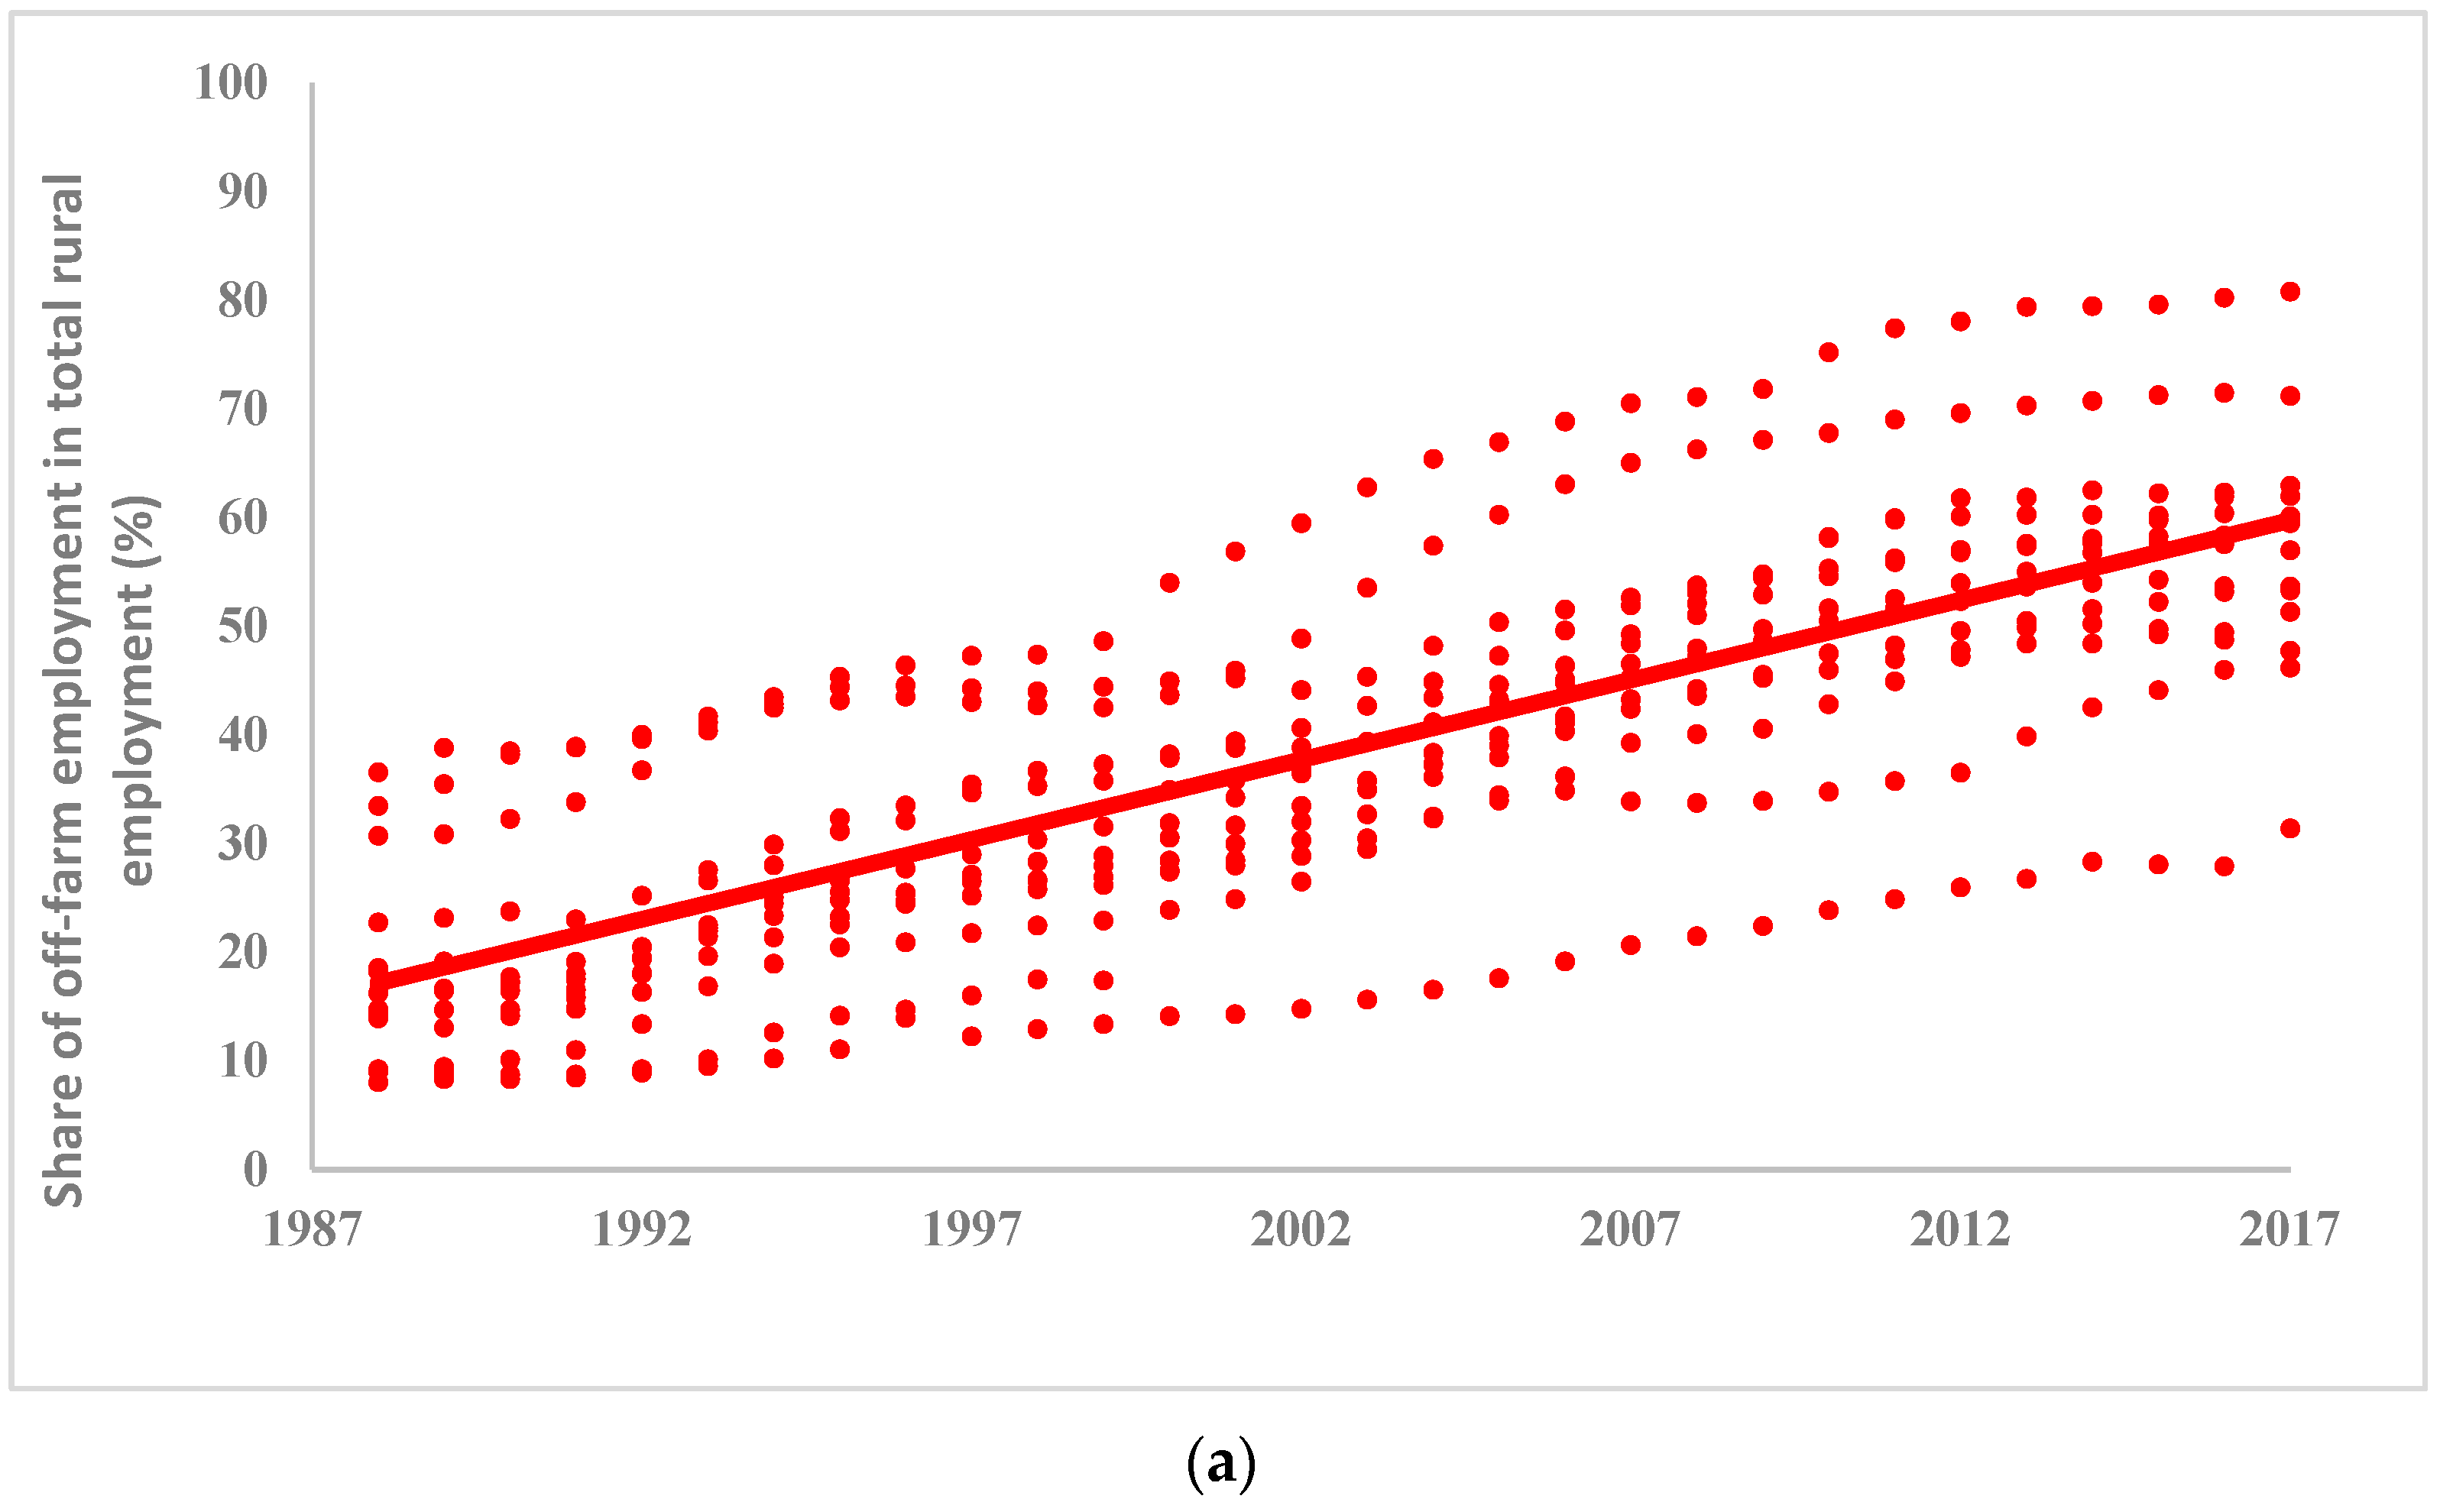
4.2. Provincial Rural Transformation in China, the Philippines, and Vietnam

Based on the two indicators of rural transformation listed in Table 2 in this section, we compare the trends and speeds of provincial rural transformation in China, the Philippines, and Vietnam over the past decades. Figure 5 and Figure 6 separately present the share of high-value agriculture and the share of off-farm employment in total rural employment in the provinces of China and Vietnam and regions in the Philippines. Due to data availability and comparability, the analyses on provincial rural transformation in this section cover time periods from 1988 to 2017 in China and the Philippines and from 1996 to 2017 in Vietnam.
As shown in Figure 5, all provinces in China and Vietnam have gone through a process of rural transformation in terms of the rising share of high-value agriculture (see Figure 5a,c). In stark contrast, some regions in the Philippines showed negative trends whereby the share of high-value agriculture gradually declined over time (see the light blue dots and trend line in Figure 5b). More specifically, most regions in the island of Mindanao (i.e., Zamboanga Peninsula, Northern Mindanao, Davao Region, SOCCSKSARGEN, and Caraga) experienced a decline in the proportion of high-value outputs in total agricultural output value from 1988 to 2017. According to the Philippines Mindanao Jobs Report [33], agriculture in Mindanao has not undergone that much diversification and therefore is still primarily characterized to be dominated by small holders and landless agricultural workers engaged in cultivating traditional low-value crops. Agricultural growth in the regions could not be attributed to the growth in high-value agriculture, the share of which, in fact, decreased. More specifically, major producing regions of traditional crops such as Cagayan Valley (34%), Western Visayas (52%), and Eastern Visayas (52%) showed a decline and slow improvement in their HVA shares. These regions, which exhibited the smallest HVA shares in the Philippines in 2017, are among the top-producing regions of rice, corn, and sugarcane, respectively. Figure 5 also shows that the level and speed of rural transformation measured by the share of high-value agriculture differs more largely among the provinces of the Philippines than those of China and Vietnam. Meanwhile, the smallest internal variations are observed in the Chinese provinces. For example, in 2017, the high-value agricultural share ranged from 27% (Cagayan Valley) and 88% (Calabarzon) in the Philippine provinces while ranging from 76% (Anhui) to 96% (Fujian) in the Chinese ones.
Figure 6 demonstrates the general changing trend of the share of rural off-farm employment at the provincial level in China, the Philippines, and Vietnam. According to Figure 6, the rate of rural non-farm employment increases in all the areas of studies considered in these three countries. Based on the comparison of the trends, it can be seen that the speed of rural transformation through rising off-farm employment is the fastest in China, followed by the Philippines and Vietnam. Similarly, a large variation in the share of rural off-farm employment exists in the provinces of each country. For instance, farmers in economically developed regions (e.g., Zhejiang from the middle–lower Yangtze region in China, Central Luzon and Calabarzon in the Philippines, and Bắc Ninh and Hà Nam from the Red River Delta in Vietnam) had a much higher rural non-farm employment share (more than 80% in 2017) than other provinces (less than 40% in 2017) in the less developed regions (e.g., Yunnan from the southwestern region of China, ARMM in the Philippines, and Yên Bái from the northwestern region in Vietnam).

4.3. The Trends of Rural Poverty Incidence

Figure 7 shows the trends of rural poverty incidence in the provinces of China, the Philippines, and Vietnam. Considering data availability and the fact that the pathways of rural and structural transformations across countries differ, the periods of analyses of rural poverty trends considered varied where in China, it is from 2000 to 2017; in the Philippines, it is from 1994 to 2016; and in Vietnam, it is from 2002 to 2016. Moreover, as the Chinese government and the Vietnamese government adjusted the national standard of the poverty line in 2011 and 2010, respectively, the analysis of rural poverty reduction in these two countries is thus divided into two stages. For China, the two stages are 2000–2010 and 2011–2017, while for Vietnam, these are 2002–2008 and 2010–2016. According to Figure 7, although the rural poverty incidence has declined in all countries, it still differs largely among countries. By comparing the slopes of the fitting lines (absolute value form) of provincial rural poverty incidence, it can be found that the speed of rural poverty reduction in the second stage was faster than that in the preceding stage in China and Vietnam2. Meanwhile, the Philippines has decreased its rural poverty the slowest. Regarding the level of rural poverty, differences exist across countries and even across provinces or regions within each country. By 2016, the provincial rural poverty incidence ranged from 0 to 11.6% in China, 10.07% to 62.98% in the Philippines, and 1.6% to 20.8% in Vietnam. The Chinese provinces had the lowest average rate of rural poverty at about 4.29% with the highest national standard of poverty line (2.20 a day in international USD in PPP). In contrast, the Philippine provinces had both the highest average rural poverty incidence at about 26.7% and the highest national standard poverty line (1.95 a day in International USD in PPP).

5. Results

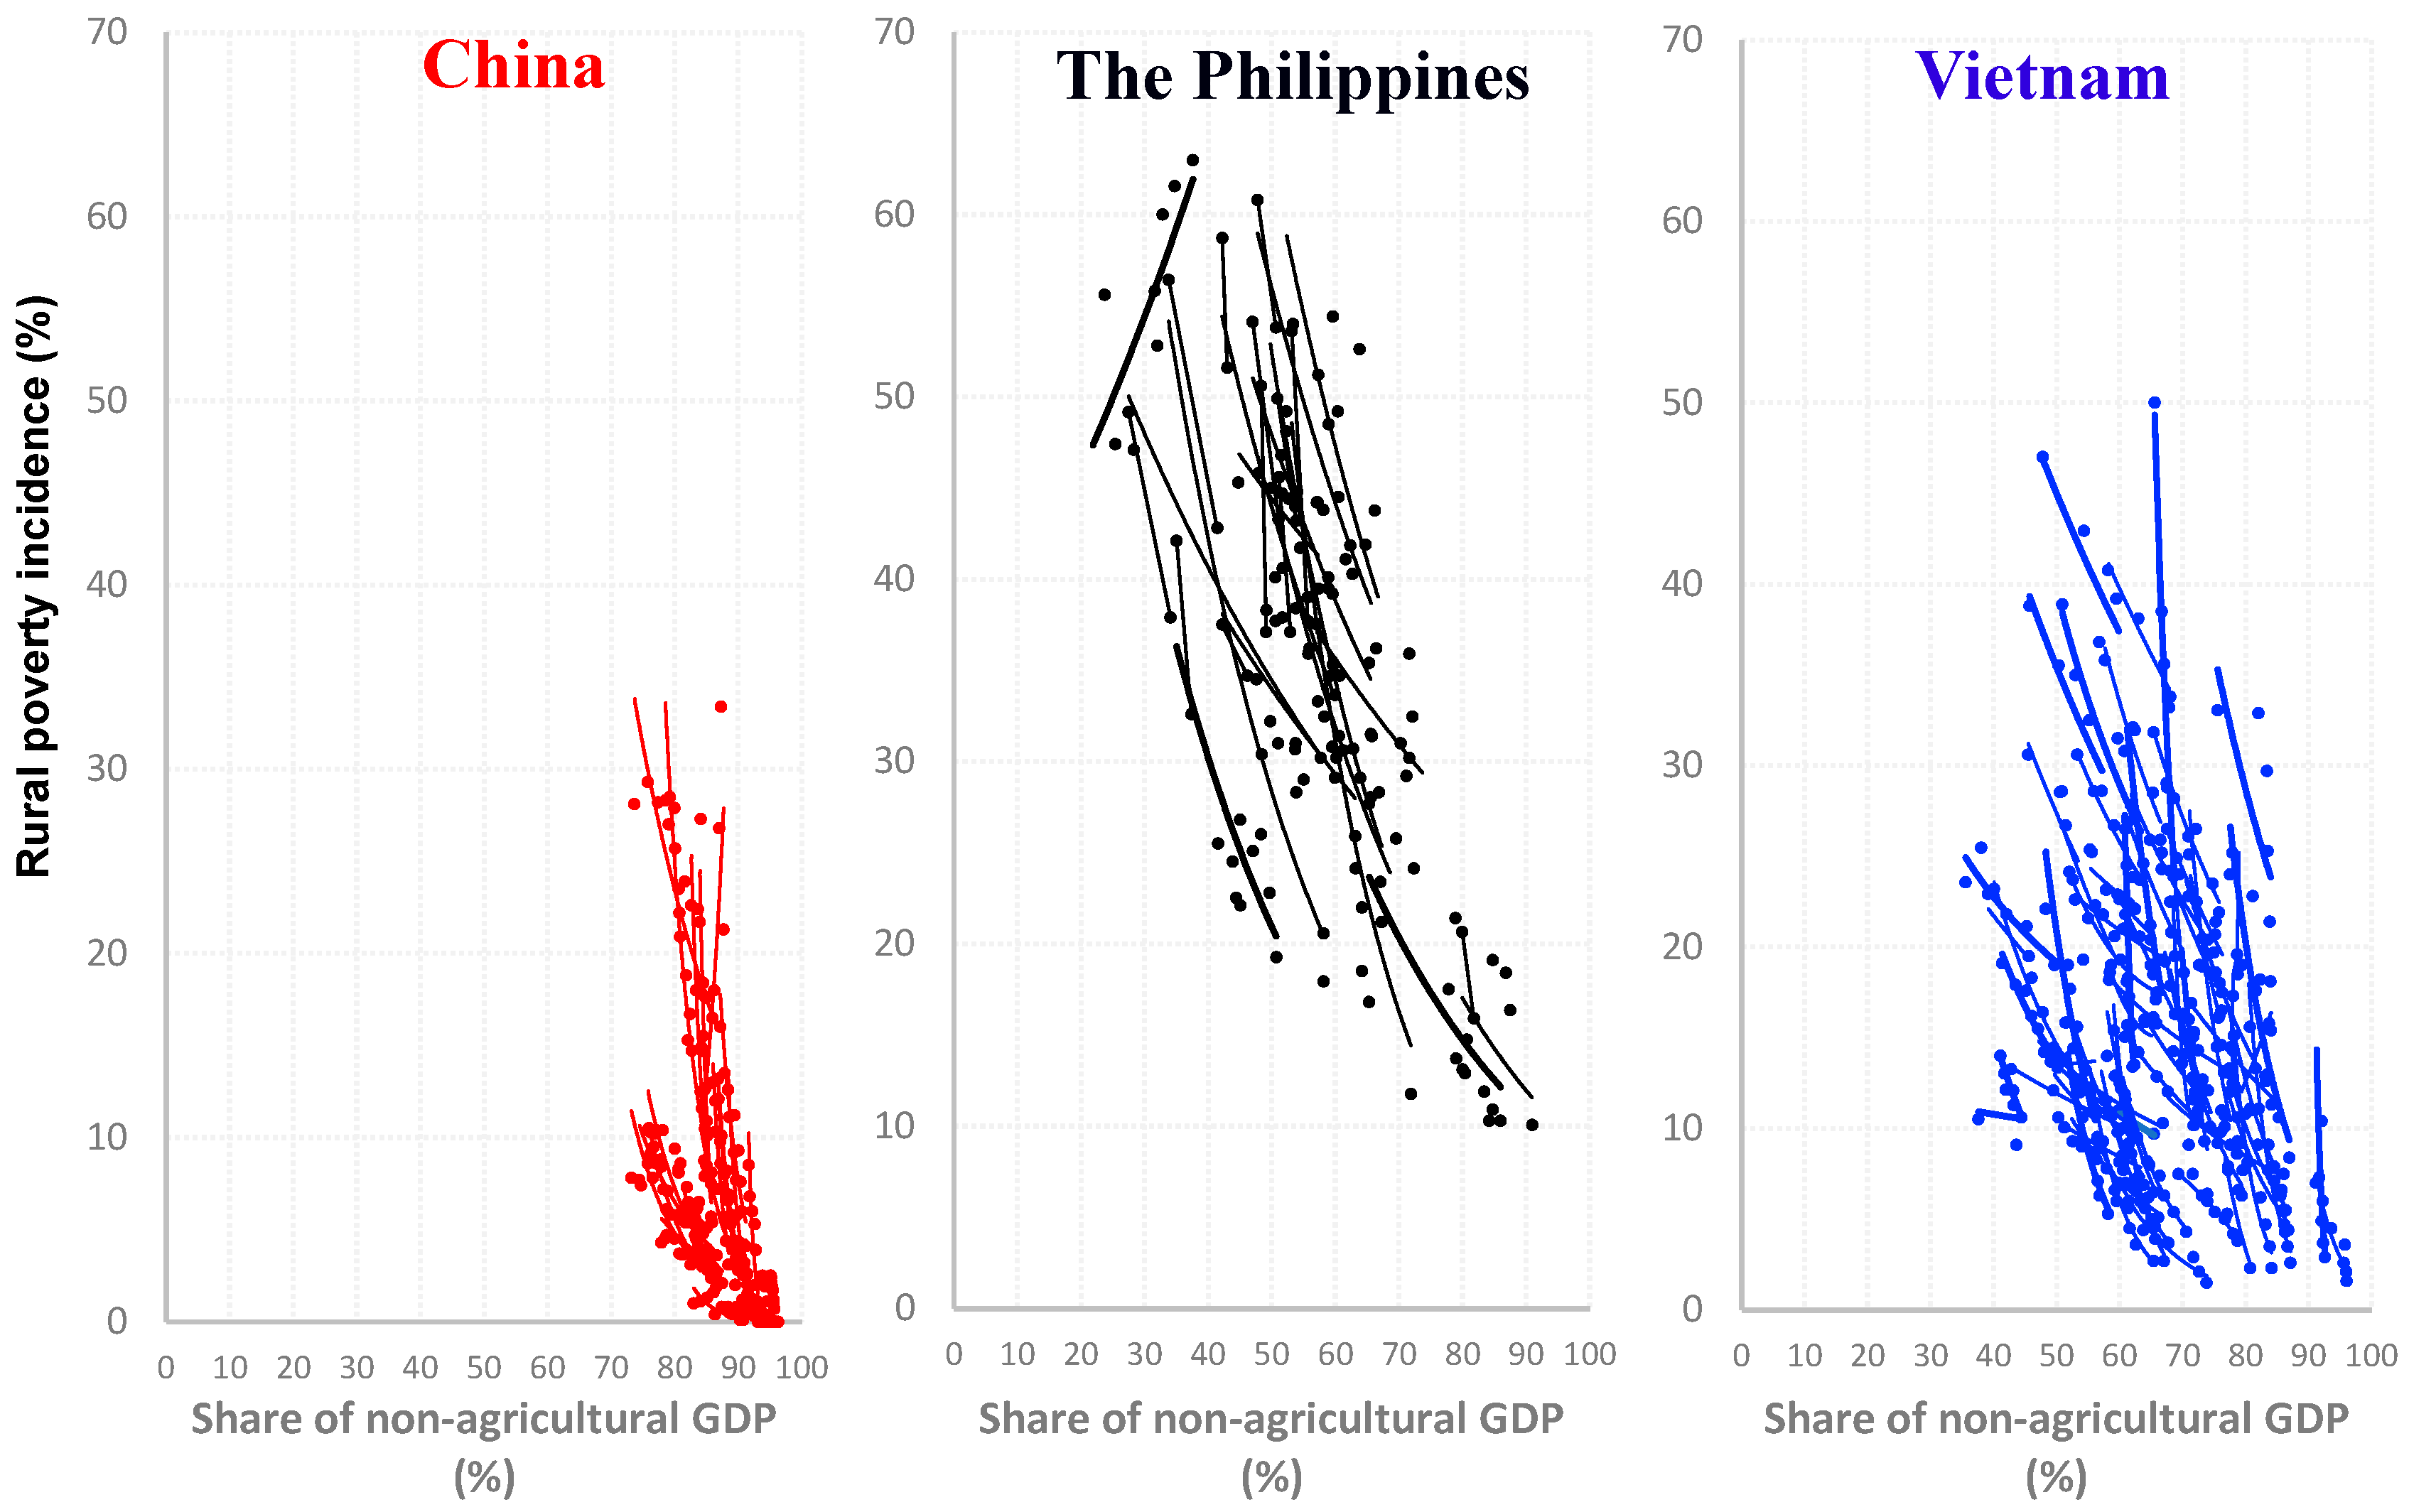
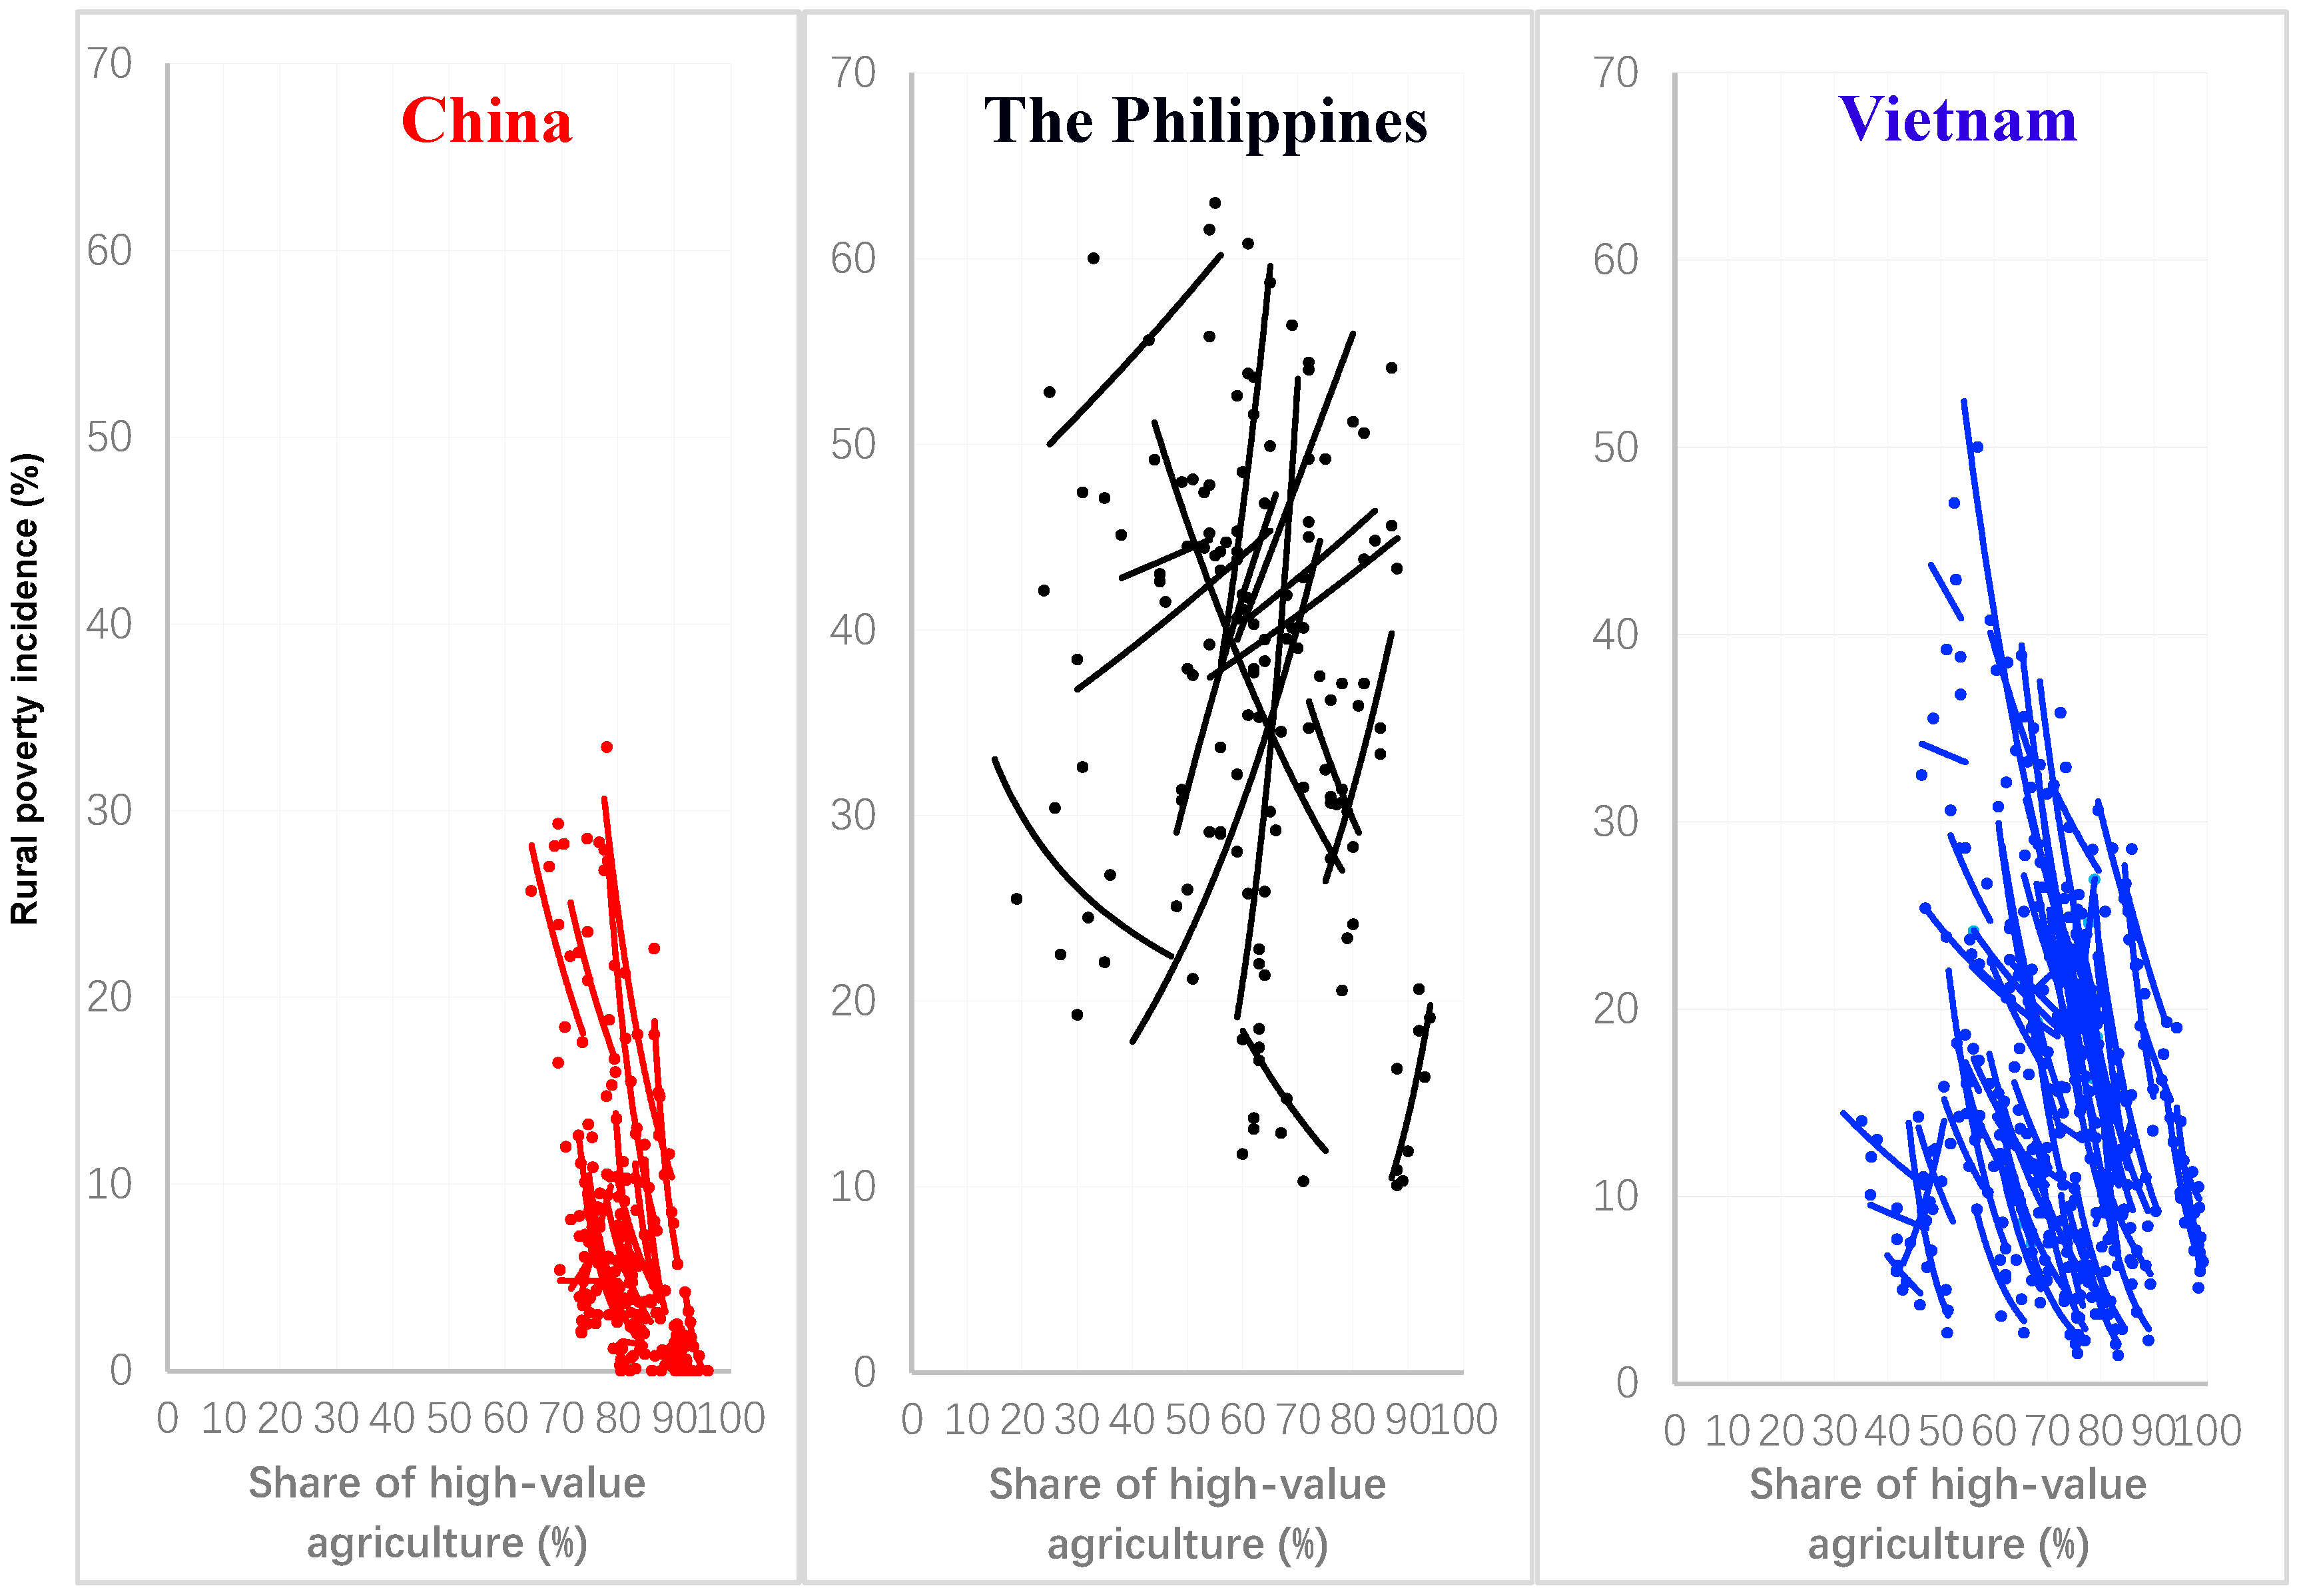
5.1. Provincial Rural and Structural Transformations and Rural Poverty Reduction in China the Philippines and Vietnam: Based on Graphic Analysis

Figure 8 illustrates provincial/regional structural transformation (measured by the share of non-agricultural GDP) and rural poverty incidence by country. As shown by most of the provinces/regions in the countries, there is a negative relationship between rural poverty and structural transformation, such that as the share of non-agricultural GDP increases, rural poverty incidence is reduced. According to Figure 8, even with the rise of the national poverty line, China has experienced an inclusive structural transformation3 with a fall in rural poverty incidence to zero or close to it in most of its provinces from 2000 to 2017. In Vietnam, many provinces experienced more inclusive structural transformation during the period of 2010 to 2016 than the period of 2002–2008. On average, the share of non-agricultural GDP increased by 14.9% in all Vietnamese provinces. Nevertheless, only two provinces have reduced their rural poverty incidence to around 1% by 2016. The average shares of non-agricultural GDP across the Philippine regions in 2016 are the lowest among the three countries. Consequently, it had the highest average regional rural poverty incidence in 2016 as compared to China and Vietnam despite a significant reduction of rural poverty incidence in many regions. The rural poverty incidence in all provinces of the Philippines was still above 10% in 2016.
Figure 9 shows provincial rural poverty and the share of high-value agriculture in three countries. Concretely, China reduces its provincial rural poverty incidence the quickest with the increase of high-value agriculture share over time. This negative correlation between rural poverty incidence and the share of high-value agriculture was not shown in the case of the regions in the Philippines. The relationship shown was one where the incidence of rural poverty gradually declined with the decreasing share of high-value agriculture. Further, it is also worth noting that the share of high-value commodities in agricultural production makes a smaller contribution to rural poverty reduction in Vietnam than in China.
Figure 10 presents the rural poverty incidence and share of rural labor off-farm employment in provinces by country. A strong negative relationship between rural poverty and rural non-farm employment is evidenced for all three countries. The larger the share of off-farm employment in rural employment is, the lower the rural poverty incidence is. Particularly, in China, with an increasing share of rural labor off-farm employment, rural poverty incidence has been reduced in all provinces, implying that China has experienced an inclusive rural transformation from 2000 to 2017. Moreover, rural poverty incidence in many Vietnamese provinces has not decreased with the increase of off-farm employment of rural labor during the period of 2002–2008 but all provinces from Vietnam have gone through an inclusive rural transformation during the period of 2010–2016, with a declining rural poverty incidence from an average of 18.4% to 7.8%. In the Philippines, similar to the pattern of structural transformation, with the rise of non-farm employment, rural poverty incidence reduces fast during the period of 1994–2016 in most provinces.

5.2. Provincial Rural and Structural Transformations and Rural Poverty Reduction in China the Philippines and Vietnam: Based on Regression Analysis

In the linear regression, the dependent variable is rural poverty incidence, while the independent variables are structural transformation and rural transformation. To be more specific, structural transformation is measured by the share of non-agricultural GDP (ST). The share of high-value agriculture (RT1) and the share of rural labor off-farm employment (RT2) are adopted to measure the level of rural transformation. Further, as we have mentioned in the previous section, China and Vietnam adjusted their national poverty line in 2011 and 2010, respectively, dummies representing countries with different stages (D1 = 1 if country = China (2011–2017); D2 = 1 if country = Vietnam (2010–2016)) and their interactions with ST, RT1, and RT2 are also augmented in the regression model to reflect the differences among countries and time periods4. Due to the remarkably high correlation between non-agricultural GDP (ST) and rural labor’s non-farm employment (RT2), we separately regress rural poverty incidence on ST, ST and RT1, and RT1 and RT2. The estimation results are shown in Table 3, Table 4 and Table 5. As the explanatory power of some regressions (in terms of overall R2) for the Philippines is limited, those results just show the simple correlations between structural/rural transformations and rural poverty reduction. Similar signals and magnitudes of the estimated parameters in both OLS and FE of all regressions indicate the robustness of the estimation results. As the results of Hausman specification tests suggest that FE estimators are more effective than the OLS estimators. Thus, the interpretation of the estimation results will focus on the FE estimates.
Table 3 provides the estimated parameters of the regressions examining the correlation between provincial structural transformation and rural poverty in the three countries, respectively. According to Table 3, the share of non-agricultural GDP (ST) negatively correlates with rural poverty incidence in all three countries. This implies that most provinces in these countries follow a similar trend whereby the higher the level of structural transformation, the lower the rural poverty incidence. As for China, the estimated coefficients of ST and ST*D1 are negative and statistically significant at a 1% level, meaning that the share of non-agricultural GDP (ST) greatly matters in rural poverty reduction in China during both the period of 2000–2010 and the period of 2011–2017. A rising share of nonagricultural GDP significantly decreases rural poverty with an increasingly fast speed. Moreover, the magnitudes of these coefficients are larger in China than those in Vietnam and the Philippines, indicating that ST reduced rural poverty with the fastest speed in China. Moreover, the average level of structural transformation is higher in the provinces of Vietnam than those in the Philippines during the period from 2002 to 2016, while rural poverty incidence is on average lower in Vietnamese provinces than those from the Philippines. This shows that the structural transformation is not inclusive in the Philippines.
Table 4 gives the regression results on the correlation between rural transformation and rural poverty reduction in the three countries. On one hand, RT1 is negatively correlated with rural poverty incidence in both China and Vietnam. The estimated coefficients of RT1 and RT1*D1 in the regression of Chinese provinces are −0.47 and −0.12, respectively, which reveals that the increasing share of high-value agriculture reduces rural poverty at an increasingly fast speed in China during the 2000–2017 period. Analogously, the coefficients of RT1 and RT1*D2 in the regression of Vietnam are −0.43 and −0.15 and are also statistically significant at the 1% level. This means that the rising share of high-value agriculture decreases rural poverty in Vietnam but at a slightly slower speed than that in China. In stark contrast, in the regression of the Philippines, the sign of the estimated parameter of RT1 is positive, showing that rural transformation is not inclusive in the Philippines, as the declining rural poverty incidence is accompanied by a decrease in the share of high-value agriculture during the period of 1994–2016. The underlying reason for this could be that low-value crop production still dominates in the agriculture of many regions in the Philippines due to a lack of agricultural diversification (World Bank, 2013). Thus, the process of rural transformation within the agricultural sector is not obvious in the Philippines, and promoting high-value agriculture only benefits the non-poor. On the other hand, RT2 has negative effects on rural poverty incidence in all three countries. Comparing the magnitudes of the estimated coefficients of RT2, it can be found that the share of rural labor off-farm employment reduces rural poverty slightly faster in China (2000–2016) than in Vietnam (2002–2016), while much faster in the Philippines (1994–2016) than in the other two countries.
Table 5 shows the estimation results of the regression on the correlation between structural and rural transformations and rural poverty reduction in the three countries. As is listed in Table 5, both structural and rural transformation have negative impacts on rural poverty. This demonstrates that structural and rural transformations have reduced rural poverty incidence in all three countries. To be specific, the coefficients of ST and ST*D1 in the regression of China are −0.60 and −0.47. They are statistically significant at the 1% level, meaning that structural transformation significantly decreased rural poverty incidence with increasingly fast speed in China during the period of 2000–2017. The coefficients of ST and ST*D2 in the regression for Vietnam are −0.25 and −0.03, while that of ST is −0.53 in the case of the Philippines. This reflects that structural transformation reduces rural poverty in the Philippines (1994–2016) faster than in Vietnam (2002–2016) but still slower than in China (2000–2017). With regard to RT1, its coefficient in the regression of the Philippines is not significant and rather small, implying that rural transformation within the agricultural sector has no significant effect on rural poverty reduction in the Philippines. Additionally, the coefficients of RT1 and RT1*D1 for China are −0.62 and −0.12, while those of RT1 and RT1*D2 for Vietnam are −0.40 and −0.16. They are all statistically significant at the 1% level. This indicates that rural transformation reduces rural poverty in China more quickly than in Vietnam. In general, China has experienced both inclusive structural and rural transformations, which have significantly reduced rural poverty faster than the other two countries. Both structural and rural transformations have reduced rural poverty in Vietnam, while only structural transformation has made a contribution to rural poverty reduction in the Philippines.

6. Major Institutions, Policies, and Investments Affecting Rural Transformation in China, the Philippines, and Vietnam

Many previous studies have shown that institutions, policies, and investments are the main drivers of agricultural growth and inclusive rural transformation. Based on these studies, we briefly compare the design and implementation of the major institutions, policies and investments that affect the path and speed of inclusive rural transformation, and discuss the likely impacts of the major IPIs on rural poverty reduction in China, the Philippines, and Vietnam.
Institutional reform has played a fundamentally important role in promoting fast rural and structural transformations in China over the past four decades. Based on the first rural reform implemented in late 1970s, the household responsibility system (HRS) has facilitated rural transformation from cereal-based agriculture to more diversified high-value agriculture through rising agricultural productivity [34]. During the same period, several institutional reforms on factor markets have been carried out to further promote rural transformation. These reforms included market reforms for agricultural inputs and outputs, institutional reforms to support township and village enterprises and rural cooperative economies, institutional innovation on mechanization, land consolidation, and labor mobility [12,13,35]. Moreover, the Chinese government has successively promulgated a number of supportive policies to establish a strong agricultural science and technology innovation and extension system and develop liberalized markets for agricultural products. The result was a rapid, sustained, and inclusive transformation of rural areas [2,13,35]. Further, heavy investment in rural areas, especially in agricultural R&D, transportation infrastructure, irrigation, education, and health care, provides a solid foundation for steady agricultural growth and rural transformation in China [12].
In the Philippines, land reforms aiming at land redistribution were made in the 1940s. However, the progress has been uneven with the result that land inequality is still wide across the country. The share of landless farmers increased from about 58% in the 1970s to approximately 70% in 2010 [36]. As the Philippine government realized that the development of the infrastructure systems is an important stimulus behind the increasing economic importance of the rural nonfarm sector in rural poverty reduction, it started to implement institutional reform on transferring irrigation management from the central level to decentralized users of irrigation services from the early 1990s [37]. However, due to the slow growth of government fiscal income, the public expenditure on water control has kept down and the limited expansion of irrigation has been made possible through loans from international agencies. The share of cultivated land equipped for irrigation even fell slightly from 16% in 1990 to 14% in 2010 [2]. Almost at the same time, the government increased investment in constructing rural electricity infrastructure [14]. Electrification coverage in the rural Philippines expanded starting with 49% of the households with access to electricity in 1993 and reaching 90% in 2017 [38]. Nevertheless, accomplishments in terms of increasing the quantity of roads and improving their quality have been modest [14]. The government’s spending on transportation infrastructure is below the World Bank’s recommendation (5% of GDP) to enable the Philippines to meet its infrastructure needs in the coming decade, and even dropped to only 0.3% of GDP in 2009 [39]. As a result, poor conditions of farm-to-market roads increased the transaction costs and aggravated rural poverty.
Since the ‘renovation (Đổi mới)’ policy was promulgated by the Vietnamese Communist Party in 1986, Vietnam’s economy has rapidly changed [40]. With the implementation of the household contract responsibility system as a breakthrough point in 1988, land-use rights were given to individuals. The Land Law released in 1993 further widened farmers’ land-use rights, including the right to rent, purchase, sell and bequeath land, and to use land as collateral [2]. These institutional reforms have made Vietnam switch from an agricultural country dominated by self-sufficient small-scale farming to an agricultural country dominated by commercialized production [16]. Moreover, sectoral policies supporting agricultural market reforms and investments in agricultural R&D and infrastructure have propelled rapid agricultural growth [2]. The agro–economic upswing over the past 20 years positively contributed to rapid poverty reduction rates and increasing living standards [41]. Under the background of agrarian change, rural transformation in Vietnam fueled growth in the off-farm sector [40]. Meanwhile, through the transition from a state-led to a market economy, the off-farm sector continued to rise, providing new jobs and off-farm employment opportunities. The resulting trends of modernization are highly visible [42,43]. In recent years, Vietnam has steadily remained the world’s second-largest grain exporter. It also has been the leading exporter of agricultural products and agricultural by-products, such as coffee beans, cashew nuts, rubber, etc. [16].

7. Concluding Remarks and Policy Implications

China, the Philippines, and Vietnam have experienced significant rural and structural transformations in the past two decades. Rural transformation has occurred both within the agricultural sector and through labor transfer from farm to non-farm sectors. Within the agricultural sector, rural transformation is characterized by the shifting of agriculture from largely cereal-based production to higher-value production, such as vegetables, fruits, livestock, and fisheries. Over the same period, along with agricultural growth, the three countries underwent a fast structural transformation. The share of agriculture in both the GDP and total employment has been declining in almost all provinces of these three countries. There is a converging trend between these two shares, indicating that the divergence between labor productivity in agriculture and in the remaining sectors of the economy has been decreasing in these countries. However, the speed of structural transformation and the convergence of labor productivity differs largely not only among countries but also among provinces within each country.
This paper also found that both structural and rural transformations matter in rural poverty reduction in these three countries. The graphic analysis demonstrates that the structural transformation is negatively correlated with the rural poverty rate. This is to say, the higher the level of ST, the lower the rural poverty rate. With respect to the relationship between rural transformation and rural poverty reduction, there is strong evidence showing that raising the share of rural off-farm employment contributes to rural poverty reduction. However, rural transformation within the agricultural sector through a shift from cultivating low-value crops to high-value agricultural production (such as vegetables, fruits, livestock, and fisheries) facilitates rural poverty reduction in China and Vietnam but does not help decrease rural poverty in the Philippines. The results of the regression analysis confirm the negative relationship between rural poverty and the shares of non-agricultural GDP. Furthermore, the regression analysis also reveals that with the expansion of the non-farm sectors in both urban and rural areas, high-value agricultural shares have a statistically significant and negative correlation with rural poverty in China and Vietnam over time. Nevertheless, such a negative correlation is much weaker or even does not exist in the Philippines. In other words, structural and rural transformation are not inclusive in the Philippines. Particularly, the speeds and levels of ST and RT and rural poverty reduction differ not only across countries but also among provinces within each country.
The abovementioned findings of this paper have several policy implications. In general, the governments of all these three countries should continue to boost the nonfarm sectors of their economies by constantly raising the share of non-agricultural GDP and vigorously encouraging off-farm employment. Specifically, the Chinese government should promote appropriate institutional innovations, adopt policy supports, and raise investments to improve agricultural productivity and therefore further speed up rural transformation to a higher level and alleviate rural poverty. The Philippine government should substantially expand its investment in infrastructure construction such as upgrading road networks and irrigation systems on one hand and diversify agriculture by producing more high-value products on the other hand. The Vietnamese government should accelerate rural transformation by adjusting agricultural structure to produce more high-value commodities and propel industrialization and urbanization in the meantime. Finally, as this paper shows, the speeds and levels of structural and rural transformation and rural poverty reduction differ largely among provinces within each country. The differences could be attributed to many factors such as the agricultural potential of each province, in terms of the terrain, soils, or demographic characteristics of the labor force; the distance from urban centers; the related services to the population; etc. Therefore, we raise the following policy recommendations at the provincial level.
Firstly, for provinces with both fast structural and rural transformation, future policies should focus on sustaining the growth of labor-intensive manufacturing for inclusive transformation. Further, promoting integrated urban–rural development and balanced regional development to narrow urban–rural and regional income gaps is another concern for future policymaking.
Secondly, for provinces that have gone through both slow structural and rural transformation, policies should attach more importance to eliminating the binding economic, institutional, and political constraints to achieve faster structural and rural transformation. Especially, the government should take measures to create more jobs for rural workers in agricultural or non-farm sectors in both urban and rural areas. The investment in agricultural technology and infrastructure construction should be increased further to promote agricultural and rural growth.
Thirdly, for provinces with mixed outcomes of structural transformation, rural transformation, and poverty reduction, the focus of future policies should depend on the circumstances of the province. Provinces with slow structural transformation should prioritize job creation in non-farm sectors in both rural and urban areas, whereas provinces with slow rural transformation should take infrastructure construction and investment in agricultural technology into account when designing future policies for rural development.

Author Contributions

Conceptualization, Q.C. and J.H.; methodology, Q.C. and J.H.; data collection, Q.C., M.A.S. and T.T.; writing—original draft preparation, Q.C.; writing—review and editing, J.H., M.A.S. and T.T. All authors have read and agreed to the published version of the manuscript.

Funding

This research was funded by International Fund for Agricultural Development, grant number 2000000866, and the National Natural Science Foundation of China, grant numbers 72433001 and 71934003.

Data Availability Statement

The original contributions presented in this study are included in the article. Further inquiries can be directed to the corresponding author.

Acknowledgments

The authors would like to thank all project team members from China, the Philippines, and Vietnam for their efforts in rectifying country data and information and providing comments in the early stage of this study, especially Yu Sheng, Pengfei Shi, and Huayong Zhi from China; Pedcris Orencio and Karen Custodio from the Philippines; and Nguyen Do Anh Tuan, Pham Kieu Hanh, Vu Thi Lan, and Dang Kim Khoi from Vietnam.

Conflicts of Interest

The authors declare no conflicts of interest. The funders had no role in the design of the study; in the collection, analyses, or interpretation of data; in the writing of the manuscript; or in the decision to publish the results.

Abbreviations

The following abbreviations are used in this manuscript:
IFADInternational Fund for Agricultural Development
FAOFood and Agriculture Organization of the United Nations
GSOVGeneral Statistic Office of Vietnam
PPPPurchasing Power Parity
WDIWorld Development Indicators
OECDOrganization for Economic Co-operation and Development
GDPGross Domestic Product
IFPRIInternational Food Policy Research Institute

Appendix A

Table A1. Sampled provinces in China, the Philippines, and Vietnam.
CountryRegionProvince
ChinaMiddle–lower Yangtze RegionZhejiang, Jiangsu, Hubei, Hunan, Jiangxi, and Anhui
Southwest ChinaChongqing, Sichuan, Yunnan, Guizhou, and Guangxi
South ChinaFujian and Guangdong
The PhilippinesCordillera Administrative Region, Ilocos, Cagayan Valley, Central Luzon, Calabarzon, Mimaropa, Bicol, Western Visayas, Central Visayas, Eastern Visayas, Zamboanga Peninsula, North Mindanao, Davao, SICCSKSARGEN, Caraga, Autonomous Region in Muslim Mindanao
VietnamRed River Delta Bắc Ninh, Hà Nam, Hưng Yên, Hải Dương, Ninh Bình, Thái Bình, and Vĩnh Phúc
Northeast and Northwest RegionBắc Giang, Bắc Kạn, Hà Giang, Lào Cai, Lạng Sơn, Hòa Bình, Thái Nguyên, Tuyên Quang, and Yên Bái
North Central Coast RegionHà Tĩnh, Quảng Bình, and Quảng Trị
South Central Coast RegionBình Định, Phú Yên, Quảng Nam, and Quảng Ngãi
Central Highland and Southeast RegionBình Phước, Bình Thuận, Ninh Thuận, Tây Ninh, and Gia Lai
Mekong River Delta An Giang, Bến Tre, Kiên Giang, Long An, Sóc Trăng, Tiền Giang, Trà Vinh, Vĩnh Long, and Đồng Tháp

Notes

1
The regions of the Philippines are similar in size to the provinces of China. As data are only available at the regional level in the Philippines, we use regional data of the Philippines in our analysis.
2
The provincial rural poverty incidence was higher in the second stage than that in the first stage in China and Vietnam. This is mainly because these two countries raised their national standard of poverty line.
3
In the process of an inclusive transformation, everyone, without exception, can exercise their economic, social, and political rights, develop their abilities, and take advantage of the opportunities available in their environment [2]. According to IFAD, rural poverty reduction as structural and rural transformation proceed is used as a proxy for inclusion [2].
4
Therefore, ST*D1, RT1*D1, and RT2*D1 represent ST, RT1, and RT2 in China during the period of 2011–2017, while ST*D2, RT1*D2, and RT2*D2 represent ST, RT1, and RT2 in Vietnam during the period of 2010–2016.

References

  1. Timmer, C. Food security, structural transformation, markets and government policy. Asia Pac. Policy Stud. 2017, 4, 4–19. [Google Scholar] [CrossRef]
  2. IFAD. Rural Development Report 2016: Fostering Inclusive Rural Transformation; IFAD: Rome, Italy, 2016; pp. 106–124. [Google Scholar]
  3. Huang, J. Forty years of China’s agricultural development and reform and the way forward in the future. J. Agrotech. Econ. 2018, 3, 4–15. [Google Scholar]
  4. Huang, J.; Wang, D.; Findlay, C.; Chen, C. Accelerating rural transformation in Asian developing countries. J. Integr. Agric. 2023, 22, 3565–3567. [Google Scholar] [CrossRef]
  5. NBSC (National Bureau of Statistics of China). China Statistic Yearbook 2020; NBSC: Beijing, China, 2021.
  6. Hamzah, I. Effective Institutional Arrangement in Rural Development: Malaysia. Master’s Thesis, University of Glasgow, Glasgow, UK, 2010. [Google Scholar]
  7. Shaari, I. Rural Development and Rural Poverty in Malaysia. In Poverty Amidst Plenty: Research Findings and the Gender Dimension in Malaysia; Ariffin, J., Ed.; Pelanduk Publications: Petaling Jaya, Malaysia, 1994; pp. 26–67. [Google Scholar]
  8. DOSM (Department of Statistics Malaysia). Yearbook of Statistics Malaysia; DOSM: Kuala Lumpur, Malaysia, 2017.
  9. World Bank. World Development Indicators; World Bank: Washington, DC, USA, 2015. [Google Scholar]
  10. GSOV (General Statistics Office of Vietnam). Results of the 2016 Rural, Agricultural and Fishery Census; Statistical Publishing House: Hà Nội, Vietnam, 2017.
  11. FAO. Agricultural Transformation of Middle-Income Asian Economies: Diversification, Farm Size and Mechanization, by David Dawe; ESA Working Paper No. 15-04; FAO: Rome, Italy, 2015. [Google Scholar]
  12. Huang, J.; Shi, P. Regional rural and structural transformations and farmer’s income in the past four decades in China. China Agric. Econ. Rev. 2021, 13, 278–301. [Google Scholar] [CrossRef]
  13. Huang, J. Rural Revitalization: Rural Transformation, Structural Transformation and Government’s Functions. Issues Agric. Econ. 2020, 1, 4–16. [Google Scholar]
  14. Ramos, C.G.; Estudillo, J.; Sawada, Y.; Otsuka, K. Transformation of the rural economy in the Philippines, 1988–2006. J. Dev. Stud. 2012, 48, 1629–1648. [Google Scholar] [CrossRef]
  15. Nguyen, M.H.; Dorin, B.; Duteurtre, G. Structural transformation, agriculture and livestock in Vietnam (1970–2015): A multi-scale political economy of an ongoing revolution. In 11ème Journées de Recherche en Sciences Sociales INRA-SFER-CIRAD; SFER: Lyon, France, 2017. [Google Scholar]
  16. Tarp, F. Growth, Structural Transformation, and Rural Change in Vietnam: A Rising Dragon on the Move; Oxford University Press: Oxford, UK, 2007. [Google Scholar]
  17. Huang, J. China’s rural transformation and policies: Past experience and future direction. Engineering 2022, 18, 21–26. [Google Scholar] [CrossRef]
  18. Mat Zin, R. Measuring and Monitoring Poverty and Inequality: The Malaysian Experience; Institute of Southeast Asia Studies: Singapore, 2011. [Google Scholar]
  19. Bhattacharya, R.; Bhattacharjee, J. Poverty and Inequality in India: Regional Disparities. In Regional Development and Public Policy Challenges in India. India Studies in Business and Economics; Bhattacharya, R., Ed.; Springer: New Delhi, India, 2015. [Google Scholar] [CrossRef]
  20. NBSC (National Bureau of Statistics of China). China Statistic Yearbook 2017; NBSC: Beijing, China, 2018.
  21. GSOV (General Statistics Office of Vietnam). Statistical Yearbook of Vietnam; Statistical Publishing House: Hà Nội, Vietnam, 2003.
  22. World Bank. World Development Indicators; World Bank: Washington, DC, USA, 2023. [Google Scholar]
  23. Johnston, B.F.; Mellor, J.W. The role of agriculture in economic development. Am. Econ. Rev. 1961, 51, 566–593. [Google Scholar]
  24. Li, S.; Dong, Y.; Zhang, L.; Liu, C. Off-farm employment and poverty alleviation in rural China. J. Integr. Agric. 2021, 20, 2–10. [Google Scholar] [CrossRef]
  25. OECD. Review of Agricultural Policies in Vietnam; OECD: Paris, France, 2015. [Google Scholar]
  26. GSOV (General Statistics Office of Vietnam). Statistical Yearbook of Vietnam; Statistical Publishing House: Hà Nội, Vietnam, 2024.
  27. Teresa, M.; Sanchez, C. Rural Labor and Rural Non-Agricultural Activities in the Philippines; Discussion Paper Series No. 94-11; Philippine Institute for Development Studies: Quezon City, Philippines, 1994.
  28. Balisacan, A.M. Agricultural growth, landlessness, off-farm employment and rural poverty in the Philippines. In Proceedings of the 35th Annual, Conference of the Australian Agricultural Economic Society held at the University of New England, Armidale, Australia, 11–14 February 1991. [Google Scholar]
  29. Briones, R.M. Agricultural Employment and the Rural Household: A Characterization for Selected Provinces in the Philippines; Discussion Paper Series No. 2020-17; Philippine Institute for Development Studies: Quezon City, Philippines, 2020.
  30. Timmer, P. A World Without Agriculture: The Structural Transformation in Historical Perspective; Wendt Distinguished Lecture; American Enterprise Institute: Washington, DC, USA, 2009. [Google Scholar]
  31. Farooq, S. The Rural Nonfarm Economy, Livelihood Strategies and Household Welfare in Rural Pakistan; Pakistan Institute of Development Economics (PIDE): Islamabad, Pakistan, 2014. [Google Scholar]
  32. IFPRI. Global Food Security Report 2019; IFPRI: Washington, DC, USA, 2019; Available online: https://ebrary.ifpri.org/utils/getfile/collection/p15738coll2/id/133129/filename/133348.pdf (accessed on 27 February 2019).
  33. World Bank. The Philippines Mindanao Jobs Report; World Bank: Washington, DC, USA, 2017. [Google Scholar]
  34. Huang, J.; Rozelle, S. Technological change: Rediscovering the engine of productivity growth in China’s agricultural economy. J. Dev. Econ. 1996, 49, 337–369. [Google Scholar] [CrossRef]
  35. Huang, J. Facilitating inclusive rural transformation in the Asian countries. World Food Policy 2018, 4, 31–55. [Google Scholar] [CrossRef]
  36. USAID. Philippines: Property Rights and Resource Governance; USAID: Washington, DC, USA, 2011.
  37. World Bank. Philippine Development Report. Creating More and Better Jobs; World Bank: Washington, DC, USA, 2013. [Google Scholar]
  38. Llanto, G. Infrastructure and regional growth. In The Dynamics of Regional Development: The Philippines in East Asia; Balisacan, A., Hill, H., Eds.; Asian Development Bank Institute; Edward Elgar Publishing: Cheltenham, UK, 2007; pp. 316–344. [Google Scholar]
  39. Llanto, G. The Impact of Infrastructure on Agricultural Productivity; Philippine Institute for Development Studies: Manila, Philippines, 2012.
  40. Benedikter, S.; Waibel, G.; Birtel, S.; Tran, B.T. Local Entrepreneurship in Vietnam’s Rural Transformation. A Case Study from the Mekong Delta; Center for Development Research (ZEF): Bonn, Germany; Institute for Socio-Economic Development Studies (CIDS): Can Tho City, Vietnam; Southern Institute of Social Sciences (SISS): Can Tho City, Vietnam, 2013.
  41. UNDP; AUSAID. The Regional Poverty Assessment; UNDP; AUSAID: Mekong River Region, Vietnam, 2003.
  42. Vijvereberg, W.P.M.; Haughton, J. Household Enterprises in Vietnam: Survival, Growth, and Living Standards. In Economic Growth, Poverty, and Household Welfare in Vietnam; Glewwe, P., Agrawal, N., Dollar, D., Eds.; World Bank: Washington, DC, USA, 2004. [Google Scholar]
  43. Oostendorp, R.H.; Trung, T.Q.; Tung, N.T. The Changing Role of Non-Farm Household Enterprises in Vietnam. World Dev. 2009, 37, 632–644. [Google Scholar] [CrossRef]
Figure 1. Convergence of shares of agricultural GDP and employment in China, Vietnam, and the Philippines in recent decades. CHN = China, VNM = Vietnam, PHL = Philippines. Note: Log per capita GDP is the logarithmic transformation of the level of Gross Domestic Product divided by mid-year population of the country (constant 2010 US dollars). The triangular, circular, and square dots represent agricultural employment (%), agricultural GDP (%), and the difference between agricultural GDP (%) and agricultural employment (%), respectively. The red, green, and blue colors represent China, the Philippines, and Vietnam. Data source: World Development Indicators database, World Bank (2021).
Land 14 00350 g001
Figure 2. Share of non-cereal in agricultural output values in China, the Philippines, and Vietnam, 1979–2018. Source: FAO (2021).
Land 14 00350 g002
Figure 3. Rural poverty incidence (%) in China, the Philippines, and Vietnam. Note: The rural poverty line in China from 1978 to 2019 was RMB 2300 per person per year at 2010 prices, equivalent to USD 2.3 per person per day (PPP) and higher than the updated international extreme poverty line (USD 1.9 per person per day (PPP)) of the World Bank. The poverty line in the Philippines was USD 1.25 per person per day (PPP) in 1997–2012 and USD 1.95 per person per day (PPP) in 2015–2018. The poverty line in Vietnam was USD 1.23 per person per day (PPP) in 1993–2008 and USD 1.93 per person per day (PPP) in 2010–2016. Data source: NBS (2021); PSA (2020); GSO (2020); World Bank (2018).
Land 14 00350 g003
Figure 4. Convergence of shares of agricultural GDP and employment in China (a), the Philippines (b), and Vietnam (c), 1990–2017. Note: GDP is in constant 2000 international dollars in PPP. Each dot represents an observation of a province/region. The trend lines are generated using the quadratic fitting method. Sources: China Statistic Yearbook (various years) and China Provincial Statistic Yearbook (various years); National Statistical Coordination Board of the Philippines (2003, 2008) and Philippine Statistics Authority (2019); General Statistic Office of Vietnam (2020); and the Provincial Statistic Yearbook of Vietnam.
Land 14 00350 g004
Figure 5. Shares of high-value agriculture in China (a), the Philippines (b), and Vietnam (c), 1988–2017. Note: Each dot represents an observation of a province/region in corresponding year. Each trend line is obtained using a linear fitting method. In (b), the light blue color represents regions showing negative trends whereby the share of high-value agriculture gradually declined over time, while the dark blue color represents those with increasing high-value agriculture in the Philippines. Source: China Statistic Yearbook (various years) and China Provincial Statistic Yearbook (various years); National Statistical Coordination Board of the Philippines (2003, 2008) and Philippine Statistics Authority (2019); General Statistic Office of Vietnam (https://www.gso.gov.vn); and the Provincial Statistic Yearbook of Vietnam.
Land 14 00350 g005
Figure 6. Shares of rural labor off-farm employment in China (a), the Philippines (b), and Vietnam (c), 1988–2017. Note: Each dot represents an observation of a province/region in corresponding year. Each trend line is obtained using a linear fitting method. Source: China Statistic Yearbook (various years) and China Provincial Statistic Yearbook (various years); National Statistical Coordination Board of the Philippines (2003, 2008) and Philippine Statistics Authority (2019); General Statistic Office of Vietnam (https://www.gso.gov.vn); and the Provincial Statistic Yearbook of Vietnam.
Land 14 00350 g006aLand 14 00350 g006b
Figure 7. Rural poverty incidence in China, the Philippines, and Vietnam, 1994–2017. Note: Each dot represents an observation of a province/region in corresponding year. Each trend line is obtained using a quadratic fitting method. The national standard of the poverty line in Vietnam is about 1.34 a day in International USD in PPP during 2002–2008 and about 1.93 a day in International USD in PPP during 2010–2016. The national standard of the poverty line in China is about 1.03 a day in International USD in PPP during 2000–2010 and about 2.20 a day in International USD in PPP during 2011–2017. The national standard of the poverty line in the Philippines is about 1.95 a day International USD in PPP. Source: China Statistic Yearbook (various years) and China Provincial Statistic Yearbook (various years); National Statistical Coordination Board of the Philippines (2003, 2008) and Philippine Statistics Authority (2019); General Statistic Office of Vietnam (https://www.gso.gov.vn); and the Provincial Statistic Yearbook of Vietnam.
Land 14 00350 g007
Figure 8. Share of non-agricultural GDP and rural poverty reduction in China, the Philippines, and Vietnam, 1994–2017. Note: Each dot represents an observation of a province/region in corresponding year. The national standard of the poverty line in Vietnam is about 1.34 a day in International USD in PPP during 2002–2008 and about 1.93 a day in International USD in PPP during 2010–2016. The national standard of the poverty line in China is about 1.03 a day in International USD in PPP during 2000–2010 and about 2.20 a day in International USD in PPP during 2011–2017. The national standard of the poverty line in the Philippines during 1994–2016 is about 1.95 a day in International USD in PPP. Source: China Statistic Yearbook (various years) and China Provincial Statistic Yearbook (various years); National Statistical Coordination Board of the Philippines (2003, 2008) and Philippine Statistics Authority (2019); General Statistic Office of Vietnam (https://www.gso.gov.vn); and the Provincial Statistic Yearbook of Vietnam.
Land 14 00350 g008
Figure 9. Share of high-value agriculture and rural poverty incidence in China, the Philippines, and Vietnam, 1994–2017. Note: Each dot represents an observation of a province/region in corresponding year. The national standard of the poverty line in Vietnam is about 1.34 a day in International USD in PPP during 2002–2008 and about 1.93 a day in International USD in PPP during 2010–2016. The national standard of the poverty line in China is about 1.03 a day in International USD in PPP during 2000–2010 and about 2.20 a day in International USD in PPP during 2011–2017. The national standard of the poverty line in the Philippines during 1994–2016 is about 1.95 a day in International USD in PPP. Source: China Statistic Yearbook (various years) and China Provincial Statistic Yearbook (various years); National Statistical Coordination Board of the Philippines (2003, 2008) and Philippine Statistics Authority (2019); General Statistic Office of Vietnam (https://www.gso.gov.vn); and the Provincial Statistic Yearbook of Vietnam.
Land 14 00350 g009
Figure 10. Share of rural labor off-farm employment and rural poverty incidence in China, the Philippines, and Vietnam, 1994–2017. Note: Each dot represents an observation of a province/region in corresponding year. The national standard of the poverty line in Vietnam is about 1.34 a day in International USD in PPP during 2002–2008 and about 1.93 a day in International USD in PPP during 2010–2016. The national standard of the poverty line in China is about 1.03 a day in International USD in PPP during 2000–2010 and about 2.20 a day in International USD in PPP during 2011–2017. The national standard of the poverty line in the Philippines during 1994–2016 is about 1.95 a day in International USD in PPP. Source: China Statistic Yearbook (various years) and China Provincial Statistic Yearbook (various years); National Statistical Coordination Board of the Philippines (2003, 2008) and Philippine Statistics Authority (2019); General Statistic Office of Vietnam (https://www.gso.gov.vn); and the Provincial Statistic Yearbook of Vietnam.
Land 14 00350 g010
Table 1. Agricultural value added and agricultural labor productivity in China, the Philippines, and Vietnam, 1991–2018.
Added Value Added
(Billion USD)
Annual Growth Rate in 1991–2018 (%)Agricultural Labor Productivity (Added Value per Labor, USD)Annual Growth Rate in 1991–2018 (%)
1991201819912018
China36310313.9495552576.52
Philippines18352.49173233812.51
Vietnam14383.7757316293.95
Note: Value is in constant 2015 USD. Annual growth rate over 27 years is estimated as ((Y2018/Y1991) ^ (1/27) − 1) × 100. Source: World Development Indicators database, World Bank (2021).
Table 2. Indicators measuring provincial/regional structural and rural transformations.
DimensionsIndicatorsDefinitions (Units)
ST: Structural transformationShare of non-agricultural GDPShare of secondary and tertiary industries in total GDP (%)
RT: Rural transformationRT1: Share of high-value agricultureShare of the output value of non-cereal production in gross output value of agriculture (%)
RT2: Share of rural labor off-farm employment Share of rural labor employed in non-agricultural sectors in total rural employment (%)
OutcomeRural poverty incidenceShare of rural population below national poverty line (%)
Table 3. Regression results on the correlation between structural transformation and rural poverty incidence (%).
ChinaVietnamPhilippines
OLSFEOLSFEOLSFE
ST−0.67 ***−0.64 ***−0.35 ***−0.40 ***−0.53 ***−0.53 ***
(0.09)(0.07)(0.05)(0.05)(0.10)(0.12)
ST*D1−0.38 ***−0.36 ***
(0.12)(0.12)
ST*D2 −0.04−0.04
(0.04)(0.04)
D139.24 ***36.69 ***
(10.47)(10.56)
D2 0.441.11
(2.67)(2.67)
cons63.28 ***60.69 ***40.31 ***42.90 ***74.60 ***74.67 ***
(7.36)(7.68)(3.26)(3.17)(7.94)(8.48)
Overall R20.440.440.520.520.210.21
Hausman Test7.16 *7.42 *6.09 *
No. of obs.234234370370141141
Note: D1 = 1 if country = China and year >= 2011; D2 = 1 if country = Vietnam and year >= 2010; ST: Share of non-agricultural GDP (%). The values in the parentheses are the standard errors. The significance levels are * 10% and *** 1%.
Table 4. Regression results on the correlation between rural transformation and rural poverty incidence (%).
ChinaVietnamPhilippines
OLSFEOLSFEOLSFE
RT1−0.43 ***−0.47 ***−0.30 ***−0.43 ***0.18 ***0.16 **
(0.07)(0.08)(0.04)(0.05)(0.06)(0.07)
RT1*D1−0.10 ***−0.12 ***
(0.07)(0.07)
RT1*D2 −0.11 ***−0.15 ***
(0.03)(0.03)
RT2−0.30 ***−0.29 ***−0.44 ***−0.28 ***−0.53 ***−0.55 ***
(0.03)(0.04)(0.08)(0.09)(0.08)(0.09)
RT2*D1−0.02 ***−0.02 ***
(0.04)(0.03)
RT2*D2 0.100.02
(0.05)(0.04)
D115.86 ***18.03 ***
(5.52)(5.52)
D2 4.04 ***8.97 ***
(3.44)(3.43)
cons54.44 ***56.69 ***56.09 ***62.55 ***72.16 ***74.58 ***
(5.52)(6.40)(3.82)(4.66)(5.78)(6.75)
Overall R20.610.600.610.620.520.52
Hausman test45.20 *** 43.98 *** 43.00 ***
No. of Obs.234234370370141141
Note: D1 = 1 if country = China and year >= 2011; D2 = 1 if country = Vietnam and Year >= 2010; RT1: Share of high-value agriculture (%); RT2: Share of rural labor off-farm employment. The values in the parentheses are the standard errors. The significance levels are ** 5%, and *** 1%.
Table 5. Regression results on the correlation between structural and rural transformations and rural poverty incidence (%).
ChinaVietnamPhilippines
OLSFEOLSFEOLSFE
ST−0.57 ***−0.60 ***−0.26 ***−0.25 ***−0.53 ***−0.55 ***
(0.07)(0.08)(0.05)(0.05)(0.11)(0.14)
ST*D1−0.47 ***−0.47 ***
(0.11)(0.11)
ST*D2 −0.03−0.03
(0.04)(0.03)
RT1−0.55 ***−0.62 ***−0.32 ***−0.40 ***−0.02−0.03
(0.07)(0.08)(0.04)(0.05)(0.08)(0.10)
RT1*D1−0.09−0.12 **
(0.08)(0.07)
RT1*D2 −0.14 ***−0.16 ***
(0.03)(0.03)
D155.71 ***58.88 ***
(9.68)(9.57)
D2 12.51 ***14.03 ***
(3.24)(3.66)
cons99.78 ***107.45 ***56.09 ***60.73 ***76.78 ***78.27 ***
(7.53)(8.69)(3.82)(3.66)(10.95)(14.33)
Overall R20.540.540.640.640.210.21
Hausman test25.77 ***38.72 ***20.05 ***
No. of obs.234234370370141141
Note: D1 = 1 if country = China and year >= 2011; D2 = 1 if country = Vietnam and Year >= 2010; ST: Share of non-agricultural GDP (%); RT1: Share of high-value agriculture (%). The values in the parentheses are the standard errors. The significance levels are ** 5%, and *** 1%.
Disclaimer/Publisher’s Note: The statements, opinions and data contained in all publications are solely those of the individual author(s) and contributor(s) and not of MDPI and/or the editor(s). MDPI and/or the editor(s) disclaim responsibility for any injury to people or property resulting from any ideas, methods, instructions or products referred to in the content.

