Article

Comprehensive Assessment of Drought Susceptibility Using Predictive Modeling, Climate Change Projections, and Land Use Dynamics for Sustainable Management

1
College of Surveying and Geo-Informatics, North China University of Water Resources and Electric Power, Zhengzhou 450046, China
2
Key Laboratory of Mine Spatio-Temporal Information and Ecological Restoration, Ministry of Natural Resources, Jiaozuo 454003, China
3
Hydraulics and Geotechnics Section, KU Leuven, Kasteelpark Arenberg 40, BE-3001 Leuven, Belgium
4
National Institute of Natural Hazards, Ministry of Emergency Management of the People’s Republic of China, Beijing 100085, China
5
Department of Environment, Tabas Branch, Tabas 9791735618, Iran
6
Department of Arid Zone Management, Gorgan University of Agricultural Sciences and Natural Resources (GUASNR), Gorgan 4913815739, Iran
*
Author to whom correspondence should be addressed.
Land 2025, 14(2), 337; https://doi.org/10.3390/land14020337
Submission received: 23 December 2024 / Revised: 3 February 2025 / Accepted: 5 February 2025 / Published: 7 February 2025

Abstract

:
This study assessed the drought susceptibility in Golestan Province, Northeastern Iran, using land use change modeling and climate projections from the CMIP6 framework, under three Shared Socioeconomic Pathways (SSP1-2.6, SSP2-4.5, and SSP5-8.5) for 2030–2050. The development of current (2022) and future drought susceptibility maps was based on agrometeorological sample points and 14 environmental factors—such as land use, precipitation, mean temperature, soil moisture, and remote sensing-driven vegetation indices—used as inputs into a machine learning model, maximum entropy. The model showed a very robust predictive capacity, with AUCs for the training and test data of 0.929 and 0.910, thus certifying the model’s reliability. The current analysis identified major hotspots in Gomishan and Aqqala, where 66.12% and 36.12% of their areas, respectively, exhibited “very high” susceptibility. Projections under the SSP scenarios, particularly SSP5-8.5, indicate that the risk of drought will be the most severe in Maraveh Tappeh, where 72.09% of the area exhibits a “very high” risk. The results revealed that Golestan Province is at a crossroads. Rising temperatures, exceeding 35 °C in summer, combined with declining rainfall, intensify agricultural and hydrological droughts. These aggravated risks are compounded with land use transitions from rangelands to bare land, mostly in Aqqala and Gomishan, besides urban expansion in Bandar-e Torkman and Bandar Gaz, all of which face less groundwater recharge and increased surface runoff. Golestan’s drought vulnerability has both local and regional impacts, with its increased susceptibility affecting neighboring communities and ecosystems. Trade, migration, and ecological stresses linked to declining water resources may emerge as critical challenges, requiring regional collaboration for mitigation. Targeted interventions prioritizing sustainable land use practices, regional cooperation, and collaborative strategies are essential to address and mitigate these cascading risks and safeguard vulnerable communities.

1. Introduction

Drought is defined as a prolonged period of deficient precipitation and related climatic conditions that significantly affect agrometeorological factors, such as soil moisture and crop yields, leading to adverse impacts on agricultural systems and water availability [1]. Drought is a complex natural disaster with multiple facets, characterized by prolonged water deficiency, which has major effects on ecosystems, agricultural systems, and human societies [2]. It has critically affected the water availability, agricultural productivity, and livelihoods of millions of people [3]. The United Nations Convention to Combat Desertification (UNCCD) has reported a global economic loss due to drought of approximately USD 124 billion from 2000 to 2019, with the last 10 years witnessing an increased frequency and severity [4]. Droughts have a significant societal impact in addition to financial costs, including food insecurity, malnutrition, migration, and conflict over scarce resources; therefore, it represents a significant concern regarding sustainable development [5]. In the case of Iran, an arid and semi-arid country, drought represents one of the most significant environmental challenges. It has critically affected the water availability, agricultural productivity, and livelihoods of millions of people. Iran has witnessed a number of recent serious droughts, with the drought from 1999 to 2001 causing an estimated USD 3.3 billion in economic losses, affecting over 37 million people [6]. Agricultural production in Iran relies heavily on irrigation, to the point that it is estimated that agriculture requires, on average, over 90 percent of Iran’s water resources [7]. This heavy reliance on farming renders Iran particularly vulnerable to precipitation and temperature variability, where the results of drought exacerbate water scarcity and increase the extraction of groundwater, land subsidence, and desertification. Additionally, the socioeconomic repercussions of drought include the loss of income from agricultural operations, leading to rural–urban migration, placing an additional burden on the already stretched socioeconomic system [8]. In Northern Iran, Golestan Province, which experiences comparatively higher precipitation levels and milder temperatures than the arid and semi-arid southern regions, still faces significant drought challenges, leading to repeated reductions in crop production, diminished water availability, and increased socioeconomic stress.
Recent advances in climate science have emphasized the role of human-induced climate change in modifying the hydrological cycle and increasing the frequency and severity of droughts in many regions of the globe [9]. Previous global studies have applied different climate models and emission scenarios to project future drought conditions and reported unprecedented drought risks for the Mediterranean area, Central America, and parts of the Middle East and other regions of Africa and Asia, including Iran [10,11]. These global drought studies use global circulation models (GCMs) and regional climate models (RCMs) to simulate changes in key variables like the temperature, precipitation, and other climate variables, and they are used as inputs to assess the impact of the projected climate on the future drought dynamics under various greenhouse gas emission scenarios [12]. However, integrating LULC changes with climate projections remains a novel approach in Iran. While LULC studies in Iran have explored its impact on hydrological processes and droughts, no comprehensive research has integrated both climate and LULC dynamics to assess future drought risks under changing conditions, as is considered in our study. In the case of Iran, a plethora of studies have been conducted to analyze the link between climate change and drought. These studies have found significant changes in the temperature and precipitation patterns over the last few decades in different climatic zones of Iran [13,14]. Climate studies lack localized drought indicators, which are crucial for decision makers to address future vulnerabilities [15]. In Iran, LULC changes, such as deforestation, urbanization, and agricultural expansion, significantly affect hydrological processes and exacerbate drought conditions [16]. Studies have shown that these LULC changes can influence key factors like evapotranspiration, soil moisture, and surface runoff, further intensifying the drought risk [16,17,18,19,20]. For example, deforestation in some regions of Iran has led to increased vulnerability to drought [21,22], while urbanization has contributed to a reduced water retention capacity in the soil [23,24,25]. Still, to the authors’ knowledge, there are no studies on the impact of LULC change on the future drought risks in Iran under different climate change scenarios.
While much promise is found in the literature related to drought and climate change, several underpinning issues remain. The first is that there have been few, if any, comprehensive studies that fully integrate the latest climate projections with dynamics associated with land use change to assess the drought susceptibility moving forward into the future. Most studies have assessed either the impacts of climate change or land use changes in isolation, neglecting the interconnected nature of these factors, which could significantly shape the drought conditions [26]. Secondly, many of the existing studies utilize earlier climate models, such as the Climate Model Intercomparison Project Phase 5 (CMIP5) [27,28], which uses climate models that have a lower spatial resolution compared to those from CMIP6 [29]. CMIP6 enhances climate simulations by incorporating higher-resolution models and a broader range of socioeconomic pathways, providing deeper insights into future drought risks and opportunities. This advancement is particularly relevant for Iran, where previous climate studies have often relied on lower-resolution models (e.g., CMIP5), resulting in generalized climate projections. The higher spatial resolution and diverse socioeconomic pathways provided by CMIP6 offer more region-specific and nuanced insights, which are critical in addressing the unique drought challenges faced by Iran, where agriculture and water management are heavily impacted by such changes. Our study therefore aims to fill this gap through projections of the future precipitation and temperature derived from CMIP6 climate models and using a Markov chain model for land use projection in Golestan Province, Iran. The integration of CMIP6 projections with LULC dynamics is particularly innovative for Iran. Previous studies in Iran and other semi-arid regions have typically focused either on climate projections alone [30,31,32,33], LULC impacts on drought [34,35,36], or older climate models such as CMIP5 [37,38,39,40]. By combining high-resolution climate projections (CMIP6) with future LULC changes, our approach allows for a more accurate and localized assessment of the drought risk, addressing gaps in the current research, where the interaction between the climate and land use has been overlooked in this region. For example, recent studies have similarly noted the importance of coupling LULC dynamics with climate change projections for a comprehensive understanding of the future drought conditions [41,42,43,44]. Together with a machine learning model (MaxEnt) for drought susceptibility assessment and projection, with the use of several drought-controlling predictors, including the current and future projected land use and climate variables, we aim to enable better spatial literacy in understanding how climate change and land use dynamics will influence the future drought risks. In particular, we consider and interpret the current and three unique future scenarios representing optimistic, intermediate, and pessimistic conditions, allowing us to offer a range of possible futures and options to consider with respect to drought management.
The selection of the MaxEnt model for drought susceptibility analysis in this study is justified by its ability to handle complex, non-linear relationships between environmental variables and drought occurrences, making it particularly well suited for this context. MaxEnt has been extensively validated in ecological and environmental studies, demonstrating robust performance in modeling susceptibility and distribution under uncertain conditions [45]. Compared to other machine learning approaches like random forest or support vector machines, MaxEnt requires only presence data, which is advantageous when absence data are unavailable or unreliable. Additionally, its feature regularization techniques minimize overfitting, ensuring reliable predictions even with diverse and interrelated drought-controlling factors [45,46]. Despite its established utility and success in studies of drought [47,48,49] and other natural hazards, such as landslides and floods, and multi-hazard susceptibility analysis [50,51,52,53], its application under diverse future climate and land use change scenarios remains underexplored. By integrating a comprehensive range of drought-controlling factors and employing the Standardized Drought Condition Index (SDCI) as a reliable proxy for agrometeorological drought, our study demonstrates this model’s ability to achieve high predictive accuracy [46]. This methodological approach underscores the model’s potential to advance drought management strategies in vulnerable regions. In addition, the use of the most recent CMIP6 climate projections in our study should also be noted. The CMIP6 projections represent a major enhancement over previous climate projections with respect to both the spatial resolution and complex Earth system processes [29]. Coupling projections with land use change helps to incorporate a more systemic approach to the future drought risk and avoids problems with static land use assumptions, as frequently used in past studies [54]. This transition from relying solely on climate change projections to integrating both climate and land use changes is essential in improving drought management and policy planning [55]. Our study provides actionable outputs that can be directly applied by decision makers in Golestan Province. By identifying the areas that are most susceptible to drought under varying future conditions, the findings offer a basis for targeted intervention. For instance, regions projected to experience severe drought could benefit from the immediate implementation of water-saving irrigation practices, the selection of drought-resistant crops, or support for reforestation initiatives. These actions are not merely suggested but are supported by a clear understanding of future vulnerabilities, allowing local governments to prioritize and allocate resources effectively [56]. Additionally, the scenario-based approach adopted in our study enables policymakers to test and refine different strategies, ensuring that resource allocation aligns with the most likely future conditions, thereby minimizing uncertainties in long-term planning [57].
In light of the above, the current study seeks to offer an integrated assessment of the future drought risks in Golestan Province, considering climate projections and associated land use changes, using sophisticated modeling techniques. Furthermore, the aim is to fill gaps in existing studies and offer actionable science to inform management and policy, in order to facilitate the development of more resilient and sustainable approaches to the management of drought in Iran and potentially in other similarly arid or semi-arid regions with comparable climatic and land use conditions, such as parts of Central Asia, the Middle East, and North Africa.

2. Materials and Methods
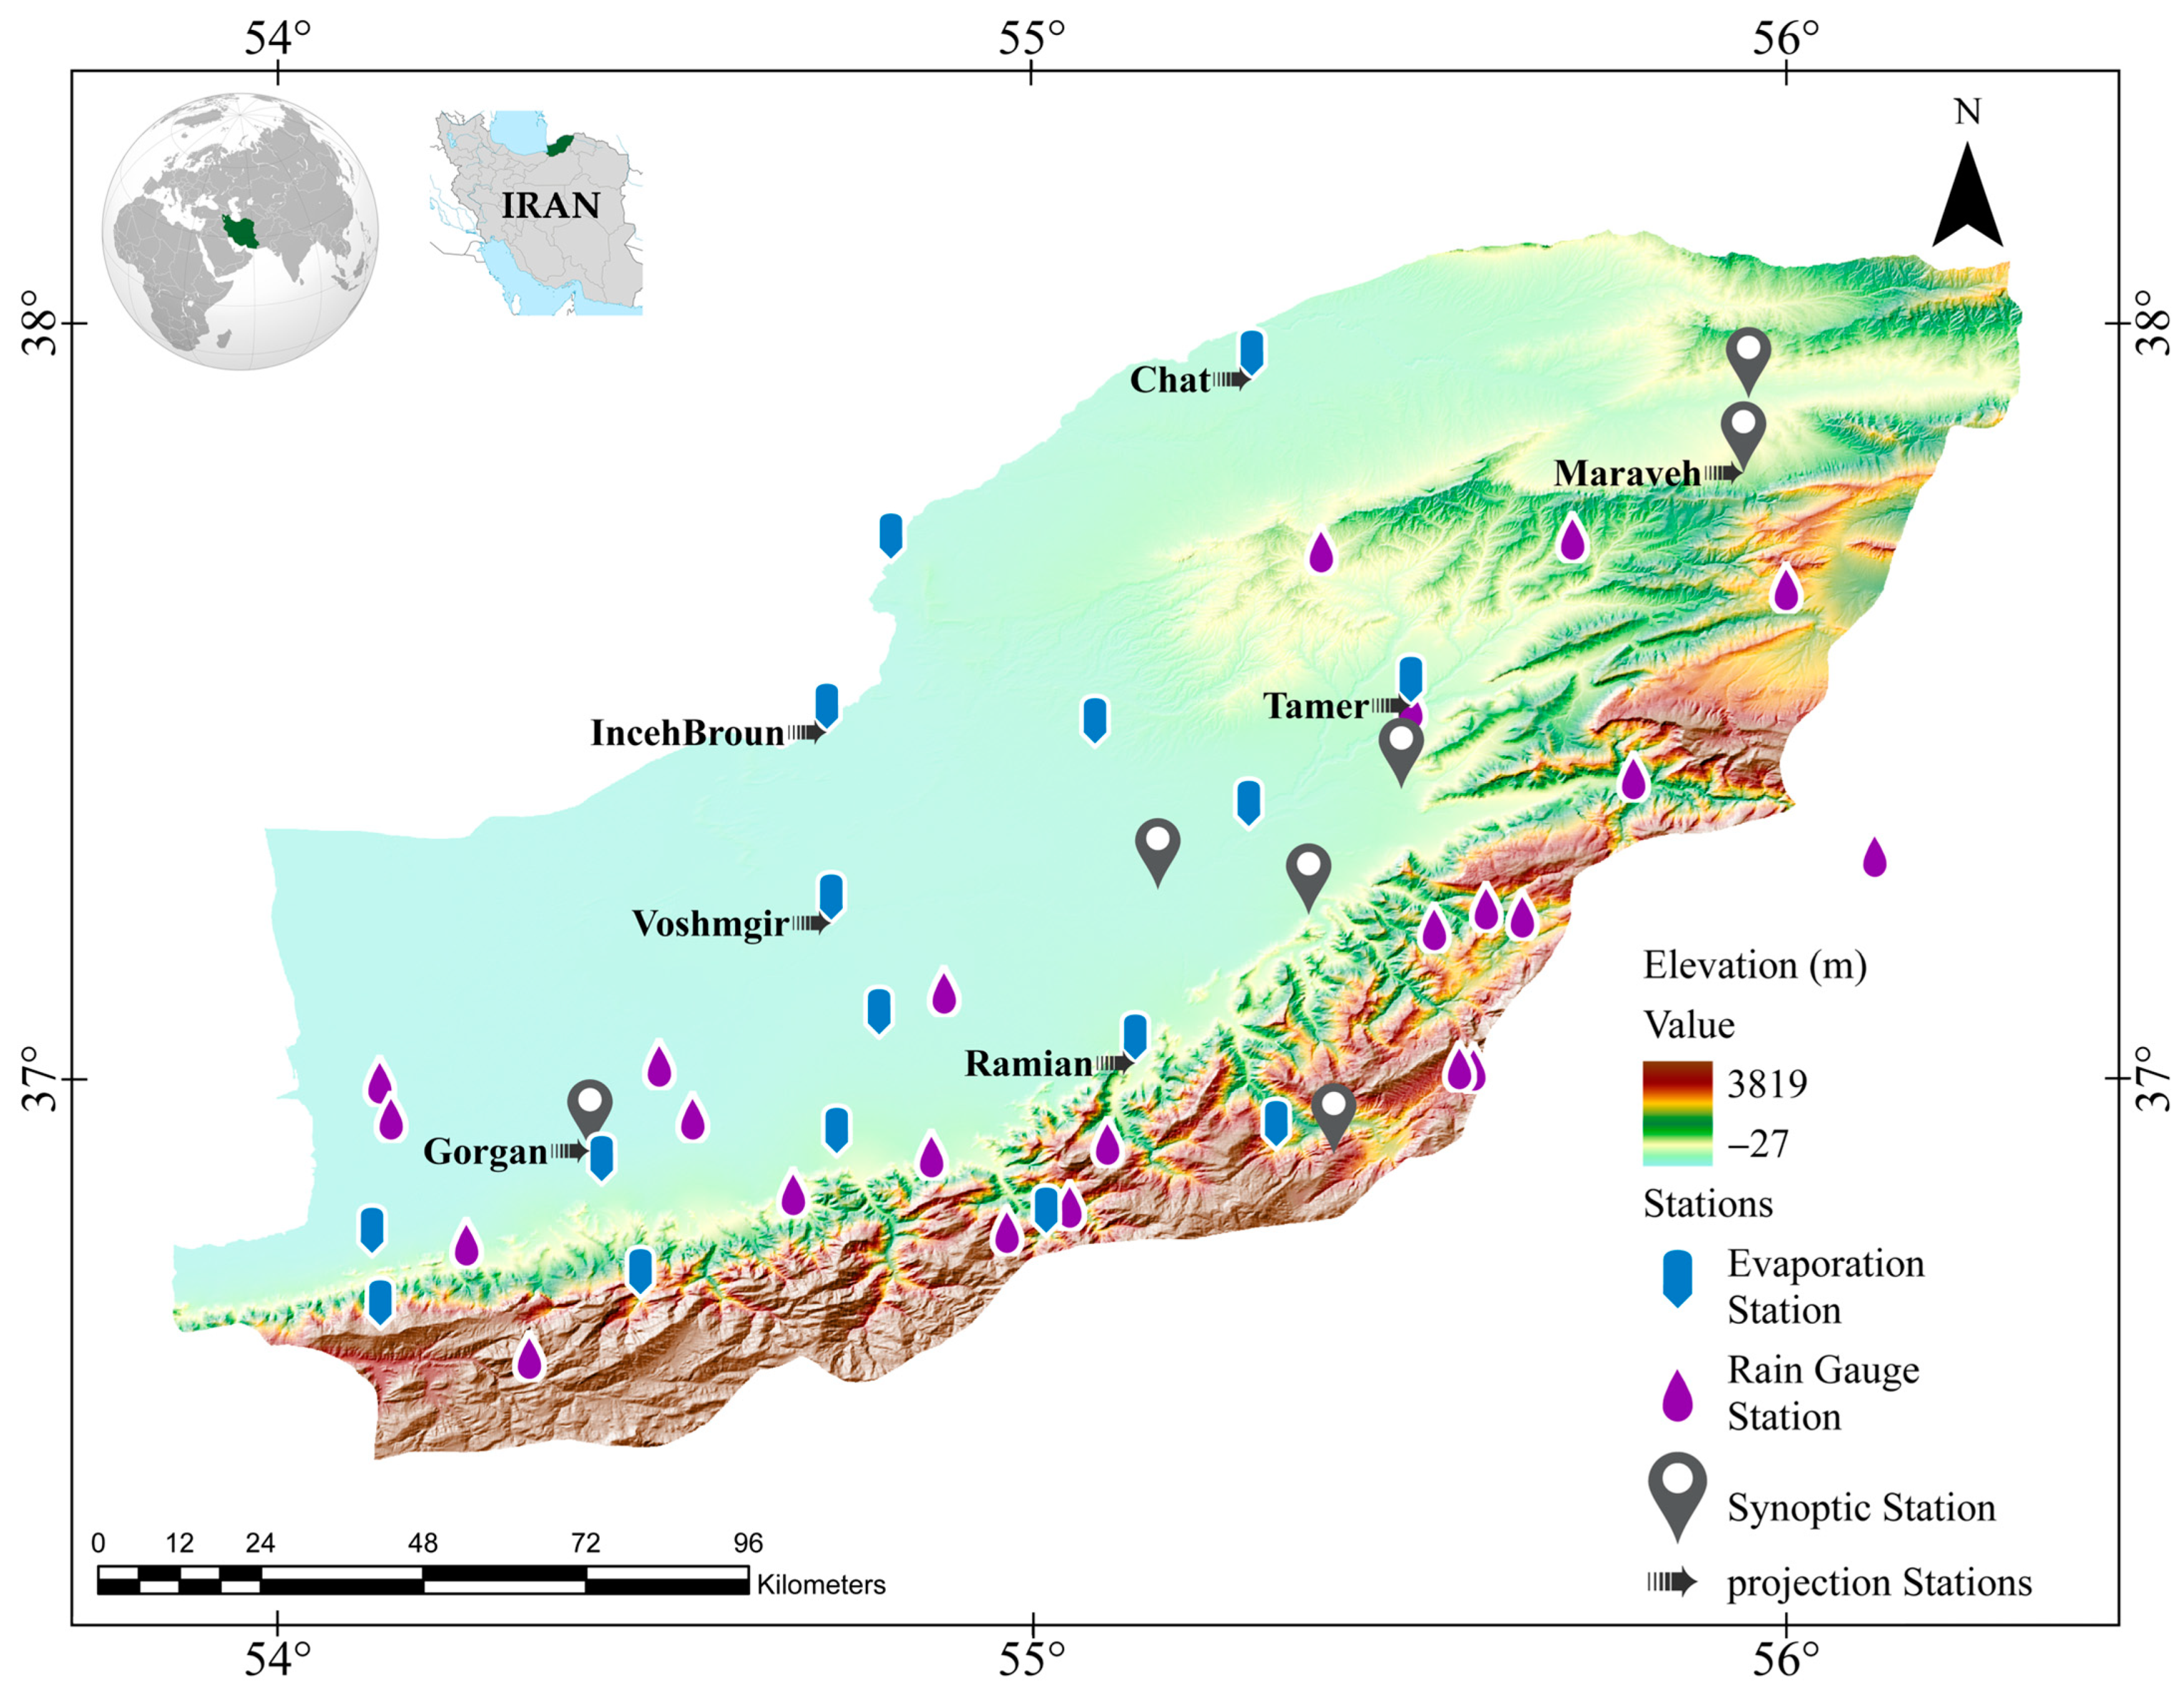
The methodological framework adopted in this research is depicted in Figure 1 and discussed further below.

2.1. Study Area

Golestan Province, Northeastern Iran, spans 20,367 km2. Geographically, its landscape exhibits a variety of topographical attributes, including the coast along the Caspian Sea in the north, plains in the middle, and the Alborz Mountains in the southern part (Figure 2). Due to the contrasting geographical features, the elevation varies significantly throughout the province, with elevation of −27 m a.s.l on the northern coastal areas and over 3000 m in the southern mountainous areas. Since the elevation range is considerable, the climatic conditions are also diverse, ranging from humid subtropical in the coastal and plain regions to temperate and semi-arid in the mountainous regions. Golestan Province receives average annual precipitation of approximately 550 mm, where the northern plains have a total annual precipitation amount of less than 200 mm, while the southern and central areas, especially the highlands, receive up to 1000 mm of total annual rainfall. Golestan experiences cold winters (−10 °C) and hot summers (>35 °C). These extreme climate conditions make the region highly prone to both drought and flooding, as two extremes with recognized impacts on water resource availability [58].
LULC changes across Golestan Province have been observed in the last few decades as a result of the increased population, agricultural expansion, and urbanization. The major land use types in Golestan Province include agricultural land (35%), forests (20%), rangeland (30%), and urban areas (15%). Agriculture, concentrated in fertile plains, plays a critical role in the local economy, with key crops including wheat, barley, rice, and cotton, alongside fruits, vegetables, and livestock production. However, deforestation, land degradation, and urbanization have heightened the region’s susceptibility to drought and water stress [59]. The reliance on agriculture makes the province highly vulnerable to drought, leading to economic losses, food shortages, and socioeconomic instability. Recent droughts have strained agriculture, the water supply, and livelihoods, fueling resource conflicts [8].
The province has developed irrigation canals, reservoirs, and water transfer systems to sustain agriculture. However, these infrastructures are under growing pressure due to population growth, climate change, and the over-extraction of water resources. Inadequate water resource management and limited drought response practices further exacerbate these vulnerabilities. The severe droughts in 1999–2001 and 2007–2009 caused considerable economic damage, highlighting the need for effective drought management and adaptation strategies [7]. The population is unevenly distributed, with a higher density in the northern and central parts, where agricultural activities are concentrated and the drought impacts are the most severe due to reduced agricultural outputs and water stress.

2.2. Data Sources

The data utilized in this study were sourced from various platforms and used to evaluate the drought susceptibility in Golestan Province under both the current and future conditions. Remote sensing indices, derived from Landsat 9, offered essential insights into the vegetation health, soil moisture, and environmental stress. A land use map for the study area’s current state was also created using Landsat 9 data. These tools were supplemented with ground-based data, such as the temperature, precipitation, and other meteorological variables from local measurement stations. To develop the agrometeorological evidence layer, this study combined the Vegetation Condition Index (VCI) and Temperature Condition Index (TCI), resulting in the Standardized Drought Condition Index (SDCI). The SDCI evidence layer, alongside the remote sensing indices and ground-based climatic data, was used to generate the drought susceptibility map for the present conditions. Additionally, future land use and climate projections were derived using the LARS-WG8 tool, which provided high-resolution climate data for the years 2030 to 2050 under various emission scenarios. Collectively, these datasets enabled the assessment and prediction of the drought susceptibility under changing climate and land use scenarios for the future.

2.2.1. Drought-Controlling Factors

In order to evaluate the susceptibility to agrometeorological drought in Golestan Province, we exploited 14 drought-controlling predictors, which included remote sensing indices and climate data derived from ground measurements. The selected indices were chosen due to their sensitivity to the root causes of drought, ensuring that we captured different climatic and environmental dimensions of drought. In particular, they were chosen based on their demonstrated ability to capture the key dimensions of drought—vegetation health, soil moisture, and climatic stressors. Remote sensing indices, such as the Green Normalized Difference Vegetation Index (GNDVI) and Soil Moisture Stress Index (SIWSI), are particularly effective in assessing vegetation health and water stress over large spatial scales. Ground-based data, including the temperature and precipitation, provide localized, high-resolution climatic inputs that are critical for drought modeling. Together, these predictors ensured the comprehensive representation of the complex interactions driving drought conditions. Relevant studies (e.g., [60,61,62,63]) demonstrate that combining these factors enhances the reliability and accuracy of drought susceptibility models. These factors were used to produce the current (2022) and future drought susceptibility models (2030–2050) using the MaxEnt method. The year 2022 was selected to reflect the current conditions, being the year that a drought strongly impacted the province, while the two following years (2023 and 2024) were characterized as wet years.

Remote Sensing Indices

Remote sensing indices were derived from Landsat 9 Level-2 imagery from 21 January 2022 to 1 January 2023, considering only scenes with less than 5% cloud cover. The data provider (USGS) had already applied atmospheric, radiometric, and geometric corrections, including orthorectification. Additional preprocessing steps were performed to prepare the data for analysis. Specifically, pixel values were normalized to a range of 0 to 1 by dividing them by 10,000, and a cloud and cloud shadow masking process was implemented to improve the dataset’s quality and accuracy. The study area was covered by three paths (161, 162, and 163) and three rows (33, 34, and 35), resulting in 74 extracted scenes. These scenes were then incorporated to generate both a land use map and corresponding vegetation indices. Remote sensing allows for continuous, large-scale landscape monitoring and provides high-resolution data for the detection of drought at large scales. Remote sensing indices provide key information about vegetation health, soil moisture, and environmental stress (Table 1).

Land Use

In this study, we employed Landsat 9 satellite imagery and a supervised classification approach to produce a land cover map. To achieve this, Landsat 9 images were first preprocessed by applying temporal filters for each season of 2022, capturing the relevant data for spring, summer, fall, and winter. These temporal filters allowed us to select seasonal data for each period, ensuring that the images were relevant for seasonal land cover changes. Subsequently, various vegetation indices, including the Normalized Difference Vegetation Index (NDVI) and Enhanced Vegetation Index (EVI), were calculated for each image using the appropriate bands of Landsat 9, such as the NIR, RED, and BLUE bands, to provide insights into the vegetation health and land cover dynamics over time. The seasonal indices were subsequently integrated into the dataset and utilized as input features for a supervised random forest classifier, a method that has demonstrated strong efficacy for LULC classification [74,75,76]. This classifier was trained on labeled ground truth samples that were randomly split into training and testing datasets. By applying the random forest algorithm, we were able to classify the land cover types in the study area based on the spectral information from the Landsat 9 imagery and the derived vegetation indices. In addition to the optical data, we also incorporated other relevant features, such as terrain data, including the elevation and slope, obtained from a digital elevation model (DEM), to enhance the classification results. The digital elevation data used in this study were sourced from the NASADEM dataset, available on the Google Earth Engine platform. NASADEM represents a reprocessed version of the Shuttle Radar Topography Mission (SRTM) data, offering enhanced accuracy by integrating auxiliary datasets, including ASTER GDEM, ICESat GLAS, and PRISM. This dataset provided crucial topographic information, such as the elevation and slope, which were derived and incorporated into the analysis to improve the accuracy of the classification and land use mapping processes.
In this work, all reference samples were split into training and testing sets (70% for training, 30% for validation) based on a randomly assigned column in the Google Earth Engine (GEE) environment. A total of 3226 reference samples were used, with 30% allocated for testing and 70% for training. The random forest classifier was then trained on the training subset to generate spectral signatures for each land cover class. Next, the trained model was validated on the remaining test set, allowing the calculation of error metrics through a confusion matrix. This matrix yielded the overall accuracy and the Kappa coefficient. This approach enabled a reliable and scalable classification performance assessment by relying on GEE’s robust data handling and efficient parallel processing capabilities.

Ground-Based Data

In addition to the remote sensing indices, we utilized ground-based datasets including the minimum temperature (Tmin), maximum temperature (Tmax), and precipitation, which were based on data from synoptic, rainfall, and evaporation stations across Golestan Province, to provide important climatic variables for a more thorough examination of drought in the area. Ground-based data were acquired from the Regional Water Company of Golestan.

2.2.2. Evidence Layer

The Standardized Drought Condition Index (SDCI) was adopted to extract 500 drought occurrence points, which served as the evidence layer for MaxEnt modeling. The SDCI integrates remote sensing and ground data to capture spatial drought patterns. Notably, the SDCI index effectively represents meteorological and agricultural drought conditions in the region when exploring the impacts of drought. The SDCI integrates three vegetation and meteorological indices, listed in Table 2. These drought occurrence points represent historical drought events in the region and serve as a critical dataset for drought susceptibility mapping.

2.2.3. Future Land Use and Climate Data

In our endeavor to project drought conditions for the timeline spanning from 2030 to 2050, we harnessed land use and climate change projections, explained as follows.
  • Land Use Projection: In this study, we utilized Land Change Modeler (LCM) to project future land use changes, employing both the cellular automata–Markov chain model and machine learning techniques for more accurate predictions. Land Change Modeler is a robust tool for the analysis of historical land use patterns and projection of future changes, which are essential in understanding how land use evolves over time. To create the input maps for this projection, we used Landsat satellite imagery from the years 2000 and 2022. These images were first preprocessed and classified into different land use categories using the random forest classification model. This machine learning model, known for its accuracy and efficiency, was trained on labeled data, allowing us to classify the satellite imagery into relevant categories, such as urban areas, agricultural land, forests, and water bodies. Once the land use maps for the years 2000 and 2022 were generated, we applied the Markov chain model to simulate transitions between different land use types over time. This model helps to quantify the likelihood of one land use category changing into another based on observed historical trends. Using these tools, we projected land use maps for the period between 2030 and 2050.
  • Climate Data: Data from the CMIP6 report were used under three shared socioeconomic pathways (SSPs).
    • SSP1-2.6: Low emissions, representing a future with stringent climate mitigation;
    • SSP2-4.5: Moderate emissions, being the middle path; and
    • SSP5-8.5: High emissions, for rapid warming and extreme climate impacts [11].
The Long Ashton Research Station Weather Generator (LARS-WG8), as the most recent downscaling tool, was used to downscale the future climate change data at the station level. In this study, an ensemble model was constructed using an Raisanen approach, drawing on outputs from five models participating in the Coupled Model Intercomparison Project Phase 6 (CMIP6) [81,82] (Table 3). Daily minimum temperature (Tmin), maximum temperature (Tmax), and precipitation data were collected from seven well-distributed synoptic and evaporation stations across the Golestan Province, each having 30 years of consistent data from 1985 to 2015, and were input into LARS-WG8. The Tmin, Tmax, and precipitation projection data will serve as critical inputs for future drought susceptibility modeling.

2.3. Data Analysis and Processing

2.3.1. Current Conditions (2022)

For the current drought susceptibility analysis, we used the maximum entropy (MaxEnt) model. The 14 controlling factors, together with the 500 drought evidence points, were employed to train and validate the model, ensuring that it accurately reflected the current agrometeorological drought patterns in Golestan Province. MaxEnt uses a probability distribution to predict areas most susceptible to drought, with the evidence points serving as the foundation for model calibration. By running the model under the current climatic conditions (2022), we were able to generate a baseline map of the drought susceptibility for the region.

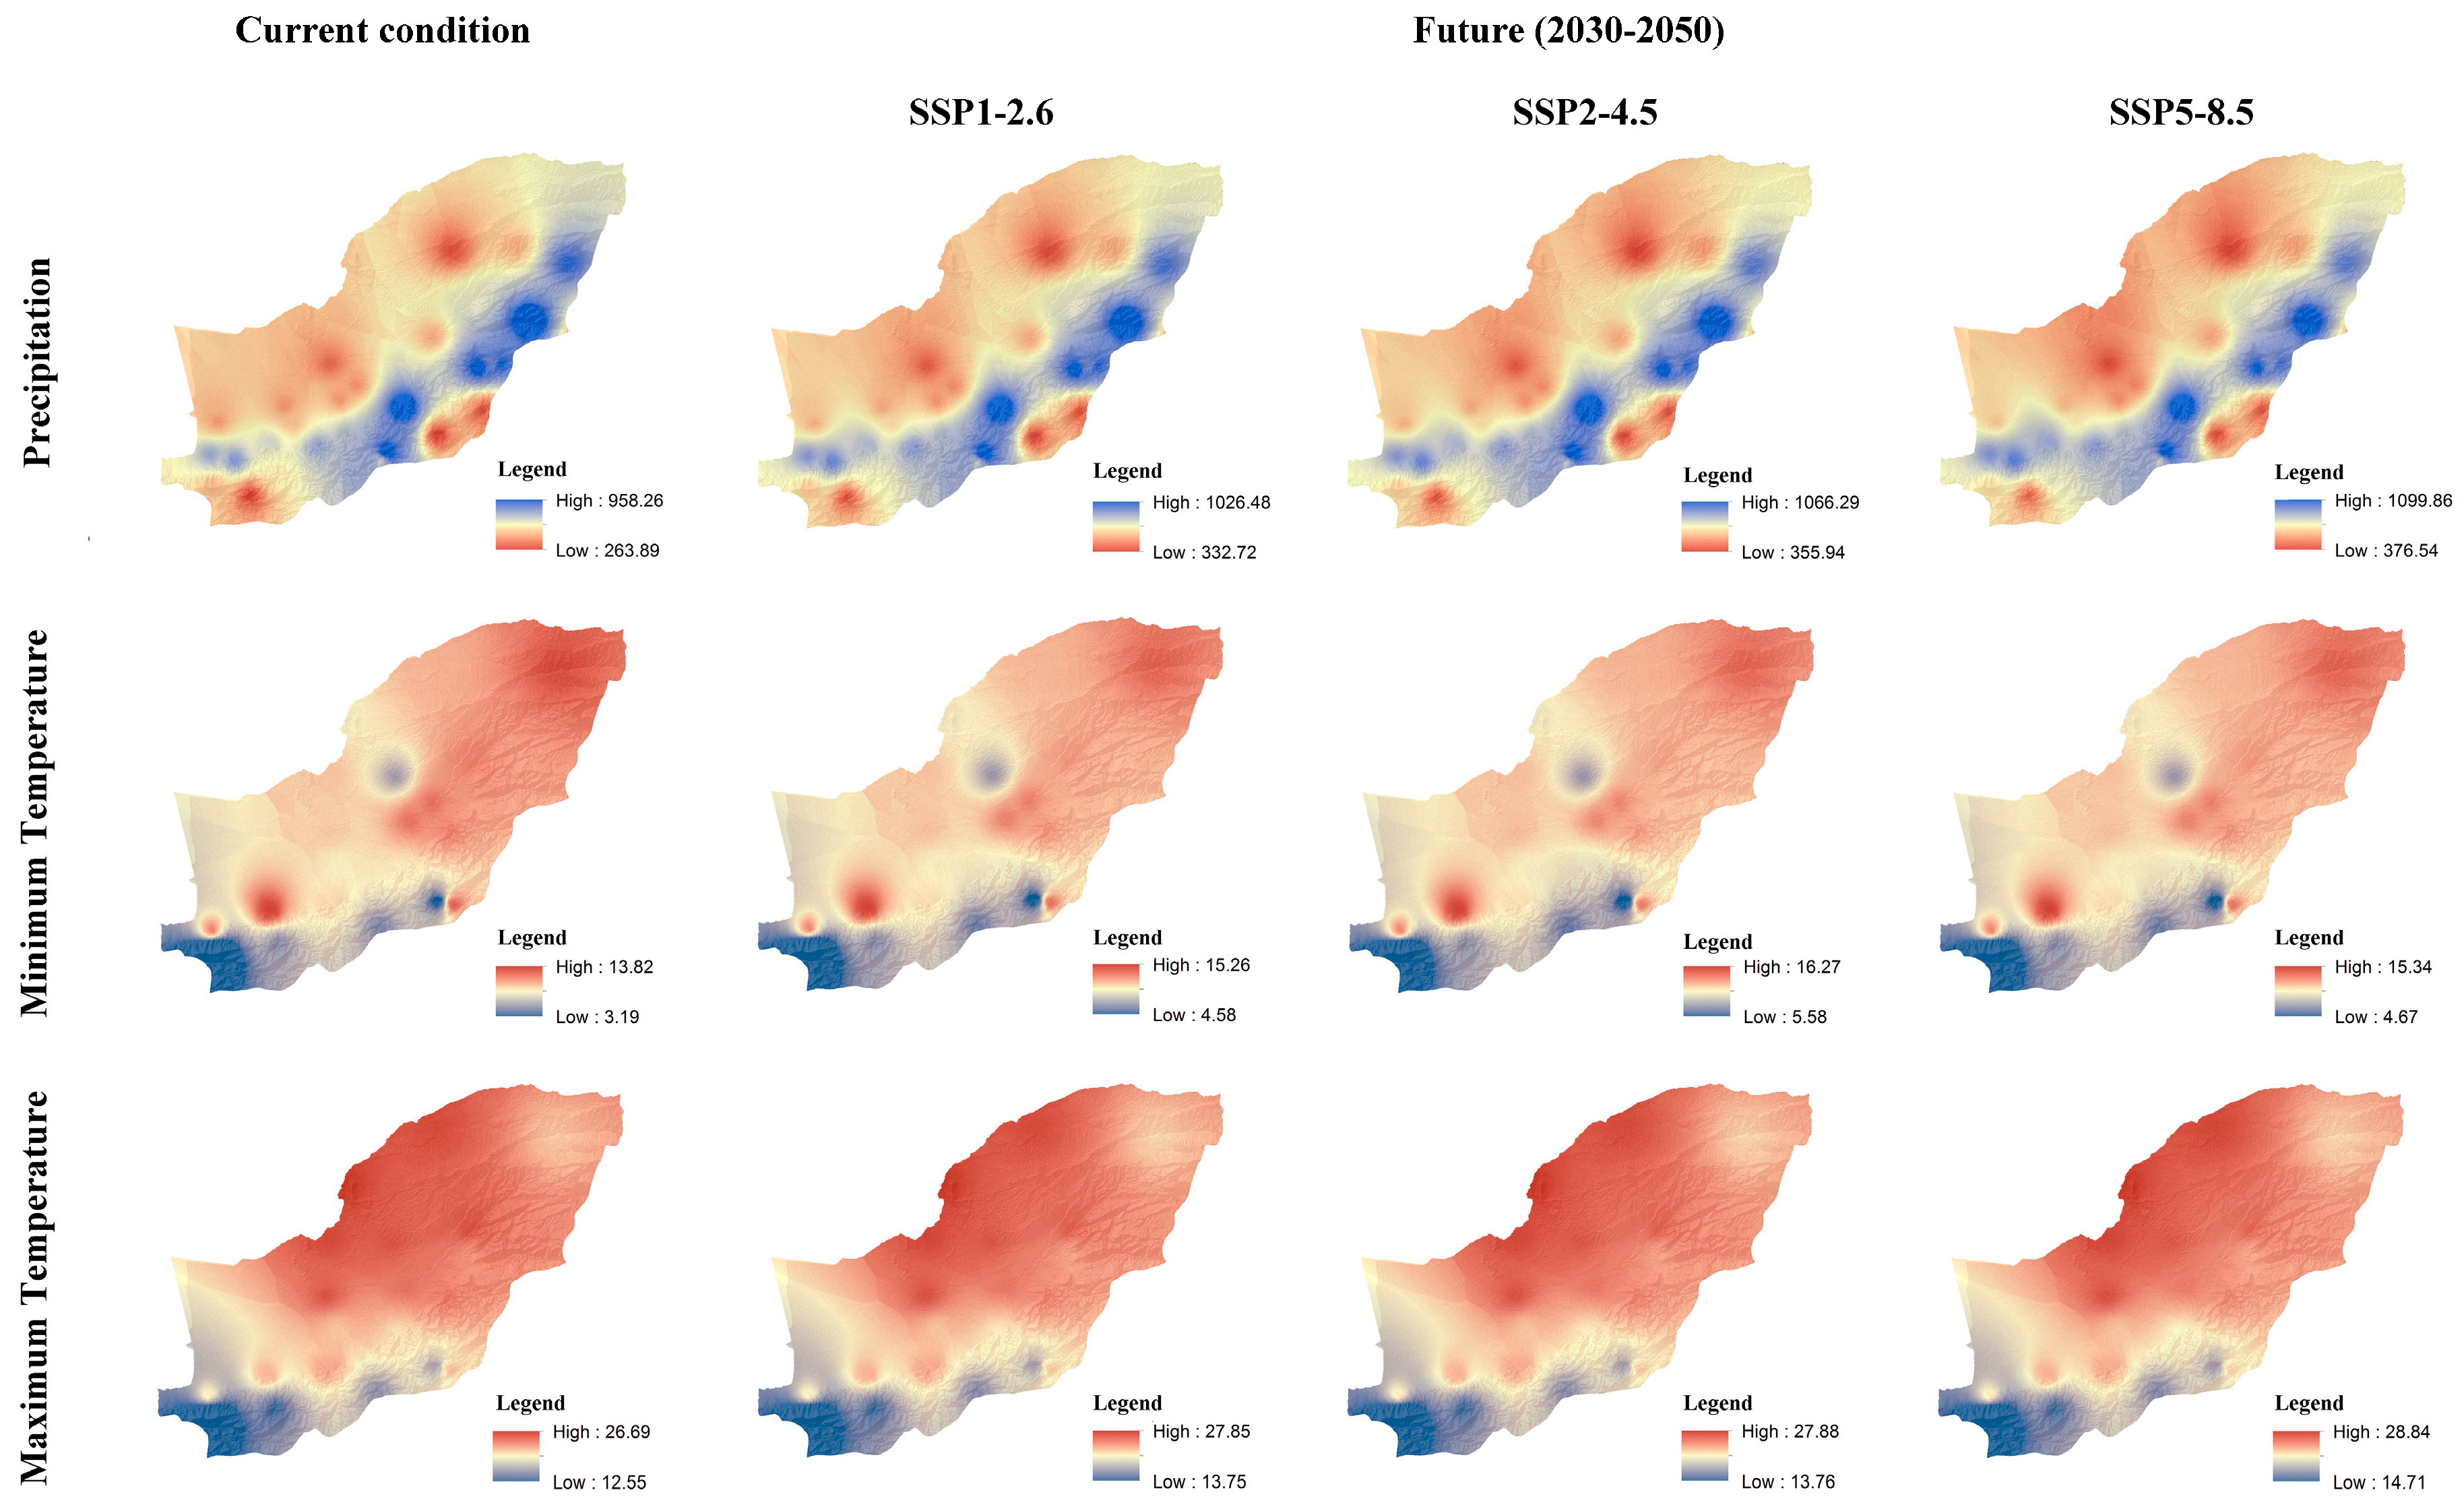
2.3.2. Future Scenarios (2030–2050)

Using the MaxEnt model, we projected the drought susceptibility under four scenarios: the current conditions (2022 data as baseline) and three future climate pathways—SSP1-2.6 (optimistic), SSP2-4.5 (moderate), and SSP5-8.5 (severe). Each future scenario incorporated 2030–2050 climate data and projected land use changes, while other thematic layers, like the vegetation indices, remained constant. These scenarios illustrated potential climate-driven shifts in the drought risk.

2.3.3. Drought Susceptibility Modeling Using Maximum Entropy

The MaxEnt model, a machine learning algorithm for presence-only data, is widely used in environmental studies to predict areas susceptible to specific conditions, such as drought. It maximizes the entropy to estimate the least-biased probability distribution that meets environmental constraints, utilizing factors like the temperature, precipitation, and land use [88,89]. MaxEnt compares environmental conditions at known presence locations (e.g., drought-affected areas) with the entire study area to calculate susceptibility probabilities [89,90]. Rooted in information theory, the model assumes minimal bias by selecting distributions with the maximum entropy, ensuring that the predictions align with the provided data while avoiding unsupported assumptions [91]. For this study, MaxEnt processed 500 SDCI points alongside environmental variables to produce probabilistic maps of the drought susceptibility under the current and future climate scenarios, offering critical insights into Golestan Province’s drought risk [46,89,92].

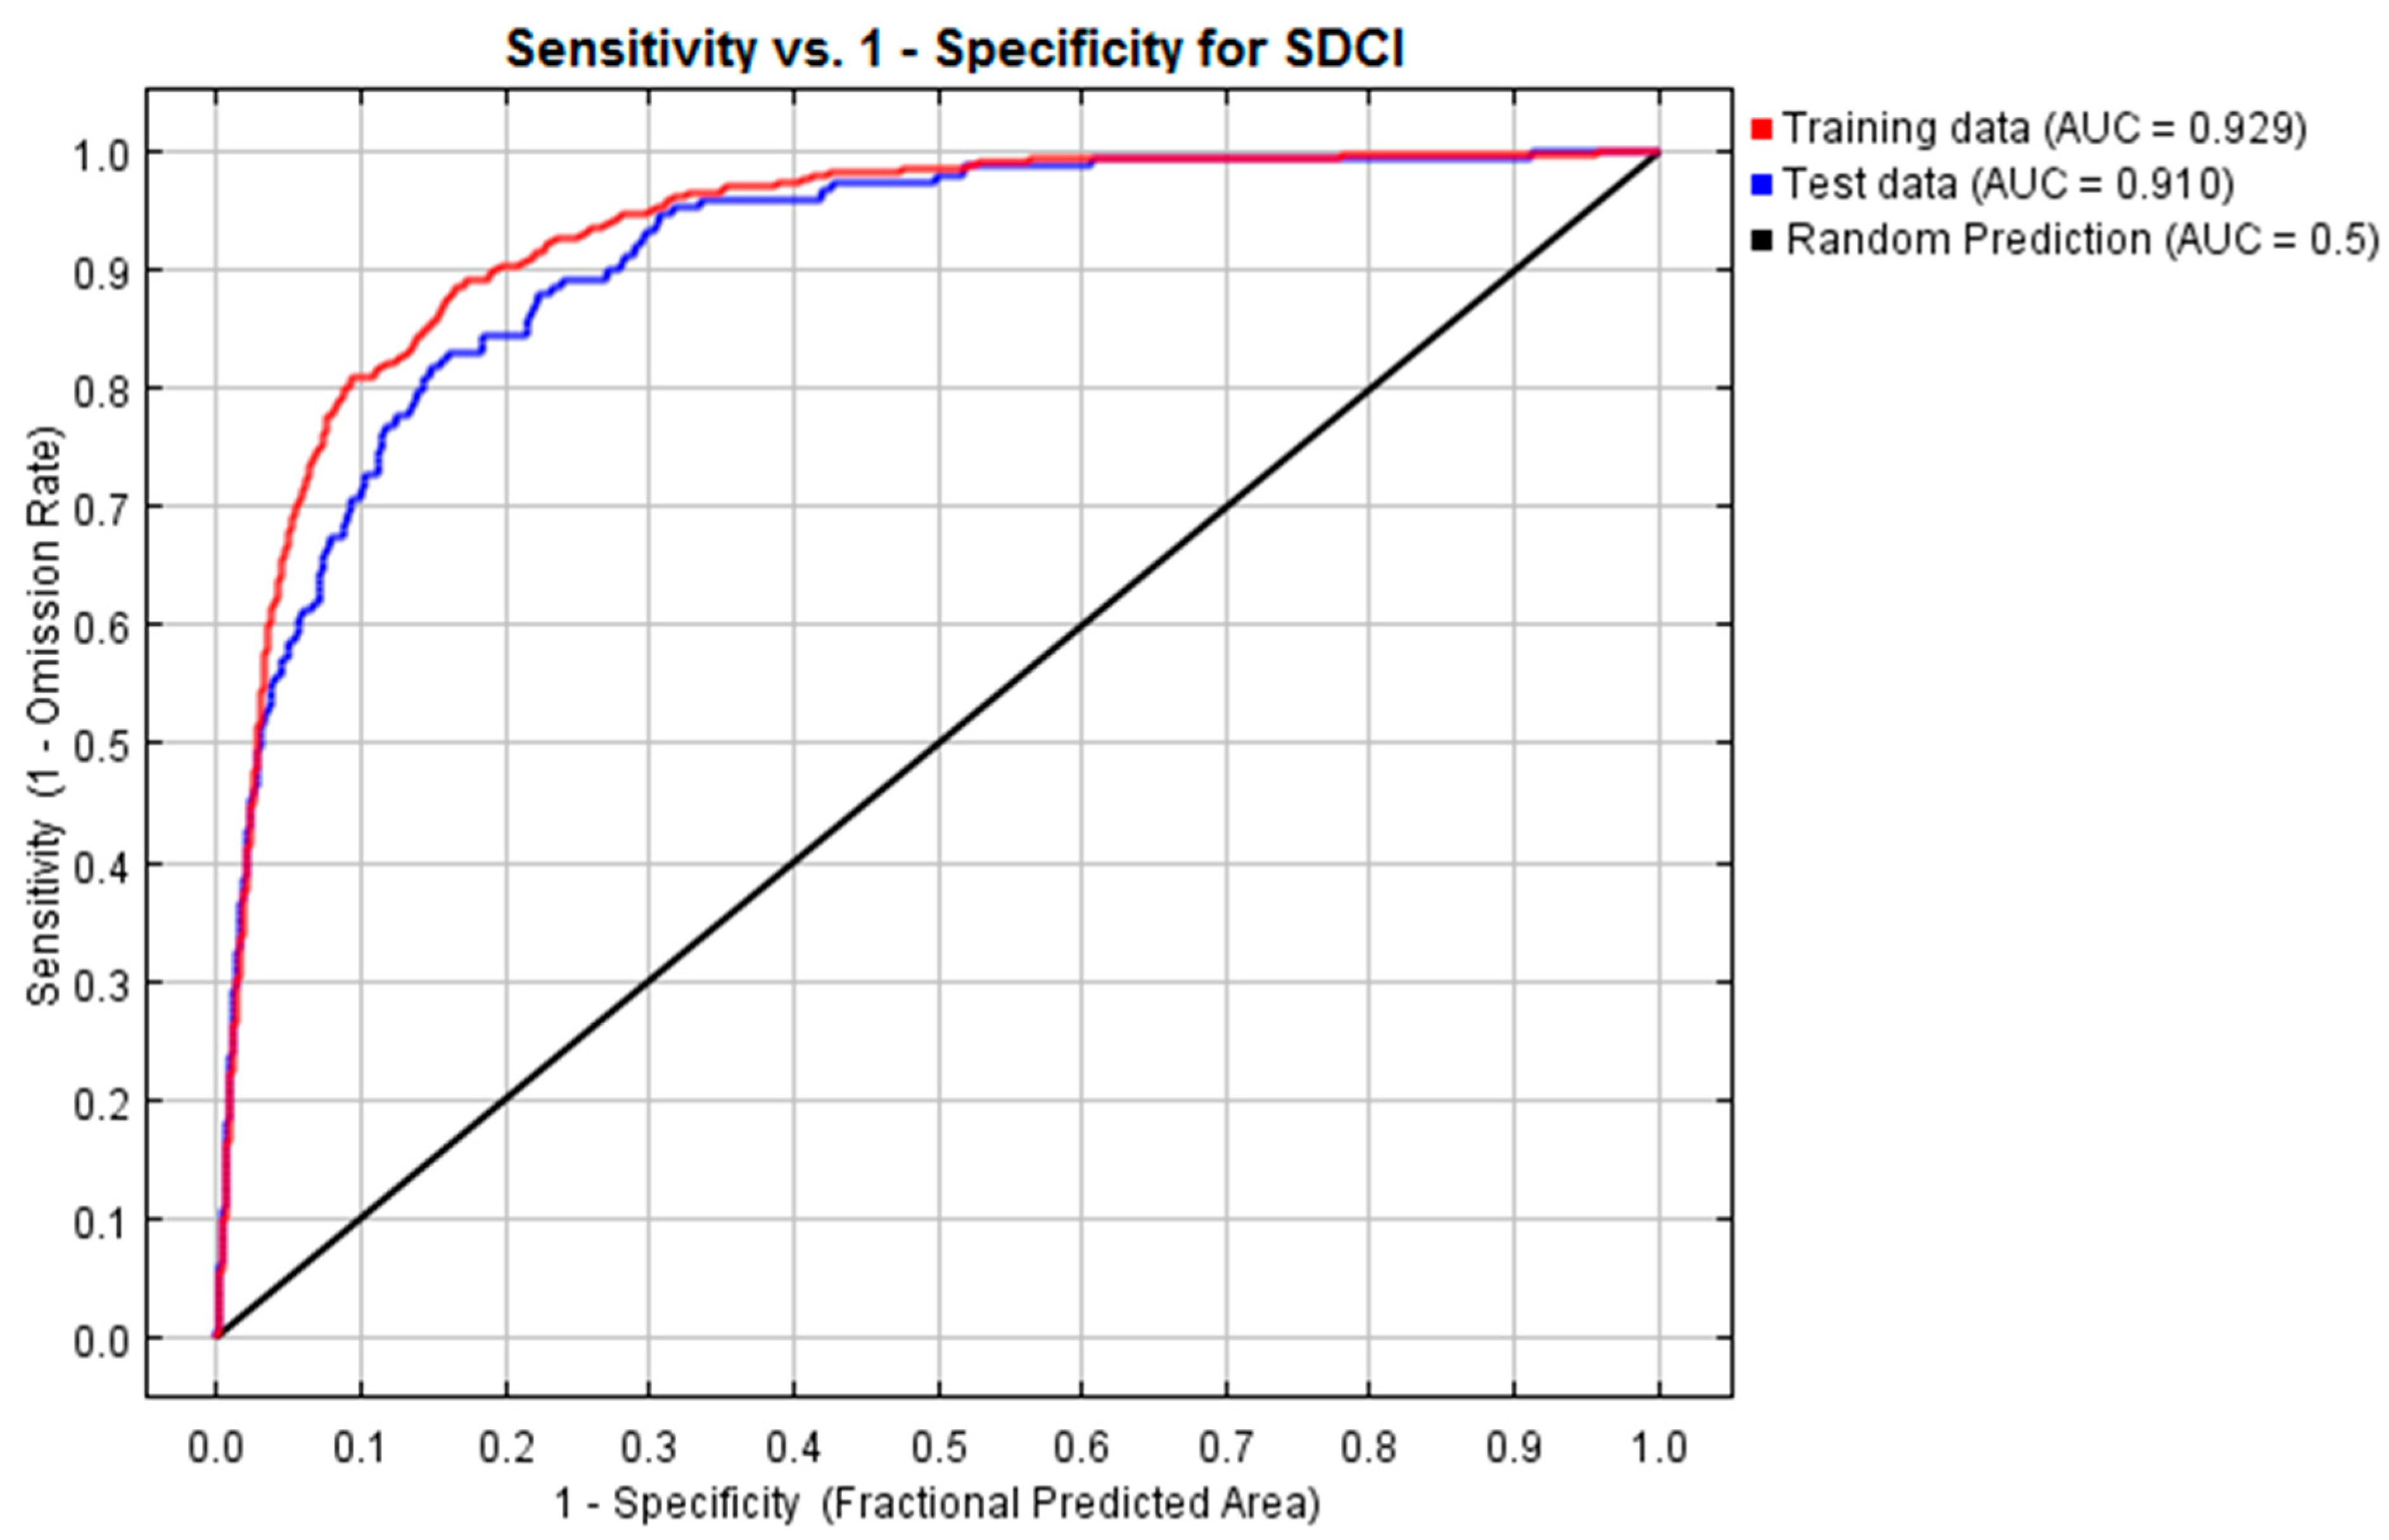
2.3.4. Model Validation and Performance Metrics

To assess the MaxEnt model’s performance, we calculated the area under the curve (AUC) metric of the ROC curve. The ROC plots the false positive rate (FPR) on the x-axis and the true positive rate (TPR) on the y-axis. The AUC of the ROC curve indicates the accuracy of the model’s prediction. The ROC values can be categorized into four descriptive accuracy classes: (1) 0.6–0.7, indicating poor accuracy; (2) 0.7–0.8, indicating fair accuracy; (3) 0.8–0.9, indicating good accuracy; and (4) 0.9–1.0, indicating excellent accuracy. Therefore, AUC values closer to 1 will indicate higher model accuracy in predicting the drought susceptibility [93,94,95].

3. Results

3.1. Monthly Climate Change Data

Figure 3 displays the monthly projected climate change data for the precipitation and maximum and minimum temperatures for two stations. These projections include changes under SSP2-4.5 and SSP5-8.5 over the historical baseline.
The temperatures rise across all scenarios, with notable increases in the minimum and maximum values. Under SSP5-8.5, the most pessimistic scenario, the minimum temperature increases range from +1.07 °C (Maraveh in June) to +3.44 °C (Inceh Borun in March). The maximum temperature increases under SSP5-8.5 are also substantial, with values reaching +3.38 °C (Inceh Borun in April), +3.15 °C (Gorgan in April), and +2.95 °C (Maraveh in November). In the optimistic scenario, SSP1-2.6, the minimum temperature increases are more modest, generally ranging from +0.36 °C (Maraveh in July) to +2.25 °C (Chat in December). The maximum temperature under SSP1-2.6 also increases, but the peaks are typically below +2.0 °C, with exceptions like Gorgan in December (+1.90 °C).
The precipitation varies significantly by station, month, and scenario. Under SSP5-8.5, the precipitation increases significantly in some months, such as +57.24 mm in December at Ramian and +54.76 mm in December at Gorgan. Conversely, the same scenario predicts sharp declines in other months, such as −30.52 mm in September at Gorgan and −26.78 mm in September at Ramian. SSP1-2.6 generally results in more stable changes, although some notable variations occur, including a +19.14 mm increase in January at Ramian and a −8.37 mm decrease in October at Inceh Borun. The standard deviation for precipitation changes is considerably higher than for the temperature, indicating greater variability, with values as high as 18.66 mm at Ramian under SSP5-8.5 and 23.22 mm at Gorgan under the same scenario. The temperature’s standard deviations are comparatively lower, often below 0.6 °C, reflecting more consistent trends.
Stations like Gorgan and Ramian show significant susceptibility to extreme precipitation changes, with the maximum values exceeding +50 mm in some months and negative extremes of −23.35 mm or more in others. Tamer and Maraveh, by contrast, show smaller fluctuations in precipitation, with fewer extreme positive or negative values. However, even these stations exhibit clear warming trends across all scenarios, with the minimum temperature increases ranging from +0.36 °C to +2.58 °C and the maximum temperature increases from +0.54 °C to +2.95 °C.

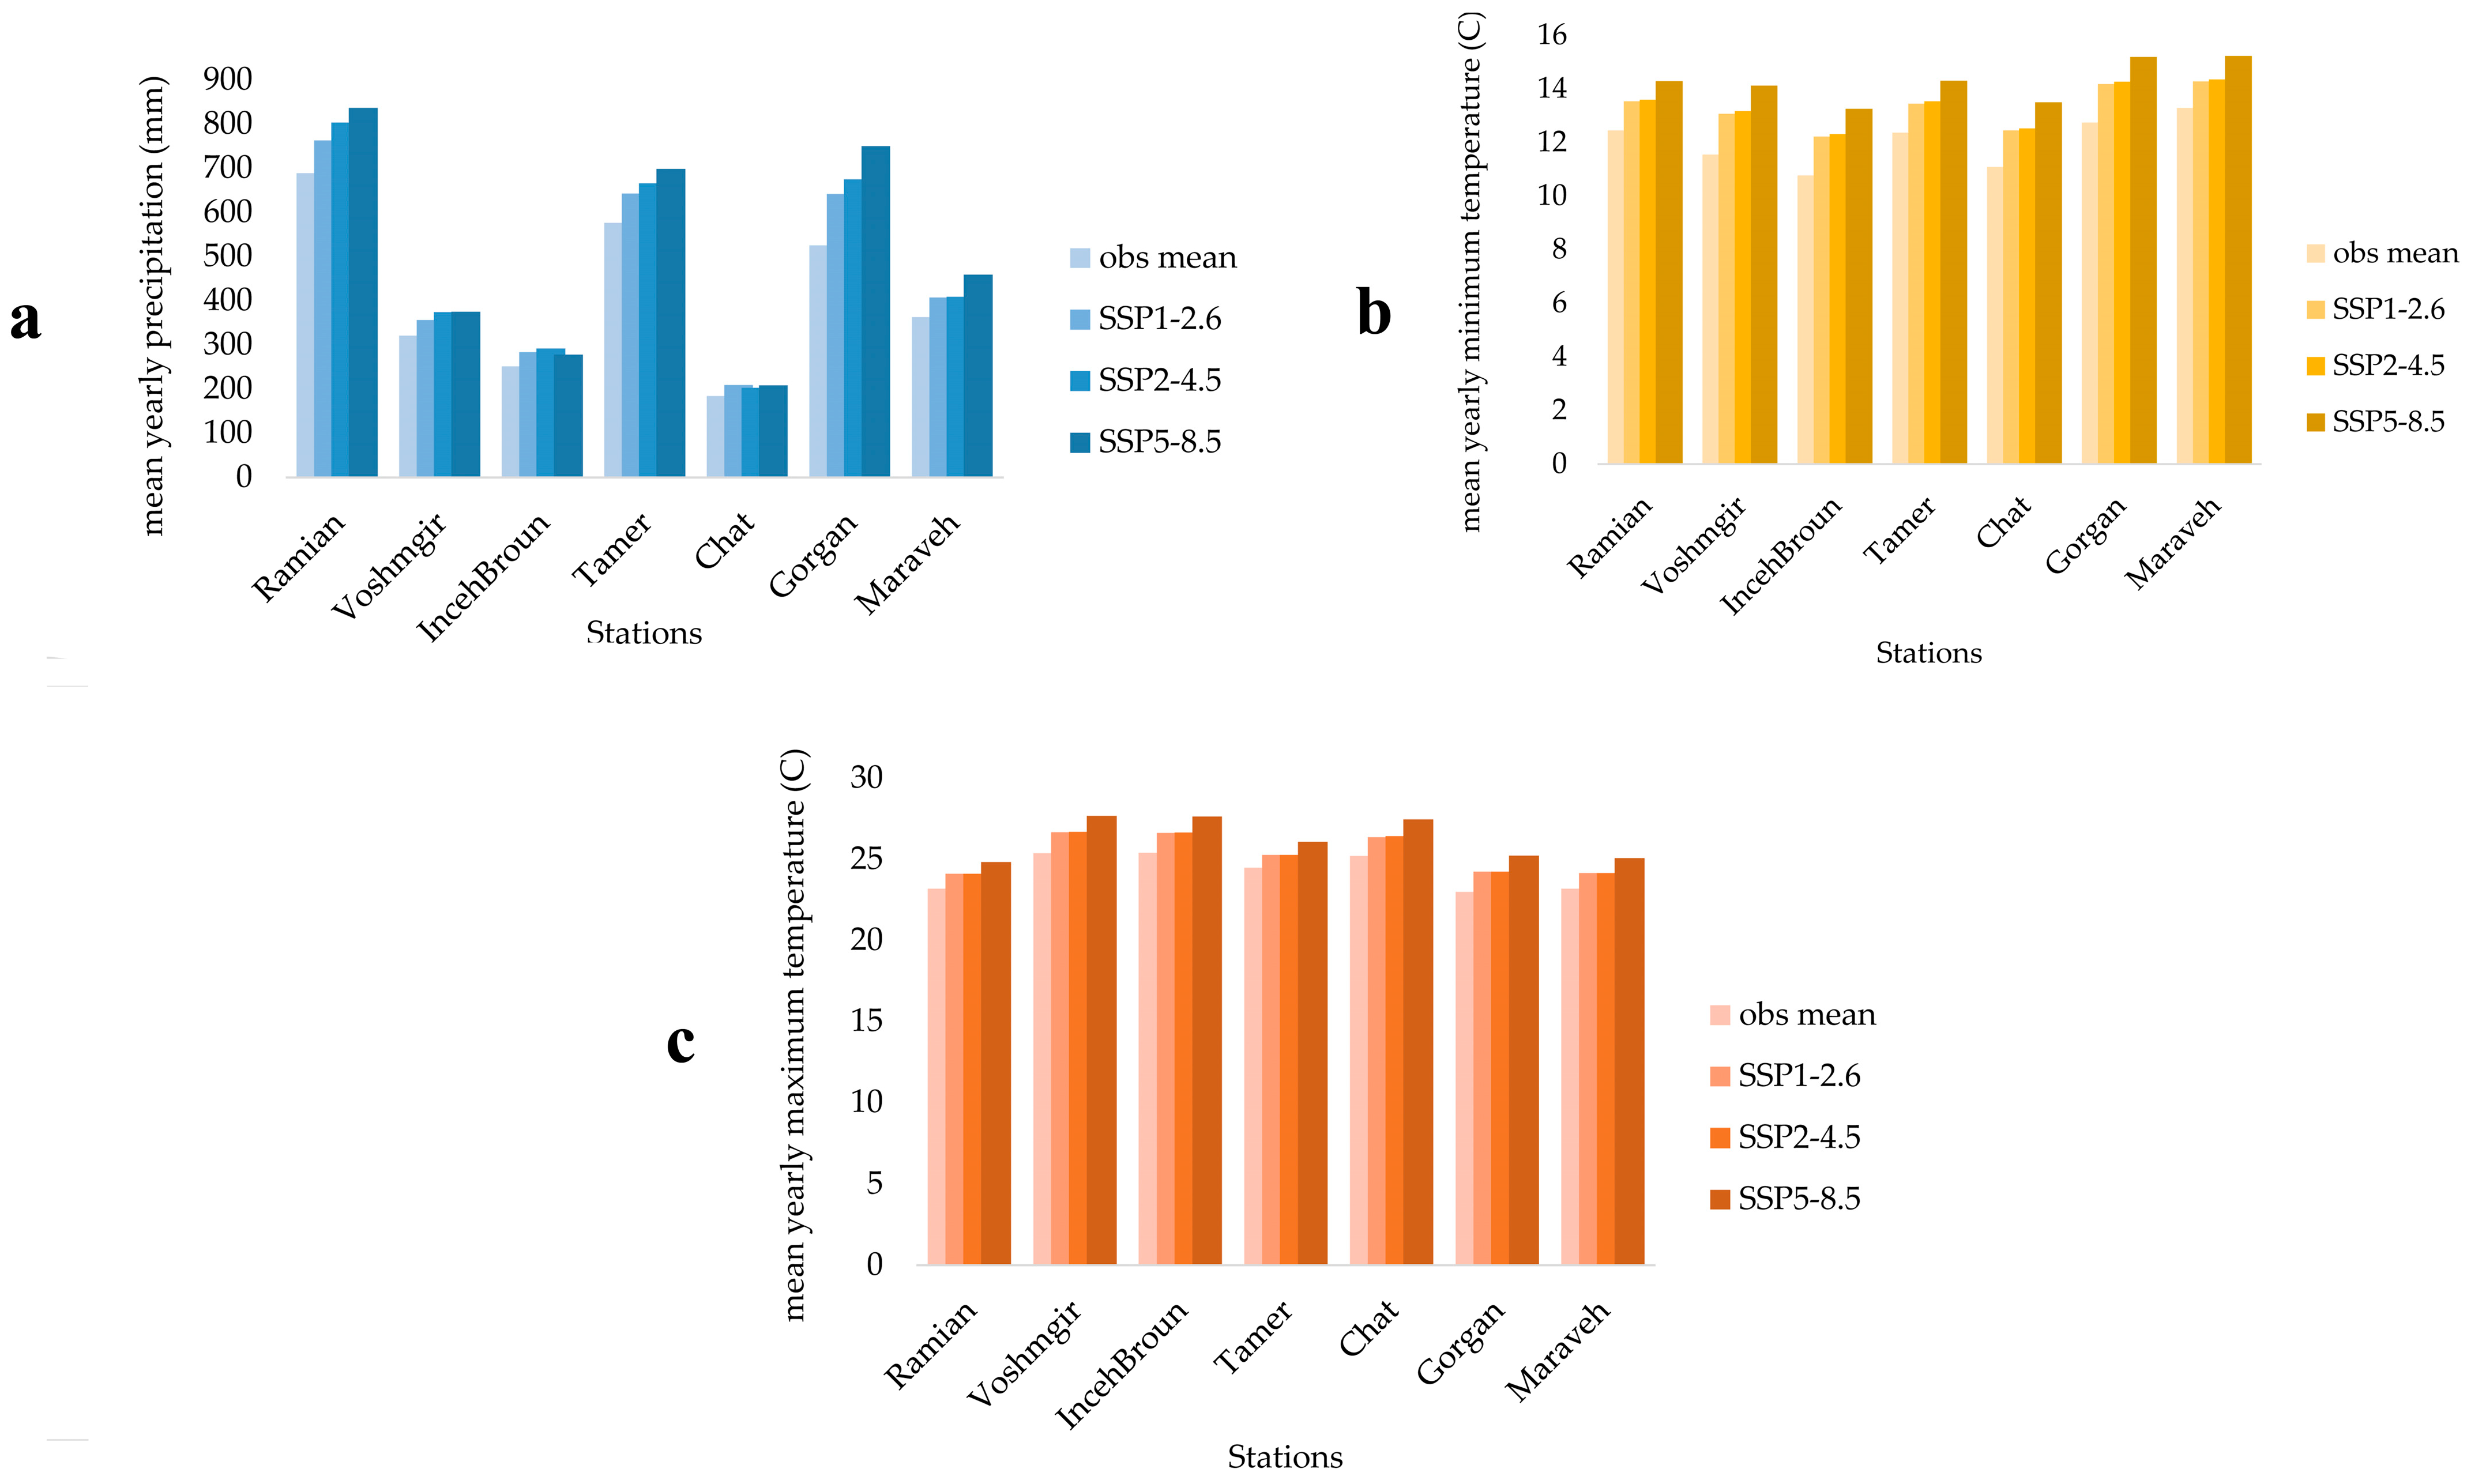
3.2. Annual Climate Change Data

Figure 4 presents the annual projected climate change data for the precipitation and maximum and minimum temperatures across all seven stations used for downscaling. Figure 5 summarizes the percentage changes in the examined variables under the future climate change scenarios compared to the current conditions (observed mean values).
Figure 5 uses a color-coded format to facilitate a graphical spatiotemporal comparison across various stations under different scenarios. As illustrated in Figure 4 and Figure 5, the increases in the mean annual precipitation across all synoptic stations are consistent among climate scenarios SSP1-2.6, SSP2-4.5, and SSP5-8.5. For the Gorgan station, the precipitation under SSP5-8.5 shows the highest increase, rising by 224.20 mm, from 525.56 mm to 749.76 mm. The Ramian station experiences an increase of 147.86 mm under the same scenario, from 688.78 mm to 836.64 mm. In Voshmgir, the precipitation rises from 320.68 mm to 375.03 mm, reflecting an increase of 54.35 mm, while, in Inceh Borun, the precipitation increases by 26.37 mm, from 251.47 mm to 277.84 mm.
All scenarios project a steady rise in the minimum temperatures, with the largest rises being found with SSP5-8.5. For example, in Ramian, the minimum temperature increases by 1.84 °C, from 12.45 °C to 14.29 °C, under SSP5-8.5. Similarly, in Maraveh Tappeh, the temperature rises by 1.94 °C, from 13.29 °C to 15.23 °C, while Tamer sees an increase of 1.94 °C, from 12.36 °C to 14.31 °C. All stations exhibit a similar pattern of increase for the maximum temperatures, with greater changes observed under the SSP5-8.5 scenario. Voshmgir and Inceh Broun show the highest projected maximum temperatures, reaching 27.69 °C and 27.68 °C, respectively, under SSP5-8.5, reflecting increases of 2.30 °C and 2.25 °C compared to the current conditions. Gorgan sees a rise in the maximum temperature from 22.99 °C to 25.22 °C, an increase of 2.23 °C, under SSP5-8.5, while Ramian experiences a rise of 1.64 °C, from 23.19 °C to 24.83 °C. Figure 6 illustrates the spatial distribution maps of the examined climatic variables under the current and future climate change scenarios.

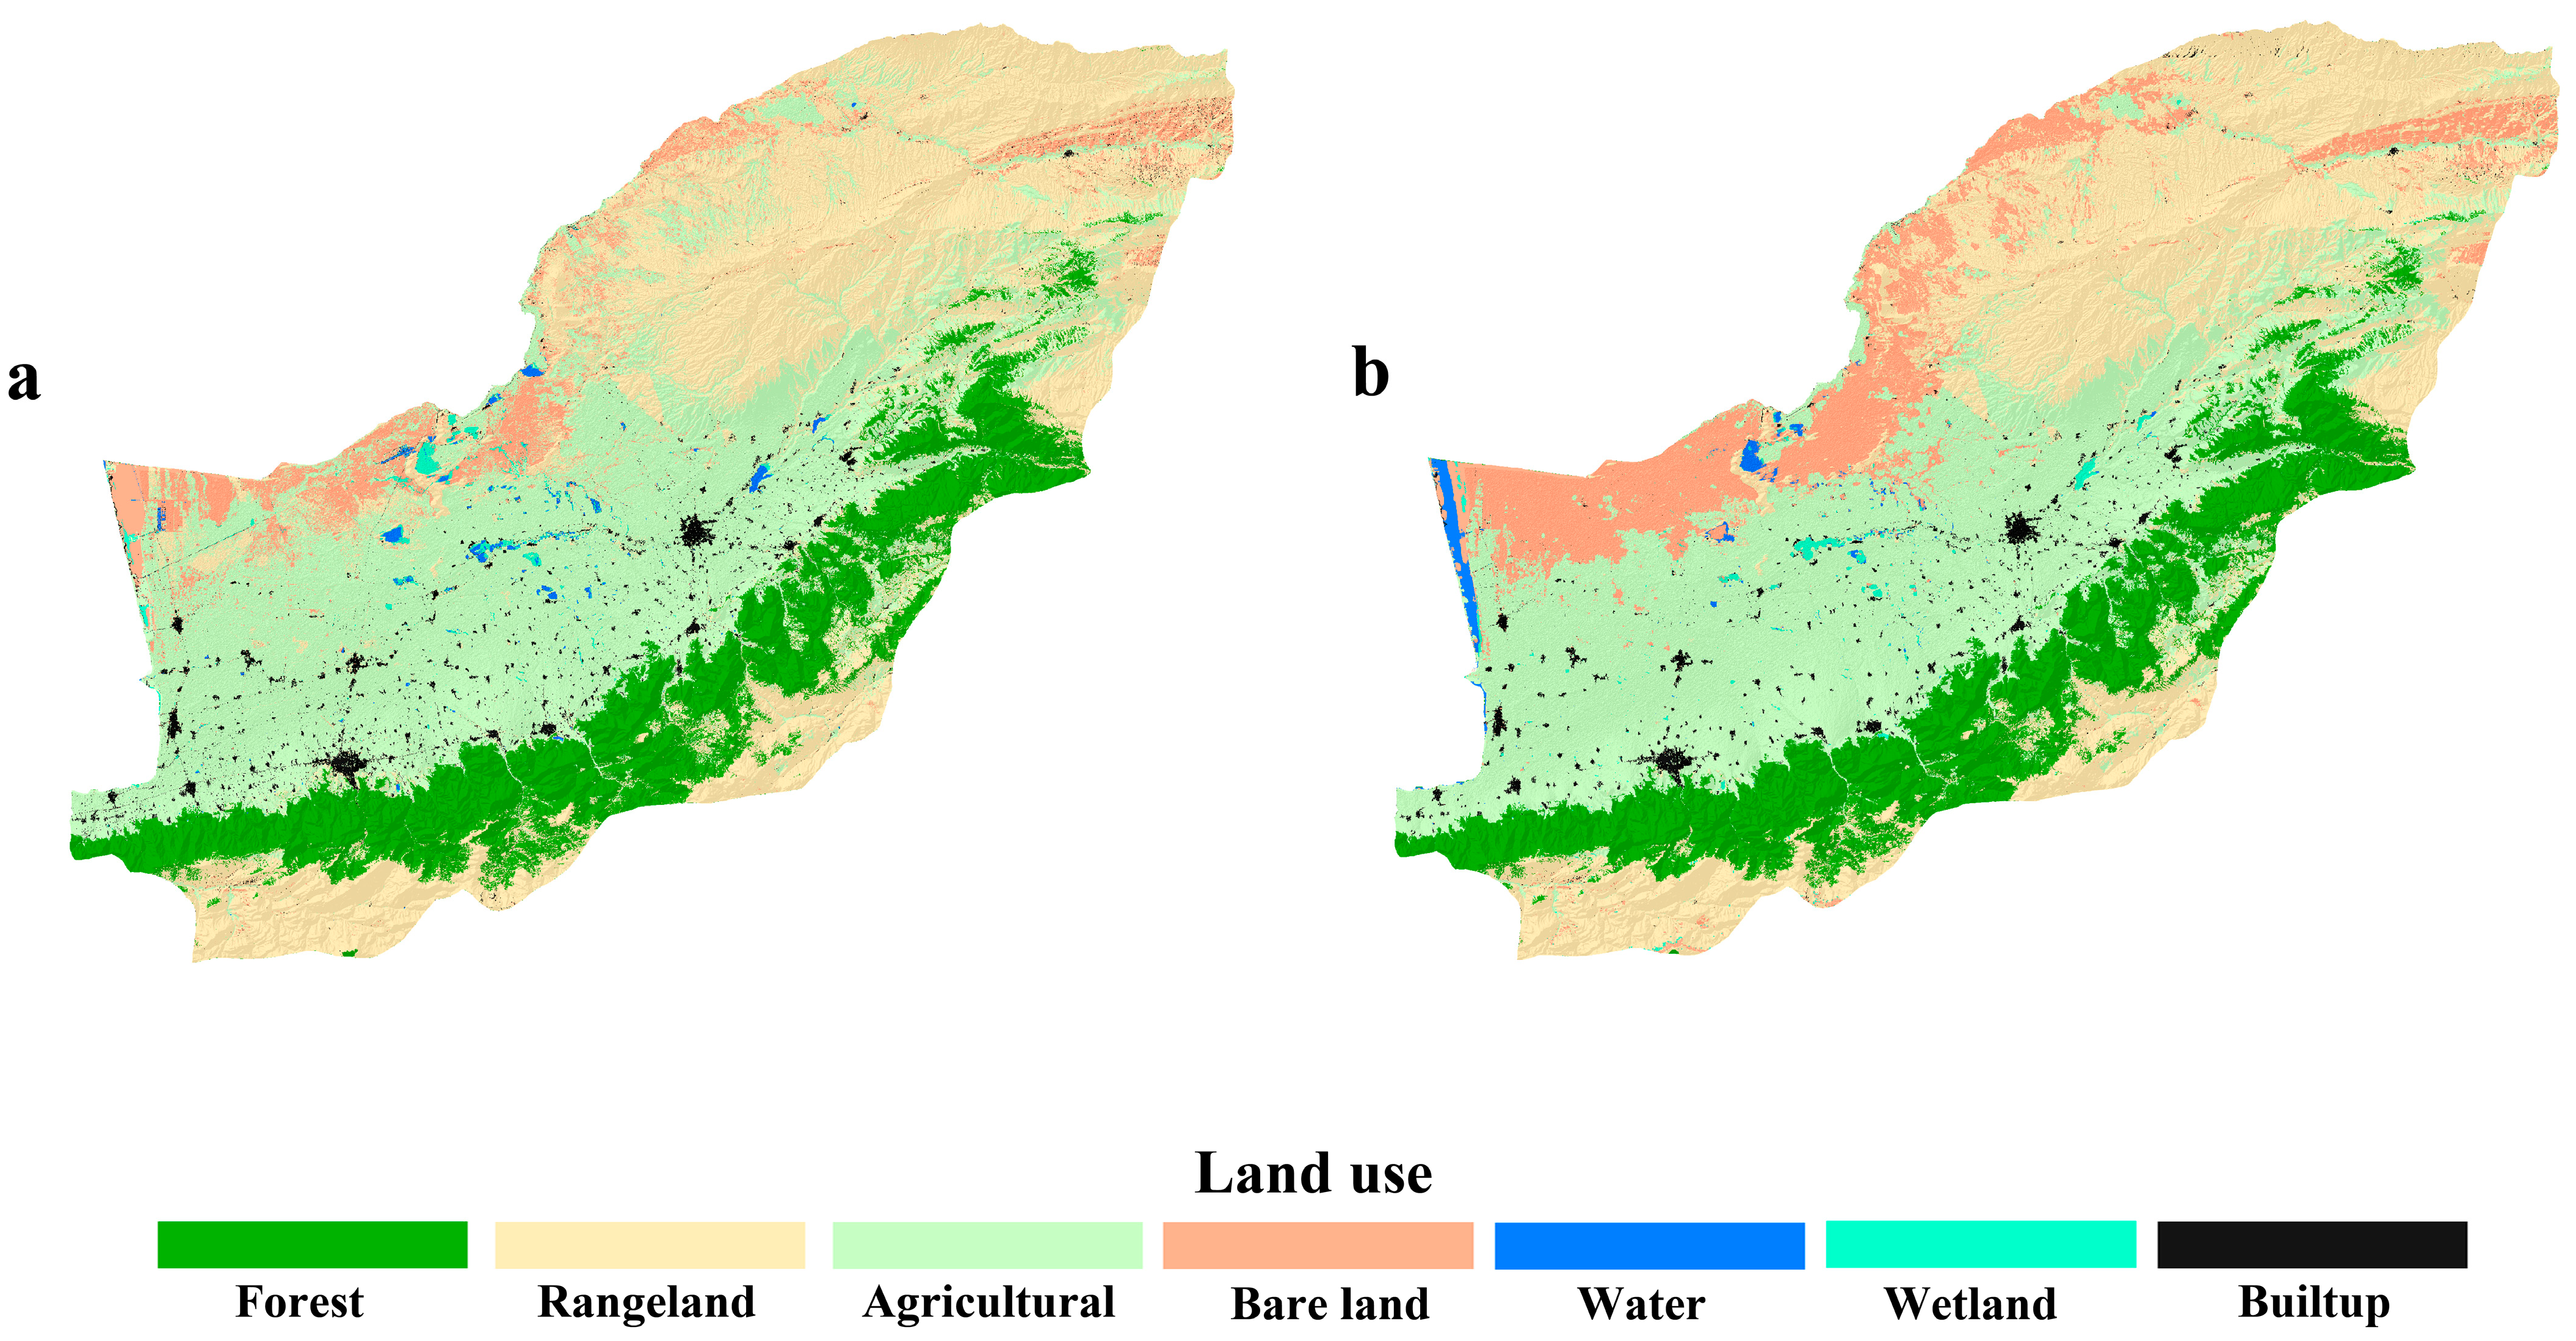
3.3. Analysis of Land Use Change and Its Impact on Drought Conditions

The accuracy assessment of the LULC classification results indicated a high level of performance. The overall accuracy was 0.98, demonstrating that the classifier correctly identified 98% of the test samples. Furthermore, the Kappa coefficient was calculated to be 0.98, indicating the strong agreement between the classified map and the reference data. When trained with the selected spectral and textural features, these results suggest that the random forest classifier provided highly accurate and reliable land cover classification for the study area. The overall accuracy and Kappa coefficient were well above the acceptable threshold, confirming the robustness of the classification model. Accordingly, the LULC map of Golestan Province was classified into seven distinct categories. Forests, predominantly part of the Hyrcanian forests, are located in the northern foothills of the Alborz Mountains and the southern Caspian coastal plains, characterized by dense vegetation consisting of ancient broadleaf species such as oak (Quercus castaneifolia), beech (Fagus orientalis), hornbeam (Carpinus betulus), and maple (Acer velutinum), playing a vital role in the ecological balance and biodiversity. Rangelands, primarily found in the eastern and southeastern parts of the province, consist of natural grasslands and shrublands that are essential for grazing livestock and the preservation of native flora and fauna. Agricultural lands dominate the fertile lowlands of the central and western plains, actively cultivated for crops, orchards, and plantations, forming the cornerstone of the region’s economy. Bare lands, with minimal vegetation, are scattered across eroded zones, particularly in the northern plains, often resulting from deforestation or natural processes. Water bodies, such as rivers, lakes, and reservoirs, are primarily concentrated in the central plains, with significant examples being the Gorgan River and the Golestan Dam. Wetlands, such as the Gomishan Wetland near the Caspian Sea, are defined by water-saturated soils and support aquatic plants and wildlife, serving as natural water filters and habitats. Built-up areas, including cities such as Gorgan, Bandar-e Torkman, and Gonbad-e Kavus, encompass urban and rural settlements, industrial zones, and infrastructure, reflecting the extent of human habitation and activity. Understanding these categories and their spatial distribution is essential in managing the land resources and planning sustainable development in the province.
Table 4 and Figure 7 presents a summary of the land use in 2022, as well as the projected changes for 2030–2050, revealing significant shifts in land categories like forests, rangeland, agricultural land, and bare land. These changes give important insights into how the drought conditions, both agricultural and hydrological, can be worsened. Figure 8 presents spatial maps of the land use classes for the years 2022 and 2030–2050. Next, we will discuss how each land use change case relates to drought’s impacts and the generalized environmental repercussions.
In 2022, the total forest area in the region was 339,409 ha, which is projected to decrease by 0.06% (1299 ha) by 2030–2050, with this area being converted to rangeland and built-up spaces. The total rangeland area in 2022 was 708,347 ha, and it is expected to decline by 2.83% (57,295 ha) by 2030–2050, with much of this land being converted into bare land. Agricultural land, which covered 805,055 ha in 2022, will decrease by 2.85% (57,788 ha), primarily transitioning into bare land and built-up areas. The bare land area in 2022 was 123,473 ha and is expected to increase significantly by 5.24% (106,202 ha) by 2030–2050. Water bodies, which accounted for 7210 ha in 2022, are projected to increase by 0.23% (4710 ha) by 2030–2050. Wetland areas, which covered 8818 ha in 2022, will decrease by 0.05% (940 ha) by 2030–2050, largely transitioning into water bodies. Built-up areas, which totaled 35,801 ha in 2022, will see a small increase of 0.32% (6420 ha) by 2030–2050 due to urbanization.

3.4. Localized Analysis of Land Use Change in Golestan Province (2022 vs. 2030–2050)

Significant land use changes are projected across Golestan Province by 2030–2050 (Table 5). In sum, Ali Abad showed slight forest cover increases (45.79% to 46.13%) and minimal rangeland losses, while Aqqala experienced sharp rangeland and agricultural land declines, with bare land rising dramatically (13.68% to 26.13%). Azadshahr, Bandar Gaz, and Bandar-e Torkman exhibited minor shifts, including small reductions in rangeland and slight increases in built-up areas. Galikesh and Kalaleh saw moderate rangeland declines and agricultural land increases, while Gomishan and Gonbad-e Kavus faced substantial rangeland and agricultural land losses, with significant bare land expansion. Gorgan, Kordkuy, Maraveh Tappeh, Minudasht, and Ramiyan recorded minor changes, including slight increases in forest or agricultural land and small reductions in rangeland. More details are provided in Table 5.

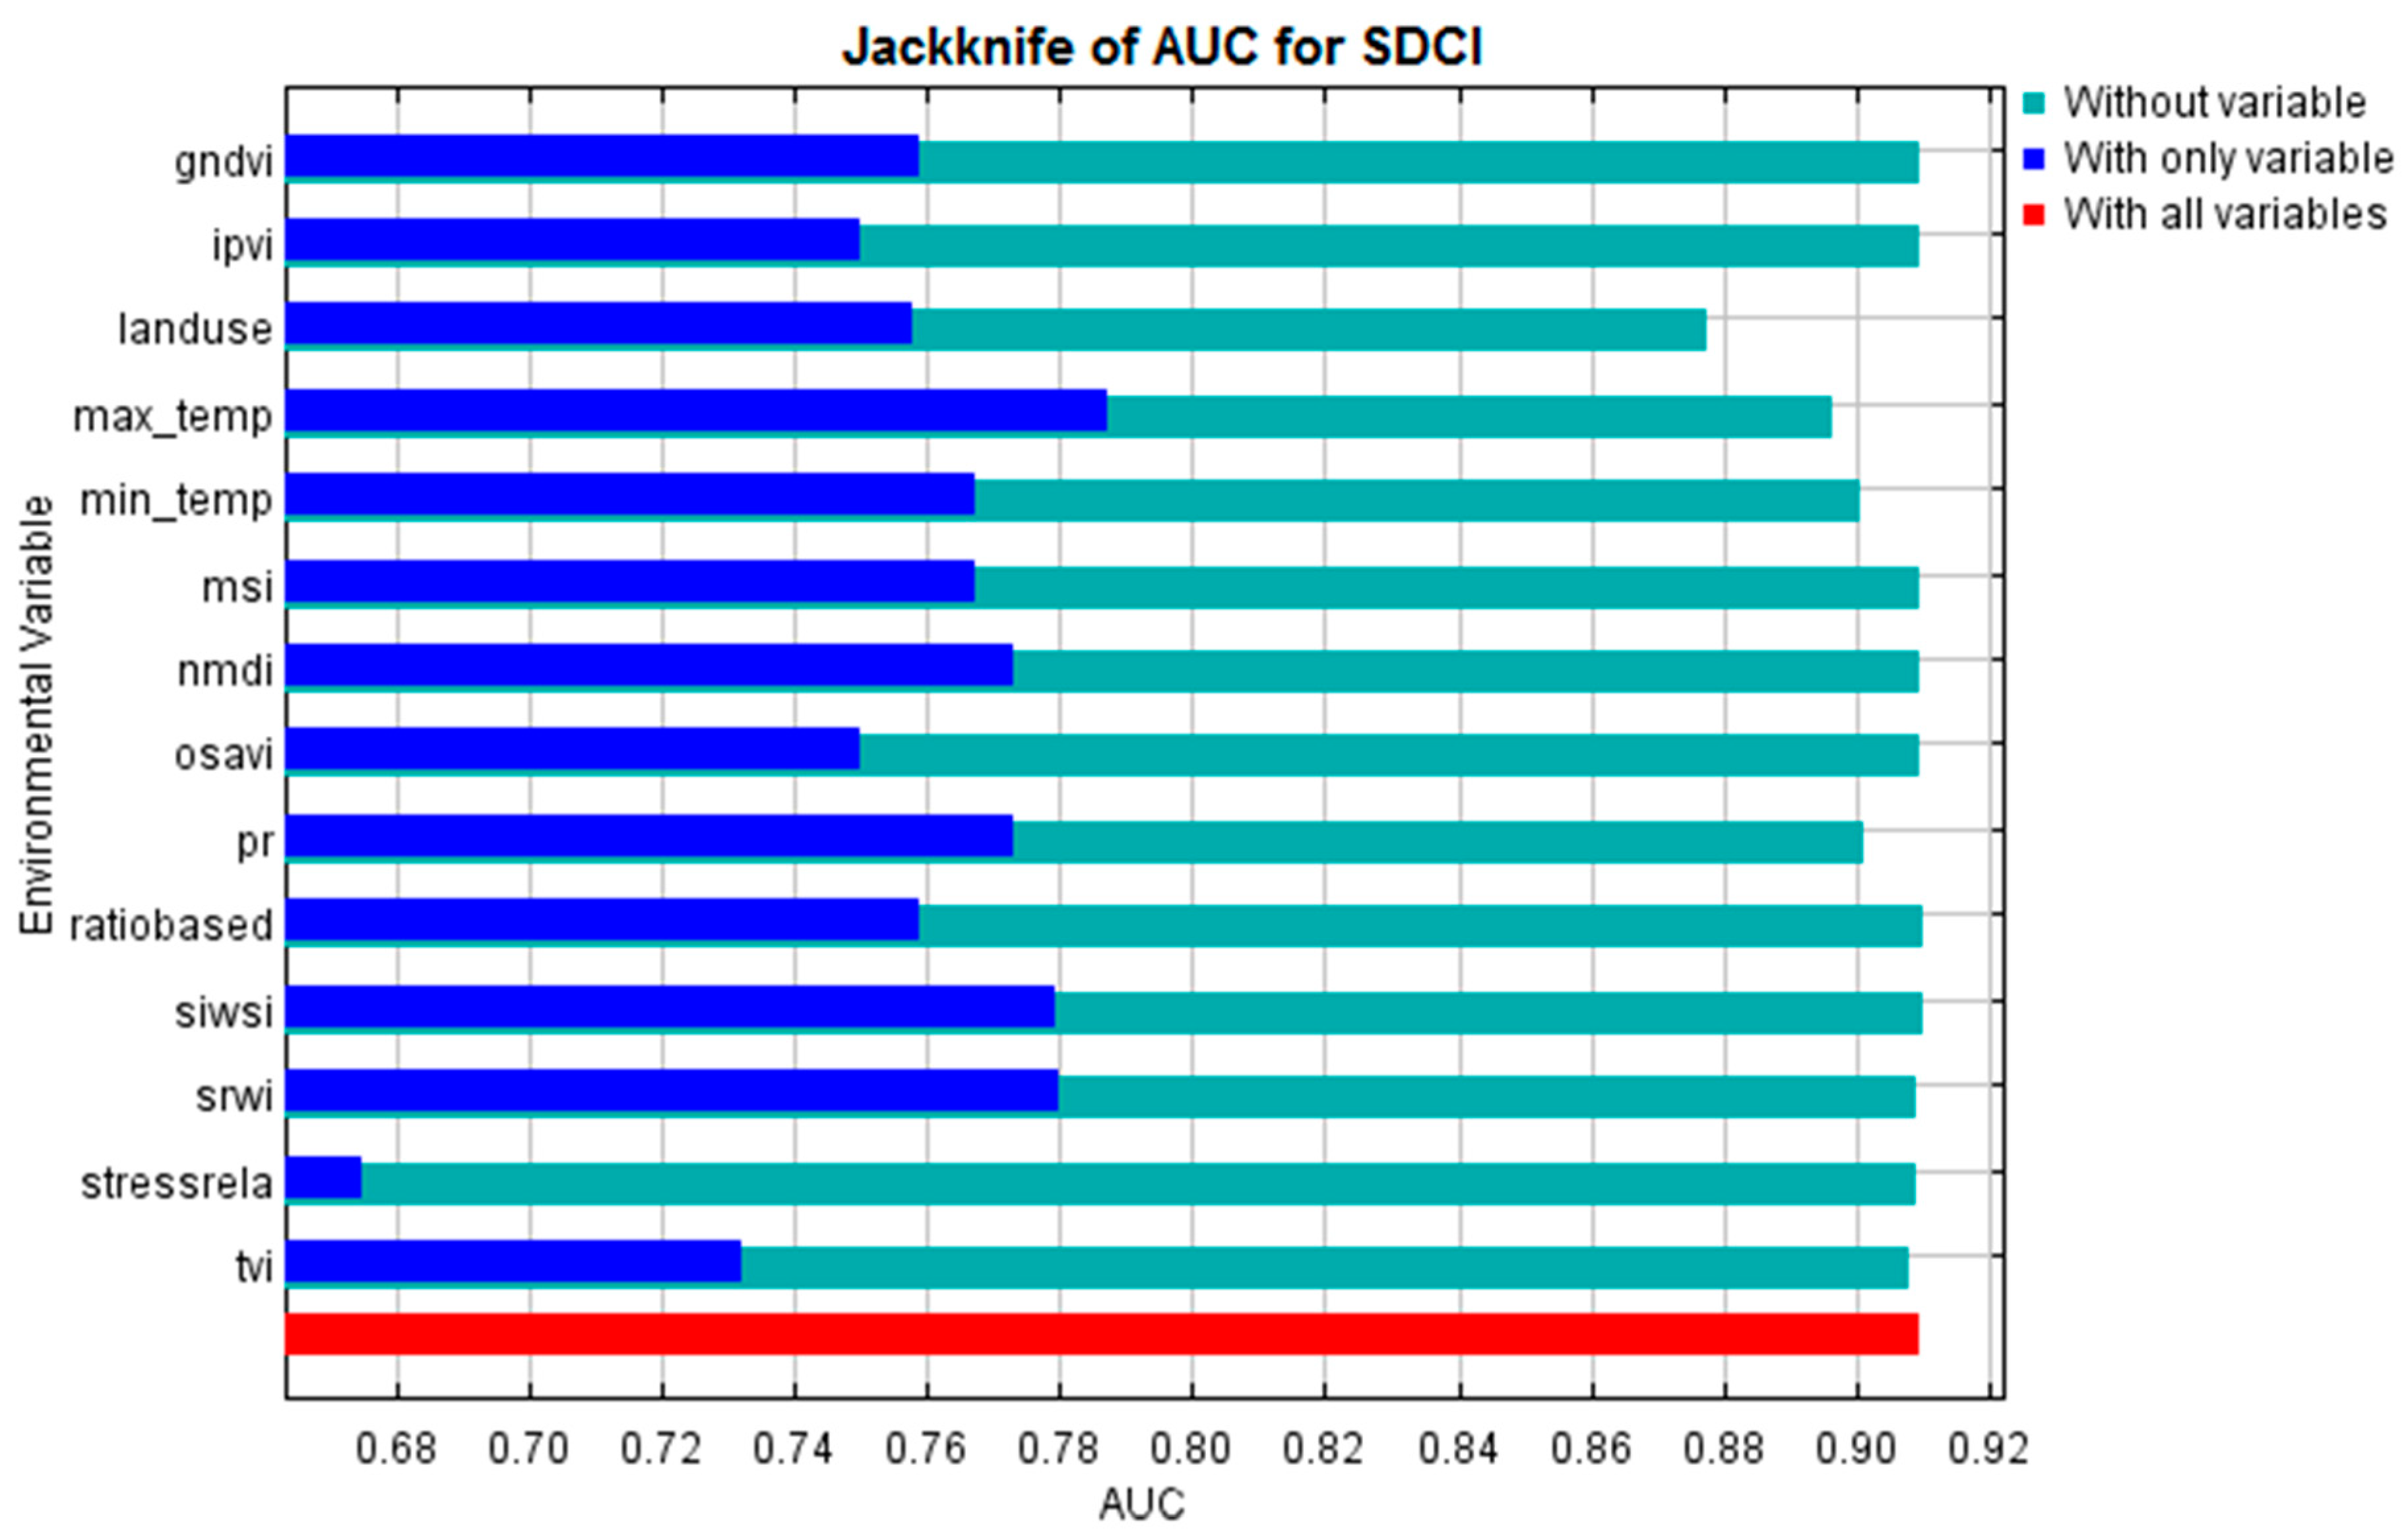
3.5. Key Environmental Drivers and Evaluation of Drought Susceptibility Using MaxEnt: Insights from Jackknife and AUC Analysis

The jackknife test of the maximum entropy (MaxEnt) model evaluated the predictive significance of 14 environmental variables regarding the agrometeorological drought susceptibility within Golestan Province (Figure 9). The analysis highlighted precipitation, the maximum temperature, and land use as the most influential predictors of drought, based on the lengths of their blue bars in the test. Precipitation exhibited a blue bar value of 0.771, followed by the maximum temperature at 0.788 and land use at 0.755. These factors demonstrated the strongest capabilities to independently predict the Standardized Drought Condition Index (SDCI). The green bar values, which reflect the decline in the AUC when a variable is excluded from the model, further emphasized the critical role of these variables. For example, precipitation’s green bar value was 0.9, while the maximum temperature and land use had values of 0.898 and 0.878, respectively. The exclusion of these variables significantly reduced the model’s performance, indicating their unique contributions to drought prediction.
Variables like the Soil Moisture Stress Index (SIWSI) and Simple Ratio Water Index (SRWI) also contributed notably, with blue bar values of 0.779 and 0.78, respectively. Although their individual predictive capacities were moderate, their inclusion in the model enhanced the accuracy, as evidenced by their consistent green bar values of 0.91. Conversely, vegetation indices such as the Green Normalized Difference Vegetation Index (GNDVI) and Infrared Percentage Vegetation Index (IPVI) showed lower individual predictive power, with blue bar values of 0.755 and 0.749, respectively, despite maintaining strong overall model performance.
According to the ROC curve, the MaxEnt model demonstrated reliable performance for drought susceptibility assessment (Figure 10). The generated AUC values of the ROC curves for the training and test data were 0.929 and 0.910. The generated ROC curve of the training data indicated that the MaxEnt model achieved a good discrimination capacity between drought and non-drought occurrences in the training points, evidenced by the generated AUC value of 0.929.

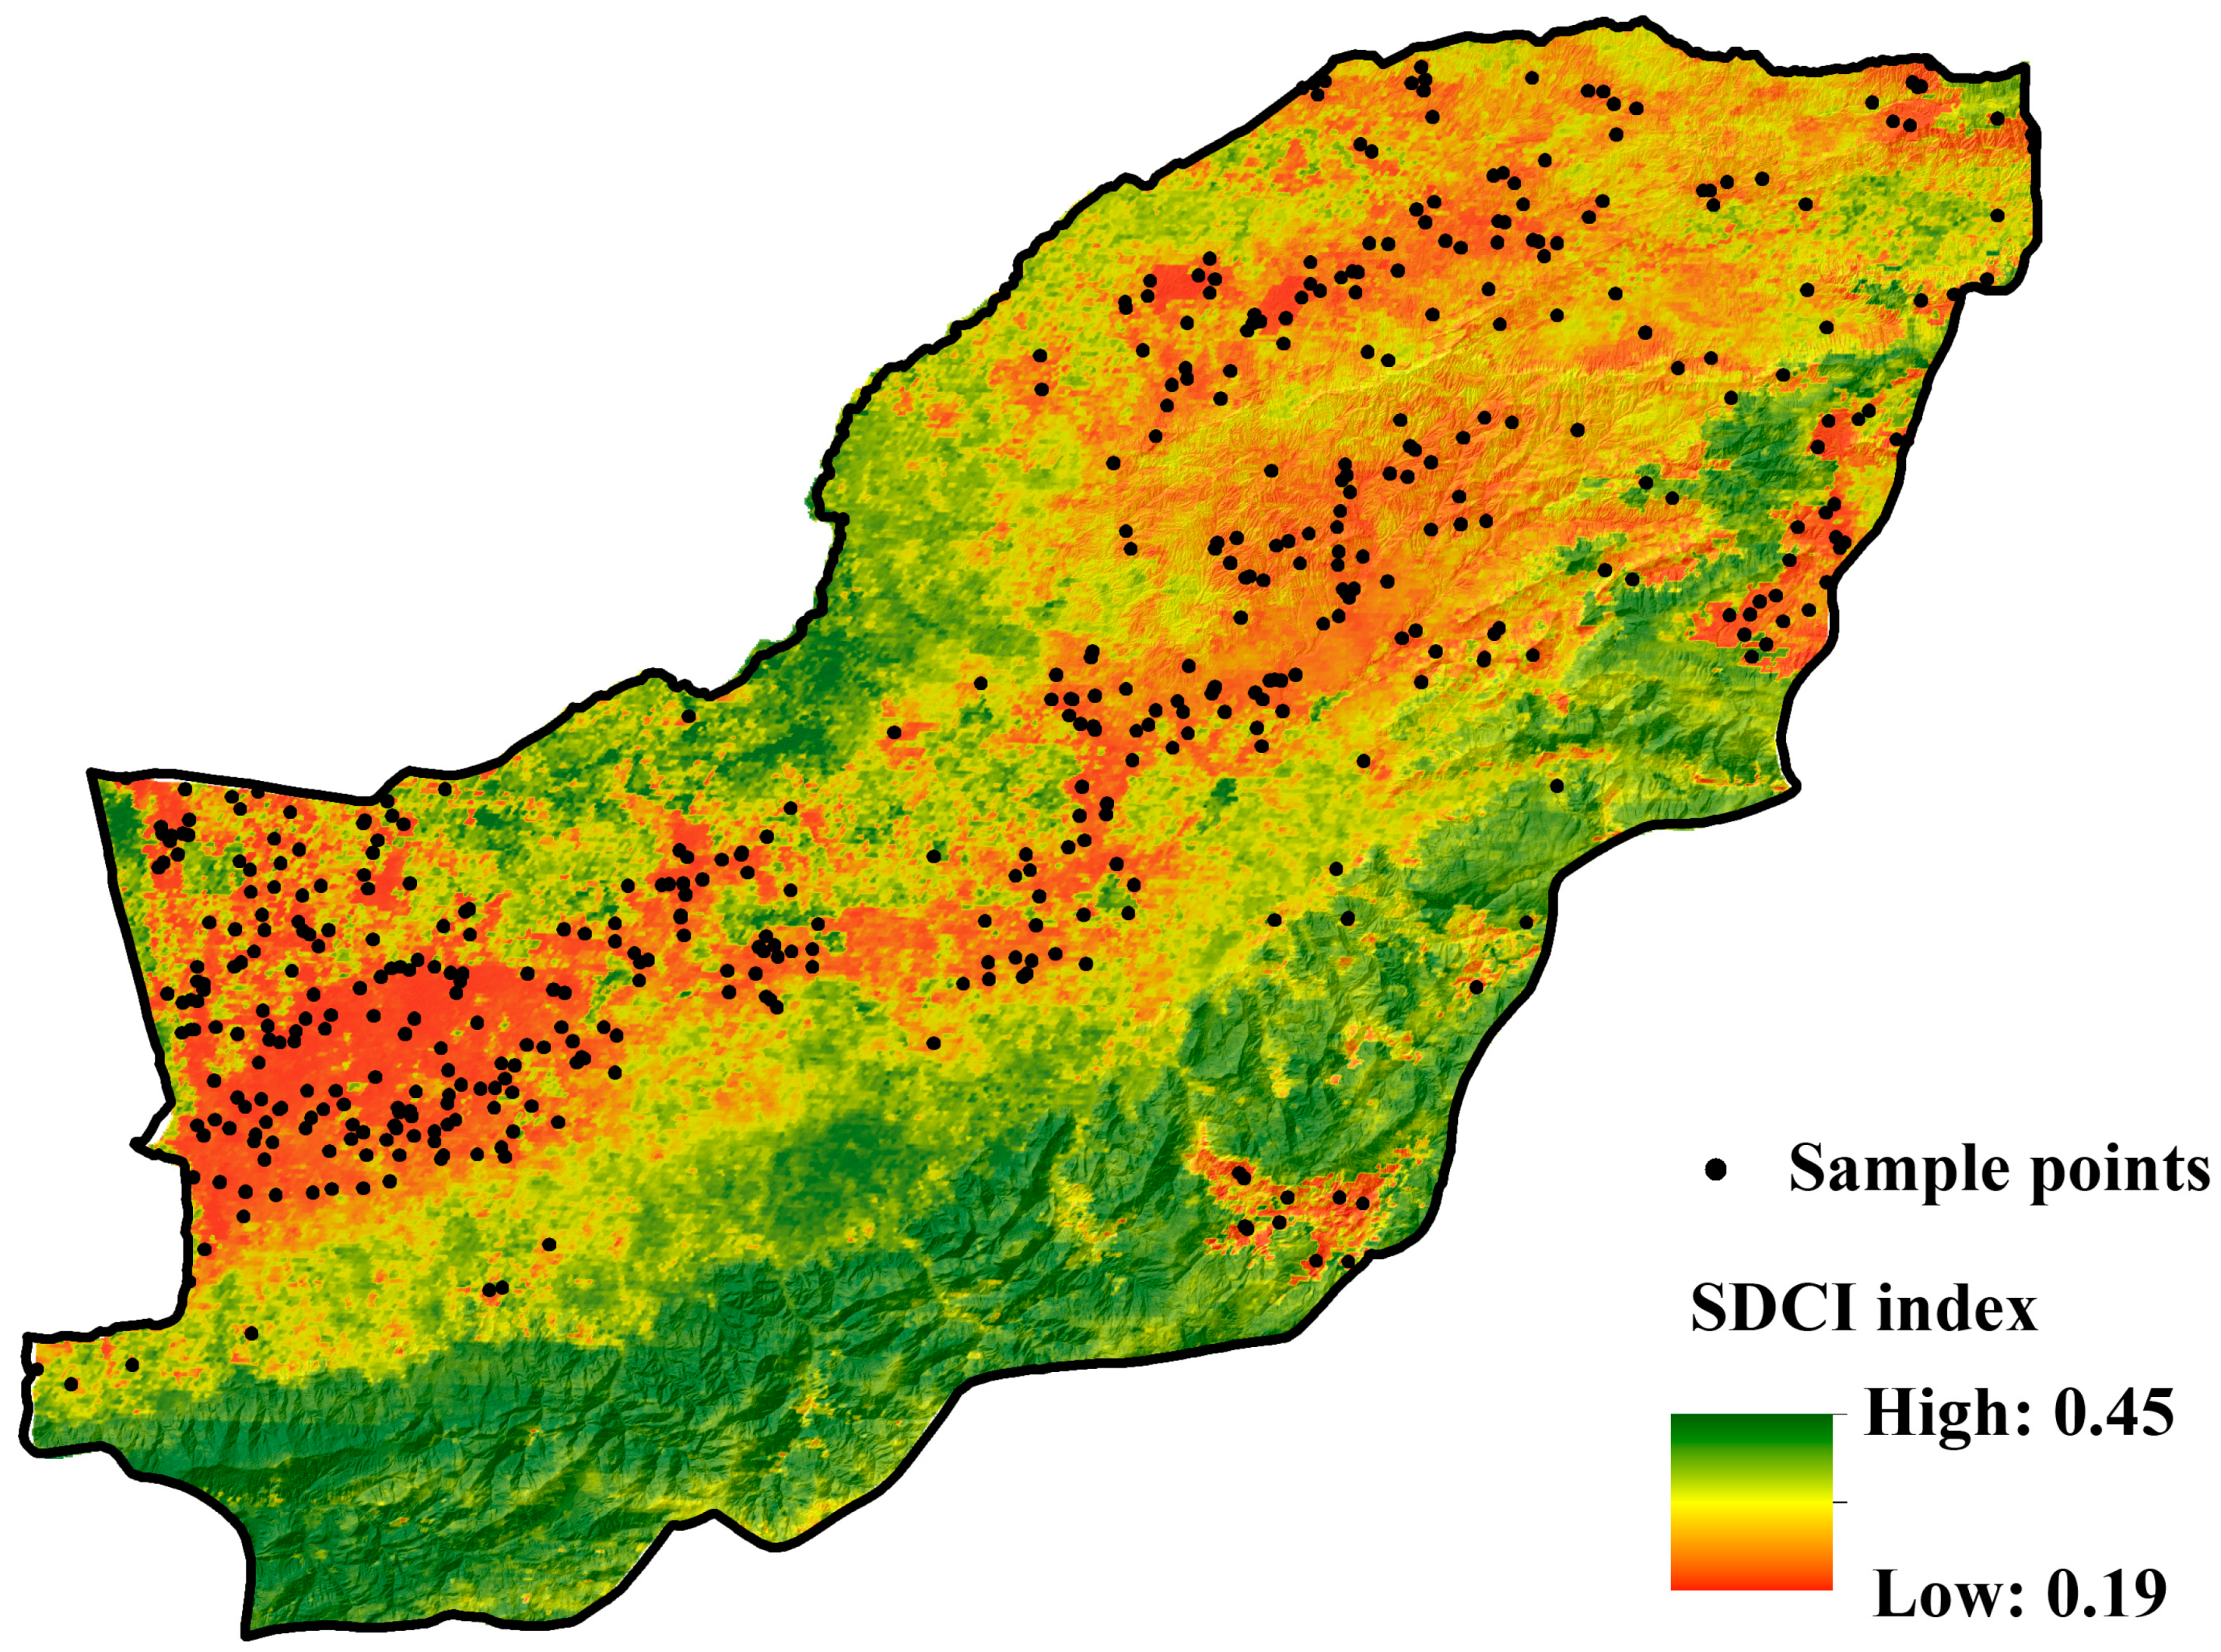
3.6. Integrated Analysis of Drought Susceptibility Classes and Their Link to Climate Change and Land Use Dynamics

The drought susceptibility maps were classified into five susceptibility categories (i.e., very low, low, moderate, high, and very high) using Jenks’s natural breaks classification method [96], given the skewed, light-tailed distribution of the susceptibility frequency histogram [97,98]. Building upon the modeling of the 14 drought-controlling factors and 500 SDCI sample points (Figure 11), the drought susceptibility maps of Golestan Province reveal significant heterogeneity across the counties (Figure 12). In Gomishan, for instance, 66.12% of the county exhibits “very high” susceptibility, indicating severe threats to agricultural and hydrological resources. In contrast, Bandar Gaz shows 97.68% of its area categorized as “very low,” which is a significant achievement for this region. The projected data for the future scenarios—SSP1-2.6, SSP2-4.5, and SSP5-8.5—indicate a troubling fate for the region. Under SSP1-2.6, Bandar-e Torkman shows a shift, with 89.25% of its area moving to the “very high” class. For SSP2-4.5, in Aqqala and Gomishan, most areas remain “highly” and “very highly” susceptible. Under SSP5-8.5, Aqqala is projected to have large areas of “moderate” (48.10%) and “high” (31.25%) susceptibility. The land use patterns show significant changes, particularly the conversion of rangeland to bare land in the counties of Aqqala and Gomishan. These changes correspond with the increased maximum temperatures and decreased summer rainfall. Gonbad-e Kavus shows the progressive degradation of agricultural land, linked to increasing temperatures, resulting in water shortages. Urban expansion in Bandar Gaz and Bandar-e Torkman has led to increased surface runoff and decreased groundwater recharge.

4. Discussion

4.1. Monthly Climate Change Data

The consistent warming projected across all scenarios underscores the inevitability of climate change impacts on Golestan Province, with SSP5-8.5 highlighting the most severe outcomes. Temperature increases, particularly in the summer months, could exacerbate the drought conditions by accelerating the evaporation rates and reducing the soil moisture availability. The projected temperature rises (+3.15 °C in April, +1.85 °C in July at Gorgan) under SSP5-8.5 may heighten heat stress, reducing crop yields and increasing the water demand. Similarly, the persistent rise in the minimum temperatures, such as +3.44 °C at Inceh Borun in March, suggests warmer nights, which may impact plant growth and lead to increased energy demands for cooling.
The high variability in precipitation, particularly under SSP5-8.5, poses additional challenges for water resource management. Stations like Gorgan and Ramian, with extreme precipitation swings such as −30.52 mm in September and +54.76 mm in December, highlight the dual risk of severe droughts and floods. These fluctuations are likely to strain the existing water infrastructure, including reservoirs, irrigation systems, and flood defenses, necessitating substantial investments in adaptive measures. In contrast, stations like Tamer and Maraveh show less extreme variability but still experience notable changes, such as precipitation decreases of −7.83 mm in September (Tamer under SSP5-8.5) and increases of +22.18 mm in December (Tamer under SSP1-2.6), indicating that even relatively stable regions are not immune to the effects of climate change.
Changes in land use, combined with these climatic shifts, are likely to exacerbate the drought susceptibility. The interplay of increased temperatures and erratic precipitation can reduce groundwater recharge, especially in areas experiencing urban expansion or transitions from rangeland to bare land. This is particularly concerning for regions where urbanization is likely to compound the effects of reduced rainfall in certain months. Moreover, higher precipitation variability can lead to flash flooding, as projected under SSP5-8.5 in stations like Ramian and Gorgan during December, potentially damaging infrastructure and ecosystems.
A coordinated climate adaptation and land use strategy is essential. Water storage solutions (e.g., reservoirs, rainwater harvesting) are vital in balancing rainfall extremes and mitigating drought. Crop selection and irrigation techniques should be adjusted to account for the warmer and drier conditions expected in the summer months, while flood-prone areas may require upgraded drainage and flood control systems. Monitoring systems are also essential in tracking climatic changes and informing adaptive management, especially in stations like Gorgan and Ramian, which exhibit significant variability.
The results emphasize the urgent need for scenario-based planning to mitigate the adverse effects of climate change. While SSP1-2.6 offers a more optimistic outlook with manageable temperature and precipitation changes, even these scenarios present challenges that require proactive measures. Under SSP5-8.5, the stakes are significantly higher, necessitating robust, coordinated action to protect both natural ecosystems and human communities in Golestan Province.

4.2. Annual Climate Change Data

The increase in annual rainfall foretells changes in regional atmospheric dynamics, conditioned, most likely, by changes in circulation patterns and moisture availability concerning global warming. Stations such as Gorgan, lying relatively close to the Caspian Sea, may be subject to more moisture influx. Although the increases in Voshmgir and Inceh Borun are significant, they are relatively smaller compared to Gorgan and Ramian due to the smaller amounts of observed precipitation at lower altitudes. Such an increase in precipitation also signals rising future challenges like increasing flood risks, particularly in areas with insufficient drainage systems and water management infrastructure.
The annual minimum temperature increase may alter local microclimates, affecting the length and intensity of the growing season for crops. An option that raises the minimum temperatures could diminish the risk of frost but could also disrupt the ecosystem dynamics. When the minimum temperatures rise, less diurnal temperature variation occurs—this influences plant growth, evapotranspiration rates, and the ecosystem’s capacity to resist heat stress. The rise in the maximum temperatures presents two challenges: higher temperatures may lengthen the growing season in cooler regions but also increase the likelihood of drought if the water availability (from precipitation) cannot be maintained with higher temperatures. In combination with the expected increases in precipitation, this may yield more erratic weather, with more storms or drought periods becoming more frequent or intense. Even small increases in the maximum temperature can increase heat stress in human populations and natural systems, with more frequent and intense heatwaves.

4.3. Combined Monthly and Annual Climate Chnage

To evaluate whether any seasonal or long-term patterns might emerge, the mean annual and monthly results regarding the precipitation, minimum temperature, and maximum temperature across the synoptic stations were compared. An unequivocal and demonstrable increase in both precipitation and temperature is evident under all SSP scenario types, with the magnitude of the change increasing progressively from SSP1-2.6 through to SSP5-8.5. For example, in Gorgan, the annual precipitation is projected to increase from 642 mm under SSP1-2.6 to 749.7 mm under SSP5-8.5, a clear indicator of intensified atmospheric moisture availability. Similarly, the minimum temperatures show a rise of up to +3.44 °C in Inceh Borun in March under SSP5-8.5, while the maximum temperatures in Gorgan could rise by as much as +3.15 °C in April under the same scenario. These increases point to a pronounced trend towards a hotter and wetter climate, particularly under severe climate change scenarios such as SSP5-8.5.
The data highlight distinct seasonal patterns superimposed on these long-term trends. The winter and early spring months (e.g., January to April) are projected to experience the most significant increases in precipitation across stations, aligning with global observations in temperate regions, where the precipitation peaks during these seasons. ese months, which raises concerns about flood risks in areas with insufficient drainage infrastructure, such as parts of the Voshmgir and Ramian districts. For instance, the December precipitation at Ramian could rise by +57.24 mm under SSP5-8.5, compared to the current levels. Conversely, the summer months (e.g., June to August) show mixed precipitation trends, with some stations experiencing reductions (e.g., −30.52 mm in September at Gorgan under SSP5-8.5), potentially exacerbating drought conditions.
Seasonal contrasts in the temperature changes are similarly pronounced. The summertime maximum temperatures are projected to rise sharply, with Gorgan, for example, seeing increases of up to +3.15 °C in April under SSP5-8.5. The rise in the minimum temperatures across all seasons further suggests reduced frost occurrence, which could benefit agriculture by extending the growing season. However, the accompanying reduction in diurnal temperature variation and elevated heat stress may negatively affect crop yields, particularly during critical summer growth stages, when higher evapotranspiration rates may outpace the water availability. For instance, Maraveh shows minimum temperature increases of +2.58 °C in November under SSP5-8.5, signaling the potential for higher nighttime heat stress.
This pattern of accentuated seasonal contrasts suggests that the winter and early spring months will become wetter, posing increased flood risks, while the summers may become drier and hotter, raising the likelihood of prolonged heatwaves and drought conditions. Stations like Ramian and Voshmgir may see amplified intensities and frequencies of rainfall events during wetter months, while regions like Gorgan and Inceh Borun could face more extreme summer heat, exacerbating water scarcity and agricultural stress. These patterns are consistent with global climate projections that indicate more erratic weather, including intensified wet and dry periods.
These combined monthly and annual trends point towards an aggravated seasonal cycle characterized by heightened contrasts between wetter winters and drier summers. This dynamic may benefit crops by offering a longer growing season due to warmer winters but impose significant challenges during the summer months, when water deficits and heat stress could impair yields. The projected increases in annual and seasonal rainfall suggest opportunities for water storage and harvesting; however, adaptive measures will be necessary to mitigate the flood risks during wetter months and address water scarcity during prolonged dry spells. Effective strategies will require integrated water management, agricultural adaptation (e.g., drought-resistant crops and irrigation efficiencies), and disaster risk reduction to cope with the dual threats of intensified floods and droughts.
The findings emphasize the need for a multifaceted approach to climate adaptation, balancing the opportunities offered by a longer growing season with the challenges posed by increased seasonal variability. This unique combination of warmer temperatures and fluctuating precipitation patterns reinforces the urgency of developing resilient infrastructure and systems to safeguard the livelihoods and ecosystems of Golestan Province.

4.4. Analysis of Land Use Change and Its Impact on Drought Conditions

The land use analysis reveals a clear trend of land degradation, with significant shifts that will exacerbate both agricultural and hydrological droughts. The small decrease in the forest area of 1299 ha (0.06%) may seem insignificant but has critical implications for drought mitigation. Forests, which play an essential role in water retention, groundwater recharge, and preventing soil erosion, will lose their capacity to buffer drought conditions as they are converted into rangeland and built-up areas. The reduction in forests in this manner diminishes the land’s ability to absorb moisture, thus contributing to higher rates of evapotranspiration and reinforcing drought conditions. The 2.83% decline in rangeland (57,300 ha) is also concerning. As rangelands are converted to bare land, their role in moisture retention is significantly diminished, leading to higher soil erosion rates and exacerbating the onset of hydrological droughts. This loss of rangeland may also result in overgrazing, further reducing the soil moisture and heightening the vulnerability to drought. Similarly, the 2.85% reduction in agricultural land (57,800 ha) intensifies the risk of agricultural drought. As agricultural lands shrink and are replaced by bare land and built-up areas, the remaining fertile land faces increased water stress, potentially forcing farmers to utilize less productive soils that are more prone to degradation. This shrinkage in cultivable land also places additional strain on water resources, exacerbating water scarcity and the depletion of local aquifers, thus further aggravating agricultural droughts. The 5.24% rise in bare land (106,202 ha) is particularly alarming, as bare land significantly reduces the land’s capacity to retain water. Increased bare land leads to more runoff, less water infiltration, and higher evaporation rates, all of which amplify hydrological drought. The transformation of agricultural and rangeland areas into bare land further compounds these effects, reducing productivity and pushing the region towards desertification.
On the other hand, there is a small increase in water bodies (0.23% or 4710 ha), which could potentially serve as a buffer against drought, offering additional resources for irrigation. However, this gain is limited in scope and cannot counterbalance the broader negative effects of land use change. The slight reduction in wetland areas (0.05% or 940 ha) is also noteworthy, as wetlands play a crucial role in groundwater recharge and flood control. The conversion of wetlands into water bodies reduces their natural buffering capacity, which could further exacerbate hydrological droughts in the region. Finally, the 0.32% increase in built-up areas (6420 ha) driven by urbanization leads to the conversion of permeable land into impervious surfaces. This transformation reduces groundwater recharge and increases surface runoff, both of which contribute to hydrological drought. Urbanization also exacerbates the urban heat island effect, increasing the evaporation rates and reducing the water availability for agriculture, further intensifying the drought conditions. In sum, the land use changes observed in this study point to a growing challenge in mitigating drought conditions in the region. The increase in bare land and the reductions in forest, rangeland, and agricultural areas undermine the landscape’s ability to retain moisture and support vegetation. While the growth of water bodies offers some potential relief, it is insufficient to offset the broader land degradation trends. These findings underscore the urgent need for targeted land management strategies and climate-smart agricultural practices to mitigate the impacts of climate change and land degradation on the drought susceptibility in the region.

4.5. Localized Analysis of Land Use Change in Golestan Province (2022 vs. 2030–2050)

The localized land use changes observed in Golestan Province highlight significant trends that could amplify the drought risks, both agricultural and hydrological. The widespread transformation of rangeland into bare land, especially in Aqqala, Gomishan, and Gonbad-e Kavus, is particularly concerning. The increase in bare land, by 12.45% in Aqqala, 13.24% in Gomishan, and 11.44% in Gonbad-e Kavus, represents a loss of vital vegetation cover, which normally helps to retain moisture and prevent desertification. This transformation leads to a reduced ability to absorb and retain water, exacerbating both agricultural and hydrological droughts. Bare land increases the evaporation rates and accelerates soil erosion, making recovery from drought conditions more difficult. Additionally, the sharp decrease in agricultural land in Aqqala (−7.13%) and Gonbad-e Kavus (−9.27%) suggests that farming is becoming unsustainable in these areas, primarily due to water scarcity and land degradation. As agricultural land is converted to barren soil, the land becomes more vulnerable to further degradation, creating a feedback loop of soil erosion and reduced water availability, thereby heightening agricultural droughts. Urbanization in coastal areas, such as Bandar Gaz and Bandar-e Torkman, introduces another layer of stress. The increases in built-up areas of +0.60% and +0.73%, respectively, although modest, signify a growing trend towards impermeable surfaces that hinder water infiltration and increase surface runoff. This urban expansion contributes to the urban heat island effect, which intensifies evaporation and exacerbates water stress, further contributing to hydrological drought.
On the other hand, the slight increase in forest cover in counties like Galikesh (+0.17%) and Ali Abad (+0.34%) offers hope for resilience against drought. Forests play a critical role in sustaining microclimates, reducing surface runoff, and enhancing groundwater recharge. Their preservation helps to stabilize the soil, prevent erosion, and maintain the moisture levels in the landscape. These forests not only mitigate drought effects but also contribute to carbon sequestration and local climate regulation, supporting the region’s long-term resilience to climate change and land degradation. However, the slight reduction in forest cover in Bandar Gaz and Kordkuy is concerning, as these areas are already vulnerable to urban encroachment and the expansion of barren land. Addressing the loss of forested areas and preventing further land degradation should be a priority in these counties to maintain their capacity to buffer drought conditions. Overall, the land-use changes across Golestan Province underscore the growing vulnerability of the region to drought, driven by a combination of land degradation, urban expansion, and shifts in agricultural practices. Strategies focusing on preserving forested areas, improving water management, and reversing land degradation are essential in mitigating the adverse impacts of drought in these counties.

4.6. Climate Change Projections and Their Interaction with Land Use Changes

Overall, the synoptic stations across Golestan Province project marked changes in the temperature and precipitation under the future climate scenarios (SSP1-2.6, SSP2-4.5, and SSP5-8.5). In general, the minimum and maximum temperatures are projected to increase under all scenarios, leading to increased evapotranspiration and deepening water stress, particularly in agricultural areas. Winter precipitation is expected to increase for all scenarios, pointing to a wetter winter and a greater probability of flooding, which is problematic under conditions of deepening drought and desertification. Reduced precipitation under future scenarios is projected during the growing season for most synoptic stations; the results from Gorgan, Ramian, and Gonbad-e Kavus are particularly alarming. These trends are consistent with the land use observations. The expansion of bare land in Aqqala and Gomishan, for example, may be directly related to consecutive increases in the temperature, leading to increasing soil moisture deficits. This result is corroborated by the reduction in the rangeland area in these counties, suggesting declining water resources and signaling a potential water shortage for vegetative regrowth. Urban expansion in Bandar Gaz and Bandar-e Torkman is likely to be a driver of water runoff and potential water shortage in these densely built areas; this pattern may also be related to the potential risk of extreme precipitation events and the increasing likelihood of water shortages under repetitive drought cycles. Rising temperatures increase the likelihood of increasing water runoff in deforested areas, but also increase the urban water needs in drier months.
The combined evidence of climate and land use changes indicates that Golestan Province is at a crossroads as it is rapidly transforming under the pressures of land degradation, urban expansion, and climate change, triggering mounting threats of future drought and potential desertification events. The present expansion of bare land, particularly in Aqqala and Gonbad-e Kavus, suggests the importance of developing and implementing conservation measures to prevent the further exacerbation of this condition. This should be prioritized for rangeland management to prevent or recover from desertification. In Ali Abad and Galikesh, it appears to be most crucial to provide some forest protection from immediate drought; the forests must be maintained and a mechanism established to preserve forests that are currently declining. The parts of the province that are experiencing forest loss, including Bandar Gaz, would benefit from reforestation, which has potentially positive influences on the local water cycle and drought likelihood. Sustainability-oriented urban expansion planning is tasked with integrating green infrastructure, like permeable pavements and living roofs, in urbanized counties. The goal of this is to minimize surface runoff and groundwater depletion and to control for urban heat islands or, at least, enhance the reliable supply of water to growing cities. As climate change accelerates, a crucial role will be played by adaptation options in relation to agriculture, particularly in places like Gonbad-e Kavus and Kalaleh, marked by significant reductions in productive land. In this way, food security will be sustained against escalating climatic change.
The combination of alterations in land use and climatic pressures has multiplied the risks of agricultural and hydrological drought in Golestan Province. With an extensive increase in bare land and a decrease in rangelands and agricultural land, Golestan faces increasing challenges in provisioning and supporting ecosystem services. County-wide trends reflect greater pressure on the environment, arising from climate change as well as unsustainable approaches to land use management. Targeted interventions focused on land degradation, supporting efforts towards forest conservation, and promoting sustainable agriculture are crucial to mitigate these growing risks. The future of the province lies in its capacity to cope with these emerging changes: integrated land use planning and climate-resilient development strategies will guarantee the long-term sustainability of natural and human systems under a climate characterized by increasingly strong droughts.

4.7. Key Environmental Drivers and Evaluation of Drought Susceptibility Using MaxEnt: Insights from Jackknife and AUC Analysis

The results underscore the dominant role of climate-related factors, particularly precipitation and the maximum temperature, in shaping the drought susceptibility within Golestan Province. As the primary driver, precipitation directly influences the water availability, with reduced rainfall exacerbating meteorological and agricultural drought. The maximum temperature acts synergistically, intensifying the evapotranspiration rates and depleting the soil moisture, thereby contributing to the drought severity. Land use emerges as another critical determinant, reflecting how anthropogenic alterations—such as agricultural expansion or rangeland degradation—affect the region’s vulnerability to drought. The observed green bar value of 0.878 for land use signifies its indispensable role in improving the model’s accuracy. Strategic land management practices, aimed at mitigating surface runoff and enhancing groundwater recharge, are essential to reducing drought’s impacts. While vegetation indices, including the GNDVI and IPVI, exhibit lower standalone predictive capabilities, their integration into the MaxEnt model bolsters the overall performance. These indices provide indirect measures of vegetation health and stress, acting as supplementary inputs that refine the spatial characterization of drought. Similarly, moisture-specific variables such as the SIWSI and SRWI enhance the model’s reliability by offering detailed insights into the soil and water conditions. The findings highlight the need for targeted interventions to address the underlying drivers of drought. Adaptive strategies, such as optimizing irrigation practices, promoting afforestation, and implementing sustainable land use policies, can mitigate the risks in hotspots like Gomishan and Aqqala. Furthermore, proactive measures to combat rising temperatures and declining precipitation—projected under climate change scenarios—are crucial in safeguarding the region’s agricultural productivity and water security. By integrating robust environmental data and predictive modeling, this study provides a comprehensive framework for the understanding and management of drought dynamics, emphasizing the interplay between climatic variables and land use in shaping regional susceptibility. These insights form a foundation for evidence-based planning and resilience-building efforts in Golestan Province.
The high AUC value in the ROC curve suggests that the areas with high vulnerability to drought were well discriminated from areas with low susceptibility, meaning that the model can be considered to be applicable when predicting the drought susceptibility using the training data. Meanwhile, the generated AUC value of 0.910 indicated that the model’s performance was good for the test data within the same area, thus possessing good generalization abilities for independent data, meaning that we can assess the robustness of the model in predicting drought at different spatial scales. The overfitting of the model has been effectively avoided, as evidenced by the close alignment of the AUC training and AUC test curves, indicating that the developed model can be applied to new areas to assess the drought susceptibility. We also strongly attribute this to the fact that the model has a strong generalization capacity and is not only applicable to the specific study area. The excellent performance observed during model validation demonstrates its practical application value for various fields, such as scientific research, large-scale public disaster management, and various stakeholders. This is due to the MaxEnt model’s ability to handle high-dimensional data and capture non-linear relationships, providing large space for the model’s application. The predictive power of the MaxEnt setup in our study allows it to be easily integrated into practical decision-making tools for drought-prone areas such as Golestan Province, including the development of early warning systems and resource allocation optimization.

4.8. Integrated Analysis of Drought Susceptibility Classes and Their Link to Climate Change and Land Use Dynamics

The transition of hotspot areas from one scenario to another for Golestan Province highlights the strong need for timely interventions. For example, the Aqqala hotspot area will experience an alarming shift, with 48.10% of its area exhibiting “moderate” and 31.25% exhibiting “high” susceptibility under the SSP5-8.5 scenario. Moreover, Gomishan maintains high levels, with 66.12% of its territory falling within the “very high” category, underscoring this area as a hotspot that requires specific attention. It is imperative to address these transitions by applying comprehensive management strategies that are tailored to these hotspot areas and their respective challenges. Both Aqqala and Gomishan require the immediate adoption of more sustainable agricultural practices, such as the introduction of drought-resistant plant varieties and improved irrigation efficiency to maximize the potential water use. Additionally, improved soil conservation practices can decrease the drought severity by increasing water retention and reducing erosion. In the SSP5-8.5 scenario, Maraveh Tappeh is projected to have about 72.09% of its area experiencing “very high” susceptibility to drought. Temperature rises, combined with reduced summer precipitation, can exacerbate the depletion of water for agricultural and ecosystem-related needs. Management strategies urgently need to be employed to manage the risks related to drought in Maraveh Tappeh. The isolation of high-drought-risk regions through drought-resistant agriculture would help to maintain productivity in the face of natural disasters. Enhanced water management through rainwater harvesting systems for additional irrigation during dry seasons would be prudent.
The involvement of the community is crucial in the area of Maraveh Tappeh, as the greatest benefits could be obtained by local stakeholders. This involvement could provide valuable insights into sustainable practices that are acceptable from both cultural and ecological perspectives. Local initiatives for soil conservation and vegetation restoration would significantly improve the resilience of the land to dry conditions. Thus, Maraveh Tappeh would benefit from adopting these interventions, as it would prepare the area for the expected drought conditions and make it more environmentally sustainable. Lastly, continuous monitoring and community engagement will be crucial. Enabling local communities to participate in decision-making processes regarding water resource management and raising their awareness of sustainable practices could greatly boost the adaptation capacity of the region. Therefore, interventions within these hotspots are of the utmost importance to ensure that Golestan Province achieves greater resilience against the increasing threats of climate change and land use.

4.9. Comparison with Other Works

The findings of this study align closely with a substantial body of global and regional research, while also contributing novel insights into the interplay of climate change and land use dynamics. Our projections of increased precipitation during winter and early spring, coupled with rising temperatures under all SSP scenarios, resonate with the global trends identified by Dai (2013), who highlighted the amplification of drought risks due to reduced warm-season precipitation and elevated evapotranspiration under global warming [9]. Similarly, Kirtman et al. (2013) emphasized heightened seasonal variability in the temperature and precipitation, which supports our observations of wetter winters and hotter, drier summers in Golestan Province [12]. At a regional level, studies such as Soltani et al. (2012) and Asakereh et al. (2023) similarly documented increasing precipitation variability and temperature trends across Iran, which correspond closely with our findings [6,14]. Moreover, Madani (2014) underscored Iran’s water management challenges, a perspective that complements our analysis of the dual threats of intensified winter rainfall and heightened summer drought conditions [7]. Our examination of land use changes, particularly the conversion of rangeland to bare land in Aqqala and Gomishan, aligns with the findings of Rahmati et al. (2019), who demonstrated the exacerbation of drought conditions through reduced groundwater recharge and increased surface runoff [17]. Furthermore, our integration of CMIP6 climate scenarios with land use projections represents a methodological advancement. While Wu et al. (2022) similarly coupled land use and climate models, their focus on habitat quality contrasts with our emphasis on drought susceptibility, demonstrating the broader applicability of such integrated frameworks [54].
Methodologically, our use of the MaxEnt model for drought susceptibility assessment is consistent with its widespread application in environmental modeling, as described by Phillips et al. (2006) and Elith et al. (2011) [45,46]. The model’s strong predictive performance in this study, with AUC values of 0.929 for training and 0.910 for testing, confirms its robustness in assessing complex environmental risks such as drought, comparable to its success in species distribution modeling. This reliability further underscores the strength of our predictive framework. In comparison to earlier studies, such as Zhao and Dai (2017), which addressed uncertainties in global drought projections, our approach provides a localized and integrated perspective by combining climate change scenarios with land use dynamics [26]. While most prior research in Iran, such as that of Soltani et al. (2012) and Morid et al. (2006), has focused on either climatic variables or land use changes in isolation, our study bridges these domains to offer a more comprehensive assessment of the future drought risks in Golestan Province [6,15]. This integration of spatiotemporal climate projections with land use modeling not only validates existing findings but also extends them by addressing critical gaps in understanding the multifaceted drivers of drought susceptibility.
In summary, the results of this study are well supported by previous works, yet they contribute important new insights into the interactions between climate and land use changes. This synthesis of global trends and localized impacts advances the discourse on drought risk assessment and highlights the pressing need for integrated management strategies tailored to regional vulnerabilities.

5. Conclusions

This study assessed Golestan’s drought risks, emphasizing climate change and land use shifts. By applying the MaxEnt model, we were able to produce high-resolution drought susceptibility maps, which identified current drought hotspots like Gomishan and Aqqala, and we forecasted severe future drought conditions under various climate scenarios. The model effectively predicts droughts, providing insights into regional challenges, including land degradation, water scarcity, urban expansion, climate change, and the loss of critical ecosystems, all of which contribute to the growing vulnerability of Golestan Province to severe drought conditions. The study emphasizes the critical role of climate change and the land use dynamics in exacerbating the drought risk. In particular, the conversion of rangelands to bare land in areas like Aqqala and Gomishan, combined with rising temperatures and declining summer rainfall, is expected to aggravate the drought conditions. Urbanization, particularly in areas like Bandar-e Torkman and Bandar Gaz, further exacerbates the situation by increasing surface runoff and decreasing groundwater recharge, placing more pressure on the already strained water resources. In response to these findings, this study advocates for urgent intervention in the most vulnerable regions, particularly Gomishan, Aqqala, Bandar-e Torkman, and Bandar Gaz, where land degradation, water scarcity, urban expansion, and climate change are the most pronounced. Sustainable water strategies, including efficient irrigation and rainwater harvesting, are crucial. Additionally, land restoration initiatives, including the rehabilitation of degraded rangelands and reforestation, are critical in improving soil moisture retention and reversing the trend of land degradation. Urban planning must also incorporate green infrastructure, such as permeable pavements and green roofs, to effectively manage stormwater and enhance groundwater recharge.
In conclusion, our study underscores the need for integrated regional policies that align local drought management with broader strategies for water resource resilience. Collaborative frameworks between neighboring regions could help to mitigate shared challenges arising from ecological degradation, resource scarcity, and climate-induced migration. Given the alarming trends observed in Golestan Province, future research should focus on the development of adaptive land management strategies tailored to the mitigation of drought risks. Future studies could explore the potential for climate-smart agriculture, innovative irrigation techniques, and real-time monitoring systems to improve the water use efficiency, as well as the roles of afforestation and reforestation in enhancing ecosystem resilience. Additionally, evaluating the long-term impacts of urbanization and land use changes on water resources and soil quality will be essential in designing integrated water management strategies. It is also crucial to explore community-based participatory approaches to drought management, ensuring that local populations are actively involved in the design and implementation of sustainable practices. Future studies should explore the interactions between social, hydrological, and agrometeorological droughts to provide a more holistic understanding of the drought dynamics in Golestan Province. Incorporating social aspects, such as the impacts on local communities and livelihoods, alongside hydrological changes and water availability, will enable a comprehensive approach to drought management.

Author Contributions

Conceptualization, J.L. and M.J.S.; methodology, J.L.; software, J.L. and E.S.; validation, M.J.S. and E.S.; formal analysis, J.L.; investigation, M.J.S. and E.S.; resources, M.J.S.; data curation, M.J.S.; writing—original draft preparation, J.L. and M.J.S.; writing—review and editing, J.L., M.L., R.L., M.J.S., Y.R. and E.S.; visualization, J.L. and M.L.; supervision, R.L. and M.J.S.; project administration, J.L. and M.J.S.; funding acquisition, J.L. and R.L. All authors have read and agreed to the published version of the manuscript.

Funding

This research was jointly funded by the National Key Research and Development Project (Grant No. 2021YFB3901203), the Key Laboratory of Mine Spatio-Temporal Information and Ecological Restoration, MNR (No. KLM202301), Henan Provincial Science and Technology Research (No. 242102320017), and the Henan Province Joint Fund Project of Science and Technology (No. 222103810097).

Data Availability Statement

The data presented in this study are available upon request from the corresponding author.

Conflicts of Interest

The authors declare no conflicts of interest.

References

  1. Wilhite, D.A.; Glantz, M.H. Understanding: The Drought Phenomenon: The Role of Definitions. Water Int. 1985, 10, 111–120. [Google Scholar] [CrossRef]
  2. Orimoloye, I.R.; Belle, J.A.; Orimoloye, Y.M.; Olusola, A.O.; Ololade, O.O. Drought: A Common Environmental Disaster. Atmosphere 2022, 13, 111. [Google Scholar] [CrossRef]
  3. Wilhite, D.A.; Buchanan-Smith, M. Drought as Hazard: Understanding the Natural and Social Context. Drought Water Cris. Sci. Technol. Manag. Issues 2005, 3, 29. [Google Scholar]
  4. Byron-Cox, R. From Desertification to Land Degradation Neutrality: The UNCCD and the Development of Legal Instruments for Protection of Soils. In Legal Instruments for Sustainable Soil Management in Africa; Springer: Berlin/Heidelberg, Germany, 2020; pp. 1–13. [Google Scholar]
  5. Wilhite, D.A.; Sivakumar, M.V.K.; Pulwarty, R. Managing Drought Risk in a Changing Climate: The Role of National Drought Policy. Weather. Clim. Extrem. 2014, 3, 4–13. [Google Scholar] [CrossRef]
  6. Soltani, S.; Saboohi, R.; Yaghmaei, L. Rainfall and Rainy Days Trend in Iran. Clim. Change 2012, 110, 187–213. [Google Scholar] [CrossRef]
  7. Madani, K. Water Management in Iran: What Is Causing the Looming Crisis? J. Environ. Stud. Sci. 2014, 4, 315–328. [Google Scholar] [CrossRef]
  8. Karimi, S.; Rahemi, M.; Rostami, A.A.; Sedaghat, S. Drought Effects on Growth, Water Content and Osmoprotectants in Four Olive Cultivars with Different Drought Tolerance. Int. J. Fruit Sci. 2018, 18, 254–267. [Google Scholar] [CrossRef]
  9. Dai, A. Increasing Drought under Global Warming in Observations and Models. Nat. Clim. Chang. 2013, 3, 52–58. [Google Scholar] [CrossRef]
  10. Yasuhara, M.; Cronin, T.M.; Peter, B.; Okahashi, H.; Linsley, B.K.; Yang, H.; Wang, Y.; Liu, Z.; Work Group II; Weaver, A.J.; et al. IPCC 2014. Impacts, Adaptation and Vulnerability—Europe. Clim. Dyn. 2014, 26, 661–668. [Google Scholar] [CrossRef]
  11. Masson-Delmotte, V.; Zhai, P.; Pirani, A.; Connors, S.L.; Péan, C.; Berger, S.; Caud, N.; Chen, Y.; Goldfarb, L.; Gomis, M.I. Climate Change 2021: The Physical Science Basis. Contrib. Work. Group I Sixth Assess. Rep. Intergov. Panel Clim. Change 2021, 2, 2391. [Google Scholar]
  12. Kirtman, B.; Power, S.B.; Adedoyin, A.J.; Boer, G.J.; Bojariu, R.; Camilloni, I.; Doblas-Reyes, F.; Fiore, A.M.; Kimoto, M.; Meehl, G. Near-Term Climate Change: Projections and Predictability. In Climate Change 2013: The Physical Science Basis. IPCC Working Group I Contribution to AR5; Cambridge University Press: Cambridge, UK, 2013. [Google Scholar]
  13. Silakhori, E.; Dahmardeh Ghaleno, M.R.; Meshram, S.G.; Alvandi, E. To Assess the Impacts of Climate Change on Runoff in Golestan Province, Iran. Nat. Hazards 2022, 112, 281–300. [Google Scholar] [CrossRef]
  14. Asakereh, H.; Masoodian, S.A.; Tarkarani, F.; Zandkarimi, S. Decadal Change of Iran’s Precipitation Regime. Pure Appl. Geophys. 2023, 180, 4275–4293. [Google Scholar] [CrossRef]
  15. Morid, S.; Smakhtin, V.; Moghaddasi, M. Comparison of Seven Meteorological Indices for Drought Monitoring in Iran. Int. J. Climatol. 2006, 26, 971–985. [Google Scholar] [CrossRef]
  16. Ghaffari, G.; Keesstra, S.; Ghodousi, J.; Ahmadi, H. SWAT-simulated hydrological impact of land-use change in the Zanjanrood basin, Northwest Iran. Hydrol. Process. Int. J. 2010, 24, 892–903. [Google Scholar] [CrossRef]
  17. Rahmati, O.; Samadi, M.; Shahabi, H.; Azareh, A.; Rafiei-Sardooi, E.; Alilou, H.; Melesse, A.M.; Pradhan, B.; Chapi, K.; Shirzadi, A. SWPT: An Automated GIS-Based Tool for Prioritization of Sub-Watersheds Based on Morphometric and Topo-Hydrological Factors. Geosci. Front. 2019, 10, 2167–2175. [Google Scholar] [CrossRef]
  18. Bhimala, K.R.; Rakesh, V.; Prasad, K.R.; Mohapatra, G.N. Identification of Vegetation Responses to Soil Moisture, Rainfall, and LULC over Different Meteorological Subdivisions in India Using Remote Sensing Data. Theor. Appl. Climatol. 2020, 142, 987–1001. [Google Scholar] [CrossRef]
  19. Kouassi, J.-L.; Gyau, A.; Diby, L.; Bene, Y.; Kouamé, C. Assessing Land Use and Land Cover Change and Farmers’ Perceptions of Deforestation and Land Degradation in South-West Côte d’Ivoire, West Africa. Land 2021, 10, 429. [Google Scholar] [CrossRef]
  20. Silakhori, E.; Maleki, S.; Pourghasemi, H.R. Spatiotemporal Variations in Land Use of Mahvelat Plain in Iran Using Google Earth Engine from 2011 to 2030. In Advanced Tools for Studying Soil Erosion Processes; Elsevier: Amsterdam, The Netherlands, 2024; pp. 413–433. [Google Scholar]
  21. Emadodin, I.; Reinsch, T.; Taube, F. Drought and Desertification in Iran. Hydrology 2019, 6, 66. [Google Scholar] [CrossRef]
  22. Avazpour, N.; Faramarzi, M.; Omidipour, R.; Mehdizadeh, H. Monitoring the Drought Effects on Vegetation Changes Using Satellite Imagery (Case Study: Ilam Catchment). Geogr. Environ. Sustain. 2021, 11, 125–143. [Google Scholar]
  23. Khaledian, Y.; Kiani, F.; Ebrahimi, S. The Effect of Land Use Change on Soil and Water Quality in Northern Iran. J. Mt. Sci. 2012, 9, 798–816. [Google Scholar] [CrossRef]
  24. Zare, M.; Samani, A.A.N.; Mohammady, M. The Impact of Land Use Change on Runoff Generation in an Urbanizing Watershed in the North of Iran. Environ. Earth Sci. 2016, 75, 1–20. [Google Scholar] [CrossRef]
  25. Keshtkar, M.; Mokhtari, Z.; Sayahnia, R. Impact of Land Use/land Cover Change on Soil Retention Service: A Case of Agricultural-Urbanized Landscape in Northern Iran. J. Landsc. Ecol. 2022, 15, 34–58. [Google Scholar] [CrossRef]
  26. Zhao, T.; Dai, A. Uncertainties in Historical Changes and Future Projections of Drought. Part II: Model-Simulated Historical and Future Drought Changes. Clim. Change 2017, 144, 535–548. [Google Scholar] [CrossRef]
  27. Taylor, K.E.; Stouffer, R.J.; Meehl, G.A. An Overview of CMIP5 and the Experiment Design. Bull. Am. Meteorol. Soc. 2012, 93, 485–498. [Google Scholar] [CrossRef]
  28. IPCC. Climate Change. The Physical Science Basis. Contribution of Working Group I to the Fourth Assessment Report of the Intergovernmental Panel on Climate Change; Cambridge University Press: Cambridge, UK, 2007; pp. 747–785. [Google Scholar]
  29. Eyring, V.; Bony, S.; Meehl, G.A.; Senior, C.A.; Stevens, B.; Stouffer, R.J.; Taylor, K.E. Overview of the Coupled Model Intercomparison Project Phase 6 (CMIP6) Experimental Design and Organization. Geosci. Model Dev. 2016, 9, 1937–1958. [Google Scholar] [CrossRef]
  30. Zhai, J.; Mondal, S.K.; Fischer, T.; Wang, Y.; Su, B.; Huang, J.; Tao, H.; Wang, G.; Ullah, W.; Uddin, M.J. Future Drought Characteristics through a Multi-Model Ensemble from CMIP6 over South Asia. Atmos. Res. 2020, 246, 105111. [Google Scholar] [CrossRef]
  31. Li, H.; Li, Z.; Chen, Y.; Liu, Y.; Hu, Y.; Sun, F.; Kayumba, P.M. Projected Meteorological Drought over Asian Drylands under Different CMIP6 Scenarios. Remote Sens. 2021, 13, 4409. [Google Scholar] [CrossRef]
  32. Yang, L.; Tian, J.; Fu, Y.; Zhu, B.; He, X.; Gao, M.; Odamtten, M.T.; Kong, R.; Zhang, Z. Will the Arid and Semi-Arid Regions of Northwest China Become Warmer and Wetter Based on CMIP6 Models? Hydrol. Res. 2022, 53, 29–50. [Google Scholar] [CrossRef]
  33. Yahaya, I.; Zhou, J.; Jiang, S.; Xu, R.H.; Huang, J.; Su, B.; Jing, C.; Qiu, F.; Jiang, T. Depiction of Drought Over Africa in the Light of Changing Climate from CMIP6 Models. Earth Syst. Environ. 2024, 8, 1011–1035. [Google Scholar] [CrossRef]
  34. Sierra-Soler, A.; Adamowski, J.; Qi, Z.; Saadat, H.; Pingale, S. High Accuracy Land Use Land Cover (LULC) Maps for Detecting Agricultural Drought Effects in Rainfed Agro-Ecosystems in Central Mexico. J. Water Land Dev. 2015, 26, 19–35. [Google Scholar] [CrossRef]
  35. Akinyemi, F.O. Vegetation Trends, Drought Severity and Land Use-Land Cover Change during the Growing Season in Semi-Arid Contexts. Remote Sens. 2021, 13, 836. [Google Scholar] [CrossRef]
  36. Patel, S.K.; Sharma, A.; Barla, A.; Singh, G.S. Traditional Farming in the Indian Himalayan Region: Preserving Agro-Biodiversity and Future Food Security. In The Resilience of Traditional Knowledge Systems for a Sustainable Future. Advances in Asian Human-Environmental Research; Springer: Cham, Switzerland, 2024; pp. 27–57. [Google Scholar]
  37. Gondim, R.; Silveira, C.; de Souza Filho, F.; Vasconcelos, F.; Cid, D. Climate Change Impacts on Water Demand and Availability Using CMIP5 Models in the Jaguaribe Basin, Semi-Arid Brazil. Environ. Earth Sci. 2018, 77, 550. [Google Scholar] [CrossRef]
  38. Xu, K.; Wu, C.; Zhang, C.; Hu, B.X. Uncertainty Assessment of Drought Characteristics Projections in Humid Subtropical Basins in China Based on Multiple CMIP5 Models and Different Index Definitions. J. Hydrol. 2021, 600, 126502. [Google Scholar] [CrossRef]
  39. Alemu, M.G.; Wubneh, M.A.; Worku, T.A.; Womber, Z.R.; Chanie, K.M. Comparison of CMIP5 Models for Drought Predictions and Trend Analysis over Mojo Catchment, Awash Basin, Ethiopia. Sci. Afr. 2023, 22, e01891. [Google Scholar] [CrossRef]
  40. El-Rawy, M.; Batelaan, O.; Al-Arifi, N.; Alotaibi, A.; Abdalla, F.; Gabr, M.E. Climate Change Impacts on Water Resources in Arid and Semi-Arid Regions: A Case Study in Saudi Arabia. Water 2023, 15, 606. [Google Scholar] [CrossRef]
  41. Dixit, S.; Atla, B.M.; Jayakumar, K. V Evolution and Drought Hazard Mapping of Future Meteorological and Hydrological Droughts Using CMIP6 Model. Stoch. Environ. Res. Risk Assess. 2022, 36, 3857–3874. [Google Scholar] [CrossRef]
  42. Ty, T.V.; Lavane, K.; Nguyen, P.C.; Downes, N.K.; Nam, N.D.G.; Minh, H.V.T.; Kumar, P. Assessment of Relationship between Climate Change, Drought, and Land Use and Land Cover Changes in a Semi-Mountainous Area of the Vietnamese Mekong Delta. Land 2022, 11, 2175. [Google Scholar] [CrossRef]
  43. Haider, S.; Masood, M.U.; Rashid, M.; Alshehri, F.; Pande, C.B.; Katipoğlu, O.M.; Costache, R. Simulation of the Potential Impacts of Projected Climate and Land Use Change on Runoff under CMIP6 Scenarios. Water 2023, 15, 3421. [Google Scholar] [CrossRef]
  44. Mohseni, U.; Agnihotri, P.G.; Pande, C.B.; Durin, B. Understanding the Climate Change and Land Use Impact on Streamflow in the Present and Future under CMIP6 Climate Scenarios for the Parvara Mula Basin, India. Water 2023, 15, 1753. [Google Scholar] [CrossRef]
  45. Phillips, S.J.; Anderson, R.P.; Schapire, R.E. Maximum Entropy Modeling of Species Geographic Distributions. Ecol. Modell. 2006, 190, 231–259. [Google Scholar] [CrossRef]
  46. Elith, J.; Phillips, S.J.; Hastie, T.; Dudík, M.; Chee, Y.E.; Yates, C.J. A Statistical Explanation of MaxEnt for Ecologists. Divers. Distrib. 2011, 17, 43–57. [Google Scholar] [CrossRef]
  47. Pérez Navarro, M.Á.; Sapes, G.; Batllori, E.; Serra-Diaz, J.M.; Esteve, M.A.; Lloret, F. Climatic Suitability Derived from Species Distribution Models Captures Community Responses to an Extreme Drought Episode. Ecosystems 2019, 22, 77–90. [Google Scholar] [CrossRef]
  48. Ghazipour, F.; Mahjouri, N. A Multi-Model Data Fusion Methodology for Seasonal Drought Forecasting under Uncertainty: Application of Bayesian Maximum Entropy. J. Environ. Manag. 2022, 304, 114245. [Google Scholar] [CrossRef] [PubMed]
  49. Eghtedarnezhad, M.; Malekinezhad, H.; Rafiei, E. Investigating the Effectiveness of the Maximum Entropy Model in Measuring the Potential of Areas Prone to Hydrological Drought of Underground Water Resources (Case Study: Jiroft Plain). Iran. J. Ecohydrol. 2024, 11, 105–124. [Google Scholar]
  50. Javidan, N.; Kavian, A.; Pourghasemi, H.R.; Conoscenti, C.; Jafarian, Z.; Rodrigo-Comino, J. Evaluation of Multi-Hazard Map Produced Using MaxEnt Machine Learning Technique. Sci. Rep. 2021, 11, 6496. [Google Scholar] [CrossRef] [PubMed]
  51. Soltanpour, H.; Serrhini, K.; Gill, J.C.; Fuchs, S.; Mohadjer, S. Multi-Hazard Susceptibility Mapping in the Karst Context Using a Machine-Learning Method (MaxEnt). EGUsphere 2024, 2024, 1–39. [Google Scholar]
  52. Orefice, S.; Innocenti, C. Regional Assessment of Coastal Landslide Susceptibility in Liguria, Northern Italy, Using MaxEnt. Nat. Hazards 2024, 1–27. [Google Scholar] [CrossRef]
  53. Qasimi, A.B.; Isazade, V.; Berndtsson, R. Flood Susceptibility Prediction Using MaxEnt and Frequency Ratio Modeling for Kokcha River in Afghanistan. Nat. Hazards 2024, 120, 1367–1394. [Google Scholar] [CrossRef]
  54. Wu, J.; Luo, J.; Zhang, H.; Qin, S.; Yu, M. Projections of Land Use Change and Habitat Quality Assessment by Coupling Climate Change and Development Patterns. Sci. Total Environ. 2022, 847, 157491. [Google Scholar] [CrossRef]
  55. Zougmoré, R.; Partey, S.; Ouédraogo, M.; Omitoyin, B.; Thomas, T.; Ayantunde, A.; Ericksen, P.; Said, M.; Jalloh, A. Toward Climate-Smart Agriculture in West Africa: A Review of Climate Change Impacts, Adaptation Strategies and Policy Developments for the Livestock, Fishery and Crop Production Sectors. Agric. Food Secur. 2016, 5, 1–16. [Google Scholar] [CrossRef]
  56. Gohari, A.; Mirchi, A.; Madani, K. System Dynamics Evaluation of Climate Change Adaptation Strategies for Water Resources Management in Central Iran. Water Resour. Manag. 2017, 31, 1413–1434. [Google Scholar] [CrossRef]
  57. Walker, W.E.; Haasnoot, M.; Kwakkel, J.H. Adapt or Perish: A Review of Planning Approaches for Adaptation under Deep Uncertainty. Sustainability 2013, 5, 955–979. [Google Scholar] [CrossRef]
  58. Hoseini Rostami, F.; Jahani, M.A. Analysis of Service Quality Gap between Perceptions and Expectations of Service Recipients Using SERVQUAL Approach in Selected Hospitals in Golestan Province. Iran. J. Health Sci. 2018, 6, 58–67. [Google Scholar] [CrossRef]
  59. Rahmati, M.; Mirás-Avalos, J.M.; Valsesia, P.; Davarynejad, G.H.; Bannayan, M.; Azizi, M.; Lescourret, F.; Génard, M.; Vercambre, G. Assessing the Effects of Water Stress on Peach Fruit Quality and Size Using the QualiTree Model. In Proceedings of the XXX International Horticultural Congress IHC2018: International Symposium on Cultivars, Rootstocks and Management Systems of 1281, Istanbul, Turkey, 12–16 August 2018; pp. 539–546. [Google Scholar]
  60. Ji, L.; Peters, A.J. Assessing Vegetation Response to Drought in the Northern Great Plains Using Vegetation and Drought Indices. Remote Sens. Environ. 2003, 87, 85–98. [Google Scholar] [CrossRef]
  61. Bajgiran, P.R.; Darvishsefat, A.A.; Khalili, A.; Makhdoum, M.F. Using AVHRR-Based Vegetation Indices for Drought Monitoring in the Northwest of Iran. J. Arid Environ. 2008, 72, 1086–1096. [Google Scholar] [CrossRef]
  62. Rousta, I.; Olafsson, H.; Moniruzzaman, M.; Zhang, H.; Liou, Y.-A.; Mushore, T.D.; Gupta, A. Impacts of Drought on Vegetation Assessed by Vegetation Indices and Meteorological Factors in Afghanistan. Remote Sens. 2020, 12, 2433. [Google Scholar] [CrossRef]
  63. Zhu, X.; Li, Q.; Guo, C. Evaluation of the Monitoring Capability of Various Vegetation Indices and Mainstream Satellite Band Settings for Grassland Drought. Ecol. Inform. 2024, 82, 102717. [Google Scholar] [CrossRef]
  64. Gitelson, A.A.; Kaufman, Y.J.; Merzlyak, M.N. Use of a Green Channel in Remote Sensing of Global Vegetation from EOS-MODIS. Remote Sens. Environ. 1996, 58, 289–298. [Google Scholar] [CrossRef]
  65. Crippen, R.E. Calculating the Vegetation Index Faster. Remote Sens. Environ. 1990, 34, 71–73. [Google Scholar] [CrossRef]
  66. Hunt, E.R., Jr.; Rock, B.N. Detection of Changes in Leaf Water Content Using near-and Middle-Infrared Reflectances. Remote Sens. Environ. 1989, 30, 43–54. [Google Scholar]
  67. Wang, L.; Qu, J.J. NMDI: A Normalized Multi-band Drought Index for Monitoring Soil and Vegetation Moisture with Satellite Remote Sensing. Geophys. Res. Lett. 2007, 34, L20405. [Google Scholar] [CrossRef]
  68. Rondeaux, G.; Steven, M.; Baret, F. Optimization of Soil-Adjusted Vegetation Indices. Remote Sens. Environ. 1996, 55, 95–107. [Google Scholar] [CrossRef]
  69. Zarco-Tejada, P.J.; Ustin, S.L. Modeling Canopy Water Content for Carbon Estimates from MODIS Data at Land EOS Validation Sites. In Proceedings of the IGARSS 2001. Scanning the Present and Resolving the Future. Proceedings. IEEE 2001 International Geoscience and Remote Sensing Symposium (Cat. No. 01CH37217), Sydney, NSW, Australia, 9–13 July 2001; Volume 1, pp. 342–344. [Google Scholar]
  70. Fensholt, R.; Sandholt, I. Derivation of a Shortwave Infrared Water Stress Index from MODIS near-and Shortwave Infrared Data in a Semiarid Environment. Remote Sens. Environ. 2003, 87, 111–121. [Google Scholar] [CrossRef]
  71. Jafari, R.; Lewis, M.M.; Ostendorf, B. Evaluation of Vegetation Indices for Assessing Vegetation Cover in Southern Arid Lands in South Australia. Rangel. J. 2007, 29, 39–49. [Google Scholar] [CrossRef]
  72. Milner, N. Advanced Spatial Regression Modeling of Corn and Soybean Yield with 30 Vegetation Indices Derived from a Sentinel-2 Time-Series; Southern Illinois University at Edwardsville: Edwardsville, IL, USA, 2021; ISBN 9798780611400. [Google Scholar]
  73. Alahacoon, N.; Edirisinghe, M. A Comprehensive Assessment of Remote Sensing and Traditional Based Drought Monitoring Indices at Global and Regional Scale. Geomat. Nat. Hazards Risk 2022, 13, 762–799. [Google Scholar] [CrossRef]
  74. Gislason, P.O.; Benediktsson, J.A.; Sveinsson, J.R. Random Forests for Land Cover Classification. Pattern Recognit. Lett. 2006, 27, 294–300. [Google Scholar] [CrossRef]
  75. Rodriguez-Galiano, V.F.; Ghimire, B.; Rogan, J.; Chica-Olmo, M.; Rigol-Sanchez, J.P. An Assessment of the Effectiveness of a Random Forest Classifier for Land-Cover Classification. ISPRS J. Photogramm. Remote Sens. 2012, 67, 93–104. [Google Scholar] [CrossRef]
  76. Phan, T.N.; Kuch, V.; Lehnert, L.W. Land Cover Classification Using Google Earth Engine and Random Forest classifier—The Role of Image Composition. Remote Sens. 2020, 12, 2411. [Google Scholar] [CrossRef]
  77. Rhee, J.; Im, J.; Carbone, G.J. Monitoring Agricultural Drought for Arid and Humid Regions Using Multi-Sensor Remote Sensing Data. Remote Sens. Environ. 2010, 114, 2875–2887. [Google Scholar] [CrossRef]
  78. Kogan, F.N. Application of Vegetation Index and Brightness Temperature for Drought Detection. Adv. Sp. Res. 1995, 15, 91–100. [Google Scholar] [CrossRef]
  79. Liu, W.T.; Kogan, F.N. Monitoring Regional Drought Using the Vegetation Condition Index. Int. J. Remote Sens. 1996, 17, 2761–2782. [Google Scholar] [CrossRef]
  80. Du, L.; Tian, Q.; Yu, T.; Meng, Q.; Jancso, T.; Udvardy, P.; Huang, Y. A Comprehensive Drought Monitoring Method Integrating MODIS and TRMM Data. Int. J. Appl. Earth Obs. Geoinf. 2013, 23, 245–253. [Google Scholar] [CrossRef]
  81. Räisänen, J.; Ruokolainen, L.; Ylhäisi, J. Weighting of Model Results for Improving Best Estimates of Climate Change. Clim. Dyn. 2010, 35, 407–422. [Google Scholar] [CrossRef]
  82. Xu, Z.P.; Li, Y.P.; Huang, G.H.; Wang, S.G.; Liu, Y.R. A Multi-Scenario Ensemble Streamflow Forecast Method for Amu Darya River Basin under Considering Climate and Land-Use Changes. J. Hydrol. 2021, 598, 126276. [Google Scholar] [CrossRef]
  83. Voldoire, A.; Saint-Martin, D.; Sénési, S.; Decharme, B.; Alias, A.; Chevallier, M.; Colin, J.; Guérémy, J.; Michou, M.; Moine, M. Evaluation of CMIP6 Deck Experiments with CNRM-CM6-1. J. Adv. Model. Earth Syst. 2019, 11, 2177–2213. [Google Scholar] [CrossRef]
  84. John, J.G.; Blanton, C.; McHugh, C.; Radhakrishnan, A.; Rand, K.; Vahlenkamp, H.; Wilson, C.; Zadeh, N.T.; Dunne, J.P.; Dussin, R. Noaa-Gfdl Gfdl-esm4 Model Output Prepared for cmip6 Scenariomip; World Data Center for Climate: Hamburg, Germany, 2018. [Google Scholar]
  85. Good, P. MOHC HadGEM3-GC31-LL Model Output Prepared for CMIP6 ScenarioMIP; World Data Center for Climate: Hamburg, Germany, 2019. [Google Scholar]
  86. Jungclaus, J.; Mikolajewicz, U.; Kapsch, M.-L.; D’Agostino, R.; Wieners, K.-H.; Giorgetta, M.; Reick, C.; Esch, M.; Bittner, M.; Legutke, S. MPI-M MPIESM1. 2-LR Model Output Prepared for CMIP6 PMIP; World Data Center for Climate: Hamburg, Germany, 2019. [Google Scholar]
  87. Yukimoto, S.; Koshiro, T.; Kawai, H.; Oshima, N.; Yoshida, K.; Urakawa, S.; Tsujino, H.; Deushi, M.; Tanaka, T.; Hosaka, M. MRI MRI-ESM2. 0 Model Output Prepared for CMIP6 ScenarioMIP; World Data Center for Climate: Hamburg, Germany, 2019. [Google Scholar]
  88. Chen, W.; Pourghasemi, H.R.; Kornejady, A.; Zhang, N. Landslide Spatial Modeling: Introducing New Ensembles of ANN, MaxEnt, and SVM Machine Learning Techniques. Geoderma 2017, 305, 314–327. [Google Scholar] [CrossRef]
  89. Kornejady, A.; Kouchaki, E.; Boustan, A.; Pourghasemi, H.R.; Sadeghinia, M.; Heidari, A. Multihazard Risk Analysis and Governance across a Provincial Capital in Northern Iran. In Computers in Earth and Environmental Sciences; Elsevier: Amsterdam, The Netherlands, 2022; pp. 655–673. [Google Scholar]
  90. Seidenfeld, T. Entropy and Uncertainty. Philos. Sci. 1986, 53, 467–491. [Google Scholar] [CrossRef]
  91. Karmeshu, A.; Pal, N.R. Uncertainty, Entropy and Maximum Entropy Principle—An Overview. In Entropy Measures, Maximum Entropy Principle and Emerging Applications; Springer: Berlin/Heidelberg, Germany, 2003; pp. 1–78. [Google Scholar]
  92. Merow, C.; Smith, M.J.; Silander, J.A., Jr. A Practical Guide to MaxEnt for Modeling Species’ Distributions: What It Does, and Why Inputs and Settings Matter. Ecography 2013, 36, 1058–1069. [Google Scholar] [CrossRef]
  93. Verbakel, J.Y.; Steyerberg, E.W.; Uno, H.; De Cock, B.; Wynants, L.; Collins, G.S.; Van Calster, B. ROC Curves for Clinical Prediction Models Part 1. ROC Plots Showed No Added Value above the AUC When Evaluating the Performance of Clinical Prediction Models. J. Clin. Epidemiol. 2020, 126, 207–216. [Google Scholar] [CrossRef]
  94. Hou, S.; Liu, Y.; Yang, Q. Real-Time Prediction of Rock Mass Classification Based on TBM Operation Big Data and Stacking Technique of Ensemble Learning. J. Rock Mech. Geotech. Eng. 2022, 14, 123–143. [Google Scholar] [CrossRef]
  95. Zhou, Y.; Wu, W.; Wang, H.; Zhang, X.; Yang, C.; Liu, H. Identification of Soil Texture Classes under Vegetation Cover Based on Sentinel-2 Data with SVM and SHAP Techniques. IEEE J. Sel. Top. Appl. Earth Obs. Remote Sens. 2022, 15, 3758–3770. [Google Scholar] [CrossRef]
  96. Jenks, Y.F. The data model concept in statistical mapping. Int. Yearb. Cartogr. 1967, 7, 186–190. [Google Scholar]
  97. Ayalew, L.; Yamagishi, H. The application of GIS-based logistic regression for landslide susceptibility mapping in the Kakuda-Yahiko Mountains, Central Japan. Geomorphology 2005, 65, 15–31. [Google Scholar] [CrossRef]
  98. Akgun, A. A comparison of landslide susceptibility maps produced by logistic regression, multi-criteria decision, and likelihood ratio methods: A case study at İzmir, Turkey. Landslides 2012, 9, 93–106. [Google Scholar] [CrossRef]
Figure 1. Flowchart showing the procedures adopted in this study (GNDVI: Green Normalized Difference Vegetation Index; IPVI: Infrared Percentage Vegetation Index; MSI: Moisture Stress Index; NMDI: Normalized Multi-Band Drought Index; OSAVI: Optimized Soil-Adjusted Vegetation Index; RVI: Ratio-Based Vegetation Index; SRWI: Simple Ratio Water Index; SIWSI: Soil Moisture Stress Index; SRVI: Stress-Related Vegetation Index; TVI: Transformed Vegetation Index; LULC: Land Use and Land Cover; SDCI: Standardized Drought Condition Index; CA-Markov: Cellular Automata-Markov Chain; SSP: Shared Socioeconomic Pathways; LARS-WG: Long Ashton Research Station Weather Generator).
Land 14 00337 g001
Figure 2. Location of the study area in Iran and the distribution of various meteorological stations used to map precipitation and temperature (the labeled projection stations refer to the synoptic and evaporation stations employed for the downscaling of future climate change data).
Land 14 00337 g002
Figure 3. Monthly projected climate change data for Gorgan, including (a) mean monthly precipitation (mm), (b) mean monthly minimum temperature (°C), and (c) mean monthly maximum temperature (°C), and for Inceh Borun station, including (d) mean monthly precipitation (mm), (e) mean monthly minimum temperature (°C), and (f) mean monthly maximum temperature (°C).
Land 14 00337 g003
Figure 4. Mean annual projected climate change data for (a) precipitation (mm), (b) minimum temperature (°C), and (c) maximum temperature (°C) across stations.
Land 14 00337 g004
Figure 5. Annual changes in precipitation and maximum and minimum temperature under future climate change scenarios compared to the current conditions (the light to dark color palette indicates the range from low to amplified percentage changes).
Land 14 00337 g005
Figure 6. Spatial distribution maps of precipitation and minimum and maximum temperatures under current and future climate change scenarios.
Land 14 00337 g006
Figure 7. Schematic comparison of projected areal shifts in land use classes from 2022 to 2030–2050.
Land 14 00337 g007
Figure 8. Spatial maps of land use classes for the years 2022 (a) and 2030–2050 (b).
Land 14 00337 g008
Figure 9. Jackknife test results for the MaxEnt model, showing the contributions of various environmental factors to drought susceptibility modeling.
Land 14 00337 g009
Figure 10. ROC curves from the MaxEnt model for the training and test stages of drought susceptibility modeling.
Land 14 00337 g010
Figure 11. The SDCI map of Golestan Province, along with 500 sample points, which served as evidence of agrometeorological drought.
Land 14 00337 g011
Figure 12. Drought susceptibility maps of Golestan Province for the current (a), SSP1-2.6 (b), SSP2-4.5 (c), and SSP5-8.5 (d) scenarios.
Land 14 00337 g012
Table 1. Detailed descriptions and formulas of the remote sensing indices used as drought-controlling factors.
Index NameDescriptionFormulaReference
Green Normalized Difference Vegetation Index (GNDVI)GNDVI is an index used to evaluate the health and greenness of vegetation. It primarily measures the chlorophyll content in leaves, which decreases during drought conditions. G N D V I = N I R G r e e n N I R + G r e e n [64]
Infrared Percentage Vegetation Index (IPVI)IPVI is a simple vegetation index focusing on the percentage of infrared reflectance. Vegetation health can be inferred from the balance between infrared and visible light reflected by plant surfaces. I P V I = N I R N I R + R e d [65]
Moisture Stress Index (MSI)MSI is a reflectance measurement, sensitive to increases in leaf water content. It is applicable for densely vegetated areas and is more sensitive at the canopy level rather than the leaf level. M S I = S W I R 2 N I R [66]
Normalized Multi-Band Drought Index (NMDI)NMDI is used to monitor the water content in vegetation and soil, making it highly relevant in detecting droughts. It leverages both near-infrared (NIR) and shortwave infrared (SWIR) bands. N M D I = N I R ( S W I R 1 S W I R 2 ) N I R + S W I R 1 + S W I R 2 [67]
Optimized Soil-Adjusted Vegetation Index (OSAVI)OSAVI is a modification of NDVI, designed to reduce soil brightness influences. It works well in environments with minimal vegetation cover, helping to accurately assess vegetation health. O S A V I = ( N I R R e d ) ( N I R + R e d + 0.16 ) [68]
Ratio-Based Vegetation Index (RVI)RVI is a straightforward vegetation index comparing near-infrared and red reflectance, providing a ratio that correlates with vegetation health. R V I = N I R R e d [69]
Simple Ratio Water Index (SRWI)SRWI is designed to detect moisture levels in vegetation and soil, particularly in water-stressed environments. S R W I = N I R S W I R 1 [69]
Soil Moisture Stress Index (SIWSI)SIWSI measures water stress by combining information from the near-infrared and shortwave infrared bands. S I W S I = ( S W I R 1 N I R ) ( S W I R 1 + N I R ) [70]
Stress-Related Vegetation Index (SRVI)SRVI is sensitive to stress in vegetation and can detect early signs of drought stress before visible symptoms appear. S R V I = M I R + ( R e d N I R ) [71,72]
Transformed Vegetation Index (TVI)TVI is a normalized vegetation index that helps to reduce atmospheric effects, making it more robust under variable conditions. T V I = ( S W I R 1 R e d ) ( S W I R 1 + R e d ) [73]
Table 2. Detailed descriptions and formulas of the SDCI and its constituents (TCI, VCI, and PCI).
Index NameDescriptionFormulaReference
Standardized Drought Condition Index (SDCI)The SDCI is an integrated index that combines multiple drought-related factors to provide a comprehensive assessment of drought conditions. S D C I = 0.25 × T C I + 0.25 × V C I + 0.50 × P C I [77]
Temperature Condition Index (TCI)TCI assesses vegetation stress due to temperature extremes, helping to identify areas impacted by heat stress or cooling deficits. T C I = L S T m a x L S T i L S T m a x L S T m i n [78]
Vegetation Condition Index (VCI)VCI evaluates vegetation health and stress using satellite-derived Normalized Difference Vegetation Index (NDVI) values. V C I = N D V I i N D V I m i n N D V I m a x N D V I m i n [79]
Precipitation Condition Index (PCI)PCI measures precipitation anomalies to identify areas experiencing drought or excess rainfall. P C I = T R M M T R M M m i n T R M M m a x T R M M m i n [80]
Table 3. Description of the CMIP6 models used in this study.
ModelModeling CenterResolution (Atmosphere)
Latitude × Longitude
Reference
CNRM-CM6-1Centre National de Recherches Meteorologiques/Centre Europeen de Recherche et Formation Avancees en Calcul Scientifique1.4° × 1.4°[83]
GFDL-ESM4Geophysical Fluid Dynamics Laboratory (GFDL), USA1.25° × 1.0°[84]
HadGEM3-GC31-LLMeteorological Office Hadley Centre, UK 1.88° × 1.25°[85]
MPI-ESM1-2-LRMeteorological Research Institute, Japan1.9° × 1.9°[86]
MRI-ESM2.0Meteorological Research Institute, Japan1.0° × 1.0°[87]
Table 4. Areal changes in land use classes from the current conditions (2022) to future projections (2023–2050). Units are ha.
ClassLand Use2022 (ha)2030–2050 (ha)Percent ChangeAreal Change (ha)
1Forest339,409338,110−0.06−1299
2Rangeland708,347651,052−2.83−57,295
3Agricultural805,055747,267−2.85−57,788
4Bare land123,473229,6755.24106,202
5Water body721011,9200.234710
6Wetland88187878−0.05−940
7Built-up35,80142,2210.326420
Table 5. Land use change projections and the suggested management strategies for different counties of Golestan Province (Alternating row colors were applied to improve visual separation and readability).
CountyLand Use ChangeStatus
Ali AbadForestSlight increase (+0.34%) from 45.79% to 46.13%Ali-Abad’s forest area is well preserved, with a slight increase projected, which should help to buffer hydrological drought by maintaining water retention and reducing surface runoff. However, the increase in bare land (+0.30%) is concerning, as this trend could exacerbate agricultural drought by reducing the productive land available for farming. The rise in agricultural land may reflect increased irrigation needs, which could place pressure on local water resources. With Ali Abad located centrally, near the forested and agricultural heart of the province, its stable forest cover will mitigate some drought effects, but land degradation (bare land) must be addressed to avoid worsening conditions.
RangelandDecrease (−1.62%)
AgriculturalIncrease (+0.60%)
Bare LandSignificant rise from 0.07% to 0.37%
AqqalaRangelandSubstantial decline from 7.21% to 2.32%Aqqala faces severe degradation, with rangeland loss (−4.89%) and an alarming increase in bare land (+12.45%). Aqqala’s location in the northern plains, which is prone to drought and aridification, exacerbates this trend. The significant decrease in agricultural land reflects the impact of increasing drought severity, as water shortages likely make farming unsustainable. The bare land expansion directly correlates with worsening agricultural and hydrological drought, and climate projections from nearby stations likely indicate drier future conditions, requiring urgent intervention to halt desertification.
AgriculturalDecrease (−7.13%)
Bare LandSignificant rise from 13.68% to 26.13%
AzadshahrRangelandDecrease (−1.09%)Azadshahr’s moderate rangeland decrease and slight agricultural increase suggest a transition in land use towards farming, but the rise in bare land signals potential soil degradation. This county, located in the southeast, is prone to drought stress due to climate variability. The increase in bare land may be driven by reduced rainfall and rising temperatures projected for nearby synoptic stations, pushing the land towards more desert-like conditions. The conservation of the remaining rangelands will be crucial to maintain moisture in the soil and prevent the further expansion of degraded areas.
AgriculturalSlight increase (+0.62%)
Bare LandIncrease from 0.28% to 0.44%
Bandar GazForestSlight decrease (−0.28%)Urbanization in Bandar Gaz, located along the Caspian Sea, is notable, with a +0.60% increase in built-up areas. This rise, along with the small reduction in forest and agricultural lands, could worsen hydrological drought due to increased impermeable surfaces (urban areas) that reduce groundwater recharge. Although forest loss is minimal, the rising urban footprint suggests that the water demand and management issues could become more severe as climate change leads to warmer temperatures and more erratic rainfall patterns.
AgriculturalMinimal decrease (−0.50%)
Built-upRise from 5.57% to 6.17%
Bandar-e TorkmanAgriculturalSlight decrease (−0.63%)Bandar-e Torkman, another Caspian coastal area, shows a steady expansion in urban areas (+0.73%) and a small increase in bare land (+0.03%), while agricultural land shrinks slightly. Although the changes are not dramatic, this county’s strong dependence on agriculture makes even minor land use shifts critical. With projections of rising temperatures and altered precipitation patterns in the coastal zones, agricultural drought could intensify, particularly if water resources are strained by expanding urbanization. Efforts to improve urban water management and protect agricultural land from overuse will be vital.
Bare LandSmall increase (+0.03%)
Built-upIncrease from 6.28% to 7.01%
GalikeshForestSlight increase (+0.17%)Galikesh, situated near the Alborz Mountains, retains a large forested area, which sees a small increase (+0.17%), helping to stabilize the local hydrological cycle. However, the reduction in rangeland (−2.60%) and the increase in agricultural land (+2.21%) point to intensifying land use pressures, likely driven by an increasing demand for farming. Given Galikesh’s mountainous geography, changes in climate (precipitation and temperature) will have a pronounced effect on the agricultural drought risk, especially if rainfall patterns shift and temperatures rise.
RangelandSharp decline (−2.60%)
AgriculturalIncrease (+2.21%)
GomishanRangelandSharp decline (−7.84%)Gomishan experiences one of the most dramatic shifts, with a large increase in bare land (+13.24%) and a steep reduction in rangeland (−7.84%). This county, located in the low-lying coastal areas of the province, is vulnerable to land degradation and salinization due to its proximity to the Caspian Sea. The increase in water bodies (+5.11%) may reflect rising water levels or changes in water management, but it is not enough to offset the effects of widespread land degradation. These trends suggest a growing risk of desertification and hydrological drought due to increased bare land exposure.
Bare LandLarge increase (+13.24%)
Water BodiesSignificant rise (+5.11%)
Gonbad-e KavusRangelandDecrease (−2.04%)Gonbad-e Kavus, a central agricultural hub, shows one of the largest bare land increases (+11.44%), coupled with a sharp decline in agricultural land (−9.27%). These changes indicate a strong correlation between increasing agricultural drought and the degradation of farmland into bare land, which exacerbates water scarcity issues. Rangeland also sees a notable decline (−2.04%), further highlighting the challenges faced by this region. The high degree of land degradation points to rising temperatures and reduced rainfall contributing to worsening drought conditions.
AgriculturalLarge decline (−9.27%)
Bare LandSignificant rise from 9.96% to 21.40%
GorganRangelandDecrease (−2.55%)As the provincial capital, Gorgan shows a balance between urban expansion and land use changes. The rise in bare land (+0.54%) and reduction in rangeland (−2.55%) suggest increasing pressure on the available land, while agriculture expands slightly. The city’s location near the Alborz foothills suggests that the increase in bare land could lead to hydrological drought, as urbanization and reduced rangeland disrupt natural water retention mechanisms.
AgriculturalIncrease (+1.48%)
Bare LandIncrease (+0.54%)
KalalehModerate rangeland decline (−2.97%), with an increase in agricultural land (+2.86%)This shift may lead to a heightened drought risk as land degradation continues.
KordkuySmall but important rise in bare land (+0.39%)It indicates growing degradation, with slight reductions in forest and rangeland.
Maraveh TappehSignificant bare land expansion (+2.62%)It signals increasing vulnerability to drought, particularly as rangelands shrink.
Minudasht and RamiyanSmall increases in forest and agricultural land but some declines in rangelandThese counties show moderate stability. Minimal bare land expansion helps to maintain local drought resilience.
Disclaimer/Publisher’s Note: The statements, opinions and data contained in all publications are solely those of the individual author(s) and contributor(s) and not of MDPI and/or the editor(s). MDPI and/or the editor(s) disclaim responsibility for any injury to people or property resulting from any ideas, methods, instructions or products referred to in the content.

