
Spatiotemporal Coupling of New-Type Urbanization and Ecosystem Services in the Huaihe River Basin, China: Heterogeneity and Regulatory Strategy

Abstract
1. Introduction
2. Materials and Methods
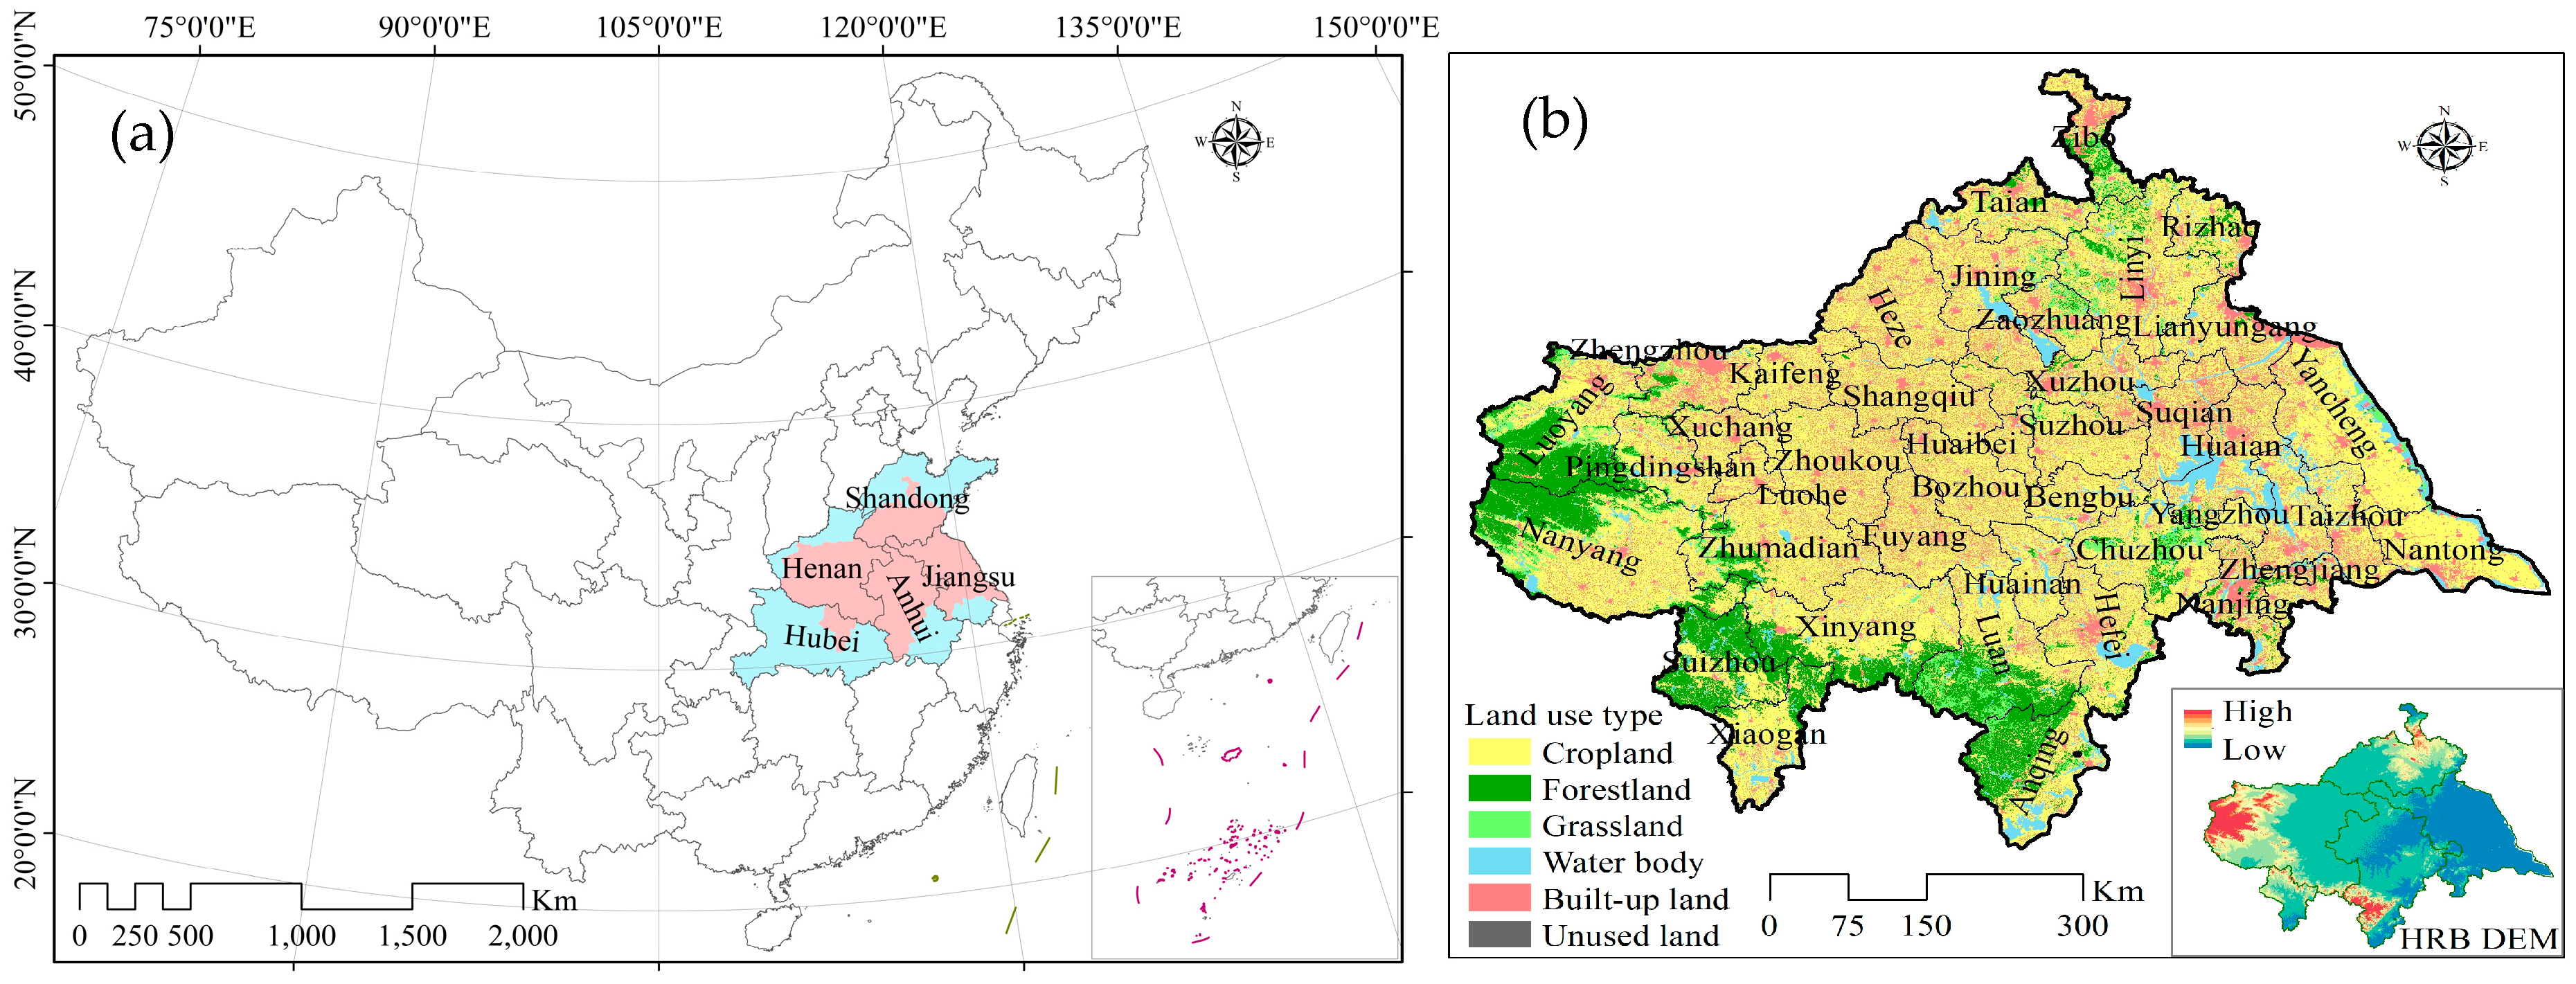
2.1. Study Area
2.2. Data Sources and Processing
2.3. ES Value
2.4. Comprehensive Index Method and Coupling Coordination Degree
2.5. GeoDetector
2.6. Multi-Scenario Simulations
2.6.1. Principles of PLUS Simulation Model
2.6.2. Neighborhood Coefficient and Multi-Scenario Setup for PLUS Model
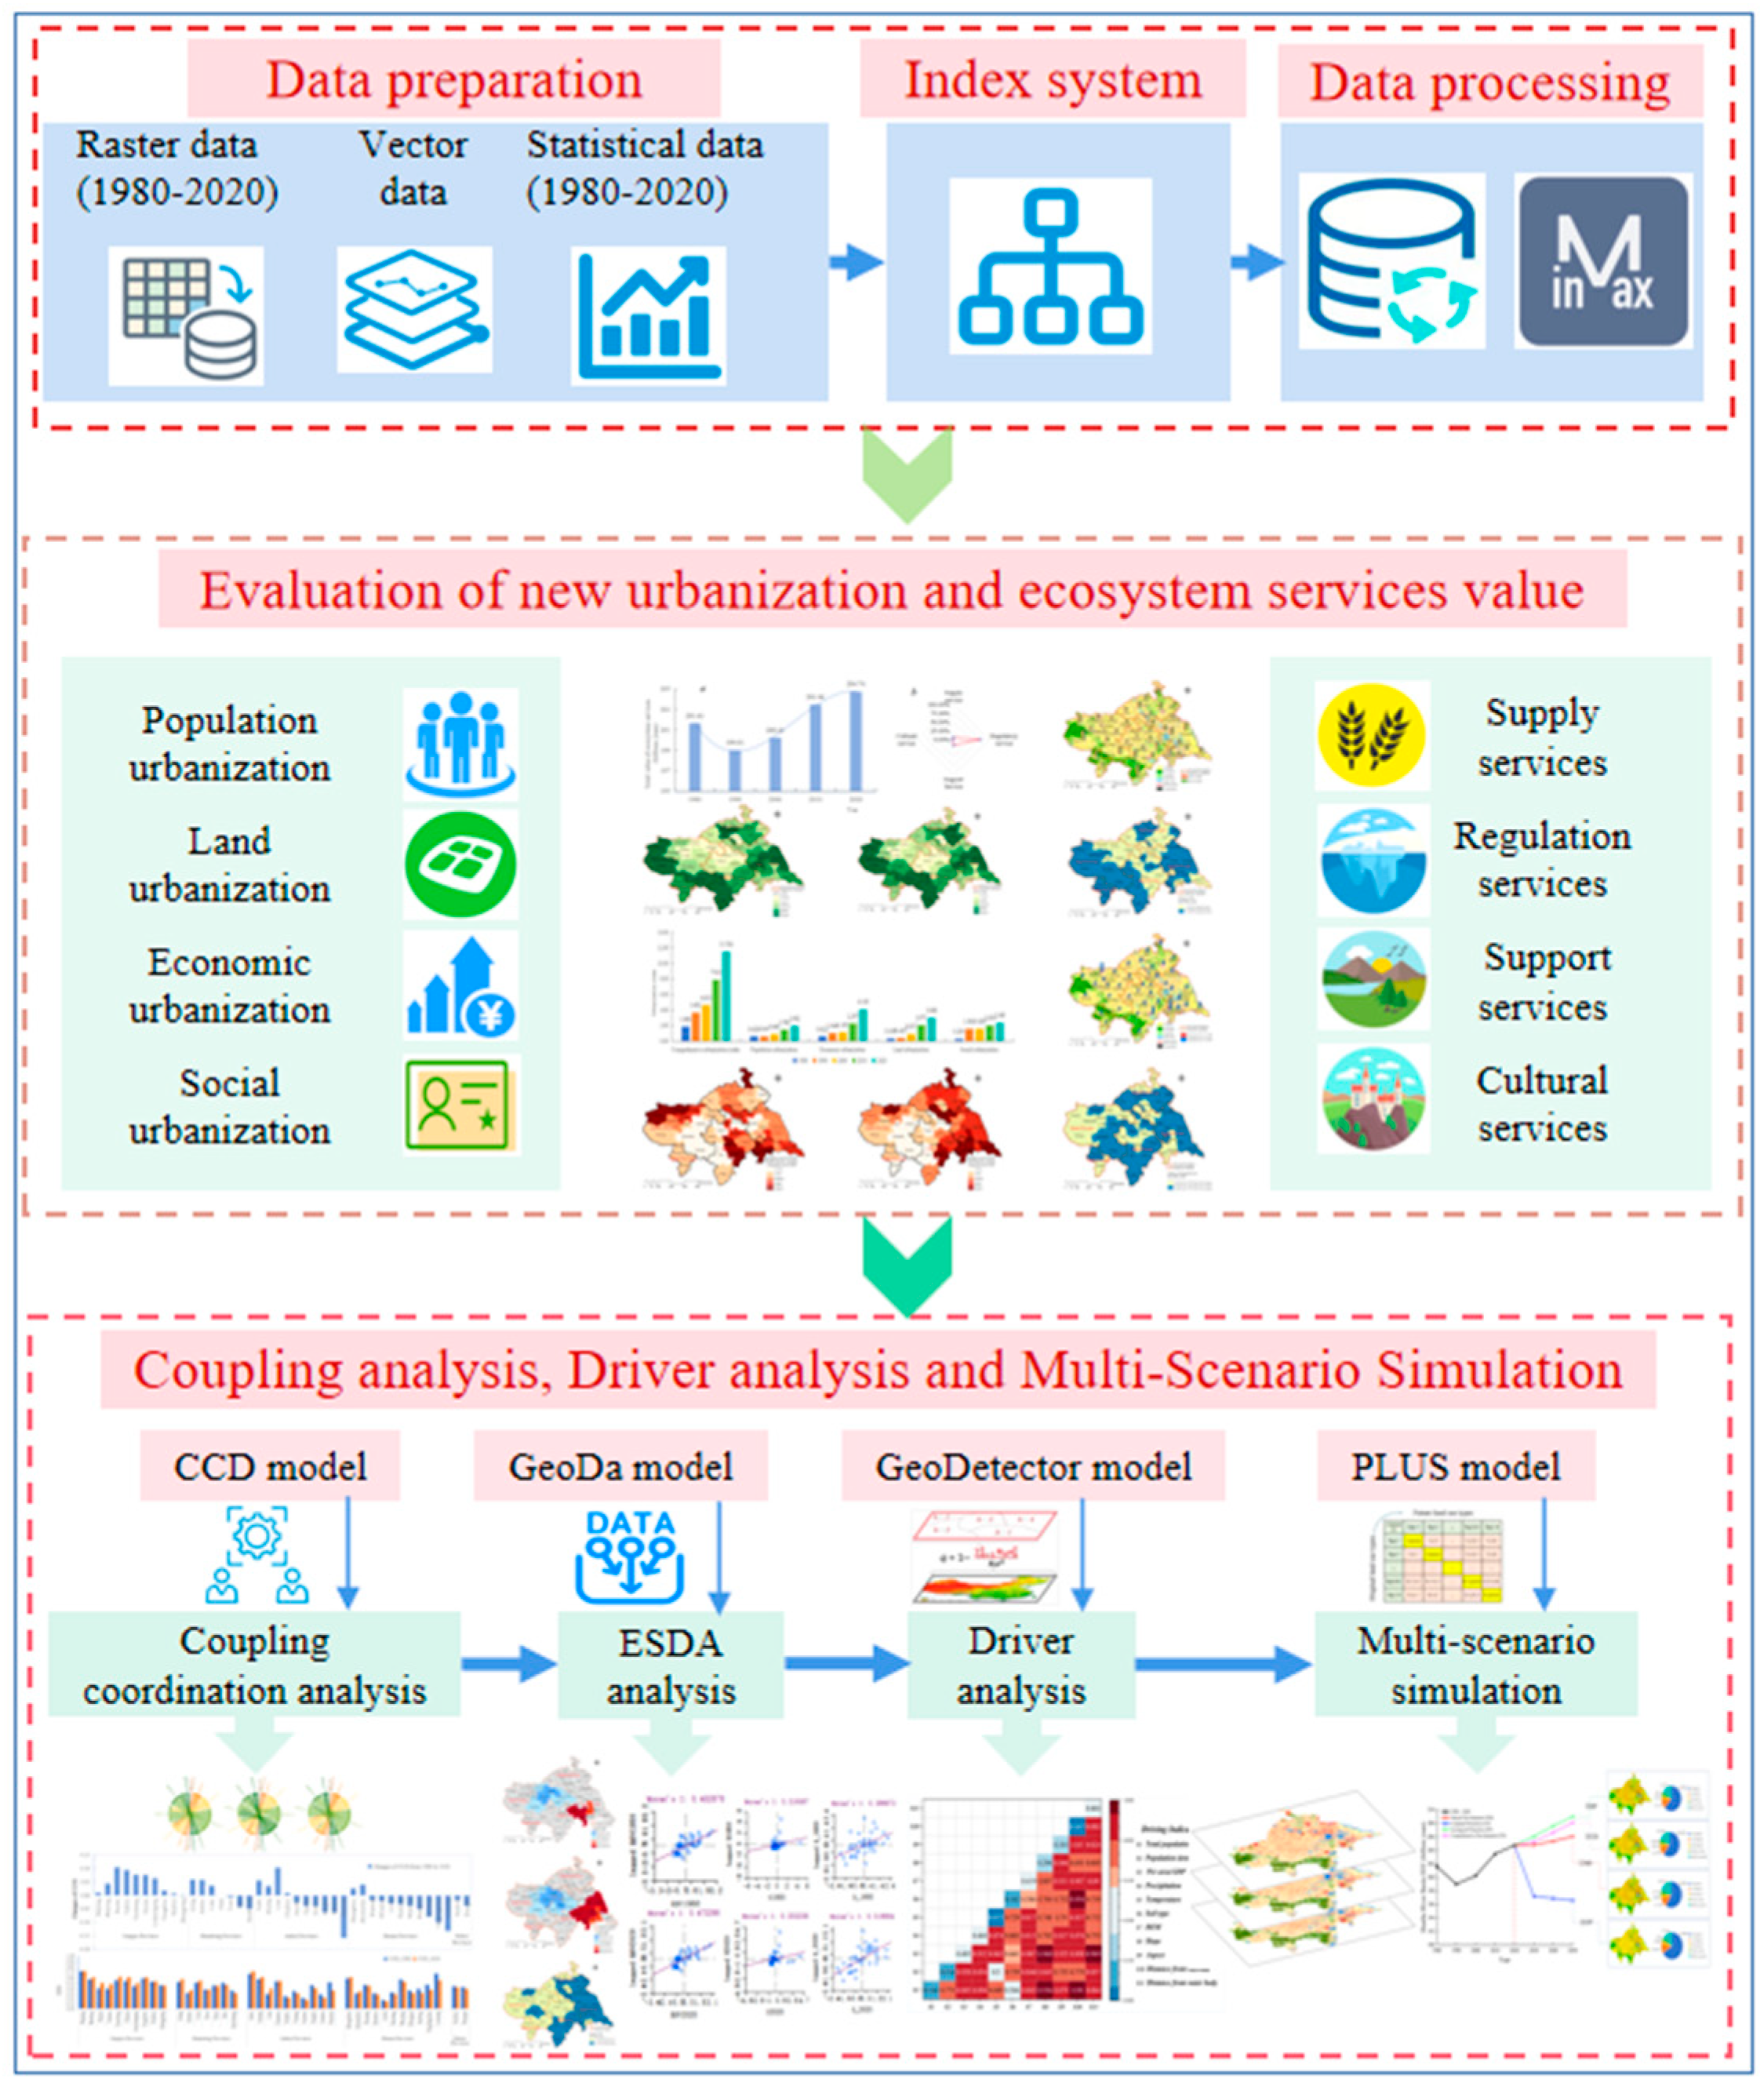
2.7. Technology Roadmap
3. Results
3.1. Dynamic Analysis of the ES Value and New Urbanization
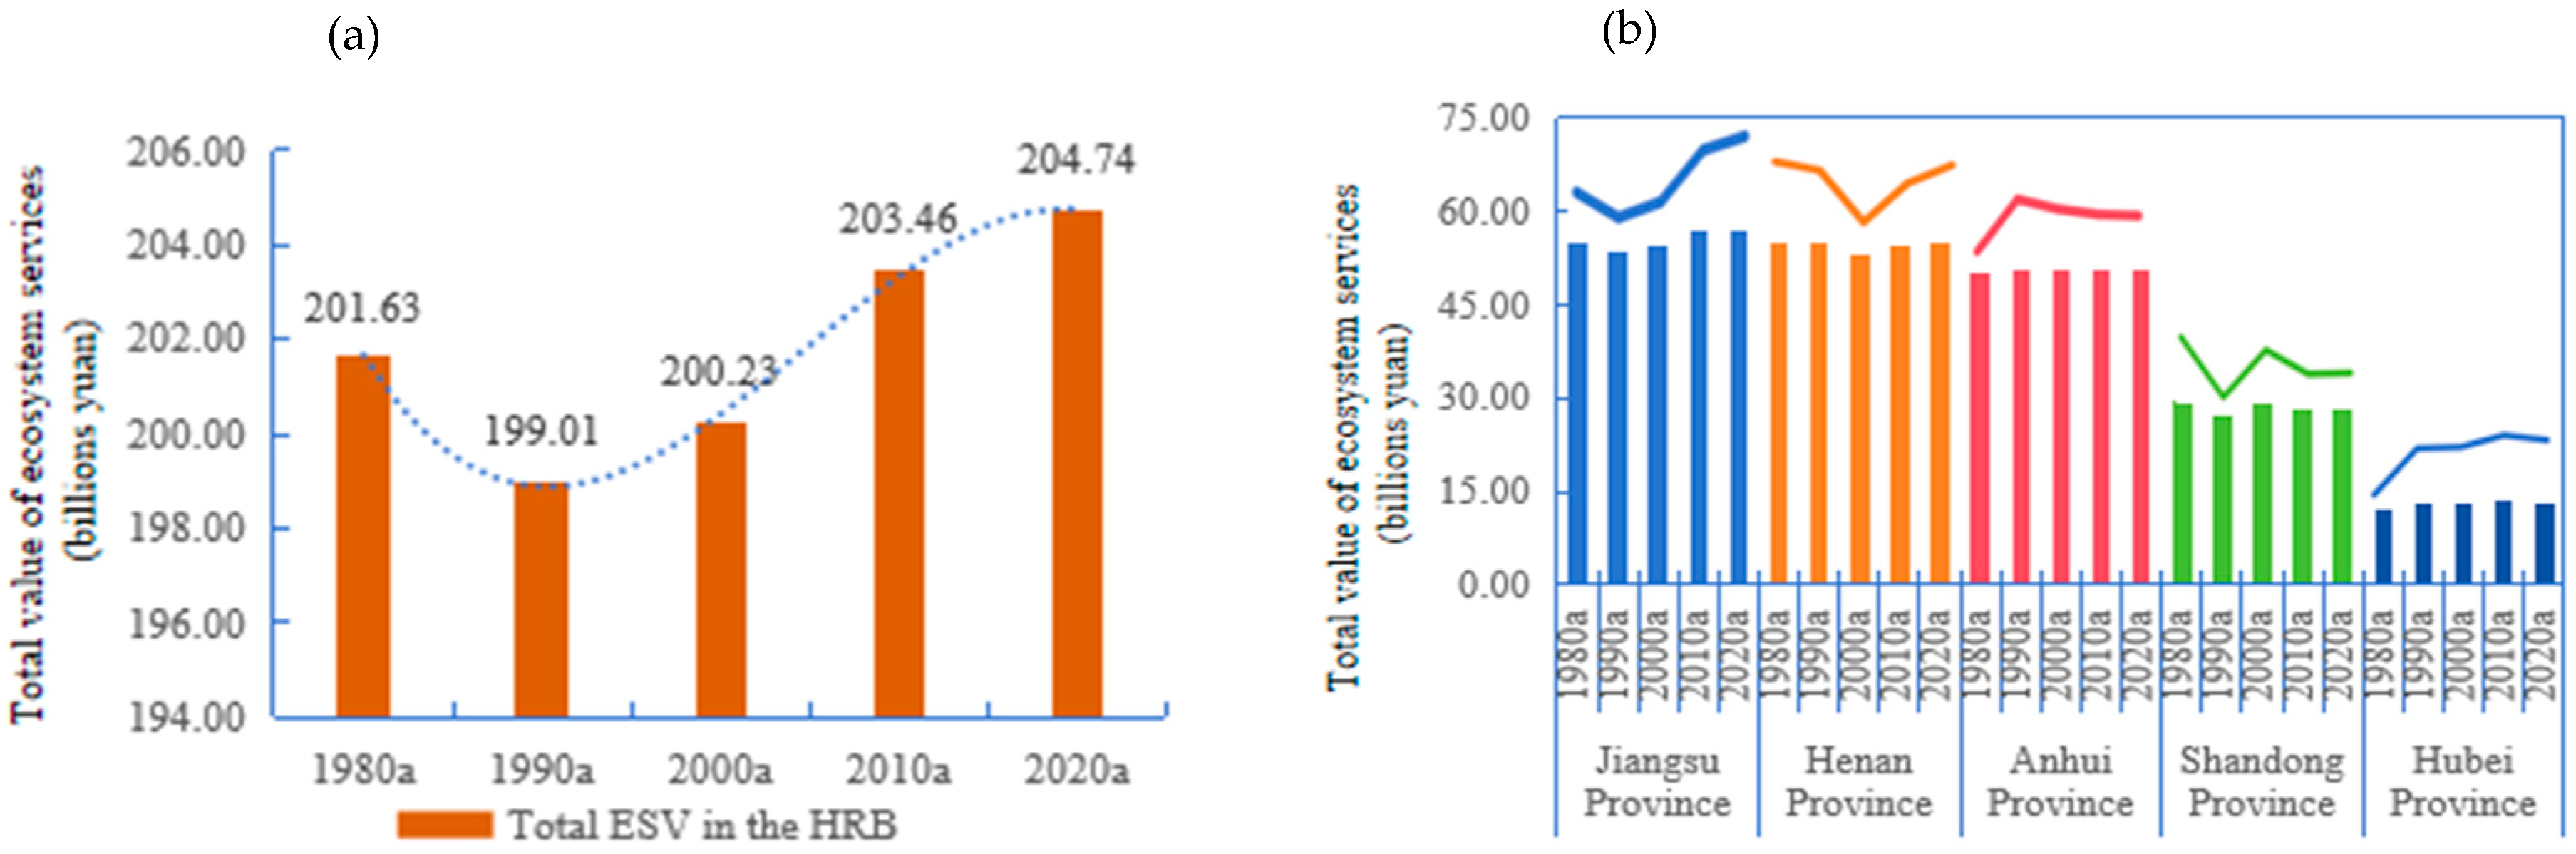
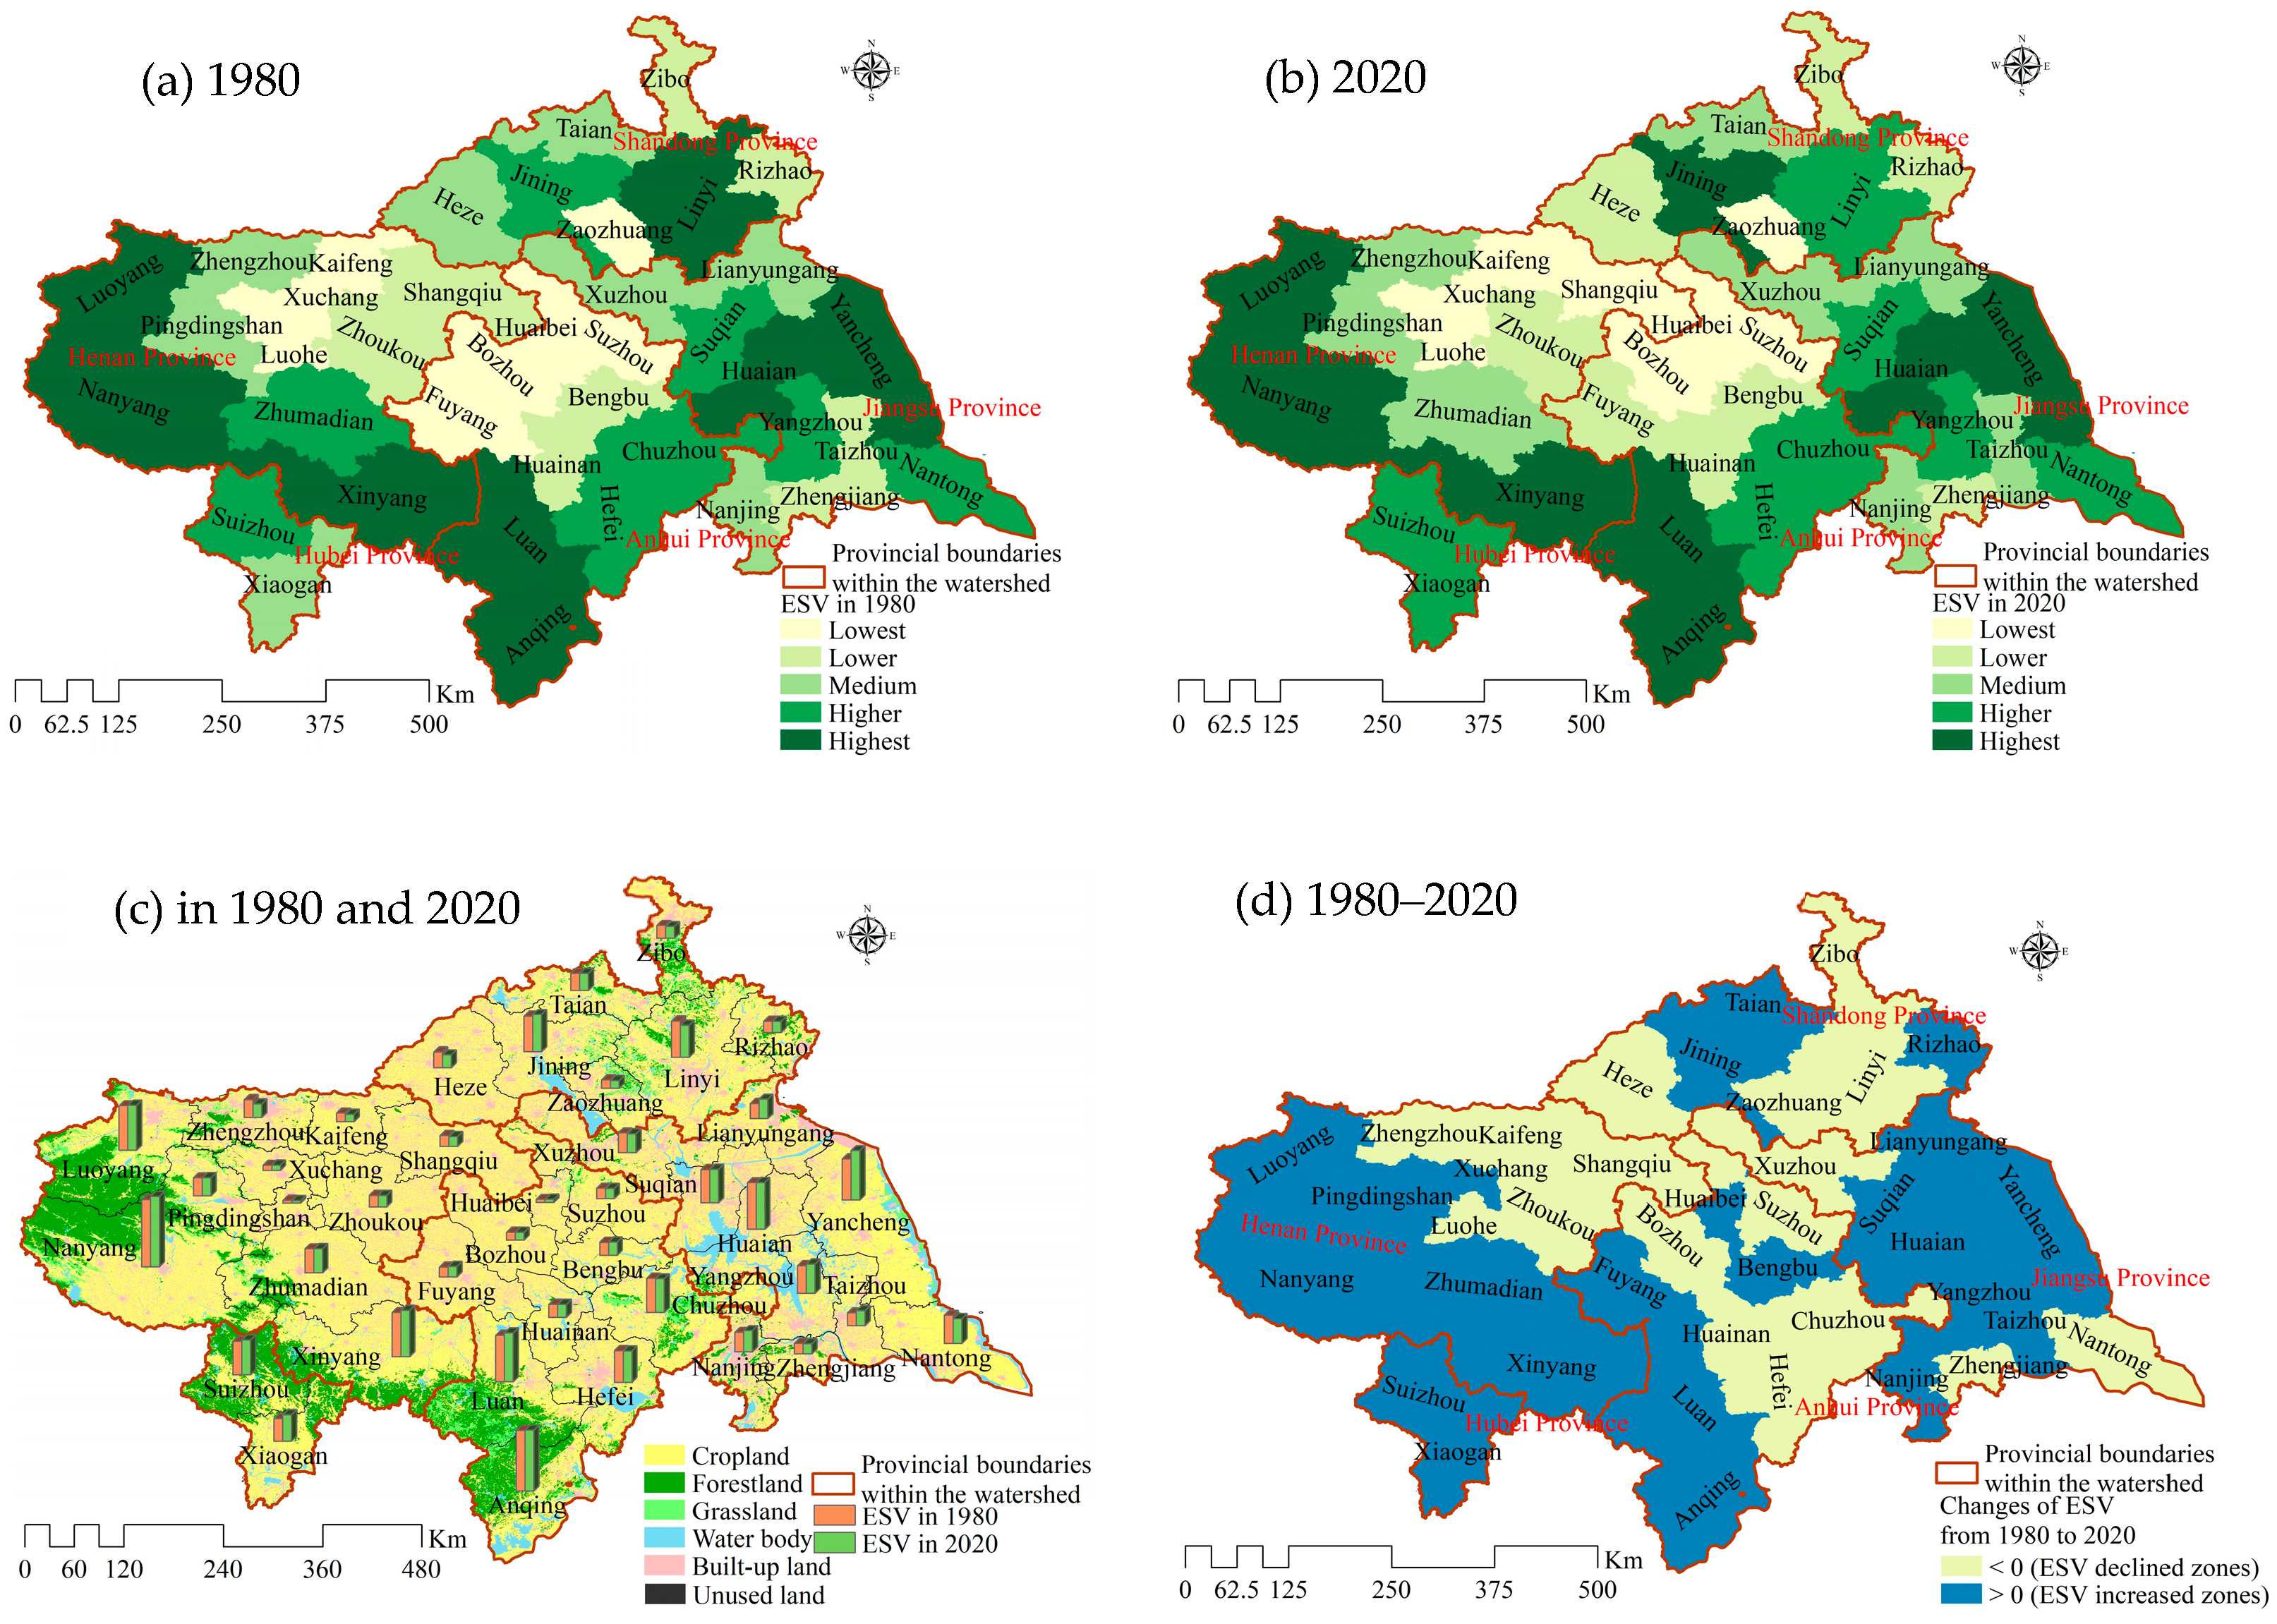
3.1.1. Spatial–Temporal Variation Characteristics of ES Value
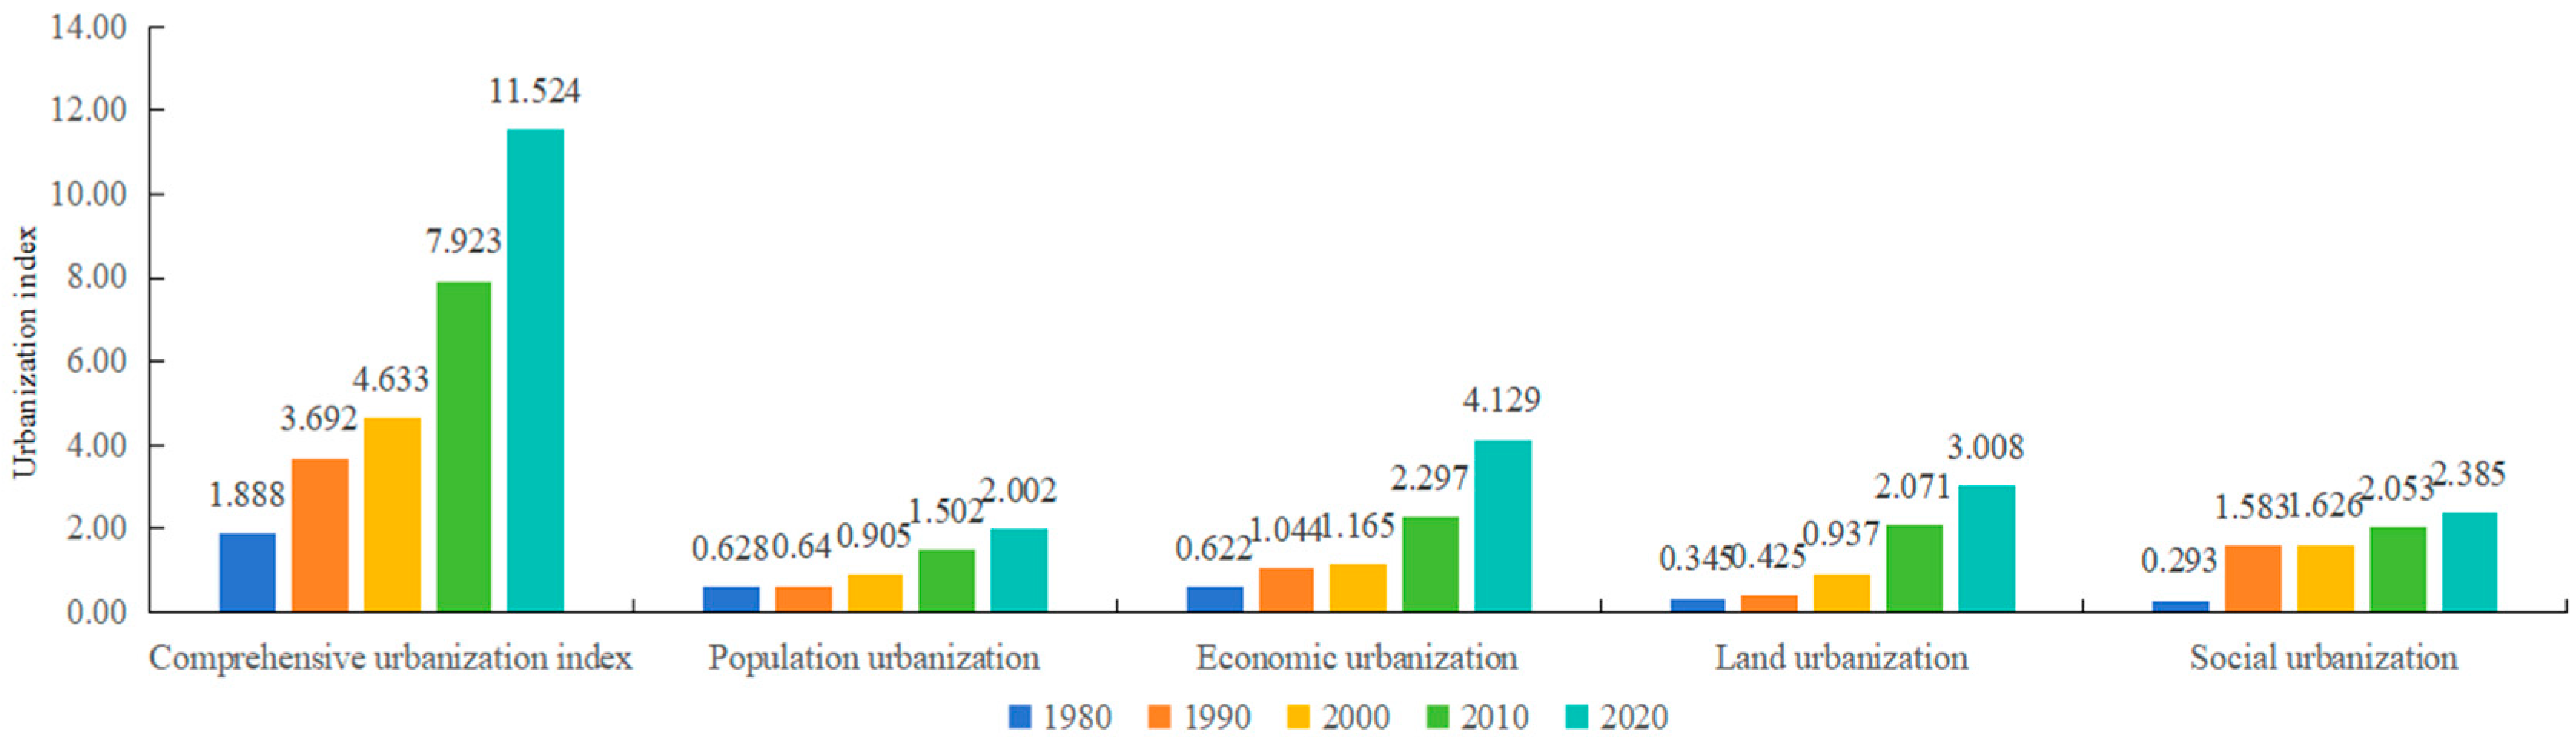
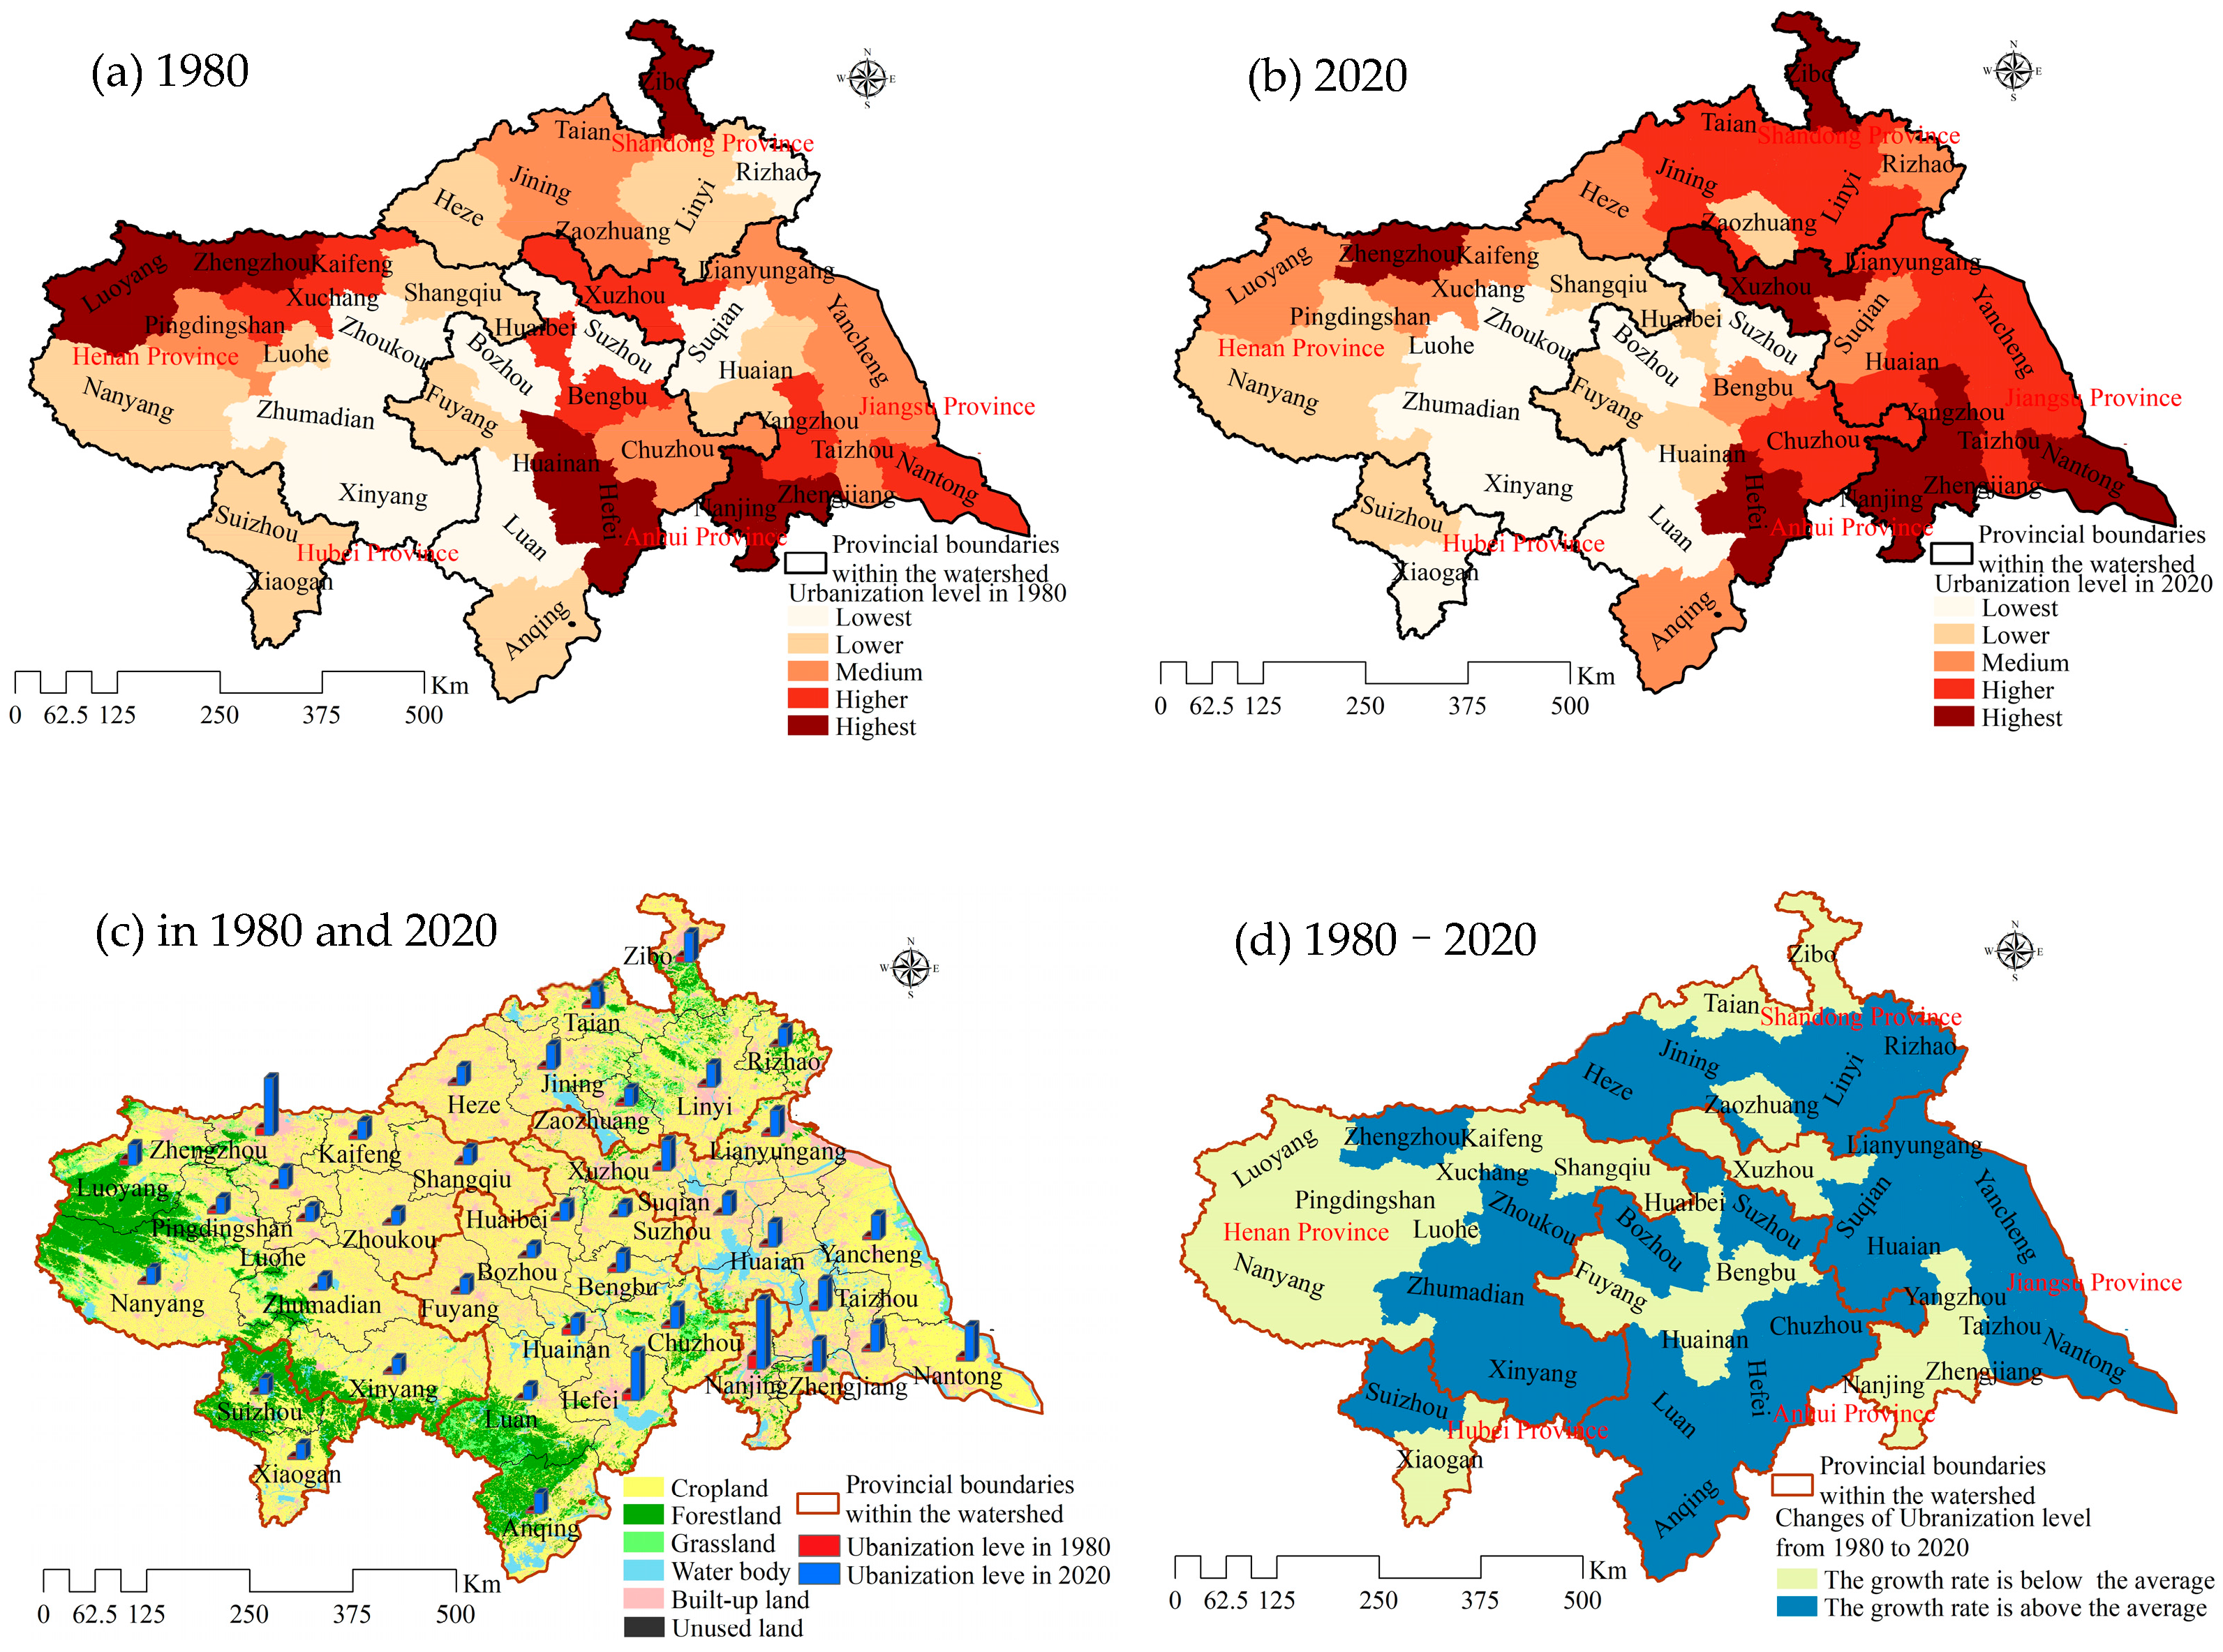
3.1.2. Analysis of Changes in the New Urbanization
3.2. Analysis of the Variation in CCD
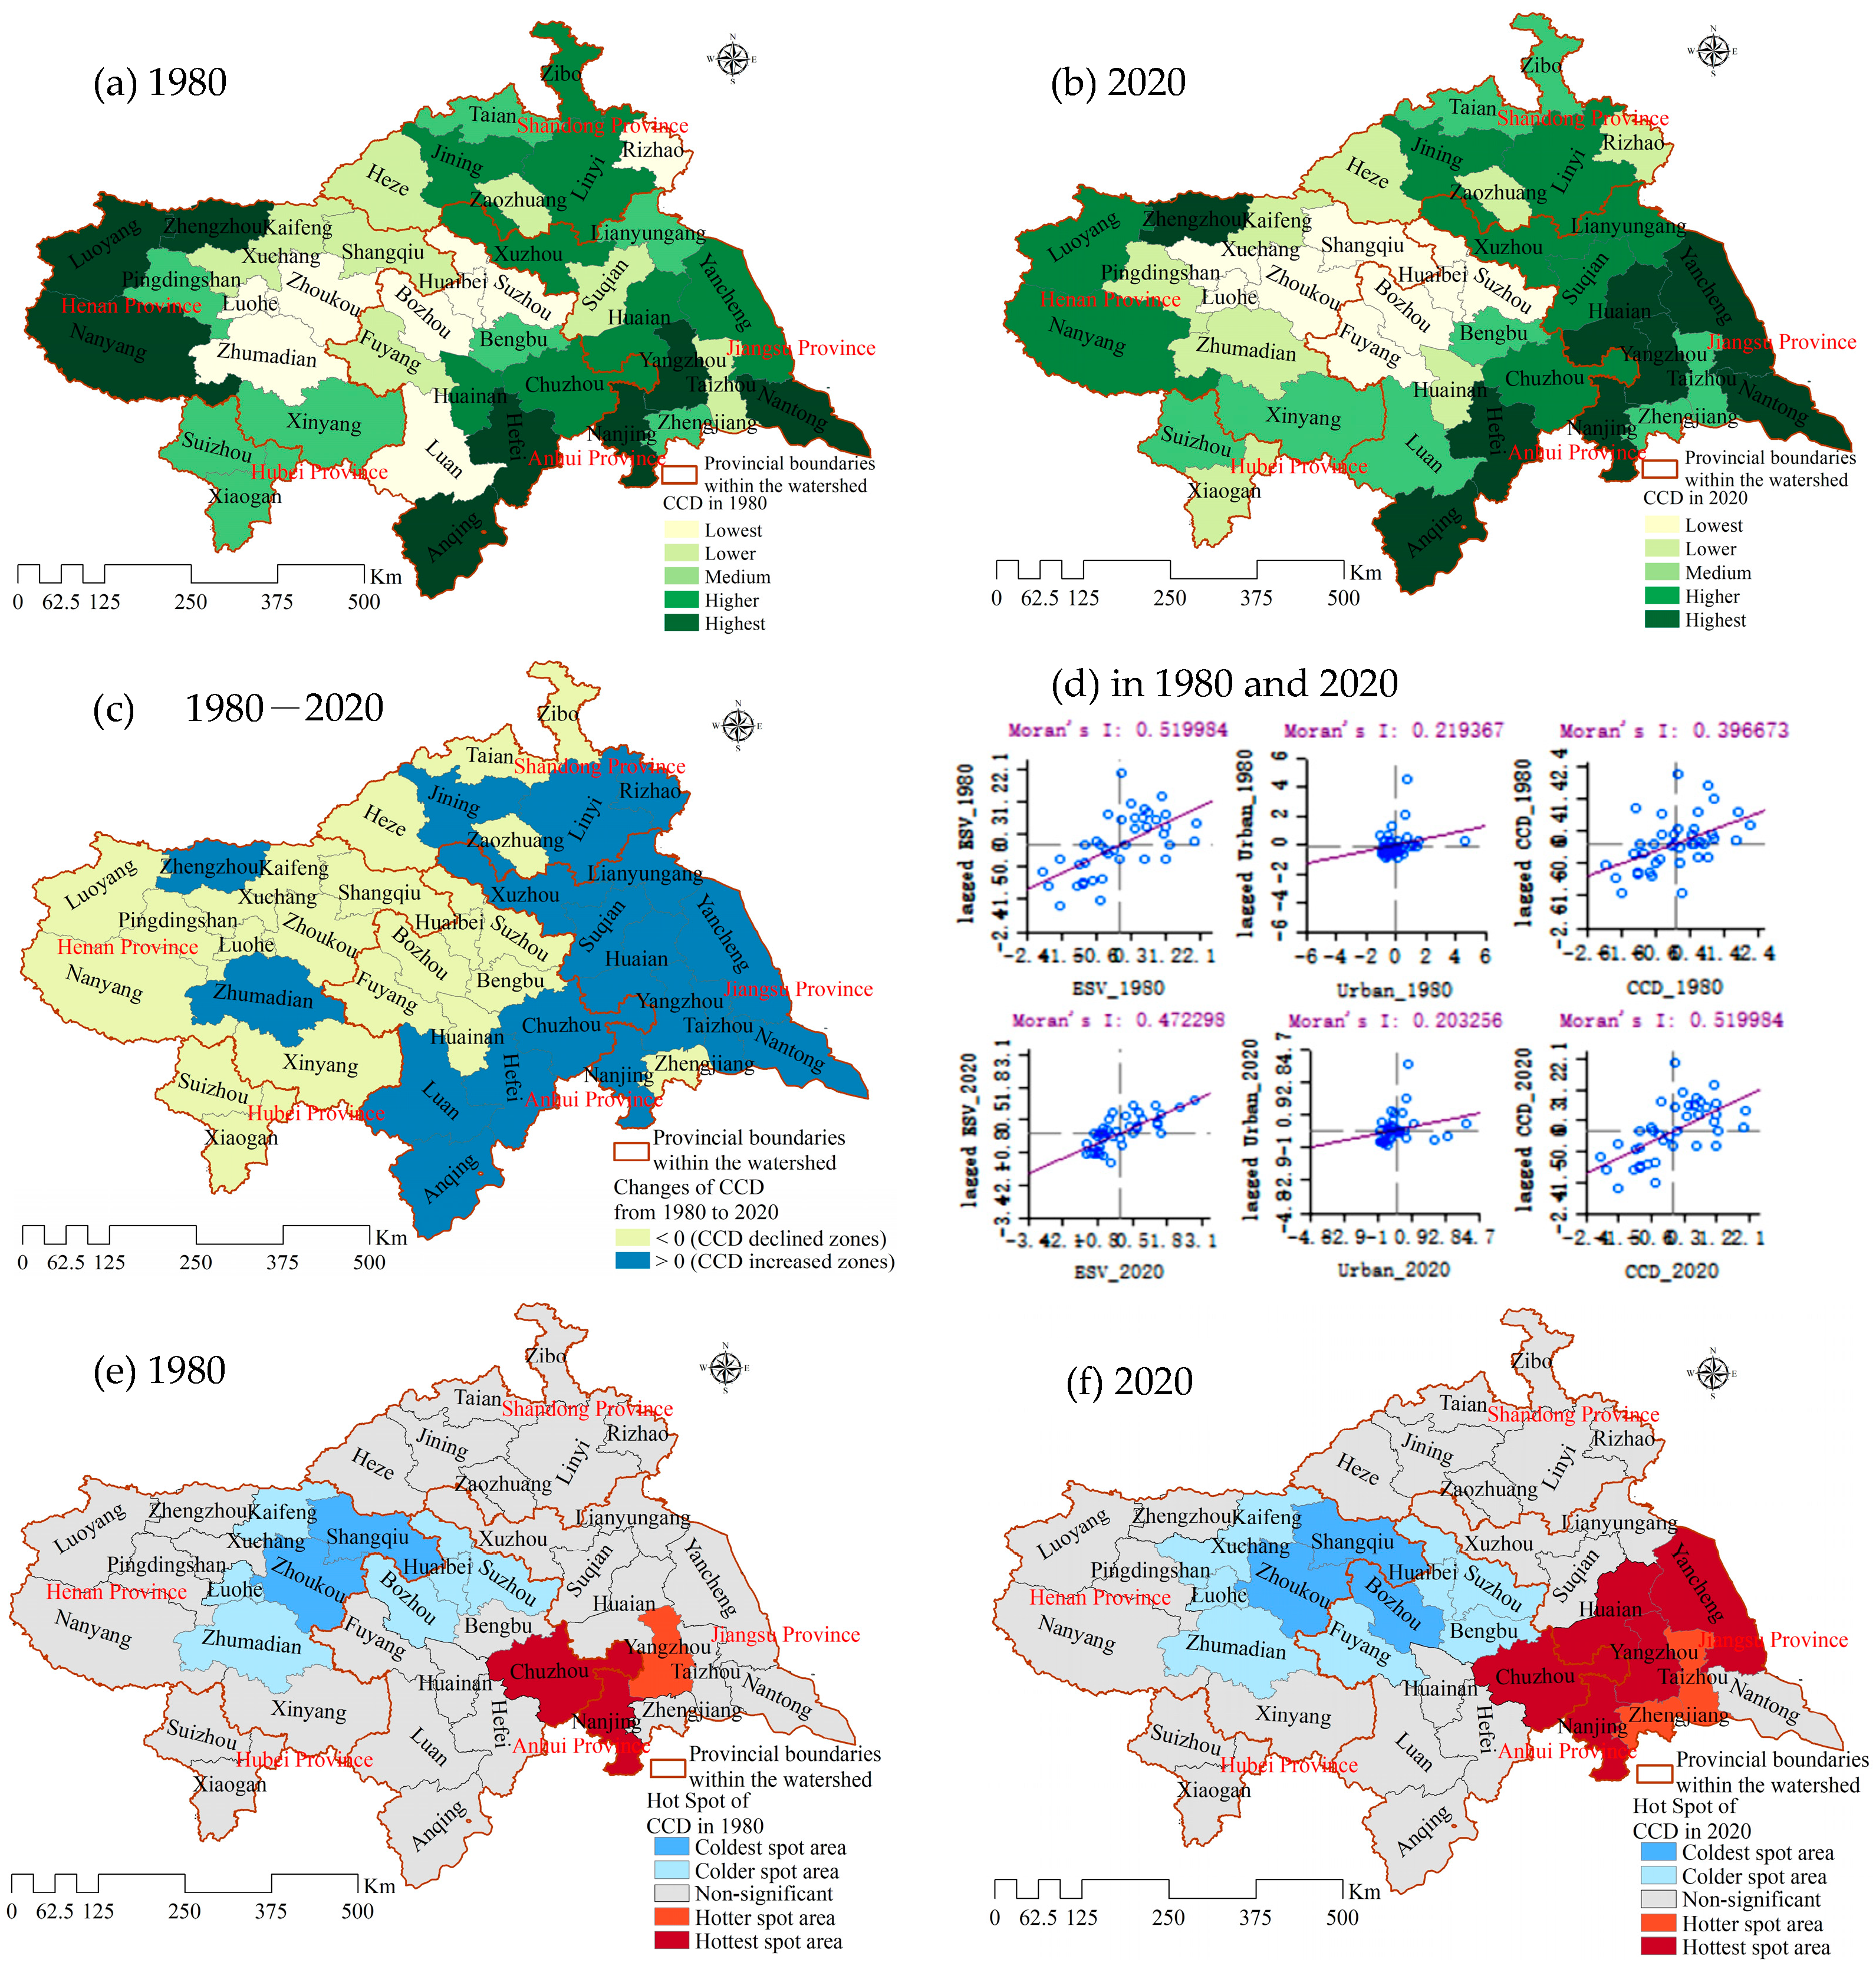
3.2.1. The Trend and Characteristics of Spatio-Temporal Variation in CCD
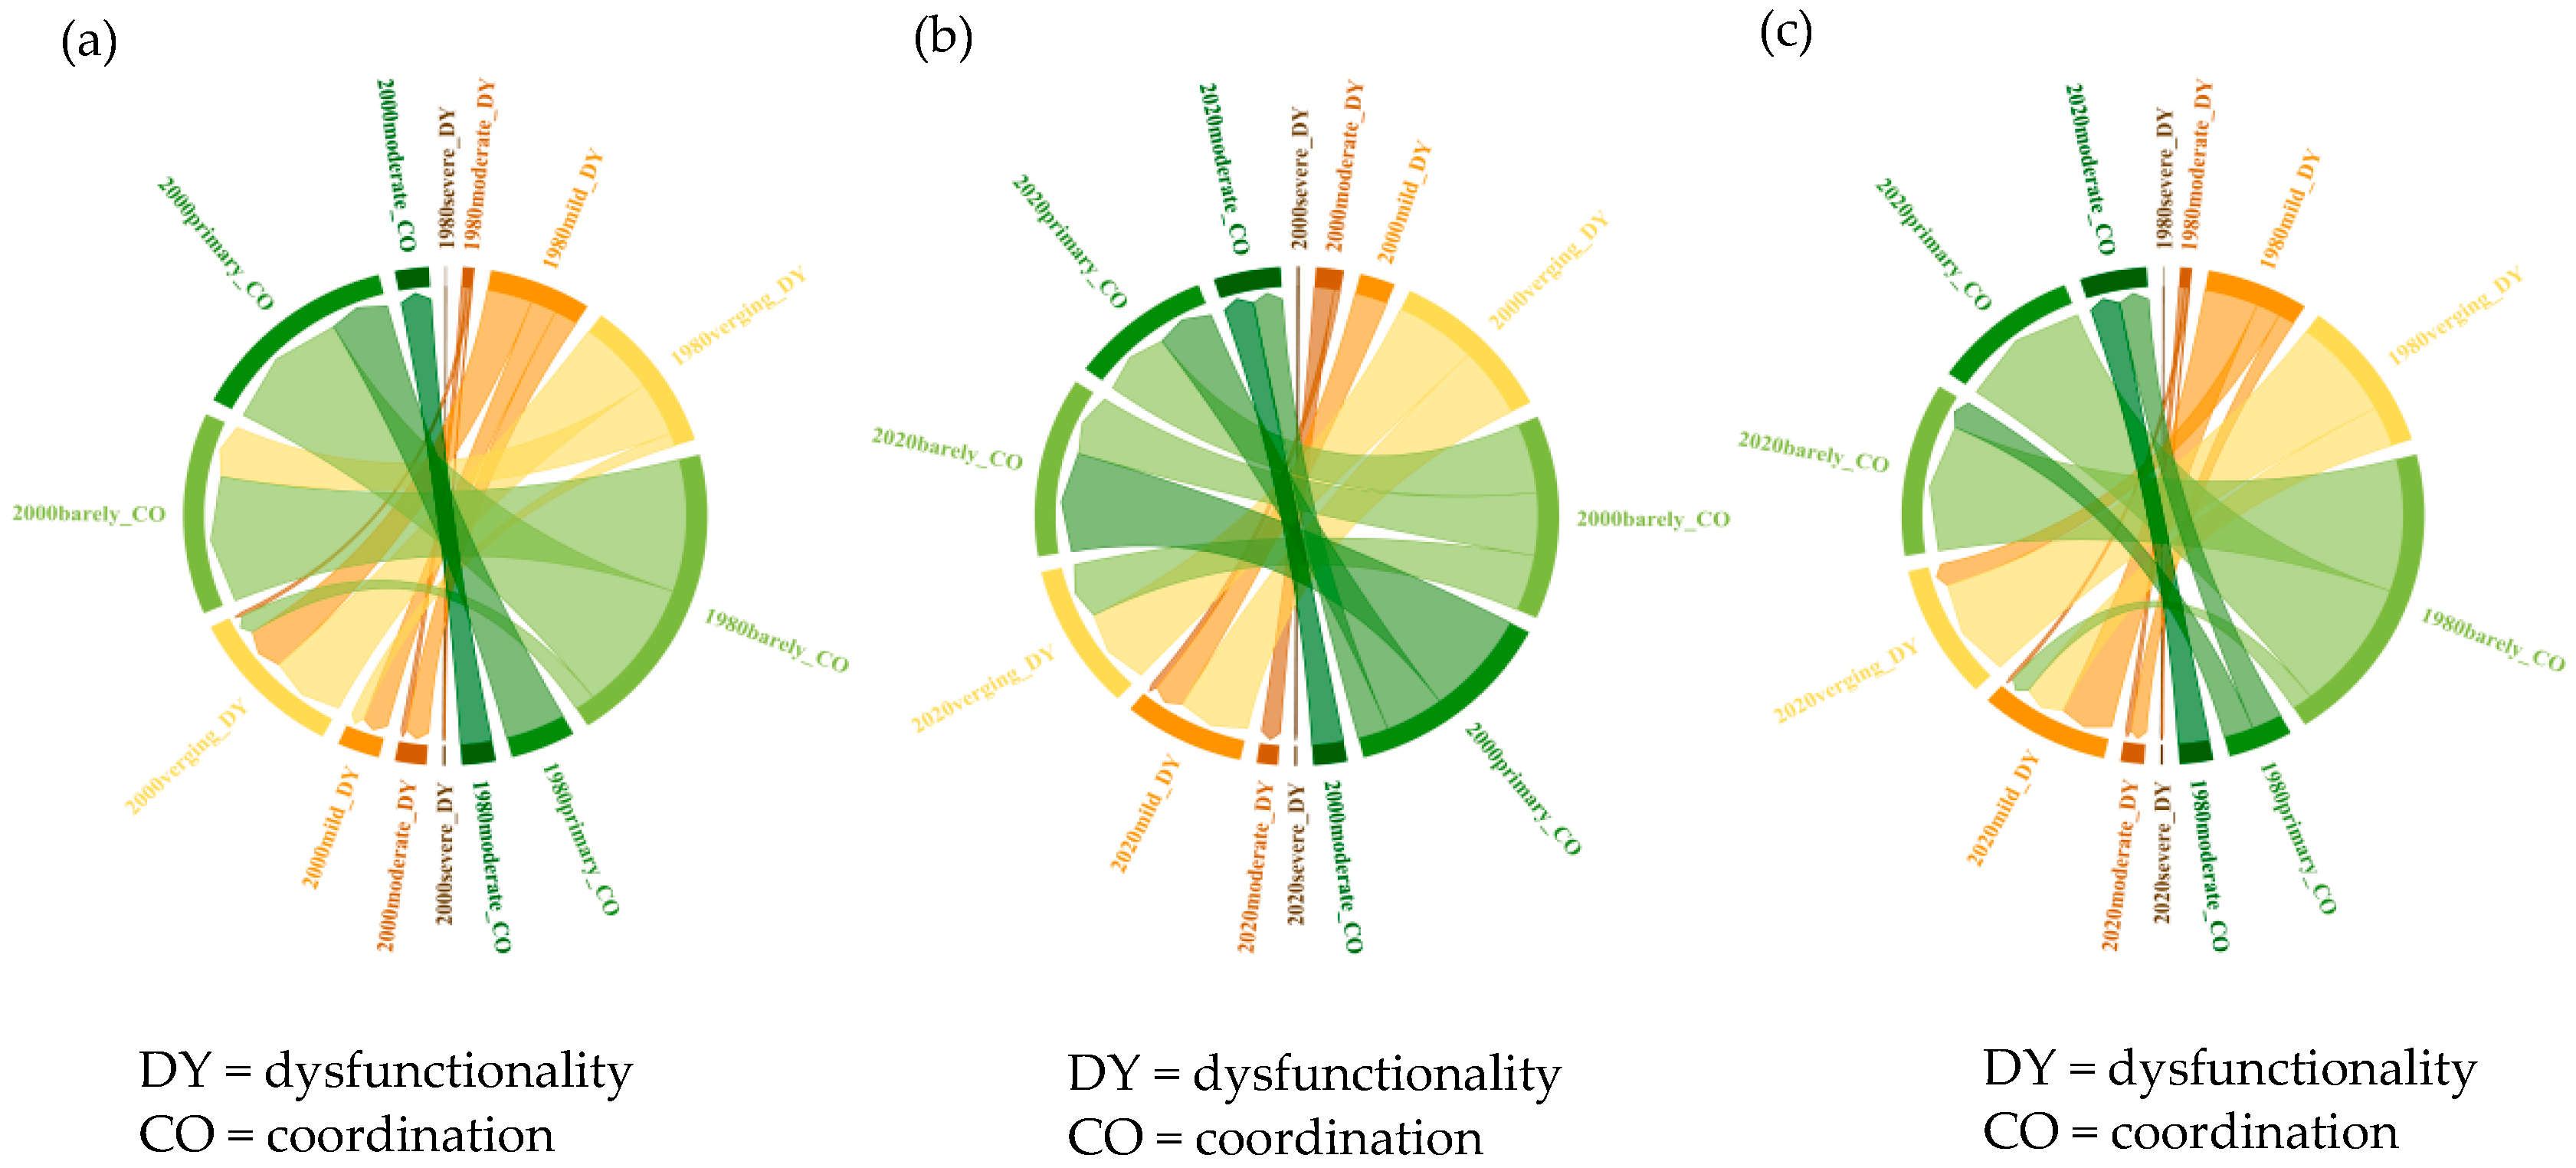
3.2.2. Coupling Coordinated Development Degree Shifts and Spatial Heterogeneity
3.2.3. GeoDetection Analysis of the CCD
3.3. Multi-Scenario Simulations of Land Use and ES Value
3.3.1. Analysis of Land Use Simulation
3.3.2. Multi-Scenario Simulations of ES Value
4. Discussion
4.1. Complex Interactions Between ESs, Urbanization, and Differentiated Regulation Strategies
4.2. Urbanization and Ecological Regulation Insights Based on Multi-Scenario Simulation
4.3. Limitations of This Study and Potential Follow-Up Work
5. Conclusions
Author Contributions
Funding
Data Availability Statement
Acknowledgments
Conflicts of Interest
References
- Qiao, X.; Zheng, J.; Yang, Y.; Liu, L.; Chen, Z. How does urbanization impact the supply–demand relationship of agroecosystem services? Insights from farmland loss in the Huaihe River Basin, China. Ecol. Indic. 2024, 158, 111406. [Google Scholar] [CrossRef]
- Qian, X.; Wang, D.; Wang, J.; Chen, S. Resource curse, environmental regulation and transformation of coal-mining cities in China. Resour. Policy 2021, 74, 101447. [Google Scholar] [CrossRef]
- Cheng, Z.; Li, L.; Liu, J. Natural resource abundance, resource industry dependence and economic green growth in China. Resour. Policy 2020, 68, 101734. [Google Scholar] [CrossRef]
- Song, M.; Zhao, X.; Shang, Y.; Chen, B. Realization of green transition based on the anti-driving mechanism: An analysis of environmental regulation from the perspective of resource dependence in China, 2020. Sci. Total Environ. 2019, 698, 134317. [Google Scholar] [CrossRef]
- You, M.; Zou, Z.; Zhao, W.; Zhang, W.; Fu, C. Study on land use and landscape pattern change in the Huaihe River Ecological and economic zone from 2000 to 2020. Heliyon 2023, 9, e13430. [Google Scholar] [CrossRef] [PubMed]
- Jia, W.; Zhang, X.; Wang, Y. Assessing the pollutant evolution mechanisms of heavy pollution episodes in the Yangtze-Huaihe valley: A multiscale perspective. Atmos. Environ. 2021, 244, 117986. [Google Scholar] [CrossRef] [PubMed]
- Costanza, R.; d’Arge, R.; de Groot, R.; Farber, S.; Grasso, M.; Hannon, B.; Limburg, K.; Naeem, S.; O’Neill, R.V.; Paruelo, J.; et al. The value of the world’s ecosystem services and natural capital. Ecol. Econ. 1998, 25, 3–15. [Google Scholar] [CrossRef]
- Alba-Patiño, D.; Carabassa, V.; Castro, H.; Gutiérrez-Briceño, I.; García-Llorente, M.; Giagnocavo, C.; Gómez-Tenorio, M.; Cabello, J.; Aznar-Sánchez, J.A.; Castro, A.J. Social indicators of ecosystem restoration for enhancing human wellbeing. Resour. Conserv. Recycl. 2021, 174, 105782. [Google Scholar] [CrossRef]
- Hernández-Blanco, M.; Costanza, R.; Chen, H.; deGroot, D.; Jarvis, D.; Kubiszewski, I.; Montoya, J.; Sangha, K.; Stoeckl, N.; Turner, K.; et al. Ecosystem health, ecosystem services, and the well-being of humans and the rest of nature. Glob. Change Biol. 2022, 28, 5027–5040. [Google Scholar] [CrossRef]
- Kibria, A.S.M.G.; Costanza, R.; Gasparatos, A.; Soto, J. A composite human wellbeing index for ecosystem-dependent communities: A case study in the Sundarbans, Bangladesh. Ecosyst. Serv. 2022, 53, 101389. [Google Scholar] [CrossRef]
- Tapolczai, K.; Selmeczy, G.B.; Szabó, B.; B-Béres, V.; Keck, F.; Bouchez, A.; Rimet, F.; Padisák, J. The potential of exact sequence variants (ESVs) to interpret and assess the impact of agricultural pressure on stream diatom assemblages revealed by DNA metabarcoding. Ecol. Indic. 2021, 122, 107322. [Google Scholar] [CrossRef]
- Zhang, S.; Sun, C.; Zhang, Y.; Hu, M.; Shen, X. Exploring the spatiotemporal changes and driving forces of ecosystem services of Zhejiang coasts, China, under sustainable development goals. Chin. Geogr. Sci. 2024, 34, 647–661. [Google Scholar] [CrossRef]
- Li, J.; Zhang, Y. Coupling Coordination and Driving Factors of New-Type Urbanization and Ecological Efficiency in Yangtze River Delta Region. Ecol. Econ. 2022, 38, 109–114+141. [Google Scholar]
- Zhai, Y.; Zhai, G.; Yu, Z.; Lu, Z.; Chen, Y.; Liu, J. Coupling coordination between urbanization and ecosystem services value in the Beijing-Tianjin-Hebei urban agglomeration. Sustain. Cities Soc. 2024, 113, 105715. [Google Scholar] [CrossRef]
- Zhang, N.; Wang, Y. Study on the coupled coordination of new urbanization and water environment in the Yangtze River Economic Belt and its driving factors. Resour. Environ. Yangtze Basin 2024, 33, 572–583. [Google Scholar]
- Zhang, S.; Huang, C.; Li, X.; Song, M. The spatial–temporal evolution and influencing factors of the coupling coordination of new-type urbanization and ecosystem services value in the Yellow River Basin. Ecol. Indic. 2024, 166, 112300. [Google Scholar] [CrossRef]
- Pan, Z.; Gao, G.; Fu, B.; Liu, S.; Wang, J.; He, J.; Liu, D. Exploring the historical and future spatial interaction relationship between urbanization and ecosystem services in the Yangtze River Basin, China. J. Clean. Prod. 2023, 428, 139401. [Google Scholar] [CrossRef]
- Tu, D.; Cai, Y.; Liu, M. Coupling coordination analysis and spatiotemporal heterogeneity between ecosystem services and new-type urbanization: A case study of the Yangtze River Economic Belt in China. Ecol. Indic. 2023, 154, 110535. [Google Scholar] [CrossRef]
- Bi, Y.; Zheng, L.; Wang, Y.; Li, J.; Yang, H.; Zhang, B. Coupling relationship between urbanization and water-related ecosystem services in China’s Yangtze River economic Belt and its socio-ecological driving forces: A county-level perspective. Ecol. Indic. 2023, 146, 109871. [Google Scholar] [CrossRef]
- Wang, J.; Wang, Q.; Lu, D. Spatio-temporal coupling pattern and its influencing factors of digital economy, tourism economy and new urbanization: A case study of Yangtze River Delta region. Geogr. Res. 2024, 43, 3301–3326. [Google Scholar]
- Li, Y.; Li, M. Coupling Coordination, Spatial–Temporal patterns and dynamic impact of the new urbanization and ecological resilience in the Yangtze River Economic Belt. Resour. Environ. Yangtze Basin 2024, 33, 2329–2341. [Google Scholar]
- Chen, Y.; Cai, H.; Chen, Y. Spatial correlation and interaction effect intensity between territorial spatial ecological quality and new urbanization level in Nanchang metropolitan area, China. Ecol. Indic. 2023, 156, 111163. [Google Scholar] [CrossRef]
- Yang, M.; Gao, X.; Siddique, K.H.; Wu, P.; Zhao, X. Spatiotemporal exploration of ecosystem service, urbanization, and their interactive coercing relationship in the Yellow River Basin over the past 40 years. Sci. Total Environ. 2023, 858, 159757. [Google Scholar] [CrossRef] [PubMed]
- Xie, G.; Lu, C.; Leng, Y.; Zheng, D.; Li, S. Ecological assets valuation of the Tibetan Plateau. J. Nat. Resour. 2003, 18, 189–196. [Google Scholar]
- Xie, G.; Zhen, L.; Lu, C.; Cao, S.; Xiao, Y. Supply, consumption and valuation of ecosystem services in China. Resour. Sci. 2008, 30, 93–99. [Google Scholar]
- Huang, M.; Yue, W.; Fang, B.; Feng, S. Scale response characteristics and geographic exploration mechanism of spatial differentiation of ecosystem service values in Dabie Mountain area, central China from 1970 to 2015. Acta Geogr. Sin. 2019, 74, 1904–1920. [Google Scholar]
- Pan, G.; Xu, Y.; Yu, Z.; Song, S.; Zhang, Y. Analysis of river health variation under the background of urbanization based on entropy weight and matter-element model: A case study in Huzhou City in the Yangtze River Delta, China. Environ. Res. 2015, 139, 31–35. [Google Scholar] [CrossRef]
- Sun, X. Green city and regional environmental economic evaluation based on entropy method and GIS. Environ. Technol. Innov. 2021, 23, 101667. [Google Scholar] [CrossRef]
- Li, J.; Qiu, J.; Amani-Beni, M.; Wang, Y.; Yang, M.; Chen, J. A modified equivalent factor method evaluation model based on land use changes in Tianfu New Area. Land 2023, 12, 1335. [Google Scholar] [CrossRef]
- Cai, J.; Li, X.; Liu, L.; Chen, Y.; Wang, X.; Lu, S. Coupling and coordinated development of new urbanization and agro-ecological environment in China. Sci. Total Environ. 2021, 776, 145837. [Google Scholar] [CrossRef] [PubMed]
- Sui, G.; Wang, H.; Cai, S.; Cui, W. Coupling coordination analysis of resources, economy, and ecology in the Yellow River Basin. Ecol. Indic. 2023, 156, 111133. [Google Scholar] [CrossRef]
- Dong, G.; Ge, Y.; Liu, J.; Kong, X.; Zhai, R. Evaluation of coupling relationship between urbanization and air quality based on improved coupling coordination degree model in Shandong Province, China. Ecol. Indic. 2023, 154, 110578. [Google Scholar] [CrossRef]
- Shi, S.; Wang, X.; Hu, Z.; Zhao, X.; Zhang, S.; Hou, M.; Zhang, N. Geographic detector-based quantitative assessment enhances attribution analysis of climate and topography factors to vegetation variation for spatial heterogeneity and coupling. Glob. Ecol. Conserv. 2023, 42, e02398. [Google Scholar] [CrossRef]
- Wang, J.; Xu, C. Geodetector: Principle and prospective. Acta Geogr. Sin. 2017, 72, 116–134. [Google Scholar]
- Liang, X.; Guan, Q.; Clarke, K.C.; Liu, S.; Wang, B.; Yao, Y. Understanding the drivers of sustainable land expansion using a patch-generating land use simulation (PLUS) model: A case study in Wuhan, China. Comput. Environ. Urban Syst. 2021, 85, 101569. [Google Scholar] [CrossRef]
- Fu, F.; Jia, X.; Zhao, Q.; Tian, F.; Wei, D.; Zhao, Y.; Zhang, Y.; Zhang, J.; Hu, X.; Yang, L. Predicting land use change around railway stations: An enhanced CA-Markov model. Sustain. Cities Soc. 2024, 101, 105138. [Google Scholar] [CrossRef]
- Niu, T.; Xiong, L.; Chen, J.; Zhou, Y.; Yin, J. Land Use Change Simulation and Multi-Scenario Prediction of the Yangtze River Basin based on the PLUS model. J. Wuhan Univ. Technol. 2024, 57, 129–141+151. [Google Scholar]
- Li, H.; Fang, C.; Xia, Y.; Liu, Z.; Wang, W. Multi-scenario simulation of production-living-ecological space in the Poyang Lake area based on remote sensing and RF-markov-FLUS model. Remote Sens. 2022, 14, 2830. [Google Scholar] [CrossRef]
- Lin, J.; Chen, Q. Analyzing and simulating the influence of a water conveyance project on land use conditions in the Tarim River region. Land 2023, 12, 2073. [Google Scholar] [CrossRef]
- Pontius, R.; Boersma, W.; Castella, J. Comparing the input, output, and validation maps for several models of land change. Ann. Reg. Sci. 2008, 42, 11–37. [Google Scholar] [CrossRef]
- Cui, F.; Wang, Y.; Liu, G. Exploring the spatial–temporal evolution and driving mechanisms for coupling coordination between green transformation of urban construction land and industrial transformation and upgrading: A case study of the urban agglomeration in the middle reaches of the Yangtze River. Environ. Sci. Pollut. Res. 2023, 30, 119385–119405. [Google Scholar]
- Zhang, S.; Zhong, Q.; Cheng, D.; Xu, C.; Chang, Y.; Lin, Y.; Li, B. Landscape ecological risk projection based on the PLUS model under the localized shared socioeconomic pathways in the Fujian Delta region. Ecol. Indic. 2022, 136, 108642. [Google Scholar] [CrossRef]
- Feng, Q.; Zhao, W.; Duan, B.; Hu, X.; Cherubini, F. Coupling trade-offs and supply-demand of ecosystem services (ES): A new opportunity for ES management. Geogr. Sustain. 2021, 2, 275–280. [Google Scholar] [CrossRef]
- Qiao, X.; Gu, Y.; Zou, C.; Wang, L.; Luo, J.; Huang, X. Trade-offs and synergies of ecosystem services in the Taihu Lake Basin of China. Chin. Geogr. Sci. 2018, 28, 86–99. [Google Scholar] [CrossRef]
- Ye, C.; Hu, M.; Lu, L.; Dong, Q.; Gu, M. Spatio-temporal evolution and factor explanatory power analysis of urban resilience in the Yangtze River Economic Belt. Geogr. Sustain. 2022, 3, 299–311. [Google Scholar] [CrossRef]
- Zhang, G.; Wang, J.; Wu, K.; Xu, Z. Spatial-temporal characteristics and influencing factors of coordination between economic and environmental development of three major urban agglomerations in China. Geogr. Res. 2020, 39, 272–288. [Google Scholar]
- Feng, Y.; He, S.; Li, G. Interaction between urbanization and the eco-environment in the Pan-Third Pole region. Sci. Total Environ. 2021, 789, 148011. [Google Scholar] [CrossRef] [PubMed]
- Özokcu, S.; Özdemir, Ö. Economic growth, energy, and environmental Kuznets curve. Renew. Sustain. Energy Rev. 2017, 72, 639–647. [Google Scholar] [CrossRef]
- Zhang, F.; Xu, N.; Wang, C.; Guo, M.; Pankaj, K. Multi-scale coupling analysis of urbanization and ecosystem services supply-demand budget in the Beijing-Tianjin-Hebei region, China. J. Geogr. Sci. 2023, 33, 340–356. [Google Scholar] [CrossRef]
- Abadie, A.; Diamond, A.; Hainmueller, J. Synthetic control methods for comparative case studies: Estimating the effect of California’s tobacco control program. J. Am. Stat. Assoc. 2010, 105, 493–505. [Google Scholar] [CrossRef]
- Yao, X.; Chen, Y.; Sheng, Y.; Qi, H.; Zhang, Q.; Ou, C. Spatial and temporal evolution characteristics and influencing factors of coupling coordination degree of urbanization and eco-environment in the Huaihe Eco-economic Belt. Res. Sq. 2023. [Google Scholar] [CrossRef]
- Sui, Y.; Hu, J.; Zhang, N.; Ma, F. Exploring the dynamic equilibrium relationship between urbanization and ecological environment—A case study of Shandong Province, China. Ecol. Indic. 2024, 158, 111456. [Google Scholar] [CrossRef]
- Tang, P.; Huang, J.; Zhou, H.; Fang, C.; Zhan, Y.; Huang, W. Local and telecoupling coordination degree model of urbanization and the eco-environment based on RS and GIS: A case study in the Wuhan urban agglomeration. Sustain. Cities Soc. 2021, 75, 103405. [Google Scholar] [CrossRef]
- Liang, X.; Liu, X.; Li, X.; Chen, Y.; Tian, H.; Yao, Y. Delineating multi-scenario urban growth boundaries with a CA-based FLUS model and morphological method. Landsc. Urban Plan. 2018, 177, 47–63. [Google Scholar] [CrossRef]


| Data Type | Variables | Year | Spatial Resolution | Unit | Data Sources |
|---|---|---|---|---|---|
| Land use data | land use classification maps | 1980, 1990, 2000, 2010, and 2020 | 30 m | / | (https://www.resdc.cn/) (acessesd on 18 May 2024) |
| Natural factors | DEM | 2000 | 90 m | m | (https://www.gscloud.cn/) (acessesd on 18 May 2024) |
| slope | 2000 | 90 m | DEM-based extraction | ||
| aspect | 2000 | 90 m | DEM-based extraction | ||
| annual average temperature | 2020 | 1000 m | 0.1 °C | (https://www.resdc.cn/) (acessesd on 15 May 2024) | |
| annual average precipitation | 2020 | 1000 m | 0.1 mm | ||
| soil type | 1995 | 1000 m | / | (https://www.resdc.cn/) (acessesd on 15 May 2024) | |
| distance from water body | 2020 | 300 m | m | (https://www.openstreetmap.org/) (acessesd on 10 May 2024) | |
| Socio-economic factors | population density | 2019 | 1000 m | Persons/km2 | (https://www.resdc.cn/) (acessesd on 15 May 2024) |
| GDP per area | 2020 | 1000 m | 10,000 CNY/km2 | ||
| distance from railroads | 2020 | / | / | (https://www.openstreetmap.org/) (acessesd on 10 May 2024) |
| Service Type | Land Type | |||||
|---|---|---|---|---|---|---|
| Level 1 Type | Level 2 Type | Cropland | Forestland | Grassland | Water Body | Unused Land |
| Supply services | food production | 543.39 | 124.17 | 147.53 | 322.10 | 4.92 |
| raw material production | 120.48 | 285.22 | 218.83 | 179.49 | 14.75 | |
| water resources supply | −641.74 | 147.53 | 120.48 | 2675.16 | 9.84 | |
| subtotal | 22.13 | 556.92 | 486.84 | 3176.75 | 29.51 | |
| Regulation services | gas regulation | 437.66 | 938.03 | 764.68 | 656.50 | 54.09 |
| climate adjustment | 228.67 | 2806.71 | 2023.58 | 1448.23 | 49.18 | |
| purification | 66.39 | 822.46 | 668.79 | 2249.79 | 152.44 | |
| environmental hydrology | 735.18 | 1836.71 | 1482.65 | 31,096.29 | 103.27 | |
| subtotal | 1467.9 | 6403.91 | 4939.70 | 35,450.81 | 358.98 | |
| Support services | soil conservation | 255.71 | 1142.11 | 931.88 | 796.65 | 63.93 |
| nutrient cycling | 76.22 | 87.29 | 71.30 | 61.47 | 4.92 | |
| biodiversity | 83.60 | 1040.07 | 848.28 | 2562.06 | 59.01 | |
| subtotal | 415.53 | 2269.47 | 1851.46 | 3420.18 | 127.86 | |
| Cultural services | esthetic landscape | 36.88 | 456.11 | 373.74 | 1627.72 | 24.59 |
| subtotal | 36.88 | 456.11 | 373.74 | 1627.72 | 24.59 | |
| total | 1942.44 | 9686.41 | 7651.74 | 43,675.46 | 540.94 | |
| Target Layer | Classification Layer | Indicator Layer (Code and Name) | Indicator Attribute | Weight |
|---|---|---|---|---|
| U The urbanization index | Up | Up1 Urbanization rate (%) | (+) | 6.60% |
| Up2 Population density | (−) | 0.28% | ||
| Up3 Number of registered urban unemployed individuals | (−) | 0.35% | ||
| Ue | Ue1 Economic growth rate | (+) | 0.41% | |
| Ue2 The proportion of secondary and tertiary industries in GDP (%) | (+) | 2.32% | ||
| Ue3 Total retail sales of social consumer goods as a percentage of GDP (%) | (+) | 2.19% | ||
| Ue4 Per capita GDP (yuan) | (+) | 17.70% | ||
| Ul | Ul1 Built-up area | (+) | 11.98% | |
| Ul2 Per capita park green area (m2/person) | (+) | 11.92% | ||
| Ul3 Urban built-up land area | (+) | 12.58% | ||
| Us | Us1 The number of urban basic medical insurance participants | (+) | 8.77% | |
| Us2 The number of urban workers participating in basic pension insurance | (+) | 10.28% | ||
| Us3 Number of urban general institutions of higher learning | (+) | 14.62% |
| Land Use Type | Cropland | Forestland | Grassland | Water Body | Built-Up Land | Unused Land |
|---|---|---|---|---|---|---|
| Domain factor parameters | 0.33 | 0.12 | 0.09 | 0.22 | 1 | 0 |
| ND | CP | EP | CD | |||||||||||||||||||||
|---|---|---|---|---|---|---|---|---|---|---|---|---|---|---|---|---|---|---|---|---|---|---|---|---|
| A | B | C | D | E | F | A | B | C | D | E | F | A | B | C | D | E | F | A | B | C | D | E | F | |
| A | 1 | 1 | 1 | 1 | 1 | 1 | 1 | 0 | 0 | 0 | 0 | 0 | 1 | 1 | 1 | 1 | 1 | 1 | 1 | 0 | 0 | 1 | 1 | 1 |
| B | 1 | 1 | 1 | 1 | 1 | 1 | 1 | 1 | 1 | 0 | 0 | 1 | 0 | 1 | 0 | 0 | 0 | 0 | 1 | 1 | 1 | 0 | 0 | 0 |
| C | 1 | 1 | 1 | 1 | 1 | 1 | 1 | 1 | 1 | 1 | 1 | 1 | 0 | 1 | 1 | 1 | 0 | 0 | 1 | 1 | 1 | 1 | 1 | 1 |
| D | 1 | 1 | 1 | 1 | 1 | 1 | 1 | 0 | 1 | 1 | 0 | 0 | 0 | 0 | 0 | 1 | 0 | 0 | 0 | 0 | 1 | 1 | 0 | 0 |
| E | 0 | 0 | 0 | 0 | 1 | 0 | 0 | 0 | 0 | 0 | 1 | 0 | 0 | 0 | 0 | 0 | 1 | 0 | 0 | 0 | 0 | 0 | 1 | 0 |
| F | 1 | 1 | 1 | 1 | 1 | 1 | 1 | 1 | 1 | 1 | 1 | 1 | 1 | 1 | 1 | 1 | 1 | 1 | 1 | 1 | 1 | 1 | 1 | 1 |
| Years | Coupling Degree (C) | Coordination Index (T) | Coupling Coordinative Development Degree (D) | Coupling Coordination Level |
|---|---|---|---|---|
| 1980 | 0.289 | 0.234 | 0.260 | moderate dysfunctionality |
| 1990 | 0.432 | 0.102 | 0.210 | moderate dysfunctionality |
| 2000 | 0.991 | 0.254 | 0.502 | barely coordination |
| 2010 | 0.994 | 0.698 | 0.833 | good coordination |
| 2020 | 1.000 | 0.990 | 0.995 | high-quality coordination |
| Year | Statistical Description of ESV at City Level | Statistical Description of UI at City Level | CCD Statistical Descriptors at City Level | |||||||||
|---|---|---|---|---|---|---|---|---|---|---|---|---|
| Min | Max | Mean | STDEV | Min | Max | Mean | STDEV | Min | Max | Mean | STDEV | |
| 1980 | 0.059 | 1.440 | 0.504 | 0.343 | 0.019 | 0.157 | 0.047 | 0.027 | 0.175 | 0.716 | 0.440 | 0.129 |
| 2020 | 0.053 | 1.511 | 0.512 | 0.360 | 0.047 | 0.864 | 0.288 | 0.146 | 0.145 | 0.726 | 0.436 | 0.146 |
| Cropland | Forestland | Grassland | Water Body | Built-Up Land | Unused Land | |
|---|---|---|---|---|---|---|
| Area in 2020 | 249,910.88 | 46,369.39 | 14,778.18 | 22,885.91 | 58,187.63 | 356.28 |
| ND 2050/km2 | 230,350.34 | 45,310.19 | 15,162.83 | 24,227.58 | 77,135.40 | 301.93 |
| CP 2050/km2 | 258,477.03 | 45,707.23 | 12,859.19 | 21,124.81 | 54,020.45 | 299.56 |
| EP 2050/km2 | 241,999.47 | 48,724.68 | 14,299.84 | 23,773.53 | 63,382.33 | 308.42 |
| CD 2050/km2 | 236,261.83 | 45,392.29 | 14,330.44 | 24,558.84 | 71,648.08 | 296.79 |
| ND 2050 (compared to 2020, %) | −7.83 | −2.28 | 2.60 | 5.86 | 32.56 | −15.25 |
| CP 2050 (compared to 2020, %) | 3.43 | −1.43 | −12.99 | −7.70 | −7.16 | −15.92 |
| EP 2050 (compared to 2020, %) | −3.17 | 5.08 | −3.24 | 3.88 | 8.93 | −13.43 |
| CD 2050 (compared to 2020, %) | −5.46 | −2.11 | −3.03 | 7.31 | 23.13 | −16.70 |
Disclaimer/Publisher’s Note: The statements, opinions and data contained in all publications are solely those of the individual author(s) and contributor(s) and not of MDPI and/or the editor(s). MDPI and/or the editor(s) disclaim responsibility for any injury to people or property resulting from any ideas, methods, instructions or products referred to in the content. |
© 2025 by the authors. Licensee MDPI, Basel, Switzerland. This article is an open access article distributed under the terms and conditions of the Creative Commons Attribution (CC BY) license (https://creativecommons.org/licenses/by/4.0/).
Share and Cite
Huang, M.; Guo, Q.; Zhang, G.; Tang, Y.; Wu, X. Spatiotemporal Coupling of New-Type Urbanization and Ecosystem Services in the Huaihe River Basin, China: Heterogeneity and Regulatory Strategy. Land 2025, 14, 286. https://doi.org/10.3390/land14020286
Huang M, Guo Q, Zhang G, Tang Y, Wu X. Spatiotemporal Coupling of New-Type Urbanization and Ecosystem Services in the Huaihe River Basin, China: Heterogeneity and Regulatory Strategy. Land. 2025; 14(2):286. https://doi.org/10.3390/land14020286
Chicago/Turabian StyleHuang, Muyi, Qin Guo, Guozhao Zhang, Yuru Tang, and Xue Wu. 2025. "Spatiotemporal Coupling of New-Type Urbanization and Ecosystem Services in the Huaihe River Basin, China: Heterogeneity and Regulatory Strategy" Land 14, no. 2: 286. https://doi.org/10.3390/land14020286
APA StyleHuang, M., Guo, Q., Zhang, G., Tang, Y., & Wu, X. (2025). Spatiotemporal Coupling of New-Type Urbanization and Ecosystem Services in the Huaihe River Basin, China: Heterogeneity and Regulatory Strategy. Land, 14(2), 286. https://doi.org/10.3390/land14020286