1. Introduction
Extreme natural hazards (e.g., flash floods, landslides, typhoons) and highly lethal infectious diseases (e.g., COVID-19) continue to cause profound and widespread harm, resulting in significant human, economic, and environmental losses [
1,
2]. The degree of damage varies greatly depending on regional conditions and underlying vulnerabilities, revealing stark disparities in how communities are affected [
3]. This disparity is closely linked to social vulnerability, and understanding it is not only important but also an urgent task for identifying the regions or groups most at risk during extreme events [
4]. The lack of a clear understanding of social vulnerability can leave disaster preparedness and mitigation efforts misaligned, exacerbating the risks faced by already vulnerable populations [
5]. Moreover, this issue extends beyond immediate disaster response, affecting sustainable land management and the resilience of communities that depend on specific land uses [
6]. For instance, regions reliant on intensive agriculture may experience heightened disaster risks due to soil degradation, while densely populated urban areas with inadequate infrastructure often bear the brunt of natural disasters [
7]. These dynamics underscore the critical need for robust social vulnerability assessments. Such assessments are essential for shaping land-use planning strategies that not only address immediate risks but also build long-term resilience and sustainability [
8]. By integrating social vulnerability as a central focus, policymakers can develop adaptive strategies to reduce risks and enhance equity, ultimately fostering communities that are better prepared for future challenges [
9].
Social vulnerability can be estimated and quantified by analyzing demographic, socioeconomic, and other characteristics of a population [
10,
11,
12,
13]. The resulting measure is referred to as the Social Vulnerability Index (SVI). Among the widely recognized approaches, the SVI developed by Flanagan et al. [
14], utilized by the CDC and ATSDR, and the Social Vulnerability Index (SoVI) proposed by Cutter et al. [
15], are prominent. SoVI, in particular, employs principal component analysis (PCA) as a common method for developing such indices [
16]. The popularity of PCA in SVI studies stems from its suitability for cases where expertise in social factors is limited or identifying the influence of variables is challenging. Moreover, its statistical simplicity has contributed to its continued use since its introduction in 2003 [
17,
18,
19].
Despite its widespread application, PCA-based methods like SoVI face notable challenges [
20]. One key issue is the interpretability of the final index [
21]. The incorporation of multiple social factors into a single index complicates the clear identification of specific drivers of social vulnerability [
22,
23]. This lack of clarity can hinder its practical application in decision-making and communication with stakeholders, as the index is derived from statistical relationships rather than content-focused reasoning [
24]. Recent studies have sought to address this by integrating expert insights with PCA outcomes and applying sensitivity and uncertainty analyses to improve the comprehensibility and practical relevance of the findings [
21,
22,
23].
Another significant limitation lies in the weighting methodology [
25]. In SoVI calculations, all principal components are typically assigned equal weights regardless of their variance explanatory power, which may not reflect their true social influence [
26]. To address this, various approaches have been proposed, such as assigning weights based on variance explanatory power, incorporating expert opinions or surveys, and analyzing correlations with actual disaster events. These methods have demonstrated improvements in aligning the index with real-world situations [
24,
25].
The most critical issue, however, concerns indicator selection [
16]. The results of PCA-based SVI methods are highly sensitive to the choice of input indicators, as changes in individual variables can significantly impact the overall index [
17,
23]. Tate [
23] highlighted that this variability undermines consistency, and subsequent studies have explored the effects of diverse indicator compositions [
27,
28]. For instance, Fatemi et al. [
16] developed a standardized indicator-set tailored to Iran’s context by incorporating local expert opinions, demonstrating its adaptability across various disaster scenarios. Gall [
29] and Oulahen et al. [
30] emphasized the importance of evaluating the relative importance of indicators and developing common sets applicable across regions and disaster types. Moreover, Holand and Lujala [
31] stressed the necessity of creating region-specific indices, given that identical indicators can yield different results in different contexts. However, despite these efforts, many studies still rely on indicators narrowly focused on specific disasters or derived from previous research [
32]. This limited approach often overlooks the comprehensive dimensions of social vulnerability, which require consideration of diverse social factors and situations. Developing a robust and inclusive methodology for indicator selection remains a pressing challenge in SVI research.
In the context of land use and planning, social vulnerability plays a crucial role in shaping how various regions respond to land-based challenges such as soil degradation, land tenure insecurity, and urban sprawl. Social vulnerability assessments provide critical insights into how communities might be disproportionately affected by these challenges, enabling the identification of at-risk populations and regions [
16]. By prioritizing social vulnerability as a foundational framework, policymakers can develop more targeted land-use strategies that address both human and environmental needs [
31]. To strengthen this approach, a deeper understanding of the selection and utilization of indicators is essential, as these decisions play a critical role in shaping the accuracy and applicability of social vulnerability assessments.
In conclusion, the Social Vulnerability Index (SVI) is an indispensable tool for assessing the susceptibility of communities, populations, or regions to adverse circumstances. Widely employed in disaster risk reduction and policy applications, SVI remains challenged by issues such as indicator selection, weighting, and interpretability. Among these, indicator selection emerges as the most critical factor, influencing the accuracy and comprehensiveness of assessments. However, many existing studies rely on limited or narrowly focused variables, overlooking diverse social and environmental contexts. This limitation reduces the reliability and adaptability of SVI for broader applications.
This study seeks to address these gaps through a systematic scoping review and analysis of the variables used in SVI research, offering a comprehensive understanding of their selection and application. By identifying common practices, gaps, and trends, this study establishes a robust foundation for advancing SVI methodologies. Such advancements are crucial for both theoretical development and ensuring that the SVI effectively informs sustainable land-use planning and disaster risk reduction. Through this scoping review, we aim to emphasize the importance of inclusive and context-sensitive variable selection, ultimately contributing to the development of more effective social vulnerability assessments.
2. Materials and Methods
Social vulnerability is a complex, multidimensional concept that investigates the interplay of diverse social, economic, and demographic elements in shaping a community’s capacity to effectively respond to and recover from disasters [
33]. In contrast to physical vulnerability, which primarily addresses direct exposure to hazards, social vulnerability emphasizes the systemic inequalities and pre-existing social conditions that heighten risks for specific populations [
34]. This viewpoint highlights that vulnerability is not solely a result of natural or anthropogenic hazards; rather, it is fundamentally entrenched in structural and societal determinants that influence access to resources, decision-making processes, and adaptive capabilities [
35].
The theoretical framework surrounding social vulnerability has undergone significant development through various paradigms. A particularly impactful model is the Pressure and Release (PAR) model proposed by Blaikie et al. [
36] which delineates the interplay between root causes, dynamic pressures, and unsafe conditions in the formation of vulnerability. The PAR model underscores the notion that vulnerability is not a fixed state but rather a dynamic process influenced by the interactions between social structures and environmental risks [
37]. This systemic perspective has informed a multitude of studies by demonstrating how macro-level factors, including economic policies and governance, permeate down to influence local vulnerabilities [
38].
Building upon these foundational ideas, Cutter et al. [
15] developed the Social Vulnerability Index (SoVI) as a quantitative instrument for evaluating and comparing vulnerability across different geographic areas. The SoVI methodology synthesizes various social indicators, including income, age, and housing quality, through the application of Principal Component Analysis (PCA) [
15]. This statistical technique uncovers patterns of variance among the indicators, allowing researchers to condense intricate social dynamics into a unified index [
39]. The SoVI has gained widespread acceptance in the fields of disaster risk reduction and policy planning, owing to its capacity to deliver a systematic and replicable evaluation of vulnerability [
16]. Nonetheless, its dependence on PCA has faced criticism for certain limitations, such as challenges in result interpretation and insufficient consideration of local contexts or stakeholder perspectives [
19,
40].
Indicator selection is identified as a paramount challenge within this context. Indicators function as representations of more extensive social phenomena, and the process of selecting them significantly influences the thoroughness and precision of the index [
17]. Current research frequently depends on pre-established or region-specific indicators, which constrains their applicability across various contexts [
32]. Additionally, the lack of standardized frameworks for indicator selection has resulted in considerable discrepancies in Social Vulnerability Index (SVI) outcomes, thereby diminishing their comparability [
23].
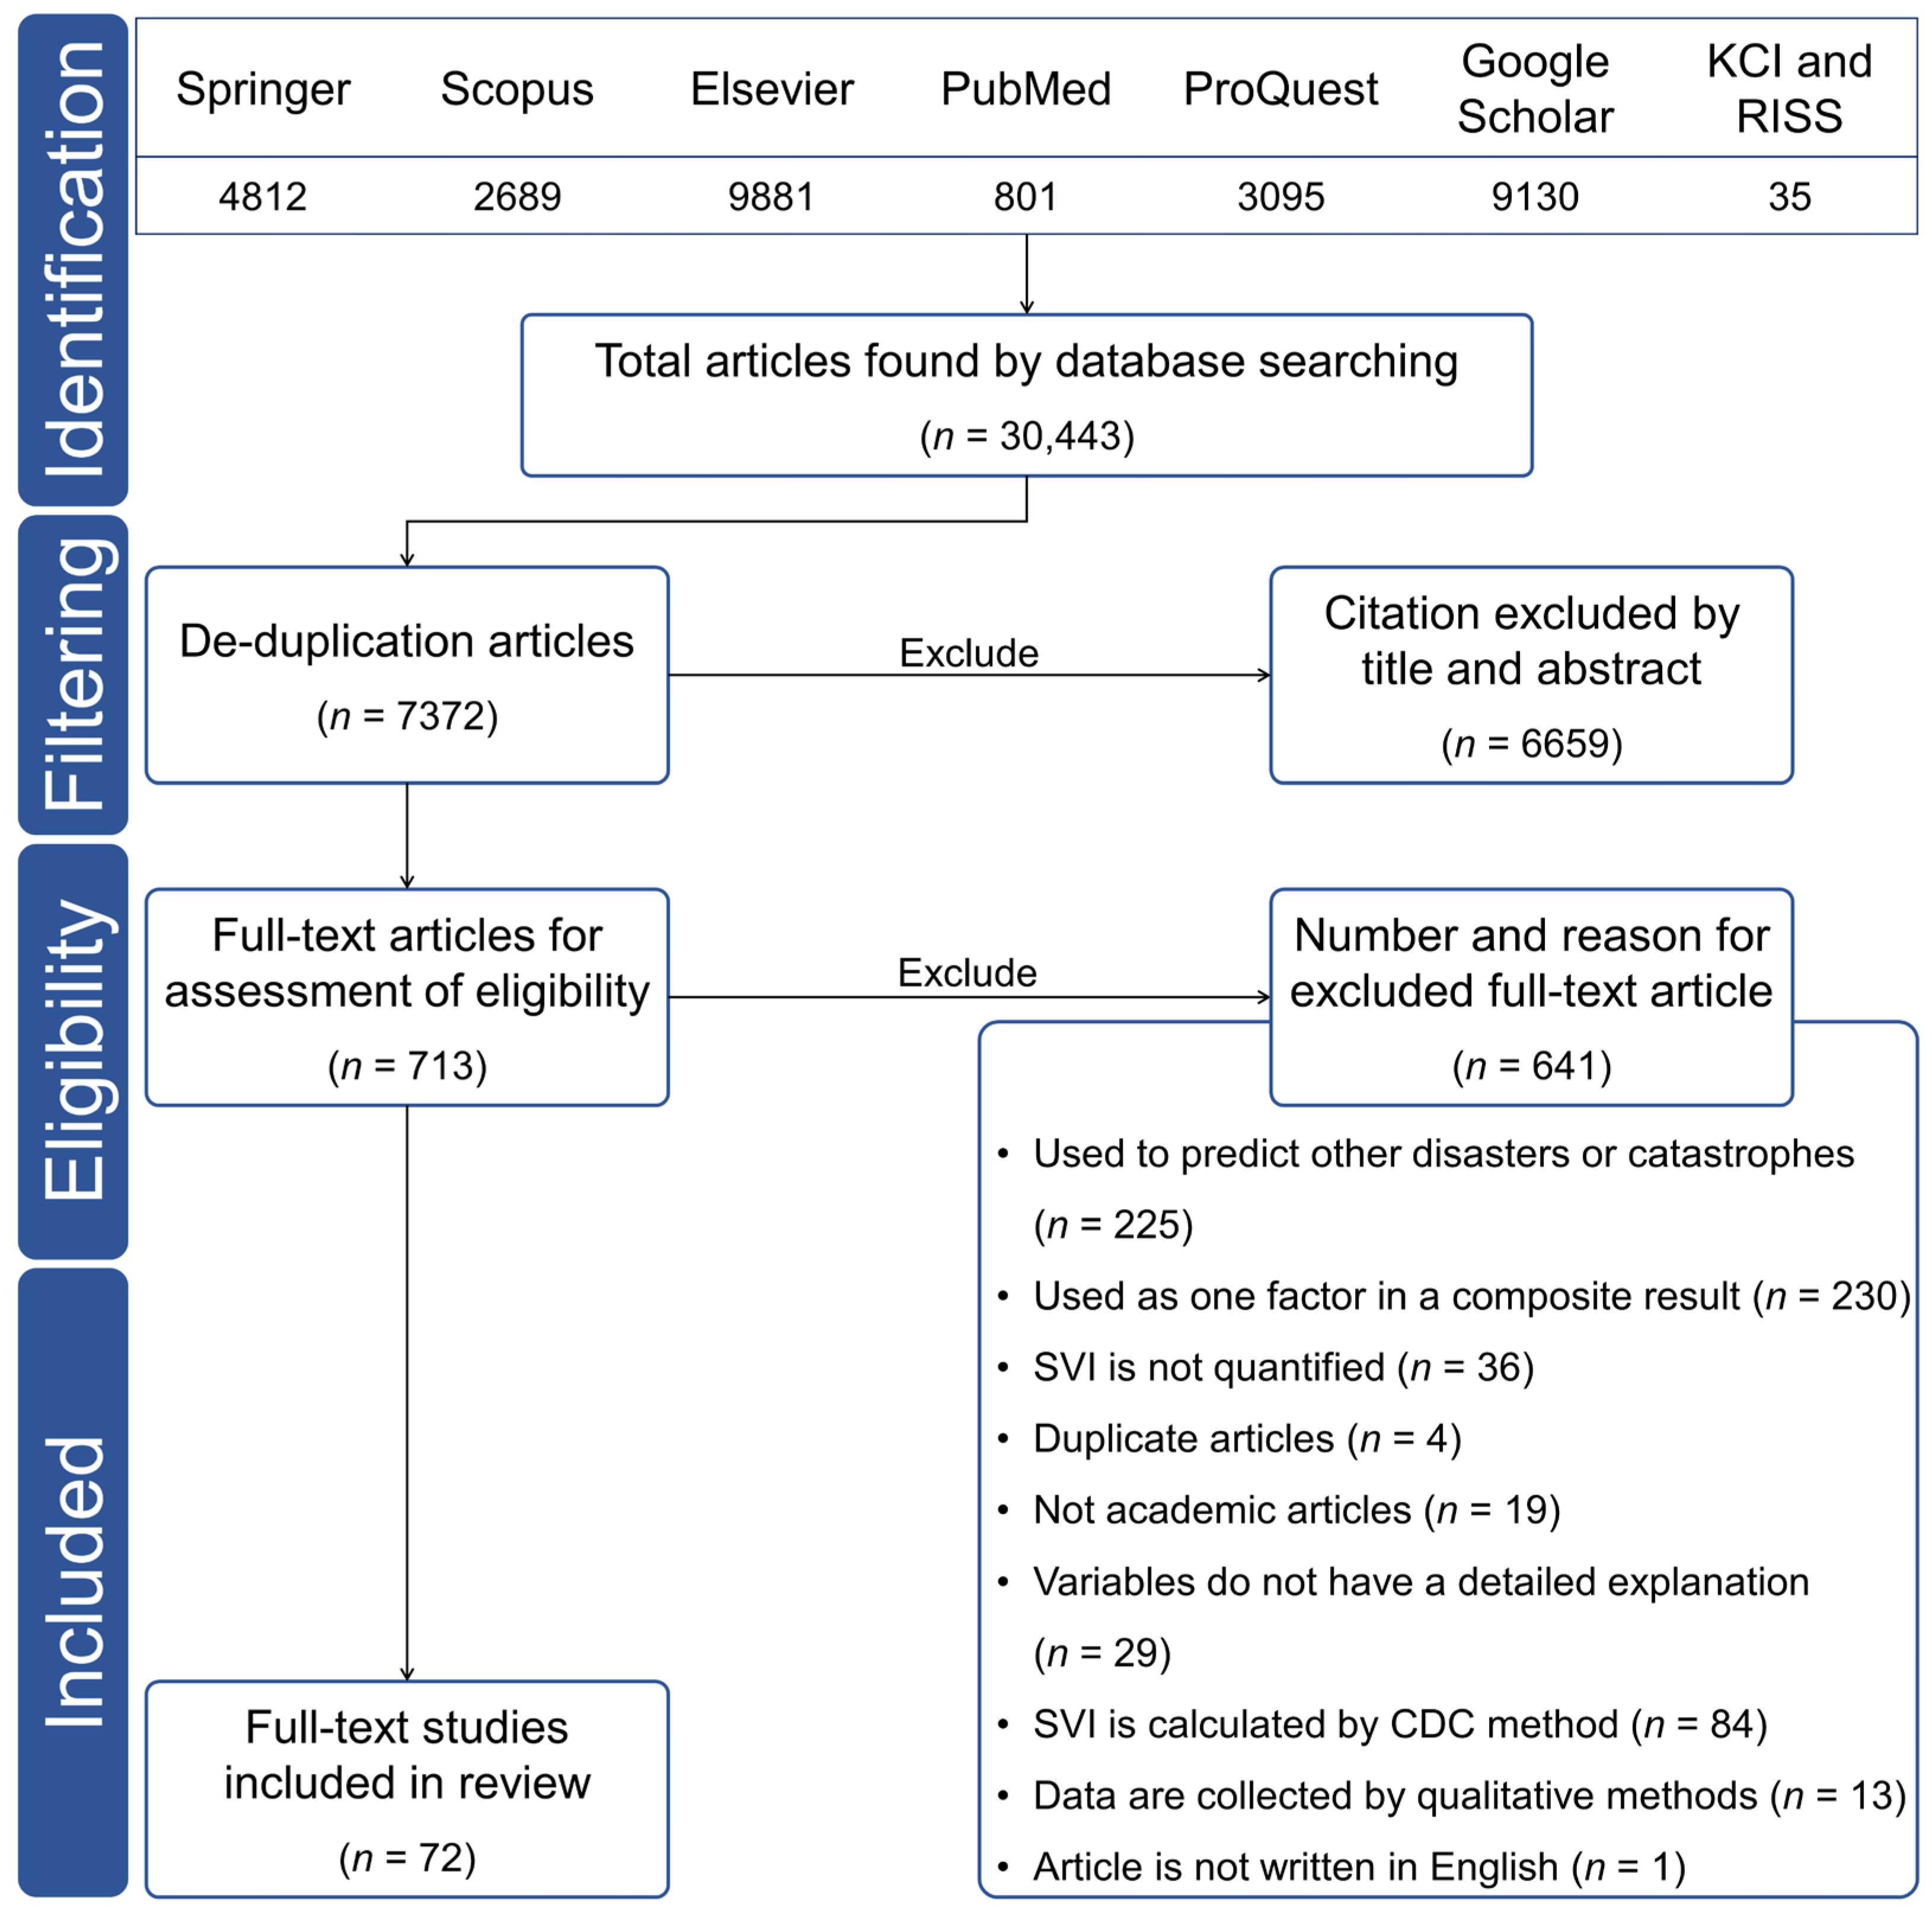
In order to mitigate these limitations, the present study utilizes a scoping review methodology to systematically investigate the range of variables employed in research pertaining to the Social Vulnerability Index (SVI). Scoping reviews are particularly effective for delineating intricate research domains, as they offer a thorough overview of the existing literature while simultaneously identifying gaps and emerging trends [
41]. By adhering to the PRISMA-ScR guidelines, this study guarantees methodological transparency and consistency [
42], which are essential for tackling the theoretical and practical challenges inherent in SVI research.
This theoretical framework emphasizes the importance of identifying diverse and contextually relevant indicators in vulnerability assessments. Through a systematic scoping review and analysis of variables across various disciplines and contexts, this study addresses gaps in indicator diversity and lays the groundwork for fostering greater consistency in future research. By reinforcing the theoretical underpinnings of social vulnerability research, this approach highlights the need for a more inclusive and systematic approach to indicator selection, providing valuable insights that improve the accuracy and applicability of vulnerability assessments. The findings from this review offer a robust foundation for developing context-sensitive methodologies essential for effective disaster risk reduction and sustainable land-use planning.
This study first utilized a scoping review to select proxy variables that could affect the Social Vulnerability Index. A scoping review is an increasingly popular approach to synthesizing research [
43,
44] and focuses on understanding the scope and nature of the research topic and providing an overview of the related research field [
45]. It is intended to explore the overall context of the related literature and draw a conceptual map, rather than to provide a clear answer to a specific research question [
46]. In this study, a scoping review was deemed appropriate because the goal was to understand the scope and nature of previous research and to explore various variables to understand the overall context [
47]. However, scoping reviews have been criticized for their lack of consistency in terms and methods used, despite the continuous development of research [
48]. This is because applying different methods to the same question can lead to different results, which can reduce the usefulness and reliability of the results [
49]. The proposed method to solve this problem is the PRISMA extension for scoping reviews (PRISMA-ScR), and this study conducted the research following the PRISMA-ScR guidelines. PRISMA-ScR is an extension of Preferred Reporting Items for Systematic Reviews and Meta-Analyses (PRISMA) and allows comprehensive and effective exploration of the literature on the research topic. In addition, by utilizing PRISMA-ScR, both methodological transparency and the usability of research results can be increased [
41].
2.1. Data Sources
For the purpose of the study, data were collected using bibliographic and citation databases, focusing on materials published through July 2024. We did not specify a starting date in our search criteria because research on social vulnerability has been ongoing for more than 50 years, with continued quantitative assessments of vulnerability in various ways [
32]. Searches were conducted across multiple platforms, including Google Scholar, PubMed, Elsevier, Springer, Scopus, and ProQuest. Furthermore, the Korean Citation Index, the Research Information Sharing Service platform, and Google Scholar were employed to gather information from studies written in Korean.
2.2. Search Strategy
In this scoping review, we implemented a uniform search approach across all sources. The search for international literature was performed using the keywords “Social Vulnerability” AND “Indicators, Components, or Index”. In the context of domestic literature, we employed Korean translations of English words that conveyed identical meanings. The search strategy was selected to identify the social variables for the construction of an SVI.
From the literature search, each author conducted an independent investigation and created a single literature file to include whole articles. Literature that was judged as potentially eligible through title and abstract filtering was also conducted by each author independently. After not eligible documents were removed during the first screening, full-text reviews were also performed by each author following the same process. In the case of disagreement, the article was finally decided on after sufficient discussion.
2.3. Eligibility Criteria
To ensure the quality of the papers, only those written in English or Korean were included, and only peer-reviewed and published papers were considered. Studies that did not quantify SVI as an index or collected data using qualitative methods, such as surveys, were excluded. When qualitative data collection was included, the composition of the variables or the subject of the study was limited [
40], which does not fit the purpose of this study. Studies that used SVI as one of the multiple components for composite results were excluded because most studies that used SVI as a factor to form a comprehensive result no longer focused on SVI [
41]. This analysis excludes instances in which the Social Vulnerability Index (SVI) was utilized for predictive purposes. Predictive studies are often instrumental in elucidating potential vulnerabilities by forecasting future scenarios and modeling the impacts of disasters [
50]. Such studies play a crucial role in enhancing preparedness and risk mitigation strategies by identifying possible outcomes under diverse conditions [
51]. However, their methodological emphasis diverges from the systematic examination of social variables, which constitutes the primary focus of this review. Predictive models typically involve assumptions, temporal projections, and hypothetical scenarios, thereby introducing uncertainty that does not align with the objectives of this study [
52]. In addition, predictive studies often incorporate a wide range of external variables to forecast final outcomes, which can obscure the specific roles and contributions of social indicators in the SVI calculation process [
53]. This approach introduces significant complexity into the systematic analysis of these indicators. By omitting predictive studies, this review preserves a focused analysis of the existing literature, aiming to identify patterns, gaps, and trends in the selection and application of social variables. This strategy ensures that the findings are directly relevant to the refinement of SVI methodologies, thereby enhancing their consistency and improving their adaptability to diverse socio-environmental contexts. However, studies that identified the correlation between SVI and other phenomena were included. Unlike predictive studies, correlation studies explore relationships without attempting to establish causality or forecast specific outcomes. These studies provide insights that align closely with the objective of this review, as they focus on understanding how social variables interact within the SVI framework [
22]. Correlation analyses allow for the identification of significant patterns and relationships that can inform the development of context-sensitive SVI methodologies while maintaining methodological transparency and reliability. In addition, according to the ultimate goal of this study, literature that did not include social variables, literature that did not define or explain variables, and literature that followed the CDC method, were excluded. Newly developed studies based on the CDC method were included, but studies that directly followed the CDC method were all conducted in the United States as the research area, and the number of such documents was quite large to prevent bias in the research results.
2.4. Data Charting Process
In this study, data charting was performed to collect and organize the variables used in SVI studies conducted in various fields. For this purpose, the selected literature was systematically derived through a predefined qualification review, and a chart including general information (author, publication year, study area), application field (environment, natural disaster, climate, etc.), and research purpose of the first selected study was created. Second, to understand how SVI is calculated, a chart including core methodology, weight setting, visualization method, etc., was created. Finally, to understand the context in which the variables constituting SVI were used, the definitions of the social variables used in each study were identified, and the contexts were recorded. Data management was performed using Excel and Python, and in this study, a case study was performed to identify variables that could be utilized in the development of the Social Vulnerability Index in Korea based on this data.
2.5. Synthesis Methods
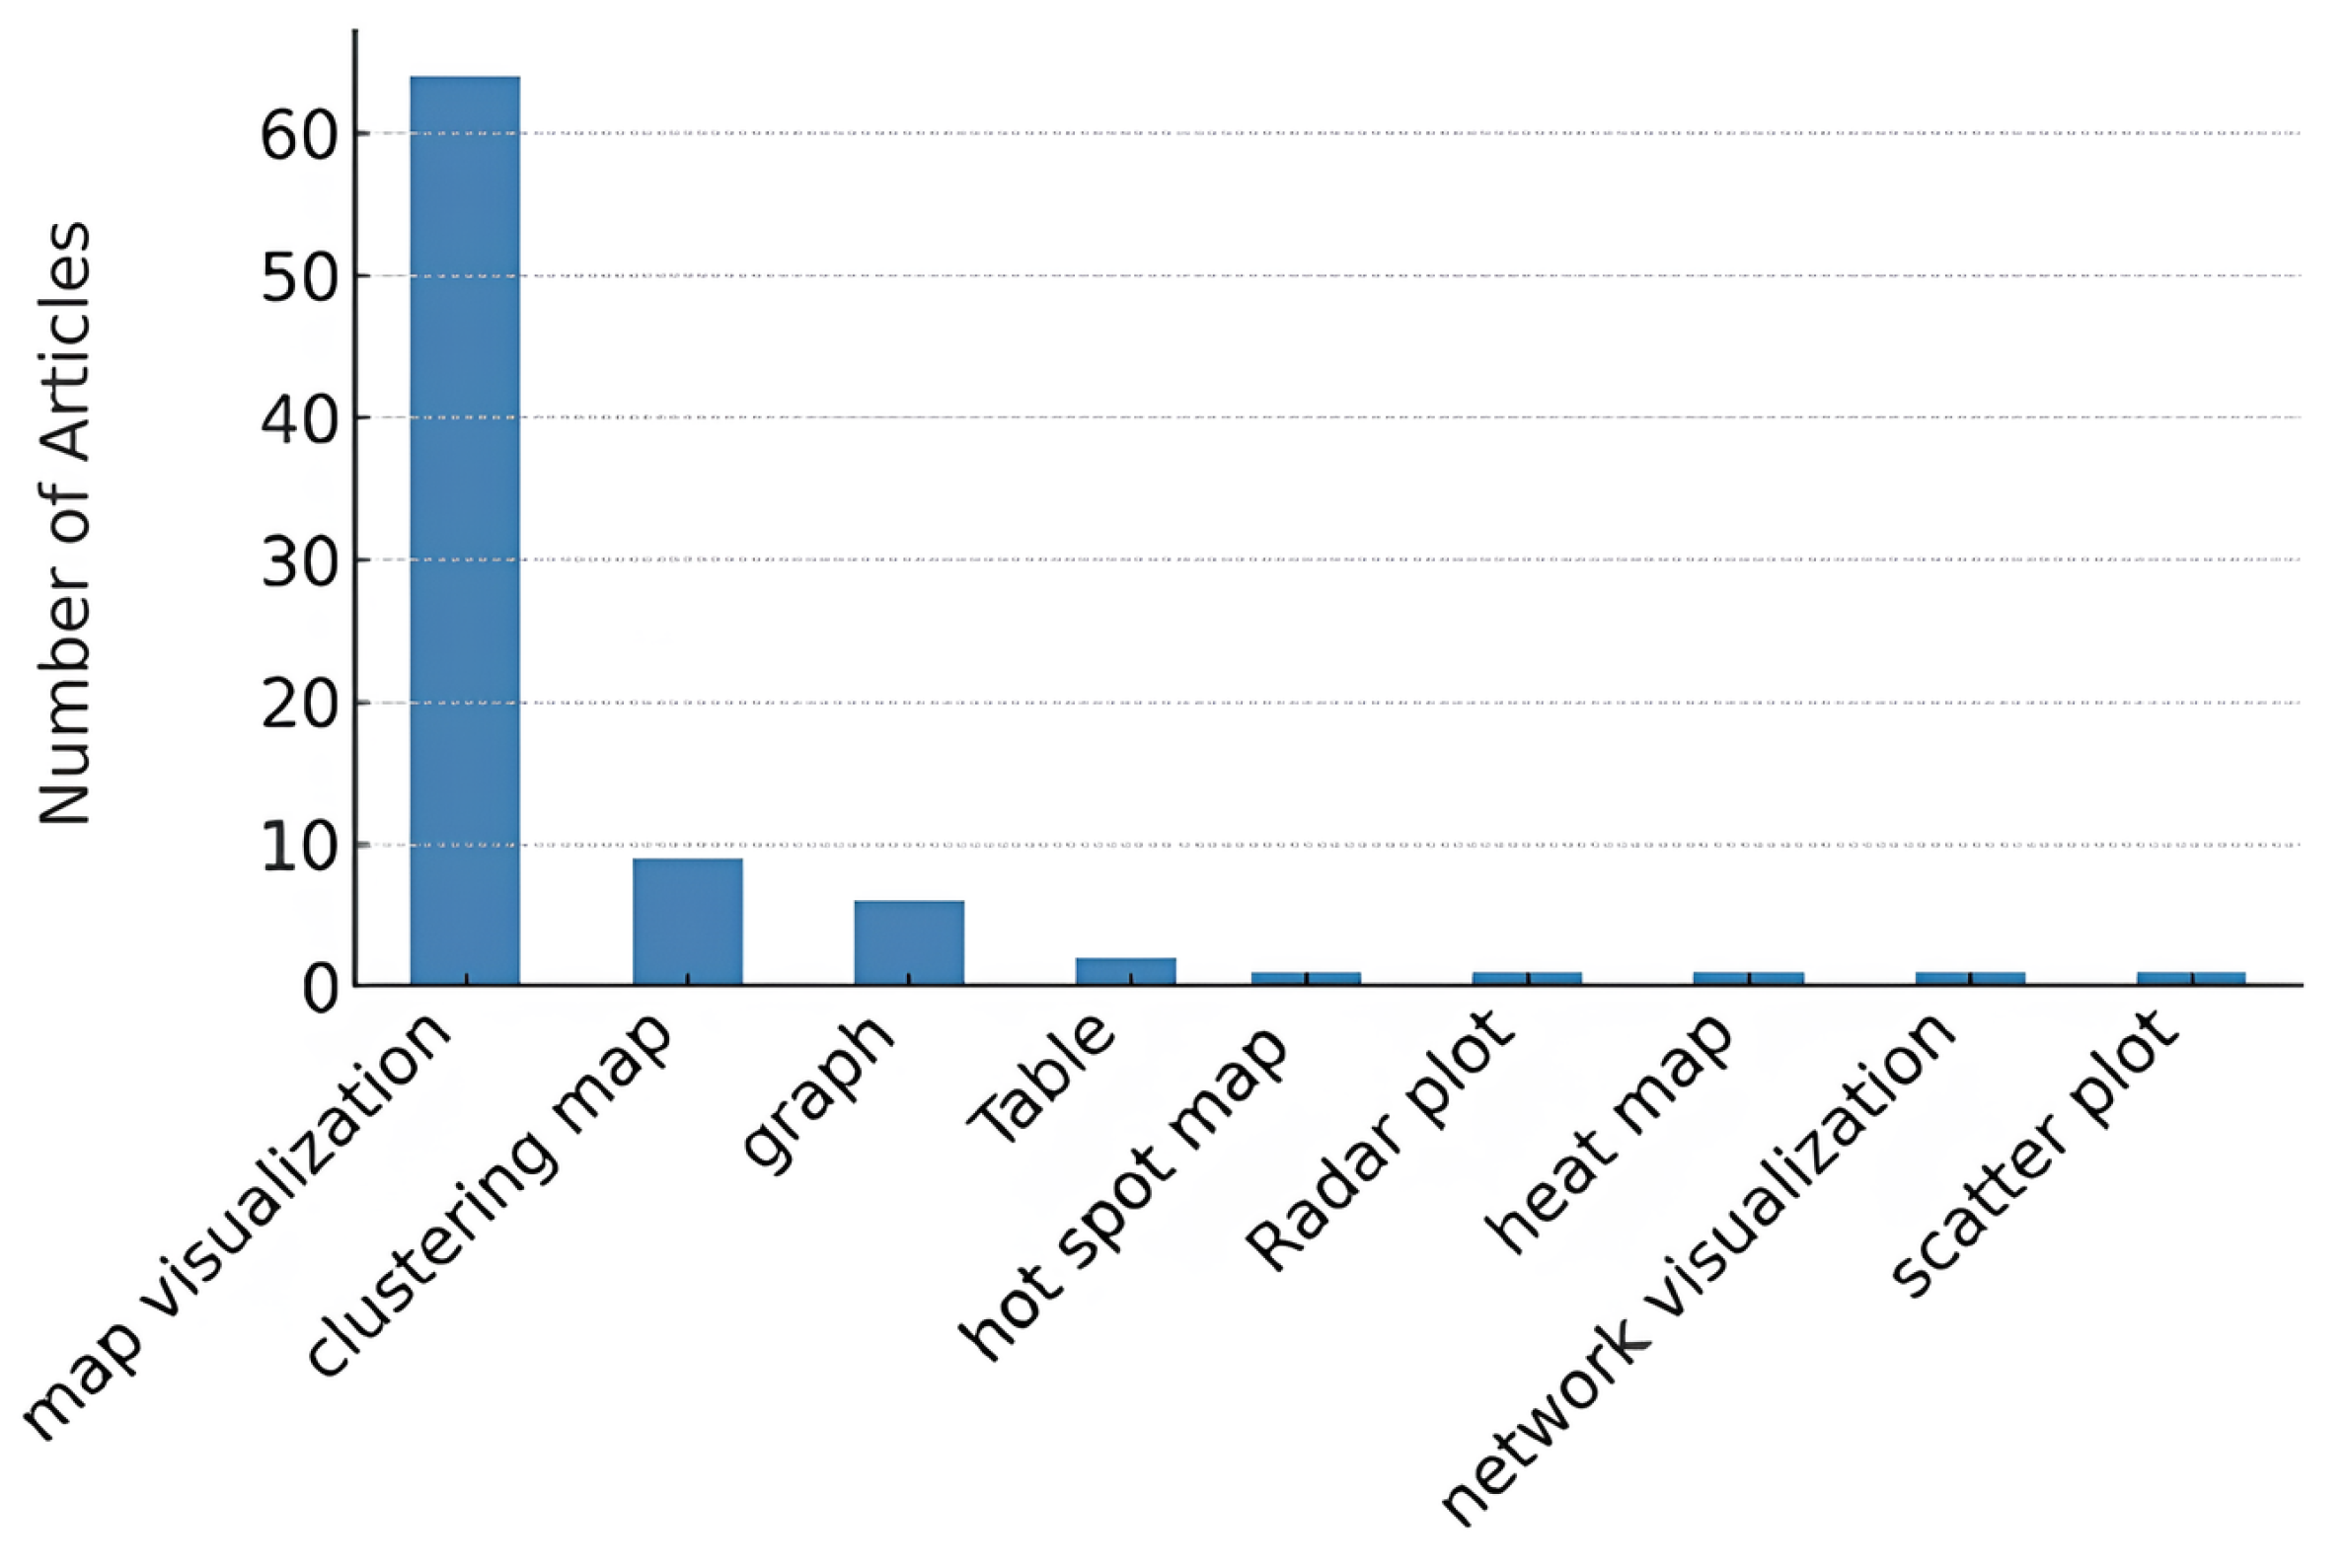
Charted data must undergo a comprehensive analysis process to summarize the characteristics of Social Vulnerability Index studies conducted so far, to understand the index calculation method, and to identify the context in which the variables were used. The research outline was categorized by application field and organized by the number of documents by year, research region, and research scale. The SVI calculation method items were visualized based on the core methodology used in each study to calculate SVI, and to organize variable information it was organized based on variable names, explanations, descriptions, units, and data sources.
4. Discussion
This study examined the variables used to calculate the Social Vulnerability Index (SVI) and the contexts in which they are applied, emphasizing a comprehensive review of previous studies. While prior research often narrowed the scope of variable selection and overlooked diversity in their approach [
32], this study sought to address these limitations by investigating all the relevant literature across various fields. By systematically reviewing the variables and their definitions, this study provides foundational insights that can support more precise and inclusive social vulnerability assessments. This approach aligns with the necessity to consider diverse factors and methodologies, facilitating more versatile applications in fields such as land use and disaster management, without limiting the findings to specific areas.
In alignment with the objectives of this study, a thorough qualification examination and subsequent final literature review revealed that the majority of existing research was focused on natural disasters. This finding underscores the prevalence of Social Vulnerability Indices (SVIs) in studies addressing disaster-related themes. However, significant exclusions were necessary to maintain the scope and relevance of this study. Specifically, literature that utilized the SVI for predictive purposes was excluded. This decision was driven by the observation that a clear causal relationship between the SVI and specific phenomena has yet to be consistently established. Studies employing the SVI as one component within a broader composite outcome were also excluded to ensure that the focus remained on research explicitly centered on SVI development and application. These two exclusion criteria accounted for the majority of the literature that did not qualify for inclusion. Examples of excluded studies include those predicting the scale of damage or exploring the relationships between the SVI and various social phenomena [
54,
55]. Furthermore, studies utilizing the CDC method were excluded to avoid potential bias in the research toward the methodological framework of a single country. The CDC approach, while widely recognized and applied, predominantly reflects the context of the United States, particularly in the medical and health domains. This methodological focus risks limiting the diversity and global applicability of the findings. Notably, a substantial number of studies related to the COVID-19 pandemic were reviewed, but the majority did not meet the inclusion criteria and were consequently excluded [
56]. These results highlight two critical observations: first, the SVI is frequently employed as a tool for predicting various outcomes or as a single factor within larger analytical frameworks; second, it is most actively utilized in the United States, with its applications concentrated in the health and medical sectors. These findings suggest that while the SVI has proven utility in certain fields, its reliance on the CDC method may constrain its adaptability and relevance in broader, cross-regional contexts. Consequently, this study emphasizes the importance of examining diverse methodologies and applications to develop a more universally applicable understanding of social vulnerability.
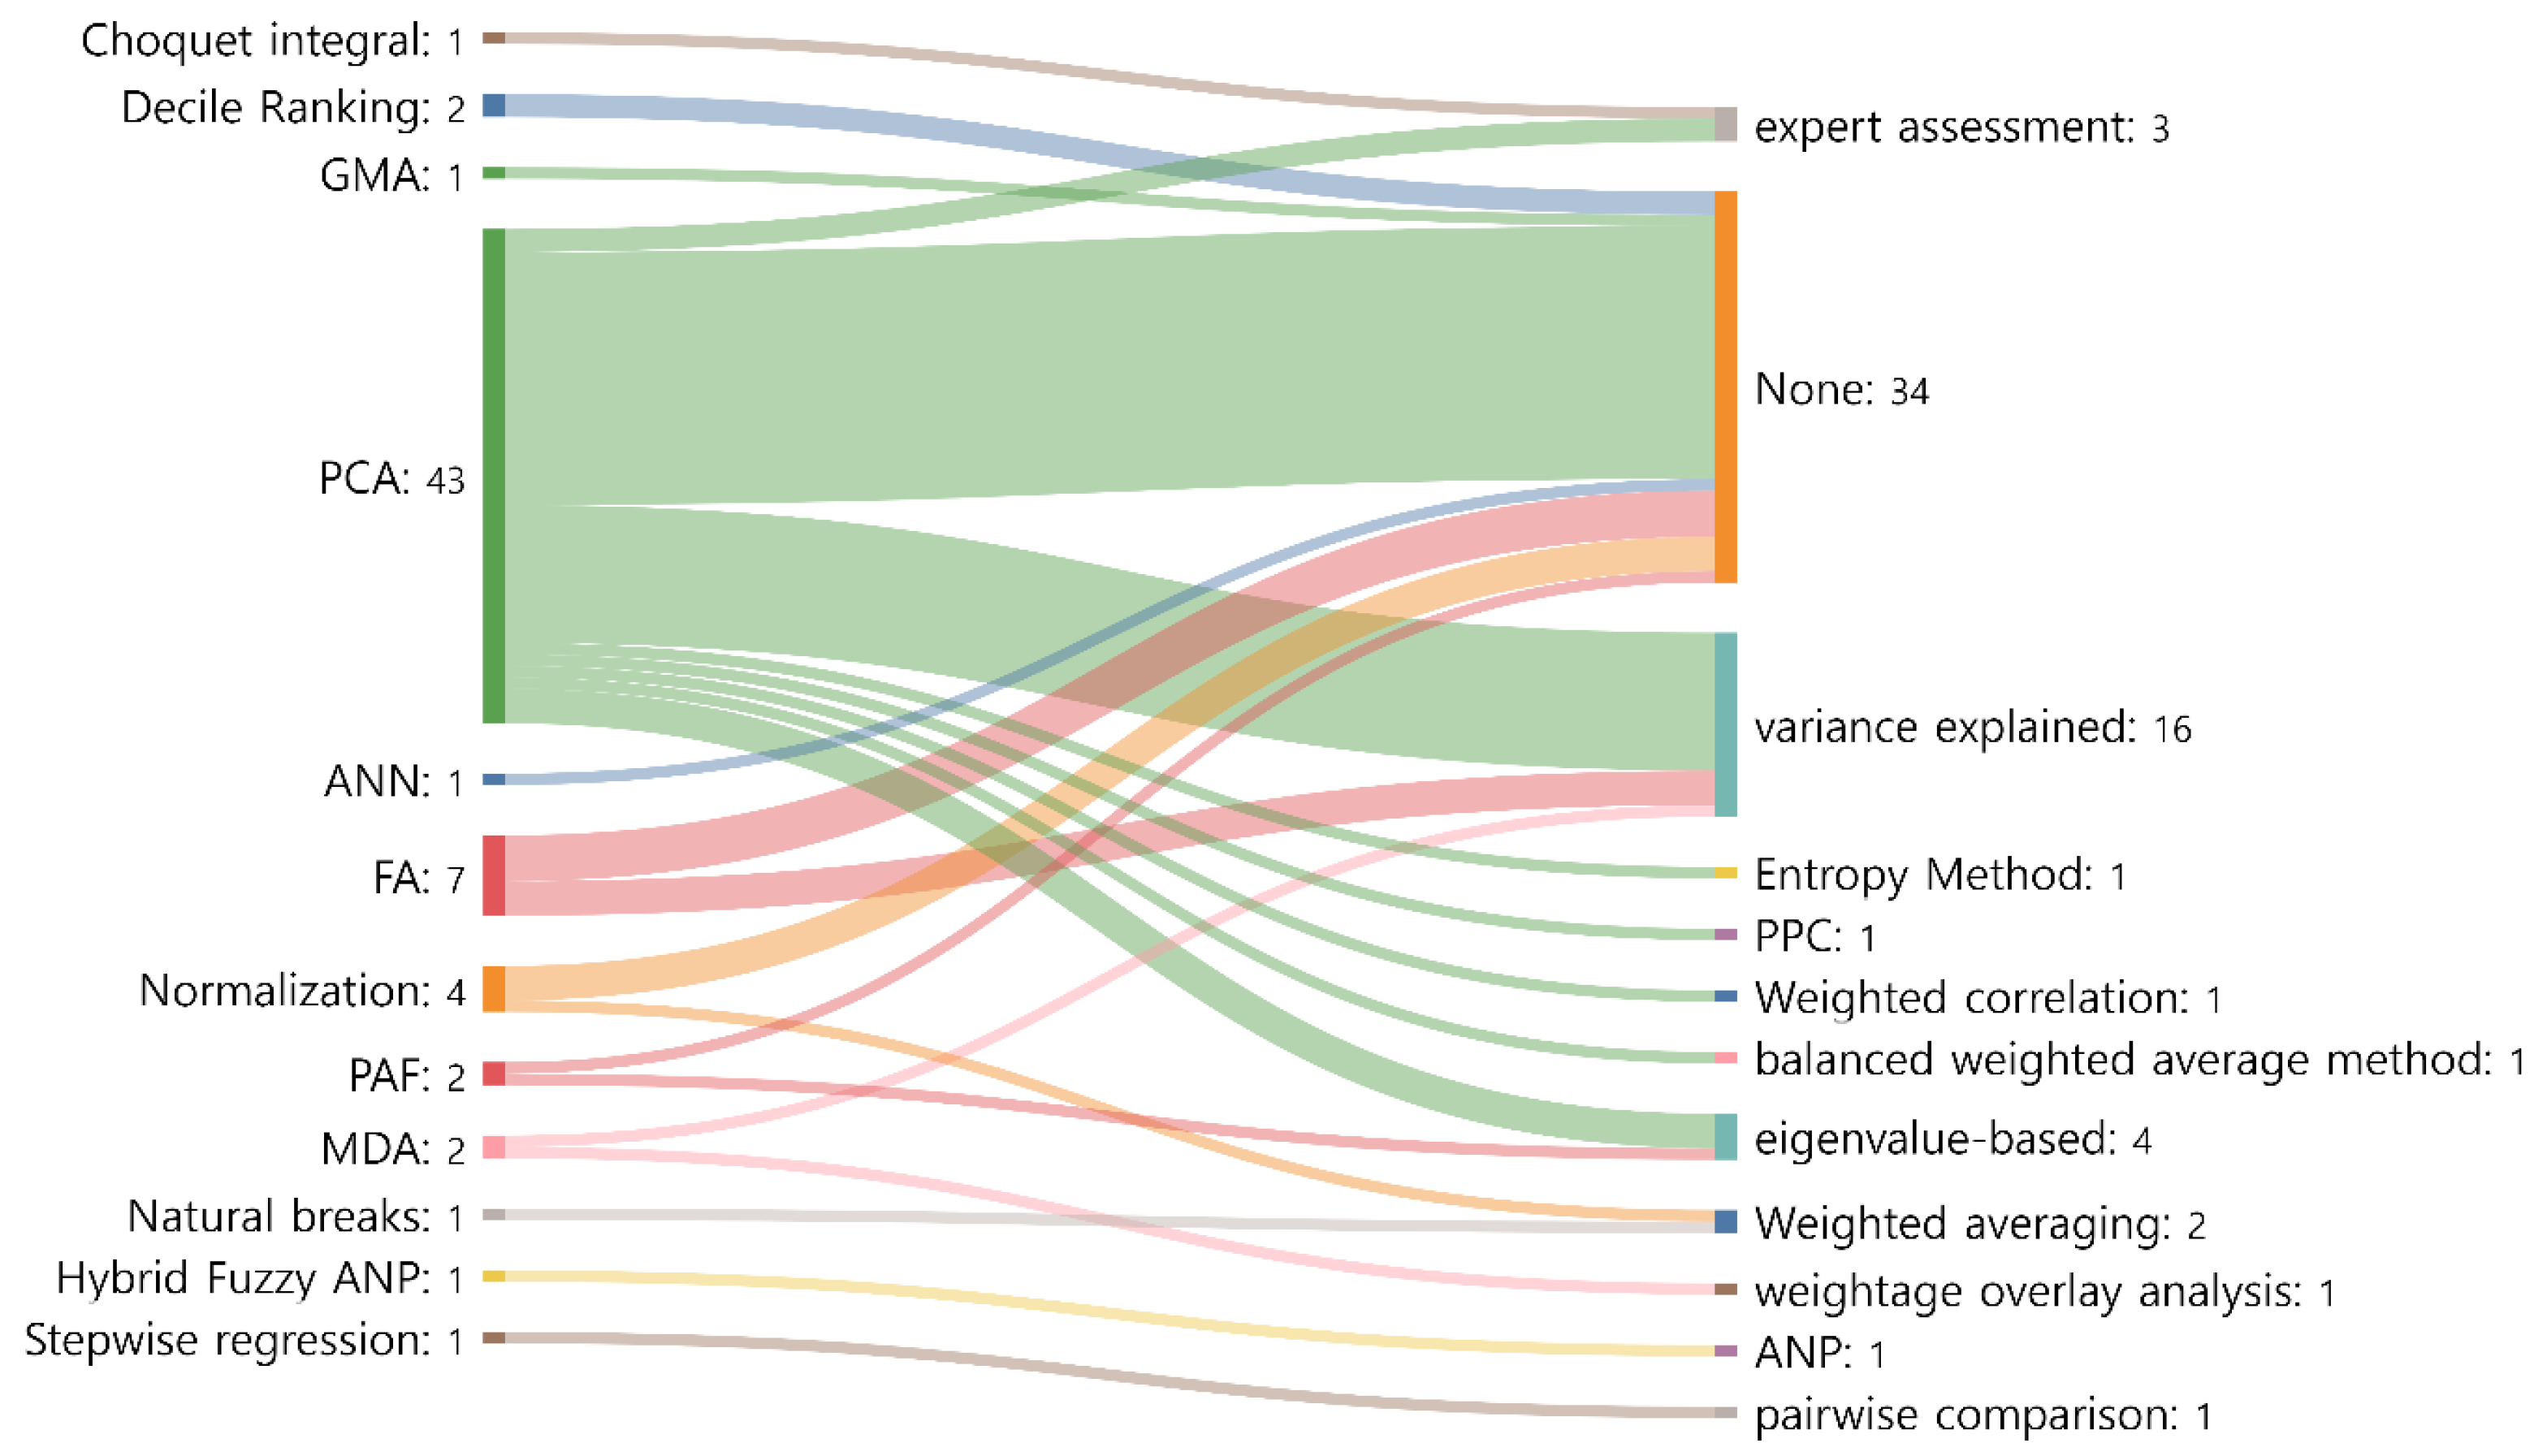
As a primary method for calculating the Social Vulnerability Index (SVI), principal component analysis (PCA) was utilized in over half of the reviewed literature. This observation reinforces the hypothesis that, despite differences in study areas or selected indicators, most studies adopt similar methodological frameworks for calculating the SVI [
57]. However, it is noteworthy that not all studies employing PCA strictly adhered to the existing Social Vulnerability Index (SoVI) methodology. A significant number of studies sought to address the known limitations of the SoVI method, particularly the weighting issue, by introducing alternative approaches [
58,
59]. Among the most commonly applied weighting methods were those based on variance explanatory power and eigenvalues, which are particularly suited for statistical techniques such as PCA or factor analysis (FA). In addition to these quantitative approaches, qualitative methods like the Analytic Hierarchy Process (AHP) and expert evaluations also emerged as viable strategies in the reviewed studies [
60,
61]. The presence of these qualitative methods indicates a growing recognition of the limitations inherent in purely statistical approaches. Specifically, many researchers have argued that statistical results alone fail to adequately capture the nuanced ways in which social vulnerability is influenced, necessitating complementary methods that incorporate expert judgment and context-specific insights [
23]. This diversification in weighting approaches reflects an effort to enhance the robustness and applicability of SVI calculations. While PCA remains a predominant method for constructing the Social Vulnerability Index (SVI) due to its ability to handle multivariate data and identify latent dimensions, it has limitations in capturing contextual nuances and incorporating expert judgment. To address these challenges, qualitative methods and alternative approaches, such as the Analytic Hierarchy Process (AHP) or Delphi method, could complement PCA by offering context-specific insights. These methods allow for the integration of expert opinions and stakeholder input, ensuring that the selected indicators reflect both statistical robustness and local relevance. For instance, the Delphi method facilitates consensus-building among experts, which can be particularly valuable in defining region-specific indicators for the SVI [
62]. Similarly, the AHP enables researchers to prioritize indicators through pairwise comparisons, thereby addressing the inherent subjectivity in variable weighting [
63]. By combining these qualitative approaches with quantitative techniques like PCA, future research could achieve a more balanced and adaptable framework for constructing SVI. By integrating both quantitative and qualitative methodologies, these studies aim to mitigate the interpretive challenges posed by relying solely on statistical correlations, thus offering a more comprehensive framework for understanding and addressing social vulnerability across varying contexts.
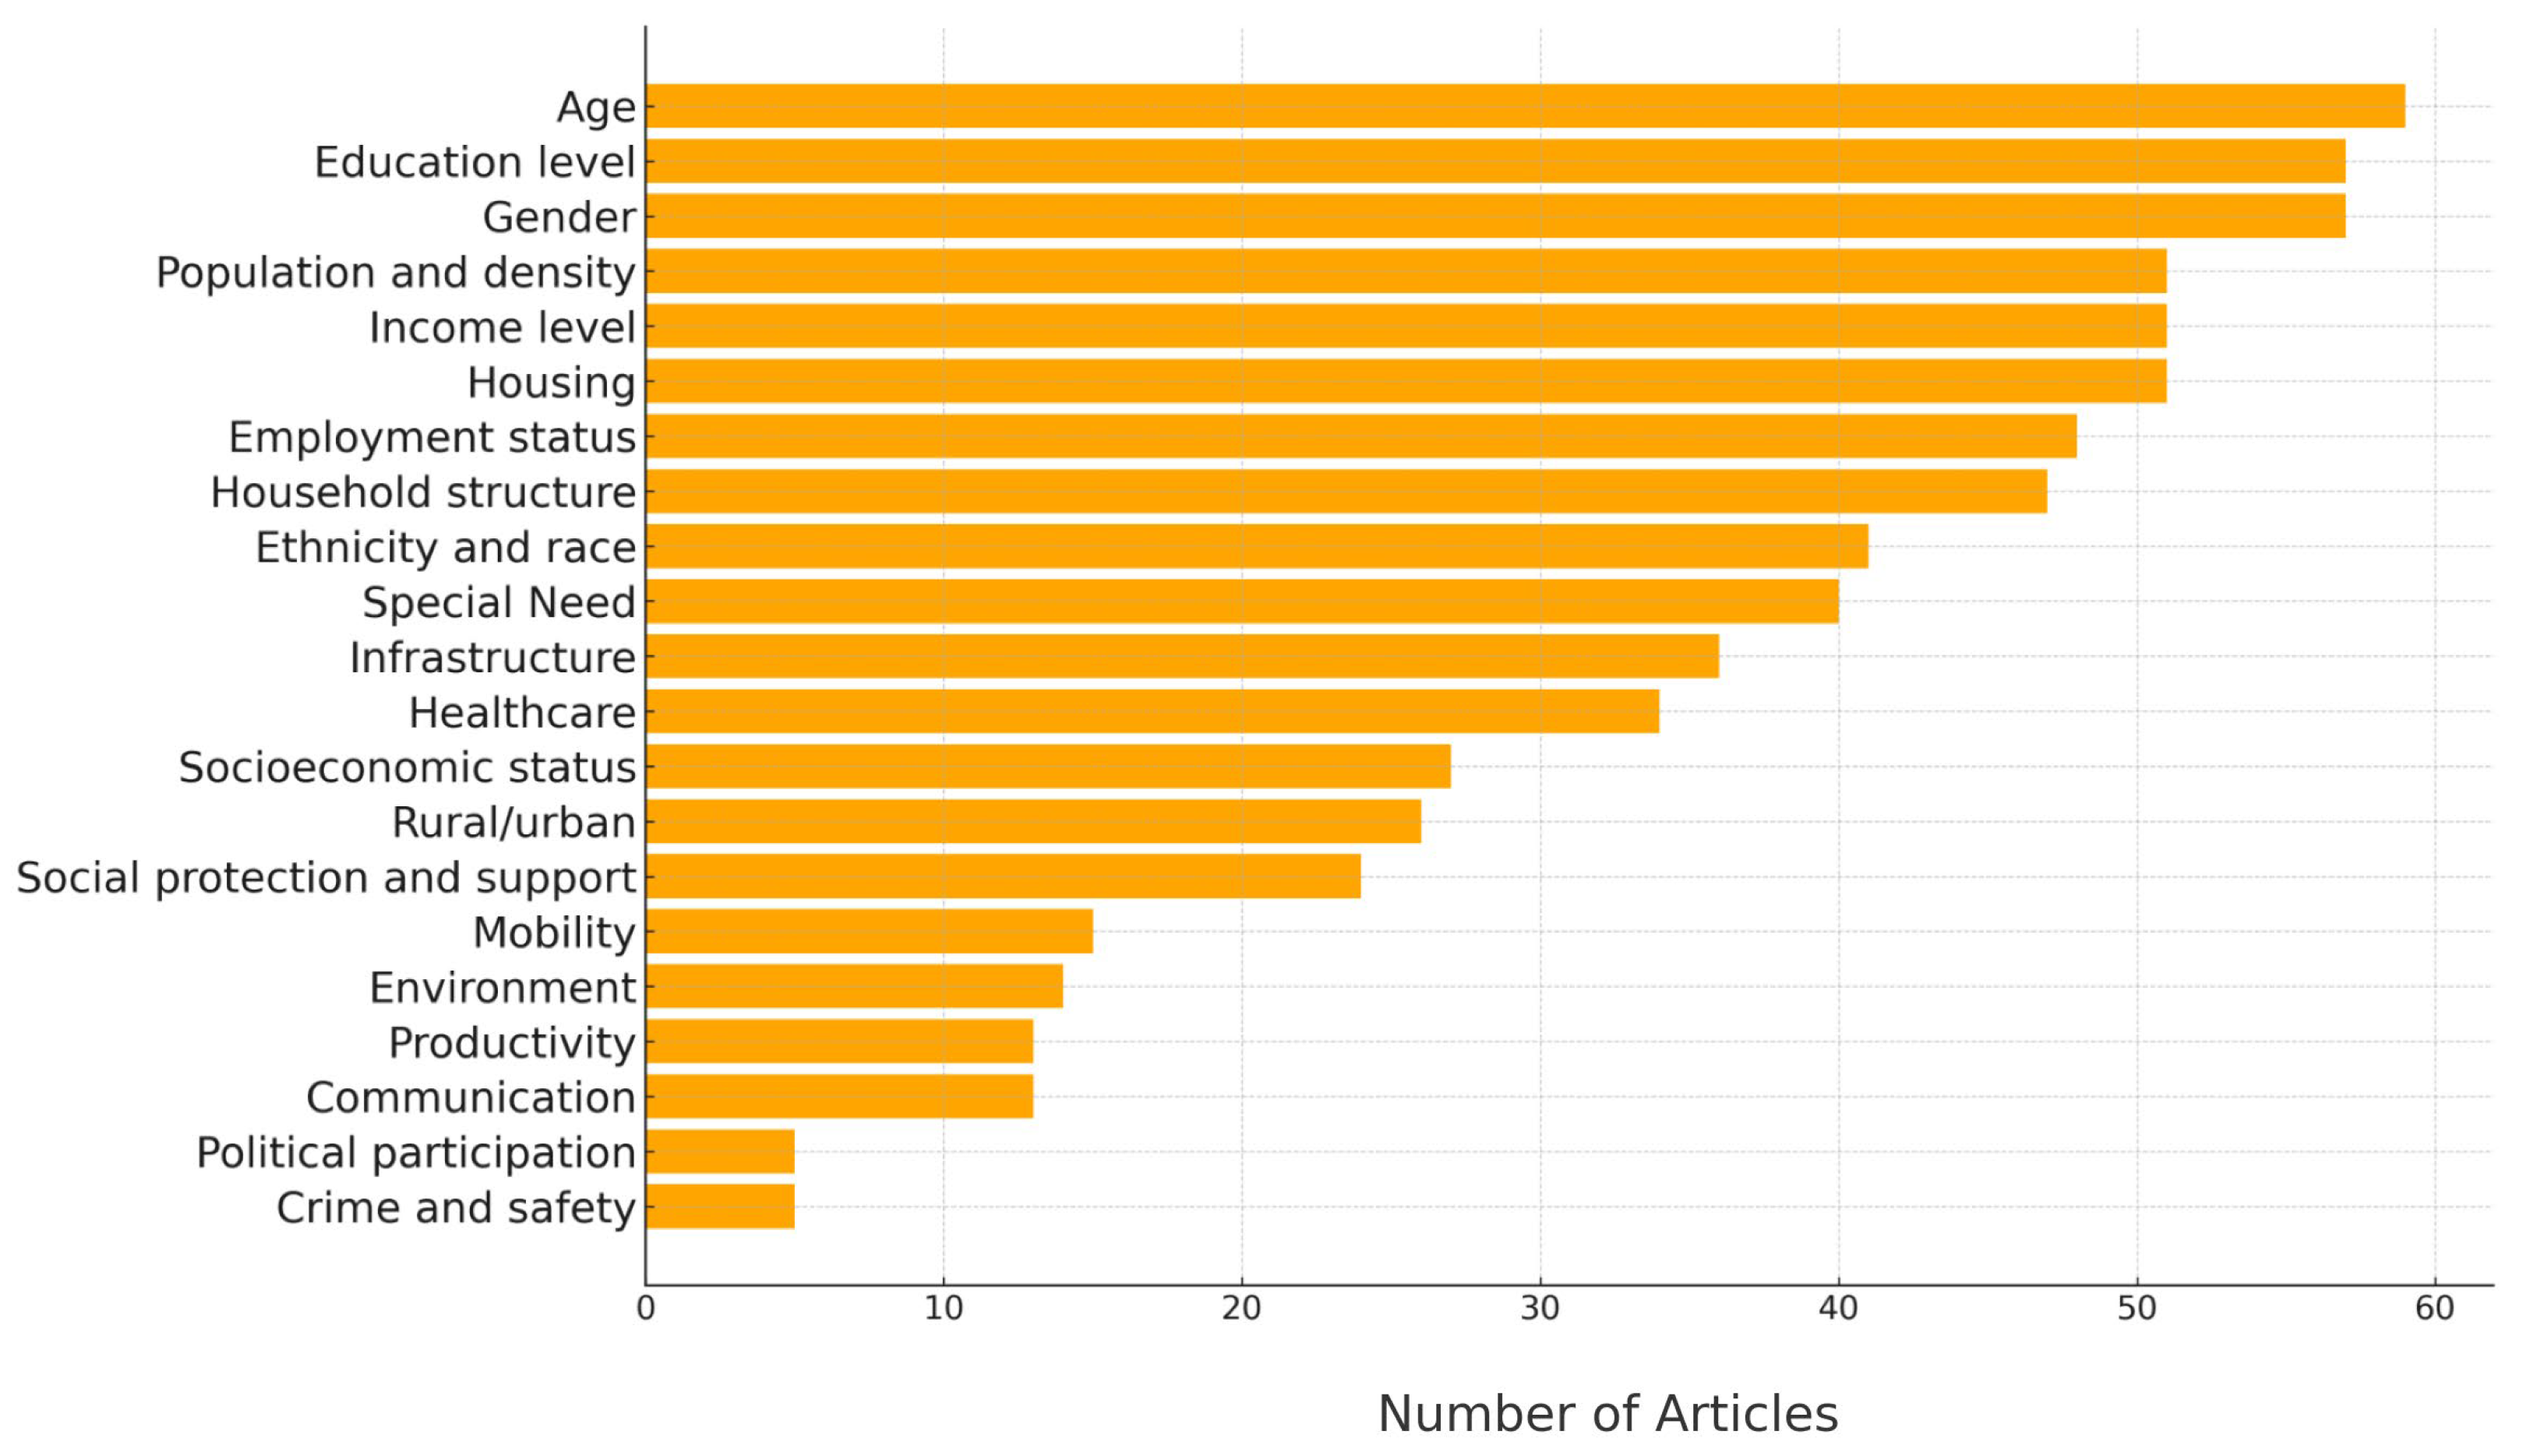
In this study, a total of 21 domains were identified as integral to the construction of the Social Vulnerability Index (SVI), with age emerging as the most frequently utilized domain. This finding aligns with the historical trajectory of social vulnerability research, where age has been a foundational component since the inception of conceptual studies in this field [
15]. Interestingly, despite the predominance of natural disaster-related studies among the selected literature, the environment domain was found to be relatively under-represented. This suggests that, even in research focused on natural disasters, the inclusion of environmental elements directly connected to actual disaster conditions remains uncommon. A plausible explanation for this gap is the difficulty in obtaining reliable and comprehensive environmental data, which poses significant challenges for integration into vulnerability assessments [
64]. A total of 61 indicators were identified across these domains, each representing sets of variables with highly similar or identical meanings. The selection of variables for SVI calculation in various studies has often been guided by conceptual frameworks that examine the relationship between vulnerability factors, or by practical considerations such as data availability, derivation from prior studies, or expert judgment. However, the absence of a clearly established standard for variable selection highlights an ongoing challenge in achieving consistency and comparability across studies [
65]. The absence of standardization highlights the significance of this study’s findings, which serve as a detailed guide for selecting appropriate variables in future efforts to calculate the Social Vulnerability Index (SVI). The insights from this result are particularly relevant for research targeting natural disasters, as they offer a structured framework for incorporating domain-specific variables that can enhance the accuracy and applicability of vulnerability assessments. Additionally, the inclusion of variables beyond the scope of natural disasters broadens the utility of these findings, making them applicable to contexts involving complex, multidimensional challenges, such as land-use planning and socio-environmental management [
66]. For instance, indicators within the environment domain, although underutilized, can be integrated into land-use strategies to identify areas at heightened risk due to both social and environmental vulnerabilities. Similarly, the systematic categorization of indicators can aid policymakers in tailoring interventions that address the interplay between demographic and environmental factors, thereby fostering resilience in diverse contexts [
67]. By presenting a detailed analysis of variable selection practices and their implications for SVI construction, this finding provides a valuable resource for researchers and practitioners aiming to enhance the methodological rigor and practical relevance of social vulnerability assessments. These findings not only contribute to a deeper understanding of the factors shaping social vulnerability but also facilitate the development of more nuanced and adaptive frameworks for its application in fields such as disaster risk reduction, sustainable development, and land-use planning.
This scoping review examined the contributions of each identified domain and indicator to the Social Vulnerability Index (SVI), providing insights into their frequency of use, criteria for application, and contextual relevance. Among the domains analyzed, age emerged as the most frequently utilized, accounting for approximately 10% (140 variables) of all identified variables. These variables were broadly categorized into three indicators, predominantly addressing elderly and youth populations (see
Table S6). However, considerable variation was observed in the criteria used to define these populations. While the thresholds of 5 and 65 years were the most commonly applied, other studies extended these boundaries to include ages as high as 85 years or as low as under 18 years [
68,
69]. This variability underscores the importance of setting thresholds that align with the demographic and socio-cultural characteristics of the target region, rather than adhering to a single standardized criterion. The frequent use of the 5- and 65-years thresholds may indicate their broader applicability, but flexibility remains essential to capture local nuances effectively. In the context of land-use planning, age-related indicators that reflect regional demographic characteristics can help identify areas where infrastructure improvements are needed to support aging populations, such as healthcare facilities or senior housing [
70]. Similarly, these indicators can inform the development of programs aimed at increasing disaster preparedness among youth populations [
71].
Similarly, the education level domain was widely applied across the reviewed studies, with its criteria reflecting significant variations shaped by differing national conditions (see
Table S6). In higher-income countries, the emphasis was predominantly on formal education attainment, particularly the completion of secondary or tertiary education [
33,
72]. Conversely, in less-developed countries, indicators such as illiteracy rates and basic literacy were more commonly used to measure educational vulnerability [
73,
74,
75]. This disparity underscores the contextual nature of education-related indicators, as countries adapt their selection to reflect socio-economic realities and the availability of data. Most studies consistently identified a strong correlation between lower education levels and increased social vulnerability, reaffirming education as a critical domain for SVI calculations. Despite its importance, the education level domain does not necessitate a universally agreed threshold for determining vulnerability. The criteria used are inherently shaped by localized challenges and socio-economic conditions [
76]. In higher-income contexts, formal education levels like secondary or tertiary attainment are emphasized due to broader accessibility and systemic expectations. In contrast, lower-income regions often rely on measures such as illiteracy rates or basic literacy, aligning with their distinct educational contexts [
77]. This diversity highlights the need for tailored education indicators that reflect the unique needs and circumstances of each region, rather than adhering to rigid, universal thresholds.
The gender domain emerged as the third most frequently utilized in the reviewed literature and was categorized into two primary indicators (
Table 3). Gender-related variables predominantly measured the number or proportion of women or focused on women occupying specific roles within their communities. Notably, among the extensive range of variables identified in this domain, only one explicitly referenced males [
78]. This disproportionate focus on women suggests a prevailing assumption within the literature that the presence of women is inherently associated with heightened social vulnerability. This notion reflects broader societal perspectives and has historical underpinnings in vulnerability studies [
79]. However, this assumption warrants critical examination, particularly in light of the complex relationship between gender, human rights, and social vulnerability. Studies have consistently underscored a strong link between limited human rights and increased social vulnerability [
80]. In this context, the frequent use of gender-related indicators, particularly those emphasizing women, might seem counterintuitive in countries with strong protections for women’s rights [
81,
82,
83]. While areas with low levels of women’s rights undoubtedly remain, an increasing number of nations now exhibit high levels of gender equality and empowerment [
84]. In such contexts, the continued reliance on gender indicators, especially those focused solely on women, raises questions about their effectiveness and relevance in accurately reflecting social vulnerability. Furthermore, the application of gender indicators must account for evolving societal conditions and regional disparities [
85]. For instance, in countries with high levels of women’s rights, gender-related vulnerability might manifest in different forms, such as disparities in representation or access to leadership roles, rather than in traditional measures like economic dependence or social marginalization [
86]. Conversely, in regions where gender inequities remain pronounced, these traditional indicators continue to hold significant relevance [
87]. This difference highlights the necessity of tailoring gender-related indicators to better reflect the socio-cultural and legal contexts of each study area.
Among the reviewed studies, crime, political participation, and environmental factors emerged as under-represented yet critical domains for understanding social vulnerability. Of the seventy-two studies analyzed, only five included crime-related variables, such as crime rates, community safety, or social unrest. Similarly, political participation variables, including voter turnout, political representation, or community engagement in decision-making, were present in five studies. Environmental factors, such as air quality, proximity to green spaces, and exposure to pollutants, were even less commonly utilized, appearing in only three studies. These findings underscore the limited integration of these domains into Social Vulnerability Index (SVI) calculations, despite their evident significance in influencing vulnerability dynamics.
Crime-related variables are particularly important for understanding community stability and resilience. High crime rates reduce social cohesion, increase fear, limit mobility, and deter investment in vulnerable areas. For example, crime-related factors have been linked to broader socio-economic conditions that exacerbate risks during disasters [
88]. Similarly, the intersection of social unrest with environmental challenges, such as riverbank erosion vulnerability, demonstrates the critical role crime-related indicators play in comprehensive vulnerability assessments [
89]. Political participation variables, while also underutilized, are critical for assessing institutional support and equitable resource distribution. Communities with higher political engagement often have stronger advocacy, better access to resources, and greater influence over policies, which enhance resilience to disasters. Political engagement has been shown to contribute to robust disaster preparedness and recovery strategies, particularly in coastal regions [
81]. Disparities in political representation also influence vulnerability, affecting access to critical resources and support systems [
90]. Indicators such as voter turnout and civic participation could significantly enhance the ability of SVI methodologies to assess institutional equity and its impact on social vulnerability. Environmental factors, despite their direct relevance to disaster vulnerability, were among the least utilized domains in the reviewed literature. Variables such as air and water quality, proximity to green spaces, and exposure to pollutants are critical for understanding the interplay between environmental conditions and human vulnerability. Environmental degradation has been shown to exacerbate livelihood vulnerabilities among smallholders, highlighting the necessity of integrating such variables into vulnerability assessments [
91]. Spatiotemporal patterns of environmental risks, particularly those related to climate change, provide valuable insights into regional vulnerabilities [
92]. However, challenges such as data availability and standardization have likely contributed to their under-representation.
The limited inclusion of crime, political participation, and environmental factors presents an opportunity to broaden the scope of SVI methodologies. Including these domains in a standardized framework would allow for a more comprehensive assessment of vulnerability, addressing the multidimensional factors that shape community resilience. Future research should prioritize the systematic inclusion of these variables to ensure their integration into SVI calculations, enhancing the framework’s applicability across diverse contexts, particularly in urban planning, disaster risk reduction, and socio-environmental management.
The role of land-related variables in social vulnerability assessments extends beyond theoretical exploration, offering a bridge between vulnerability analysis and actionable land-use planning. By incorporating indicators such as urbanization trends, road density, and environmental quality, these assessments provide detailed insights into disparities across regions, facilitating informed policy decisions that prioritize equity and sustainability. The analysis of 18 studies employing land-related variables highlights key indicators such as the proportion of built-up area, road density, agricultural land use, housing characteristics, and environmental quality. These indicators shed light on regional disparities, infrastructure needs, and environmental sustainability, emphasizing the critical role of land-related data in shaping comprehensive and effective policies to address both social and environmental vulnerabilities.
The proportion of built-up area, used in four studies, provides a vital metric for evaluating urbanization levels and the density of infrastructure within regions. High-density built-up areas, as noted by Ebert et al. [
93] and Frigerio and De Amicis [
94], often experience intensified environmental pressures, including reduced access to green spaces and heightened exposure to urban-heat-island effects. Such pressures can lead to increased energy consumption, the exacerbation of waste management challenges, and a decreased quality of life. Policymakers can utilize these findings to craft zoning regulations that balance urban expansion with ecological preservation. For example, by integrating green infrastructure such as urban parks and green rooftops into high-density areas, regions can enhance air quality, mitigate heat-related stress, and promote community well-being [
29,
30]. These strategies not only improve living conditions but also align with broader sustainability goals, ensuring that urban growth does not compromise environmental integrity.
Road density, analyzed in three studies, emerges as a critical indicator for assessing disparities in transportation infrastructure and mobility. Regions with inadequate road networks face significant barriers to accessing essential services, such as healthcare and education, and economic opportunities. Studies by Dandapat and Panda [
95] highlight how these disparities are particularly pronounced in underserved or rural areas, where limited connectivity exacerbates isolation and hinders economic development. Investments in transportation infrastructure, such as building new roads or enhancing public transit systems, can bridge these gaps. For instance, improving road density in agricultural regions can facilitate market access for farmers, reduce post-harvest losses, and stimulate local economies [
96,
97]. These investments also strengthen disaster preparedness by ensuring efficient evacuation routes and access to emergency services during crises.
Agricultural land use, reflected in indicators such as the proportion of land dedicated to farming, was analyzed in five studies. This variable provides critical insights into the vulnerabilities of agricultural regions to environmental degradation and climate-related challenges. Contreras et al. [
96] highlight the risks of overexploitation and soil erosion in regions heavily reliant on agriculture. Policies promoting sustainable farming practices, such as crop rotation, soil conservation, and agroforestry, can mitigate these risks while ensuring long-term agricultural productivity. Integrating agricultural indicators into vulnerability assessments enables land-use planners to prioritize regions requiring interventions, balancing food security with ecological resilience. Furthermore, participatory land management approaches that involve local stakeholders can enhance policy effectiveness by aligning strategies with the needs of farming communities [
31].
Housing characteristics, including the proportion of mobile homes, were explored in six studies as indicators of socio-economic challenges and vulnerability to disasters. Mobile homes and substandard housing often reflect underlying inequalities, as noted by Cutter et al. [
15] and Gautam [
98]. These housing types are more susceptible to damage from natural hazards, leaving residents disproportionately affected during crises. Integrating housing data into social vulnerability assessments can help identify regions requiring targeted investments in disaster-resilient housing infrastructure. For instance, retrofitting older housing stock with energy-efficient materials and improving structural integrity can reduce vulnerabilities while also enhancing living standards [
99].
Environmental quality indicators, such as green coverage in built-up areas, were included in three studies to evaluate their impact on social vulnerability and public health. Urban areas with limited green spaces, as highlighted by Gall [
29], are more susceptible to pollutants, heat stress, and reduced climate resilience. Expanding urban green spaces offers multiple benefits, including improved air quality, enhanced recreational opportunities, and reduced mental health stress. Additionally, green infrastructure can mitigate flood risks by enhancing stormwater management, particularly in low-lying urban areas prone to flooding [
94]. These findings underscore the need for policies that prioritize green infrastructure as a core component of sustainable urban development.
The integration of land-related variables into social vulnerability assessments provides actionable pathways for addressing systemic inequalities and fostering resilience. By combining indicators such as housing characteristics, road density, and environmental quality, policymakers can develop tailored interventions that address the unique needs of different regions [
31]. For example, in agricultural regions, integrating vulnerability assessments into land management practices can safeguard food security while promoting sustainable resource use. Similarly, in urban areas, zoning regulations informed by vulnerability data can prioritize equitable access to green spaces, transportation, and affordable housing [
68]. Policymakers must also consider regional and contextual variations when designing land-use strategies. Standardized methodologies that incorporate diverse indicators can enhance the applicability of social vulnerability assessments across different settings, while longitudinal studies can provide insights into the dynamic interactions between land use and social vulnerability over time. These approaches ensure that land-use decisions are informed by a comprehensive understanding of both social and environmental factors, fostering long-term sustainability and equity [
100].
While this study systematically reviewed the variables used in SVI construction and identified key domains such as age, education, gender and land, the inconsistencies in variable selection across studies remain a significant challenge. These inconsistencies arise from diverse methodological approaches, regional priorities, and variations in data availability, underscoring the critical need for a standardized framework to improve comparability and replicability across studies. To address these challenges, the development of a standardized framework for indicator selection is strongly recommended. Such a framework should balance consistency and flexibility by including a core set of universally applicable indicators—such as age distribution, income levels, and educational attainment—to ensure comparability across studies while incorporating region-specific variables to account for local socio-economic and environmental contexts [
14]. For example, cultural practices, geographic vulnerabilities, and environmental factors like access to green spaces or exposure to air pollution could offer the adaptability needed for localized applications [
30]. By integrating these elements, the framework would expand the applicability of SVI beyond traditional disaster-focused studies, addressing broader socio-environmental challenges in urban planning, public health, and sustainable development. Developing and validating this framework would require further research to ensure its methodological rigor and adaptability across diverse contexts. A structured approach that combines standardized core indicators with region-specific variables would enhance the SVI’s relevance and practical utility. This could support its application in disaster risk reduction, land-use planning, and other socio-environmental domains while addressing the unique vulnerabilities of different regions.
This study provides a comprehensive examination of the domains, indicators, and variables used in calculating the Social Vulnerability Index (SVI). By identifying frequently utilized components and highlighting under-represented domains such as environmental and political factors, the findings offer critical insights for refining vulnerability assessments and supporting policy development in disaster risk reduction, urban planning, and social welfare.
In the context of disaster risk reduction, the study emphasizes the importance of identifying vulnerable populations and regions based on key variables such as age, education, and income inequality. For instance, mapping socially vulnerable regions using these indicators allows for targeted interventions, including enhanced disaster preparedness programs, resource allocation for emergency shelters, and tailored communication strategies during crises [
14]. These findings align with previous research that underscores the utility of vulnerability mapping in guiding disaster policy and mitigating risk [
15].
For urban planning, the study underscores the under-representation of environmental variables, such as air quality, access to green spaces, and exposure to pollutants, in current SVI research. Integrating these factors into social vulnerability assessments could guide policymakers in designing sustainable and inclusive urban environments [
93]. For example, prioritizing investments in green infrastructure and improving housing and public services in underserved areas can address environmental inequalities and foster resilience among vulnerable populations [
92].
In social welfare, this study underscores the significance of addressing vulnerabilities rooted in disparities in education, gender, and age. For instance, educational disparities, such as limited access to quality education or opportunities for lifelong learning, disproportionately affect marginalized groups and exacerbate social vulnerability [
101]. Similarly, gender-based vulnerabilities, including unequal access to resources and systemic biases, require targeted policies that promote gender equity and empower women in decision-making roles [
102]. Age-related vulnerabilities, particularly among the elderly and youth, highlight the need for tailored interventions that provide social safety nets, healthcare access, and employment opportunities appropriate to these demographics [
90]. Additionally, the study identifies a gap in the integration of political participation variables in existing SVI methodologies. Incorporating such variables could illuminate institutional inequities and pathways to community empowerment [
103]. Strengthening civic engagement, promoting equitable resource allocation, and enhancing representation in decision-making processes can help build robust institutional support systems, enabling communities to address their unique vulnerabilities effectively [
88].
Collectively, the findings of this study emphasize the importance of a multidimensional approach to social vulnerability assessments, incorporating under-represented domains such as environmental and political factors alongside frequently utilized indicators like age, education, and income inequality. By addressing these gaps, policymakers can design more inclusive and context-sensitive strategies that balance immediate risk reduction with long-term resilience building. Integrating these insights into disaster risk reduction, urban planning, and social welfare initiatives has the potential to create more equitable and sustainable communities, ultimately enhancing societal resilience to both present and future challenges.
Building on these insights, understanding the interconnections between key domains such as education, income, and healthcare is essential for constructing a more nuanced understanding of social vulnerability. These domains do not operate in isolation but rather function as interconnected systems, where disparities in one area can intensify vulnerabilities in others. For instance, limited access to education can restrict employment opportunities, leading to income inequality that further hinders access to essential services like healthcare and housing [
90]. Recognizing these dynamics provides a foundation for designing interventions that address vulnerabilities holistically, enabling more effective policy implementation and long-term resilience building.
Education serves as a cornerstone for shaping income levels and healthcare access as it influences an individual’s capacity to secure stable employment and financial independence. Limited educational attainment often correlates with restricted employment opportunities, leading to income disparities that further hinder access to essential services such as healthcare and adequate housing [
90]. These compounded effects amplify social vulnerability, particularly among marginalized populations, as demonstrated in studies examining education as a critical determinant of resilience [
15]. Income inequality, in turn, interacts dynamically with other domains, including housing and mobility. Households with lower income levels are more likely to reside in substandard housing or areas with inadequate infrastructure, such as insufficient sanitation and limited access to clean water. These environmental factors exacerbate health risks and perpetuate cycles of vulnerability [
1]. Moreover, low-income individuals often face significant barriers to mobility, restricting their ability to access employment, educational opportunities, and healthcare facilities [
4]. Healthcare access itself is influenced by intersections with domains such as gender, ethnicity, and social support systems. Marginalized groups, including ethnic minorities and women, frequently encounter systemic barriers in healthcare systems. For example, linguistic and cultural differences may hinder their ability to navigate healthcare resources effectively, while limited political representation often leads to policies that overlook their specific needs [
103]. Environmental factors further compound these challenges, as low-income and marginalized communities often experience higher exposure to pollutants and environmental hazards, which directly affect health outcomes [
92]. The role of crime and safety also intersects significantly with education and healthcare. Communities with high crime rates frequently experience reduced investment in schools and healthcare facilities, which limits access to quality education and medical care, further deepening systemic inequalities. For instance, regions characterized by social unrest and high crime rates often display weaker institutional capacities, making it more challenging to implement policies aimed at reducing vulnerabilities [
88].
By recognizing these complex interdependencies, future research and policy development can adopt a multidimensional approach to social vulnerability assessments. Addressing single domains in isolation risks overlooking the compounded effects of vulnerabilities across multiple domains, ultimately limiting the effectiveness of interventions. For example, targeted educational programs that integrate vocational training and healthcare literacy could simultaneously address income disparities and healthcare access barriers, thereby reducing vulnerabilities holistically [
17]. Additionally, incorporating environmental and political participation variables into SVI frameworks enhances the ability to identify and address the compounded risks faced by marginalized populations [
58]. Understanding how domains such as education, income, and healthcare interact with housing, environment, and political participation enables policymakers to design more equitable and impactful strategies. By adopting this interconnected perspective, social vulnerability assessments can more effectively inform policies that foster societal resilience and address the root causes of inequality.
The Social Vulnerability Index (SVI), while primarily focused on disaster-related contexts, holds significant potential for broader applications in fields such as public health, education, urban planning, and socio-economic development. For instance, in public health, the SVI could identify regions vulnerable to pandemics by mapping disparities in healthcare access and population density [
14]. Similarly, in education, it could highlight gaps in literacy and schooling, guiding interventions to reduce systemic inequities [
81]. In urban planning, SVI applications can inform equitable infrastructure development by identifying socially vulnerable areas lacking green spaces or public transit [
24]. Furthermore, socio-economic applications of the SVI could address disparities in income, employment, and resource distribution, aligning with goals of social equity and economic sustainability [
80]. Despite these potential applications, the results of this study predominantly highlight disaster-related contexts, as the analyzed literature frequently centered on these areas rather than a deliberate focus set by the study’s scope. Future research should consider expanding eligibility criteria to include studies from diverse fields such as public health, education, and urban planning. This broader inclusion could capture a wider array of applications and methodologies, thereby enriching the understanding of social vulnerability across various societal challenges.
This study encountered a notable limitation stemming from its linguistic constraints, as only English and Korean publications were included in the analysis. This restriction skewed the geographic focus towards regions like the United States, China, and India, while excluding important research from under-represented areas such as the Balkans, South America, and Africa [
104]. For example, studies addressing socio-political fragmentation in the Balkans or informal housing issues in South America could offer critical insights into region-specific vulnerabilities [
14]. Addressing this limitation by broadening eligibility criteria to include non-English and non-Korean studies would reveal valuable factors, such as migration trends in Europe and environmental challenges in developing nations [
24]. Future research should also employ translation technologies and collaborate with multilingual scholars to integrate diverse perspectives, thereby enriching the global understanding of social vulnerability [
105].
Based on the findings of this review study, a notable limitation of Social Vulnerability Index (SVI) research is its reliance on static factors, such as demographic and socio-economic indicators, which fail to capture the dynamic nature of vulnerabilities. Vulnerabilities are inherently fluid, shaped by temporal and spatial changes such as urbanization, climate change, and migration patterns [
78]. By focusing on static conditions, many SVI studies overlook evolving risks and challenges, limiting their applicability in rapidly changing contexts. Addressing this limitation requires incorporating temporal analyses into SVI research. Urbanization often reshapes spatial vulnerabilities, with rapid infrastructure expansion exacerbating disparities in access to essential services [
31]. Similarly, the growing frequency and intensity of climate-related events emphasize the need to track vulnerability changes over time to mitigate their impacts [
106]. Temporal approaches, such as longitudinal studies or time-series data, provide valuable insights into how vulnerabilities evolve alongside socio-environmental transformations [
107]. Expanding SVI methodologies to include dynamic analyses could significantly enhance their relevance. For instance, monitoring changes in environmental degradation or infrastructure development over time can refine vulnerability assessments, enabling policymakers to design adaptive interventions [
108]. Incorporating advancements in geospatial technologies, such as satellite imagery and GIS-based temporal mapping, would further support this effort. By moving beyond static snapshots, SVI studies can provide a comprehensive understanding of vulnerabilities, fostering more effective and equitable policy responses to global challenges.
Additionally, while quantitative methods ensure consistency and comparability, they often lack the depth of context-specific insights achievable through qualitative research. The exclusion of qualitative studies, such as those employing interviews or case studies, was guided by the need for consistency in the review process. However, this decision inherently limits the understanding of systemic inequities and localized challenges [
41]. Governance factors, including corruption and institutional capacity, which significantly influence vulnerability outcomes, are often more effectively captured through qualitative methods [
14]. Integrating mixed-methods approaches could enhance the depth of SVI assessments by combining the statistical robustness of quantitative data with the nuanced perspectives of qualitative research [
38]. For example, qualitative methods could reveal regional disparities in governance quality or the impacts of corruption on disaster preparedness and resource allocation [
81]. Furthermore, standardized data collection practices and emerging technologies, such as participatory mapping, could facilitate this integration [
105]. By addressing the gap between quantitative and qualitative research, future studies can provide a more holistic understanding of social vulnerability. This comprehensive approach would allow researchers to tackle the multidimensional nature of vulnerability effectively, supporting the development of more equitable and impactful policy interventions tailored to diverse contexts.
The review of 72 selected studies reveals substantial variability in the indicators and data sources used to calculate the Social Vulnerability Index (SVI), highlighting significant data gaps across geographic and socio-economic contexts [
104]. Many studies rely on datasets from regions with well-established research infrastructure, such as the United States and Europe, while under-representing data from Africa, South America, and Southeast Asia, where unique vulnerabilities often remain undocumented [
31]. This imbalance obscures context-specific challenges, such as those arising from informal settlements or governance issues like corruption and institutional capacity, which are critical to understanding vulnerability but are difficult to quantify with existing datasets [
80]. Addressing these gaps requires enhancing local data collection efforts, leveraging participatory mapping, and conducting community-based surveys to capture region-specific indicators tied to governance and social networks [
105]. Moreover, integrating qualitative insights into SVI frameworks can bridge the divide between quantitative data and systemic inequities, enabling a more holistic assessment of vulnerability [
41]. Future research should prioritize establishing standardized, adaptable data collection practices that reflect diverse socio-cultural contexts and environmental conditions, ensuring that SVI applications are both methodologically robust and globally inclusive. By addressing these gaps, SVI studies can better inform equitable and effective policy interventions that respond to the multidimensional nature of social vulnerability.


