
Conflicts at the Crossroads: Unpacking Land-Use Challenges in the Greater Bay Area with the “Production–Living–Ecological” Perspective

Abstract
1. Introduction
2. Materials and Methods
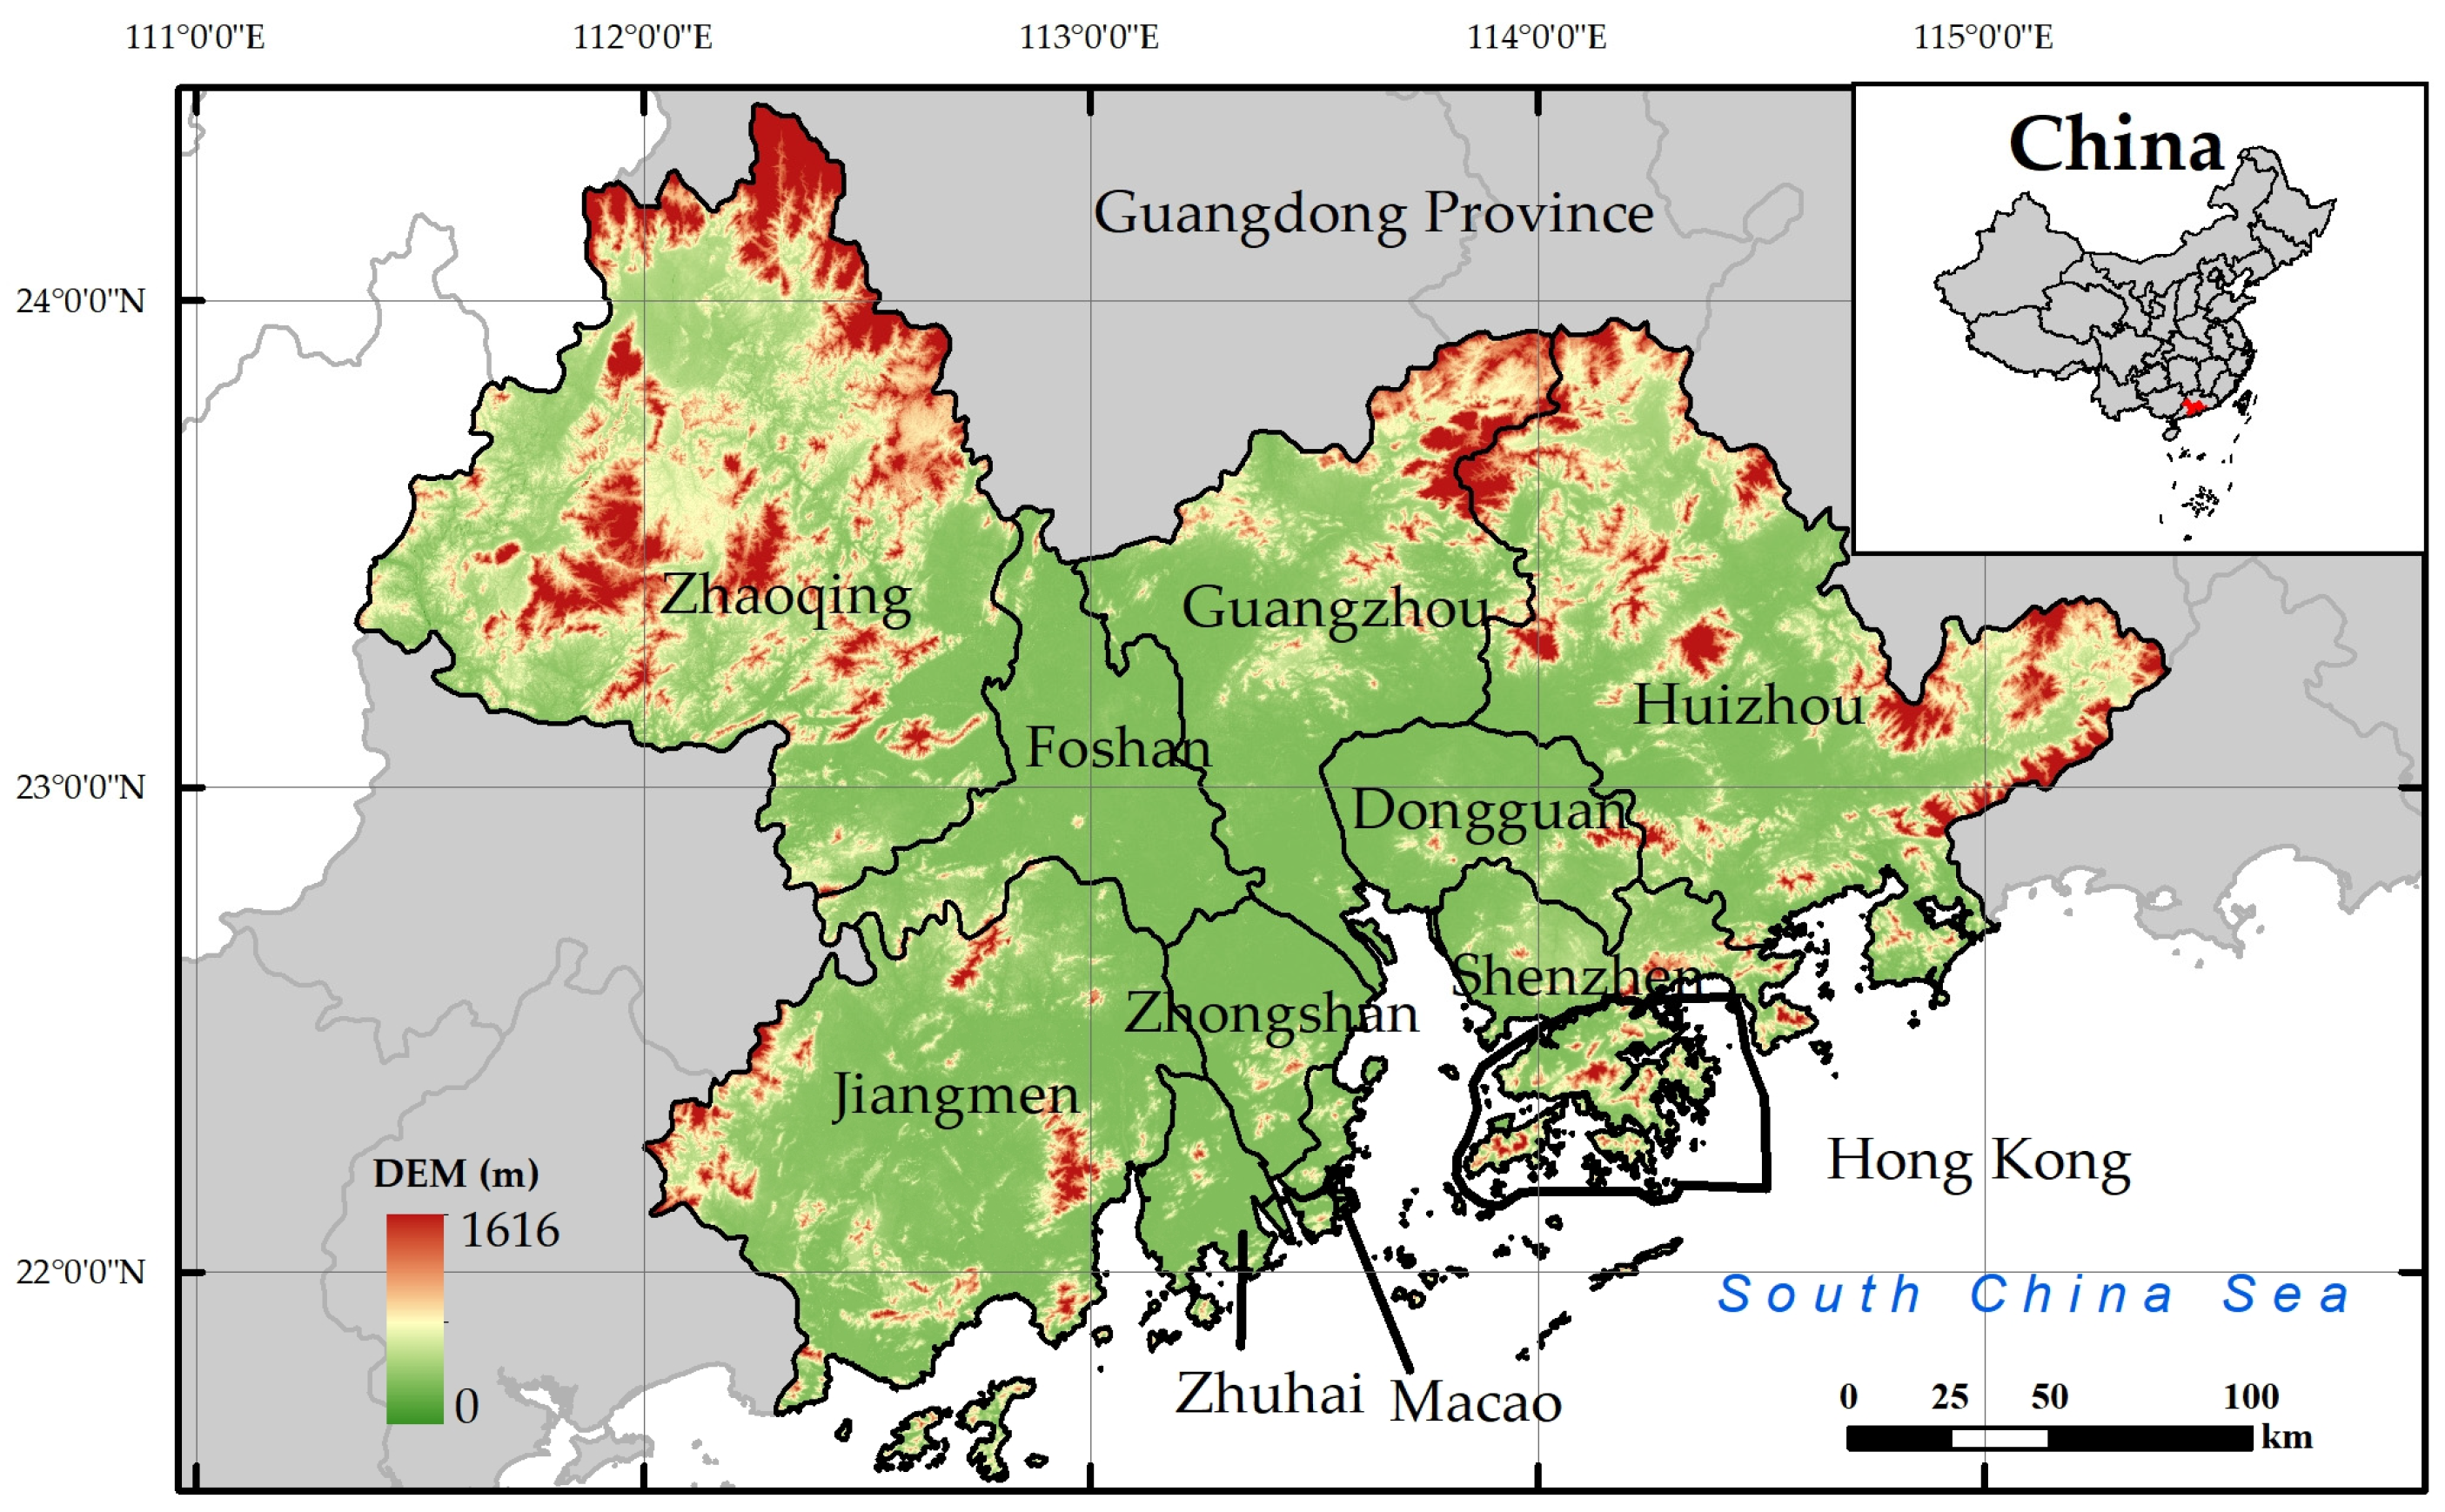
2.1. Study Area and Data Source
2.2. Research Framework
- 1.
- Production–Living–Ecological Function-Evaluation Model:
- 2.
- Identification and Intensity Diagnosis Model of LUCs Zones:
- 3.
- Spatial Relationship of LUCs:
- 4.
- Policy Recommendations for Sustainable Land Management:
2.3. Construction of Production–Living–Ecological Function-Evaluation Model
2.3.1. Selection of Production–Living–Ecological Function-Evaluation Index
2.3.2. Weight Calculation of Production–Living–Ecological Function-Evaluation Index
2.3.3. Comprehensive Scoring of Production–Living–Ecological Function-Evaluation Model
2.4. Identification and Intensity Diagnosis Model of LUCs Zones
2.5. Spatial Relationship of LUCs
3. Results
3.1. Spatial Distribution Characteristics of Land-Use Function Intensity
3.1.1. Spatial Distribution Characteristics of Production Function Intensity
3.1.2. Spatial Distribution Characteristics of Living Function Intensity
3.1.3. Spatial Distribution Characteristics of Ecological Function Intensity
3.2. Spatial Distribution Characteristics of LUCs Zones
3.3. Spatial Relationship of Land-Use Function Conflicts Area
4. Discussion
4.1. Comparative Analysis of LUCs Dynamics: Insights from Western Jilin Province
- (1)
- Function Distribution: In Jilin, production functions are weak, with ecological functions dominating in northern and peripheral areas. For example, fragile ecological zones in western Jilin focus on grassland and wetland conservation to mitigate desertification. In contrast, the GBA showcases a highly urbanized structure, where cities like Guangzhou and Shenzhen prioritize production and living functions, driven by industrialization and rapid urban growth, often at the expense of ecological functionality.
- (2)
- Conflict Intensity: In Jilin, LUCs are stable or manageable, such as localized disputes in farming areas or grassland conservation zones. However, the GBA faces escalating pressures, particularly along the Guangzhou-Shenzhen-Dongguan axis, where competition between production, living, and ecological functions has led to intensified conflicts, as seen in cases of urban sprawl replacing agricultural and green spaces.
- (3)
- Hot Spot Distribution: While Jilin’s LUCs hot spots are scattered, often tied to specific conservation projects or localized economic activities (e.g., forestry zones in Changbai Mountain), the GBA’s hot spots are concentrated in dense urban centers like Shenzhen, where global economic activities and industrial hubs amplify land-use tensions.
- (4)
- Policy Implications: Western Jilin’s land-use policies emphasize ecological preservation, such as the “Three North Shelterbelt” program targeting desertification. In contrast, the GBA requires innovative solutions, like multifunctional zoning and cross-border collaborations, to balance urban demands with ecological restoration. Examples include integrating green infrastructure with urban planning in the Guangzhou-Foshan metropolitan area.
4.2. Insights from the GBA’s LUCs and Policy Recommendations
4.2.1. Spatial Distribution and Underlying Drivers of LUCs in the GBA
4.2.2. Insights from Global Bay Areas for Managing LUCs
- (1)
- Balancing Urban Expansion and Ecological Preservation
- (2)
- Integrated Zoning and Ecological Restoration
- (3)
- Green Infrastructure for Urban Development
- (4)
- Participatory Land-Use Governance
4.2.3. Policy Recommendations for GBA
- (1)
- Enhancing Cross-Border Collaboration
- (2)
- Implementing Fine-Grained Land Management
- (3)
- Promoting Ecological Restoration and Protection
- (4)
- Stage-Specific Management Strategies
- Stable and Controllable Stage
- Basic Controllable Stage
- Basic Out-of-Control Stage
- Serious Out-of-Control Stage
5. Conclusions
- (1)
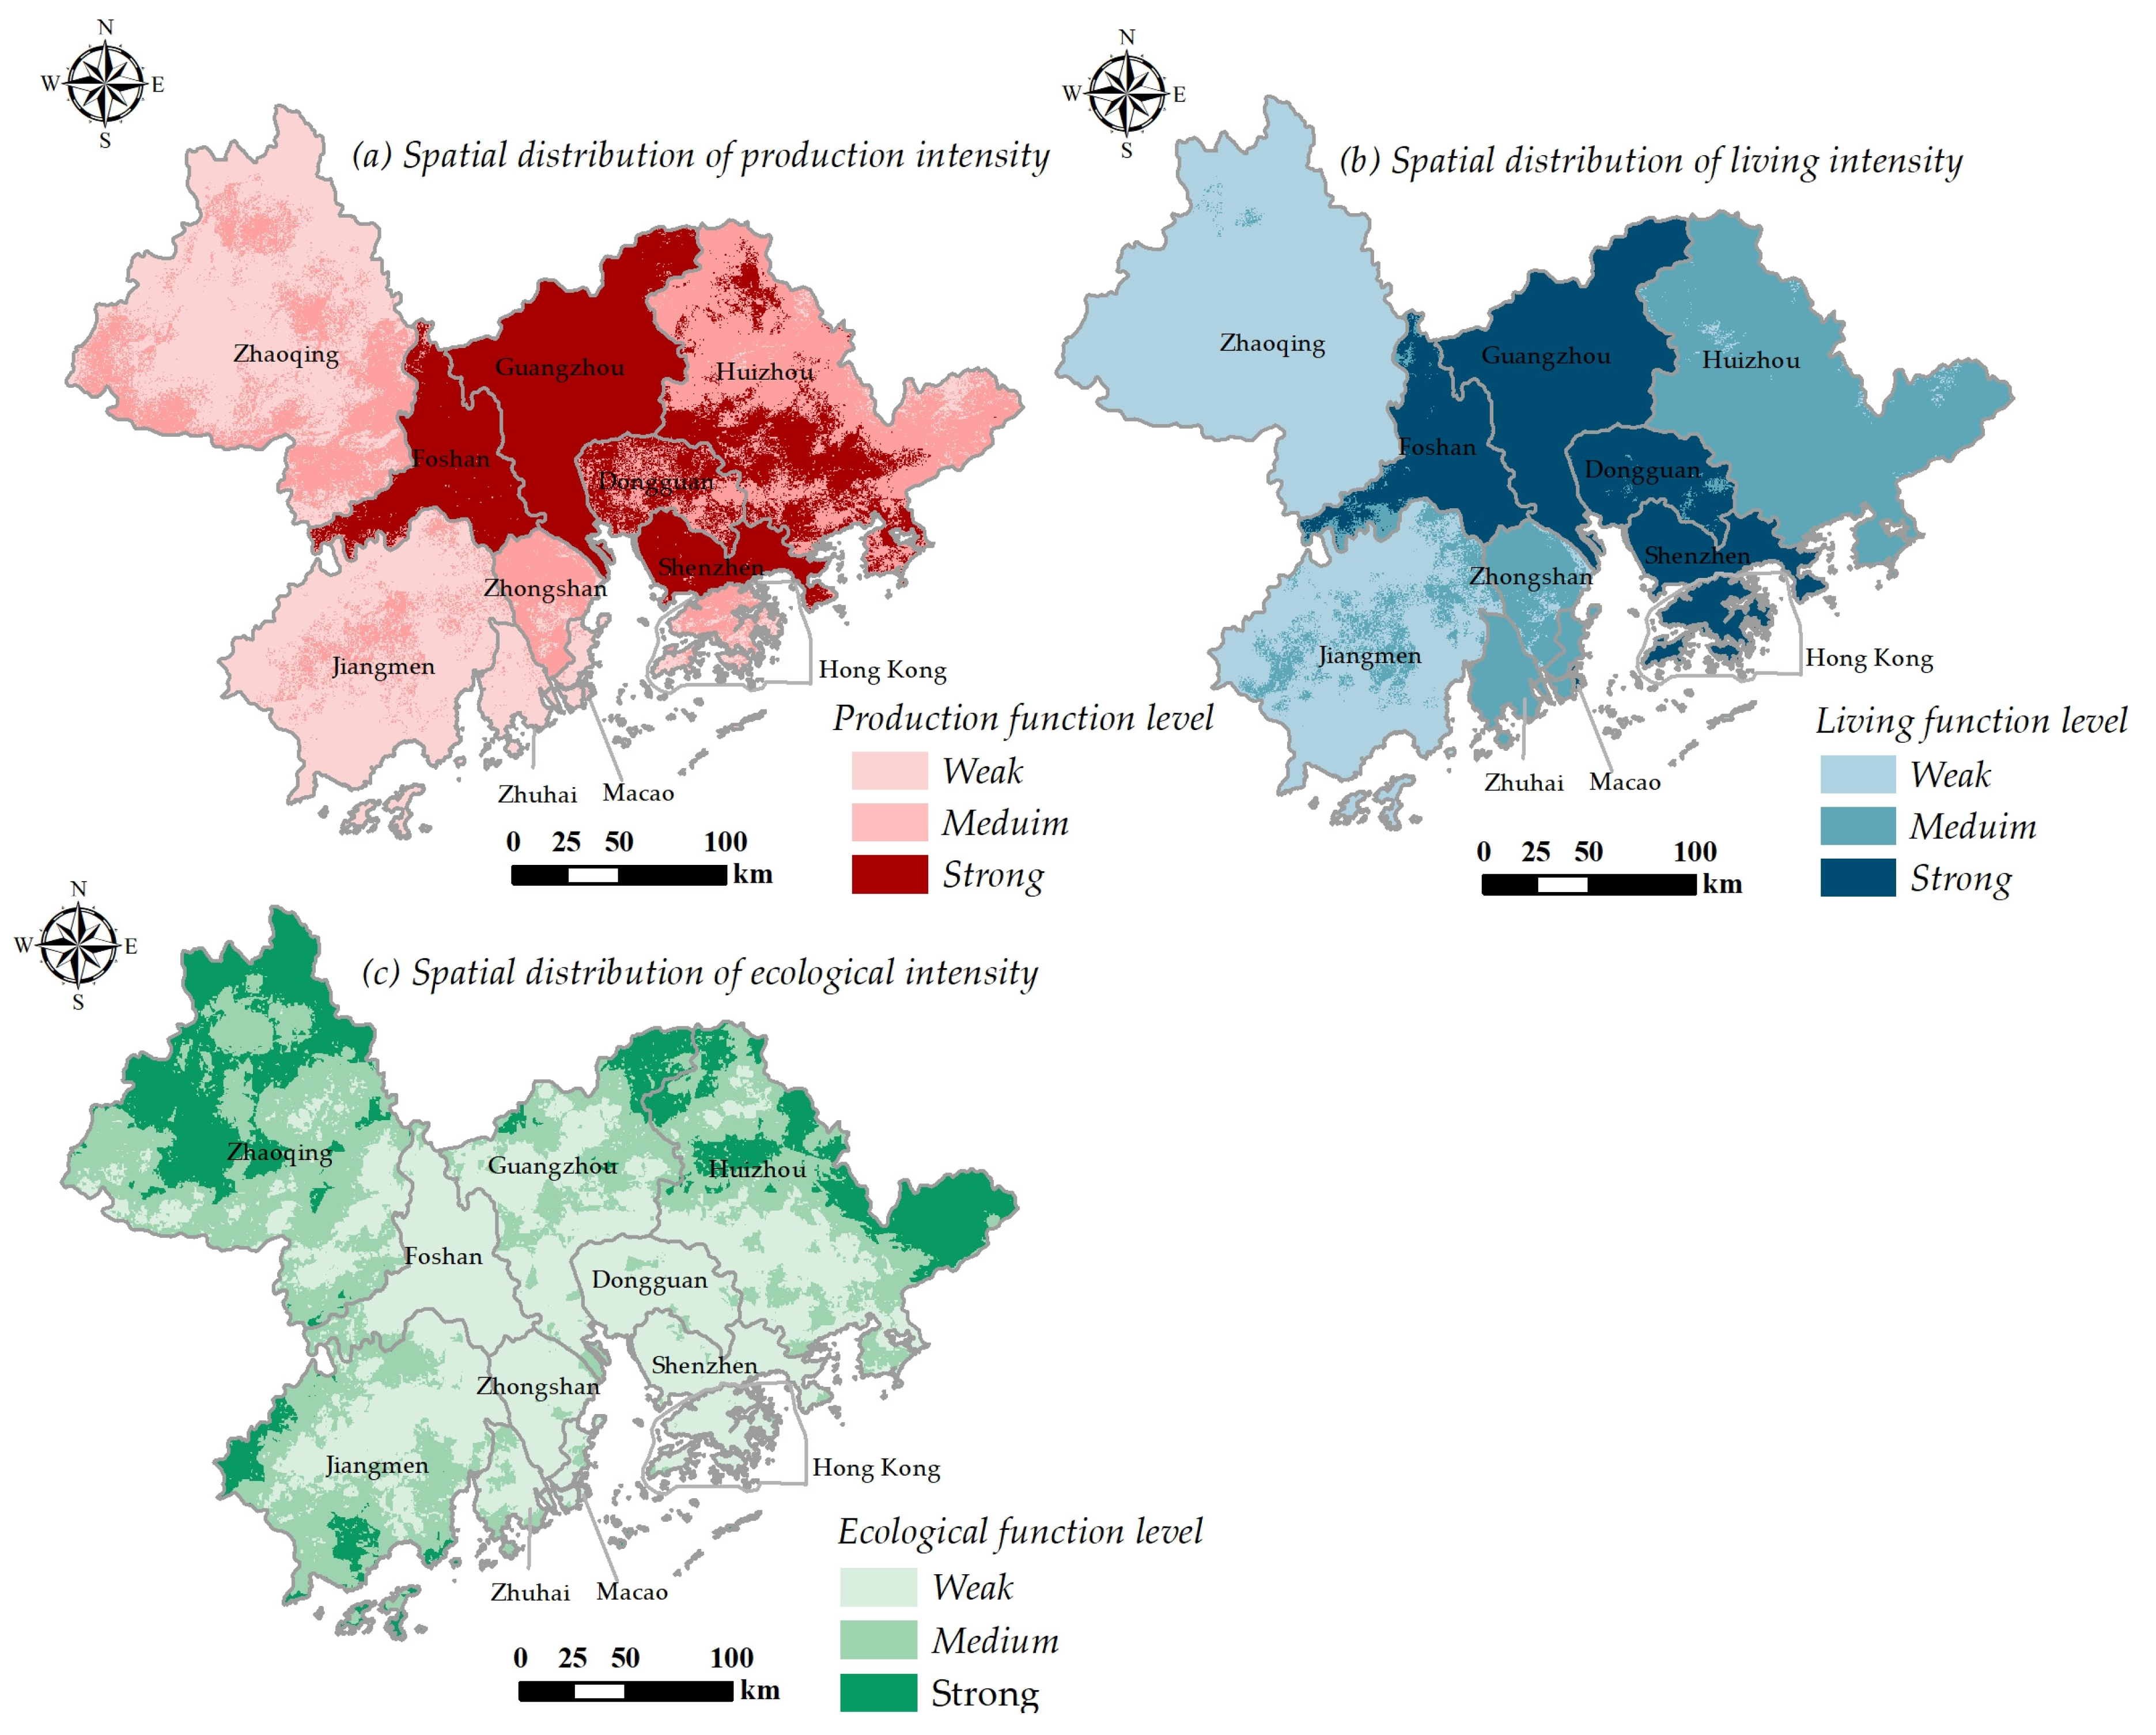
- In 2020, the GBA exhibited relatively high production functionality, moderately high living functionality, and relatively low ecological functionality. High-level production and living function zones were primarily concentrated in the central and southeastern areas, including Guangzhou, Shenzhen, and Foshan. Living functionality in Hong Kong and Macao was also classified as high. Ecological functionality displayed a clear “center-periphery” distribution pattern, weakening in urban cores like Guangzhou, Shenzhen, and Foshan and strengthening in peripheral areas such as Zhaoqing and Jiangmen.
- (2)
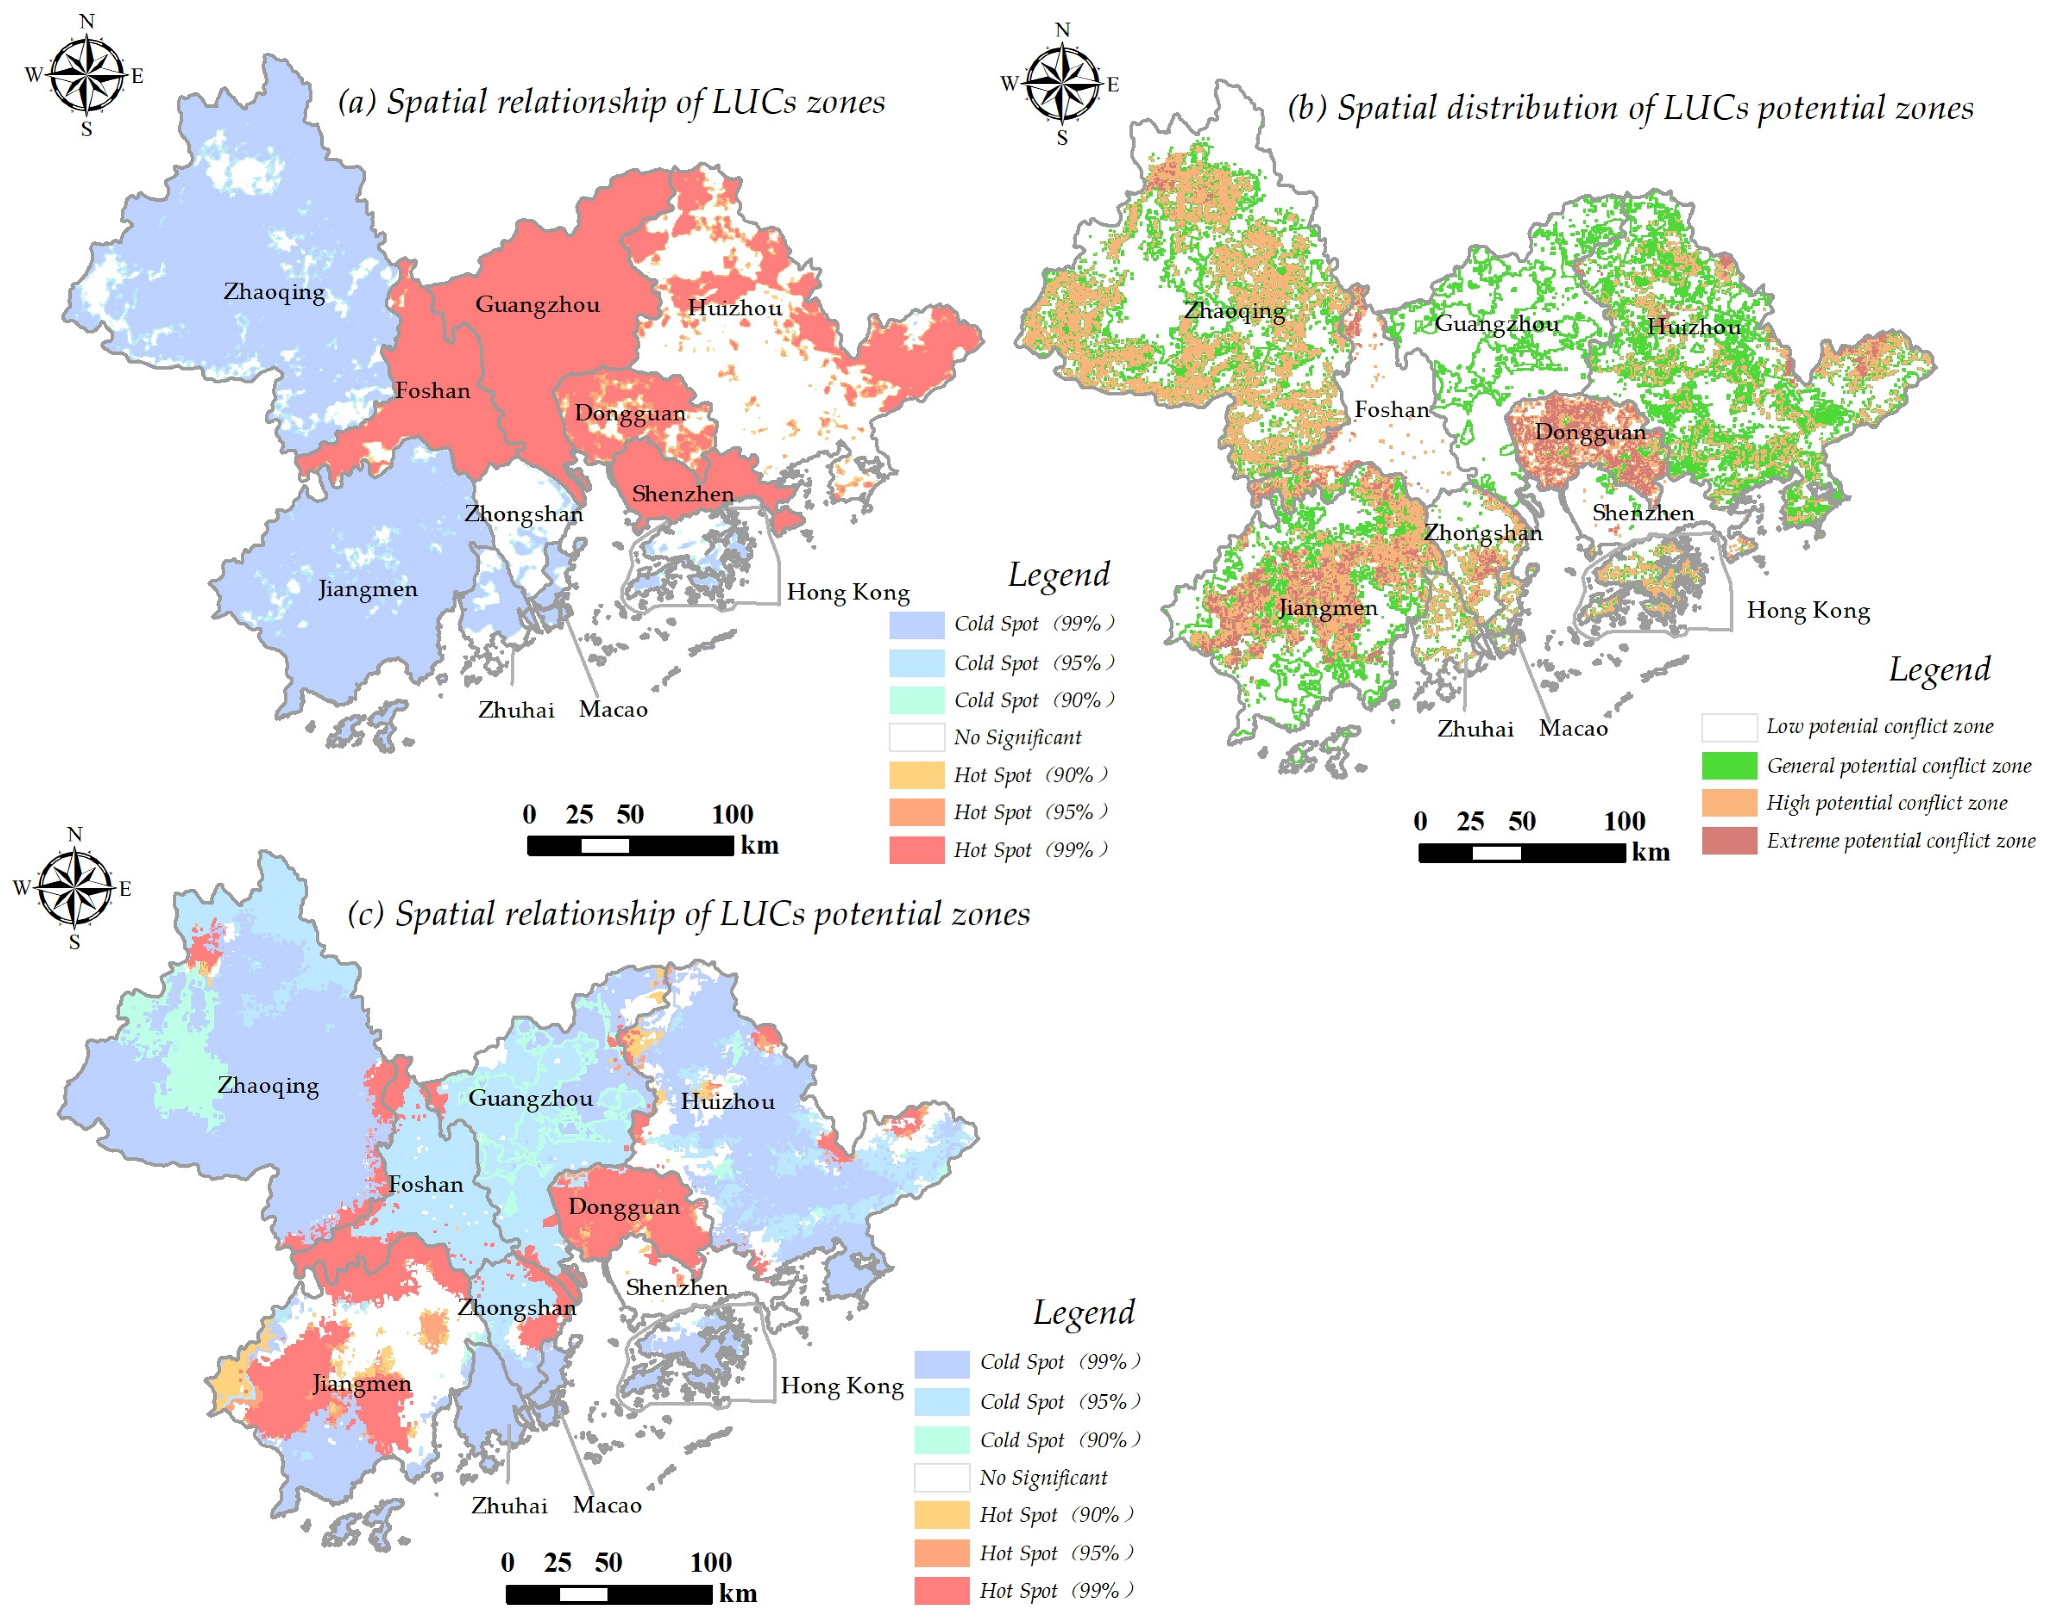
- The proportions of the stable and controllable stage, basic controllable stage, basic out-of-control stage, and serious out-of-control stage accounted for 39.22%, 28.73%, 25.41%, and 6.64% of the study area, respectively. Hot spots of LUC intensity were concentrated in the central-eastern part of the GBA, particularly in Guangzhou, Foshan, Shenzhen, and Dongguan, where high urbanization and industrial activities dominate. Cold spots were primarily distributed in peripheral regions such as Zhaoqing, Jiangmen, and Macao, where lower economic activity and stronger ecological functions reduce conflict levels.
- (3)
- The study area faced varying degrees of conflict potential, with low, general, high, and extreme potential zones occupying 47.88%, 23.43%, 22.14%, and 6.54% of the total area, respectively. Extreme conflict potential was concentrated in the central areas of Dongguan and Jiangmen, as well as the urban cores of Zhaoqing and Zhongshan. High-potential conflict zones were distributed across Zhaoqing, Jiangmen, Huizhou, Hong Kong, and Macao. Hot spots of conflict potential overlapped with administrative boundary areas such as “Foshan–Zhaoqing”, “Foshan–Jiangmen”, and “Guangzhou–Zhongshan”, highlighting areas of intensified land-use competition.
Author Contributions
Funding
Data Availability Statement
Acknowledgments
Conflicts of Interest
References
- Zou, L.; Liu, Y.; Wang, Y. Research progress and prospect of land-use conflicts in China. Prog. Geogr. 2020, 39, 298–309. [Google Scholar] [CrossRef]
- Li, G.; Fang, C. Quantitative function identification and analysis of urban ecological-production-living spaces. Acta Geogr. Sin. 2016, 71, 49–65. [Google Scholar]
- Liu, D.; Ma, X.; Gong, J.; Li, H. Functional identification and spatio-temporal pattern analysis of production-living-ecological space in watershed scale: A case study of Bailongjiang Watershed in Gansu. Chin. J. Ecol. 2018, 37, 1490–1497. [Google Scholar]
- Liu, J.; Liu, Y.; Li, Y. Classification Evaluation and Spatiotemporal Pattern Analysis of “Production-Living-Ecological” Spaces in China. Acta Geogr. Sin. 2017, 72, 1290–1304. [Google Scholar]
- Huang, A.; Xu, Y.; Lu, L.; Liu, C.; Zhang, Y.; Hao, J.; Wang, H. Progress in Research on the Identification and Optimization of “Production-Living-Ecological” Space. Prog. Geogr. 2020, 39, 503–518. [Google Scholar] [CrossRef]
- Wang, D.; Huang, L.; Chen, Z. Evolution of “Production-Living-Ecological” Space and Land Use Conflicts in Nanchang County, Nanchang City, 2000–2020. Bull. Soil Water Conserv. 2024, 44, 426–436+445. [Google Scholar]
- Li, C.; Chen, S.; Li, J.; Zhou, P. Spatiotemporal Evolution Characteristics of Land Use Conflicts Based on “Production-Living-Ecological” Space: A Case Study of the Xiamen-Zhangzhou-Quanzhou Urban Agglomeration. Bull. Soil Water Conserv. 2022, 42, 247–254, 262. [Google Scholar]
- Kong, D.; Chen, H.; Wu, K. Evolution Characteristics, Ecological Environmental Effects, and Influencing Factors of “Production-Living-Ecological” Space in China. J. Nat. Resour. 2021, 36, 1116–1135. [Google Scholar]
- Zhang, B.; Miao, C. Spatiotemporal Evolution and Driving Forces of Land Use Patterns in the Yellow River Basin. Resour. Sci. 2020, 42, 460–473. [Google Scholar]
- Chitonge, H.; Mfune, O. The urban land question in Africa: The case of urban land conflicts in the City of Lusaka, 100 years after its founding. Habitat Int. 2015, 48, 209–218. [Google Scholar] [CrossRef]
- Oliver, T.H.; Morecroft, M.D. Interactions between climate change and land use change on biodiversity: Attribution problems, risks, and opportunities. Wiley Interdiscip. Rev. Clim. Change 2014, 5, 317–335. [Google Scholar] [CrossRef]
- Milczarek-Andrzejewska, D.; Zawalinska, K.; Czarnecki, A. Land-use conflicts and the Common Agricultural Policy: Evidence from Poland. Land Use Policy 2018, 73, 423–433. [Google Scholar] [CrossRef]
- Hilson, G. An overview of land use conflicts in mining communities. Land Use Policy 2002, 19, 65–73. [Google Scholar] [CrossRef]
- Peerzado, M.B.; Magsi, H.; Sheikh, M.J. Land use conflicts and urban sprawl: Conversion of agriculture lands into urbanization in Hyderabad, Pakistan. J. Saudi Soc. Agric. Sci. 2019, 18, 423–428. [Google Scholar] [CrossRef]
- Von der Dunk, A.; Grêt-Regamey, A.; Dalang, T.; Hersperger, A.M. Defining a Typology of Peri-Urban Land Use Conflicts—A Case Study from Switzerland. Landsc. Urban Plan. 2011, 101, 149–156. [Google Scholar] [CrossRef]
- Tian, J.; Wang, B.; Cheng, Q.; Wang, S. What are the underlying causes and dynamics of land use conflicts in metropolitan junction areas? A case study of the central Chengdu–Chongqing region in China. Reg. Sustain. 2024, 5, 100161. [Google Scholar]
- Darly, S.; Torre, A. Conflicts over Farmland Uses and the Dynamics of “Agri-Urban” Localities in the Greater Paris Region: An Empirical Analysis Based on Daily Regional Press and Field Interviews. Land Use Policy 2013, 33, 90–99. [Google Scholar] [CrossRef]
- Zheng, Y.; Cheng, L.; Wang, Y.; Wang, J. Measurement and Spatial Response of Spatial Conflicts in Resource-Based Cities. Prog. Geogr. 2023, 42, 275–286. [Google Scholar] [CrossRef]
- Zong, S.; Xu, S.; Jiang, X.; Song, C. Identification and Dynamic Evolution of Land Use Conflict Potentials in China, 2000–2020. Ecol. Indic. 2024, 166, 112340. [Google Scholar] [CrossRef]
- Mudapakati, C.P.; Bandauko, E.; Chaeruka, J.; Arku, G. Peri-urbanisation and land conflicts in Domboshava, Zimbabwe. Land Use Policy 2024, 144, 107222. [Google Scholar] [CrossRef]
- Chen, X.; Wu, S.; Wu, J. Characteristics and Formation Mechanism of Land Use Conflicts in Northern Anhui: A Case Study of Funan County. Heliyon 2024, 10, e22923. [Google Scholar] [CrossRef] [PubMed]
- Zhang, X.; Gu, R. Spatio-temporal Patterns and Multi-scenario Simulation of Land-use Conflicts: A Case Study of the Yangtze River Delta Urban Agglomeration. Geogr. Res. 2022, 41, 1311–1326. [Google Scholar]
- Zhao, Y.; Zhao, X.; Huang, X.; Guo, J.; Chen, G. Identifying a Period of Spatial Land Use Conflicts and Their Driving Forces in the Pearl River Delta. Sustainability 2022, 15, 392. [Google Scholar] [CrossRef]
- Chen, Z.; Feng, X.; Hong, Z.; Ma, B.; Li, Y. Research on spatial conflict calculation and zoning optimization of land use in Nanchang City from the perspective of “three living spaces”. World Reg. Stud. 2021, 30, 533. [Google Scholar] [CrossRef]
- Dong, G.; Zhou, Q.; Sun, C.; Wang, J.; Ke, Q. Identification of Land Use Conflicts in the Guangdong-Hong Kong-Macao Greater Bay Area Based on “Multi-Suitability–Scarcity–Diversity”. Trans. Chin. Soc. Agric. Eng. 2023, 39, 245–255. [Google Scholar]
- Zhang, X.; Cui, W.; Han, H.; Mei, Y.; Wang, T.G.; Pan, S. Identification and Analysis of Land Use Conflicts in Typical Karst Villages Based on “Production-Living-Ecological” Suitability. Res. Soil Water Conserv. 2023, 30, 412–422. [Google Scholar]
- Han, B.; Jin, X.; Sun, R.; Li, H.; Liang, X.; Zhou, Y. Sustainable Land-use Evaluation Based on a Conflict-Adaptation Perspective. Acta Geogr. Sin. 2021, 76, 1763–1777. [Google Scholar]
- Zhang, R.; Chen, S.; Gao, L.; Hu, J. Spatiotemporal Evolution and Impact Mechanism of Ecological Vulnerability in the Guangdong–Hong Kong–Macao Greater Bay Area. Ecol. Indic. 2023, 157, 111214. [Google Scholar] [CrossRef]
- Xu, X.; Liu, J.; Zhang, S.; Li, R.; Yan, C.; Wu, S. Chinese National Land Use and Cover Change Dataset (CNLUCC). Resource and Environmental Science Data Center. Available online: http://www.resdc.cn/DOI (accessed on 19 October 2021). [CrossRef]
- Geospatial Data Cloud. DEM Elevation Data. Available online: http://www.gscloud.cn (accessed on 19 October 2021).
- Haklay, M.; Weber, P. OpenStreetMap: User-Generated Street Maps. IEEE Pervasive Comput. 2008, 7, 12–18. [Google Scholar] [CrossRef]
- Baidu Map Platform. Geographic Coordinate Data. Available online: https://map.baidu.com (accessed on 10 November 2021).
- National Bureau of Statistics of China. China Statistical Yearbook (2021); China Statistics Press: Beijing, China, 2021. Available online: http://www.stats.gov.cn/sj/ndsj/2021/indexch.htm (accessed on 1 February 2023).
- Guangdong Provincial Bureau of Statistics. Guangdong Statistical Yearbook (2021); Guangdong Statistics Press: Guangzhou, China, 2021. Available online: http://tjnj.gdstats.gov.cn:8080/tjnj/2021/ (accessed on 7 February 2023).
- Zou, L.; Liu, Y.; Wang, J.; Yang, Y. An analysis of land use conflict potentials based on ecological-production-living function in thesoutheast coastal area of China. Ecol. Indic. 2021, 122, 107297. [Google Scholar] [CrossRef]
- Cheng, Z.; Zhang, Y.; Wang, L.; Wei, L.; Wu, X. An Analysis of Land-Use Conflict Potential Based on the Perspective of Production–Living–Ecological Function. Sustainability 2022, 14, 5936. [Google Scholar] [CrossRef]
- Chen, L.; Zhang, A. Identification of Land Use Conflicts and Dynamic Response Analysis of Natural-Social Factors in Rapidly Urbanizing Areas: A Case Study of Urban Agglomeration in the Middle Reaches of the Yangtze River. Ecol. Indic. 2024, 161, 112009. [Google Scholar] [CrossRef]
- Hu, J.; Zhang, J.; Li, Y. Exploring the Spatial and Temporal Driving Mechanisms of Landscape Patterns on Habitat Quality in a City Undergoing Rapid Urbanization Based on GTWR and MGWR: The Case of Nanjing, China. Ecol. Indic. 2022, 143, 109333. [Google Scholar] [CrossRef]
- Magsi, H.; Torre, A.; Liu, Y.; Sheikh, M.J. Land Use Conflicts in the Developing Countries: Proximate Driving Forces and Preventive Measures. Pak. Dev. Rev. 2017, 56, 19–30. [Google Scholar]
- Walker, R.A. The Country in the City: The Greening of the San Francisco Bay Area; University of Washington Press: Seattle, WA, USA, 2009. [Google Scholar]
- Zhang, Y.; Li, P.; Li, G. Comparative Study of Planning Systems in the Tokyo Bay Area and the Guangdong–Hong Kong–Macao Greater Bay Area: From the Perspective of “Development” and “Space”. Trop. Geogr. 2023, 43, 837–858. [Google Scholar]
- Herreros-Cantis, P.; McPhearson, T. Mapping Supply of and Demand for Ecosystem Services to Assess Environmental Justice in New York City. Ecol. Appl. 2021, 31, e2390. [Google Scholar] [CrossRef]
- Mahjabeen, Z.; Shrestha, K.K.; Dee, J.A. Rethinking Community Participation in Urban Planning: The Role of Disadvantaged Groups in Sydney Metropolitan Strategy. Australas. J. Reg. Stud. 2009, 15, 45–63. [Google Scholar]


| Data Types | Involved Indicators | Data Sources | Remarks |
|---|---|---|---|
| Remote-sensing image data | Land-use types (LUT); Geomorphic data (GED); Distance from urban land (DUL); Distance from rural residential areas (DRA); Distance from water bodies (DWB); NPP; Edge density (ED); Forest land coverage (FLC); Green land coverage (GLC) | Downloaded from the Resources and Environmental Science and Data Center (https://www.resdc.cn (accessed on 19 October 2021)) | The land-use classification data are derived from the Chinese National Land-Use and Cover Change Dataset (CNLUCC), which is available through the Resource and Environmental Science Data Center (RESDC). Based on the Landsat TM image of the United States, the data were generated through manual visual interpretation. The spatial resolution of the data is 1 km, and the comprehensive accuracy is more than 90%. Distance datasets were calculated by the “Euclidean Distance” analysis function of ArcGIS10.8. |
| Terrain data | Slope (SLP); Aspect (APC) | Downloaded from the Geospatial Data Cloud (https://www.gscloud.cn (accessed on 11 November 2021)) | Based on the Aster GDEM global digital elevation model, the spatial resolution is 30 m. The slope and aspect of the divided units were calculated by the “Slope” and “Aspect” analysis functions of ArcGIS10.8. |
| Vectorized data | Distance from major roads (DMR) | Downloaded from OSM website (www.openstreetmap.org (accessed on 15 November 2021)) | Distance datasets were calculated by the “Euclidean Distance” analysis function of ArcGIS10.8. |
| Geographic coordinate data | Distance from major ports (DMP); Distance from educational land (DEL); Distance from medical facilities (DMF); Distance from pharmacies (DFP) | Extract from Baidu map geographic coordinate device | Conduct vector diagram and position calibration by ArcGIS10.8. Distance datasets were calculated by the “Euclidean Distance” analysis functions of ArcGIS10.8. |
| Socio-economic data | GDP; Total agricultural, forestry, animal husbandry, and fishery output (TAO); Proportion of industrial output value (PIV); Government fiscal revenue (GFR); Government fiscal expenditure (GFE); Consumer price index (CPI); Per capita disposable income of urban residents (CIU); Precipitation (PPT) | Statistical Yearbook of China (2021) (http://www.stats.gov.cn/sj/ndsj/2021/indexch.htm (accessed on 1 February 2023)); Statistical Yearbook of Guangdong Province (2021) (http://tjnj.gdstats.gov.cn:8080/tjnj/2021/ (accessed on 7 February 2023)) |
| Target Layer | Criteria Layer (Weights) | Factor Layer | Factor Grading and Score | ||||||
|---|---|---|---|---|---|---|---|---|---|
| Indexes | Value | Weights | 100 | 80 | 60 | 40 | 20 | ||
| Land-use production function | Natural Factors (0.2903) | LUT | / | 0.139 | 11, 12 | 24, 51, 52 | 21, 31, 41, 43, 53 | 22, 23, 32, 33, 42 | 45, 46, 61, 64, 65 |
| GED | / | 0.115 | Low-elevation hills | Low-elevation alluvial plains, low-elevation slightly undulating mountainous areas | Low-elevation alluvial terraces, low-elevation marine-alluvial plains, low-elevation moderately undulating mountainous areas, underwater slopes, underwater deltas | Underwater terraces, low-elevation erosion terraces, low-elevation alluvial-diluvial terraces, low-elevation marine plains, mid-elevation highly undulating mountainous areas | / | ||
| SLP | degrees | 0.285 | <3 | 3~8 | 8~15 | 15~25 | ≥25 | ||
| APC | / | 0.240 | Sunny slope | Semi-sunny slope | Semi-shady slope | Shady slope | / | ||
| NPP | Pg | 0.221 | ≥1600 | 1600~4000 | 4000~6500 | 6500~9000 | <9000 | ||
| Location Factors (0.2318) | DUL | m | 0.339 | ≤5700 | 5700~13,700 | 13,700~22,700 | 22,700~33,000 | >33,000 | |
| DRA | m | 0.209 | ≤2700 | 2700~5600 | 5600~9200 | 9200~15,700 | >15,700 | ||
| DWB | m | 0.133 | ≤2240 | 2240~5150 | 5150~9340 | 9340~18,900 | >18,900 | ||
| DMR | m | 0.069 | ≤425 | 425~1340 | 1340~2580 | 2580~4330 | >4330 | ||
| DMP | m | 0.250 | ≤10,000 | 10,000~21,500 | 21,500~35,500 | 35,500~55,500 | >55,500 | ||
| Socio-Economic Factors (0.4779) | GDP | yuan | 0.372 | Higher | High | General | Low | Lower | |
| TAO | yuan | 0.302 | Higher | High | General | Low | Lower | ||
| PIV | % | 0.326 | Higher | High | General | Low | Lower | ||
| Land-use living function | Natural Factors (0.1886) | LUT | / | 0.128 | 51 | 52 | 11, 12, 21, 22, 31, 32, 41, 43 | 23, 24, 33, 42, 53 | 45, 46, 61, 64, 65 |
| GED | / | 0.223 | Low-elevation marine-alluvial plains | Low-elevation alluvial terraces, low-elevation alluvial plains, low-elevation hills, low-elevation slightly undulating mountainous areas | Low-elevation alluvial-diluvial terraces, low-elevation marine plains, low-elevation moderately undulating mountainous areas | Low-elevation erosion terraces, mid-elevation highly undulating mountainous areas | Underwater slopes, underwater terraces, underwater deltas | ||
| SLP | ° degrees | 0.345 | ≤3 | 3~8 | 8~15 | 15~25 | ≥25 | ||
| APC | / | 0.304 | Sunny slope | Semi-sunny slope | Semi-shady slope | Shady slope | / | ||
| Location Factors (0.2802) | DUL | m | 0.169 | ≤5700 | 5700~13,700 | 13,700~22,700 | 22,700~33,000 | >33,000 | |
| DRA | m | 0.165 | ≤2700 | 2700~5600 | 5600~9200 | 9200~15,700 | >15,700 | ||
| DWB | m | 0.091 | ≤2240 | 2240~5150 | 5150~9340 | 9340~18,900 | >18,900 | ||
| DMR | m | 0.101 | ≤425 | 425~1340 | 1340~2580 | 2580~4330 | >4330 | ||
| DMP | m | 0.17 | >55,500 | 35,500~55,500 | 21,500~35,500 | 10,000~21,500 | ≤10,000 | ||
| DEL | m | 0.113 | ≤2000 | 2000~5000 | 5000~9800 | 9800~18,000 | >18,000 | ||
| DMF | m | 0.107 | ≤3600 | 3600~8300 | 8300~18,000 | 18,000~38,000 | >18,500 | ||
| DFP | m | 0.084 | ≤4300 | 4300~10,300 | 10,300~22,000 | 22,000~42,500 | >42,500 | ||
| Socio-Economic Factors (0.5312) | GFR | yuan | 0.385 | Higher | High | General | Low | Lower | |
| GFE | yuan | 0.319 | Higher | High | General | Low | Lower | ||
| CPI | % | 0.024 | Higher | High | General | Low | Lower | ||
| CIU | yuan | 0.272 | Higher | High | General | Low | Lower | ||
| Land-use ecological function | Natural Factors (0.1294) | LUT | / | 0.464 | 21, 31 | 22, 32, 42 | 11, 12, 23, 24, 33, 41, 43, 45, 46 | 51, 52, 53, 64 | 61, 65 |
| GED | / | 0.130 | Low-elevation marine plains, low-elevation hills, low-elevation slightly undulating mountainous areas, underwater slopes, underwater terraces, underwater deltas | Low-elevation alluvial-diluvial terraces, low-elevation alluvial plains, low-elevation moderately undulating mountainous areas | Low-elevation erosion terraces, low-elevation alluvial terraces, low-elevation marine-alluvial plains, mid-elevation highly undulating mountainous areas | / | / | ||
| ED | m/km2 | 0.406 | ≤11 | 11~21 | 21~33 | 33~50 | >50 | ||
| Location Factors (0.5560) | DUL | m | 0.262 | >33,000 | 22,700~33,000 | 13,700~22,700 | 5700~13,700 | ≤5700 | |
| DRA | m | 0.225 | >15,700 | 9200~15,700 | 5600~9200 | 2700~5600 | ≤2700 | ||
| DWB | m | 0.189 | ≤2240 | 2240~5150 | 5150~9340 | 9340~18,900 | >18,900 | ||
| DMR | m | 0.047 | >4330 | 2580~4330 | 1340~2580 | 425~1340 | ≤425 | ||
| DMP | m | 0.277 | >55,500 | 35,500~55,500 | 21,500~35,500 | 10,000~21,500 | ≤10,000 | ||
| Socio-Economic Factors (0.2082) | FLC | % | 0.440 | Higher | High | General | Low | Lower | |
| PPT | mm | 0.349 | Higher | High | General | Low | Lower | ||
| GLC | % | 0.211 | Higher | High | General | Low | Lower | ||
| Number | Production | Living | Ecological | Conflict Types |
|---|---|---|---|---|
| I | W | W | W | Weak multifunctional conflict zone |
| II | M | W | W | Dual-function low-intensity conflict zone |
| W | M | W | ||
| W | W | M | ||
| III | S | W | W | Dual-function low-intensity strong conflict zone |
| W | S | W | ||
| W | W | S | ||
| IV | M | M | W | Dual-function moderate-intensity conflict zone |
| M | W | M | ||
| W | M | M | ||
| V | S | W | M | Complex multifunctional conflict zone |
| M | W | S | ||
| W | S | M | ||
| W | M | S | ||
| S | M | W | ||
| M | S | W | ||
| VI | M | M | M | Moderate multifunctional conflict zone |
| VII | S | M | M | Dual-function moderate-intensity strong conflict zone |
| M | S | M | ||
| M | M | S | ||
| VIII | S | S | W | Dual-function high-intensity conflict zone |
| S | W | S | ||
| W | S | S | ||
| IX | S | S | M | Dual-function high-intensity strong conflict zone |
| S | M | S | ||
| M | S | S | ||
| X | S | S | S | Severe multifunctional high-intensity conflict zone |
| Land-Use Type | Production (%) | Living (%) | Ecological (%) | Total (%) | ||||||
|---|---|---|---|---|---|---|---|---|---|---|
| W | M | S | W | M | S | W | M | S | ||
| Paddy field | 4.05 | 5.43 | 6.86 | 5.67 | 5.56 | 5.09 | 9.39 | 5.47 | 1.47 | 16.34 |
| Dry land | 2.49 | 2.32 | 2.22 | 3.10 | 2.35 | 1.58 | 3.66 | 2.91 | 0.46 | 7.03 |
| Forest land | 19.37 | 12.15 | 6.82 | 20.28 | 11.19 | 6.87 | 6.27 | 18.45 | 13.62 | 38.34 |
| Shrub | 0.78 | 0.48 | 0.47 | 1.03 | 0.28 | 0.42 | 0.62 | 0.90 | 0.22 | 1.73 |
| Sparse woodland | 2.44 | 1.93 | 1.20 | 2.88 | 1.62 | 1.06 | 2.84 | 2.20 | 0.52 | 5.57 |
| Other forest land | 1.71 | 1.61 | 1.29 | 2.03 | 1.43 | 1.15 | 1.91 | 1.48 | 1.22 | 4.61 |
| High-coverage grassland | 1.31 | 0.95 | 0.51 | 1.35 | 0.64 | 0.79 | 1.03 | 1.06 | 0.69 | 2.77 |
| Medium-coverage grassland | 0.15 | 0.13 | 0.03 | 0.15 | 0.13 | 0.04 | 0.08 | 0.14 | 0.09 | 0.31 |
| Low-coverage grassland | 0.00 | 0.01 | 0.01 | 0.01 | 0.01 | 0.01 | 0.02 | 0.01 | 0.00 | 0.02 |
| River and canal | 0.63 | 0.83 | 1.20 | 0.83 | 0.68 | 1.15 | 2.03 | 0.54 | 0.09 | 2.66 |
| Lake | 0.00 | 0.00 | 0.00 | 0.00 | 0.00 | 0.00 | 0.00 | 0.00 | 0.00 | 0 |
| Reservoir and pond | 1.70 | 1.61 | 1.86 | 1.83 | 1.58 | 1.76 | 3.52 | 1.31 | 0.34 | 5.17 |
| Tidal flat | 0.07 | 0.00 | 0.01 | 0.02 | 0.05 | 0.01 | 0.04 | 0.03 | 0.00 | 0.08 |
| Beach land | 0.09 | 0.05 | 0.08 | 0.11 | 0.04 | 0.08 | 0.09 | 0.10 | 0.03 | 0.22 |
| Urban land | 0.61 | 1.56 | 4.93 | 0.26 | 1.43 | 5.41 | 6.44 | 0.65 | 0.00 | 7.10 |
| Rural residential areas | 0.80 | 1.03 | 1.66 | 0.99 | 1.25 | 1.24 | 2.85 | 0.58 | 0.06 | 3.49 |
| Other construction land | 0.96 | 1.09 | 2.50 | 0.83 | 1.51 | 2.20 | 3.85 | 0.62 | 0.08 | 4.55 |
| Sandy land | 0.00 | 0.00 | 0.01 | 0.00 | 0.00 | 0.01 | 0.01 | 0.00 | 0.00 | 0.01 |
| Swamp land | 0.00 | 0.00 | 0.00 | 0.00 | 0.00 | 0.00 | 0.00 | 0.00 | 0.00 | 0 |
| Bare land | 0.00 | 0.00 | 0.00 | 0.00 | 0.00 | 0.00 | 0.01 | 0.00 | 0.00 | 0 |
| Total | 37.16 | 31.19 | 31.65 | 41.38 | 29.75 | 28.87 | 44.65 | 36.46 | 18.89 | 100.00 |
| Land-Use Type | Stable and Controllable (%) | Basic Controllable (%) | Basic Out-of-Control (%) | Serious Out-of-Control (%) | ||||||
|---|---|---|---|---|---|---|---|---|---|---|
| I | II | III | IV | V | VI | VII | VIII | IX | X | |
| Paddy field | 0.93 | 3.28 | 0.76 | 2.64 | 1.73 | 1.14 | 0.88 | 3.87 | 0.99 | 0.10 |
| Dry land | 0.52 | 1.92 | 0.31 | 1.26 | 0.77 | 0.51 | 0.33 | 1.22 | 0.21 | 0.00 |
| Forest land | 0.90 | 9.50 | 8.32 | 3.48 | 2.04 | 3.99 | 4.40 | 2.06 | 2.53 | 1.12 |
| Shrub | 0.07 | 0.61 | 0.20 | 0.24 | 0.10 | 0.10 | 0.04 | 0.28 | 0.11 | 0.00 |
| Sparse woodland | 0.58 | 1.64 | 0.52 | 0.87 | 0.76 | 0.34 | 0.21 | 0.47 | 0.18 | 0.00 |
| Other forest land | 0.26 | 0.93 | 0.66 | 0.50 | 0.38 | 0.34 | 0.51 | 0.81 | 0.16 | 0.05 |
| High-coverage grassland | 0.16 | 0.61 | 0.57 | 0.24 | 0.38 | 0.17 | 0.26 | 0.22 | 0.14 | 0.02 |
| Medium-coverage grassland | 0.02 | 0.08 | 0.05 | 0.04 | 0.03 | 0.04 | 0.04 | 0.00 | 0.01 | 0.00 |
| Low-coverage grassland | 0.00 | 0.01 | 0.00 | 0.00 | 0.00 | 0.00 | 0.00 | 0.01 | 0.00 | 0.00 |
| River and canal | 0.18 | 0.55 | 0.07 | 0.49 | 0.23 | 0.05 | 0.03 | 0.99 | 0.07 | 0.00 |
| Lake | 0.00 | 0.00 | 0.00 | 0.00 | 0.00 | 0.00 | 0.00 | 0.00 | 0.00 | 0.00 |
| Reservoir and pond | 0.38 | 1.49 | 0.18 | 0.85 | 0.42 | 0.12 | 0.15 | 1.31 | 0.22 | 0.05 |
| Tidal flat | 0.00 | 0.05 | 0.01 | 0.01 | 0.00 | 0.00 | 0.00 | 0.00 | 0.00 | 0.00 |
| Beach land | 0.01 | 0.07 | 0.02 | 0.02 | 0.01 | 0.01 | 0.01 | 0.06 | 0.01 | 0.01 |
| Urban land | 0.09 | 0.44 | 0.12 | 0.81 | 0.98 | 0.02 | 0.05 | 4.14 | 0.46 | 0.00 |
| Rural residential areas | 0.30 | 0.71 | 0.05 | 0.59 | 0.52 | 0.11 | 0.04 | 1.11 | 0.05 | 0.01 |
| Other construction land | 0.30 | 0.72 | 0.09 | 0.59 | 0.69 | 0.12 | 0.07 | 1.83 | 0.12 | 0.01 |
| Sandy land | 0.00 | 0.00 | 0.00 | 0.00 | 0.00 | 0.00 | 0.00 | 0.01 | 0.00 | 0.00 |
| Swamp land | 0.00 | 0.00 | 0.00 | 0.00 | 0.00 | 0.00 | 0.00 | 0.00 | 0.00 | 0.00 |
| Bare land | 0.00 | 0.00 | 0.00 | 0.00 | 0.00 | 0.00 | 0.00 | 0.00 | 0.00 | 0.00 |
| Total | 4.69 | 22.61 | 11.92 | 12.63 | 9.04 | 7.06 | 7.02 | 18.38 | 5.25 | 1.38 |
| 39.22 | 28.73 | 25.40 | 6.63 | |||||||
Disclaimer/Publisher’s Note: The statements, opinions and data contained in all publications are solely those of the individual author(s) and contributor(s) and not of MDPI and/or the editor(s). MDPI and/or the editor(s) disclaim responsibility for any injury to people or property resulting from any ideas, methods, instructions or products referred to in the content. |
© 2025 by the authors. Licensee MDPI, Basel, Switzerland. This article is an open access article distributed under the terms and conditions of the Creative Commons Attribution (CC BY) license (https://creativecommons.org/licenses/by/4.0/).
Share and Cite
Cheng, Z.; Yang, J.; Xue, D. Conflicts at the Crossroads: Unpacking Land-Use Challenges in the Greater Bay Area with the “Production–Living–Ecological” Perspective. Land 2025, 14, 249. https://doi.org/10.3390/land14020249
Cheng Z, Yang J, Xue D. Conflicts at the Crossroads: Unpacking Land-Use Challenges in the Greater Bay Area with the “Production–Living–Ecological” Perspective. Land. 2025; 14(2):249. https://doi.org/10.3390/land14020249
Chicago/Turabian StyleCheng, Zilang, Jiangmin Yang, and Desheng Xue. 2025. "Conflicts at the Crossroads: Unpacking Land-Use Challenges in the Greater Bay Area with the “Production–Living–Ecological” Perspective" Land 14, no. 2: 249. https://doi.org/10.3390/land14020249
APA StyleCheng, Z., Yang, J., & Xue, D. (2025). Conflicts at the Crossroads: Unpacking Land-Use Challenges in the Greater Bay Area with the “Production–Living–Ecological” Perspective. Land, 14(2), 249. https://doi.org/10.3390/land14020249