
The Spatial–Temporal Evolution and Coupling of Population Distribution and Social Economy in the “Mid-Spine Belt of Beautiful China”


Abstract
1. Introduction
2. Materials and Methods
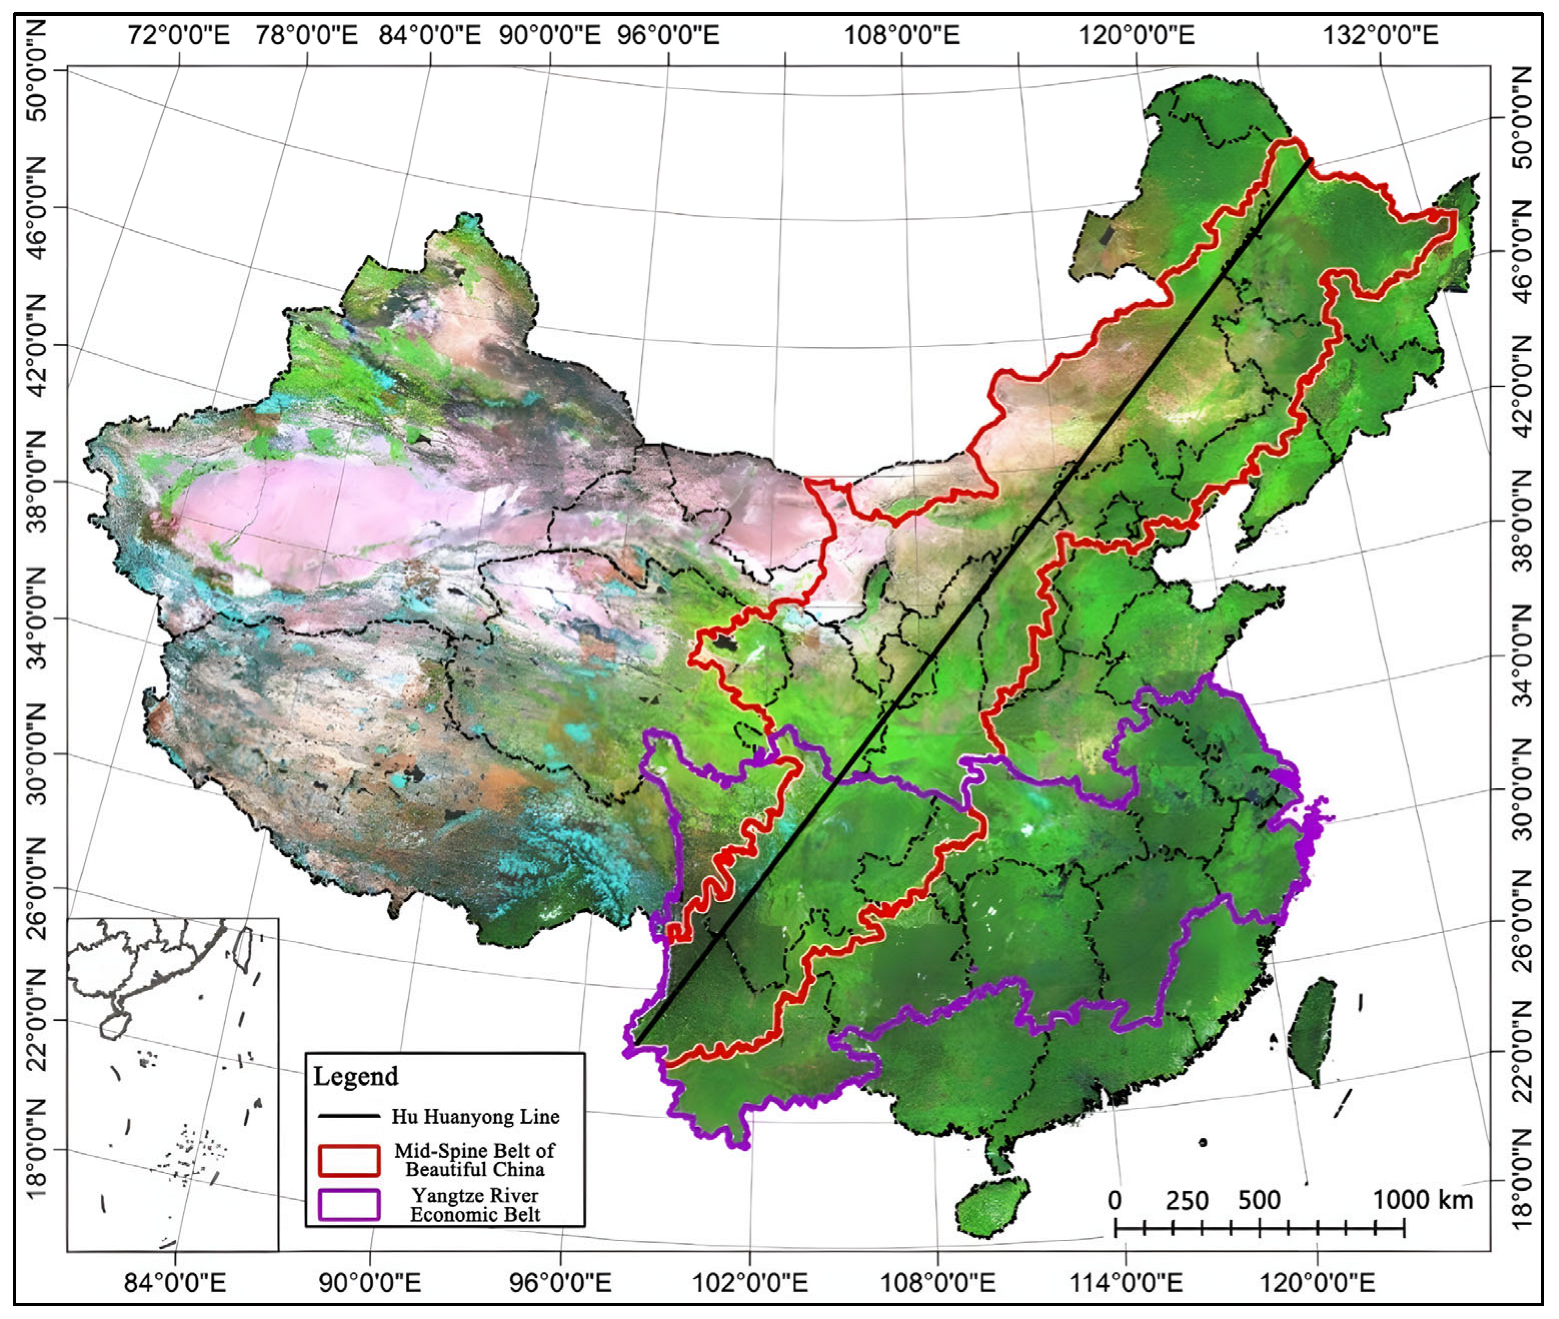
2.1. Overview of the Study Area
2.2. Data Sources
2.3. Research Methods
2.3.1. Analysis of Population Distribution and Social and Economic Balance
2.3.2. Spatial Clustering Analysis of Population Distribution and Social Economy
2.3.3. Coupling Analysis of Population Distribution and Economic Development
3. Results
3.1. Spatial–Temporal Characteristics of Population
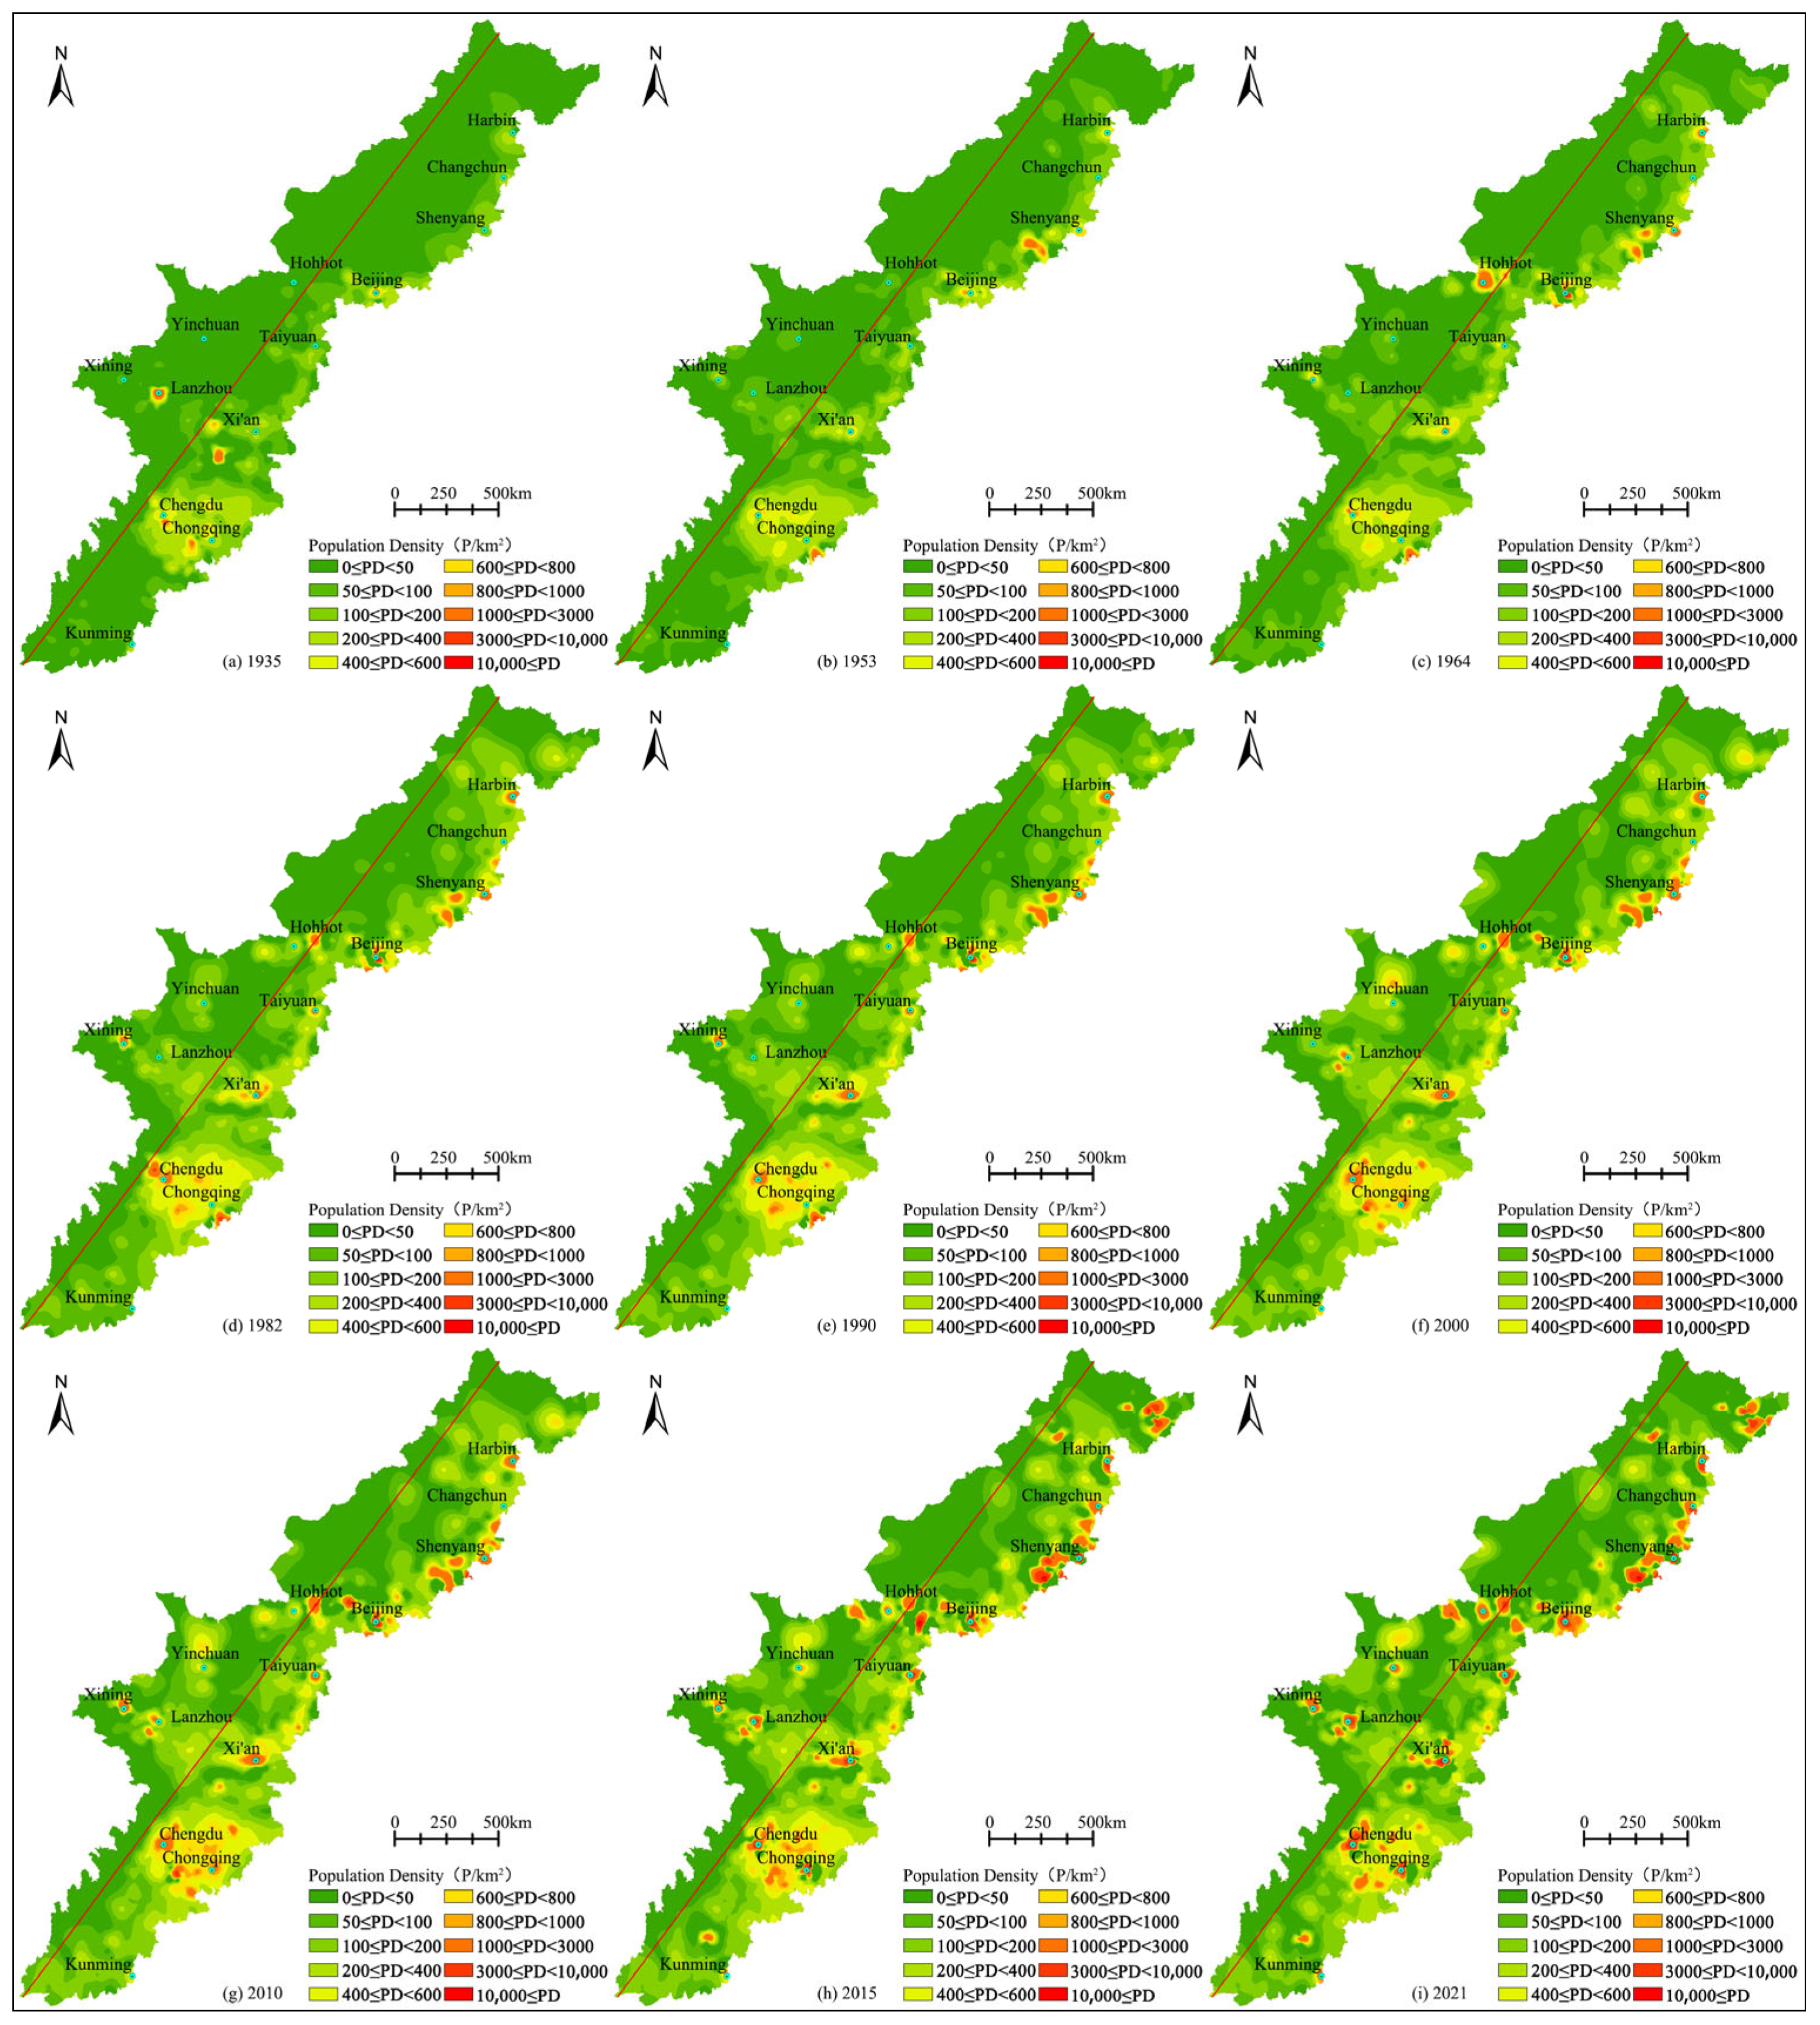
3.1.1. Spatial Distribution Pattern of Population Density
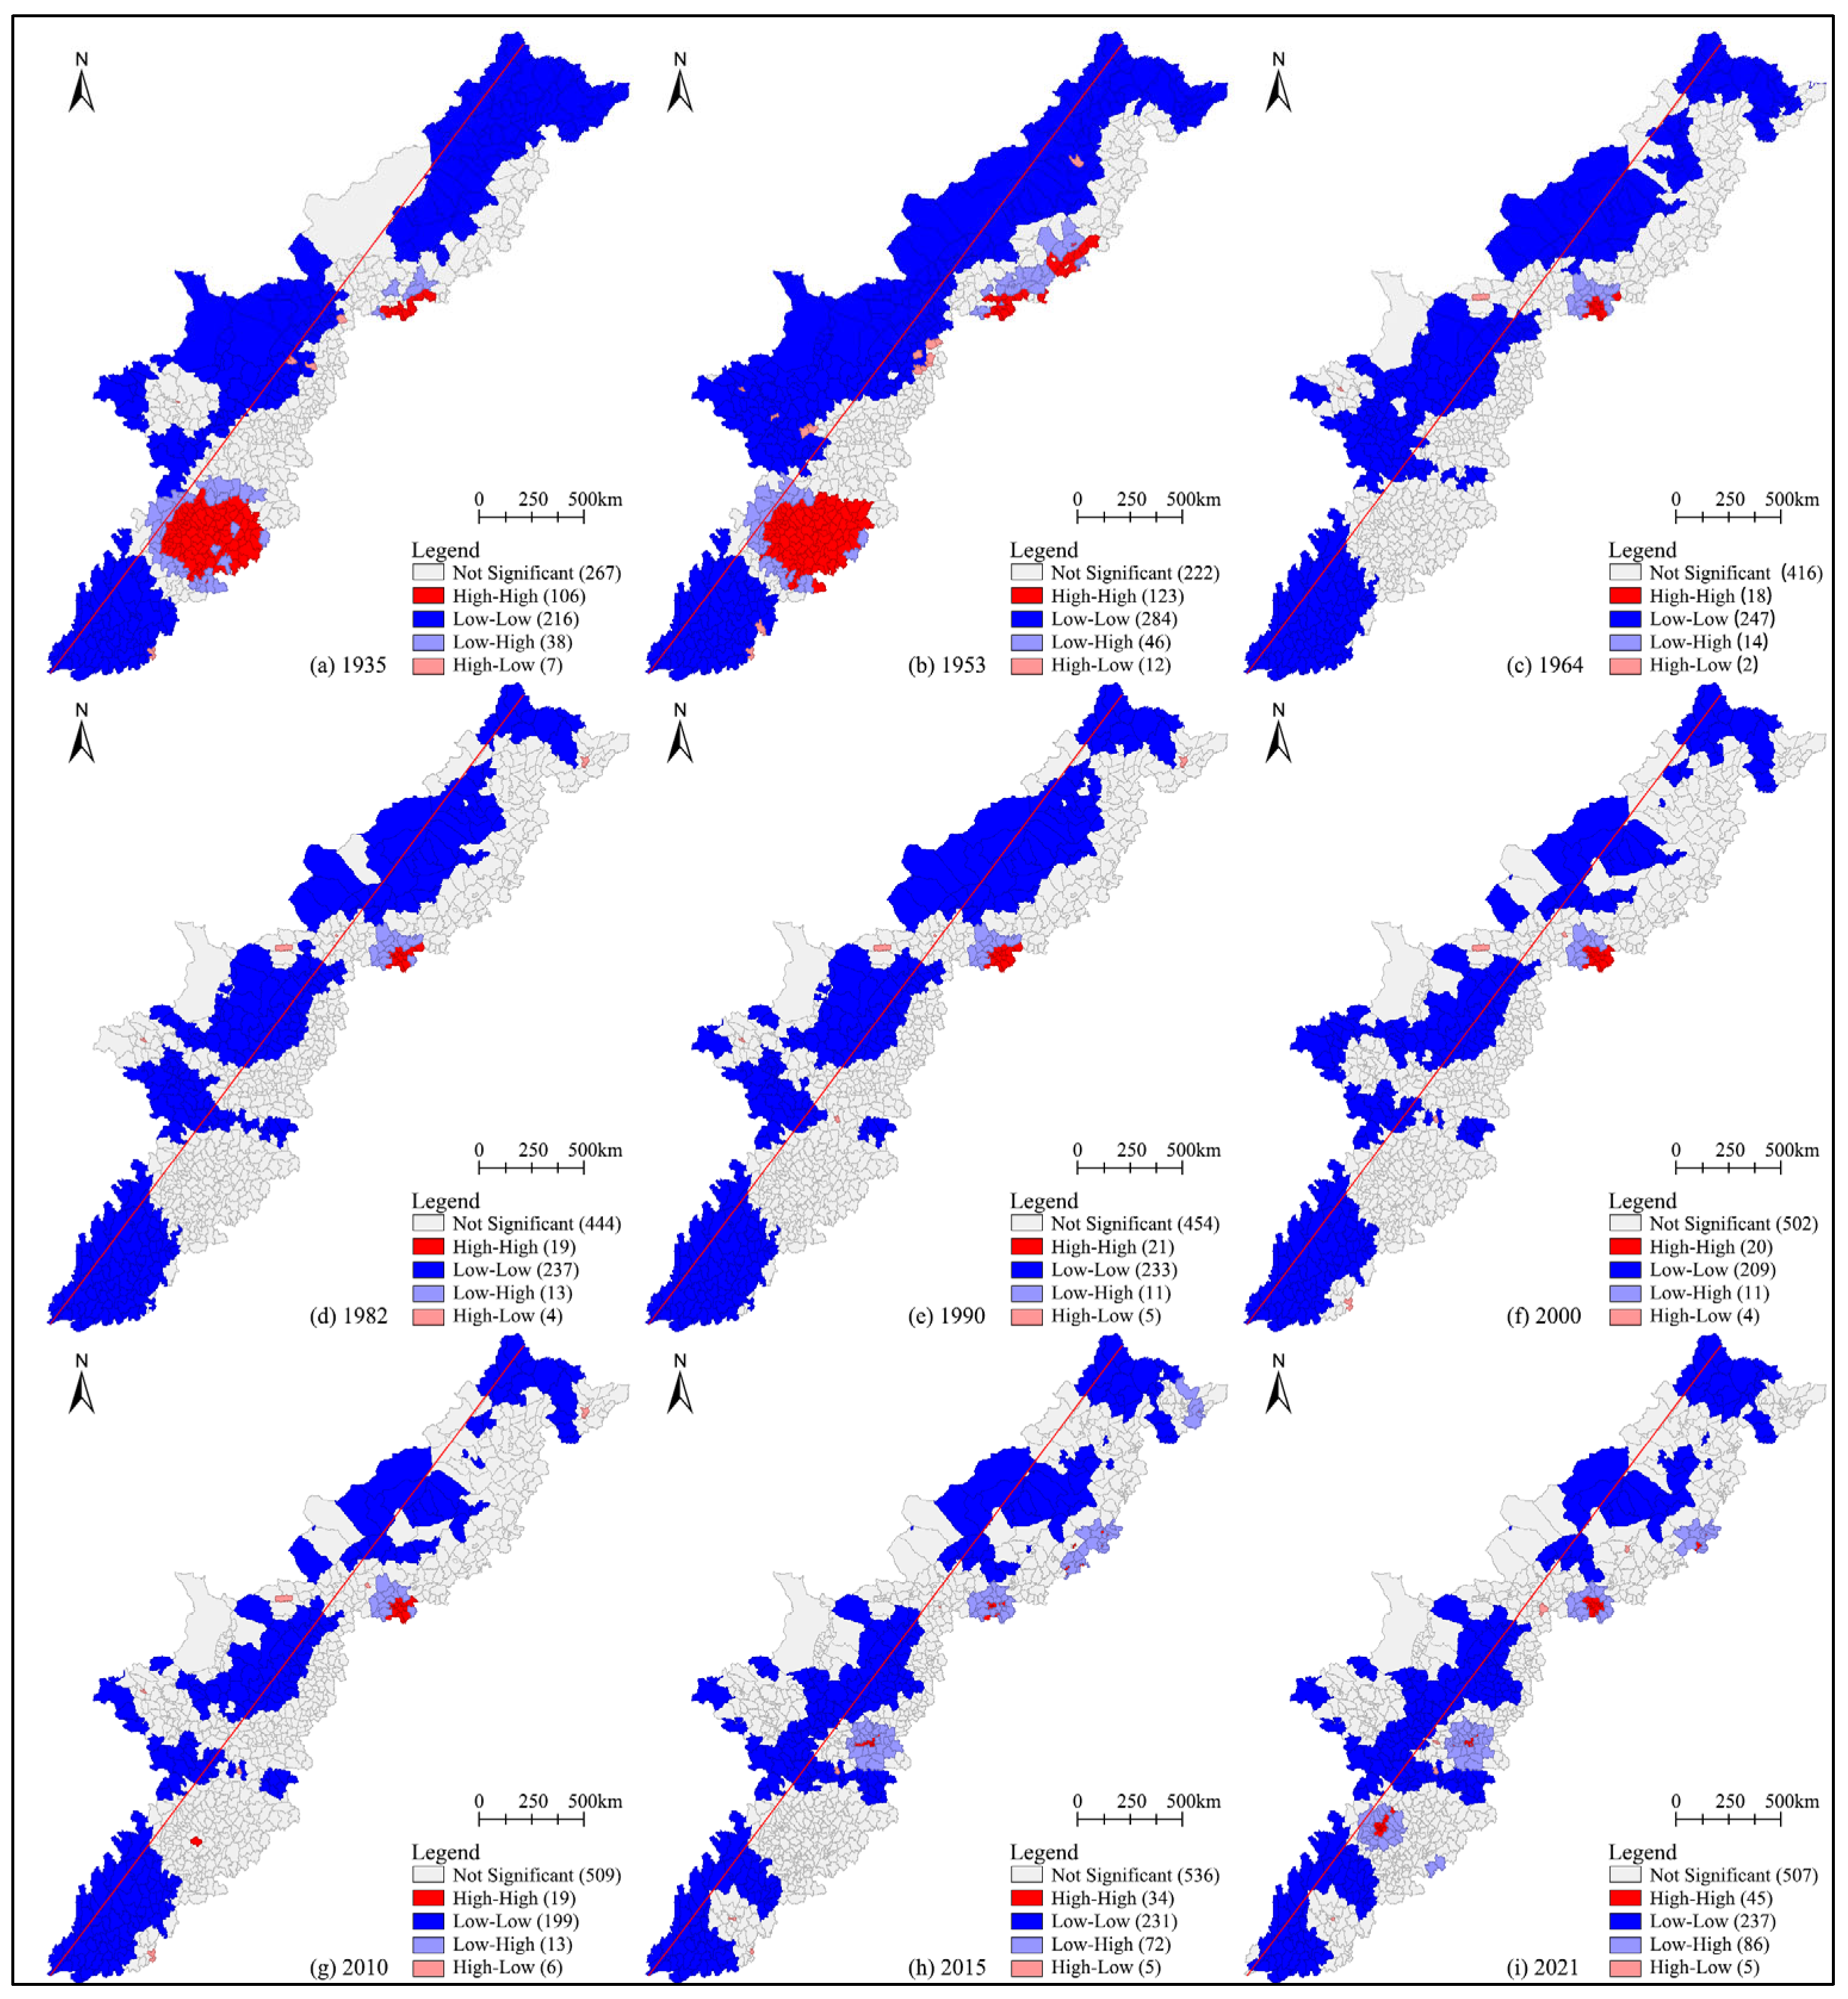
3.1.2. Spatial Aggregation Characteristics and Evolutionary Trends of Population Distribution
3.2. Spatiotemporal Characteristics of the Economy
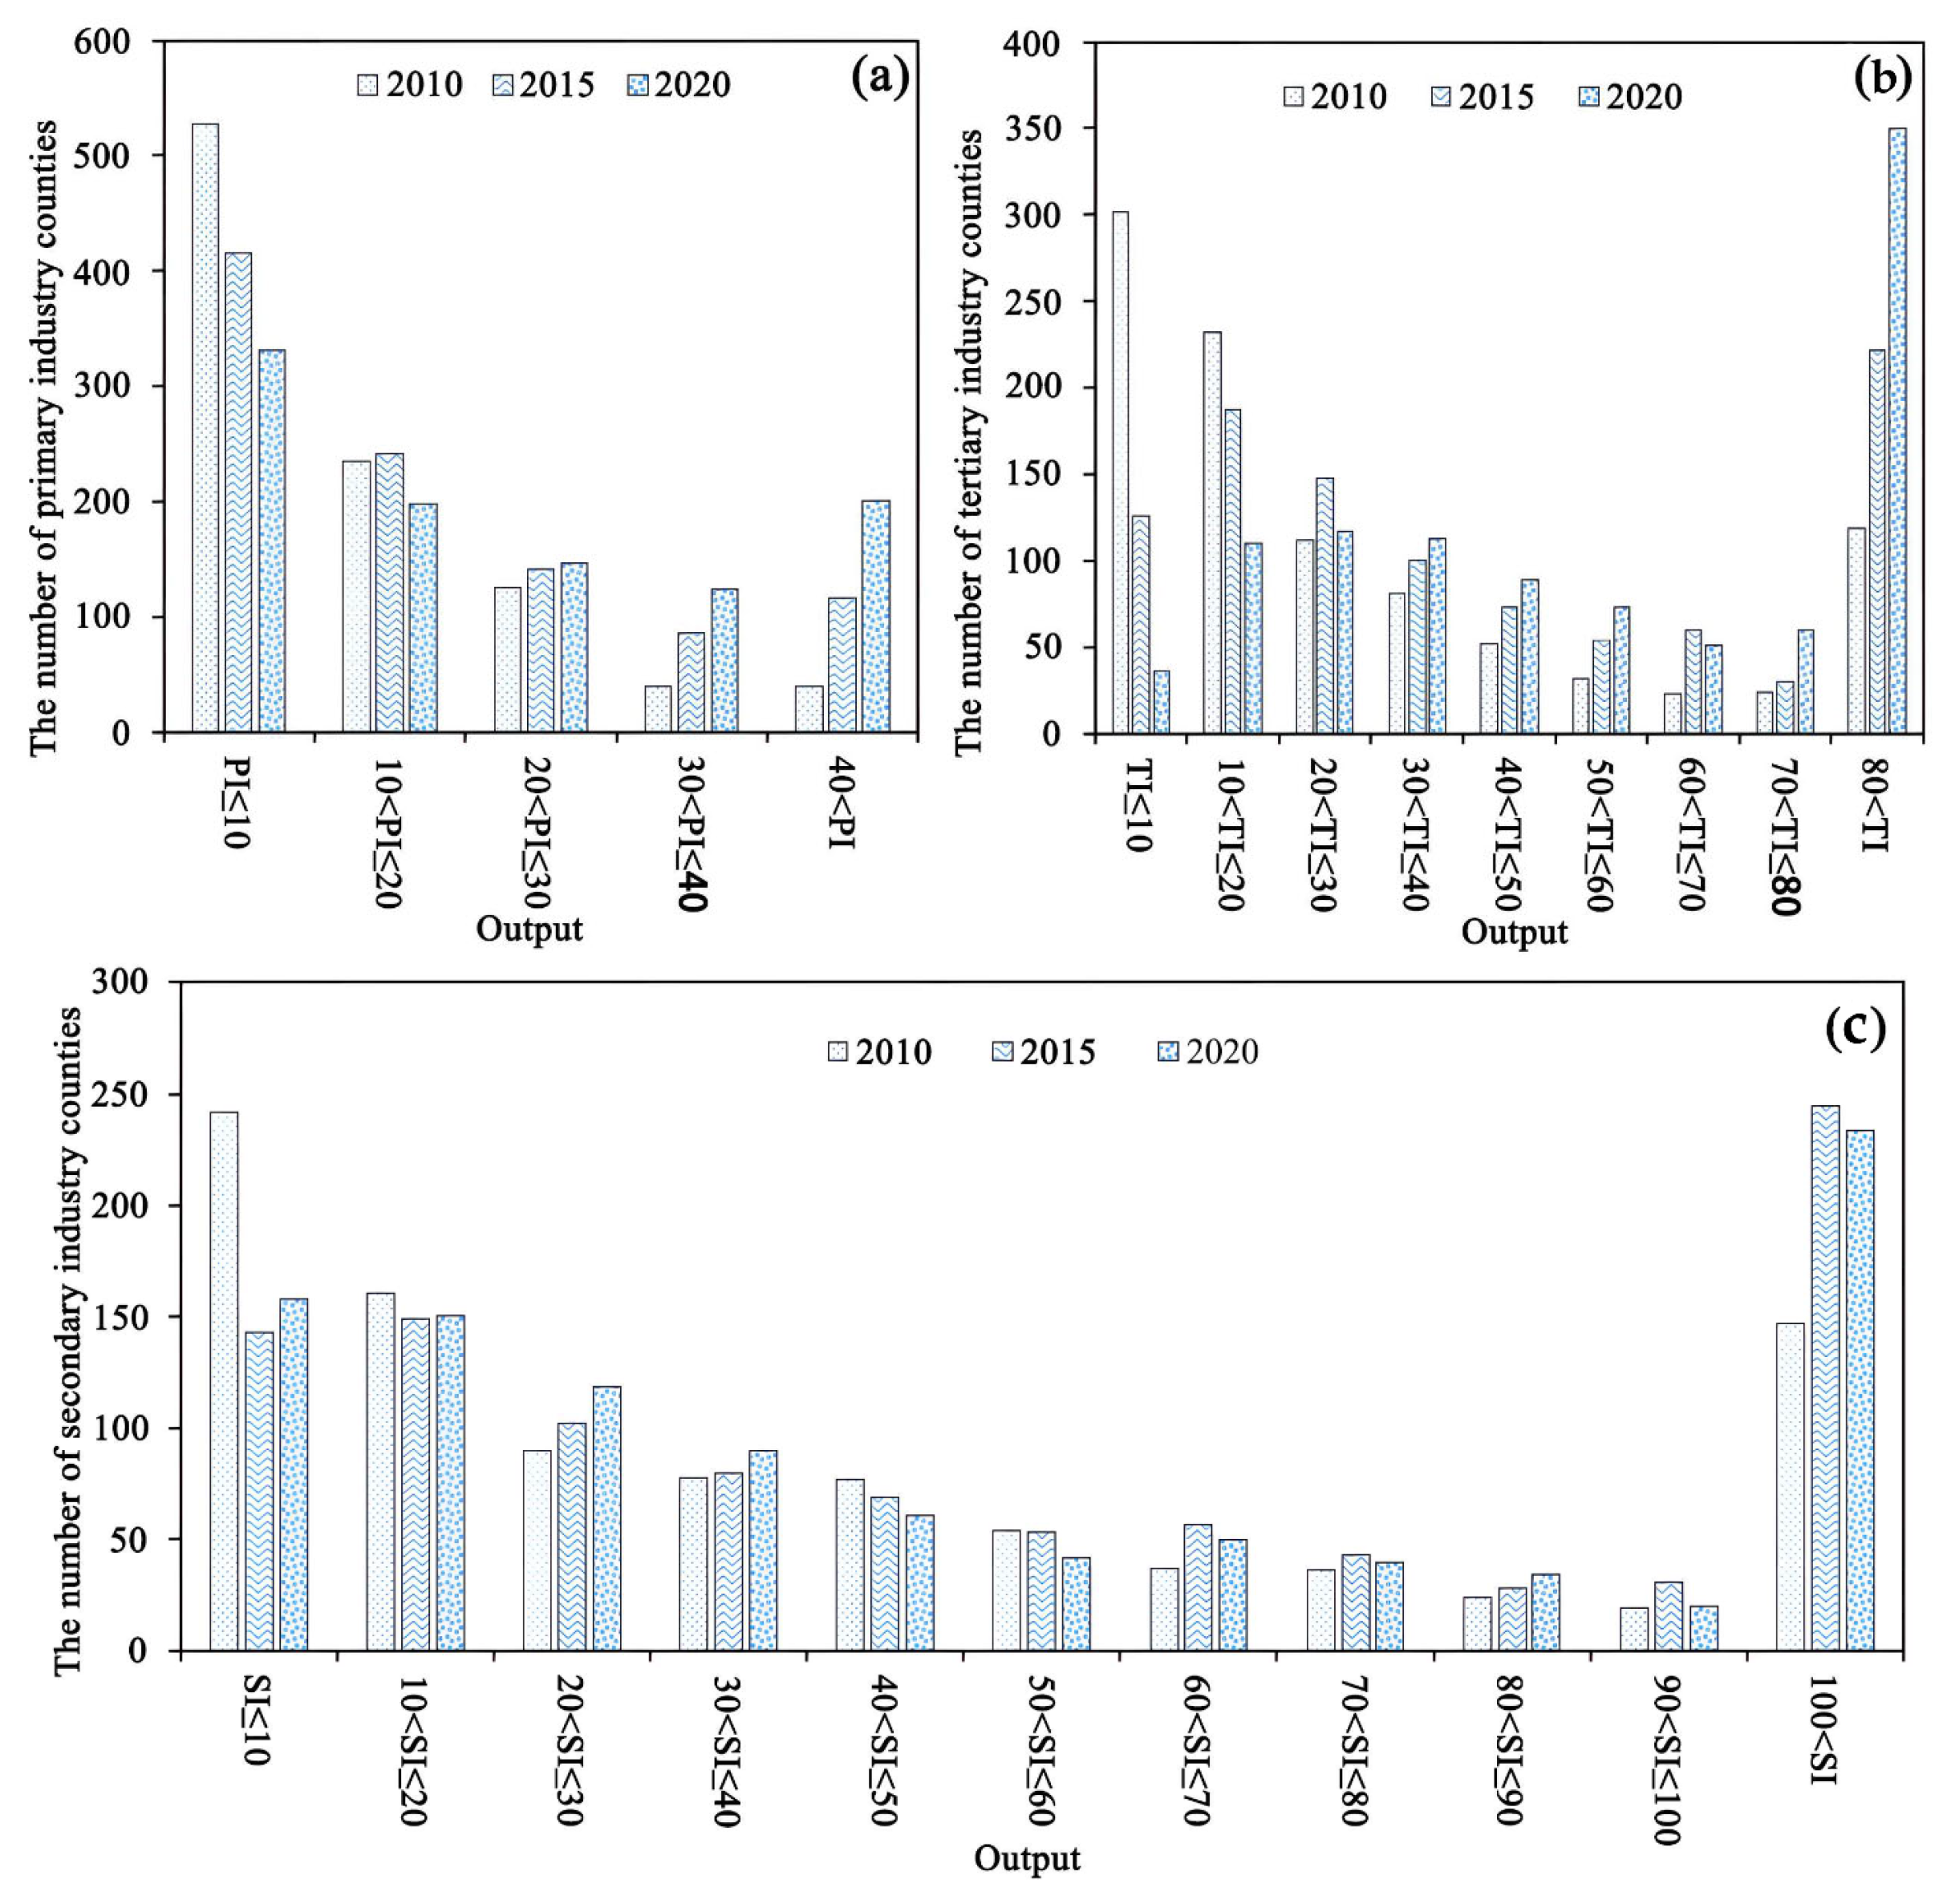
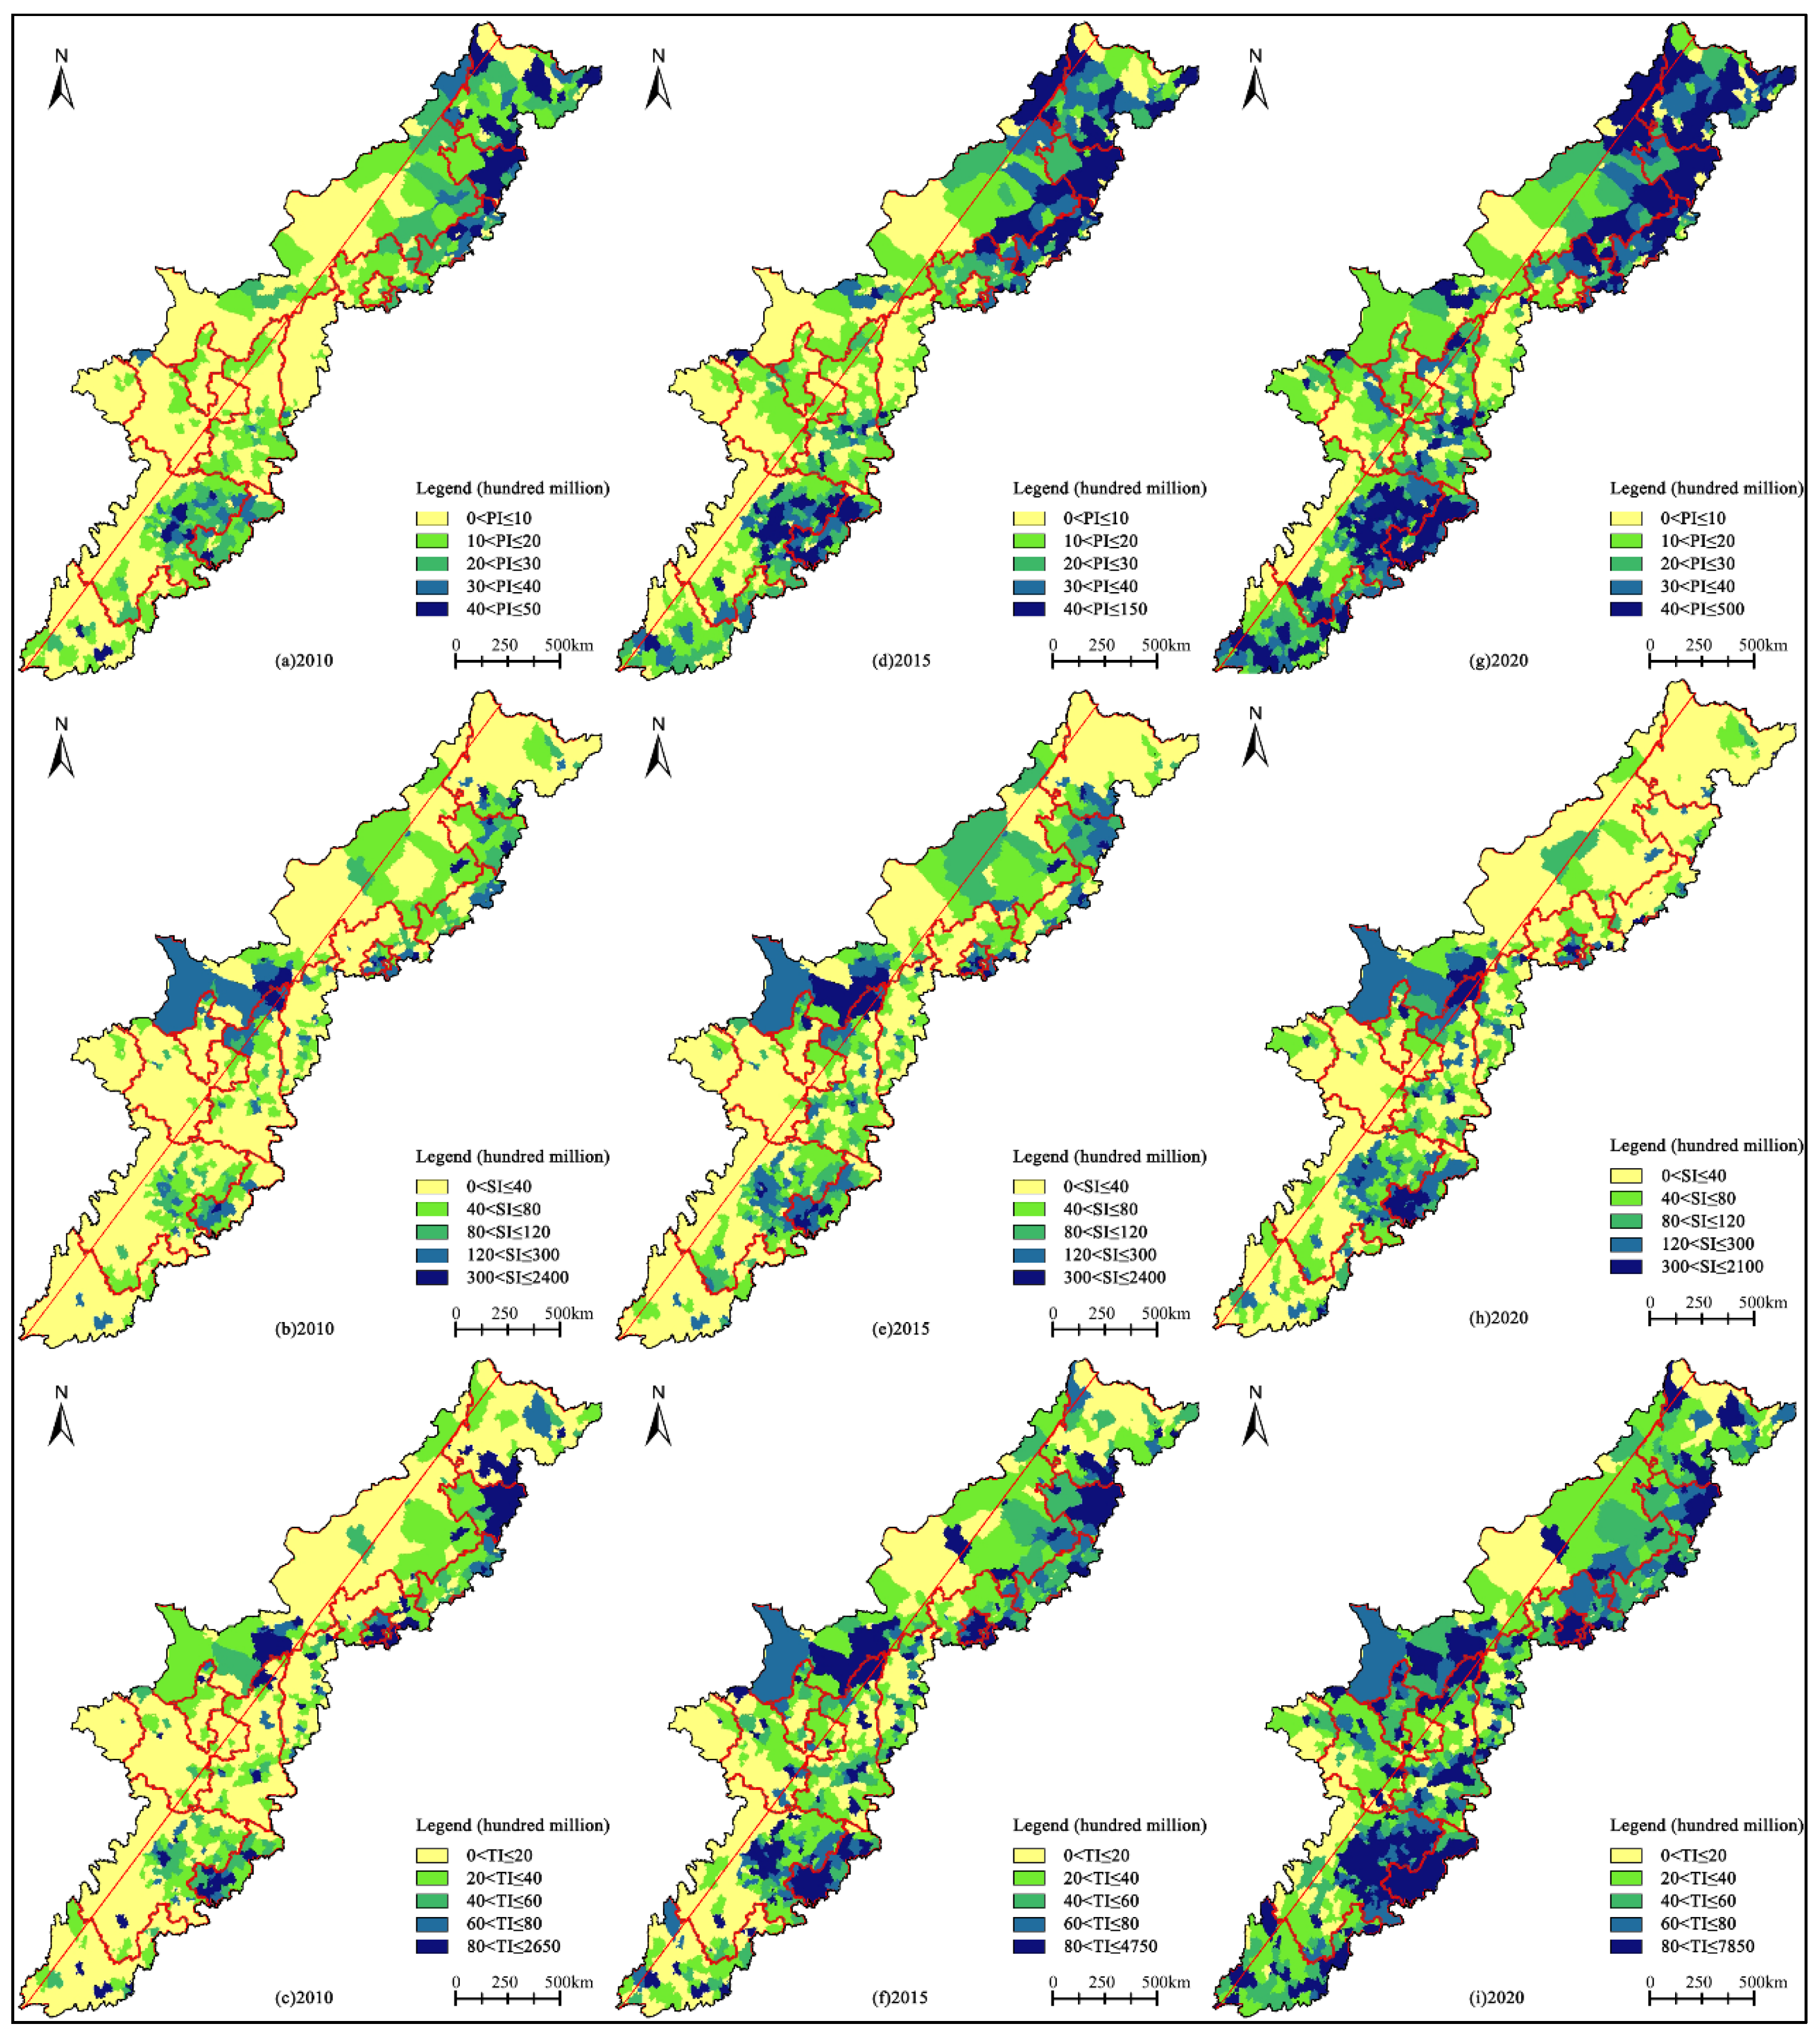
3.2.1. Spatial Distribution Pattern of Socio-Economic Factors
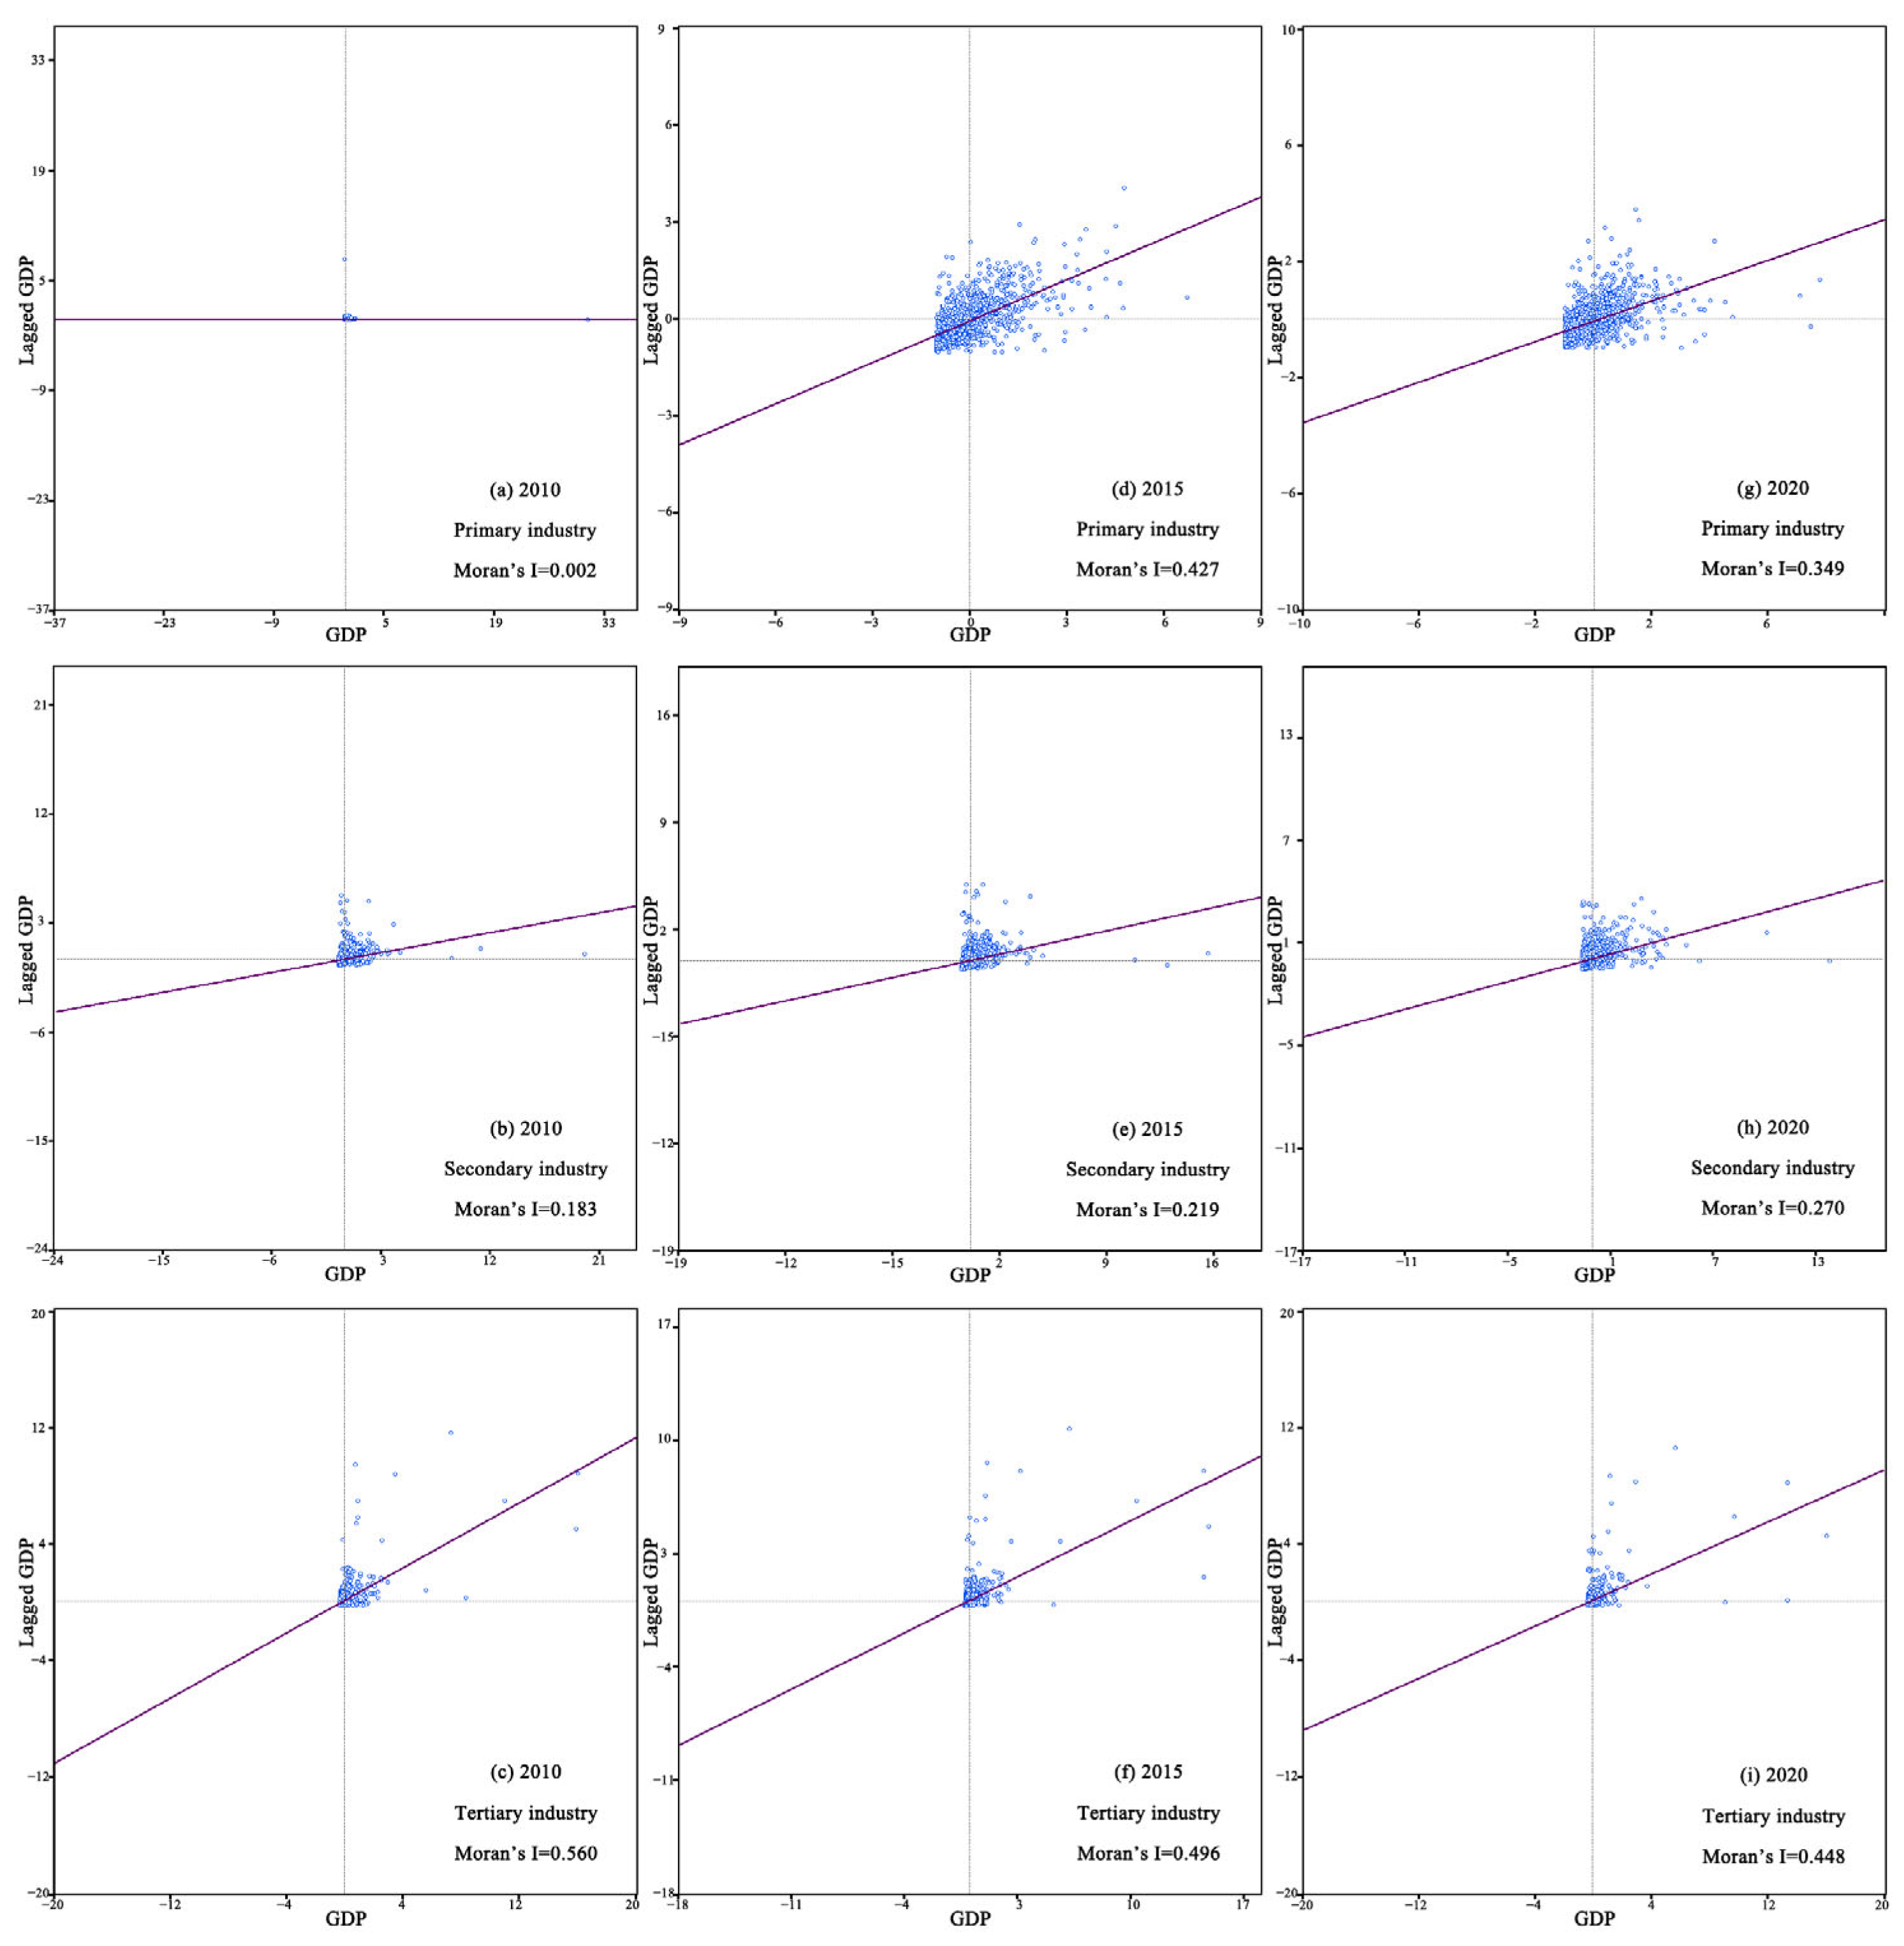
3.2.2. Characteristics and Evolutionary Trends of Socioeconomic Spatial Agglomeration
3.3. Spatial–Temporal Coupling of Population Distribution and Social Economy
3.3.1. Spatial–Temporal Evolution Characteristics of Population and Economic Gravity Center
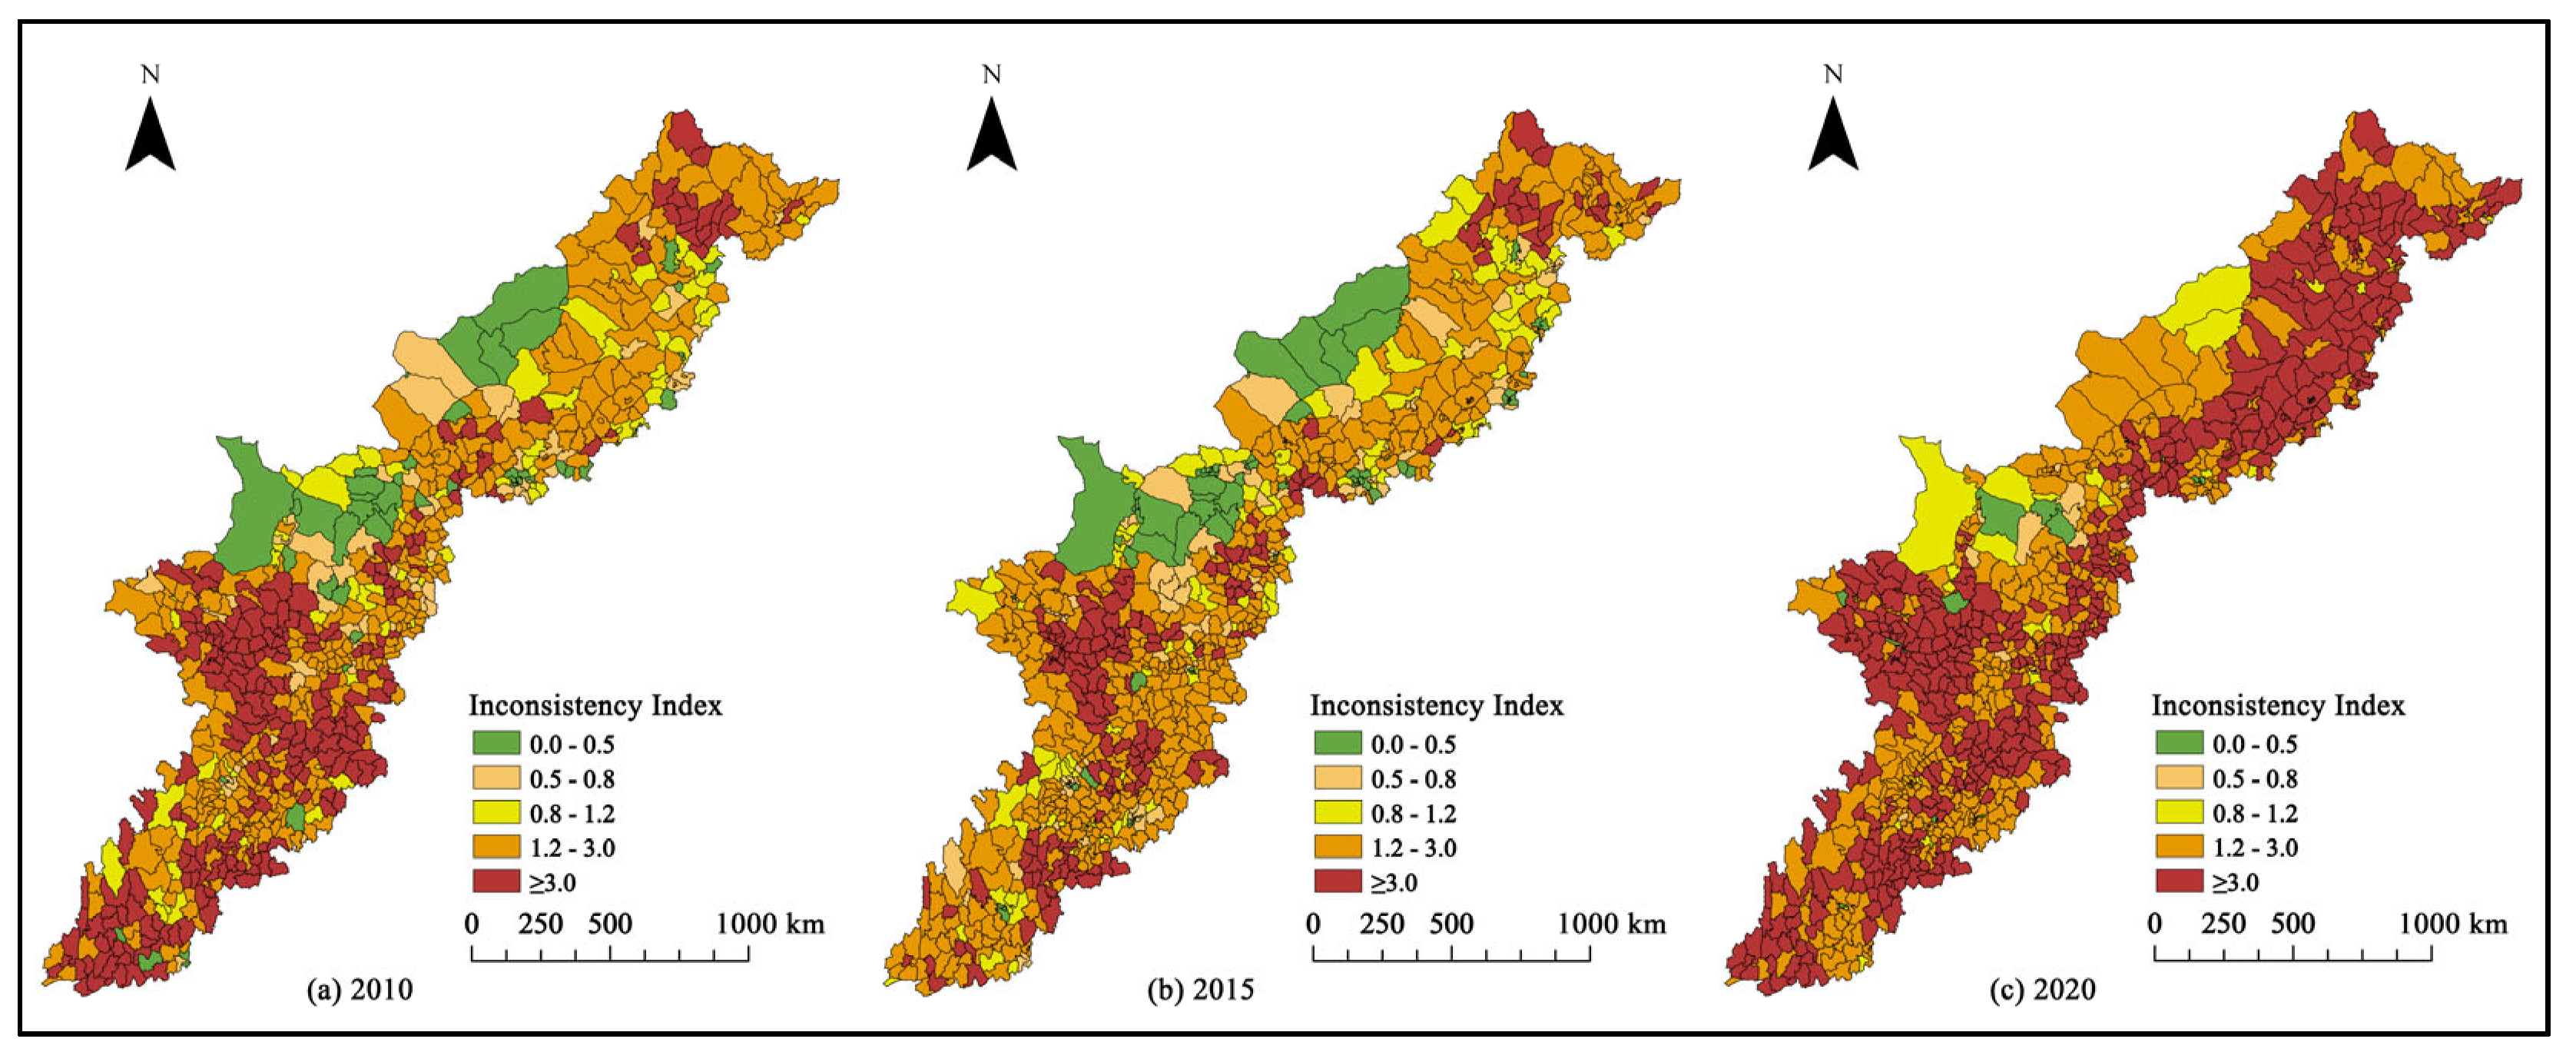
3.3.2. Analysis of the Coordination Between Population and Economy
4. Discussion
4.1. Spatial Division of the Beautiful China Mid-Ridge Zone Based on Spatial Clustering
4.1.1. Analysis of the Characteristics of the Eastern Section
4.1.2. Analysis of the Characteristics of the Middle Section
4.1.3. Analysis of the Characteristics of the Western Section
4.2. Population Distribution and Social and Economic Development Trends in the Mid-Spine Belt of Beautiful China
5. Conclusions
- (1)
- On both sides of the “Hu Line”, there is a significant spatial variation in population distribution. The population is mainly distributed on the eastern edge of the “Mid-Spine Belt of Beautiful China” and in the Sichuan Basin. Over time, the population growth rate has become significantly higher in the Hexi Corridor, Hetao Plain, and major urban agglomerations.
- (2)
- At the global scale, the population distribution of the “Mid-Spine Belt of Beautiful China” does not show significant aggregation characteristics, but rather exhibits notable spatial heterogeneity. The years with relatively obvious population distribution agglomeration are mainly 1953 and 2000, due to the rapid increase in population in the early days of the founding of the People’s Republic of China and the national western development strategy. At the local scale, the population distribution of the “Mid-Spine Belt of Beautiful China” from 1935 to 2020 can be divided into three parts: the northeast region, the central region (Xi’an–Lanzhou–Hohhot–Gansu), and the southwest region (Sichuan Basin, south of the Qinling Mountains).
- (3)
- On a global scale, there were significant spatial agglomeration differences in socioeconomic indicators in the “Mid-Spine Belt of Beautiful China” from 2010 to 2020. Second industry < first industry < tertiary industry. The first industry had the largest change, while the changes in the second and tertiary industries were relatively less significant. On a local scale, the spatial agglomeration of socioeconomic indicators in the “Mid-Spine Belt of Beautiful China” from 2010 to 2020 showed significant heterogeneity. The regions with high agglomeration of the primary industry were located in the Northeast urban agglomeration and the Sichuan Basin urban agglomeration; the regions with high agglomeration of the secondary and tertiary industries were relatively few and scattered; and the regions with low agglomeration of the three industries were mainly located in the northern part of the southwest section of the “Mid-Spine Belt of Beautiful China”.
- (4)
- From 2010 to 2020, the changes in the economic center of gravity of the “Beautiful China Mid-Spine Belt” were more pronounced compared to the population center of gravity. The migration distance of the economic center of gravity increased year by year, and the distance between the two decreased year by year. At the same time, the deviation between the population and economic centers of gravity in space showed a weakening trend, with improved balance and increased coupling.
Author Contributions
Funding
Data Availability Statement
Conflicts of Interest
References
- Wang, S.; Wang, Z. Studies on Spatial Consistency between Population Agglomeration and Economic Agglomeration in China. Popul. J. 2017, 39, 8. [Google Scholar] [CrossRef]
- Chen, X.; Yang, Z.; Zhang, Y.; Shi, Q. Simulating spatial distribution and varying patterns of population in Urumqi, China. In Proceedings of the MIPPR 2007: Remote Sensing and GIS Data Processing and Applications; and Innovative Multispectral Technology and Applications, Wuhan, China, 15–17 November 2007. [Google Scholar]
- Lian, X.; Wu, J. Dynamics of Spatial Pattern between Population and Economies in Northeast China. Popul. J. 2018, 40, 11. [Google Scholar] [CrossRef]
- Liang, W.; Wang, C.; Liu, L. Spatio-temporal Change Analysis of Population and Economic Gravity Center Gravity Center Based on ArcGIS. Geospat. Inf. 2022, 20, 4. [Google Scholar]
- Fumitaka, F.; Wong, H. The Relationship between Population and Economic Growth in AsianEconomies. ASEAN Econ. Bull. 2005, 22, 314–330. [Google Scholar]
- Yu, X.; Zhang, H.; Li, Z. Study on the Space—time Coupling between Population and Economy Based on GIS. Geomat. Spat. Inf. Technol. 2019, 42, 3. [Google Scholar]
- Hu, H. Distribution of Chinese population—With statistical tables and density charts. Chin. J. Geogr. Sci. 1935, 2, 33–74. [Google Scholar]
- Wang, X.; Gou, H.; Luo, L.; Chang, R. From Hu Huanyong Line to Mid-Spine Belt of Beautiful China: Breakthrough in Scientific Cognition and Change in Development Mode. China Acad. J. 2021, 36, 8. [Google Scholar] [CrossRef]
- Vollset, S.E.; Goren, E.; Yuan, C.-W.; Cao, J.; Smith, A.E.; Hsiao, T.; Bisignano, C.; Azhar, G.S.; Castro, E.; Chalek, J.; et al. Fertility, mortality, migration, and population scenarios for 195 countries and territories from 2017 to 2100: A forecasting analysis for the Global Burden of Disease Study. Lancet 2020, 396, 1285–1306. [Google Scholar] [CrossRef]
- Bloom, D.E.; Chatterji, S.; Kowal, P.; Lloyd-Sherlock, P.; McKee, M.; Rechel, B.; Rosenberg, L.; Smith, J.P. Macroeconomic implications of population ageing and selected policy responses. Lancet 2015, 385, 649–657. [Google Scholar] [CrossRef]
- Heim LaFrombois, M.E.; Park, Y.; Yurcaba, D. How U.S. Shrinking Cities Plan for Change: Comparing Population Projections and Planning Strategies in Depopulating U.S. Cities. J. Plan. Educ. Res. 2019, 43, 81–93. [Google Scholar] [CrossRef]
- Messina, J.P.; Brady, O.J.; Golding, N.; Kraemer, M.U.G.; Wint, G.R.W.; Ray, S.E.; Pigott, D.M.; Shearer, F.M.; Johnson, K.; Earl, L.; et al. The current and future global distribution and population at risk of dengue. Nat. Microbiol. 2019, 4, 1508–1515. [Google Scholar] [CrossRef] [PubMed]
- Delazeri, L.M.M.; Da Cunha, D.A.; Vicerra, P.M.M.; Oliveira, L.R. Rural outmigration in Northeast Brazil: Evidence from shared socioeconomic pathways and climate change scenarios. J. Rural. Stud. 2022, 91, 73–85. [Google Scholar] [CrossRef]
- Feng, Z.; Liu, X. Multi-scale Studies on the Space Consistency between Population Distribution and Economic Development in China. Popul. Econ. 2013, 9, 3–11. [Google Scholar]
- Gou, W.; An, X.; Wang, S. The Research on The Coordination Development of Population Distribution and Regional EconomyIN Shanxi Province. Econ. Geogr. 2004, 24, 5. [Google Scholar] [CrossRef]
- Wang, L.; Duan, X.; Tian, F.; Qin, X. Study on The Relationship Between Population and Economic Spatial Distribution in Yangtze River Delta. Econ. Geogr. 2009, 29, 5. [Google Scholar] [CrossRef]
- Mao, C.; Mu, G. The Mechanism of the Distribution Evolution of Floating Population and Urbanization—A Case Study of Zhejiang. Popul. J. 2016, 38, 11. [Google Scholar] [CrossRef]
- Cheng, D.; Li, X. Relationship between population distribution and topography of the Wujiang River Watershed in Guizhou province. Geogr. Res. 2020, 39, 12. [Google Scholar] [CrossRef]
- Jiang, T.; Zhu, B.; Liu, Y. Analysis on the Spatial and Temporal Evolution of Population Distribution and Its Influencing Factors in the Pearl River-Xijiang river Economic Belt. South China Popul. 2020, 35, 11. [Google Scholar]
- Liu, T.; Peng, R.; Zhuo, Y.; Cao, G. China’s changing population distribution and influencing factors: Insights from the 2020 census data. Acta Geogr. Sin. 2022, 77, 11. [Google Scholar] [CrossRef]
- You, Z.; Feng, Z.; Lei, Y.; Yang, Y.; Li, F. Regional Features and National Differences in Population Distribution in China’s Border Regions (2000–2015). Sustainability 2017, 9, 336. [Google Scholar] [CrossRef]
- Liang, L.; Chen, M.; Luo, X.; Xian, Y. Changes pattern in the population and economic gravity centers since the Reform and Opening up in China: The widening gaps between the South and North. J. Clean. Prod. 2021, 310, 127379. [Google Scholar] [CrossRef]
- Andreev, V.V. Territorial Distribution of the Population in the Russian Federation. Econ. Reg. 2017, 13, 803–811. [Google Scholar] [CrossRef]
- Inoue, T.; Inoue, N. The Future Process of Japan’s Population Aging: A Cluster Analysis Using Small Area Population Projection Data. Popul. Res. Policy Rev. 2024, 43, 58. [Google Scholar] [CrossRef]
- Zimmer, A.; Guido, Z.; Tuholske, C.; Pakalniskis, A.; Lopus, S.; Caylor, K.; Evans, T. Dynamics of population growth in secondary cities across southern Africa. Landsc. Ecol. 2020, 35, 2501–2516. [Google Scholar] [CrossRef]
- Shi, P.; Yang, Y. Study on the evaluation of the coordinated development of population and economy—Taking Wuwei of Gansu Province as an example. J. Arid. Land Resour. Environ. 2010, 24, 6. [Google Scholar] [CrossRef]
- Yang, Q.; He, L. Spatiotemporal changes in population distribution and socioeconomic development in China from 1950 to 2010. Arab. J. Geosci. 2017, 10, 498. [Google Scholar] [CrossRef]
- BI, Q. Spatial differences in the coupling of population structure and regional economy in Inner Mongolia. RrnCai ZiYuan KaiFa 2015, 4, 235–236. [Google Scholar]
- Wang, Y.; Chen, Y.; LI, Z. Evolvement characteristics of population and economic gravity centers in tarim river basin, uygur autonomous region of Xinjiang, China. Chin. Geogr. Sci. 2013, 23, 765–772. [Google Scholar] [CrossRef]
- Ma, X.; Huang, L.; Shen, B. Study on spatial interpolation method of monthly mean temperature in Shaanxi Province. J. Water Resour. Water Eng. 2017, 28, 6. [Google Scholar]
- Li, J.; Huang, W. Research on Evolution of Population and Economy Spatial Distribution Pattern in Ecologically Fragile Areas: A Case Study of Ningxia, China. Front. Environ. Sci. 2022, 10, 814569. [Google Scholar] [CrossRef]
- Yang, Q.; Wang, Y.; Li, L.; Wang, X.; He, L. Temporal-Spatial coupling analysis between population change trend and socioeconomic development in China from 1952 to 2010. J. Remote Sens. 2016, 20, 1424–1434. [Google Scholar] [CrossRef]
- Yang, Q.; Li, L.; Wang, Y.; Wang, X.; Lu, Y. Spatial distribution pattern of population and characteristics of its evolution in China during 1935–2010. Geogr. Res. 2016, 35, 14. [Google Scholar] [CrossRef]
- Wu, L.; Zhao, Y.; Wu, K. Research on the Spatial Pattern of Coupling Between Population Structure and Economic Development —A Case Study of Counties in Jiangsu Province. Popul. Decelopment 2018, 24, 11. [Google Scholar]
- Zhang, C.; Liu, Y.; Qiao, H. An empirical study on the spatial distribution of the population, economy and water resources in Northeast China. Phys. Chem. Earth Parts A/B/C 2015, 79–82, 93–99. [Google Scholar] [CrossRef]
- Zhang, P.; Xu, Y. Spatial Temporal Pattern and Influencing Factors of Population Distribution in Shandong Province. Anhui Agric. Sci. Bull. 2019, 25, 5. [Google Scholar] [CrossRef]
- Xiao, Z. Spatial Effect of Population—Economic Distribution Consistency in China. Popul. Res. 2013, 37, 11. [Google Scholar]
- Qin, Z.; Zhang, P. Simulation analysis on spatial pattern of urban population in Shenyang City, China in Late 20th century. Chin. Geogr. Sci. 2011, 21, 110–118. [Google Scholar] [CrossRef]
- Guan, J.; Wahap, H. Spatio-temporal Evolution Analysis of Population Distribution and Economic Development Inconsistent in Xinjiang. Areal Res. Dev. 2016, 35, 6. [Google Scholar]
- Wang, Y. Spatial—Temporal Evolution of Population and Economy in Beijing—Tianjin—Hebei Region. Econ. Probl. Explor. 2022, 11, 90–100. [Google Scholar]
- Chen, W.; Wang, H.; Dong, Y. Research on the Influencing Factors of Population Flow Decision in Northwest Region: Based on New Spatial Economics. Northwest Popul. J. 2022, 43, 12. [Google Scholar] [CrossRef]
- Liu, C.; Liu, X.; Shan, L.; Yuan, Y.; Peng, F. Temporal-spatial pattern and its influence factors about population migration in three provinces of northeast China. J. Liaoning Norm. Univ. Nat. Sci. Ed. 2019, 42, 391–402. [Google Scholar]
- Chen, D.; Xiang, G.; Peethambaran, J.; Zhang, L.; Li, J.; Hu, F. AFGL-Net: Attentive Fusion of Global and Local Deep Features for Building Façades Parsing. Remote Sens. 2021, 13, 5039. [Google Scholar] [CrossRef]


| Year | 1935 | 1953 | 1964 | 1982 | 1990 | 2000 | 2010 | 2015 | 2020 |
|---|---|---|---|---|---|---|---|---|---|
| I | 0.153 | 0.256 | 0.116 | 0.123 | 0.132 | 0.162 | 0.146 | 0.125 | 0.111 |
| Type | Category | Standard |
|---|---|---|
| Population agglomeration is lower than economic agglomeration | Population agglomeration is far lower than economic agglomeration | C ≤ 0.5 |
| Population agglomeration is slightly lower than economic agglomeration | 0.5 < C < 0.8 | |
| Coordination of population agglomeration and economic agglomeration | Population and economic agglomeration are basically consistent | 0.8 < C < 1.2 |
| Population agglomeration is higher than economic agglomeration | Population agglomeration is slightly higher than economic agglomeration | 1.2 < C < 3.0 |
| Population agglomeration is much higher than economic agglomeration | C ≥ 3.0 |
Disclaimer/Publisher’s Note: The statements, opinions and data contained in all publications are solely those of the individual author(s) and contributor(s) and not of MDPI and/or the editor(s). MDPI and/or the editor(s) disclaim responsibility for any injury to people or property resulting from any ideas, methods, instructions or products referred to in the content. |
© 2025 by the authors. Licensee MDPI, Basel, Switzerland. This article is an open access article distributed under the terms and conditions of the Creative Commons Attribution (CC BY) license (https://creativecommons.org/licenses/by/4.0/).
Share and Cite
Yang, Q.; Yang, J.; Chen, W.; Liang, Y.; Jia, S.; Chen, Y. The Spatial–Temporal Evolution and Coupling of Population Distribution and Social Economy in the “Mid-Spine Belt of Beautiful China”. Land 2025, 14, 235. https://doi.org/10.3390/land14020235
Yang Q, Yang J, Chen W, Liang Y, Jia S, Chen Y. The Spatial–Temporal Evolution and Coupling of Population Distribution and Social Economy in the “Mid-Spine Belt of Beautiful China”. Land. 2025; 14(2):235. https://doi.org/10.3390/land14020235
Chicago/Turabian StyleYang, Qiang, Jinxin Yang, Wenkai Chen, Yutong Liang, Shaokun Jia, and Yuanyuan Chen. 2025. "The Spatial–Temporal Evolution and Coupling of Population Distribution and Social Economy in the “Mid-Spine Belt of Beautiful China”" Land 14, no. 2: 235. https://doi.org/10.3390/land14020235
APA StyleYang, Q., Yang, J., Chen, W., Liang, Y., Jia, S., & Chen, Y. (2025). The Spatial–Temporal Evolution and Coupling of Population Distribution and Social Economy in the “Mid-Spine Belt of Beautiful China”. Land, 14(2), 235. https://doi.org/10.3390/land14020235