Abstract
Over the past two decades, the tea plantation area in Meitan County, China, has expanded nearly 30-fold, driving significant land use and cover changes (LUCC) with unclear impacts on regional carbon storage. This study uses the PLUS-InVEST model to analyze LUCC impacts on carbon storage from 2000 to 2020 and predict future changes by 2060. Results show a decline in total carbon storage from 3977.83 × 104 t in 2000 to 3960.85 × 104 t in 2020, primarily due to reductions in cultivated land and grassland. Although carbon storage in forest land and tea plantations increased, the overall trend remained negative. Multi-scenario simulations indicate that the sustainable development scenario (SDS) mitigates carbon loss, with a decrease of 31.53 × 10⁴ t, compared to larger reductions in the natural development (NDS) and economic development (EDS) scenarios. Under the SDS scenario, carbon storage in forest land and grassland increased while construction land expansion was controlled. This study emphasizes optimizing land use and agricultural management to enhance carbon sequestration and protect ecosystems, highlighting the need for a balance between ecological protection and economic development for sustainable carbon management in Meitan County.
1. Introduction
Carbon cycling plays a central role in mitigating global climate change, with its dynamic fluctuations directly influencing ecosystem stability and regional carbon balance [1,2]. As a key element of the carbon cycle, carbon storage represents the accumulation of carbon in ecosystems and serves as a critical indicator for evaluating carbon balance and sequestration capacity [3]. In recent decades, land use and land cover changes (LUCC), driven by rapid urbanization and agricultural expansion, have become the second-largest source of greenhouse gases after fossil fuel combustion, severely disrupting the capacity of terrestrial ecosystems to store carbon [4,5]. These changes impact both the spatial and temporal distribution of regional carbon storage by altering land-use types and their associated carbon densities [6].
In the past, significant research has focused on understanding carbon storage dynamics and its response to various environmental contexts. Carbon storage, as a critical component of the carbon cycle, varies greatly depending on the environmental factors influencing ecosystems. For example, in tropical regions, deforestation and agricultural expansion in the Amazon basin result in the release of hundreds of millions of tons of carbon annually, primarily due to the conversion of forests into pastures and croplands [7]. In temperate regions, carbon storage changes are primarily influenced by reforestation and vegetation restoration. Pan et al. noted that reforestation projects in Europe contributed to approximately 30% of the land carbon sink growth between 1980 and 2010 [8]. In karst regions, such as those in southwestern China, the dynamics of carbon storage are more complex due to the thin and highly heterogeneous soils, making these areas more sensitive to land use and cover changes. A study based in the Nanbei Panjiang River Basin found that the conversion of high-carbon-density land to low-carbon-density land led to a cumulative reduction of 9.036 million tons in regional carbon storage between 2000 and 2020 [9]. Additionally, agricultural ecosystems, such as tea plantations, have been found to exhibit significant carbon sequestration potential in karst regions, offering an ecological value comparable to that of conifer–broadleaf forests, rice paddies, and coral reefs [10,11]. While studies have examined carbon storage changes in tropical, temperate, and karst regions, few have focused on the impact of monoculture-based agricultural expansion in karst ecosystems.
Meitan County is a typical example of agricultural development in China’s karst regions. Since 2000, the tea plantation area has rapidly expanded from 18.67 km2 to 404.95 km2, accounting for 22% of the total land area. This expansion largely relies on encroaching on steep and high-altitude edge land, greatly changing the regional land-use pattern. Although this expansion model has driven regional economic development, its potential impact on ecosystem carbon storage remains under-analyzed. Existing studies have explored the impact of LUCC on carbon storage across multiple scales and ecosystems, integrating ecosystem service valuation models (InVEST [12]) with land-use change simulation models (such as PLUS [13], FLUS [14], SLEUTH [15], CLUE-S [16], and CA-Markov [17]). These studies have conducted extensive scenario analyses across provincial [18,19,20], watershed [21], hilly [22], plateau [23,24], urban [25,26], and county [27,28] scales, but they primarily focus on urbanization and deforestation, with little attention given to the complex interactions between agricultural growth and ecological vulnerability in karst landscapes. Therefore, this study couples the PLUS-InVEST model to conduct a high-precision quantitative analysis of the impact of LUCC on the dynamic changes in carbon storage in Meitan County. The PLUS model, by integrating multiple driving factors and random forest algorithms, accurately identifies land expansion mechanisms and simulates fine-scale dynamic changes; the InVEST model uses rasterized carbon density data to rapidly calculate carbon storage changes and provide visual representations of spatial distribution. The objectives of this study are (1) to reveal the dynamic impact of LUCC on regional carbon storage between 2000 and 2020; (2) to simulate the dynamic changes in carbon storage in 2060 under three future scenarios: natural development (NDS), sustainable development (SDS), and economic development (EDS); and (3) to provide scientific evidence for optimizing land-use management and formulating regional sustainable development policies.
2. Study Area
Meitan County (107°15′36″–107°41′08″ E, 27°20′18″–28°12′30″ N) is located in Guizhou Province, China, and is renowned as an important agricultural hub, often referred to as the “Tea City, Wine Town, Tobacco County, and Granary”. The county covers a total area of 1864 km2, with an average elevation of 910 m. As of 2023, the permanent population of Meitan County is approximately 371,800, with an urbanization rate of 49.6%. The region has a subtropical monsoon humid climate characterized by an average annual temperature of 14.9 °C. The frost-free period lasts approximately 284 days, and there is no distinct freezing or heat damage period. Meitan County receives a substantial amount of solar radiation, with a total annual radiation of 3488 MJ/m2 and scattered radiation accounting for over 60% of the total. The average annual sunshine duration is 1163 h, primarily concentrated between April and September. The county experiences abundant rainfall, with an average annual surface water runoff of 516 mm, a total surface water resource volume of 963 million m3, and an average available water volume of 951 million m3. The total average annual groundwater storage is 242 million m3, with a runoff modulus of 4.11 L/s·km2, representing 25.1% of the surface water. The forest vegetation types in Meitan County include evergreen broadleaf forests, mixed coniferous–broadleaf forests, pure coniferous forests, bamboo forests, and shrublands, with a forest coverage rate of 66.04% (Figure 1).
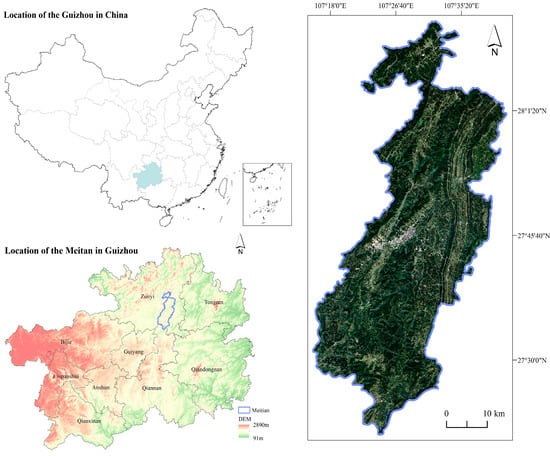
Figure 1.
Overview of the study area.
3. Materials and Methods
3.1. Research Methods
This study integrates the PLUS-InVEST model approach for analysis, focusing on land-use spatiotemporal change analysis, future scenario simulations of LUCC, and carbon storage calculation. The specific technical approach is as follows (Figure 2).
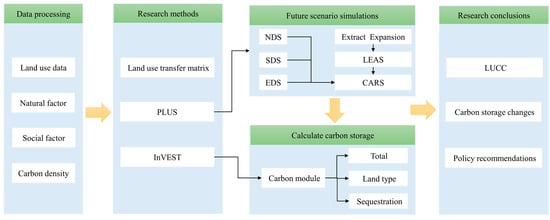
Figure 2.
Technical approach.
3.1.1. Land-Use Spatiotemporal Change Analysis
The land-use transfer matrix quantitatively describes transitions between different land-use types over time in the study area by constructing a two-dimensional matrix [29]. This matrix accurately captures changes in categories, locations, and areas, revealing transformation patterns and identifying hotspots of change. The two-dimensional matrix is represented by the following formula:
In this formula, k denotes the number of land-use types, while f and g (f, g = 1, 2…k) indicate the areas of land-use transitions between the initial state (2000) and the final state (2020).
Throughout the study period, the ratio of the area of a particular land-use type transitioning to other land-use types relative to its total area is referred to as the “outflow rate”, which measures the extent to which this land-use type diminished over the course of the study. Conversely, the ratio of the area converted from other land-use types to a particular land-use type, relative to its total area, is termed the “inflow rate”, reflecting the sources and magnitude of the increase in this land-use type over the study period [30]. Together, these two ratios serve as critical parameters for assessing the dynamics of land-use change. The formulas are as follows:
In these formulas, Rf and Mf represent the outflow and inflow rates of land-use type f, respectively; St0 and St represent the total area of land-use type f in the initial and final states, respectively; Rfg denotes the area of land-use type f transitioning to land-use type g, while Mgf denotes the area of land-use type g transitioning to land-use type f.
3.1.2. Future Scenario Simulations of LUCC
The PLUS model, developed by Liang Xun and Guan Qingfeng at China University of Geosciences (Wuhan), is a high-precision tool designed to simulate patch-level changes in land-use patterns using raster data. The model integrates the Land Expansion Analysis Strategy (LEAS) with a Cellular Automaton model (CARS), which employs multi-type random seed growth mechanisms. This innovative approach allows for a detailed exploration of the driving factors behind land expansion and facilitates fine-scale predictions of land-use pattern evolution. The PLUS model operates in a Python environment and is integrated with ArcGIS 10.8 for spatial analysis and visualization. For land-use demand prediction, this study employs seven environmental factors, ten social factors, and domain factor parameters (Table 1). A Markov chain is employed for predictive calculations, and the transition matrix is completed based on the “3060” goals, the “Guizhou Provincial Spatial Ecological Restoration Plan (2021–2035)”, and the “Meitan County Spatial Planning (2021–2035)”. The model simulates the spatial distribution of land use for 2060 under the NDS, SDS, and EDS scenarios (Table 2).

Table 1.
Domain factor parameters.
Table 2.
Conversion rules for land-use types under different scenarios.
3.1.3. InVEST Model
The InVEST model, developed by SU, TNC, and WWF, is designed to calculate changes in ecosystem services from the perspective of decision-makers and stakeholders within the broader framework of natural capital pathways. The Carbon Storage and Sequestration module, a key component of terrestrial ecosystem assessments, enables rapid calculations of total carbon storage, carbon storage across various carbon pools, and differences in carbon storage over time by inputting current or future LUCC rasters and corresponding carbon density tables. The formula is as follows:
In the formula, Sf represents the area of land-use type f; Df-above, Df-below, Df-soil, and Df-dead represent the above-ground carbon density, below-ground carbon density, soil carbon density, and dead organic carbon density of land-use type f, respectively; Dtotal is the total carbon storage in the study area.
3.2. Data Sources
Land-use data were obtained from the research team led by Xinliang Xu at the Chinese Academy of Sciences for five specific years: 2000, 2005, 2010, 2015, and 2020, with a spatial resolution of 30 m [31]. The coordinate system was standardized to GCS_WGS_1984 in ArcGIS to facilitate the UTM projection for the local area. The Reclassify tool was then used to categorize land resources and usage into six primary land-use types (Table 3).
Table 3.
Definition of land-use types.
Land-use simulation data, obtained from field surveys and literature reviews in the study area, included the selection of seven environmental and ten social factors to simulate future land-use patterns. This approach aimed to provide a comprehensive assessment of the impacts of ecosystem services and human activities on land use (Table 4). Additionally, the Resample tool in ArcGIS was used to adjust all data to a spatial resolution of 30 m, ensuring high-precision spatial analysis.
Table 4.
Driver variable data information.
The land-use carbon density data are primarily derived from previous research findings (Table 5), with studies mainly focused on regions in southern and central China, as well as Guizhou Province [32,33,34,35,36]. Above-ground and below-ground biomass carbon storage refer to the carbon stored in living plants, with the two layers divided based on soil depth: the upper layer and the lower layer. Organic carbon within the soil’s middle layer is referred to as soil organic carbon, while carbon in standing or fallen deadwood is classified as dead organic carbon. Due to variations in carbon density data across different studies, priority was given to field measurements and experiments conducted near the study area, as documented in the existing literature, to ensure data accuracy and reliability.
Table 5.
Carbon density of land-use types in Meitan County (kg/m2).
4. Results
4.1. LUCC Features
From 2000 to 2020, Meitan County underwent substantial changes in land-use patterns, primarily driven by transitions among cultivated land, forest land, and construction land (Figure 3 and Figure 4). Forest land, the dominant land-use category, remained relatively stable, increasing slightly from 1347.7 km2 to 1355.75 km2. Although 2.97% of forest land was converted to cultivated and construction land, 4.12% of cultivated land and grass land was converted back into forest land, compensating for some of the loss. Cultivated land decreased from 479.84 km2 to 461.79 km2, with its proportion of the total area dropping from 25.69% to 24.72% (Table 6). Specifically, 10.39% of cultivated land was converted into forest and construction land, while 7.78% of forest and grassland was reverted to cultivated land. In contrast, construction land expanded significantly, increasing from 4.51 km2 in 2000 to 19.22 km2 in 2020, with its share of the total area rising from 0.24% to 1.03%. A large portion of this increase (78.59%) resulted from the conversion of cultivated and forest land, underscoring the impact of urbanization and development on land-use changes. Additionally, tea plantation areas expanded from 18.67 km2 to 404.95 km2, with their output value rising significantly from USD 130,000 to USD 8.52 million, indicating substantial improvements in profitability and productivity for tea plantations (Table 7).
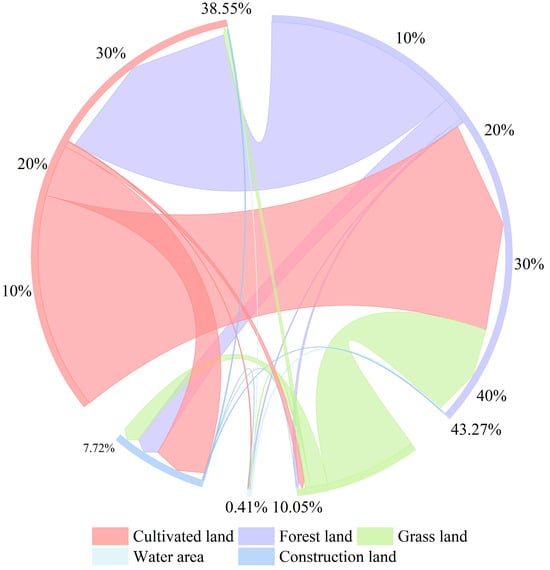
Figure 3.
Schematic diagram of land-use conversion flow in Meitan County (2000–2020).
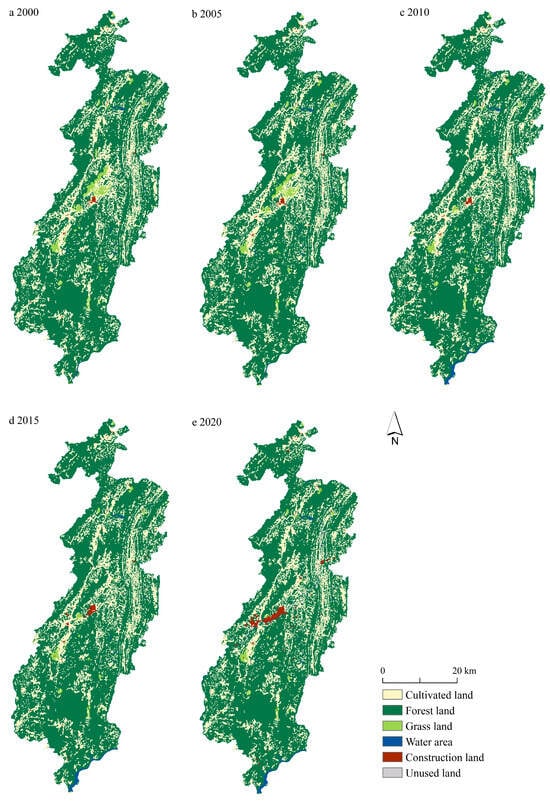
Figure 4.
Spatial distribution of land-use changes in Meitan County (2000–2020).
Table 6.
Land-use type area changes in Meitan County (2000–2020) (km2).
Table 7.
Changes in tea plantation area, output value, and forest area in Meitan County (2000–2020).
4.2. Characteristics of Carbon Storage Changes
In terms of total carbon storage in Meitan County, values in 2000, 2005, 2010, 2015, and 2020 were 39.78 × 10⁶ t, 39.84 × 10⁶ t, 39.81 × 10⁶ t, 39.82 × 10⁶ t, and 39.61 × 10⁶ t, respectively. While carbon storage showed a slight increase from 2000 to 2010, there was a notable decline of 1.70 × 105 t by 2020 (Figure 5). The Mann–Kendall (MK) trend test yielded a Z-value < 0, indicating a significant downward trend in total carbon storage. This decline can be primarily attributed to the extensive conversion of cultivated land and grassland into construction land, which considerably reduced carbon storage (Figure 3 and Figure 4). Carbon storage in cultivated land decreased from 6.55 × 10⁶ t to 6.31 × 10⁶ t, with a total loss of 2.42 × 10⁵ t over the two decades. Grassland carbon storage showed an even more pronounced reduction, dropping from 5.04 × 10⁵ t in 2000 to 2.28 × 10⁵ t in 2020, a total loss of 2.76 × 10⁵ t. Although forest land, the largest carbon pool in Meitan County, saw an increase in carbon storage, rising by 1.84 × 10⁵ t from 32.67 × 10⁶ t to 32.86 × 10⁶ t, this increase was insufficient to offset the overall losses. Forest land accounted for over 82% of the county’s total carbon storage, highlighting its critical role in carbon sequestration. Carbon storage in construction land also increased, from 4.93 × 10⁴ t to 2.14 × 10⁵ t, although its overall contribution remained limited due to its smaller baseline. From a spatial perspective (Figure 6), the southern regions of Meitan County, characterized by extensive forest coverage, emerged as high-carbon storage zones. The stability of forest land, largely composed of tea plantations, plays a crucial role in maintaining the region’s carbon storage capacity.
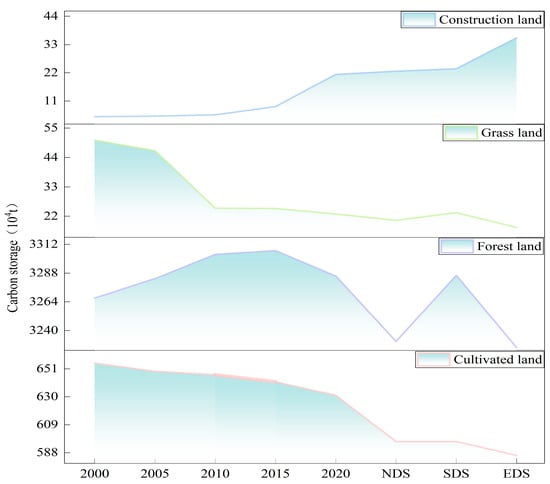
Figure 5.
Trends in carbon storage changes in Meitan County.
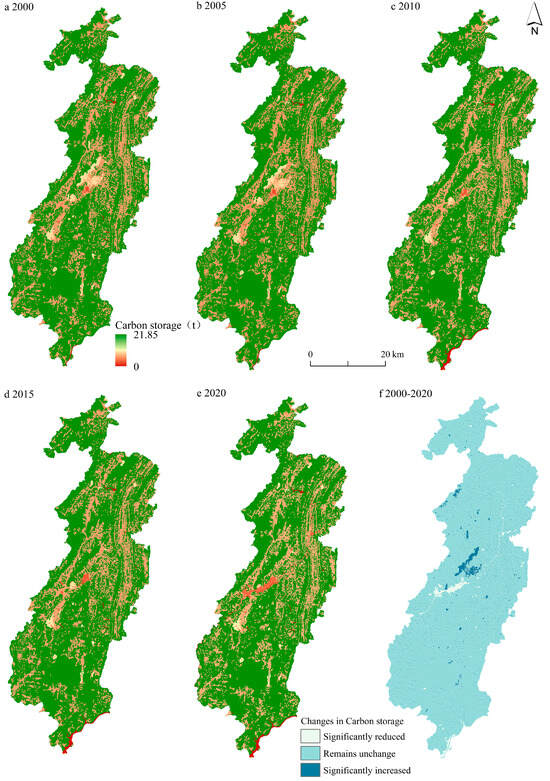
Figure 6.
Spatial distribution and difference of carbon storage in Meitan County (2000–2020).
4.3. Future Scenario Simulations
This study employs the PLUS model, using LUCC data from Meitan County for 2000 and 2010, combined with driving factors, to simulate 2020 land-use changes and validate the simulation results against real land class data. The simulation results yielded an overall accuracy of 95.37% and a Kappa coefficient of 88.58%, indicating high accuracy and consistency with actual land class distributions. Consequently, the 2010 and 2020 LUCC data are used to predict land-use type distributions for 2060 under the natural development (NDS), sustainable development (SDS), and economic development (EDS) scenarios (Figure 7). According to changes in carbon storage under different scenarios (Table 8), all scenarios show a decline in carbon storage in 2060 compared to 2020. Specifically, under the NDS and EDS scenarios, carbon storage decreased by 90.59 × 10⁴ t and 95.74 × 10⁴ t, respectively, while the SDS scenario saw a decrease of only 31.53 × 10⁴ t, indicating that the sustainable development scenario effectively mitigates carbon storage loss. Under the NDS and EDS scenarios, carbon storage in all land types declined except for construction land. Carbon storage in cultivated land decreased by 34.75 × 10⁴ t and 45.17 × 10⁴ t, forest land by 54.68 × 10⁴ t and 59.83 × 10⁴ t, and grassland by 2.35 × 10⁴ t and 4.95 × 10⁴ t, respectively. Conversely, carbon storage in construction land increased by 1.19 × 10⁴ t and 14.21 × 10⁴ t. In contrast, under the SDS scenario, only the carbon storage in cultivated land decreased by 34.75 × 10⁴ t, while carbon storage in other land types increased: forest land by 0.55 × 10⁴ t, grassland by 0.49 × 10⁴ t, and construction land by 2.18 × 10⁴ t. This change is largely due to the reduced conversion of forest land and grassland under the SDS scenario (Figure 8). By 2060, the central region of Meitan County is expected to continue experiencing an expansion of construction land due to urbanization, contributing to substantial carbon loss.
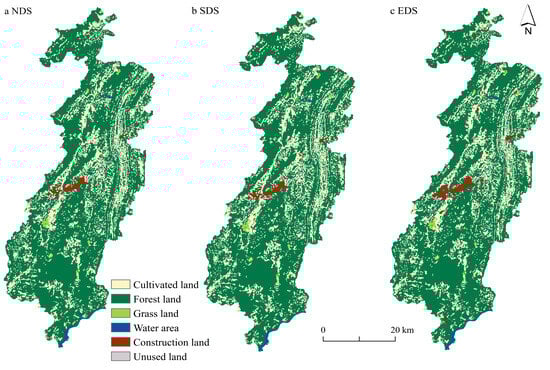
Figure 7.
Distribution of land-use types under different scenarios in Meitan County in 2060.
Table 8.
Carbon storage of different land types under different scenarios in 2060 (×104 t).
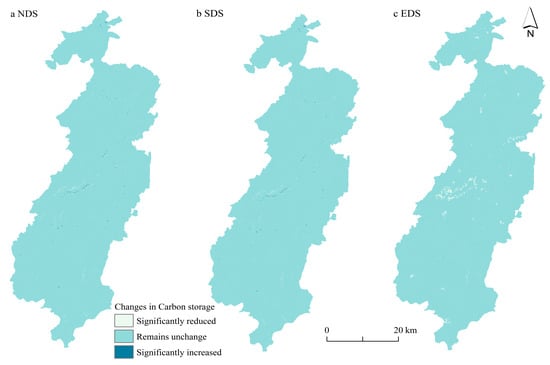
Figure 8.
Spatial variation characteristics of carbon storage under different scenarios (2020–2060).
5. Discussion
5.1. Comparison of Carbon Storage Changes
This study reveals the significant impact of LUCC on carbon storage in Meitan County between 2000 and 2020. Although carbon storage in forest land and tea plantations increased, the overall carbon storage decreased due to the reduction in cultivated land and grassland. Shi et al. found that agricultural expansion and the increase in construction land significantly reduced regional carbon storage in Guangxi Province [37]. Tang et al. further pointed out that when cultivated land is converted into construction land or agricultural expansion encroaches upon natural forests, carbon storage loss becomes particularly significant [38]. Yue et al. also observed that as land-use changes progress, the negative impact of reduced cultivated land on carbon storage may eventually outweigh the positive contribution of forest restoration [39]. These studies align with the findings of this study, demonstrating that LUCC, especially the conversion of cultivated land to construction land or other low-carbon-density land uses, leads to a significant decline in carbon storage.
The scenario simulations in this study show that under different land-use scenarios, the SDS scenario significantly slows the decline in carbon storage, reflecting the effectiveness of ecological protection policies. Under the SDS scenario, carbon storage in forest land and grassland increased, while in the NDS and EDS scenarios, rapid expansion of construction land resulted in substantial carbon storage loss. Sha et al. demonstrated that ecological protection measures in Inner Mongolia can effectively mitigate carbon storage loss and contribute to achieving regional carbon balance [40]. Nazir et al. also emphasized that the implementation of land management and restoration measures can significantly enhance the carbon sequestration potential in agriculture-dominated regions [41]. Similarly, Yang et al. found that economic-driven land-use changes significantly accelerate carbon storage loss, especially in rapidly urbanizing areas of China’s Yellow River Basin [42].
5.2. Policy Recommendations
The ecological and economic development of Meitan County are closely interconnected. The findings of this study suggest that tea plantations contribute positively to carbon storage. Specifically, under the SDS scenario, reducing the conversion of cultivated land and optimizing agricultural management practices, such as precision fertilization and intercropping, can significantly enhance the carbon sequestration capacity of tea plantations. Tong et al. indicated that precision agriculture techniques can significantly improve the carbon storage capacity of agricultural ecosystems in China [43]. Bhagat et al. proposed that through rational agricultural ecological policies and integrated agricultural systems, especially soil management and crop diversification, agricultural carbon storage can be greatly enhanced [44]. However, the vulnerability of Meitan County’s karst ecosystem complicates carbon storage management. Due to the complex topography and strong soil heterogeneity in the karst region, carbon storage shows significant spatial variation. The results of this study show that carbon storage loss is more pronounced under the NDS and EDS scenarios, particularly in areas where construction land has expanded in the central and southern parts of the county. In the future, Meitan County should focus on the coordination of ecological protection and economic development in land-use planning. This should include optimizing construction land development while strengthening the protection of forest and grassland. Tea plantations and other high-carbon-density agricultural systems should be prioritized as key areas for carbon storage management. To ensure the continued success of these initiatives, Meitan County should remain committed to the development of the tea industry, maintaining more than 40,000 ha of tea plantations, with an annual output of 80,000 tons, a production value of USD 830.4 million, and total income exceeding USD 1.384 billion.
5.3. Shortcomings and Prospects
Despite the robust findings, this study acknowledges certain uncertainties. While the coupled PLUS-InVEST model incorporates 17 natural and social driving factors, it may not fully capture the complex ecological feedback mechanisms, future policy changes, and extreme climate events that could affect carbon storage. Additionally, the fragility of the karst ecosystem and limited field data pose constraints on the temporal and spatial resolution of carbon density data. To enhance the accuracy and applicability of future research, the model’s parameters should be optimized, more field data should be incorporated, and additional uncertainty factors should be considered.
6. Conclusions
This study investigates the impact of LUCC on carbon storage in Meitan County from 2000 to 2020 and predicts future changes in carbon storage. The results indicate that while carbon storage in forest land and tea plantations has increased, the overall carbon storage has declined due to reductions in cultivated land and grassland. The simulation results show that ecological protection measures under the SDS scenario significantly slowed the loss of carbon storage, with SDS proving more effective than the NDS and EDS scenarios. This study highlights the critical need for optimizing land-use planning and agricultural management to mitigate the reduction in carbon storage amid ongoing urbanization and agricultural expansion. The findings emphasize the importance of balancing ecological protection with economic growth, particularly in rapidly expanding agricultural areas, to ensure long-term carbon storage sustainability.
Author Contributions
Y.Y., J.G. and R.Z. conceived the ideas and designed the experiment; J.L., T.L., Y.G. and S.Z. conducted an investigation on the scene and provided data; R.Z., Y.M. and H.L. analyzed the data; J.G., R.Z. and Y.M. prepared the figures and wrote the manuscript; Y.Y., M.T. and H.L. revised and edited the draft. All authors have read and agreed to the published version of the manuscript.
Funding
This research was supported by the Joint Fund of the Natural Science Foundation of China and the Karst Science Research Center of Guizhou Province (Grant No. U1812401), Guizhou Provincial Science and Technology Plan Project (Qian Ke He Cheng Guo [2022] Zhong Dian010), Guizhou forestry scientific research project, (Qianlinkehe [2022] No. 28), Karst Rocky Desertification Water-Fertilizer Coupling and Biodiversity Restoration (Guizhou Education Technology [2023] 004).
Data Availability Statement
The data sources are shown in Table 4.
Conflicts of Interest
The authors declare that they have no known competing financial interests or personal relationships that could have appeared to influence the work reported in this paper.
References
- Friedlingstein, P.; O’Sullivan, M.; Jones, M.W.; Andrew, R.M.; Gregor, L.; Hauck, J.; Le Quéré, C.; Luijkx, I.T.; Olsen, A.; Peters, G.P.; et al. Global carbon budget 2022. Earth Syst. Sci. Data 2022, 14, 4811–4900. [Google Scholar] [CrossRef]
- Houghton, R.A. Aboveground forest biomass and the global carbon balance. Glob. Change Biol. 2005, 11, 945–958. [Google Scholar] [CrossRef]
- Pan, Y.; Birdsey, R.A.; Phillips, O.L.; Houghton, R.A.; Fang, J.; Kauppi, P.E.; Keith, H.; Kurz, W.A.; Ito, A.; Lewis, S.L.; et al. The enduring world forest carbon sink. Nature 2024, 631, 563–569. [Google Scholar] [CrossRef] [PubMed]
- Wu, X.; Shen, C.; Shi, L.; Wan, Y.; Ding, J.; Wen, Q. Spatio-temporal evolution characteristics and simulation prediction of carbon storage: A case study in Sanjiangyuan Area, China. Ecol. Inform. 2024, 80, 102485. [Google Scholar] [CrossRef]
- Intergovernmental Panel on Climate Change (IPCC). 2019 Refinement to the 2006 IPCC guidelines for national greenhouse gas inventories. Agric. For. Other Land Use 2019, 4, 824. [Google Scholar]
- Li, L.; Xu, E. Scenario analysis and relative importance indicators for combined impact of climate and land-use change on annual ecosystem services in the Karst mountainous region. Ecol. Indic. 2023, 147, 109991. [Google Scholar] [CrossRef]
- Lapola, D.M.; Pinho, P.; Barlow, J.; Aragão, L.E.; Berenguer, E.; Carmenta, R.; Liddy, H.M.; Seixas, H.; Silva, C.V.; Silva-Junior, C.H.; et al. The drivers and impacts of Amazon forest degradation. Science 2023, 379, eabp8622. [Google Scholar] [CrossRef]
- Huang, L. A review on the climatic regulation effects of afforestation and its impact mechanisms. Acta Ecol. Sin. 2021, 41, 469–478. [Google Scholar]
- Luo, D.; Zhou, Z.F.; Chen, Q.; Zhang, L.; Wu, L.; Wu, T.Y. Responses of carbon storage to land use pattern in karst area: A case study of Nanbei Panjiang River Basin. Acta Ecol. Sin. 2023, 43, 3500–3516. [Google Scholar]
- Liu, S.; Yao, X.; Zhao, D.; Lu, L. Evaluation of the ecological benefits of tea gardens in Meitan County, China, using the InVEST model. Environ. Dev. Sustain. 2021, 23, 7140–7155. [Google Scholar] [CrossRef]
- Liu, W.Y.; Chiang, C.Y.; Yap, J.L.; Lin, C.C. Assessing the ecosystem service values of tea plantations using conventional and organic farming methods: Is organic farming always better? Ecol. Indic. 2024, 158, 111355. [Google Scholar] [CrossRef]
- Ouyang, Z.; Zheng, H.; Xiao, Y.; Polasky, S.; Liu, J.; Xu, W.; Wang, Q.; Zhang, L.; Xiao, Y.; Rao, E.; et al. Improvements in ecosystem services from investments in natural capital. Science 2016, 352, 1455–1459. [Google Scholar] [CrossRef] [PubMed]
- Liang, X.; Guan, Q.; Clarke, K.C.; Liu, S.; Wang, B.; Yao, Y. Understanding the drivers of sustainable land expansion using a patch-generating land use simulation (PLUS) model: A case study in Wuhan, China. Comput. Environ. Urban Syst. 2021, 85, 101569. [Google Scholar] [CrossRef]
- Qiao, X.; Li, Z.; Lin, J.; Wang, H.; Zheng, S.; Yang, S. Assessing current and future soil erosion under changing land use based on InVEST and FLUS models in the Yihe River Basin, North China. Int. Soil Water Conserv. Res. 2024, 12, 298–312. [Google Scholar] [CrossRef]
- Hwang, J.; Choi, Y.; Kim, Y.; Ol, L.N.; Yoo, Y.J.; Cho, H.J.; Sun, Z.; Jeon, S. Analysis of the effect of environmental protected areas on land-use and carbon storage in a megalopolis. Ecol. Indic. 2021, 133, 108352. [Google Scholar] [CrossRef]
- Jiang, W.; Deng, Y.; Tang, Z.; Lei, X.; Chen, Z. Modelling the potential impacts of urban ecosystem changes on carbon storage under different scenarios by linking the CLUE-S and the InVEST models. Ecol. Model. 2017, 345, 30–40. [Google Scholar] [CrossRef]
- Babbar, D.; Areendran, G.; Sahana, M.; Sarma, K.; Raj, K.; Sivadas, A. Assessment and prediction of carbon sequestration using Markov chain and InVEST model in Sariska Tiger Reserve, India. J. Clean. Prod. 2021, 278, 123333. [Google Scholar] [CrossRef]
- Du, S.; Zhou, Z.; Huang, D.; Zhang, F.; Deng, F.; Yang, Y. The response of carbon stocks to land use/cover change and a vulnerability multi-scenario analysis of the Karst region in southern China based on PLUS-InVEST. Forests 2023, 14, 2307. [Google Scholar] [CrossRef]
- Tian, L.; Tao, Y.; Fu, W.; Li, T.; Ren, F.; Li, M. Dynamic simulation of land use/cover change and assessment of forest ecosystem carbon storage under climate change scenarios in Guangdong Province, China. Remote Sens. 2022, 14, 2330. [Google Scholar] [CrossRef]
- Ma, X.Y.; Xu, Y.F.; Sun, Q.; Liu, W.J.; Qi, W. Contributing to carbon neutrality targets: A scenario simulation and pattern optimization of land use in Shandong Province based on the PLUS model. Sustainability 2024, 16, 5180. [Google Scholar] [CrossRef]
- Zhang, S.; Sun, C.; Zhang, Y.; Hu, M.; Shen, X. Exploring the spatiotemporal changes and driving forces of ecosystem services of Zhejiang Coasts, China, under sustainable development goals. Chin. Geogr. Sci. 2024, 34, 647–661. [Google Scholar] [CrossRef]
- Hu, X.; Li, Z.; Chen, J.; Nie, X.; Liu, J.; Wang, L.; Ning, K. Carbon sequestration benefits of the Grain for Green Program in the hilly red soil region of southern China. Int. Soil Water Conserv. Res. 2021, 9, 271–278. [Google Scholar] [CrossRef]
- Liu, G.; Zhao, Z. Analysis of carbon storage and its contributing factors—A case study in the Loess Plateau (China). Energies 2018, 11, 1596. [Google Scholar] [CrossRef]
- Zhao, Z.; Liu, G.; Mou, N.; Xie, Y.; Xu, Z.; Li, Y. Assessment of carbon storage and its influencing factors in Qinghai-Tibet Plateau. Sustainability 2018, 10, 1864. [Google Scholar] [CrossRef]
- Nie, X.; Lu, B.; Chen, Z.; Yang, Y.; Chen, S.; Chen, Z.; Wang, H. Increase or decrease? Integrating the CLUMondo and InVEST models to assess the impact of the implementation of the Major Function Oriented Zone planning on carbon storage. Ecol. Indic. 2020, 118, 106708. [Google Scholar] [CrossRef]
- Wang, C.; Yang, K.; Yang, W.; Qiang, H.; Xue, H.; Lu, B.; Zhou, P. R-MFNet: Analysis of urban carbon stock change against the background of land-use change based on a residual multi-module fusion network. Remote Sens. 2023, 15, 2823. [Google Scholar] [CrossRef]
- Adelisardou, F.; Zhao, W.; Chow, R.; Mederly, P.; Minkina, T.; Schou, J.S. Spatiotemporal change detection of carbon storage and sequestration in an arid ecosystem by integrating Google Earth Engine and InVEST (the Jiroft plain, Iran). Int. J. Environ. Sci. Technol. 2022, 1–16. [Google Scholar] [CrossRef]
- Li, K.; Cao, J.; Adamowski, J.F.; Mederly, P.; Minkina, T.; Schou, J.S. Assessing the effects of ecological engineering on spatiotemporal dynamics of carbon storage from 2000 to 2016 in the Loess Plateau area using the InVEST model: A case study in Huining County, China. Environ. Dev. 2021, 39, 100641. [Google Scholar] [CrossRef]
- Wu, L.; Yang, S.; Liu, X.; Luo, Y.; Zhou, X.; Zhao, H. Response analysis of land use change to the degree of human activities in Beiluo River basin since 1976. Acta Geogr. Sin. 2014, 69, 54–63. [Google Scholar]
- Peng, J.; Cai, Y.; Wang, X. Assessment on land use/cover change in karst areas based on landscape ecology: A case study at Maotiaohe River Basin, Guizhou, China. Carsologica Sin. 2007, 2, 137–143. [Google Scholar]
- Xu, Y.; Yu, L.; Peng, D.; Zhao, J.; Cheng, Y.; Liu, X.; Li, W.; Meng, R.; Xu, X.; Gong, P. Annual 30-m land use/land cover maps of China for 1980–2015 from the integration of AVHRR, MODIS and Landsat data using the BFAST algorithm. Sci. China Earth Sci. 2020, 63, 1390–1407. [Google Scholar] [CrossRef]
- Gao, H.; Han, H.; Zhang, C.; Wang, H. The impact of land use change on carbon storage in the Guizhou section of the Wujiang River Basin from 2000 to 2010. J. Sichuan Agric. Univ. 2016, 34, 48–53+84. [Google Scholar]
- Li, J.; Gong, J.; Guldmann, J.M.; Li, S.; Zhu, J. Carbon dynamics in the northeastern Qinghai–Tibetan Plateau from 1990 to 2030 using Landsat land use/cover change data. Remote Sens. 2020, 12, 528. [Google Scholar] [CrossRef]
- Li, M.; Ding, G. Research on carbon storage of major forest types in Guizhou Qiandongnan. J. Cent. South Univ. For. Technol. 2013, 33, 119–124. [Google Scholar]
- Li, Y.; Luo, H. Temporal and spatial evolution of carbon storage in typical counties in karst areas of central Guizhou and multi-scenario simulation prediction: A case study of Puding County. Environ. Sci. 2024, 45, 961–973. [Google Scholar]
- Zhang, S.; Bai, X.; Wang, S.; Qin, L.; Tian, Y.; Luo, G.; Li, Y. Assessment of ecosystem services in typical rocky desertification areas based on InVEST model: A case study of Qinglong County. J. Earth Environ. 2014, 5, 328–338. [Google Scholar]
- Shu-Qi, H.; Da-Fang, W.; Yue-Ling, P.; Jin-Yao, L.; Zhou, P. A study on the spatiotemporal dynamics of land cover change and carbon storage in the northern Gulf Economic Zone of Guangxi based on the InVEST model. Atmosphere 2024, 15, 1332. [Google Scholar] [CrossRef]
- Tang, L.; Ke, X.; Zhou, T.; Zheng, W.; Wang, L. Impacts of cropland expansion on carbon storage: A case study in Hubei, China. J. Environ. Manag. 2020, 265, 110515. [Google Scholar] [CrossRef]
- Yue, C.; Ciais, P.; Houghton, R.A.; Nassikas, A.A. Contribution of land use to the interannual variability of the land carbon cycle. Nat. Commun. 2020, 11, 3170. [Google Scholar] [CrossRef]
- Sha, Z.; Bai, Y.; Lan, H.; Liu, X.; Xie, Y. Can more carbon be captured by grasslands? A case study of Inner Mongolia, China. Sci. Total Environ. 2020, 723, 138085. [Google Scholar] [CrossRef]
- Nazir, M.J.; Nazir, M.J.; Li, G.; Nazir, M.; Zulfiqar, F.; Siddique, K.H.; Iqbal, B.; Du, D. Harnessing soil carbon sequestration to address climate change challenges in agriculture. Soil Tillage Res. 2024, 237, 105959. [Google Scholar] [CrossRef]
- Yang, W.; Pan, J. How do trade-offs between ecological construction and urbanization affect regional carbon balance? A case study from China’s Yellow River Basin. Catena 2024, 247, 108534. [Google Scholar] [CrossRef]
- Tong, H.; Xia, E.; Sun, C.; Yan, K.; Li, J.; Huang, J. Construction and comprehensive evaluation of an index system for climate-smart agricultural development in China. J. Clean. Prod. 2024, 469, 143216. [Google Scholar] [CrossRef]
- Bhagat, R.; Walia, S.S.; Sharma, K.; Singh, R.; Singh, G.; Hossain, A. The integrated farming system is an environmentally friendly and cost-effective approach to the sustainability of agri-food systems in the modern era of the changing climate: A comprehensive review. Food Energy Secur. 2024, 13, e534. [Google Scholar] [CrossRef]
Disclaimer/Publisher’s Note: The statements, opinions and data contained in all publications are solely those of the individual author(s) and contributor(s) and not of MDPI and/or the editor(s). MDPI and/or the editor(s) disclaim responsibility for any injury to people or property resulting from any ideas, methods, instructions or products referred to in the content. |
© 2025 by the authors. Licensee MDPI, Basel, Switzerland. This article is an open access article distributed under the terms and conditions of the Creative Commons Attribution (CC BY) license (https://creativecommons.org/licenses/by/4.0/).