Article

Innovative Multi-Type Identification System for Cropland Abandonment on the Loess Plateau: Spatiotemporal Dynamics, Driver Shifts (2000–2023) and Implications for Food Security

1
Key Laboratory of Land Surface Pattern and Simulation, Institute of Geographic Sciences and Natural Resources Research, Chinese Academy of Sciences, Beijing 100101, China
2
Hebei Collaborative Innovation Center for Urban-Rural Integration Development, Shijiazhuang 050061, China
Land 2025, 14(10), 2062; https://doi.org/10.3390/land14102062
Submission received: 15 September 2025 / Revised: 7 October 2025 / Accepted: 13 October 2025 / Published: 15 October 2025

Abstract

As a critical ecological barrier and key dryland agricultural zone in China, the Loess Plateau is faced with acute tensions between food security risks arising from cropland abandonment (CA) and the imperatives of ecological conservation. Yet, existing research has failed to adequately capture the long-term, high-spatiotemporal-resolution dynamics of abandonment in this region or to quantitatively couple its driving mechanisms with implications for food security. To address these gaps, this study establishes a high-precision identification system for CA tailored to the Plateau’s complex topographic conditions, distinguishing among interannual abandonment, multiyear abandonment, conversion to forest/grassland, and reclamation. Leveraging long-term data from 2000 to 2023 and integrating the Mann–Kendall test with the random forest algorithm, we examine the spatiotemporal trajectories, driving forces, and food security consequences of CA. Guided by a “type differentiation–grade classification–temporal tracking” framework, the analysis reveals a marked transition in dominant drivers from “socioeconomic factors” to “topographic–climatic factors.” It further identifies an “increasing loss–slowing growth” effect of abandonment on grain production, alongside a “pressure alleviation” trend in per capita carrying capacity. The results showed that: (1) Between 2000 and 2023, the area of CA on the Loess Plateau expanded from 2.72 million ha to 6.96 million ha, with high-grade abandonment (≥8 years) accounting for 58.9% of the total and being spatially concentrated in the hilly–gully regions of northern Shaanxi and eastern Gansu; (2) The Grain for Green Project (GFGP) peaked at approximately 340,000 hectares in 2018, followed by a slight decline, but has generally remained at around 300,000 hectares since then; (3) The reclamation rate of CA remained between 5% and 12% during 2003–2015, with minimal overall fluctuations, but after 2016, it gradually increased and peaked at 23.4% in 2022; (4) In terms of driving forces, population density (14.99%) was the primary determinant in 2005, whereas by 2020, slope (15.43%) and mean annual precipitation (15.63%) emerged as core factors; and (5) Grain yield losses attributable to abandonment increased from less than 100 t to nearly 450 t, though the growth rate slowed after 2016, accompanied by gradual alleviation of pressure on per capita carrying capacity. Overall, the study offers robust empirical evidence to inform cropland protection, food security strategies, and sustainable agricultural development policies on the Loess Plateau.

1. Introduction

Cropland is not only the material foundation of food production but also a critical resource for sustaining ecosystem services and socio-economic resilience [1,2]. However, the rapid advance of industrialization and urbanization worldwide has intensified the loss and degradation of cropland resources [3,4]. Among these challenges, cropland abandonment, as a distinctive form of cropland non-agriculturalization, has increasingly emerged as a key factor threatening food security [5,6,7]. Abandonment directly reduces the effective sown area and may further trigger secondary problems such as soil erosion and fertility decline, thereby weakening regional grain production capacity and posing potential risks to national food security strategies [1]. China has attached great importance to cropland protection and food security, and has repeatedly emphasized the promotion of the utilization and reclamation of cropland abandoned (CA) according to local conditions [8,9]. Nevertheless, the problem remains severe in ecologically fragile regions such as the Loess Plateau [10,11]. Therefore, an in-depth analysis of the spatiotemporal dynamics of cropland abandonment and its impact mechanisms on food security is of critical and urgent importance for formulating targeted and effective cropland protection policies, safeguarding national food security, and advancing sustainable agricultural development.
In recent years, the rise of remote sensing big data has created new opportunities for studying the spatiotemporal dynamics of CA. Early research largely relied on sample surveys and meta-analyses, which could capture local abandonment characteristics but were insufficient for large-scale, long-term monitoring. With advances in remote sensing technology, time-series change detection based on vegetation indices has gradually become the mainstream approach. Remote sensing enables not only the extraction of abandonment extent and quantity but also the analysis of temporal trends and driving factors, and has thus become an efficient and rapid means of CA identification [12,13,14,15,16,17]. Scholars have developed algorithms for annual and seasonal abandonment detection using imagery from Landsat [16,18], MODIS [19,20,21], and Sentinel [22,23], revealing the spatial distribution of abandoned cropland. For example, Song et al. [22] employed Sentinel-2 data to establish a method for detecting intra-annual cropland abandonment, mapping CA in Linxia, China, and found abandonment rates ranging from 1.70% to 15.80% during 2018–2021. Similarly, Zhu et al. [21] utilized MODIS NDVI data (2000–2017) to produce a time-series map of CA, analyzing its distribution, intensity, trends, duration, and reclamation.
Nevertheless, important gaps remain. First, insufficient attention has been given to the dynamic differences among abandonment types (e.g., interannual versus multiyear abandonment) [24]. Second, there is a lack of high-precision, long-term system characterization in complex terrain regions, which constrains accurate representation of spatiotemporal heterogeneity [2,11]. Third, inadequate distinction between spontaneous abandonment by farmers and policy-induced abandonment (e.g., Grain for Green Program (GFGP)) limits the precision of policy design and its alignment with the diverse causes and governance needs of different abandonment types.
Existing studies suggest that the impacts of CA are both positive and negative, with specific effects contingent upon regional context, scale, and socio-ecological background [6,8,25]. Among these, the implications for food security are the most direct, and have become a central focus of scholarly inquiry [26]. Regarding the mechanisms by which abandonment affects food security, the consensus is that it operates primarily through two pathways: reducing cultivated area and diminishing land productivity, both of which constrain grain supply [9,27]. Some studies have attempted to construct models linking abandoned area with potential grain production, concluding that abandonment exacerbates regional imbalances in grain supply and demand [28]. For instance, Wang et al. employed an area-weighted method to estimate abandonment rates at the county level, and used provincial average yields as a reference to evaluate production losses in China’s major and non-major grain-producing regions [29]. Similarly, Wu et al. applied machine learning and scenario simulation to assess the potential contribution of reclaimable abandoned land, under three crop-planting scenarios, to enhancing China’s food security [28].
While these studies have laid the groundwork for understanding the relationship between cropland dynamics and grain yield, notable gaps remain. First, most research has concentrated on overall trends in cropland change, with limited attention to how resource changes induced by specific drivers affect grain production; in particular, detailed analyses of driving factors are lacking. Second, the choice of study regions has often lacked specificity, undermining the accuracy of yield assessments and limiting the representativeness and generalizability of the findings.
As one of China’s most important ecological barriers and dryland farming regions, the Loess Plateau holds strategic significance for safeguarding both regional and national food security [30,31]. However, influenced by harsh natural conditions, severe soil erosion, rural labor outmigration, and ecological conservation policies, cropland abandonment in this region has become increasingly pronounced. Large-scale and persistent abandonment not only results in the idling and waste of valuable cropland resources but also severely undermines regional grain production capacity, intensifies supply–demand imbalances, and poses potential threats to national food security strategies.
Research on the Loess Plateau has primarily focused on analyzing the driving forces of abandonment and evaluating the ecological outcomes of soil erosion control and the Grain for Green Project [15,30,31,32,33]. Some studies have shown that abandonment rates in parts of the region exceed 10% [34], with the reduction in cultivated area beginning to affect the minimum cropland threshold required to ensure grain self-sufficiency [35,36], thereby constraining local agricultural development and food security.
Nonetheless, existing studies remain limited in two key respects. First, they lack long-term, high-resolution analyses of the spatiotemporal dynamics of CA in this ecologically fragile region, particularly with regard to the differential trajectories of interannual and multiyear abandonment. Second, quantitative assessments of the impacts of abandonment on grain production are relatively weak, leaving the underlying mechanisms insufficiently understood. These shortcomings hinder an accurate understanding of the real situation of CA and its potential risks to food security on the Loess Plateau, which may reduce the precision and effectiveness of cropland protection policies and, in turn, exacerbate regional food security crises.
In summary, existing research reveals significant knowledge gaps in the fine-scale spatiotemporal characterization of CA, the quantitative mechanisms linking abandonment to food security, and the specific dynamics of the Loess Plateau. This study aims to address these shortcomings with the following objectives: (1) to develop a high-precision identification system for CA adapted to the Plateau’s complex terrain, distinguishing among interannual abandonment, multiyear abandonment, conversion to forest/grassland, and reclamation; (2) to systematically uncover the spatiotemporal evolution of cropland abandonment on the Loess Plateau from 2000 to 2023 and to identify its core driving mechanisms; and (3) to quantitatively evaluate the spatiotemporal dynamics of grain yield and analyze the impacts of CA on grain production. The findings are expected to provide methodological references for the accurate identification of CA and to offer scientific evidence to support cropland protection, food security, and sustainable agricultural development policies.

2. Study Area and Data Sources

2.1. Study Area

The Loess Plateau is located in the middle reaches of the Yellow River, China, spanning 33°41′–41°16′ N and 100°52′–114°33′ E. It extends across seven provinces (autonomous regions)—Shanxi, Henan, Shaanxi, Inner Mongolia, Ningxia, Gansu, and Qinghai—with a total area of approximately 648,700 km2. The region encompasses 45 prefecture-level administrative units (including 5 autonomous prefectures and 3 leagues) and 341 county-level divisions (Figure 1). The Plateau is characterized by highly diverse landforms: the western part is dominated by high tablelands and gullied areas, the central part by loess hilly and gully regions, the southeastern part by rocky mountainous areas, and the northern part by arid sandy grasslands and upland grasslands.
For centuries, the fragile natural environment, compounded by unsustainable human activities, has led to severe soil erosion, poor soil fertility, water scarcity, and biodiversity loss. Since the early 21st century, however, ecological restoration projects such as the GFGP have significantly increased forest and grassland coverage, effectively curbing soil erosion and enhancing the region’s carbon sequestration capacity [37]. Nonetheless, the combined effects of rural labor outmigration, declining agricultural returns, and climate variability have contributed to widespread abandonment of sloping and low-yield cropland, particularly in ecologically fragile zones and counties with severe labor loss [38]. This land-use transition has, to some extent, reduced cultivation pressure and promoted vegetation recovery, but it has also resulted in declining food production potential and the underutilization of cultivated land resources. Against this background, taking the Loess Plateau as a typical case study to analyze the spatial patterns, driving mechanisms, and ecological and social effects of cropland abandonment is of great importance for balancing ecological conservation with food security and optimizing regional land-use strategies.

2.2. Data Sources

The datasets used in this study include land-use types, NDVI, topographic factors, climatic factors, and other ancillary data (Table 1).
Land-use data were obtained from Wuhan University with a spatial resolution of 30 m. This dataset classifies land into nine categories—cropland, forest, shrubland, grassland, water, ice/snow, barren land, impervious surfaces, and wetland—with an overall accuracy of 79.31% (https://doi.org/10.5194/essd-13-3907-2021 [39]).
NDVI data for grain yield estimation were derived from the MOD13A3 product (The manufacturer of the MOD13A3 product is Santa Barbara Remote Sensing (SBRC), which is headquartered in Santa Barbara, CA, USA) available on the NASA Earthdata platform (https://www.earthdata.nasa.gov/, accessed on 11 September 2025). As a long-term vegetation index dataset, MOD13A3 provides high-precision, multi-year baseline information for monitoring vegetation cover and crop growth across the Loess Plateau, thereby meeting the requirements of this study for regional-scale cropland vegetation dynamics.
Grain production data from 2001 to 2022 were obtained from the National Bureau of Statistics of China (https://www.stats.gov.cn/, accessed on 11 September 2025), serving as a reliable statistical basis for quantifying agricultural production capacity and assessing the impacts of cropland abandonment on grain yield.
The digital elevation model (DEM) with a spatial resolution of 30 m was obtained from the Geospatial Data Cloud (SRTMGL1 V003). Climatic data were sourced from the NASA database, providing gridded datasets for 2005, 2010, 2015, and 2020 at a spatial resolution of 1 km. Socio-economic data included population density and GDP raster datasets at a 1 km resolution for the same years. In addition, vector data on water systems and road networks for 2020 were extracted from OpenStreetMap (OSM) and used to calculate spatial distances.

3. Methods

3.1. Identification of Cropland Abandonment

Building on previous studies, this paper develops a time-series–based identification procedure for CA, tailored to the complex geomorphic patterns and land-use characteristics of the Loess Plateau (Figure 2). The overall technical framework consists of three main steps: (1) reclassification and standardization of land-use data; (2) temporal filtering with a moving window to determine interannual and multiyear abandonment [40,41,42]; and (3) identification and quantification of typical land-use transitions, including conversion to forest/grassland under the GFGP and reclamation of previously abandoned land (Figure 2).

3.1.1. Interannual Cropland Abandonment

Annual land-use datasets are inevitably affected by random noise and occasional misclassification in distinguishing cropland from non-cropland, which may result in abnormal fluctuations in a single year. To reduce such errors and avoid the interference of isolated outliers, this study applied a three-year moving-window method to correct the time-series data. In the original dataset, cropland was assigned a value of 1, while all other land-use types (forest, grassland, built-up land, unused land) were assigned a value of 0.
For each pixel, if the land-use status in a given year t was inconsistent with both the preceding year (t − 1) and the following year (t + 1), the status of year t was corrected to match its neighboring years. Specifically, if a pixel was cropland in t − 1 and t + 1 (value = 1), but non-cropland in year t (value = 0), then the status of year t was corrected to cropland. This logical consistency check effectively eliminates isolated single-year fluctuations and yields a more reliable trajectory of continuous cropland use.
After applying this correction, interannual CA was defined as a short-term interruption in cropland use, where a pixel was classified as cropland in both t 1 and t + 1 but non-cropland (forest, grassland, or unused land) in year t. The specific rules of the three-year moving-window method are expressed as:
L i , t = { 1 , i f   L i , t 1 = 1 , L i , t 1 , L i , t + 1 = 1 L i , t , otherwise
where L i , t denotes the land-use status of pixel i in year t, with 1 representing cropland and non-1 representing non-cropland.
The area of interannual CA is calculated as:
A a n n t = i = 1 n δ ( L i , t = 0 | L i , t 1 = 1 , L i , t + 1 = 1 )
where δ is an indicator function, taking the value of 1 when the condition is satisfied and 0 otherwise. The interannual abandonment rate is further computed as:
R a n n t = A a n n t A t c r o p × 100 %
where A t c r o p represents the total cropland area in year t.

3.1.2. Multiyear Cropland Abandonment

Multiyear CA is defined as the continuous interruption of cropland use over multiple years, during which cropland is converted to non-cropland (forest, grassland, or unused land). It reflects the long-term characteristics of land-use change. Building on the interannual identification results, a three-year moving-window method was applied to correct time-series consistency, which was then used to track the duration of cropland withdrawal. A pixel was classified as multiyear abandonment if it remained non-cropland for two or more consecutive years.
There is currently no consensus on the temporal threshold used to define cropland abandonment. International organizations such as the FAO (Food and Agriculture Organization of the United Nations) commonly set a longer duration (≥5 years), while recent studies in China have adopted shorter thresholds ranging from 1 to 3 years [7,43]. Drawing on these definitions and to capture both short-term and prolonged discontinuities of cultivation, this study classified multiyear abandonment into three levels: low (1–3 years), medium (4–7 years), and high (≥8 years).
This identification process was carried out across the entire study period (2000–2020). Consequently, pixels experiencing multiple cycles of “abandonment–reclamation–re-abandonment” were fully recorded, resulting in a complete temporal trajectory of cropland use.
To comprehensively characterize the spatiotemporal patterns of CA, two complementary indicators were constructed:
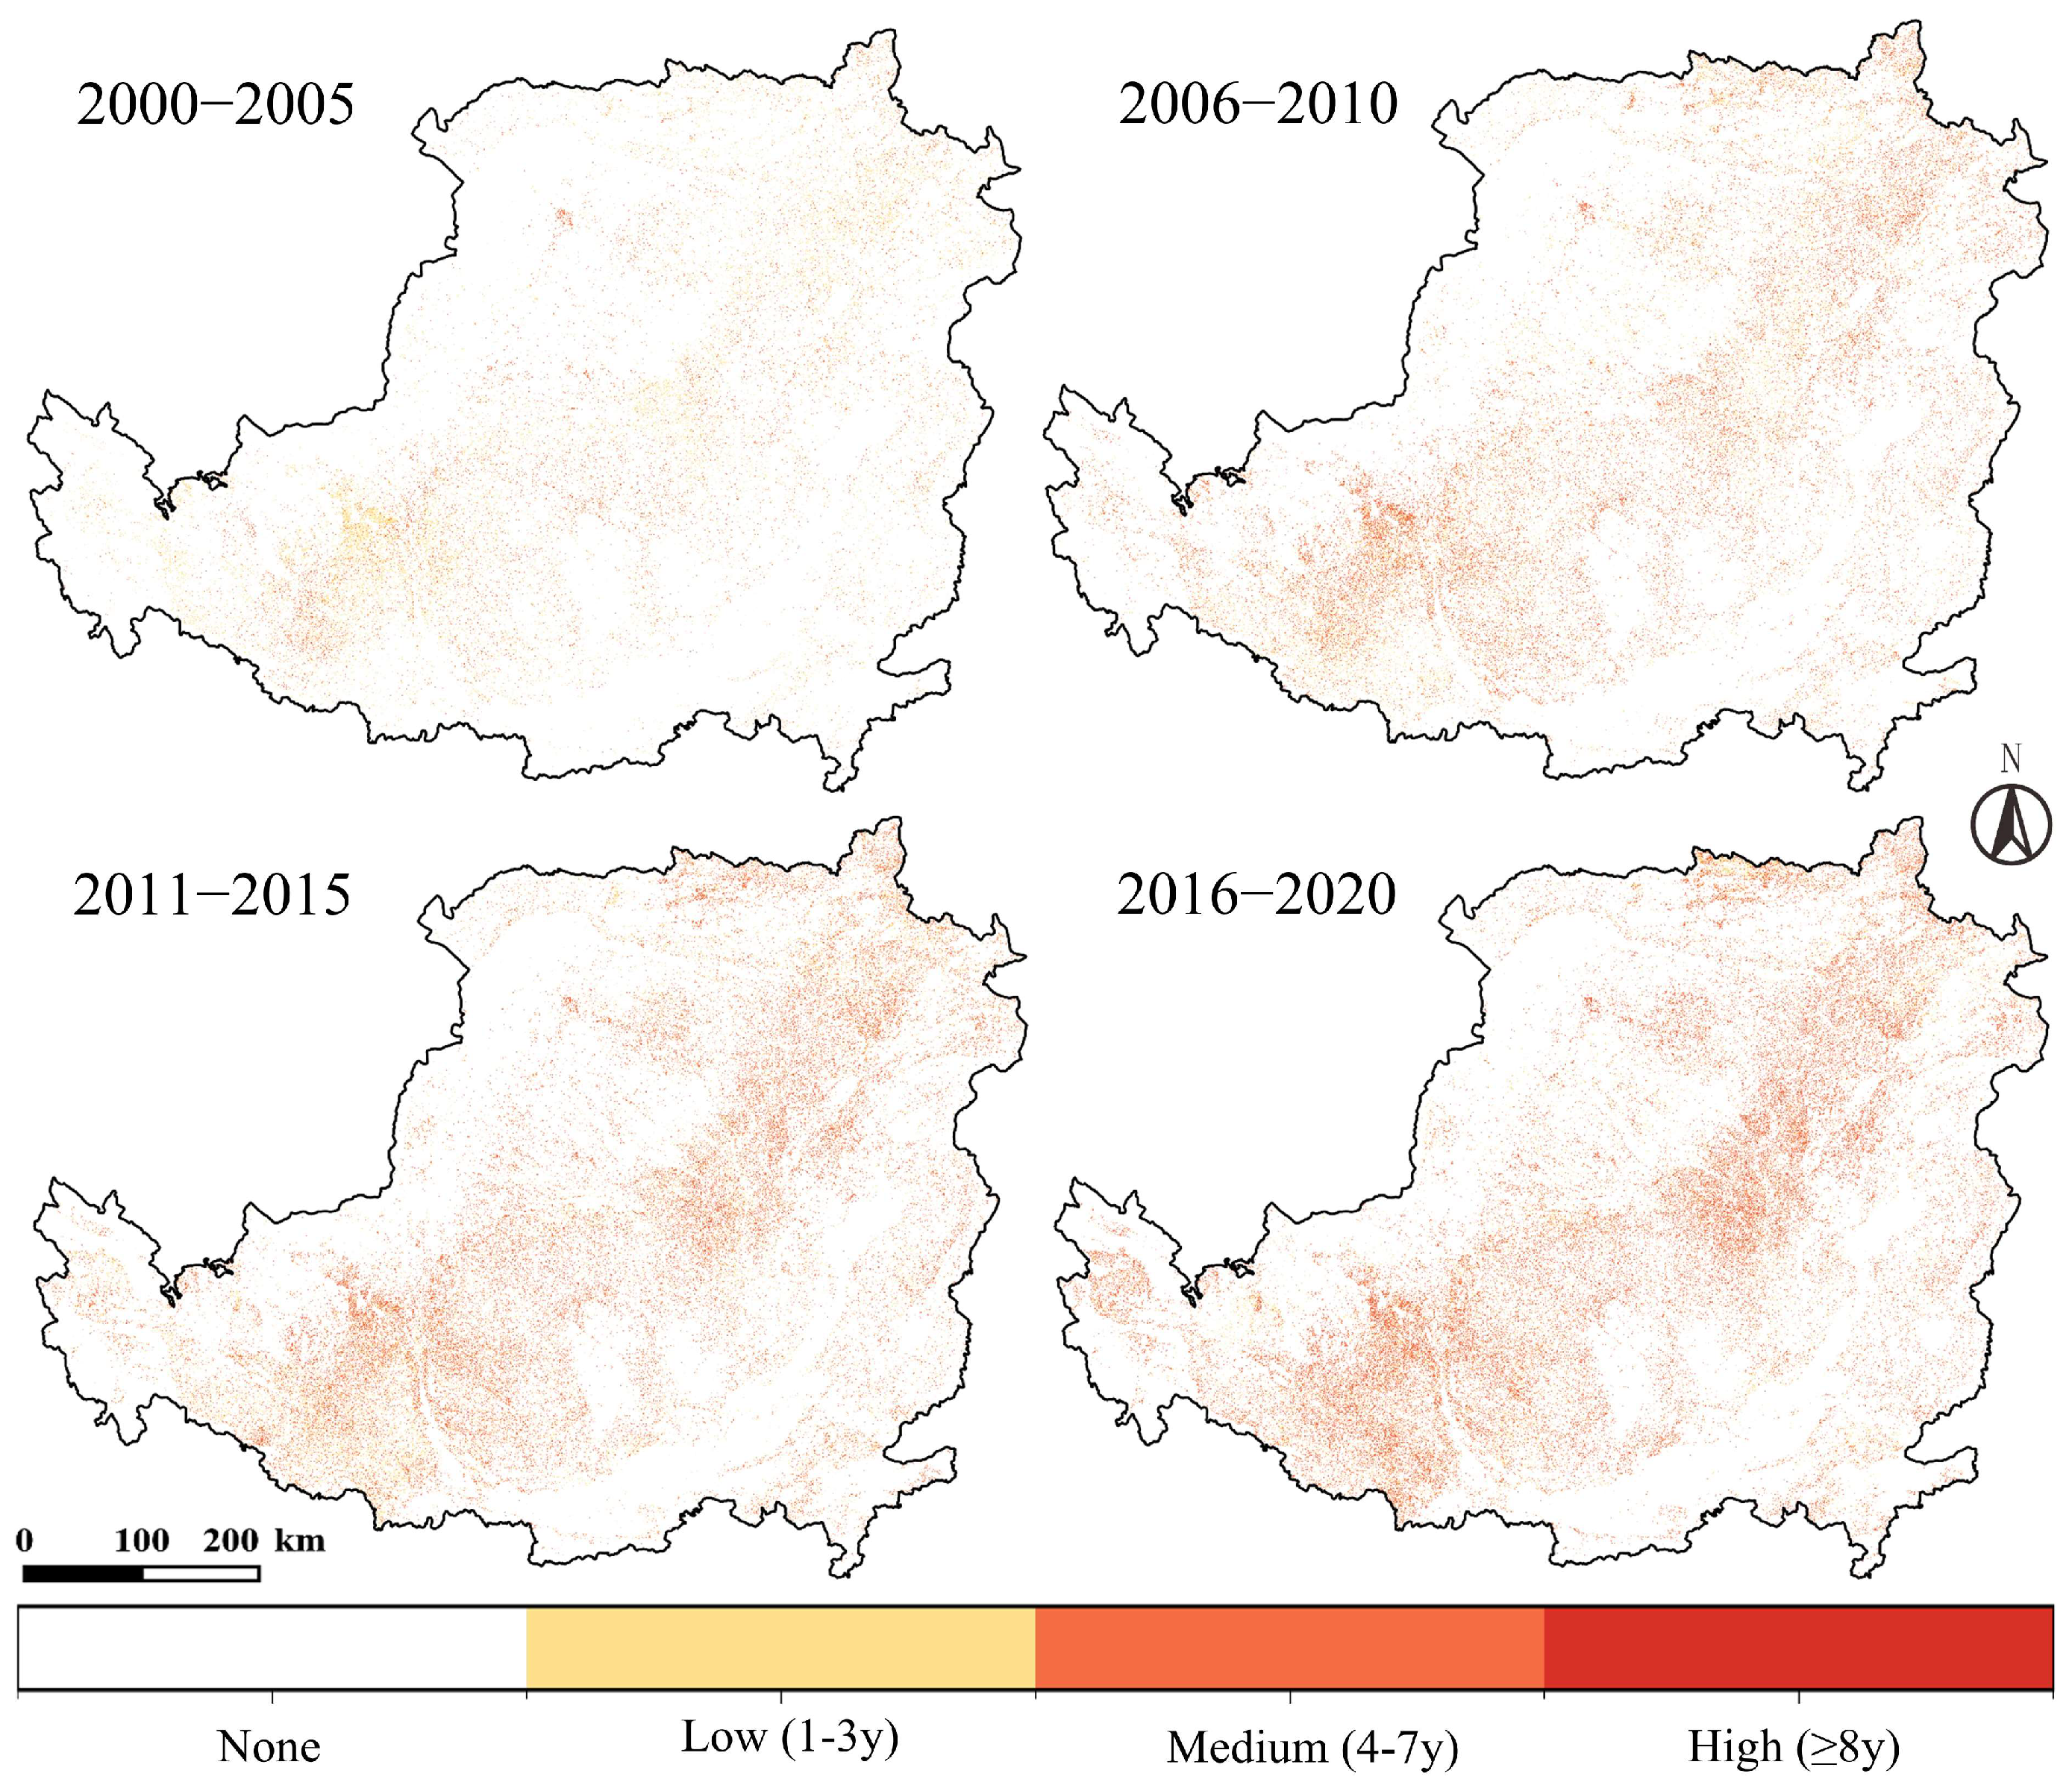
  • Interannual abandonment distribution—Based on four stages (2000–2005, 2006–2010, 2011–2015, and 2016–2020). Pixels that experienced abandonment in any year within a stage were marked, and Boolean overlay was used to calculate the total abandoned area for each stage.
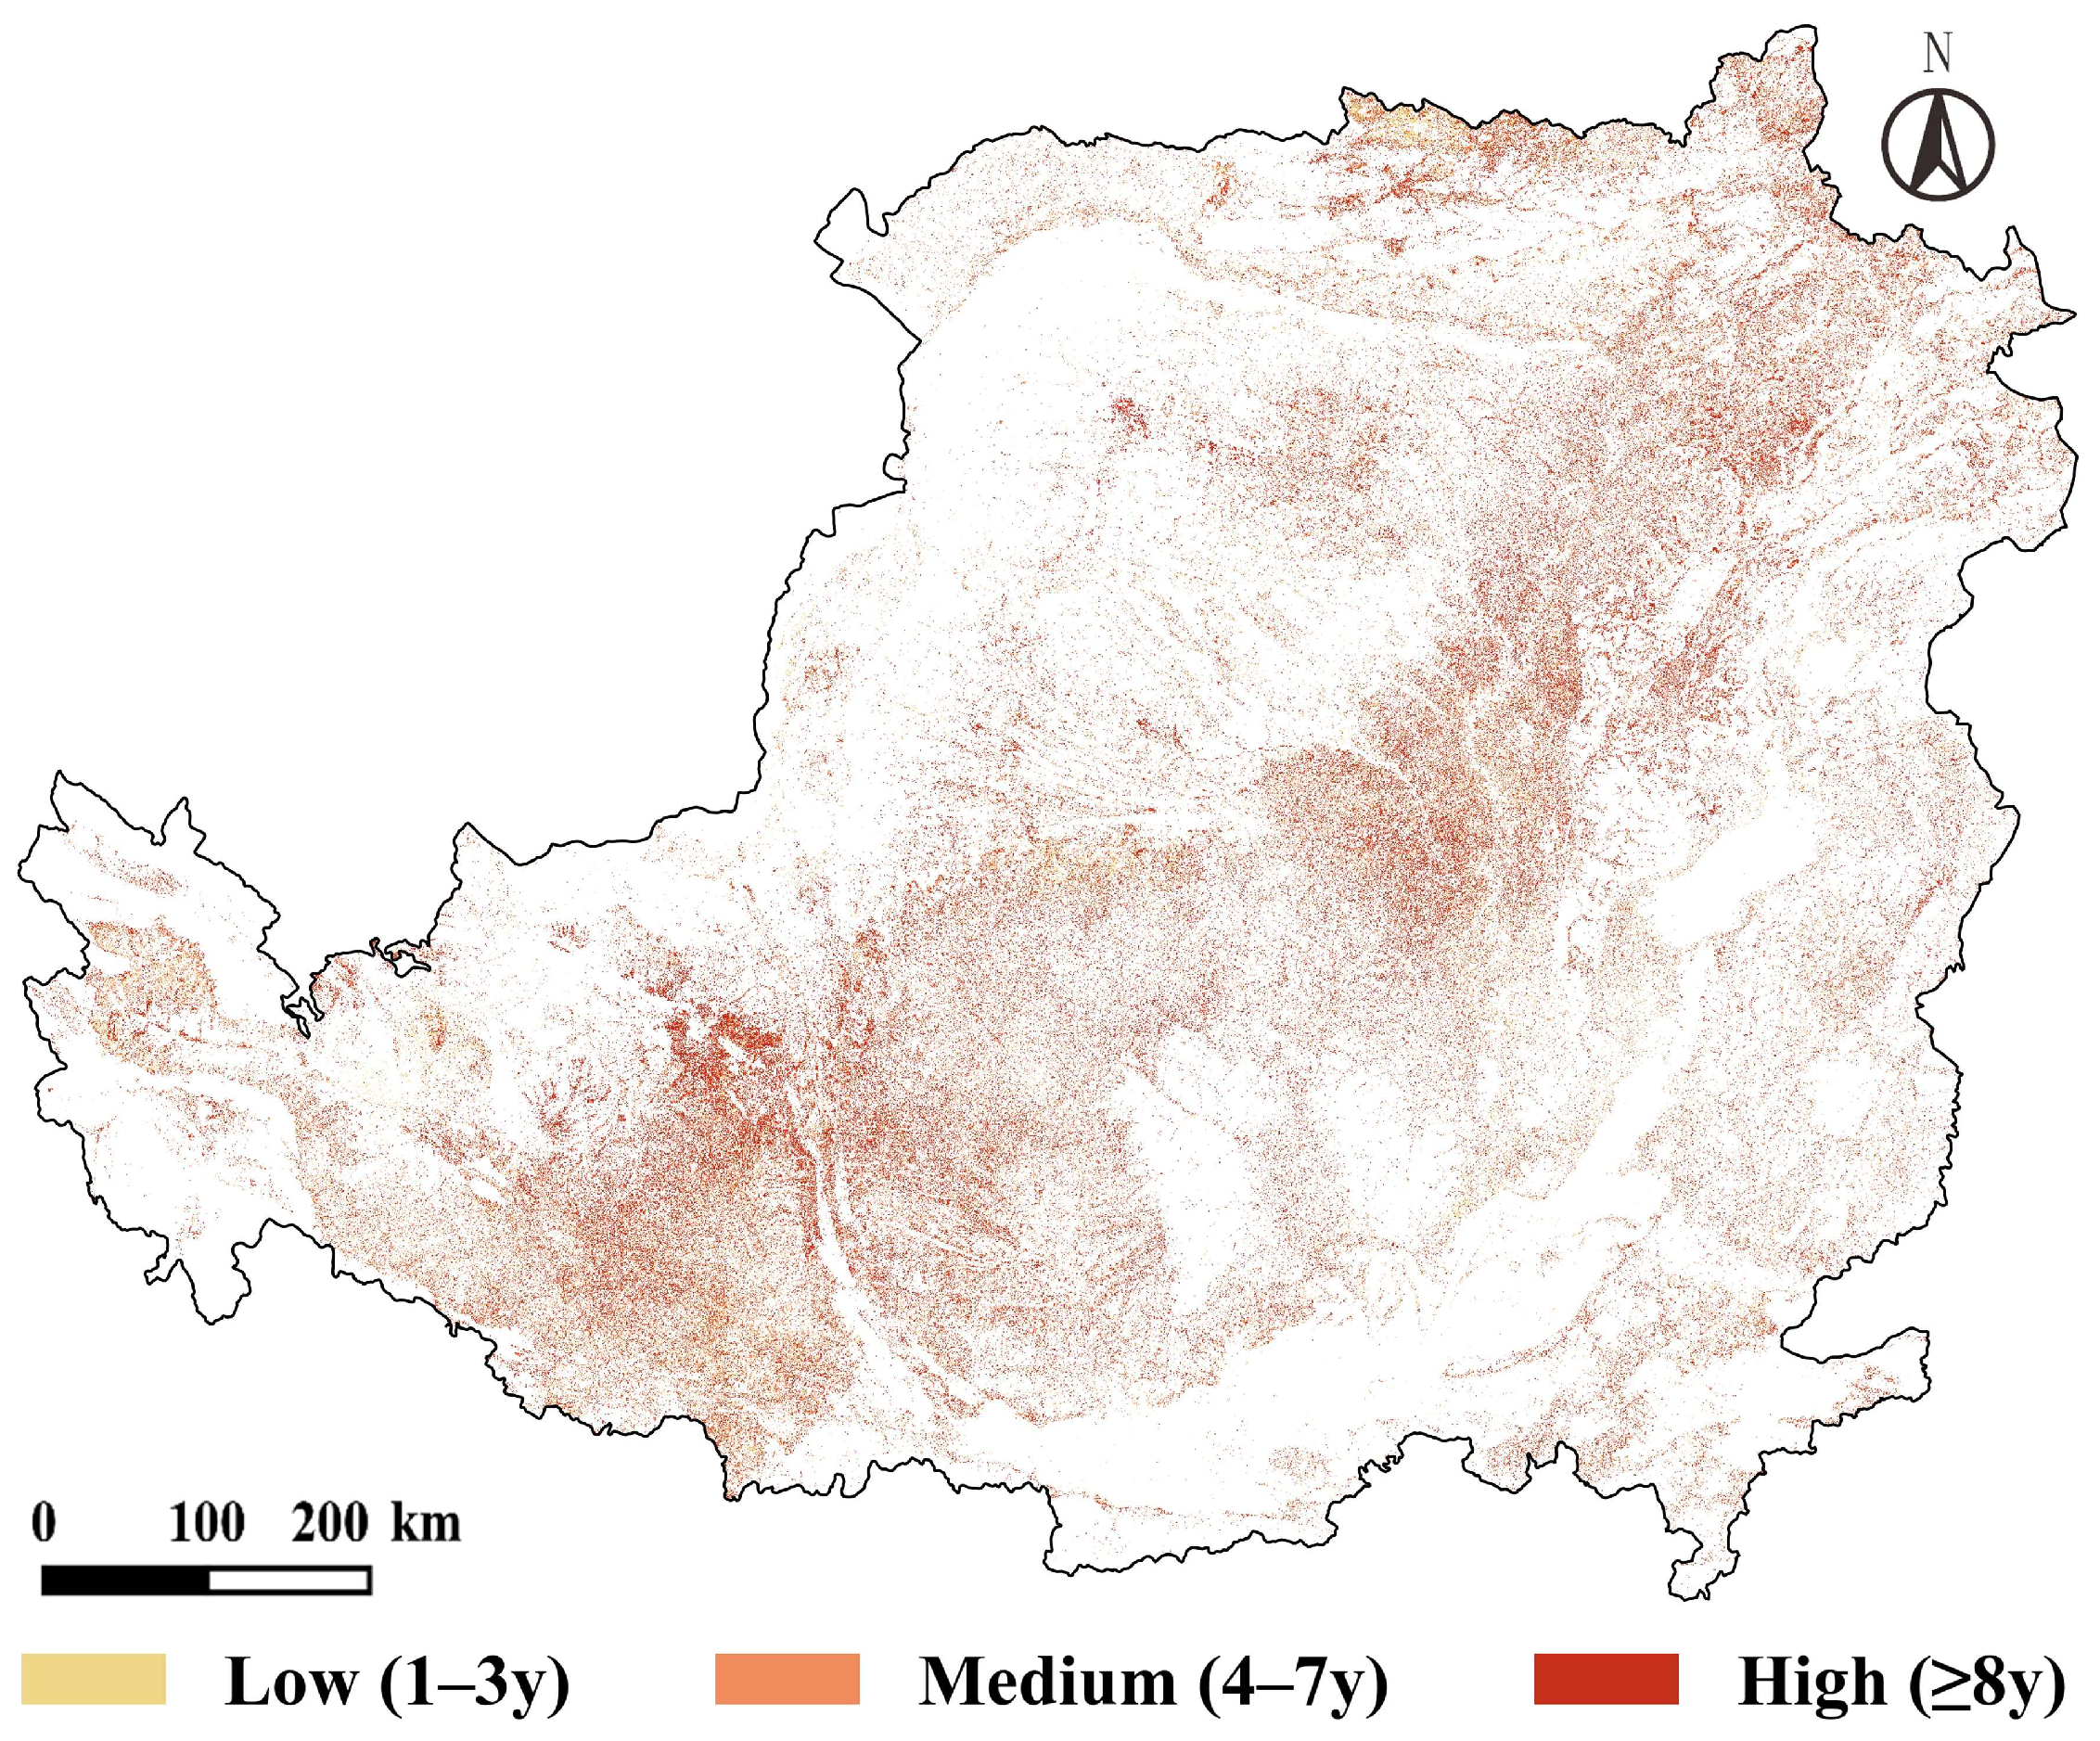
  • Multiyear abandonment grade distribution—Based on the entire period of 2000–2020. Pixels were classified into low, medium, and high-grade abandonment according to their cumulative duration of abandonment.
These two results complement each other, capturing both short-term fluctuations and long-term land-use transformation trends.
The area of multiyear cropland abandonment was calculated as:
A m u l t , k = i = 1 n δ L i , t : t + k 1 1
where k denotes the duration class of abandonment, and L i , t : t + k 1 represents the land-use status of pixel i over k consecutive years.

3.1.3. Conversion of Cropland to Forest/Grassland

Conversion of cropland to forest or grassland refers to the process in which CA is stably transformed into forest or grassland, representing a major policy-driven land-use transition. In this study, pixels within the multiyear abandonment trajectories that ultimately transitioned into forest or grassland were identified and classified as “conversion to forest” and “conversion to grassland,” respectively.
The area of cropland conversion is calculated as:
A c o n v t , c = i = 1 n δ ( L i , t e n d = c | L i , t 0 = 1 )
where c { forestland ,   grassland } , t 0 is the starting year of abandonment, and t e n d is the year when the conversion was completed.

3.1.4. Cropland Reclamation

Cropland reclamation is defined as the process by which previously abandoned pixels are re-converted to cropland (0 → 1). To avoid misclassification caused by short-term noise, reclamation was only considered valid if the cropland status persisted for more than one year following the conversion. The first year in which a pixel transitioned from non-cropland (0) back to cropland (1) was recorded as the reclamation year. This rule enables the identification of cropland recovery resulting from policy incentives or farmers’ land-use decisions.
The reclamation rate is calculated as:
R r e c t = A r e c t A t a b a n × 100 %
where A r e c t denotes the area of reclaimed cropland, and A a b a n t represents the area of abandoned cropland in the same year.

3.2. Grain Yield Assessment

3.2.1. Grain Production Estimation

To quantify the grain production capacity of the Loess Plateau, we referred to previous studies [44], which demonstrated a linear relationship between the normalized difference vegetation index (NDVI) and crop yield. Based on cropland data extraction, the proportion of each pixel’s NDVI value to the total NDVI value was weighted against the total grain output of the study region, thereby estimating grain production at the pixel level. For land-use types other than cropland, grain yield was set to zero. Finally, zonal statistics were conducted in ArcGIS (Version 10.8) (Environmental Systems Research Institute, Inc., abbreviated as Esri, Redlands, California, CA, USA) to obtain the grain yield at the county or regional scale. The calculation formula is as follows:
P i = N D V I i N D V I s u m × P s u m
where P i denotes the grain production of grid cell i, P s u m represents the total grain yield at the county or regional level (grain yield for other land-use types was set to zero), N D V I i is the NDVI value of grid cell i, and N D V I s u m is the total NDVI value of the study region.

3.2.2. Mann–Kendall Test and Sen’s Slope

This study combined the Theil–Sen slope estimator, the Mann–Kendall (M–K) test (it is a non-parametric statistical method primarily used to analyze the significance of temporal trends in data series, with the advantages of not requiring data to follow a specific distribution and being robust to outliers.), and the Hurst exponent to systematically evaluate the spatiotemporal trends and statistical significance of grain production (FP) across the Loess Plateau. Below, the core principles and calculation logic of each method are introduced.
In the Theil–Sen slope estimation, FP_i and FP_j denote the food production values at different time points i and j, respectively. The Theil–Sen slope estimator (SFP) directly reflects the direction of change in food production: SFP > 0 indicates an increasing trend, whereas SFP < 0 indicates a decreasing trend. The slope β is calculated as:
β = M e d i a n x j x i j i ,   1 i < j n
where x i and x j respectively represent the FP values in year i and year j ; n signifies the length of the time series; and β denotes the slope of FP change. Specifically, β > 0 indicates an upward trend in FP, whereas β < 0 indicates a downward trend.
The Mann–Kendall test, a non-parametric statistical method, was then used to evaluate the statistical significance of FP trends. Its main advantages lie in not requiring assumptions about data distribution and in being robust to outliers. The M–K test evaluates trend significance through the test statistic S and the standardized statistic Z. The formulas are as follows:
Z = S 1 V a r ( S ) ,   S > 0 0 ,   S = 0 S + 1 V a r ( S ) ,   S < 0
S = i = 1 n 1 j = i + 1 n s g n x j x i
s g n x j x i = 1 , x j x i > 0 0 , x j x i = 0 1 , x j x i < 0
V a r s S = n ( n 1 ) ( 2 n + 5 ) 18
where sgn represents the sign function; Z and S denote the standardized and non-standardized test statistics, respectively; and Var(S) is the variance of S. The variable Z can take any real value in (−∞, +∞). For two-tailed tests, significance was evaluated at the 95% confidence level (α = 0.05). Specifically, when |Z| > 1.96, the trend was considered statistically significant.

3.3. Random Forest Analysis of Driving Factors

This study employed the Random Forest (RF) ensemble algorithm to systematically analyze the driving mechanisms of CA on the Loess Plateau during 2005–2020. RF (It is a machine learning method that constructs multiple decision trees through bootstrap resampling and integrates their predictions to improve accuracy, and it is particularly suitable for processing high-dimensional geospatial data while quantifying the relative importance of driving factors), first proposed by Breiman [45], is an ensemble learning method that aggregates multiple decision trees to form cumulative predictive power. It has demonstrated high accuracy and computational efficiency in handling high-dimensional geospatial datasets and can quantitatively assess the relative importance of explanatory variables.
The core idea of RF is to construct a set of base classifiers through bootstrap sampling. For a dataset D containing n samples, the process includes the following steps: (1) Bootstrap resampling—randomly draw a sample from D with replacement, add it to a subsample set, and return it to D to preserve dataset integrity for subsequent draws; (2) Subsample generation—repeat the process m times to generate m subsample sets { D 1 , D 2 , , D m } ; (3) Classifier training—train each classifier L i ( 1 i m ) on its corresponding subsample set D i ; and (4) Ensemble aggregation—combine predictions of all classifiers using a predefined aggregation strategy, where regression tasks adopt the mean of predictions [46]. Through this procedure, an RF model consisting of n decision trees is constructed, after which its performance is evaluated using a test dataset and feature importance scores are computed. The importance score (IS) of each feature was calculated as:
I S = ( e r r O O B 2   e r r O O B 1 ) / N
where feature importance was rigorously assessed using the out-of-bag (OOB) error permutation method: for each decision tree in the RF model, the prediction error of its OOB samples was first computed (errOOB1); then the values of a given explanatory variable were randomly permuted to create a perturbed dataset, and the new OOB error was recalculated (errOOB2).
For model construction, sample points were randomly divided into a training set (80%) and a testing set (20%). The training set was used to fit the model, while the testing set was used to evaluate predictive performance. In the baseline model for 2005, CA status was used as the dependent variable, and eight explanatory variables were selected: Topographic factors: elevation (DEM) and slope (Slope). Climatic factors: mean annual precipitation (MAP) and mean annual temperature (MAT). Socio-economic factors: gross domestic product (GDP) and population density (POP). Locational factors: distance to national roads (DR) and distance to water bodies (DW).
An RF model consisting of 100 decision trees was initialized and trained. Following the same procedure, RF models were constructed for subsequent years, allowing us to examine the driving mechanisms of CA over the 15-year period (2005–2020). All models were implemented in Python 3.8 using the scikit-learn library [47].

4. Results

4.1. Spatiotemporal Patterns of Cropland Abandonment

4.1.1. Interannual Spatiotemporal Fluctuations

Between 2000 and 2020, CA on the Loess Plateau exhibited a gradual transition from scattered to clustered distribution and from short-term to long-term persistence. Overall, the abandoned area was approximately 2.72 million ha during 2000–2005, dominated by low-grade abandonment (1–3 years, 63%), and distributed in a relatively dispersed manner. From 2006 onward, abandonment expanded rapidly, reaching 4.66 million ha in 2010. During 2011–2015, the abandoned area further increased to 6.02 million ha, accompanied by a rising proportion of high-grade abandonment. By 2016–2020, abandonment stabilized at 6.96 million ha, with long-term abandonment (≥4 years) exceeding 75%, indicating a trend toward deeper and more persistent land-use change.
Spatially, CA during 2000–2005 was mainly scattered across the loess hilly–gully region and the southern mountainous areas of Ningxia, concentrated on cropland with steeper slopes. From 2006 to 2010, abandonment became increasingly clustered in northern Shaanxi, eastern Gansu, and southern Ningxia, gradually forming contiguous patches. After 2011–2015, CA expanded along both sides of the middle reaches of the Yellow River, while medium-grade abandonment emerged more frequently in the southern tableland and mountainous–hilly zones. By 2016–2020, high-grade CA in the northern hilly belt and the western mountain margins had formed continuous patches with markedly enhanced spatial aggregation, reflecting a shift from dispersed to clustered patterns.
From 2000 to 2020, CA expanded markedly on the Loess Plateau. The abandoned area was approximately 2.72 million ha in 2000–2005, increased to 4.66 million ha in 2006–2010, further to 6.02 million ha in 2011–2015, and then stabilized at about 6.96 million ha in 2016–2020. Meanwhile, the composition shifted from short-term events toward long-duration ones, with the share of long-term abandonment (≥4 years) exceeding 75% in 2016–2020 (Figure 3).
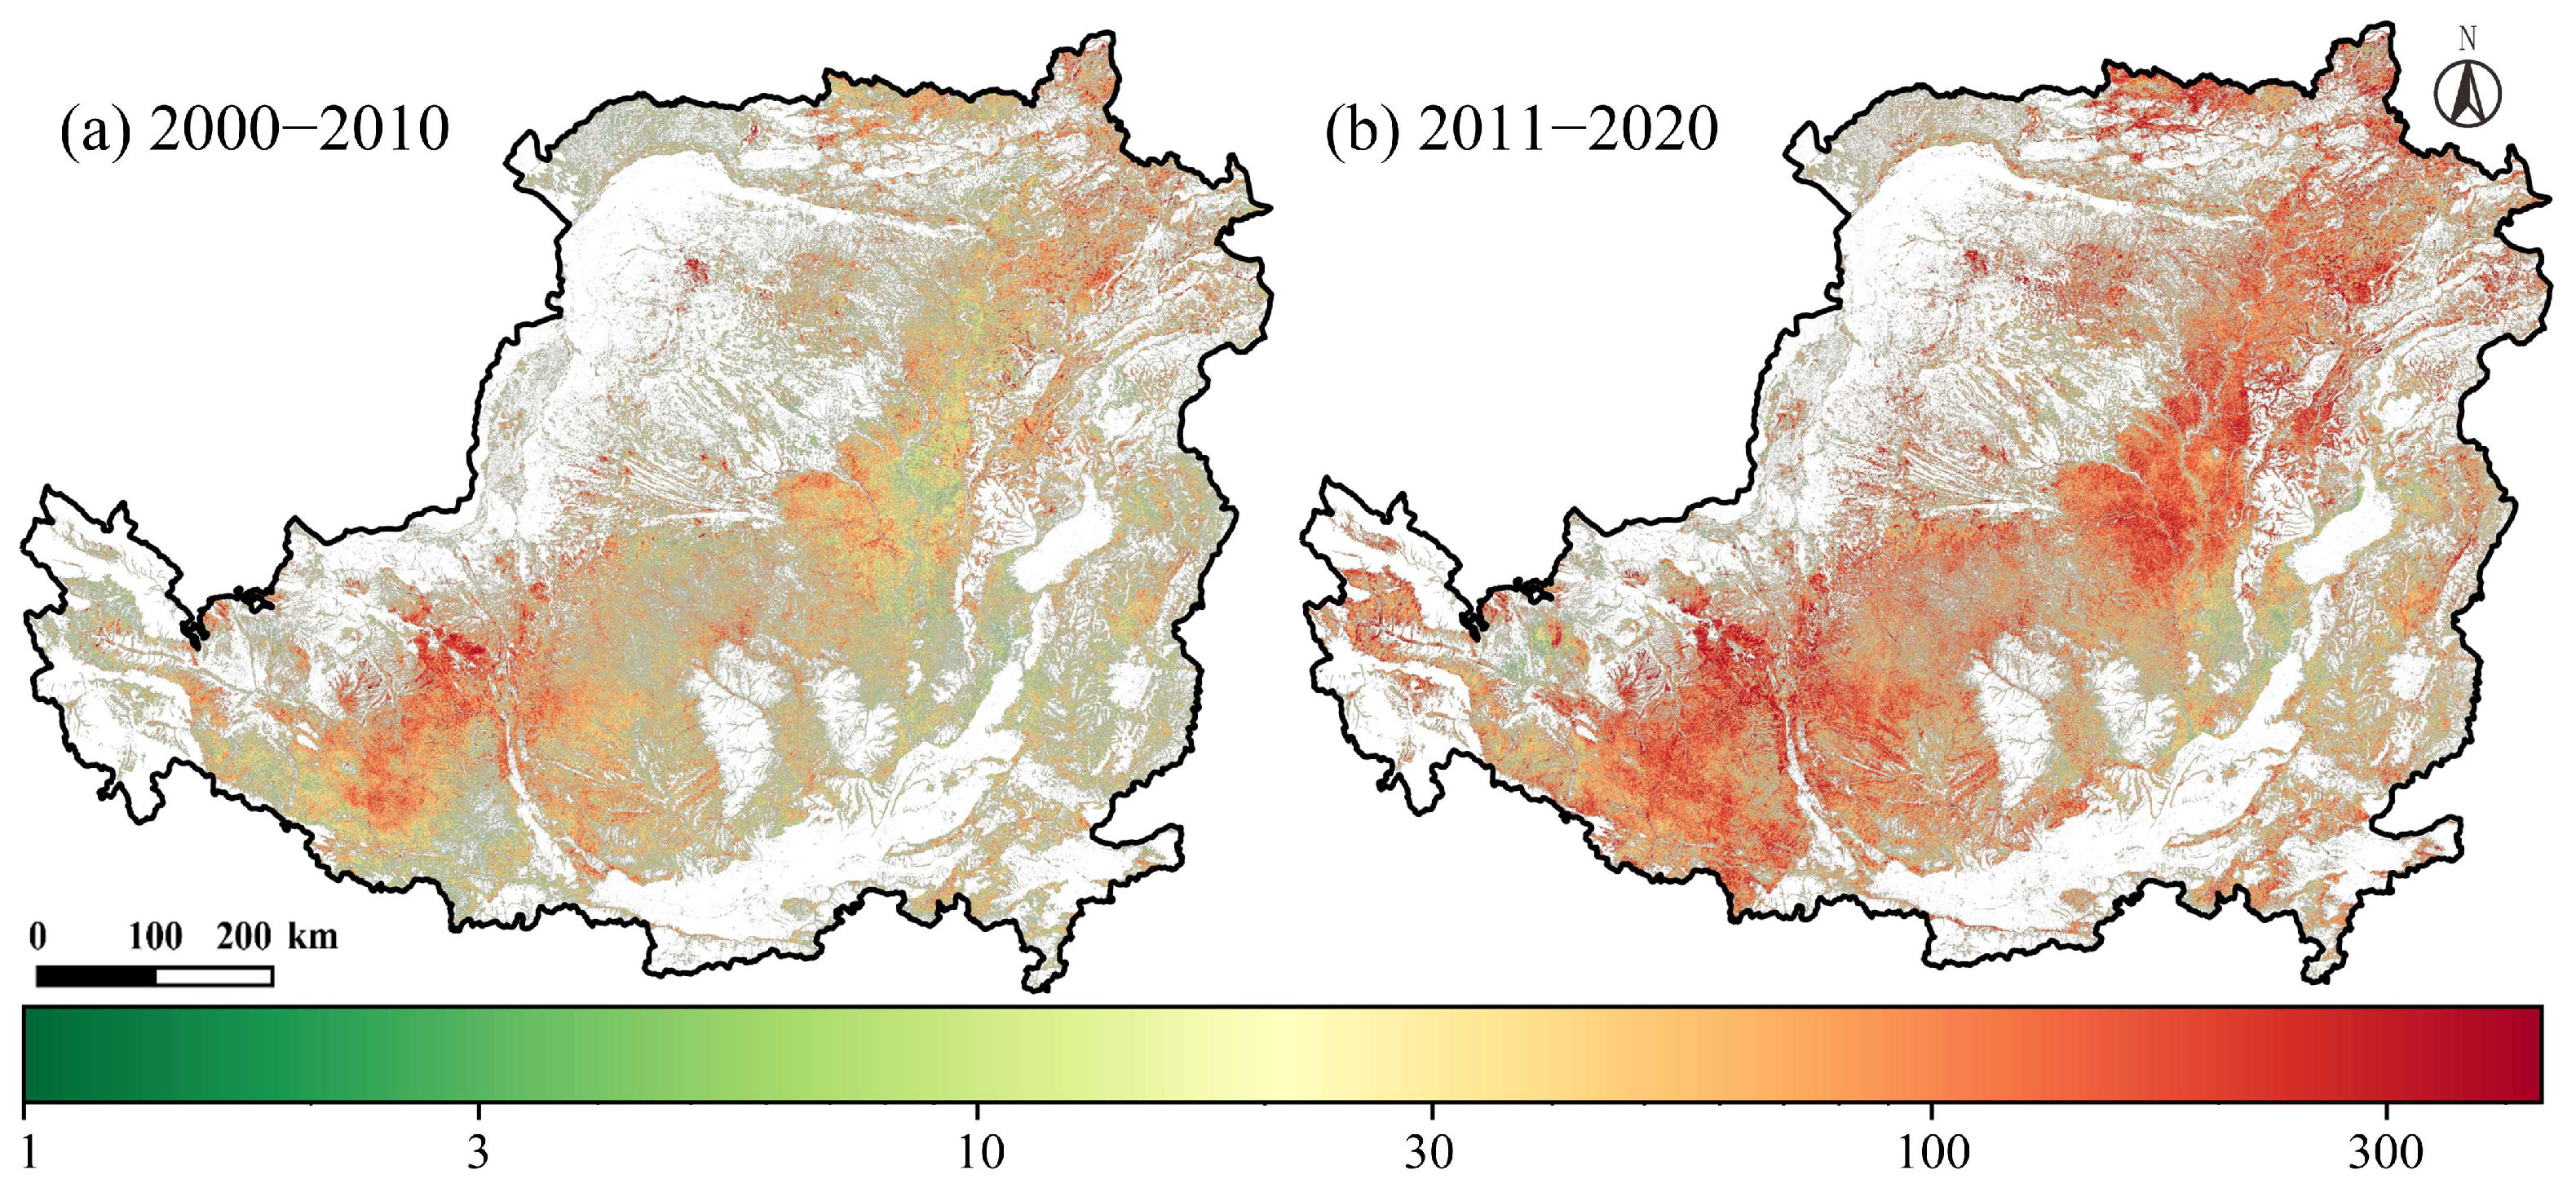
In space, CA during 2000−2010 was predominantly scattered and of low intensity, concentrating on steep or marginal rain-fed croplands in the loess hilly–gully region of northern Shaanxi (Yan’an–Yulin belt), eastern Gansu (Qingyang–Pingliang area), and the southern mountainous part of Ningxia. Small patches also appeared along western Shanxi and north-western Henan (Figure 4a). During 2011–2020, abandonment became spatially contiguous and more intensive: continuous belts developed along the northern hilly belt spanning western Shanxi–northern Shaanxi–eastern Gansu–southern Ningxia to the western margin of Inner Mongolia (Ordos edge), and along the western mountain margins of eastern Qinghai–Gansu–Ningxia (Qilian/Liupan foothills) and the middle reaches of the Yellow River. Medium-to-high levels rose notably in northern Shaanxi and eastern Gansu, and the overall spatial aggregation strengthened (Figure 4b).
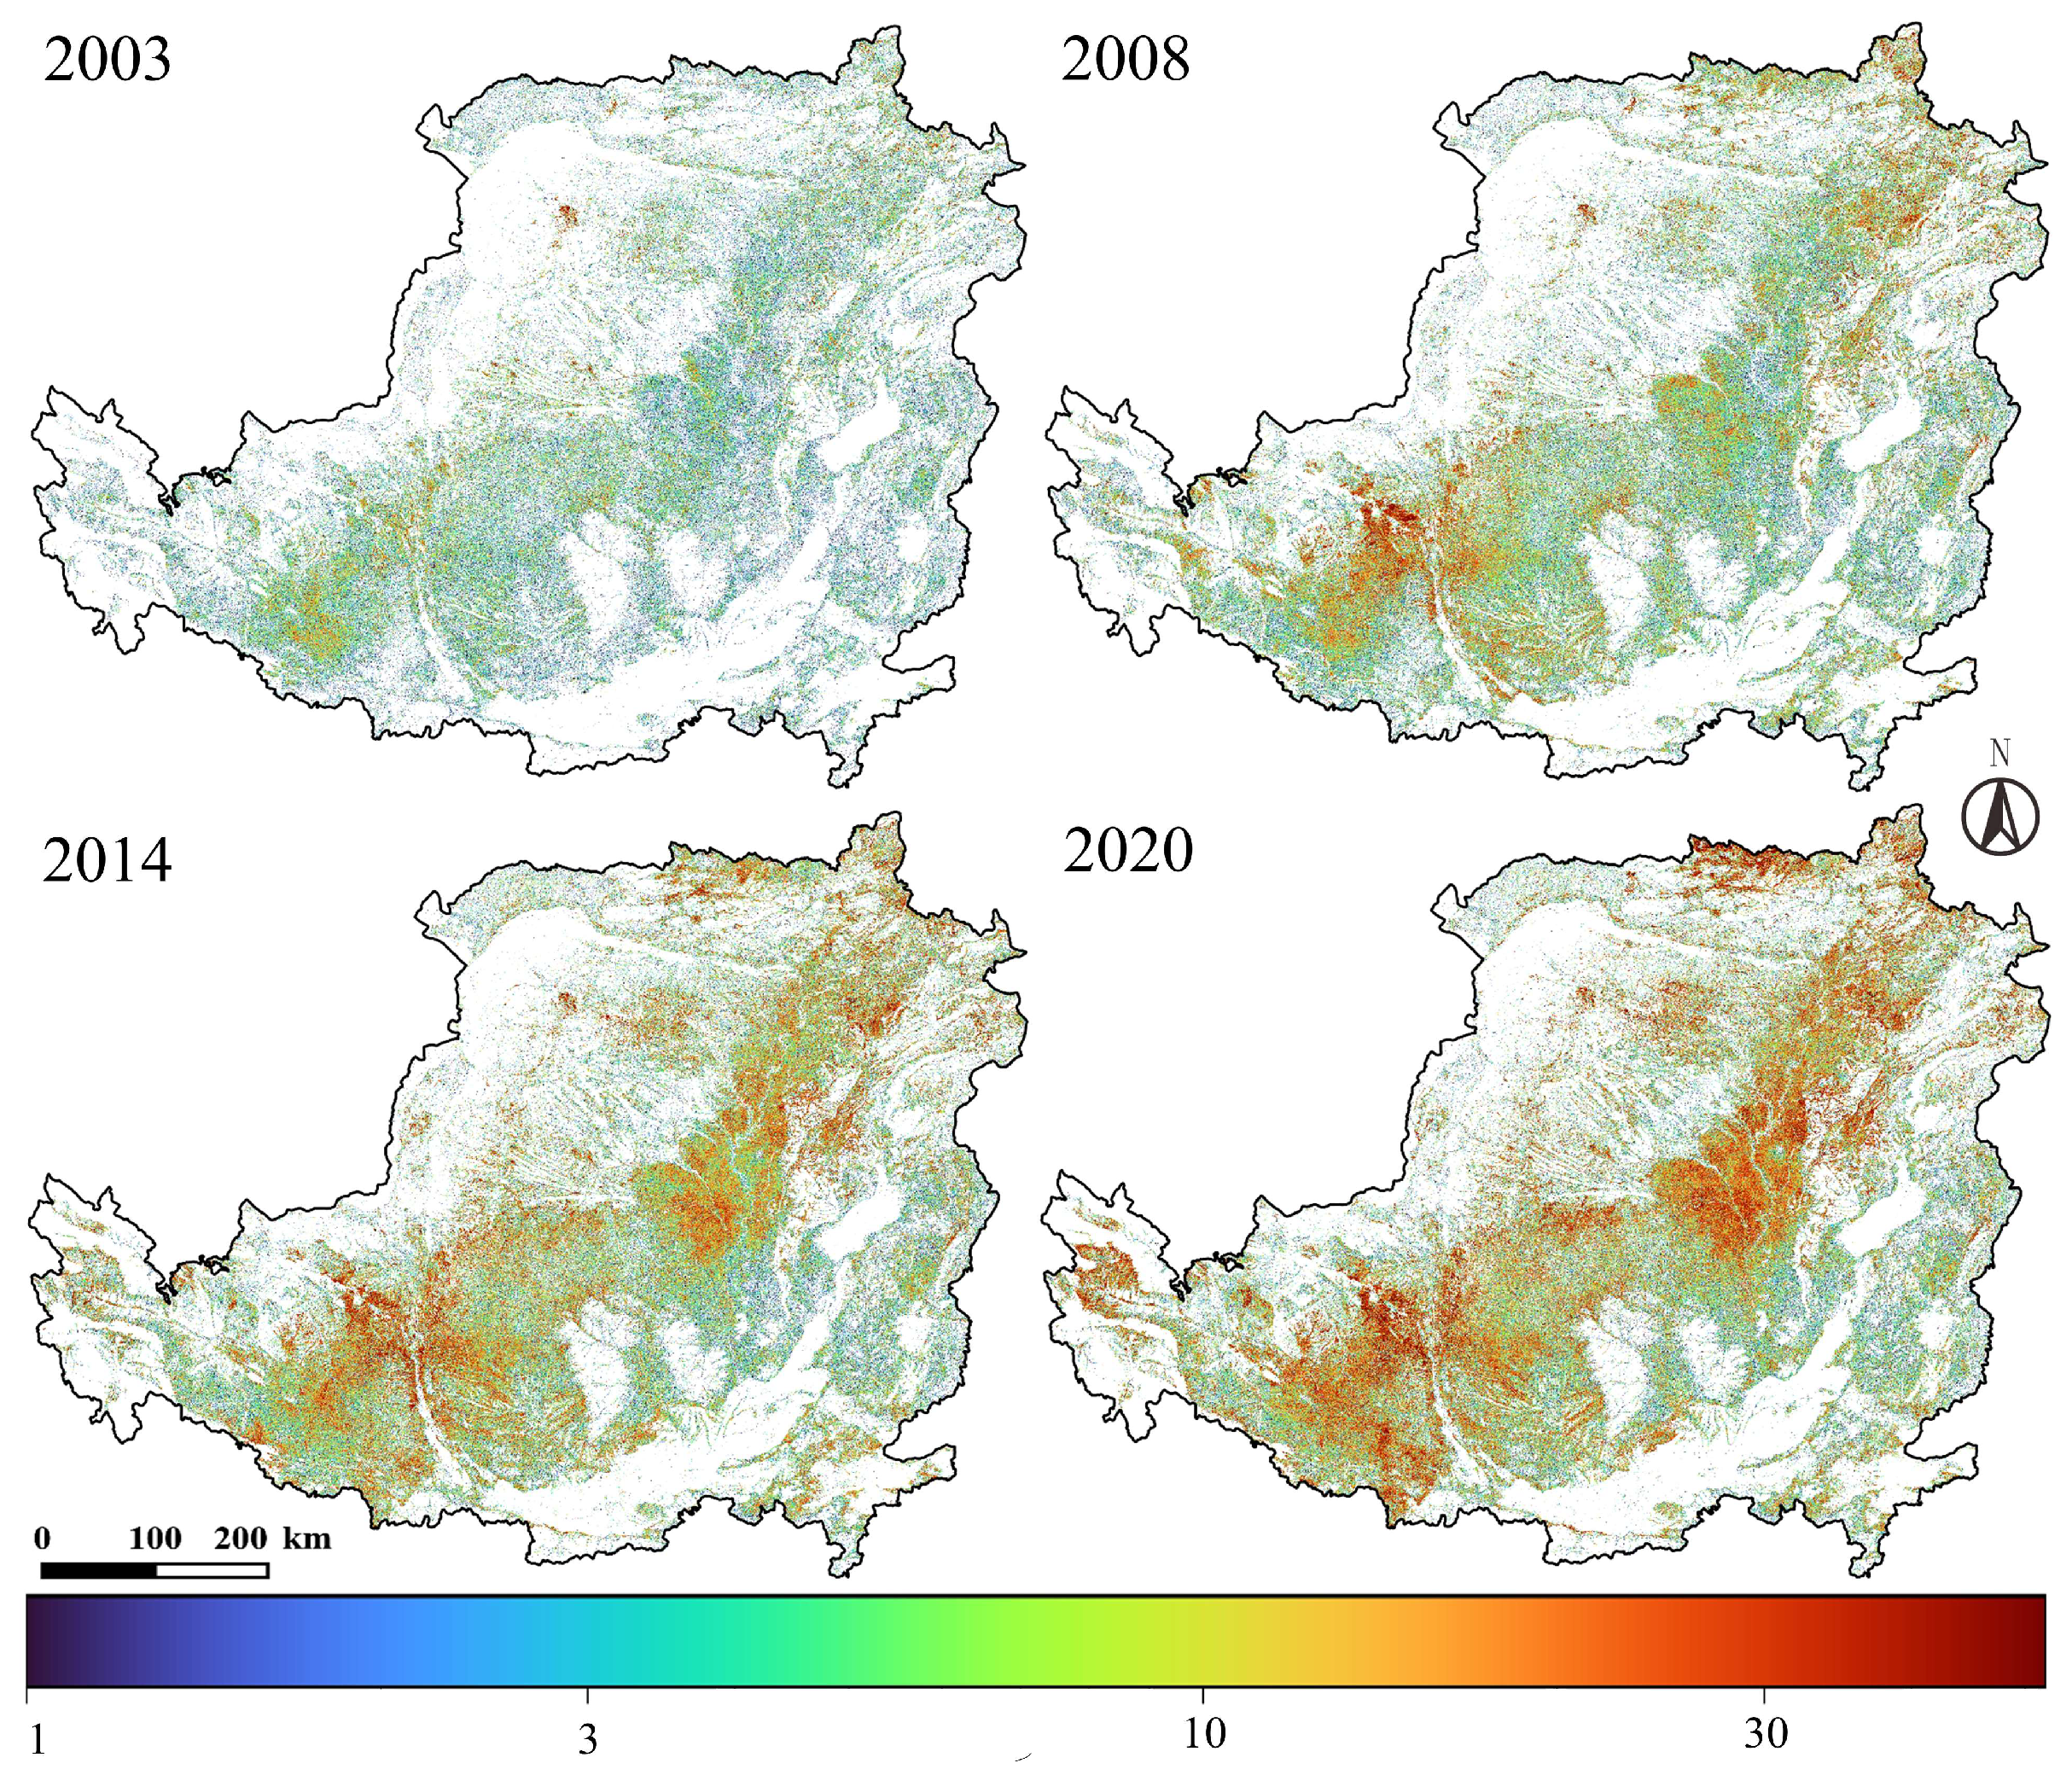
Two-time nodes are evident in the trajectory: around 2008, coinciding with the intensive phase of the Grain-for-Green Program, and around 2014, alongside adjustments to cropland protection and subsidy policies. Overall, CA evolved from short-term agricultural fluctuations to a predominately high-grade, long-term process, indicating a structural transformation of regional land-use patterns (Figure 5).

4.1.2. Spatiotemporal Fluctuations of Multiyear Abandonment

Compared with interannual abandonment, multiyear abandonment better reflects the long-term trends of cropland use. Between 2000 and 2020, multiyear abandonment on the Loess Plateau evolved from a scattered to a more clustered distribution, with clear differentiation across grades. Low-grade abandonment (1–3 years) covered approximately 1.21 million ha, occurring mainly in scattered patches across alluvial plains and areas with convenient transportation, and was often associated with short-term fluctuations. Medium-grade abandonment (4–7 years) totaled about 2.12 million ha, concentrated along the margins of the Weibei tableland and the Jinzhong Basin, where land-use dynamics were strongly influenced by policy and market factors. High-grade abandonment (≥8 years) reached 4.79 million ha, ranking first in both extent and spatial aggregation.
In terms of spatial configuration, low-grade abandonment patches were small and fragmented, concentrated in relatively flat areas with favorable irrigation conditions. In such regions, superior farming conditions meant abandonment was usually driven by temporary labor migration or economic fluctuations, and thus was less persistent. Medium-grade abandonment exhibited banded distributions, concentrated in the transitional zones between tablelands and hilly areas. This indicates that both land productivity and labor supply in these regions were near critical thresholds, making them highly sensitive to shifts in subsidies or grain prices. High-grade abandonment, in contrast, formed large, contiguous zones in the hilly–gully region of northern Shaanxi, southern Ningxia, and eastern Gansu. These areas are characterized by steep slopes, poor soils, and severe labor outmigration, where long-term abandonment was prevalent and land-use irreversibility was pronounced.
Overall, the total area of multiyear abandonment on the Loess Plateau exceeded 8.13 million ha during 2000–2020. High-grade abandonment accounted for 58.9% of the total, far exceeding medium-grade (26.1%) and low-grade (14.9%) categories. This pattern indicates that CA has evolved beyond short-term agricultural fluctuations into a predominantly high-grade, long-term process, reflecting a broader transition of land-use from traditional agriculture toward non-agricultural and ecological functions (Figure 6).

4.2. Policy Effects on Cropland Abandoned

4.2.1. Spatiotemporal Characteristics of Conversion to Forest and Grassland

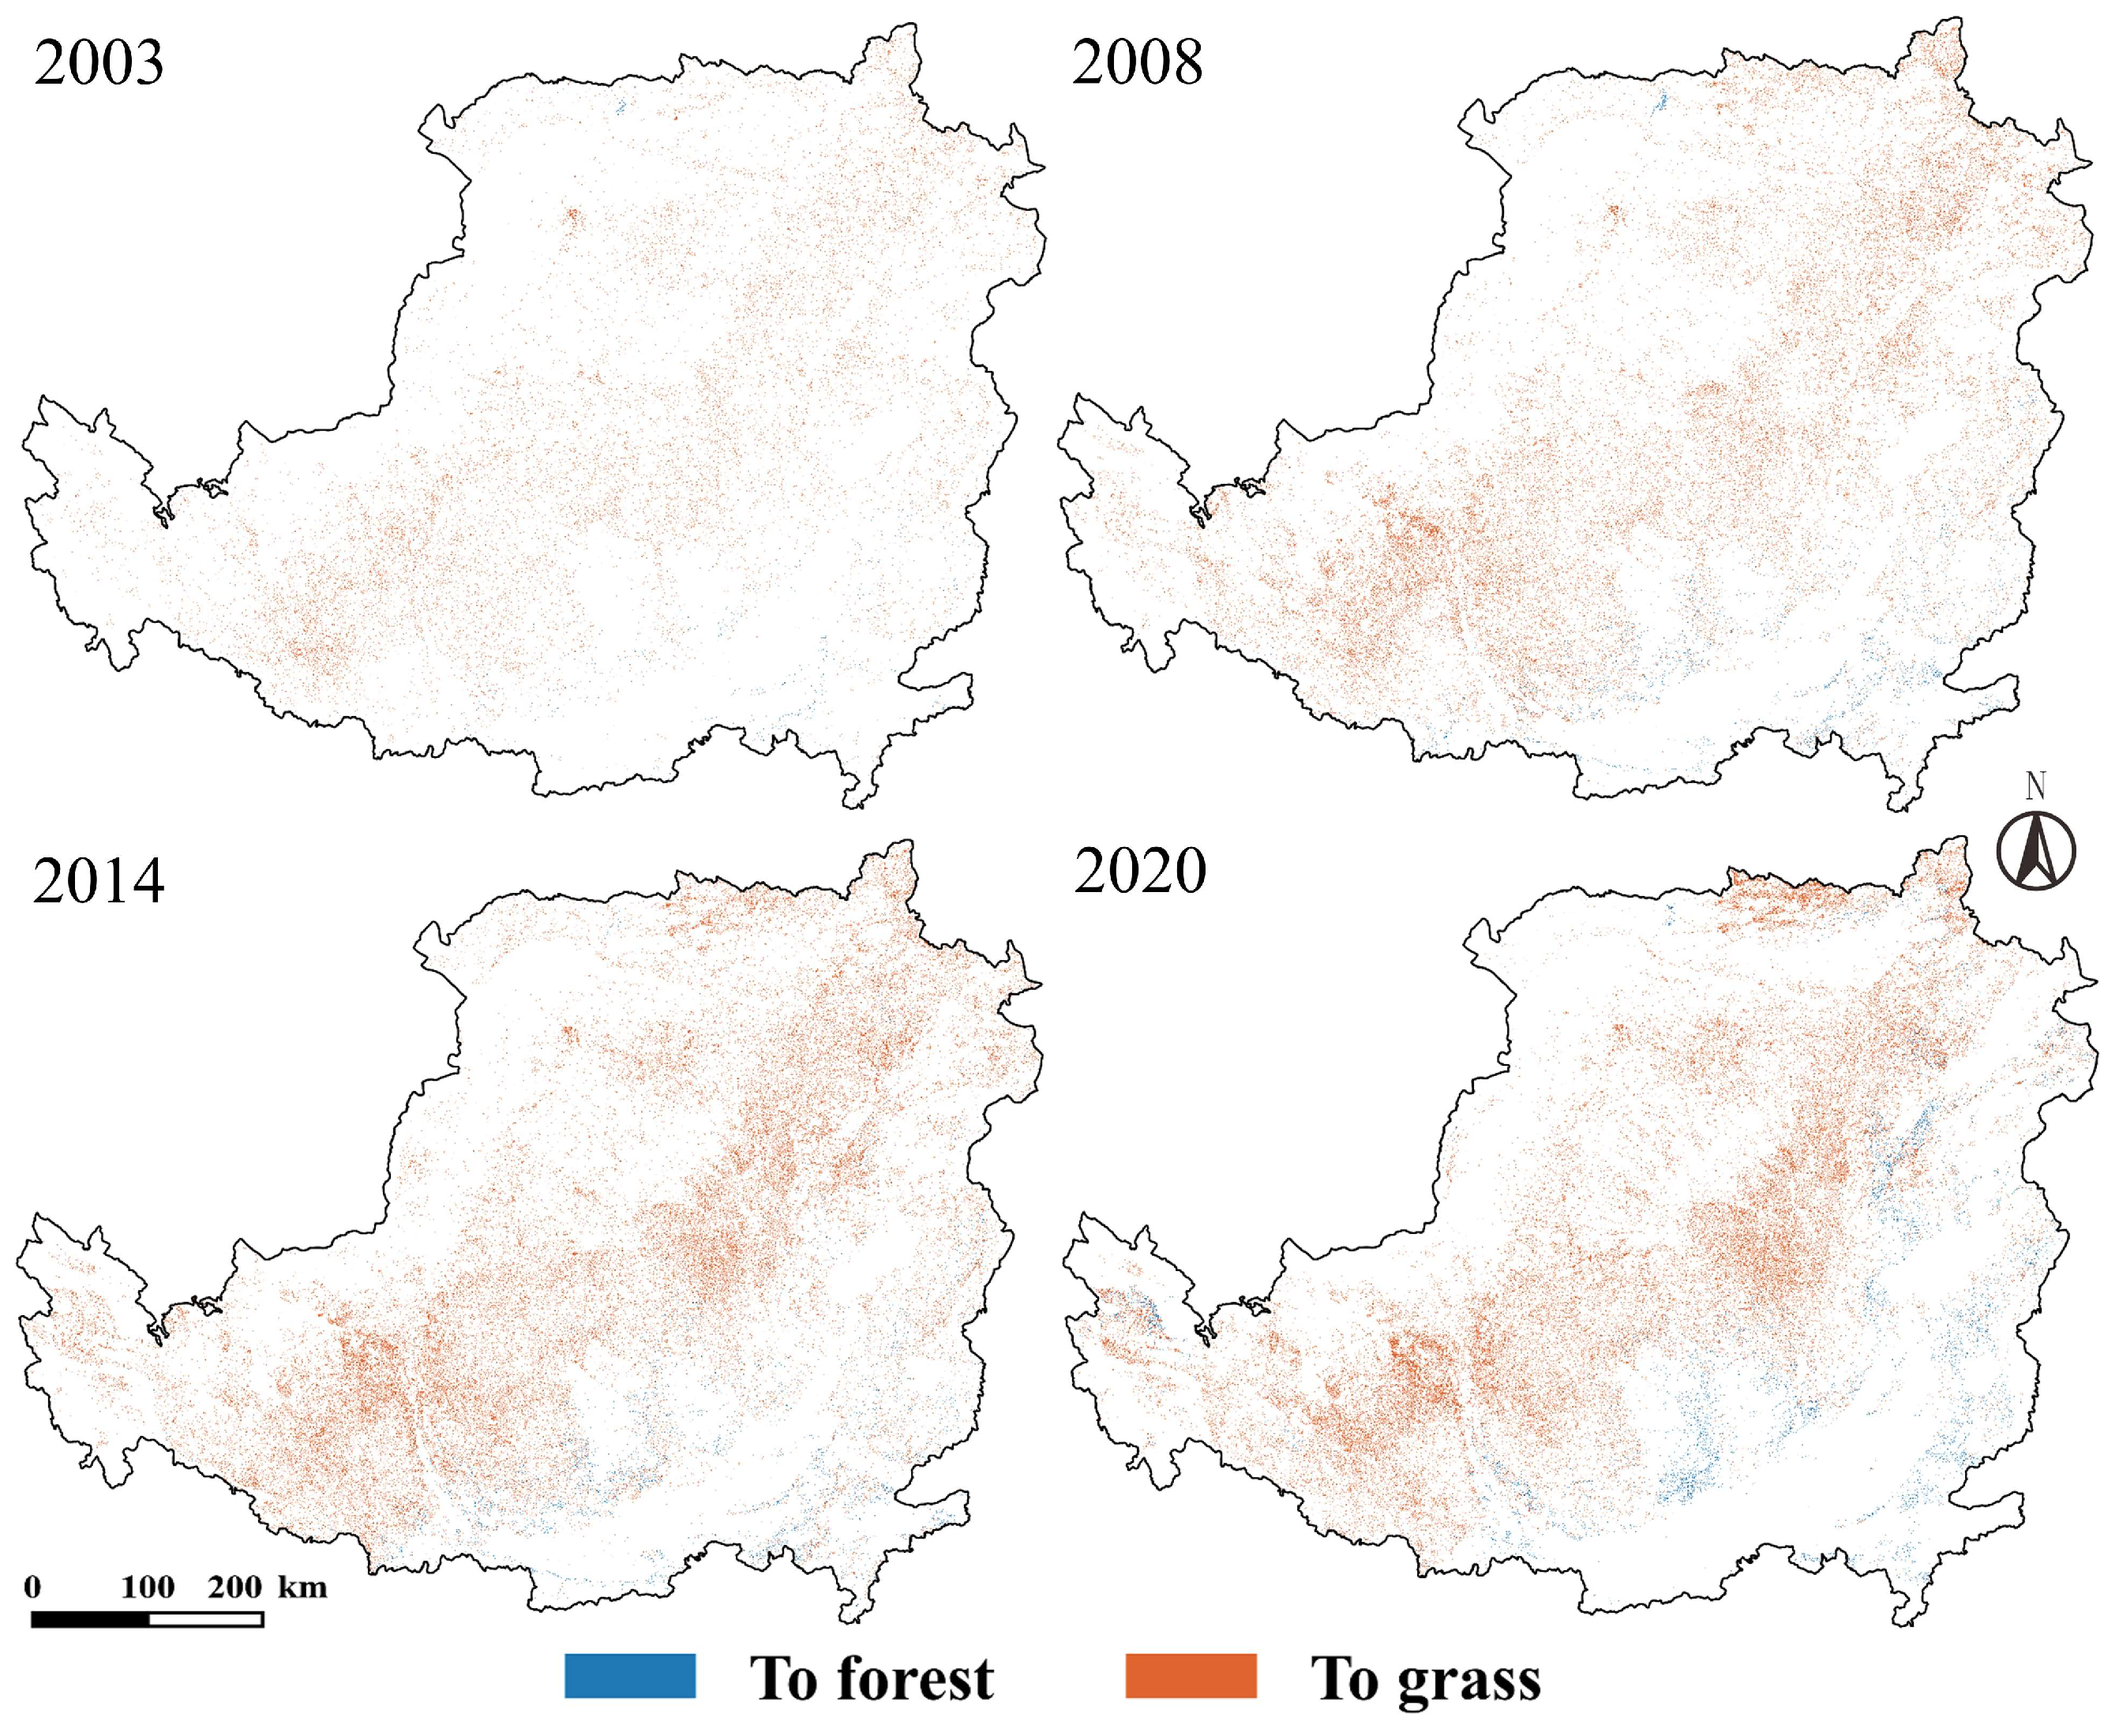
Since the large-scale implementation of the GFGP in the Loess Plateau beginning in 2000, the regional cropland-use pattern has undergone significant adjustments. Overall, CA has mainly been converted into forest and grassland, with concentrated, contiguous patches forming in the hilly–gully belt of northern Shaanxi and along the western mountain margins (Figure 7). In the early stage (2000–2005), conversions were concentrated in erosion-prone hilly–gully areas, with grassland restoration dominating. After 2006, the area of forest restoration expanded steadily, particularly in the southern hilly and mountainous zones.
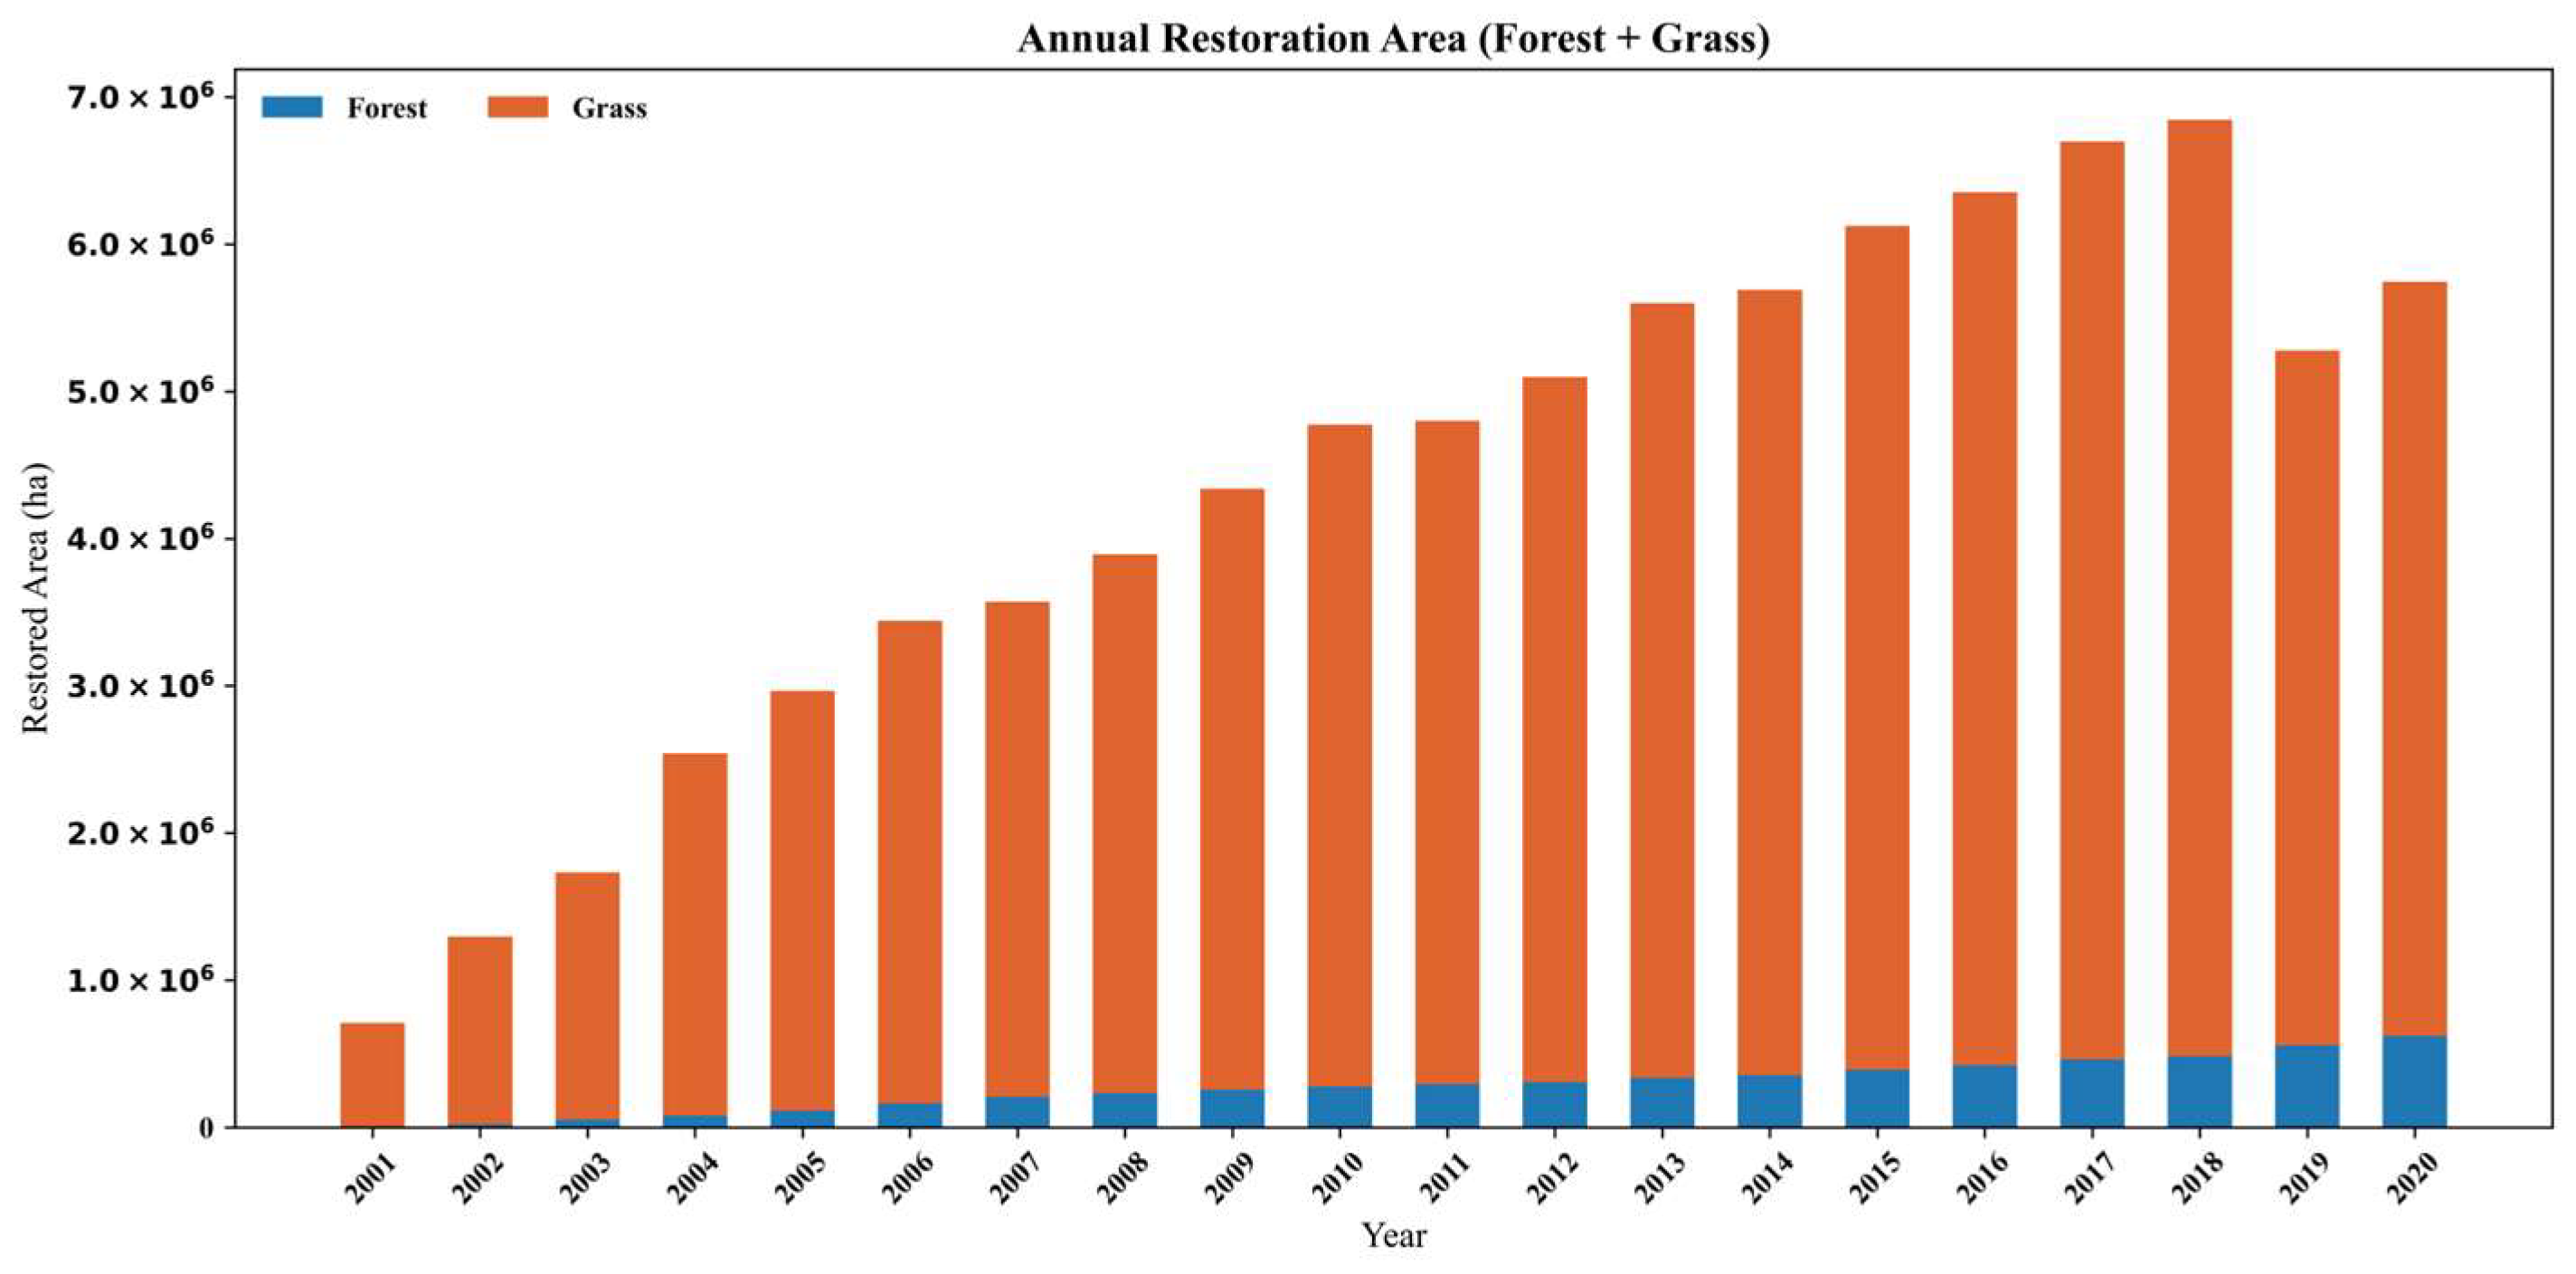
In terms of annual dynamics, the area of converted cropland increased continuously between 2000 and 2010, peaking at approximately 3.4 million ha in 2018. Although it declined slightly thereafter, it remained above 3.0 million ha overall (Figure 8). Grassland restoration consistently accounted for about 80% of the total in the early years, reflecting the shorter subsidy period (2 years) and lower cost of establishing grass cover under the initial GFGP scheme. By contrast, forest restoration—supported by extended subsidy years (up to 8 years) and higher payment standards in later stages—expanded steadily after 2006, reaching nearly 0.53 million ha in 2020, several times higher than in 2001.
The Grain for Green Program (GFGP), launched nationwide in 1999 after the catastrophic 1998 floods, has been one of the world’s largest ecological restoration initiatives, converting cropland on steep slopes and fragile lands into forest and grassland. Backed by massive central government investment and farmer subsidies, the program not only curbed soil erosion and ecological degradation but also provided direct livelihood compensation to more than 40 million rural households across 25 provinces.
This shift highlights how evolving policy incentives, together with the ecological suitability of southern hilly zones, gradually increased the share of forest restoration in the Loess Plateau.
These results demonstrate that the GFGP effectively curbed the disorderly expansion of CA in the short term while promoting a long-term ecological transition of land use. The grassland-dominated restoration pattern aligns well with the semi-arid climate and soil conservation needs of the Loess Plateau, while the gradual increase in forest area reflects the alignment between policy implementation and regional ecological carrying capacity.

4.2.2. Spatiotemporal Characteristics of Cropland Reclamation

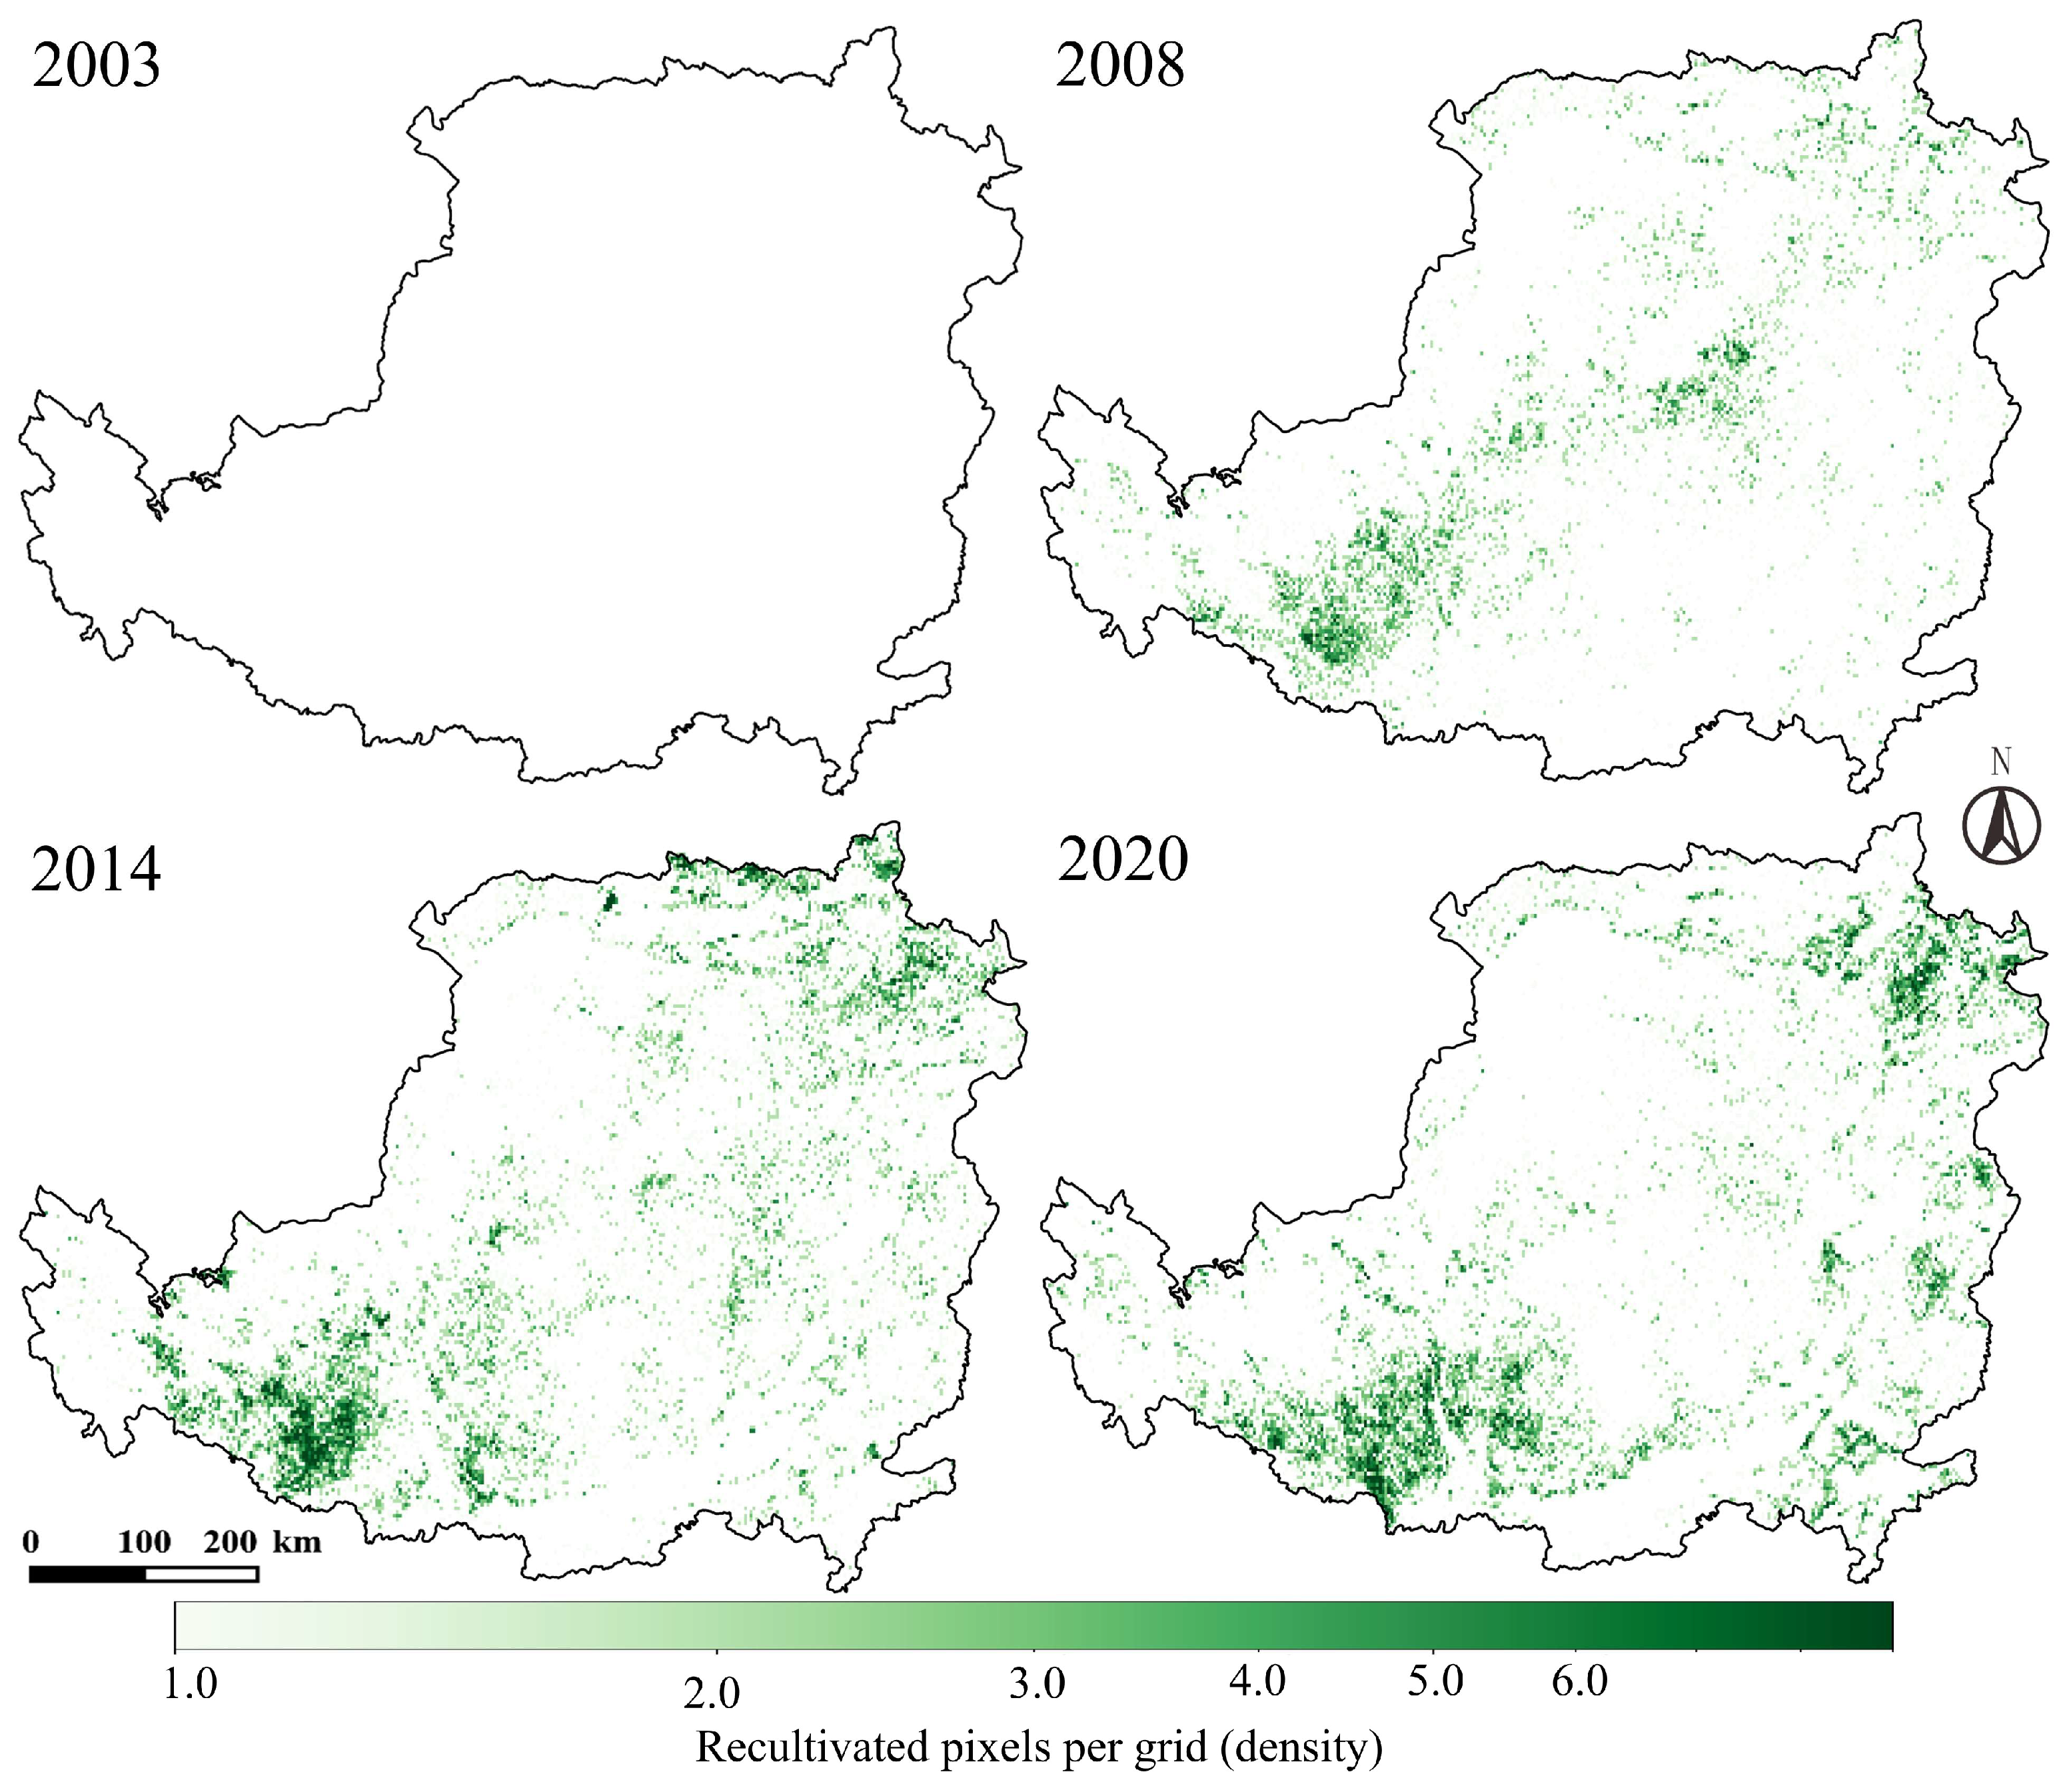
Alongside cropland conversion, reclamation hotspots were mainly concentrated along the Yellow River valley and its tributary basins, extending into the southern part of Shanxi, the transitional zones of southern Ningxia, and the eastern margins of Gansu (Figure 9). These areas are characterized by relatively flat terrain, fertile soils, and better irrigation conditions, which, together with grain subsidies and rural revitalization policies, made them particularly suitable for reclamation. By contrast, reclamation density was much lower in the northern Shaanxi hilly–gully region and in the western highlands of the Plateau, where steep slopes and ecological fragility increased the costs and risks of re-cultivation.
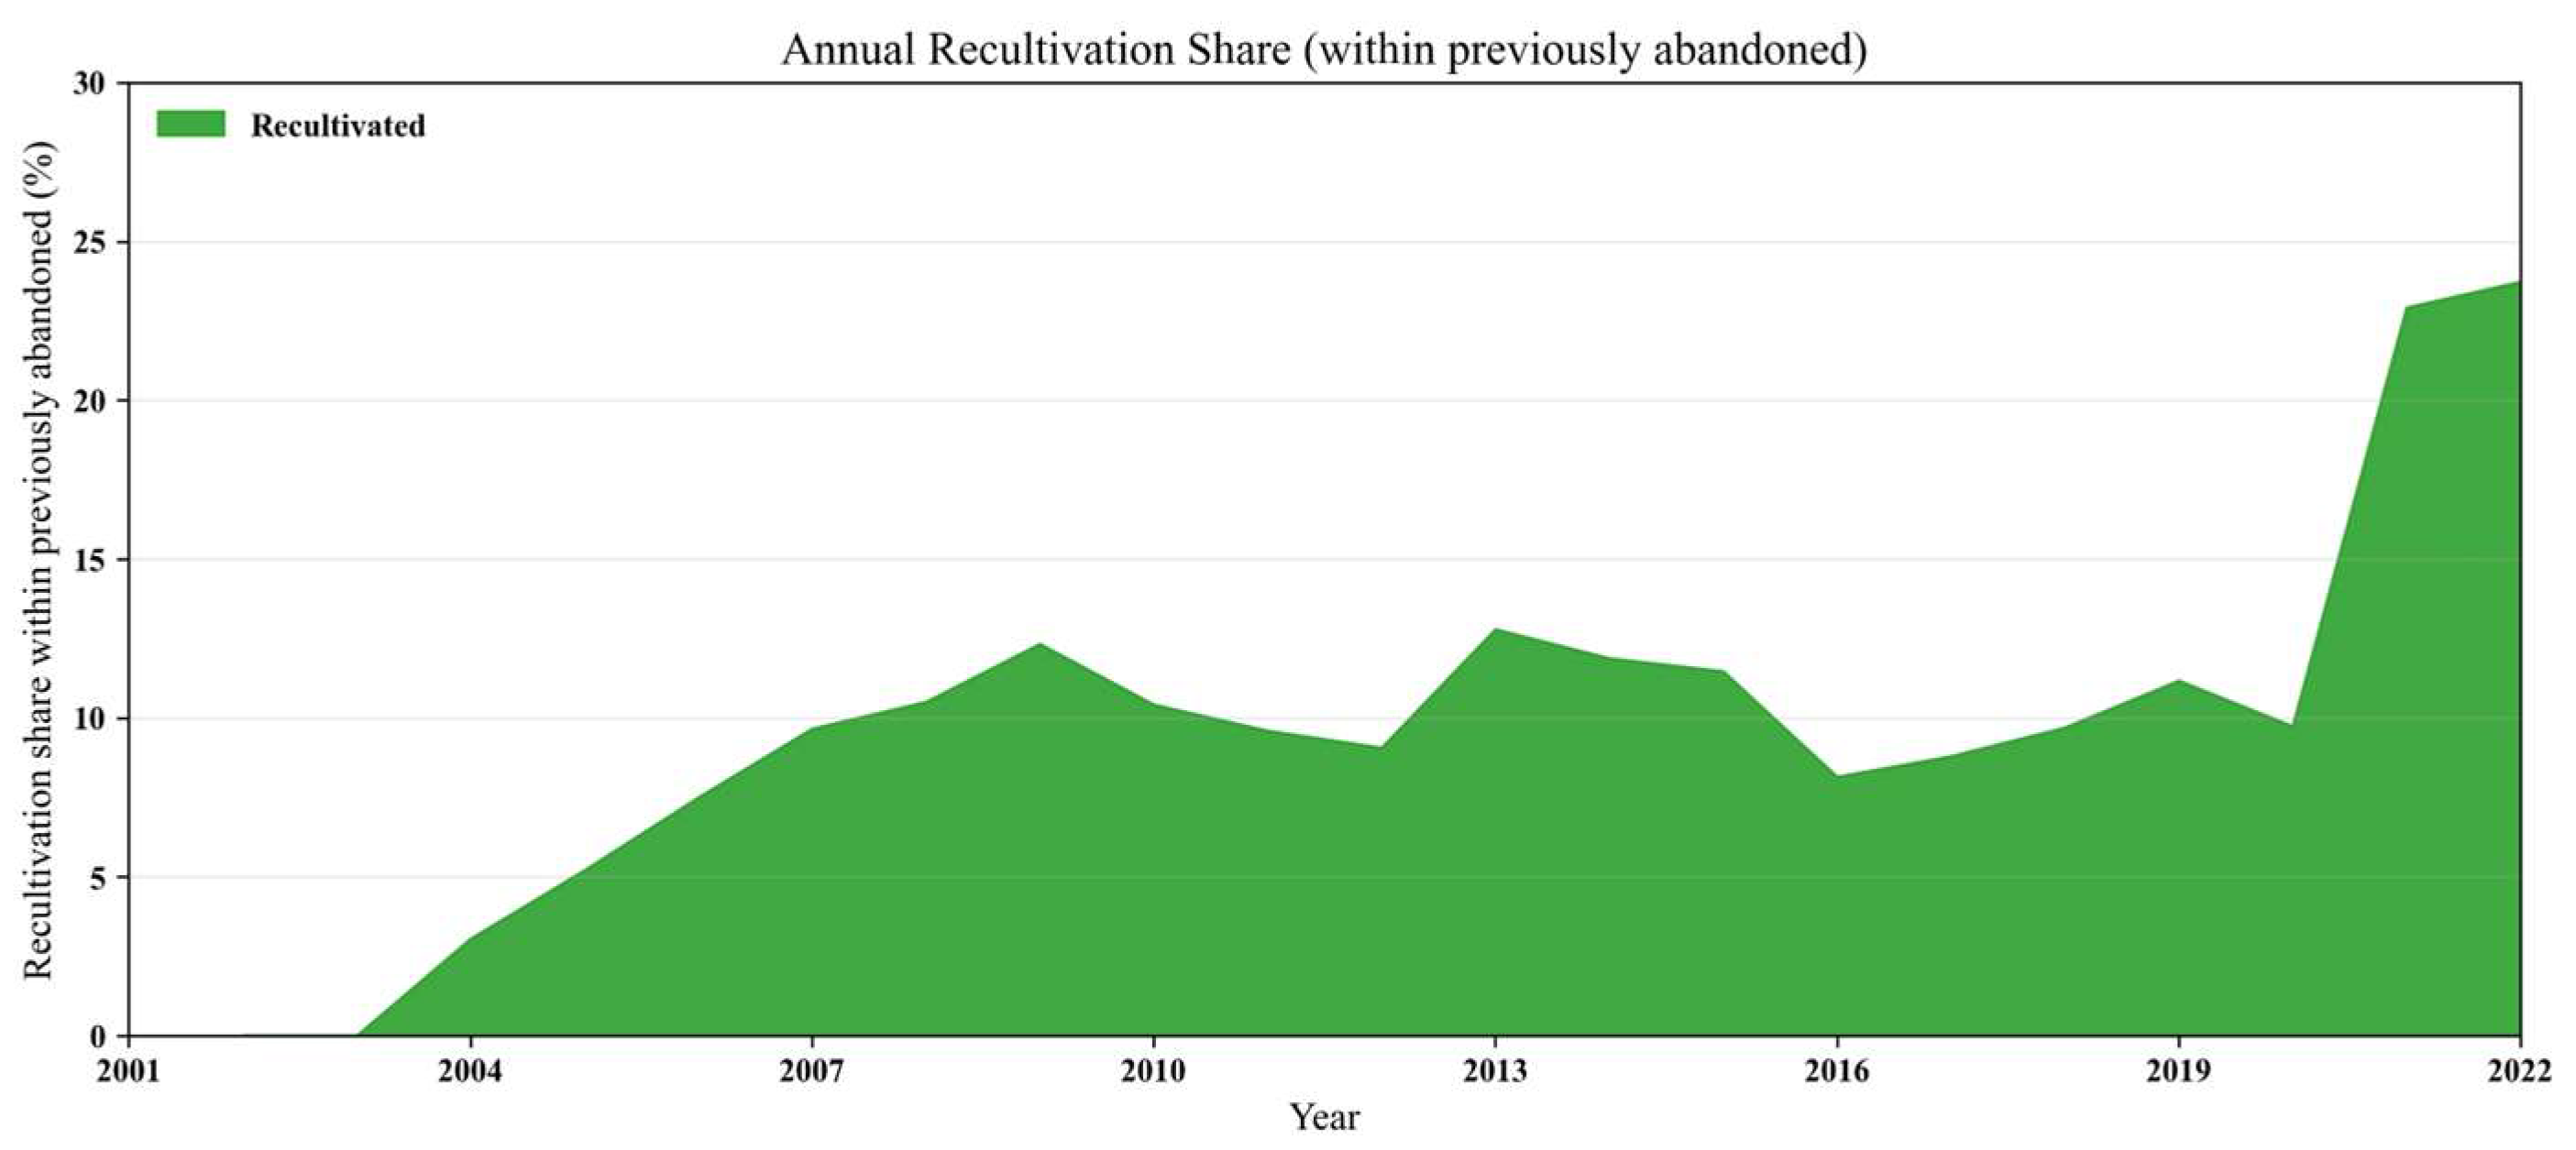
From a temporal perspective, the reclamation rate remained between 5% and 12% during 2003–2015, showing limited fluctuation. After 2016, it began to rise gradually, reaching a peak of 23.4% in 2022 (Figure 10). This trend indicates that, with the strengthening of national food security strategies and rural revitalization policies, cropland reclamation has become an increasingly important approach to controlling long-term abandonment.
Nevertheless, the scale of reclamation remains limited compared with conversion, and it is concentrated mainly on low- and medium-grade CA. In high-grade CA areas (≥8 years), the reclamation rate remains low, suggesting insufficient capacity to reverse long-term abandonment. In other words, reclamation primarily compensates for short- and medium-term CA, while challenges persist in addressing deeply rooted structural abandonment. Therefore, the future spatial layout of reclamation requires more precise alignment with regional agricultural suitability and policy investment priorities.

4.3. Spatiotemporal Evolution of Grain Production

4.3.1. Temporal Fluctuations of Grain Production

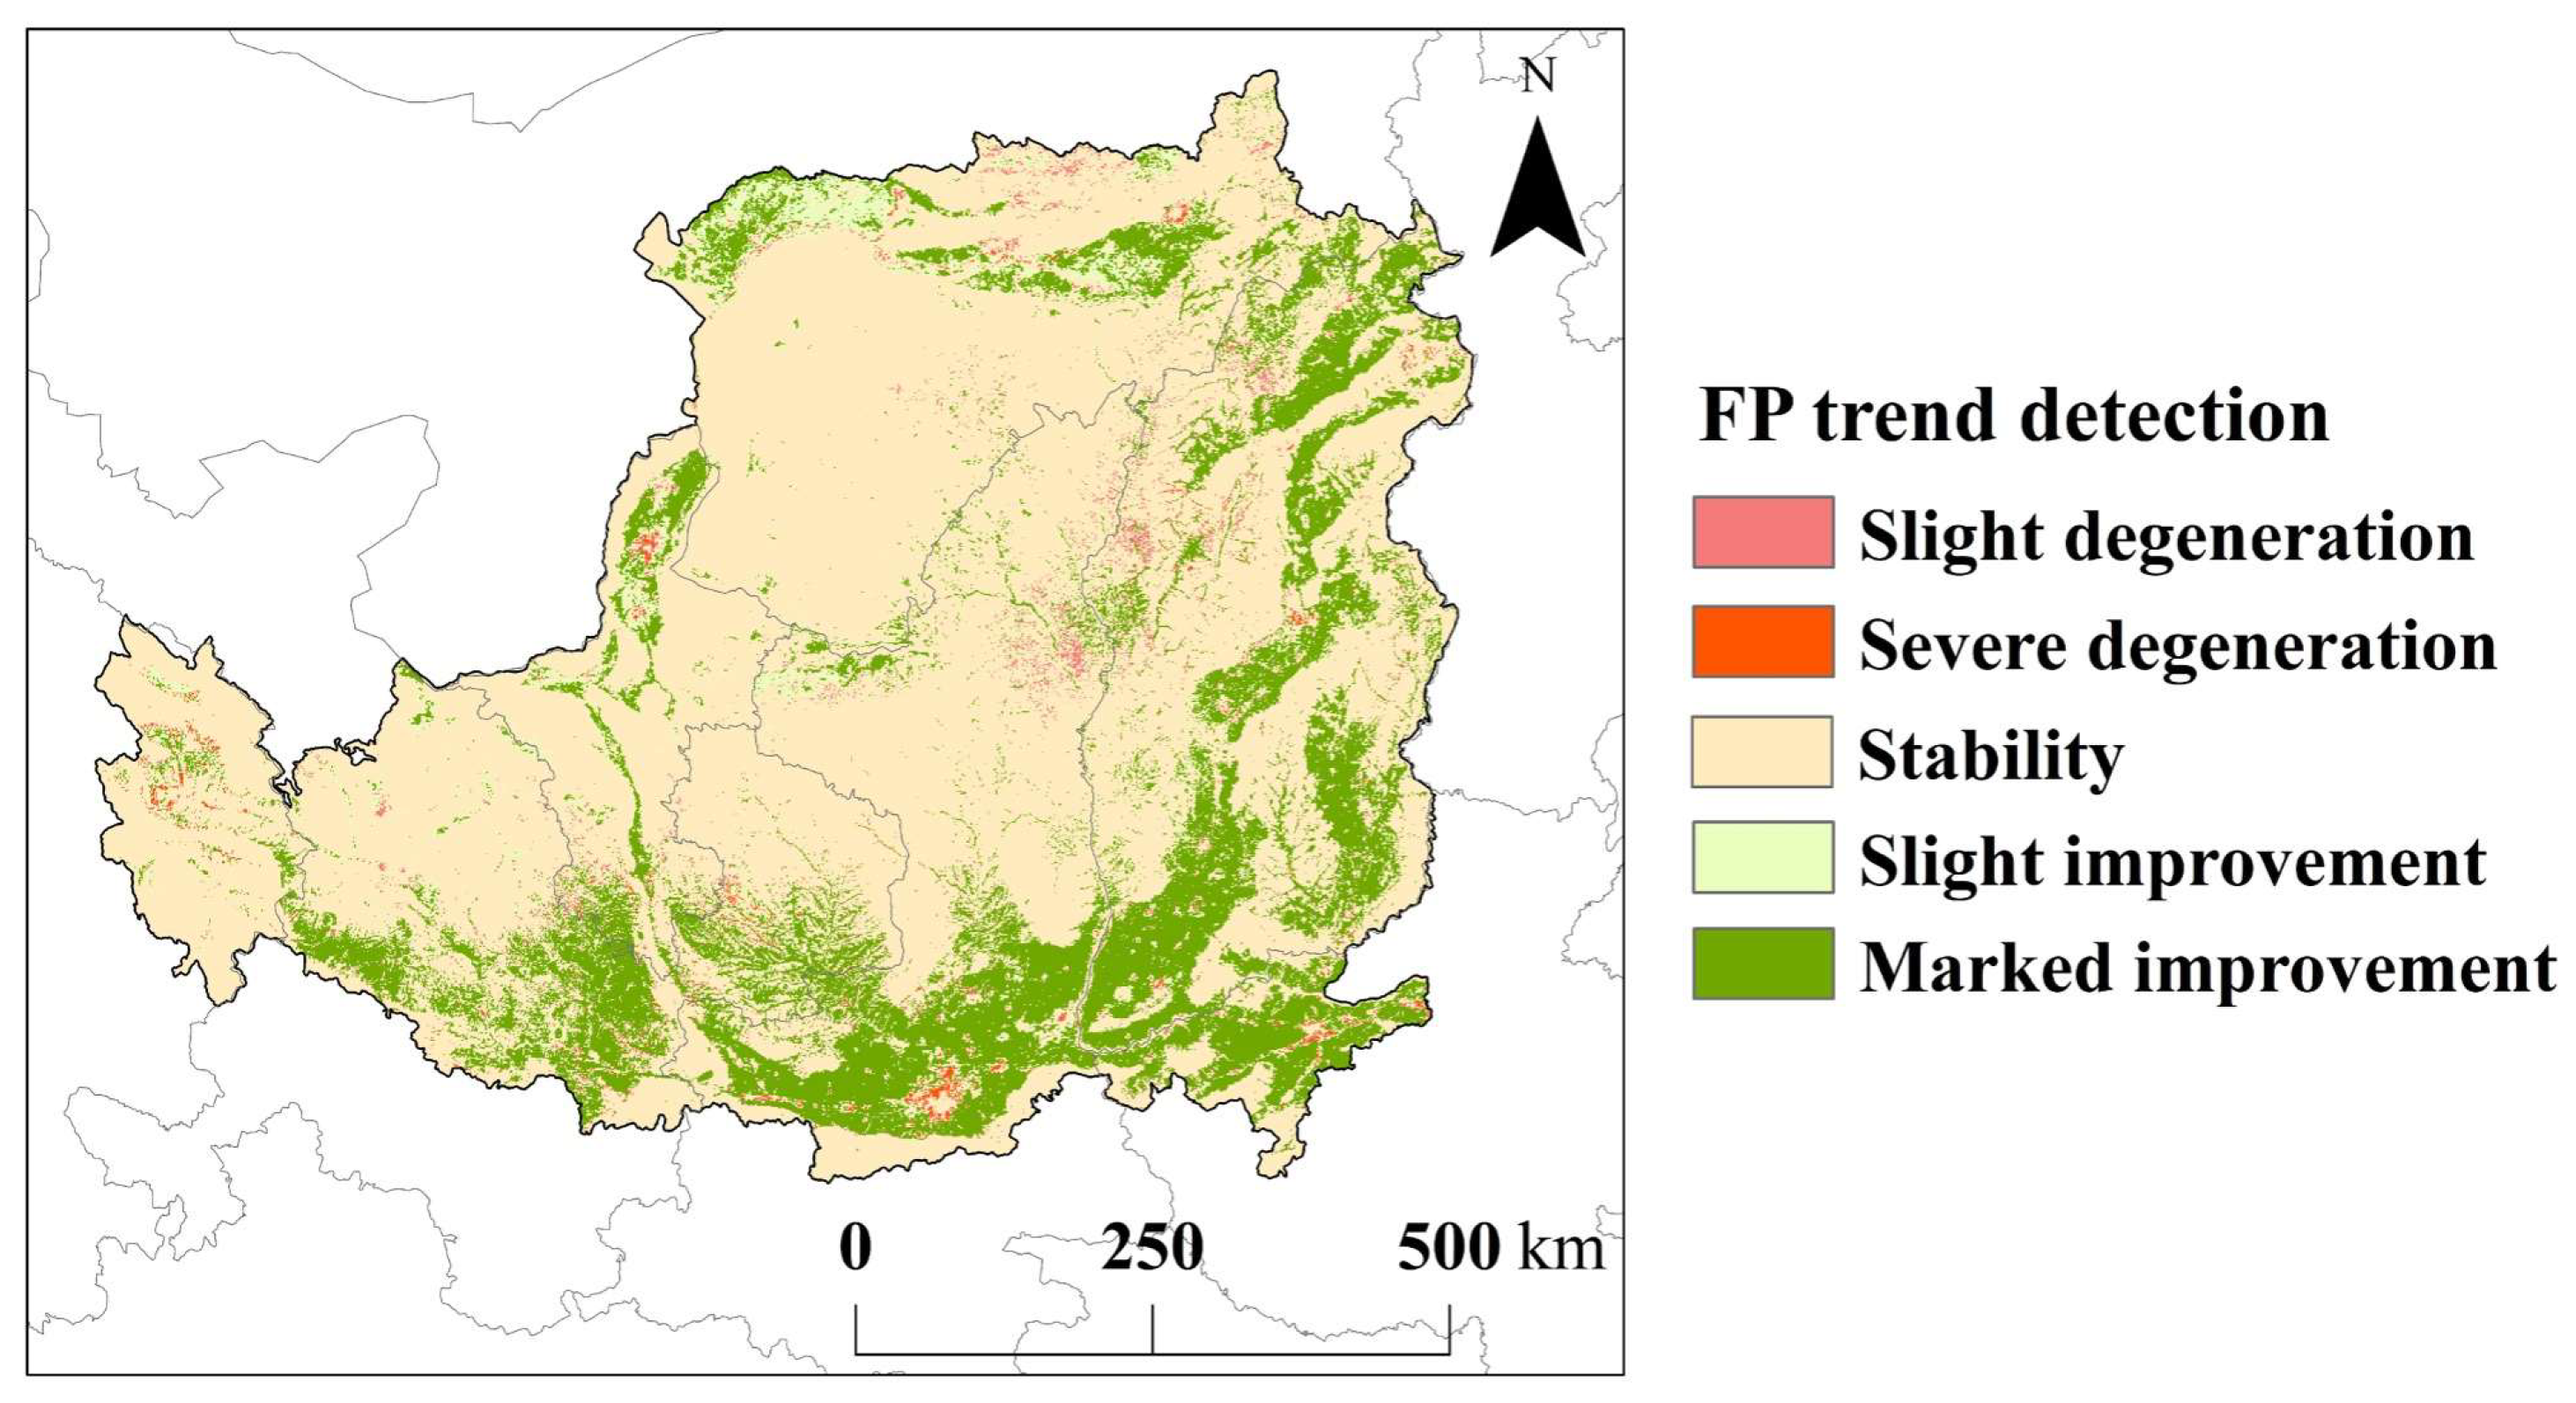
We assessed the spatial variation in food production (FP) across the Loess Plateau from 2001 to 2022. A pixel-level quantitative trend analysis was conducted using the Theil–Sen slope estimator combined with the Mann–Kendall (M–K) significance test (Figure 11).
For the classification of FP change trends, we referred to existing approaches in the literature and incorporated the ecological characteristics and environmental conditions of the Loess Plateau. The final classification rules were established as follows: when the slope of FP change (SFP) was within the interval [–0.0005, 0.0005], FP supply capacity was considered stable; when SFP ≥ 0.0005, FP was considered to show an increasing trend; and when SFP ≤ −0.0005, FP was considered to be in decline. For statistical significance testing, the Z statistic (ZS) from the M–K test was adopted as the criterion: when |ZS| > 1.96 (i.e., ZS > 1.96 or ZS < −1.96), the FP trend was deemed statistically significant; otherwise, when ZS was within the interval [−1.96, 1.96], the trend was classified as non-significant.
Following this reclassification, FP change across the study area was divided into five categories (detailed classification standards and results are provided in Table 2). The area statistics indicate that 25.14% of the region exhibited an increasing FP trend, 72.78% remained stable, and only 2.08% experienced a declining trend. These results suggest that both cropland area and food production have been steadily increasing across the Loess Plateau, with regions showing an upward FP trend generally corresponding to areas with more abundant cropland compared with regions classified as stable or declining.

4.3.2. Spatial Pattern of Grain Production

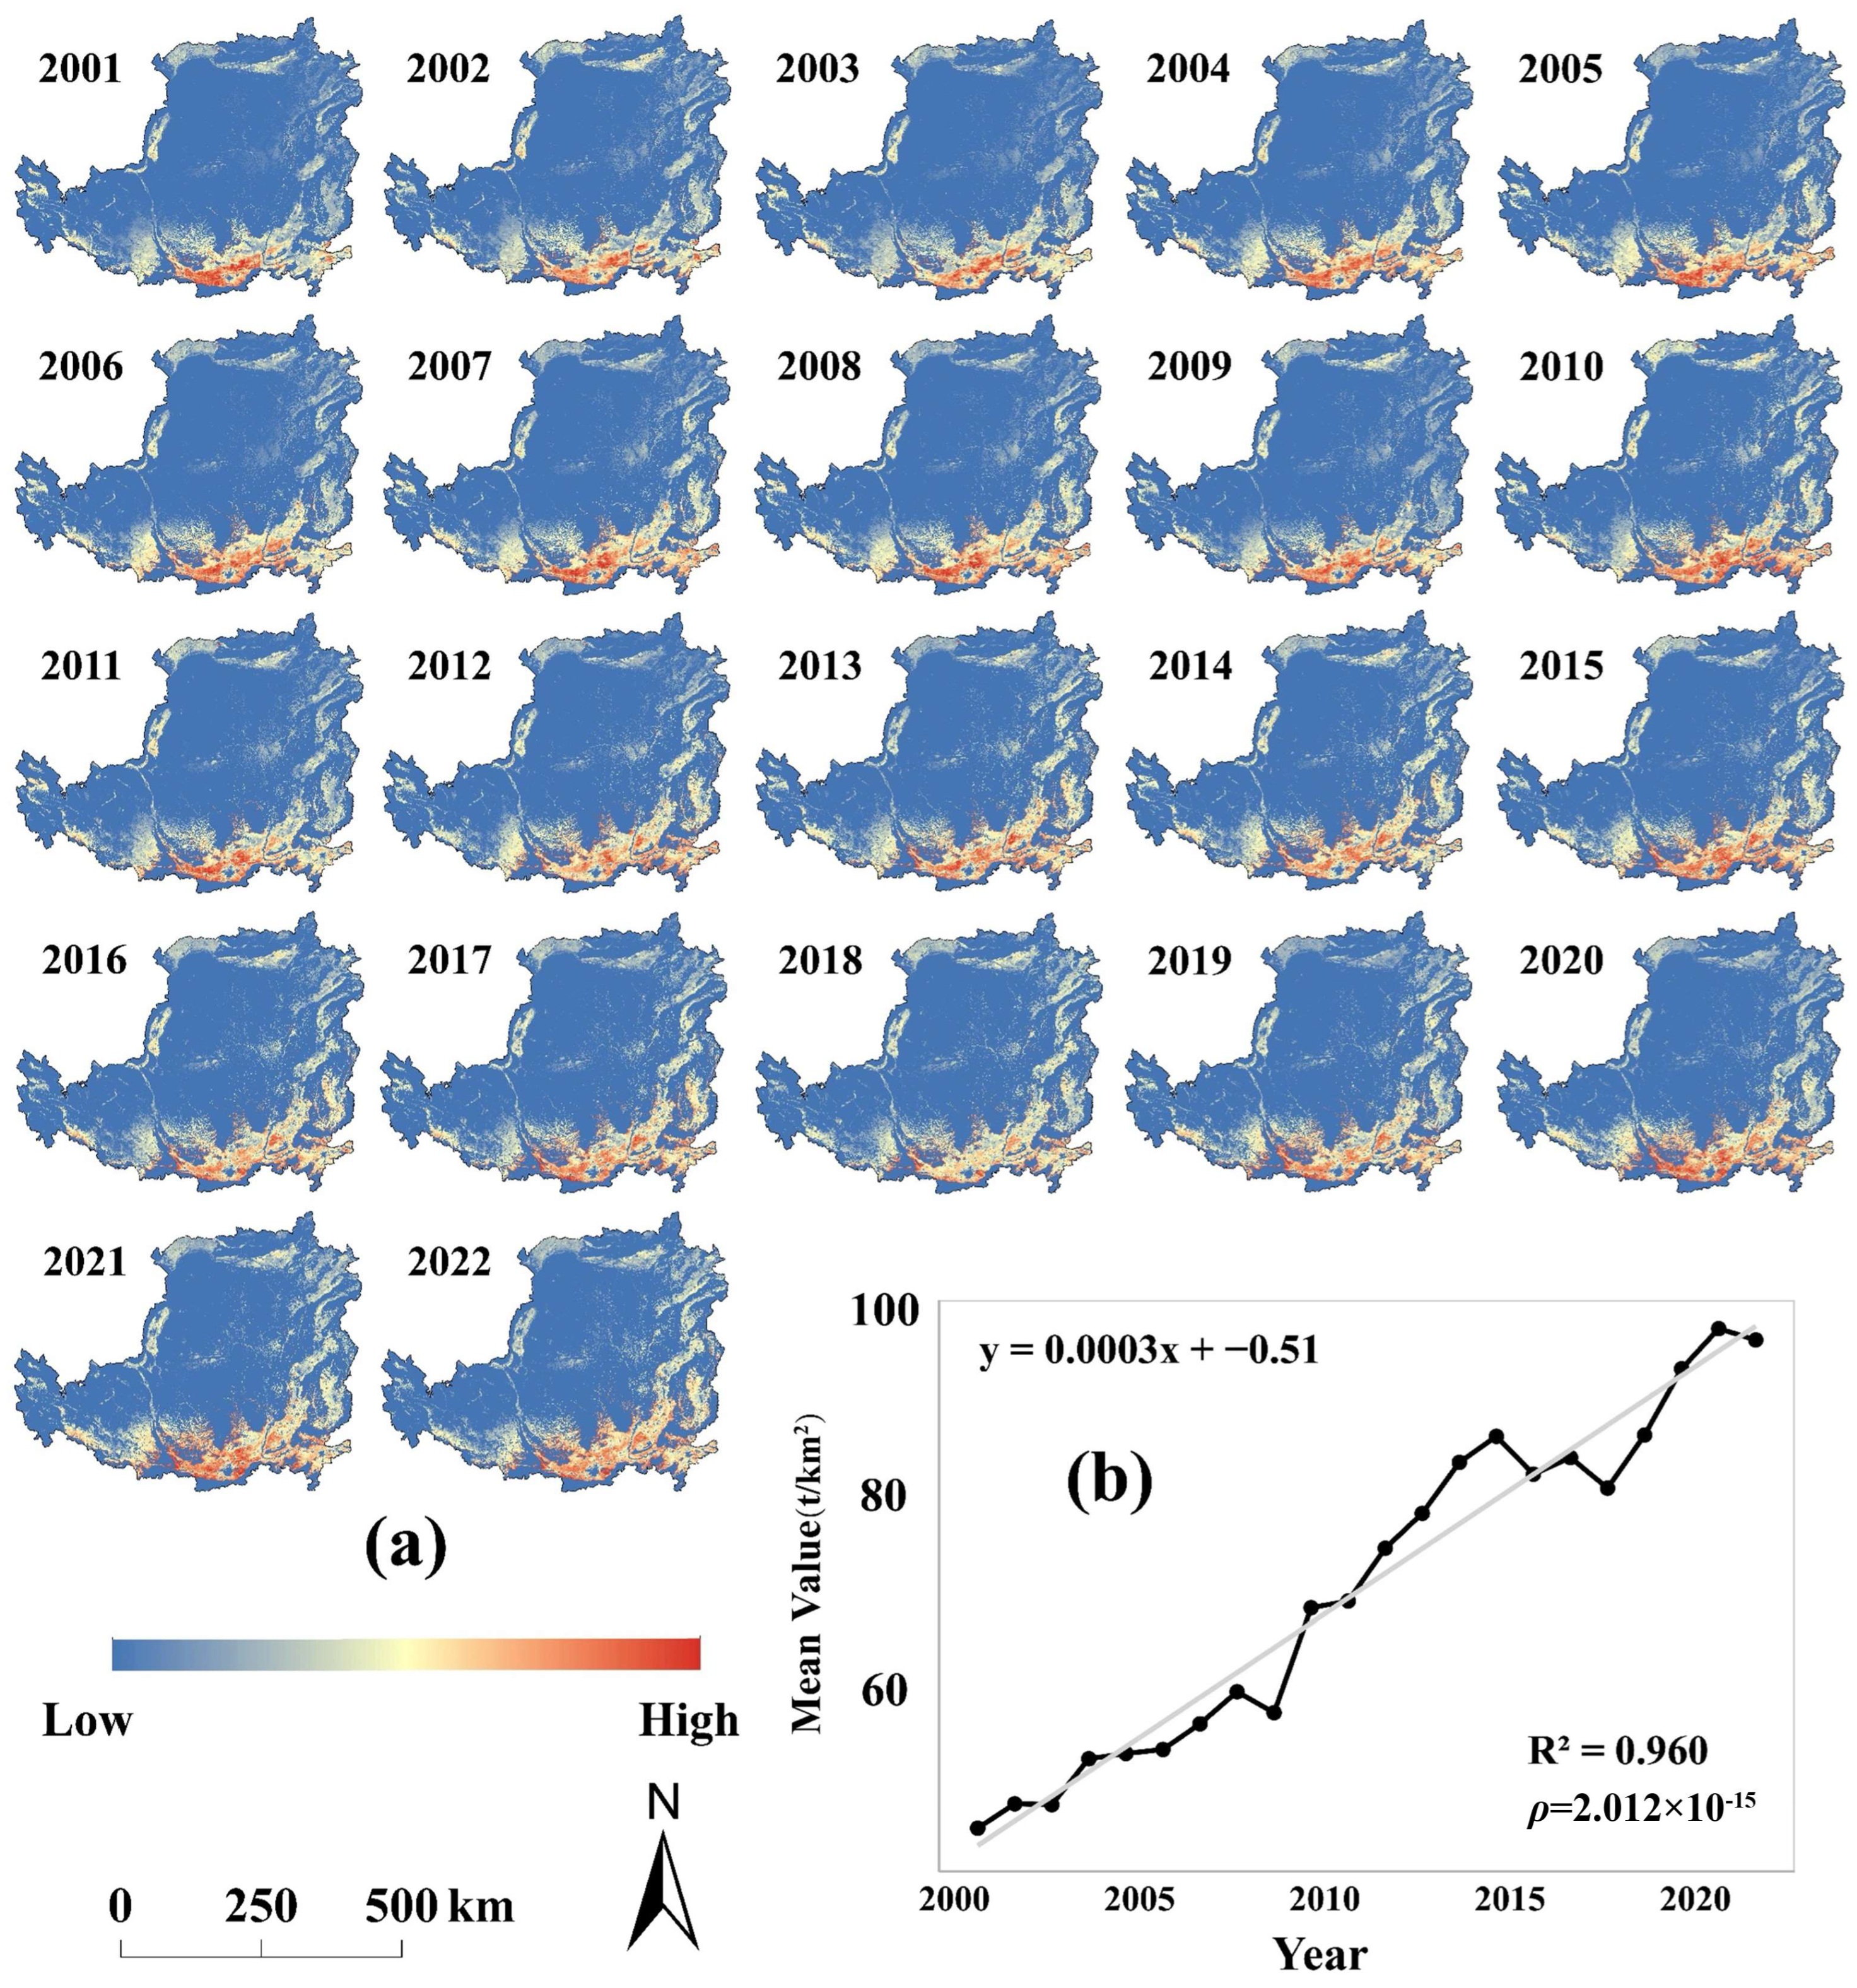
To further investigate the spatiotemporal evolution of FP in the Loess Plateau, we systematically examined the overall dynamics of FP from 2001 to 2023 (Figure 12). The results clearly illustrate the spatial differentiation of FP across different years, reflecting substantial regional heterogeneity. During 2001–2020, FP exhibited pronounced interannual fluctuations, with varying ranges across years, likely influenced by interannual variability in precipitation and temperature, as well as human disturbances.
Spatially, FP showed marked heterogeneity. High-value areas were mainly concentrated in the southern part of the study region, where favorable ecological conditions, higher NDVI, and extensive cropland contributed to strong food supply capacity. In contrast, low-value areas were widely distributed in the central and western regions, which are dominated by forest and grassland. Despite relatively high NDVI values in these areas, the limited proportion of cropland constrained food production.
The long-term trend of mean annual FP is also shown in Figure 12. Using linear trend analysis, we found that FP exhibited a significant upward trajectory over the 22-year period. The annual mean FP peaked at 97.44 t/km2 in 2022, representing an absolute increase of 49.58 t/km2 and a relative growth of 105.8% compared with 2001 (p < 0.01). The consistent rise in mean kNDVI during 2001–2022 not only indicates a general increase in cropland area but also validates the continuous growth of FP in the region.

4.4. Impacts of Cropland Abandonment on Grain Production

4.4.1. Mechanism of Grain Yield Loss

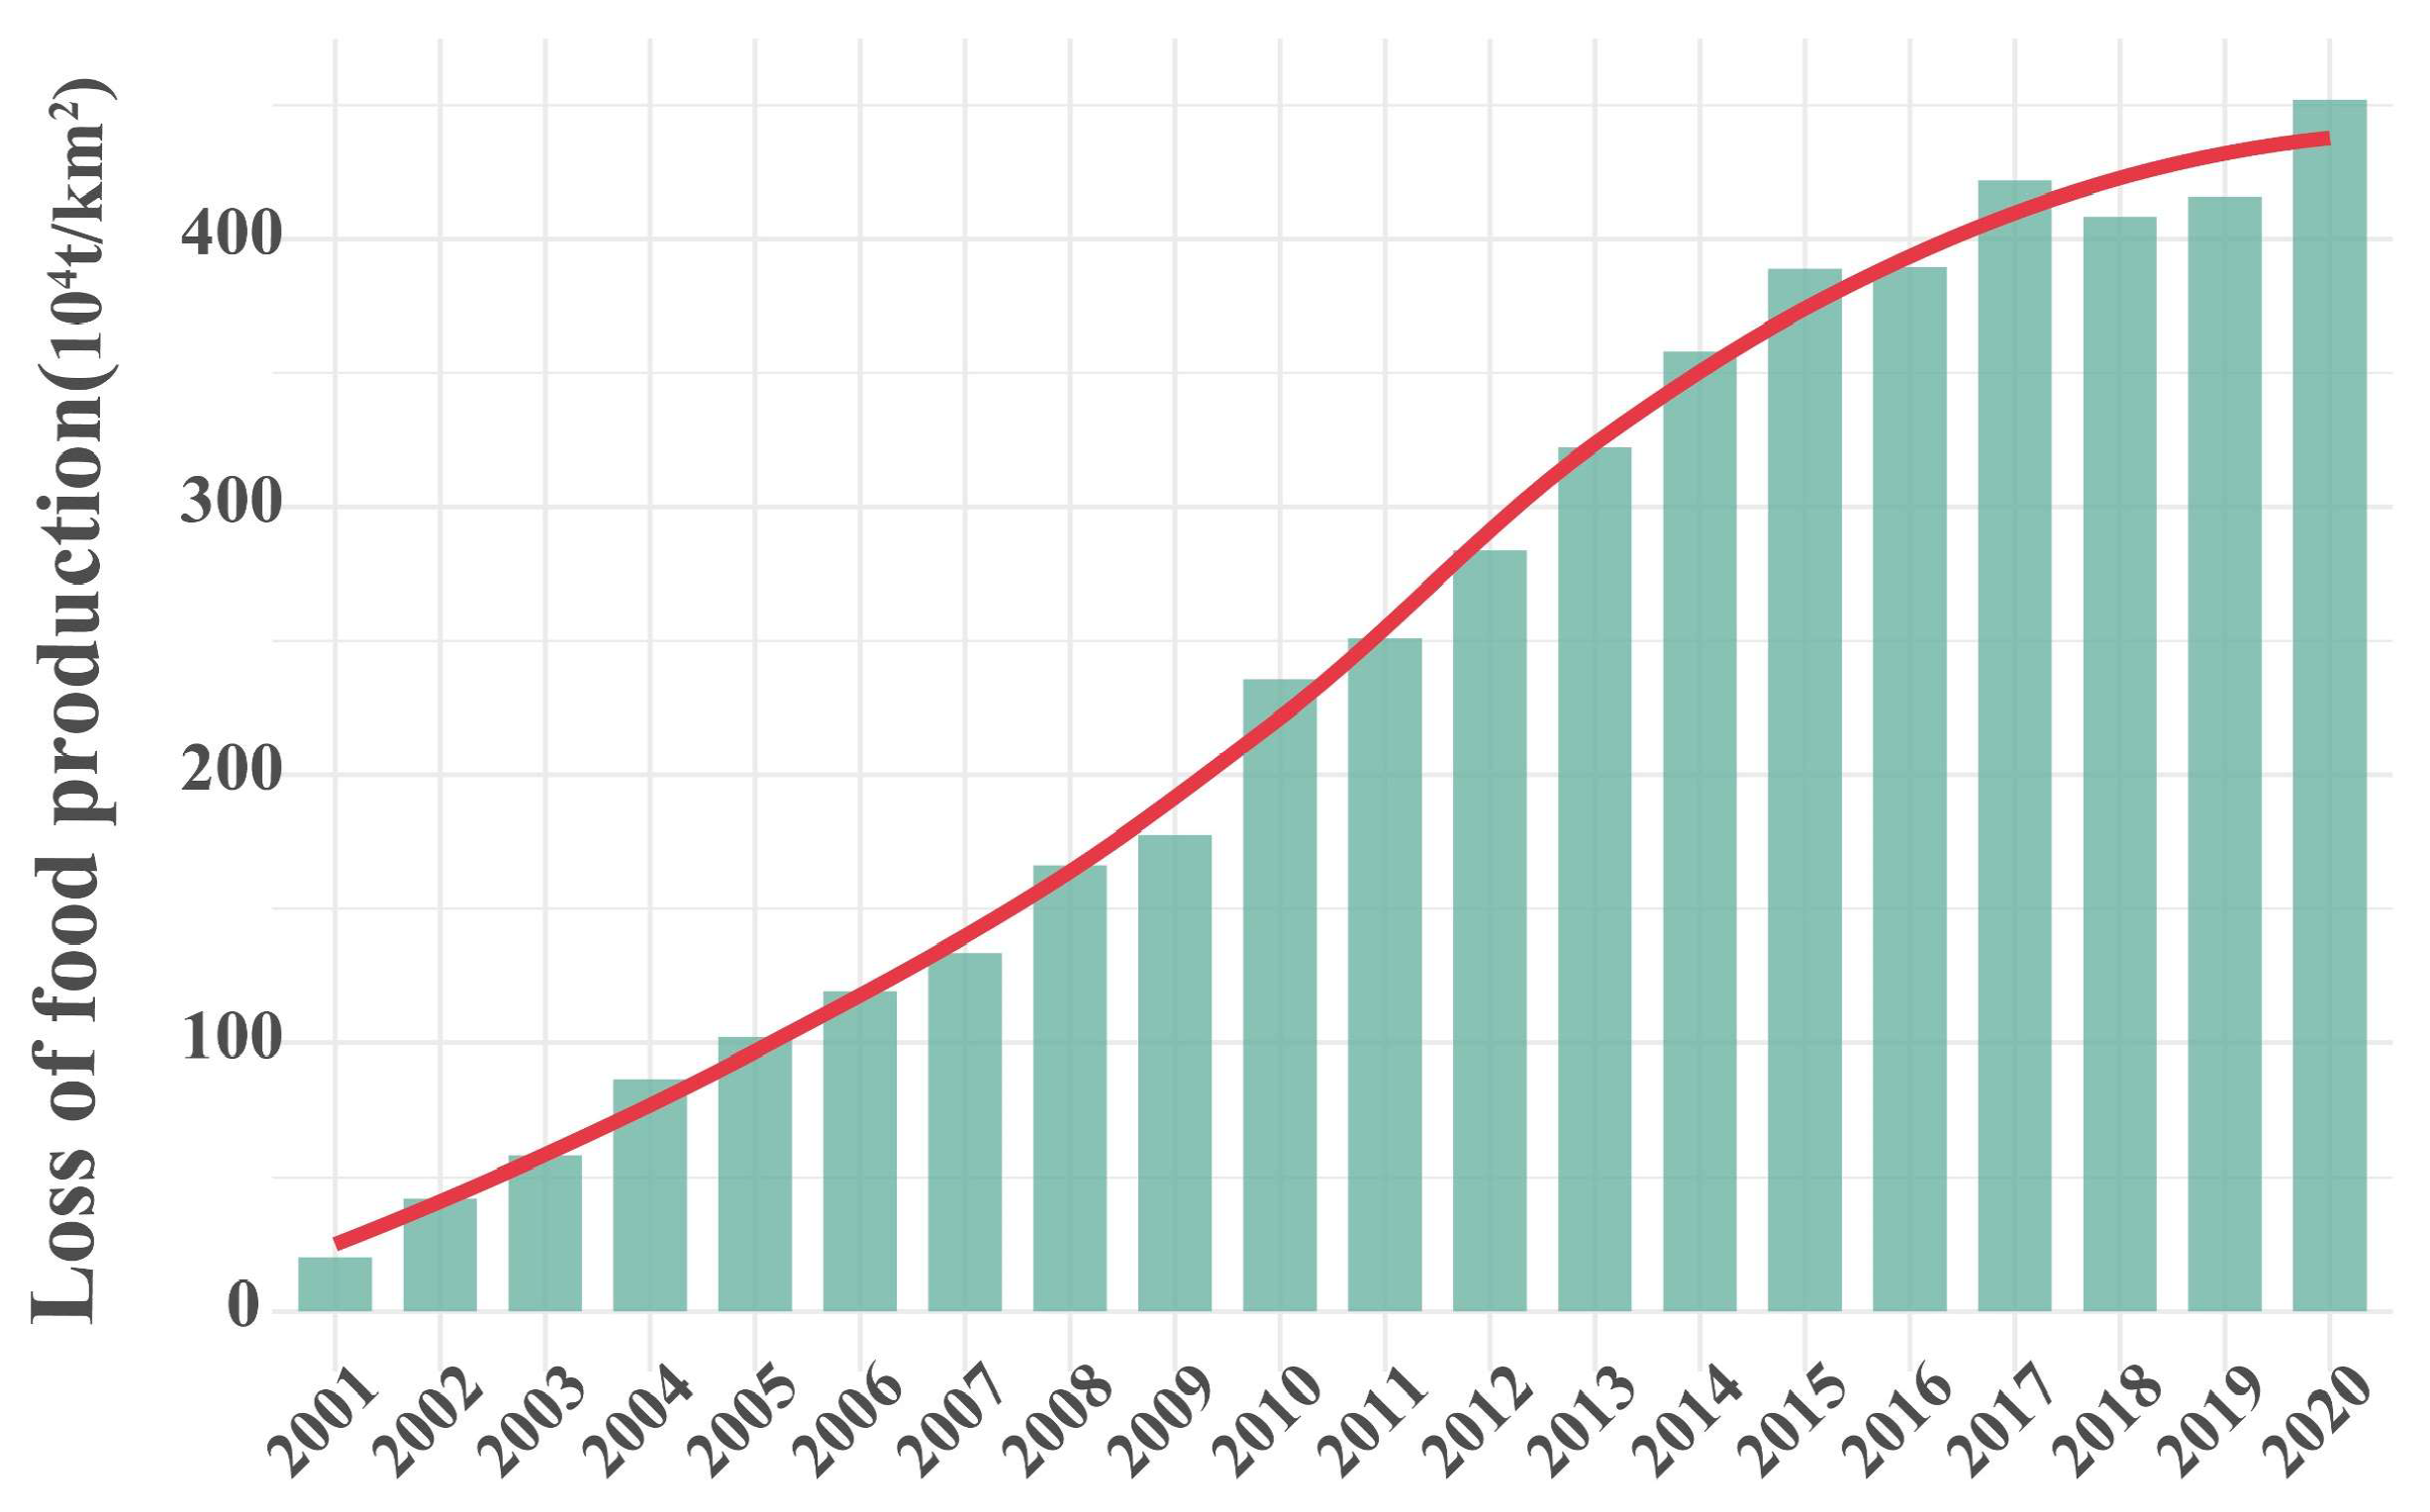
Figure 13 presents the grain production losses caused by CA in the Loess Plateau from 2001 to 2020. The temporal dynamics reveal a fluctuating yet generally increasing trend. From 2001 to 2004, yield losses remained relatively stable at low levels (<100 t). This phase coincided with limited rural labor outmigration and relatively high cropland utilization intensity, when abandonment was not yet widespread, thus exerting only minor impacts on grain production.
Between 2005 and 2013, losses entered a phase of fluctuating increase, surpassing 200 t after 2010. This trend overlapped with accelerated industrialization and urbanization, during which low-yield cropland lacking sufficient labor support became increasingly prone to abandonment. During 2014–2020, losses remained high, with values between 300–400 t during 2014–2016, a slight decline in 2017–2018, and nearly 450 t in 2020. However, the growth rate of losses gradually slowed, likely reflecting the effects of national policies targeting CA, which encouraged the re-CA, enhanced farmers’ incentives, and reduced the pace of new abandonment, thereby mitigating the growth rate of yield losses.

4.4.2. Impacts on per Capita Carrying Capacity

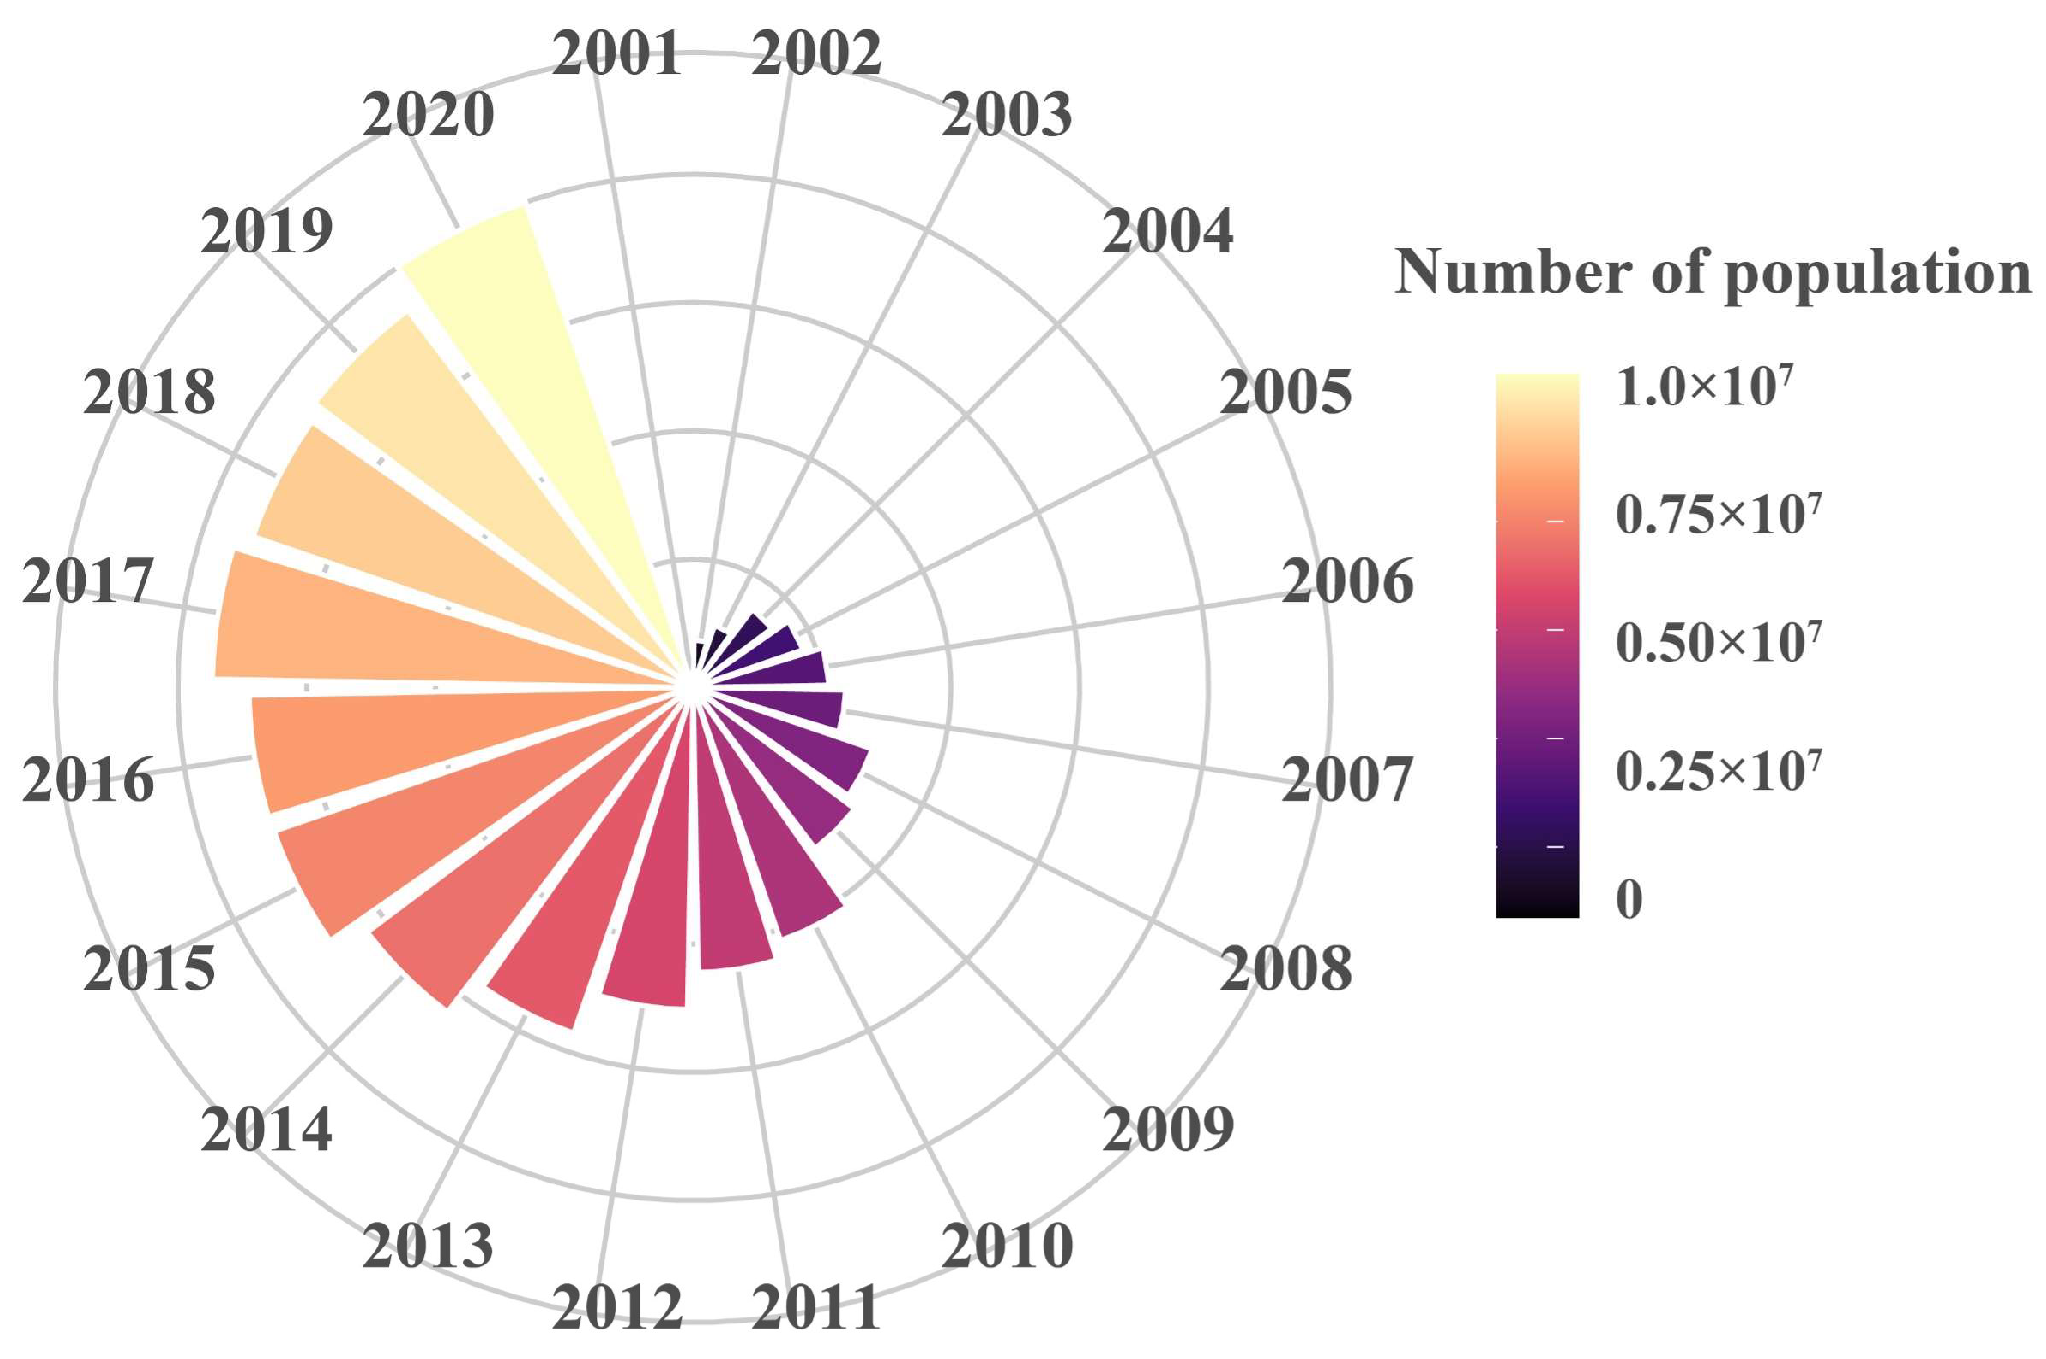
Based on the yield losses induced by CA from 2001 to 2020, we further analyzed the effects on per capita carrying capacity (Figure 14). Overall, the impacts displayed pronounced temporal dynamics, with an overall upward trend. From 2001 to 2005, per capita carrying capacity indicators (e.g., per capita grain availability) remained stable, rising from 0.0399 × 10⁷ to 0.2041 × 10⁷. During this stage, CA was limited in scale, exerting negligible effects on carrying capacity, and regional food supply was generally able to meet population demand.
Between 2006 and 2015, the expansion of abandonment (consistent with yield loss trends) led to stage-specific declines and localized stress, with carrying capacity falling to 0.777 × 10⁷ in 2015. In some years (e.g., 2009–2012), fluctuations occurred due to reductions in effective FP area.
From 2016 to 2020, the negative effects of abandonment on carrying capacity gradually weakened. Yield losses narrowed, providing supply-side support for improvements in carrying capacity. Overall, the impacts of CA on per capita carrying capacity in the Loess Plateau were largely driven by changes in the scale of CA. With the implementation of abandonment management policies in the later years, the region progressively alleviated the pressure on per capita carrying capacity, thereby laying a foundation for safeguarding food security.

4.5. Driving Mechanisms of Cropland Abandonment

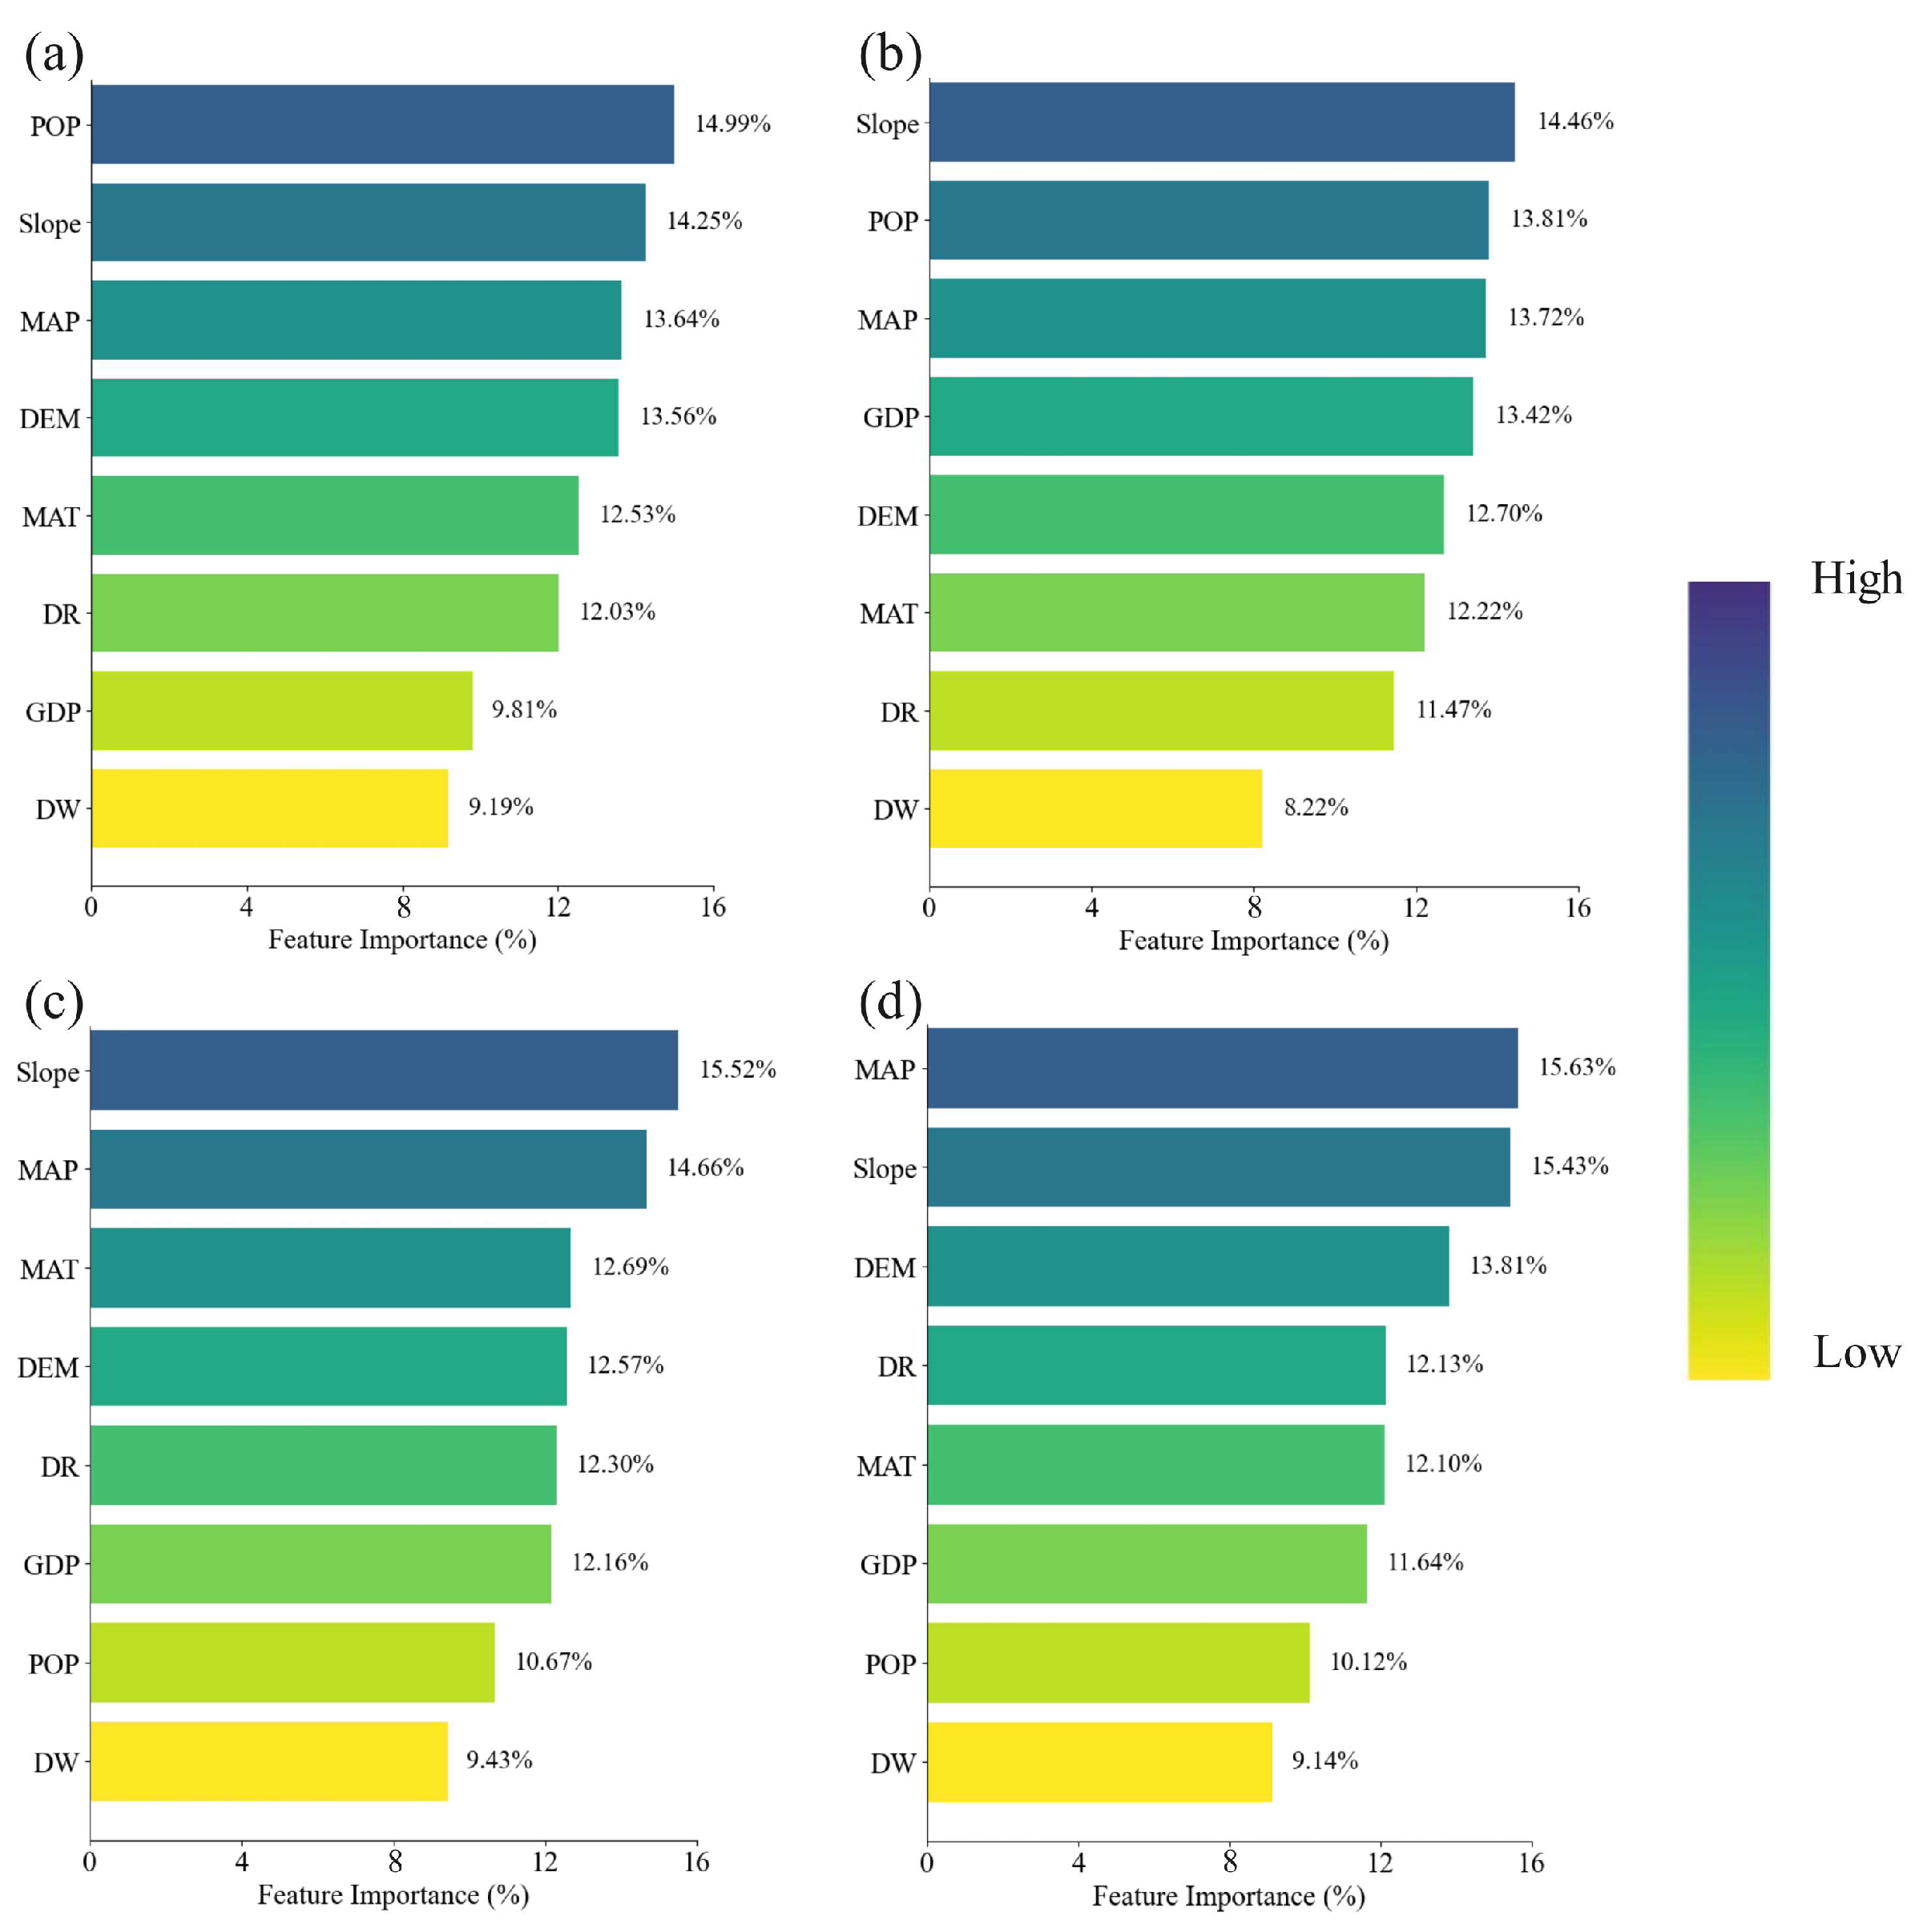
Using the RF algorithm, we assessed the relative importance of different driving factors influencing CA in the Loess Plateau (Figure 15). Higher values indicate greater influence. The results demonstrate substantial temporal variation in the contributions of these factors, reflecting the combined effects of natural conditions and socio-economic dynamics.
Analysis of the period of 2005–2020 revealed a clear temporal shift in key drivers. In 2005, population density (14.99%), slope (14.25%), and mean annual precipitation (13.64%) were the dominant factors. By 2010, slope (14.46%), population density (13.81%), and mean annual precipitation (13.72%) remained most influential. In 2015, slope (15.52%), mean annual precipitation (14.66%), and mean annual temperature (12.69%) emerged as the leading drivers. By 2020, mean annual precipitation (15.63%), slope (15.43%), and elevation (DEM, 13.81%) became the most important contributors.
Over the 2005–2020 period, the relative contributions of factor groups exhibited distinct dynamics. Socio-economic factors (population density and GDP) first increased and then declined, peaking in 2010 at 27.23%. Population density declined from 14.99% in 2005 to 10.12% in 2020, indicating a reduced demographic pressure on CA. GDP displayed more volatile fluctuations, following a rise–fall trajectory. Topographic factors (DEM and slope) increased steadily from 27.81% in 2005 to 29.24% in 2020. Slope consistently remained an important driver, rising from 14.25% in 2005 to 15.52% in 2015, before slightly declining to 15.43% in 2020. DEM gradually became more influential, reaching its highest contribution of 13.81% in 2020. Climatic factors (mean annual precipitation and mean annual temperature) also showed an upward trend, from 26.17% in 2005 to 27.73% in 2020. Mean annual temperature exerted its strongest influence in 2015, while precipitation displayed a continuous increase, rising from 13.64% to 15.63%. In contrast, accessibility factors (distance to major roads and rivers) exhibited relatively minor changes.
Overall, these results suggest that the dominant drivers of CA in the Loess Plateau have gradually shifted from socio-economic factors toward topographic and climatic factors, reflecting the region’s transition from human-driven land-use change to one increasingly constrained by natural conditions.

5. Discussion

5.1. Spatiotemporal Differentiation of Cropland Abandonment and Its Impacts on Grain Production

Between 2000 and 2020, CA in the Loess Plateau exhibited clear features of scale expansion, intensity escalation, and spatial clustering. Temporally, CA expanded from 2.72 Mha (2000–2005) to 6.96 Mha (2016–2020), with the share of high-level abandonment (≥8 years) rising from <20% in the early stage to 58.9% (4.79 Mha) (Figure 6). Two turning points were observed: 2008, coinciding with the large-scale implementation of the Grain-for-Green program [48], and 2014, associated with adjustments in cropland subsidy policies [49,50]. These shifts marked the transformation of abandonment from short-term fluctuations to long-term structural change. Spatially, CA transitioned from scattered patches in southern Ningxia and the hilly–gully region to contiguous high-level abandonment zones concentrated in northern Shaanxi, eastern Gansu, and along the middle reaches of the Yellow River, in alignment with regional topographic and climatic constraints.
The dynamic evolution of driving forces explains these differentiated patterns. In 2005, socio-economic factors dominated (population density contributing 14.99%), with labor outmigration driving the abandonment of marginal cropland [34]. After 2010, topographic (slope contribution rising from 14.25% to 15.43%) and climatic constraints (mean annual precipitation contribution increasing from 13.64% to 15.63%) became more prominent, rendering steep and remote cropland particularly vulnerable to abandonment. Accessibility factors (distance to major roads and rivers) remained stable at 8–12%, underscoring the fundamental role of transport and irrigation conditions in sustaining cropland use.
As a critical ecological policy for regulating the “orderly” pattern of CA, the Grain for Green Project exerts a pivotal regulatory function [1]. Specifically, the cumulative implementation area of the project had exceeded 3.4 million hectares by 2018 (spanning 2000–2018), with 80% of this area converted to grassland. Such a conversion pattern exhibits high compatibility with the ecological carrying capacity of the arid and semi-arid climate in the Loess Plateau, thereby effectively interrupting the vicious cycle of “unordered land abandonment and intensified soil erosion”. After 2006, the area of forestland conversion under the project gradually expanded, reaching 530,000 hectares in 2020. This shift explicitly reflects the policy’s adjustment orientation, transitioning from “single-dimensional ecological restoration” to “ecological-production synergy”. For example, in the southern hilly regions of the Loess Plateau, the “Grain for Green + economic forest” model [51] not only reduced the extent of CA but also increased farmers’ economic returns, thus achieving a balance between ecological benefits and livelihood-related benefits.
Meanwhile, the re-CA is characterized by “effective short-term compensation yet limited long-term restoration” [42]. Re-cultivated areas are primarily concentrated in regions with gentle topography and superior irrigation conditions, such as the valley along the main course of the Yellow River and the edge of the Jinzhong Basin. After 2016, the re-cultivation rate rose from 12% to 23.4%—a trend primarily driven by the dual impetus of grain subsidy policies and the Rural Revitalization Strategy. However, in terms of re-cultivation targets, the majority focus on medium-low grade abandoned land (abandonment duration: 1–7 years), while the re-cultivation rate for high-grade abandoned land (abandonment duration: ≥8 years) remains below 5%. The core cause stems from the reduction in soil fertility and the natural restoration of vegetation induced by long-term abandonment, which significantly elevates the costs and difficulties associated with re-cultivation. This indicates that the current re-cultivation policy remains inadequate in its restoration capacity for “deeply abandoned land”.
A more in-depth analysis of the variations in policy responsiveness across different grades of abandoned land reveals that the driving mechanism of medium-grade abandoned land (abandonment duration: 4–7 years) encompasses dual attributes: policy guidance and the trade-off of farmers’ economic interests. An increase in policy subsidies directly enhances the economic incentives for farmers to participate in the Grain for Green Project, rendering this category of abandoned land the most responsive to policy regulation. In contrast, for high-grade abandoned land (abandonment duration: ≥8 years), long-term abandonment has led to severe soil degradation; even with increased policy subsidies, farmers’ willingness to either re-cultivate the land or participate in the Grain for Green Project remains constrained by soil quality, ultimately limiting the incentive effects of policies. To address this, future efforts should integrate supporting soil improvement measures with existing policy subsidies to further strengthen the regulatory impact on high-grade abandoned land.
The impacts of abandonment on food security displayed a “loss increase—growth slowdown” pattern. Between 2001 and 2020, yield losses rose from <100 t/km2 to nearly 450 t/km2. Rapid growth occurred during 2005–2013, overlapping with accelerated urbanization and labor outmigration. After 2014, annual loss growth decelerated from 15% to 5%, reflecting the effectiveness of cropland protection subsidies and re-cultivation incentives [24]. Spatially, yield loss hotspots coincided with high-level abandonment areas (northern Shaanxi, eastern Gansu, >60% of total loss), whereas the southern tableland areas offset losses through re-cultivation and technological improvements (e.g., water-saving irrigation). Per Capita carrying capacity showed a “stress alleviation” trend: stable during 2001–2005, declined sharply by 2015 due to expansion of abandonment (down to 0.777 × 10⁷), and recovered after 2016, exceeding 0.5 × 107 by 2020, suggesting that integrated “abandonment control + agricultural enhancement” can balance ecological protection with food security.

5.2. Policy Optimization Pathways for Agricultural Sustainability

Addressing the challenges of limited recovery in high-level abandonment and insufficient restoration in low- to medium-level abandonment requires a tiered and differentiated re-cultivation strategy. For high-level abandonment areas (≥8 years), an “ecology-first, moderate-use” approach is recommended, such as integrating abandoned cropland with ecological livestock farming in the hilly–gully region [52], where leguminous forages can improve soil fertility while delivering both ecological and economic benefits. For medium-level abandonment (4–7 years), a “policy incentive + technical support” model should be adopted, with targeted subsidies, water-saving irrigation (e.g., drip irrigation), and drought-tolerant crops (e.g., millet) to promote sustainable re-cultivation. For low-duration cropland abandonment (1–3 years), a “government-guided, collective-led, and entity-operated” short-term custody mechanism can be introduced [53]: Village collectives take the lead in conducting surveys of idle cropland, establishing account books, and signing custody agreements (with a custody period of 1–3 years) with new-type agricultural business entities such as family farms and cooperatives; the government subsidizes the custody management fees at a certain amount per mu, requires the custody entities to carry out basic management and protection (e.g., weeding, soil moisture monitoring), and prohibits cropland hardening or overgrowth of weeds; every quarter, township-level agricultural departments conduct acceptance inspections to ensure that short-term abandonment does not transition to long-term degradation.
Current policies suffer from a disconnection between ecological restoration and cropland protection, necessitating an integrated framework that aligns “dual security” goals for ecology and food. First, ecological projects such as Grain-for-Green should embed cropland protection thresholds, e.g., designating priority farming zones for slopes <15° to avoid converting high-quality cropland. Second, a dynamic “monitoring–policy adjustment” mechanism should be established: if annual new abandonment exceeds 5%, intervention should be triggered through recalibrated subsidies and ecological compensation. Third, linking cropland protection with ecosystem service value realization is essential: for instance, carbon sinks generated by re-cultivation could be integrated into carbon trading schemes, with revenues reinvested into cropland restoration, thereby attracting private capital.
Given the shift in drivers from socio-economic to topographic–climatic, a sustainable management system based on evolving drivers is needed. In topographically constrained zones (slopes ≥ 15°), integrated “soil conservation + land use” technologies (e.g., terracing, forage crops) should be promoted [47]. In climate-sensitive areas (with annual precipitation < 400 mm), priority should be given to matching water resources with land use: the combined technology of “rainwater cellars + fish-scale pits” can be adopted for rainwater harvesting; for dryland farming, the model of “no-till cover + drought-tolerant crops” can be promoted. Specifically, this model involves retaining crop residues to cover the soil surface to reduce evaporation, matching local drought-tolerant crops such as foxtail millet and broomcorn millet, and combining soil-test-based formulated fertilization to improve unit yield, so as to adapt to the regional water resource endowment.
On a global scale, CA has emerged as a prevalent eco-agricultural challenge confronting diverse regional types, including ecologically fragile areas, labor-outflow regions, and policy-intervention zones. While the core drivers underpinning CA—such as climatic stress, population migration, and policy guidance—exhibit regional variations, governance endeavors universally adhere to the core principle of “problem-oriented and solution-adapted.” Drawing on insights into the driving mechanisms of CA on the Loess Plateau and empirical governance practices characterized by “classified governance and mechanism empowerment,” this study further extends these findings to propose governance implications that integrate academic referential value and practical feasibility for three typical global CA scenarios, thereby offering a framework for differentiated responses to cross-border farmland abandonment issues.
Against this backdrop, tailored governance strategies are designed to address distinct global CA contexts: Ecologically fragile areas (e.g., the Sahel region in Africa, the Andes Mountains in South America) confront persistent challenges of frequent droughts and impoverished soil conditions. CA in such regions exacerbates desertification risks, while necessitating a balance between ecological conservation and food security. Here, the “abandonment classification-functional adaptation” approach serves as a valuable reference: specifically, for cropland parcels abandoned for ≥8 years with severe soil degradation, ecological restoration should prioritize the use of native nitrogen-fixing plants (e.g., Acacia Senegal in the Sahel); whereas for parcels abandoned for <8 years with relatively intact soil conditions, the promotion of stress-tolerant agricultural technologies should be centered on local staple crops (e.g., sorghum in the Sahel, potatoes in the Andes). Regions experiencing substantial labor outflow (e.g., mountainous regions in Southern Europe, rural areas in Southeast Asia) grapple with “passive idleness” of cropland, driven by the migration of working-age populations. In such contexts, short-term abandonment is prone to escalation into long-term dereliction, while safeguarding farmers’ land rights and interests remains a key consideration. The “entrustment empowerment-dynamic monitoring” model is applicable here: governments take the lead in establishing cross-regional farmland entrustment platforms, integrating resources from agricultural enterprises and cooperatives to deliver end-to-end services (e.g., cultivation, crop management, and harvest with profit-sharing); concurrently, a quarterly monitoring system is developed leveraging Landsat-8/9 and Sentinel-2 remote sensing data, which identifies early-stage abandonment Via the NDVI to prevent the conversion of idle cropland into ecologically degraded abandoned land. For policy-driven abandonment regions (e.g., fallow and conservation tillage zones in the North American Great Plains), policy misalignment has emerged, as the primary drivers of abandonment have shifted from socioeconomic factors (e.g., low agricultural profitability relative to opportunity costs) to climatic stressors (e.g., drought and water scarcity). The “dynamic adaptation” principle can be employed to refine subsidy policies in response to these shifting drivers—for instance, introducing supplementary subsidies for irrigation infrastructure development in climate-vulnerable zones—coupled with the establishment of a policy evaluation mechanism. This mechanism incorporates farmer surveys, remote sensing validation, and economic benefit assessments to enhance the precision and long-term sustainability of governance efforts.

5.3. Limitations and Future Directions

This study has several limitations. First, although 30 m Landsat data improved the accuracy of abandonment detection, the complex terrain of the Loess Plateau (e.g., deep gullies, shaded areas) may still cause boundary misclassification. Moreover, seasonal versus permanent abandonment was not differentiated, leaving room for finer classification. Second, the grain production estimates relied on NDVI and county-level yield data, without accounting for crop-type heterogeneity (e.g., wheat, maize, millet) or agricultural inputs (e.g., fertilizer, mechanization), potentially leading to over- or under-estimation of yield losses. Third, the Random Forest model primarily incorporated macro-level variables (topography, climate, socio-economics) but lacked household-level behavioral data (e.g., cropping intentions, income structures), limiting the ability to fully capture the transmission mechanisms between macro drivers and micro decision-making. Finally, this study focused on the Loess Plateau as a whole, without fully examining subregional heterogeneity (e.g., northern hilly region, Weibei tablelands).
Future research should address these gaps through several avenues. Methodologically, combining high-resolution UAV imagery (0.1–0.5 m) with field surveys could enhance boundary detection, while phenological differences could help distinguish seasonal from permanent abandonment. Data-wise, integrating household survey data (e.g., questionnaires, interviews) would enable coupling models that bridge macro drivers with micro decision-making. In terms of scope, extending analysis to subregions would uncover differentiated abandonment dynamics across geomorphic units, while incorporating CMIP6 climate scenarios would allow forecasting of future abandonment trajectories and food security risks over the next 30 years. In application, developing a “abandonment monitoring–policy simulation” decision-support system could provide visualization tools to support precision policymaking and foster the translation of research findings into practice.

6. Conclusions

This study developed a multi-type CA identification system tailored to the complex terrain of the Loess Plateau, integrating annual, multi-year, Grain-for-Green, and re-cultivation types. This framework overcomes the limitations of conventional approaches that often rely on static characterization and type generalization. Using long-term datasets (2000–2020), we quantitatively revealed, for the first time, the dynamic shift in abandonment drivers from socioeconomic dominance to topographic–climatic dominance, filling a critical knowledge gap in fragile ecological regions of the Loess Plateau. Furthermore, by establishing a quantitative model linking abandonment to grain production and Per Capita carrying capacity, this study provides an empirical basis for balancing ecological protection and food security. The findings not only offer methodological innovations for targeted CA management in the Loess Plateau but also provide a transferable paradigm for sustainable cropland use and food security assurance in other ecologically vulnerable regions across China.
From 2000 to 2023, CA in the Loess Plateau exhibited clear features of scale expansion, intensity escalation, and spatial clustering. The abandoned area expanded from 2.72 Mha to 6.96 Mha, with high-level abandonment (≥8 years) accounting for 58.9%, primarily concentrated in the hilly–gully region of northern Shaanxi and eastern Gansu. Driving factors shifted markedly: while population density (14.99%) dominated in 2005, slope (15.43%) and mean annual precipitation (15.63%) emerged as the core drivers by 2020. The Grain-for-Green program (peaking at 3.40 Mha) effectively curbed disorderly abandonment, while re-cultivation (23.4% in 2022) contributed to restoring low- and medium-level abandoned land, though it remained insufficient to reverse long-term abandonment. Grain production losses increased from <100 t/km2 to nearly 450 t/km2 during 2001–2020, but growth slowed after 2016, accompanied by a gradual alleviation of Per Capita carrying capacity pressure. Overall, the results demonstrate that achieving synergistic development of abandonment control and food security in the Loess Plateau requires a strategy of precise re-cultivation, policy coordination, and long-term stewardship.

Funding

This work was supported by the Third Comprehensive Scientific Investigation in Xinjiang of China (Grant No. 2022xjkk0905), and the National Natural Science Foundation of China (Grant No. 41671177).

Data Availability Statement

The data that support the findings of this study are available from the corresponding author, upon reasonable request.

Conflicts of Interest

The author declares that he has no known competing financial interests or personal relationships that could have appeared to influence the work reported in this paper.

References

  1. Song, H.; Li, X.; Xin, L.; Dong, S.; Wang, X. Conflicts between ecological and agricultural production functions: The impact of the Grain for Green Program and wildlife damage on cropland abandonment in China’s mountainous areas. Land Use Policy 2025, 153, 107552. [Google Scholar] [CrossRef]
  2. Shi, T.; Li, X.; Xin, L.; Xu, X. The spatial distribution of CA and its influential factors at the township level: A case study in the mountainous area of China. Land Use Policy 2018, 70, 510–520. [Google Scholar] [CrossRef]
  3. Chen, G.; Li, X.; Liu, X.; Chen, Y.; Liang, X.; Leng, J.; Xu, X.; Liao, W.; Qiu, Y.A.; Wu, Q. Global projections of future urban land expansion under shared socioeconomic pathways. Nat. Commun. 2020, 11, 537. [Google Scholar] [CrossRef]
  4. Liu, F.; Zhang, Z.; Zhao, X.; Wang, X.; Zuo, L.; Wen, Q.; Yi, L.; Xu, J.; Hu, S.; Liu, B. Chinese cropland losses due to urban expansion in the past four decades. Sci. Total Environ. 2019, 650, 847–857. [Google Scholar] [CrossRef]
  5. Juknelienė, D.; Narmontienė, V.; Valčiukienė, J.; Mozgeris, G. Driving Forces of Agricultural Land Abandonment: A Lithuanian Case. Land 2025, 14, 899. [Google Scholar] [CrossRef]
  6. Qiu, B.; Li, H.; Tang, Z.; Chen, C.; Berry, J. How cropland losses shaped by unbalanced urbanization process? Land Use Policy 2020, 96, 104715. [Google Scholar] [CrossRef]
  7. Guo, A.; Yue, W.; Yang, J.; Xue, B.; Xiao, W.; Li, M.; He, T.; Zhang, M.; Jin, X.; Zhou, Q. Cropland abandonment in China: Patterns, drivers, and implications for food security. J. Clean. Prod. 2023, 418, 138154. [Google Scholar] [CrossRef]
  8. Han, Z.; Song, W. Abandoned cropland: Patterns and determinants within the Guangxi karst mountainous area, China. Appl. Geogr. 2020, 122, 102245. [Google Scholar] [CrossRef]
  9. Liu, G.; Ma, Z.; Guo, S.; Deng, X.; Song, J.; Xu, D. How does farmers’ differentiation affect CA from the perspective of land attachment and generational differences? Evidence from Sichuan Province, China. Environ. Dev. 2023, 48, 100924. [Google Scholar] [CrossRef]
  10. Song, H.; Li, X.; Xin, L.; Wang, X. Improving mechanization conditions or encouraging non-grain crop production? Strategies for mitigating CA in China’s mountainous areas. Land Use Policy 2025, 149, 107421. [Google Scholar] [CrossRef]
  11. Li, S.; Li, X.; Sun, L.; Cao, G.; Fischer, G.; Tramberend, S. An estimation of the extent of cropland abandonment in mountainous regions of China. Land Degrad. Dev. 2018, 29, 1327–1342. [Google Scholar] [CrossRef]
  12. Sun, Y.; Miao, Y.; Xie, Z.; Jiang, X. Address the challenge of cultivated land abandonment by cultivated land adoption: An evolutionary game perspective. Land Use Policy 2025, 149, 107412. [Google Scholar] [CrossRef]
  13. Kolecka, N. Height of successional vegetation indicates moment of agricultural land abandonment. Remote Sens. 2018, 10, 1568. [Google Scholar] [CrossRef]
  14. Yin, H.; Prishchepov, A.V.; Kuemmerle, T.; Bleyhl, B.; Buchner, J.; Radeloff, V.C. Mapping agricultural land abandonment from spatial and temporal segmentation of Landsat time series. Remote Sens. Environ. 2018, 210, 12–24. [Google Scholar] [CrossRef]
  15. Lu, D.; Su, K.; Wang, Z.; Hou, M.; Li, X.; Lin, A.; Yang, Q. Patterns and drivers of terrace abandonment in China: Monitoring based on multi-source remote sensing data. Land Use Policy 2025, 148, 107388. [Google Scholar] [CrossRef]
  16. Song, W. Mapping cropland abandonment in mountainous areas using an annual land-use trajectory approach. Sustainability 2019, 11, 5951. [Google Scholar] [CrossRef]
  17. Huang, Q.; Song, W. A land-use spatial optimum allocation model coupling a multi-agent system with the shuffled frog leaping algorithm. Comput. Environ. Urban Syst. 2019, 77, 101360. [Google Scholar] [CrossRef]
  18. Prishchepov, A.V.; Radeloff, V.C.; Dubinin, M.; Alcantara, C. The effect of Landsat ETM/ETM+ image acquisition dates on the detection of agricultural land abandonment in Eastern Europe. Remote Sens. Environ. 2012, 126, 195–209. [Google Scholar] [CrossRef]
  19. Zhao, X.; Wu, T.; Wang, S.; Liu, K.; Yang, J. Cropland abandonment mapping at sub-pixel scales using crop phenological information and MODIS time-series images. Comput. Electron. Agric. 2023, 208, 107763. [Google Scholar] [CrossRef]
  20. Löw, F.; Prishchepov, A.V.; Waldner, F.; Dubovyk, O.; Akramkhanov, A.; Biradar, C.; Lamers, J.P. Mapping cropland abandonment in the Aral Sea Basin with MODIS time series. Remote Sens. 2018, 10, 159. [Google Scholar] [CrossRef]
  21. Zhu, X.; Xiao, G.; Zhang, D.; Guo, L. Mapping abandoned cropland in China using time series MODIS NDVI. Sci. Total Environ. 2021, 755, 142651. [Google Scholar] [CrossRef]
  22. Liu, B.; Song, W. Mapping abandoned cropland using Within-Year Sentinel-2 time series. Catena 2023, 223, 106924. [Google Scholar] [CrossRef]
  23. Hauser, L.T.; Timmermans, J.; Soudzilovskaia, N.A.; van Bodegom, P.M. Linking land use and plant functional diversity patterns in sabah, borneo, through large-scale spatially continuous sentinel-2 inference. Land 2022, 11, 572. [Google Scholar] [CrossRef]
  24. Song, W.; Yang, D.; Wang, Y. Integrating an abandoned cropland simulation model (AFSM) using system dynamics and CLUE-S for sustainable agriculture. Agric. Syst. 2024, 219, 104063. [Google Scholar] [CrossRef]
  25. Quintas-Soriano, C.; Buerkert, A.; Plieninger, T. Effects of land abandonment on nature contributions to people and good quality of life components in the Mediterranean region: A review. Land Use Policy 2022, 116, 106053. [Google Scholar] [CrossRef]
  26. Shiferaw, B.; Holden, S.T. Policy instruments for sustainable land management: The case of highland smallholders in Ethiopia. Agr. Econ.-Blackwell 2000, 22, 217–232. [Google Scholar] [CrossRef]
  27. Nie, X.; Wu, X.; Wang, H.; Kang, Q.; Li, F.; Li, L.; Qiao, H. What psychological factors lead to the abandonment of cultivated land by coastal farmers? An interpretation based on the psychological distance. J. Risk Res. 2023, 26, 947–968. [Google Scholar] [CrossRef]
  28. Wu, X.; Zhao, N.; Wang, Y.; Ye, Y.; Wang, W.; Yue, T.; Zhang, L.; Liu, Y. The potential role of abandoned cropland for food security in China. Resour. Conserv. Recycl. 2025, 212, 108004. [Google Scholar] [CrossRef]
  29. Wang, Y.; Yang, A.; Yang, Q. The extent, drivers and production loss of CA in China: Evidence from a spatiotemporal analysis of farm households survey. J. Clean. Prod. 2023, 414, 137772. [Google Scholar] [CrossRef]
  30. Guo, H.; Sun, L.; Yao, A.; Chen, Z.; Feng, H.; Wu, S.; Siddique, K.H. Abandoned terrace recognition based on deep learning and change detection on the Loess Plateau in China. Land Degrad. Dev. 2023, 34, 2349–2365. [Google Scholar] [CrossRef]
  31. Liu, Z.; Wang, J.; Wang, X.; Wang, Y. Understanding the impacts of ‘Grain for Green’land management practice on land greening dynamics over the Loess Plateau of China. Land Use Policy 2020, 99, 105084. [Google Scholar] [CrossRef]
  32. Deng, L.; Shangguan, Z.; Sweeney, S. Changes in soil carbon and nitrogen following land abandonment of cropland on the Loess Plateau, China. PLoS ONE 2013, 8, e71923. [Google Scholar] [CrossRef]
  33. Wang, Y.; Song, W. Mapping abandoned cropland changes in the hilly and gully region of the Loess Plateau in China. Land 2021, 10, 1341. [Google Scholar] [CrossRef]
  34. Song, H.; Li, X.; Zhang, F.; Gu, P.; Chen, Y.; Wu, H.; Xin, L.; Lu, Y.; Liu, Y.; Wang, X. Understanding the spatial distribution patterns and dominant determinants of CA in China. Habitat Int. 2025, 156, 103298. [Google Scholar] [CrossRef]
  35. Xue, P.; Han, X.; Wang, Y.; Wang, X. Can agricultural machinery harvesting services reduce cropland abandonment? Evidence from rural China. Agriculture 2022, 12, 901. [Google Scholar] [CrossRef]
  36. Zhao, C.; Hou, X.; Guo, Q.; Yue, Y.; Wu, J.; Cao, Y.; Wang, Q.; Li, C.; Wang, Z.; Fan, X. Switchgrass establishment can ameliorate soil properties of the abandoned cropland in northern China. Agriculture 2022, 12, 1138. [Google Scholar] [CrossRef]
  37. Jiao, J.; Zhang, Z.; Bai, W.; Jia, Y.; Wang, N. Assessing the Ecological Success of Restoration by Afforestation on the Chinese Loess Plateau. Restor. Ecol. 2012, 20, 240–249. [Google Scholar] [CrossRef]
  38. Li, Y.; Quine, T.A.; Yu, H.Q.; Govers, G.; Six, J.; Gong, D.Z.; Wang, Z.; Zhang, Y.Z.; Van Oost, K. Sustained high magnitude erosional forcing generates an organic carbon sink: Test and implications in the Loess Plateau, China. Earth Planet. Sci. Lett. 2015, 411, 281–289. [Google Scholar] [CrossRef]
  39. Yang, J.; Huang, X. 30 m annual land cover and its dynamics in China from 1990 to 2019. Earth Syst. Sci. Data Discuss. 2021, 1–29. [Google Scholar] [CrossRef]
  40. Chang, C.; Wang, Y.; Chen, S. Anomaly detection using causal sliding windows. IEEE J. Sel. Top. Appl. Earth Obs. Remote Sens. 2015, 8, 3260–3270. [Google Scholar] [CrossRef]
  41. Kulanuwat, L.; Chantrapornchai, C.; Maleewong, M.; Wongchaisuwat, P.; Wimala, S.; Sarinnapakorn, K.; Boonya-Aroonnet, S. Anomaly detection using a sliding window technique and data imputation with machine learning for hydrological time series. Water 2021, 13, 1862. [Google Scholar] [CrossRef]
  42. Zhang, M.; Li, G.; He, T.; Zhai, G.; Guo, A.; Chen, H.; Wu, C. Reveal the severe spatial and temporal patterns of abandoned cropland in China over the past 30 years. Sci. Total Environ. 2023, 857, 159591. [Google Scholar] [CrossRef]
  43. Guo, W.H.; Chen, F.; Yang, B.; Jiang, F.; Ma, J.; Zhu, X. Identification of spatial relationship and imbalance attribution between cropland supplementation and abandonment in China. China Land Sci. 2024, 38, 120–132. [Google Scholar]
  44. Peng, J.; Tian, L.; Liu, Y.; Zhao, M.; Hu, Y.; Wu, J. Ecosystem services response to urbanization in metropolitan areas: Thresholds identification. Sci. Total Environ. 2017, 607, 706–714. [Google Scholar] [CrossRef]
  45. Breiman, L. Random forests. Mach. Learn. 2001, 45, 5–32. [Google Scholar] [CrossRef]
  46. Chen, D.; Wang, X.; Luo, X.; Huang, G.; Tian, Z.; Li, W.; Liu, F. Delineating and identifying risk zones of soil heavy metal pollution in an industrialized region using machine learning. Environ. Pollut. 2023, 318, 120932. [Google Scholar] [CrossRef] [PubMed]
  47. He, S.; Qian, H.; Liu, Y.; Zhao, X.; Su, F.; Ma, H.; Guan, Z.; Zhang, T. Water conservation assessment and its influencing factors identification using the InVEST and random forest model in the northern piedmont of the Qinling Mountains. J. Hydrol. Reg. Stud. 2025, 57, 102194. [Google Scholar] [CrossRef]
  48. Ma, Y.; Huang, L.; Li, J.; Cao, W.; Cai, Y. Carbon potential of China’s Grain to Green Program and its contribution to the carbon target. Resour. Conserv. Recycl. 2024, 200, 107272. [Google Scholar] [CrossRef]
  49. Wang, W.; Wang, Y.; Shen, Y.; Cheng, L.; Qiao, J. The role of multi-category subsidies in cultivated land transfer decision-making of rural households in China: Synergy or trade-off? Appl. Geogr. 2023, 160, 103096. [Google Scholar] [CrossRef]
  50. Chen, S.; Pei, B. Spatial-temporal variations of cultivated land compensation and its compensation mechanism in mainland China. Environ. Impact Assess. Rev. 2025, 110, 107712. [Google Scholar] [CrossRef]
  51. Wu, Z.; Zeng, T.; Chen, H.; Zhang, X.; Yang, J.; Jin, S. Rural transformation in the hilly and mountainous region of southern China: Livelihood trajectory and cross-scale effects. Habitat Int. 2024, 144, 103011. [Google Scholar] [CrossRef]
  52. Qu, L.; Li, Y.; Yang, F.; Ma, L.; Chen, Z. Assessing sustainable transformation and development strategies for gully agricultural production: A case study in the Loess Plateau of China. Environ. Impact Assess. Rev. 2024, 104, 107325. [Google Scholar] [CrossRef]
  53. Zheng, L.; Jin, S.; Su, L. Of nothing comes nothing: The impact of agricultural comparative return on cropland abandonment. J. Rural. Stud. 2025, 119, 103759. [Google Scholar] [CrossRef]
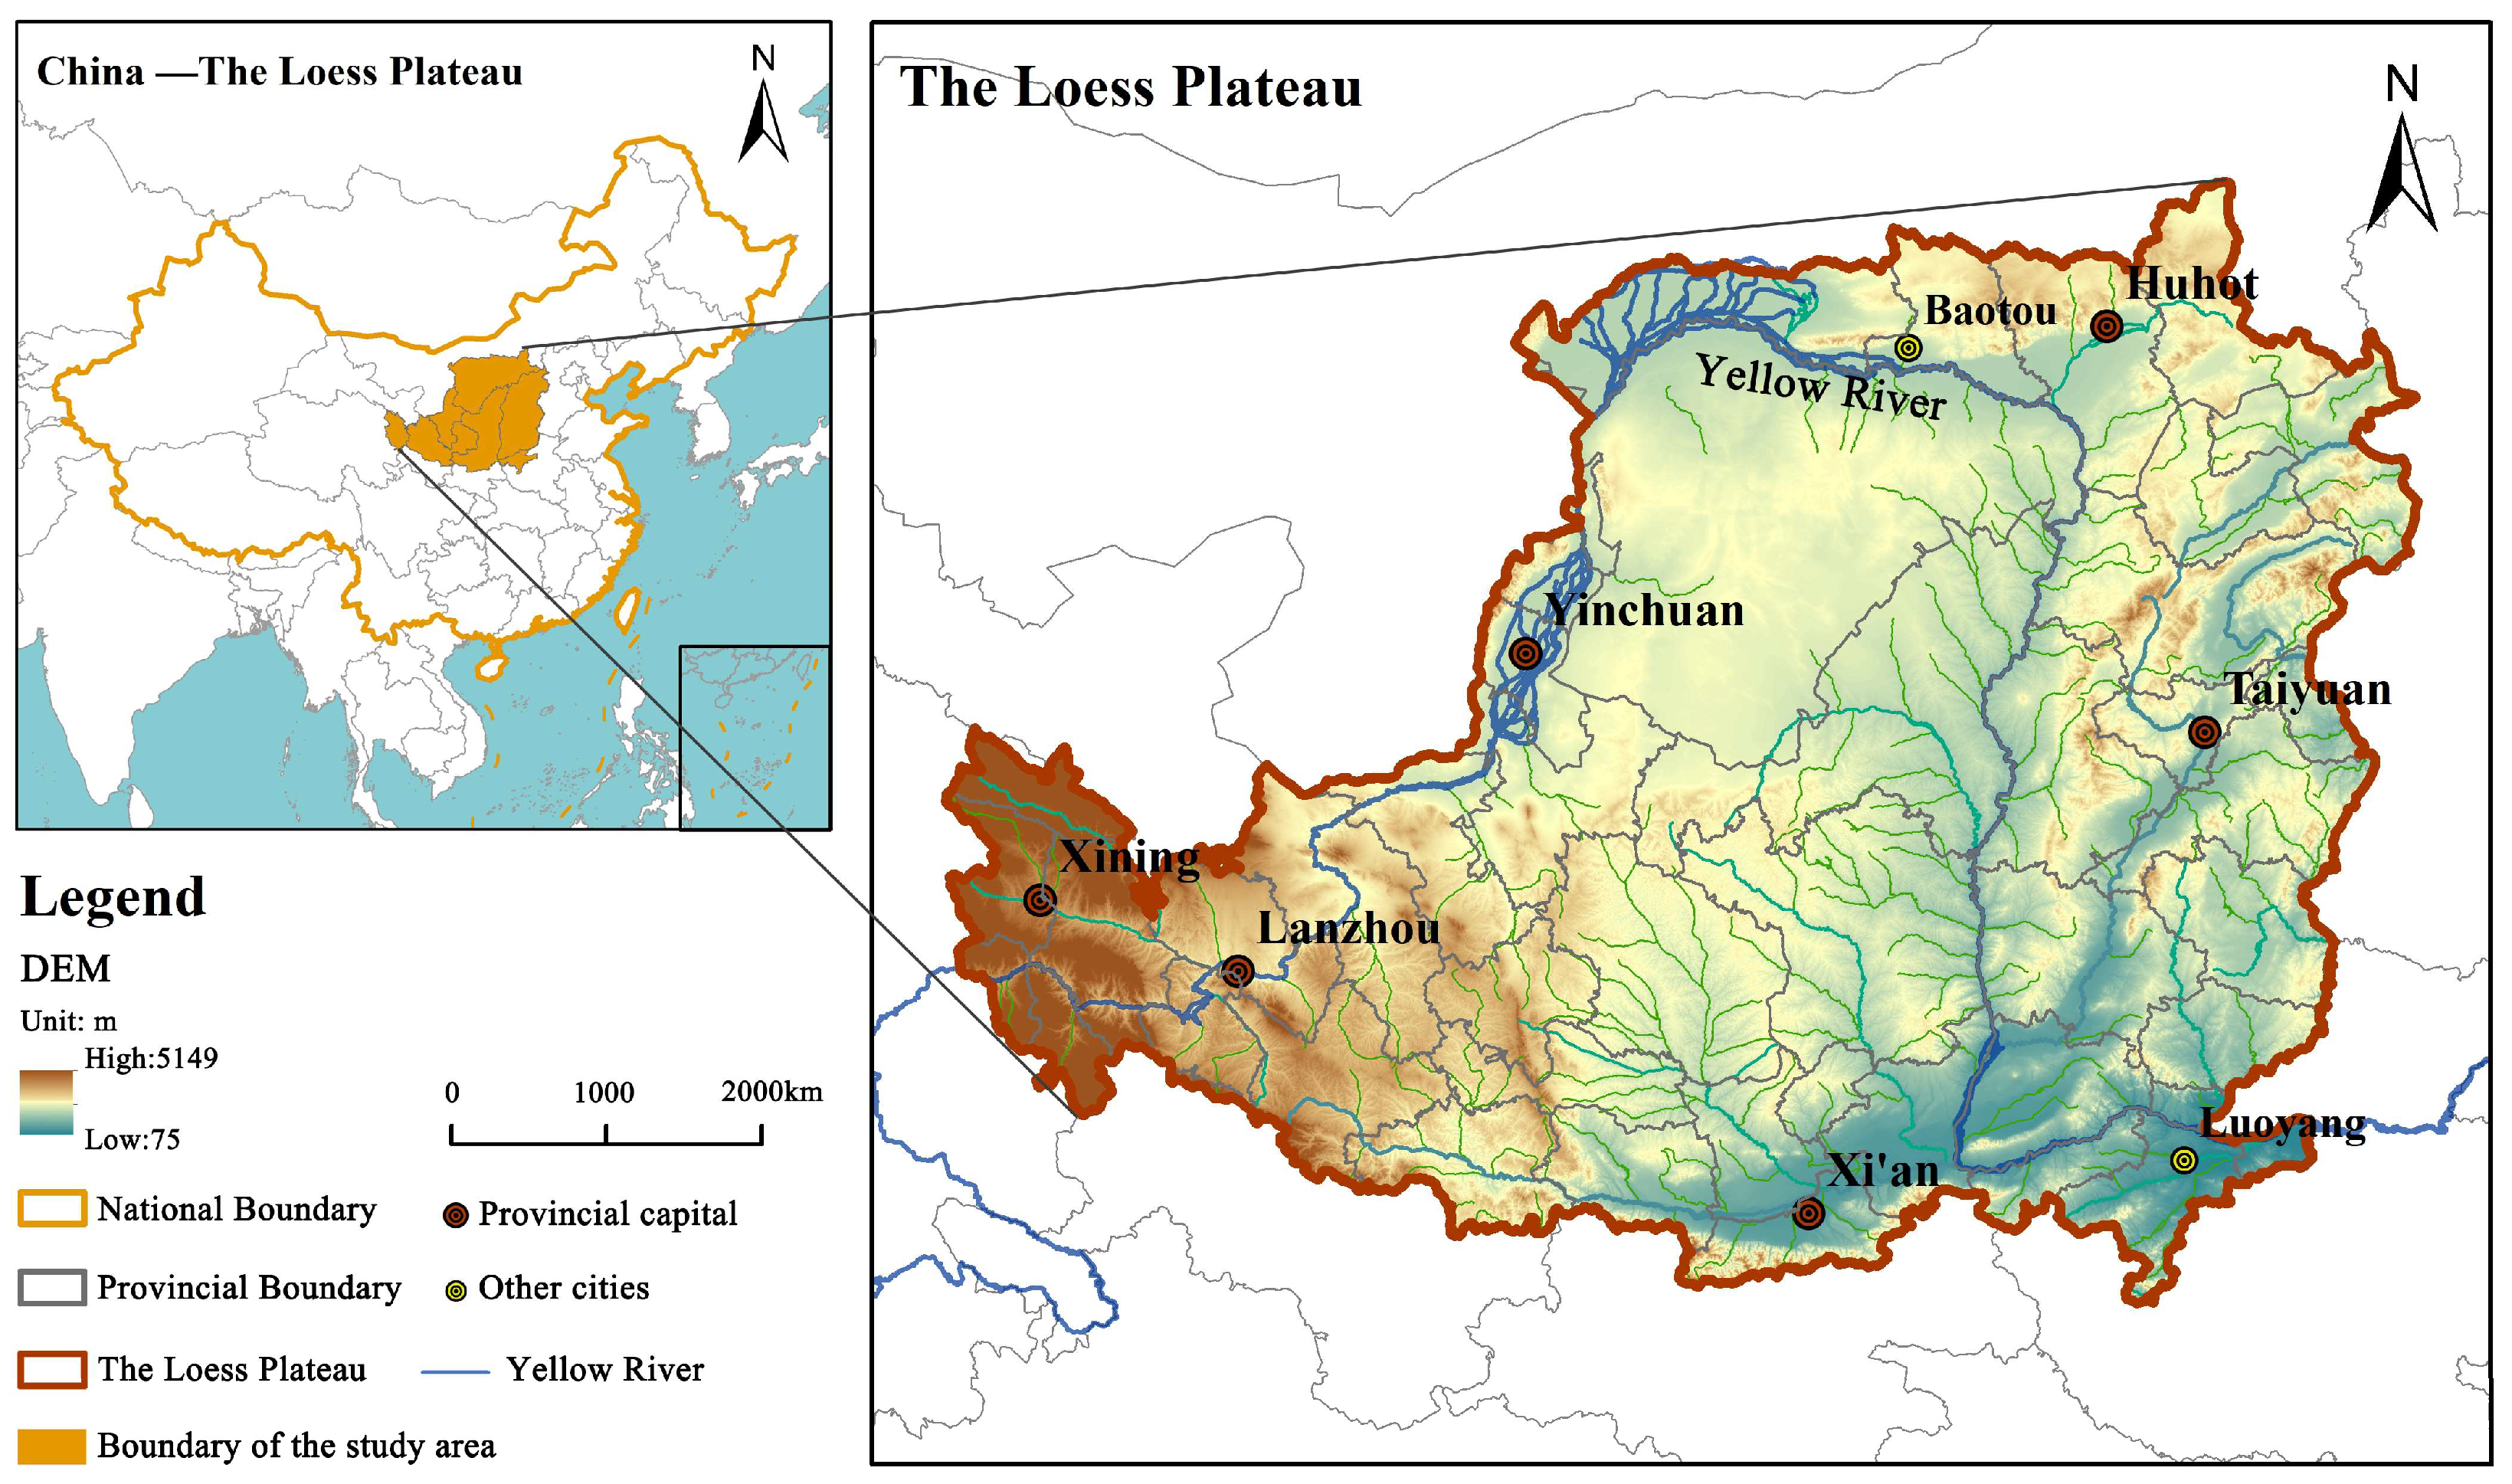
Figure 1. Geographical location of the Loess Plateau (DEM (Digital Elevation Model)).
Land 14 02062 g001
Figure 2. Schematic diagram of the moving-window identification method.
Land 14 02062 g002
Figure 3. Spatiotemporal distribution of cropland abandonment grades.
Land 14 02062 g003
Figure 4. Distribution of cumulative cropland abandonment area.
Land 14 02062 g004
Figure 5. Composite map of cropland abandonment trends.
Land 14 02062 g005
Figure 6. Distribution of multiyear cropland abandonment grades.
Land 14 02062 g006
Figure 7. Spatial distribution of cropland conversion to forest and grassland.
Land 14 02062 g007
Figure 8. Annual Restoration Area (Forest and Grassland).
Land 14 02062 g008
Figure 9. Hotspot map of cropland reclamation distribution.
Land 14 02062 g009
Figure 10. Annual Recultivation Share (within previously abandoned).
Land 14 02062 g010
Figure 11. Trend test of food production (FP) on the Loess Plateau.
Land 14 02062 g011
Figure 12. Spatial distribution and temporal trends of FP in the Loess Plateau, 2001–2022. (a) Annual FP distribution; (b) Linear trend of mean FP during the 22-year period.
Land 14 02062 g012
Figure 13. Grain production losses caused by CA in the Loess Plateau, 2001–2020.
Land 14 02062 g013
Figure 14. Impacts of CA on per capita carrying capacity in the Loess Plateau, 2001–2020.
Land 14 02062 g014
Figure 15. Importance ranking of driving factors for CA in the Loess Plateau, 2005–2020 ((ad) represent 2005, 2010, 2015, and 2020, respectively; Y-axis shows driving factors, X-axis shows feature importance).
Land 14 02062 g015
Table 1. Data sources and processing.
Data TypeVariantYearsDescriptionSpatial ResolutionData Sources
Land-Use TypeLUCC2000–2023For Identifying Cropland Abandonment30 mhttps://doi.org/10.5194/essd-13-3907-2021 [39]
Crop productionNDVI2001–2022For Crop Growth Analysis1000 mhttps://www.earthdata.nasa.gov/, accessed on 11 September 2025
Physical geographic factorsElevation2020Elevation value of each raster cell250 mhttps://www.gscloud.cn/, accessed on 11 September 2025
Slope2020Slope value of each raster cell250 m
Precipitation2005/2010/2015/2020Precipitation of each raster cell1000 mhttps://www.earthdata.nasa.gov/, accessed on 11 September 2025
Temperature2005/2010/2015/2020Temperature of each raster cell1000 m
Socio-economic factorsPopulation density2005/2010/2015/2020Population density of each raster cell1000 mhttps://earthengine.google.com/, accessed on 11 September 2025
GDP2005/2010/2015/2020GDP of each raster cell1000 mhttps://www.resdc.cn/, accessed on 11 September 2025
Accessibility factorsCounty roads2005/2010/2015/2020Distance from each raster cell center to the nearest county road1000 m
River Distance from the river1000 mhttps://www.openstreetmap.org/, accessed on 11 September 2025
Table 2. Statistical results of FP trend analysis on the Loess Plateau.
SFPZSFP TrendArea Proportion
0.0005 1.96 Marked improvement21.14%
0.0005 −1.96–1.96Slight improvement4%
0.0005 0.0005 −1.96–1.96Stability72.78%
0.0005 −1.96–1.96Slight degeneration1.55%
0.0005 1.96 Severe degradation0.52%
Disclaimer/Publisher’s Note: The statements, opinions and data contained in all publications are solely those of the individual author(s) and contributor(s) and not of MDPI and/or the editor(s). MDPI and/or the editor(s) disclaim responsibility for any injury to people or property resulting from any ideas, methods, instructions or products referred to in the content.