Article

The Impact of Industrial Land Misallocation on Sustainable Urban Development: Mechanisms and Spatial Spillover Effects

1
School of Political Science and Public Administration, Wuhan University, Wuhan 430072, China
2
China Institute of Development Strategy and Planning, Wuhan University, Wuhan 430072, China
*
Author to whom correspondence should be addressed.
Land 2025, 14(10), 1976; https://doi.org/10.3390/land14101976
Submission received: 22 August 2025 / Revised: 26 September 2025 / Accepted: 28 September 2025 / Published: 30 September 2025
(This article belongs to the Section Land Use, Impact Assessment and Sustainability)

Abstract

Exploring the impact of industrial land misallocation (ILM) on sustainable urban development (SUD) helps provide strong empirical support for SUD from the perspective of land factor allocation. Based on panel data from 283 cities between 2009 and 2021, this paper systematically analyzes the impact mechanism and spatial spillover effects of ILM on SUD from the perspective of factor misallocation. The results show that most Chinese cities face a surplus-type misallocation of industrial land, and resource allocation urgently needs optimization. During the study period, the overall level of SUD increased and exhibited a spatial gradient distribution characterized by high levels in the east and low levels in the west. ILM significantly inhibited the improvement of SUD, with the negative impact being particularly pronounced in central-western regions and non-resource-based cities. ILM also showed a significant negative spatial spillover effect. Mechanism analysis found that ILM mainly negatively affected SUD by hindering industrial transformation and upgrading as well as the progress of urban technological innovation. Further research found that the implementation of the policy for exit audits of natural resource assets alleviated the problem of ILM to a certain extent and weakened its adverse effects on SUD. Therefore, deepening efforts to correct ILM is a key measure to break resource allocation barriers and promote SUD.

1. Introduction

In recent years, the global process of urbanization has been accelerating, and land resources, as the key spatial carrier supporting socio-economic activities, have played an increasingly prominent role in promoting SUD [1]. Faced with increasingly severe resource and environmental constraints, countries around the world have strengthened the intensive use of land to enhance urban competitiveness and actively respond to the challenges of climate change [2]. In the long-term evolution of urbanization, developed countries have gradually established relatively sound land market systems, significantly optimized the allocation of land resources, and effectively supported industrial development and the continuous improvement of urban functions. For example, the OECD’s Land Governance Report [3] indicates that these countries possess relatively well-developed institutional frameworks in areas such as land market transparency, property rights protection, and market regulation. In contrast, some developing countries still face the problem of industrial land misallocation (ILM), which poses a serious challenge to achieving their urban sustainability goals. In China, alongside the rapid process of industrialization and urbanization, the industrial land supply has long been dominant [4]. However, issues regarding its allocation efficiency and rationality have gradually surfaced. Some cities face structural imbalances, such as the excessive supply or undersupply of industrial land, leading to a series of prominent problems, including resource waste, environmental pollution, low industrial efficiency, and unbalanced regional development. Against this backdrop, the efficiency and rationality of industrial land allocation have increasingly become important factors affecting urban resource utilization performance, particularly the potential negative impacts brought about by ILM, which can no longer be ignored. Although existing studies have paid attention to the impacts of ILM on energy efficiency, green total factor productivity, and other aspects, there are still gaps overall. In particular, the quantitative assessment of misallocation levels, the characterization of dynamic evolution features, and the systematic exploration of its mechanisms affecting sustainable urban development (SUD) remain to be studied in depth.
In China, the policy for exit audits of natural resource assets is an important policy innovation in recent years. This policy requires audits of local officials’ management of natural resource assets and protection of the ecological environment during their tenure, ensuring that local governments both promote economic development and protect natural resources rationally, avoiding resource waste and environmental damage caused by over-exploitation or misuse. Specifically, the policy establishes strict auditing standards and accountability mechanisms, compelling local governments to pay greater attention to the sustainable use of resources, which also has significant implications for the allocation and management of industrial land. On one hand, it constrains local governments from oversupplying industrial land, reducing resource idleness and waste caused by excessive land supply, thereby mitigating the ILM phenomenon. On the other hand, by strengthening audit supervision of industrial land use efficiency and environmental impacts, it promotes intensive land use and green transformation, providing strong support for SUD. For example, under audit pressure, local governments will plan industrial land layouts more cautiously, giving priority to land demands of high-value-added and low-pollution industries, while redeveloping or repurposing inefficiently used industrial land. This improves land use efficiency, promotes industrial structure upgrading and optimization, and ultimately advances the coordinated development of the urban economy, society, and environment.
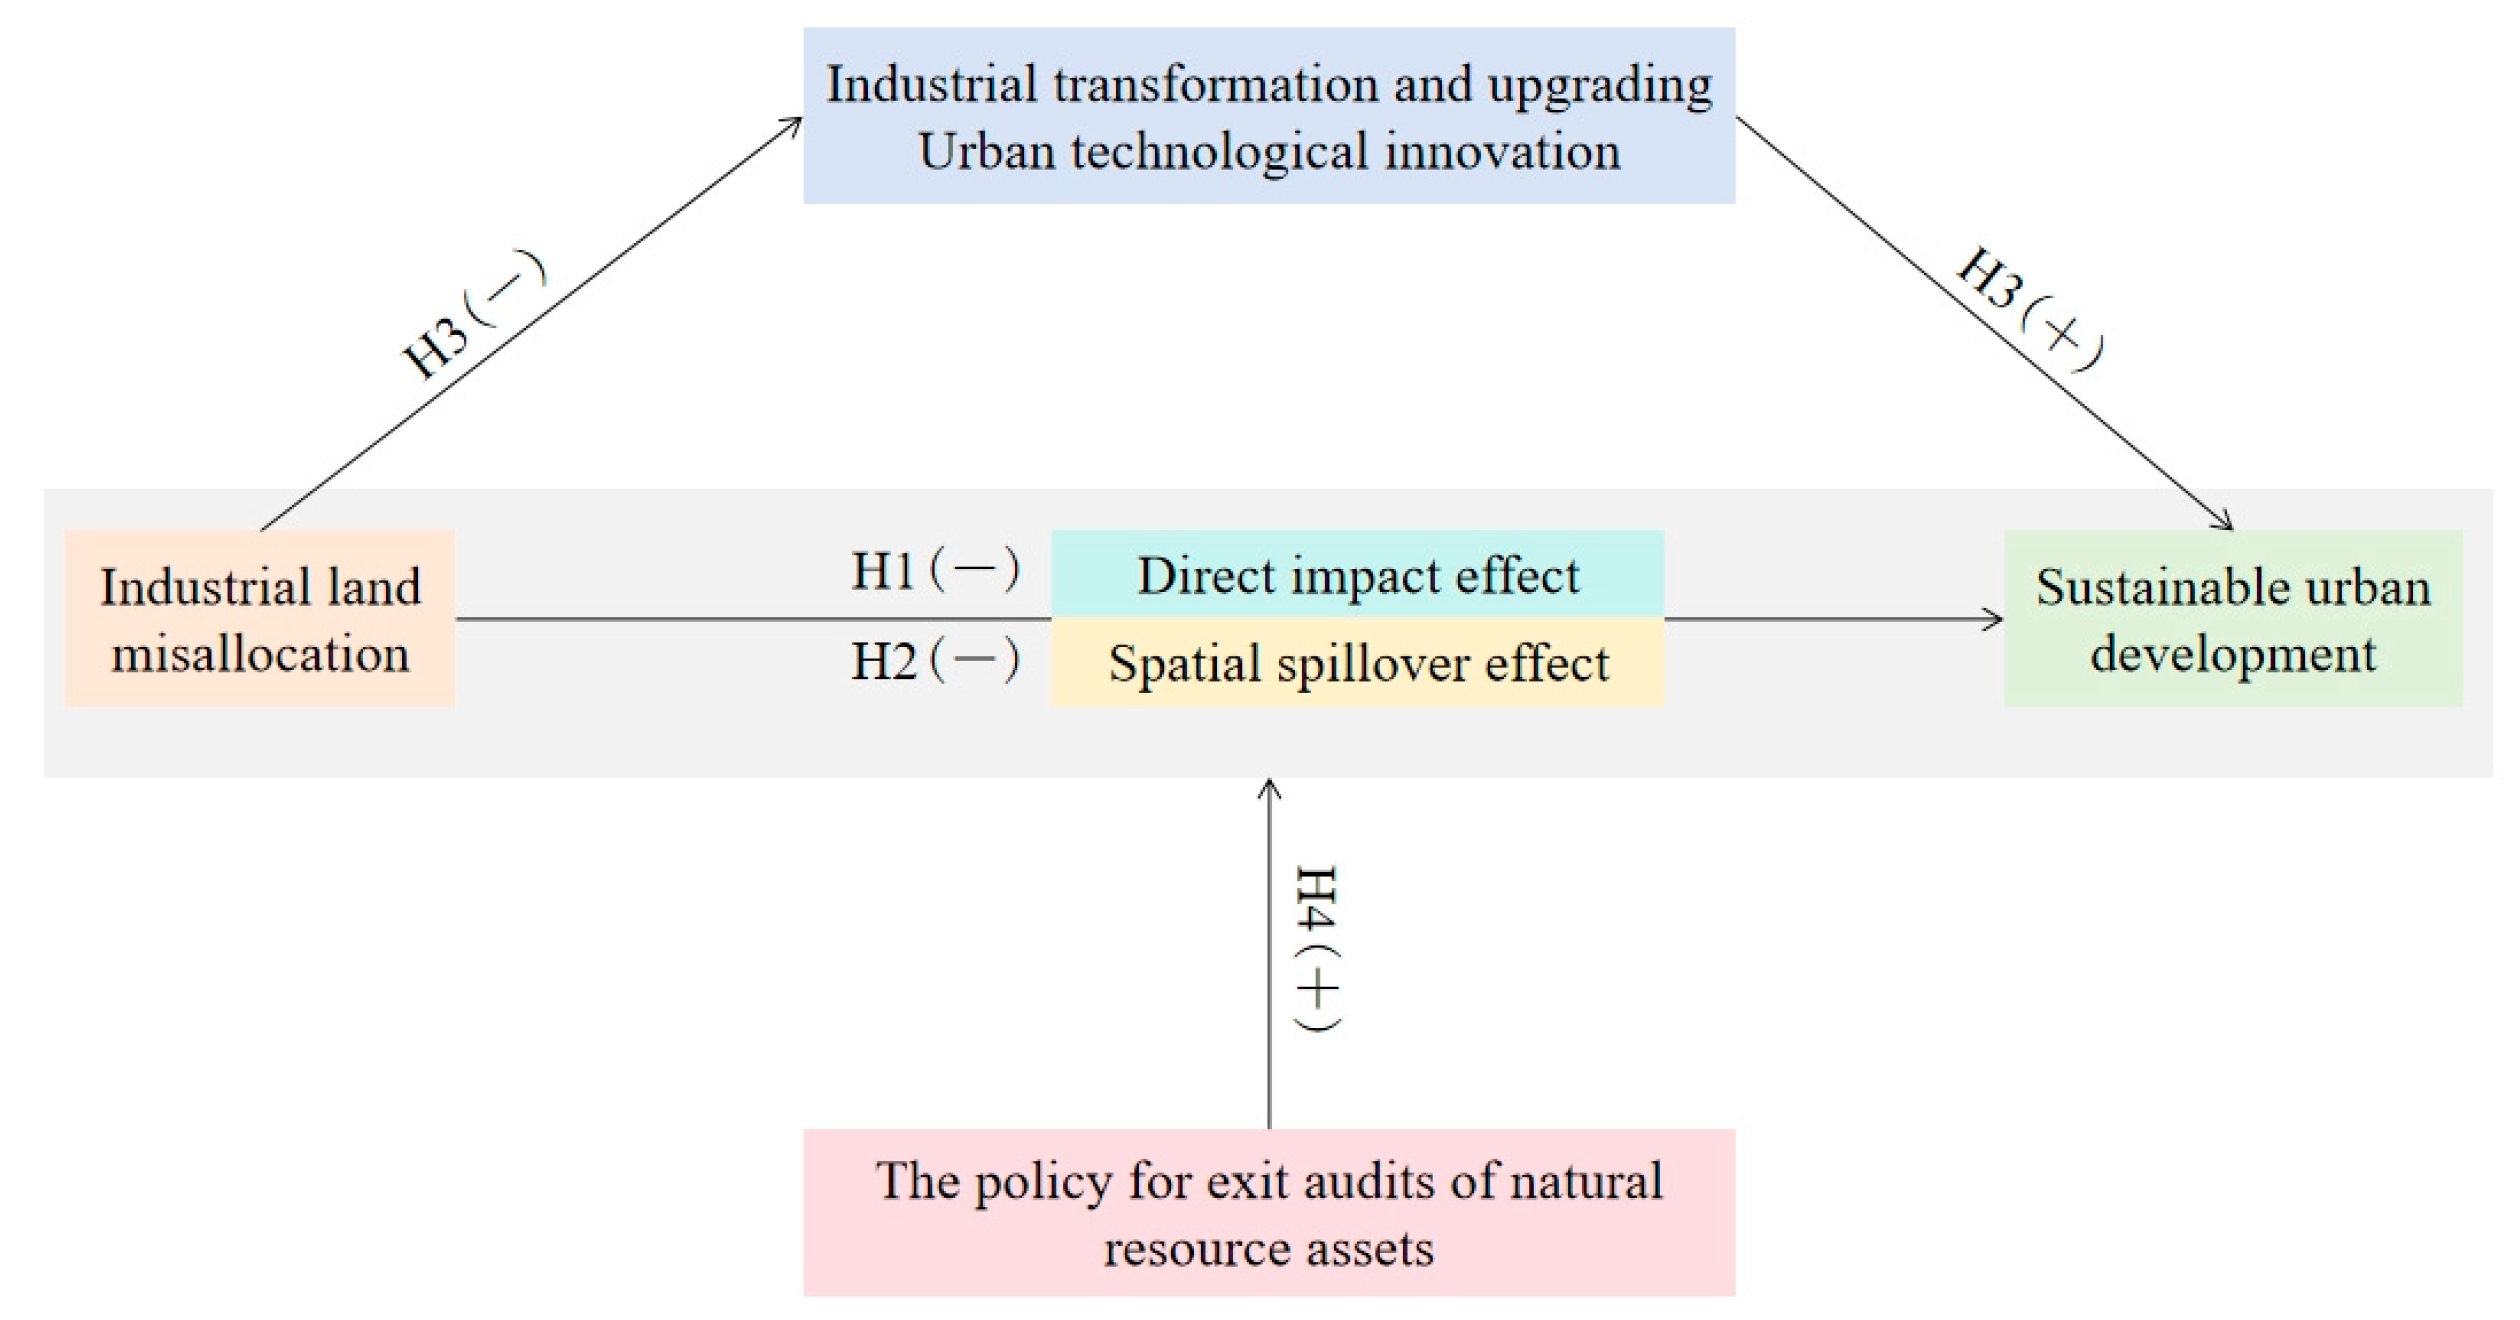
Based on this, this paper uses panel data from 283 Chinese cities from 2009 to 2021 to thoroughly explore the mechanisms through which ILM affects SUD and its spatial spillover effects (Figure 1), aiming to provide decision-making references for optimizing the allocation of land resources and promoting urban sustainability. The study’s potential contributions include the following: From the standpoint of research perspective, prior studies have rarely combined ILM with SUD. On the basis of clarifying its impact mechanisms, this paper further expands the analysis to include spatial spillover effects and spatial heterogeneity, systematically exploring the consequences of ILM. Second, regarding the measurement methods of ILM, most existing studies focus on land–price ratios [5] or the proportion of land transfer areas [6], neglecting the collaborative allocation of multiple factors during the production process. This paper constructs an input–output production function to measure the marginal output of industrial land, and compares the marginal output with the actual land price to quantify the degree of ILM. Finally, this paper investigates the moderating role of the natural resource asset exit audit policy, revealing its policy potential in promoting urban sustainability by alleviating ILM, thereby providing an empirical reference for relevant policymaking.

2. Literature Review and Theoretical Analysis

2.1. Literature Review

2.1.1. Industrial Land Misallocation

Resource misallocation refers to the inefficient allocation of production factors within an economy, which causes actual output to deviate from the ideal equilibrium level [7]. Under conditions of perfect competition, resources are primarily regulated by the market and can flow freely across regions, thereby enabling efficient allocation. However, misallocation may still occur due to several reasons. First, insufficient market competition may lead to distortions in the allocation of factors. Second, external influences beyond the market, such as irrational institutional arrangements or excessive government intervention, may disrupt the proportional balance of resource allocation, thereby triggering misallocation problems.
The matching of land supply and demand is a constantly evolving equilibrium process, and Land resource misallocation (LRM) can be understood as a deviation from an efficient allocation state [8]. Although the causes of land misallocation vary across countries due to different national conditions, they can generally be summarized in four aspects: first, fiscal reliance on land causes misallocation; second, excessive urban expansion; third, corruption in the allocation process; and fourth, flaws in the land distribution system itself. In China, land misallocation mainly stems from local governments’ pursuit of increased fiscal revenue [9]. In early-stage America, urban sprawl was one of the key factors contributing to resource misallocation, which also led to low land use efficiency [10]. In Sweden, since the authorities hold the decision-making power over land development, corruption in public land development has limited efficient land allocation [11]. In Guatemala, excessive land concentration and the complicated, high-cost land transfer process have further aggravated the situation of land misallocation [12].
There are various methodological approaches to measuring LRM. Some scholars, from the perspective of land supply, assess misallocation using indicators such as land transaction methods, land area, and prices. For example, certain studies use the proportion of land transferred through agreements within the total transferred area to indicate the degree of misallocation [6]—the higher this proportion, the more severe the misallocation. Other research adopts the ratio of industrial land transfer area to the total land transfer area as an indicator [13]. Some scholars also evaluate LRM by analyzing the price of land transferred through agreements [14] or the price ratio between industrial and commercial land. However, some viewpoints criticize assessments that rely solely on land area, emphasizing the importance of land prices in reflecting the efficiency of land allocation. However, whether measured by area or by price, it is difficult to fully capture the subtle differences in LRM. To overcome this limitation, some studies have introduced measurement approaches based on production functions and marginal output, which allow the evaluation of LRM to simultaneously account for both price and area dimensions, thereby providing a more comprehensive assessment [15]. Compared with other methods, the advantage of this approach lies in its ability to reveal the overall degree of resource misallocation while more comprehensively reflecting the differences across dimensions such as price and area. Therefore, this study adopts this method as the main analytical tool in the subsequent measurement of ILM.
Industrial land is one of the key types of urban land use. As China is the world’s largest developing country and a major manufacturing power, its demand for industrial land to advance industrialization far exceeds that of most developed economies. Consequently, research on ILM is mainly concentrated in China. Existing studies primarily focus on the consequences of such misallocation and the strategies for its governance. In terms of impact, some scholars have pointed out that ILM has brought about a series of negative effects on urban development. For instance, studies have shown that misallocation significantly hinders urban ecological modernization and exhibits spatial negative spillover effects [8]. Other researchers have found a positive correlation between ILM and carbon emissions in resource-based cities—the more severe the misallocation, the higher the carbon emissions, thus constraining the development of such cities [13]. Furthermore, some studies indicate that ILM not only reduces land use efficiency but also worsens environmental pollution, thereby impeding green economic growth in cities [16,17]. Regarding governance strategies, some scholars have explored effective approaches to mitigate ILM. One perspective emphasizes the role of markets, advocating for the acceleration of land factor market reforms to strengthen the guiding role of the market in resource allocation and promote efficiency-oriented land distribution [18]. Another line of research focuses on policy, proposing improvements to the government performance evaluation system to reduce dependence on GDP as a sole metric and to eliminate land-based development incentives, thus preventing misallocation at its root [19]. Additionally, some studies suggest that strengthening environmental regulations can help alleviate the negative impacts caused by land misallocation to a certain extent [20].

2.1.2. Sustainable Urban Development

In this era when human activities profoundly affect the Earth system, the continuous exploitation and utilization of natural resources has caused irreversible damage to the Earth’s ecosystems and their resilience [21]. In light of this, the United Nations formulated the 2030 Agenda for Sustainable Development. The agenda aims to comprehensively address the social, economic, and environmental challenges facing the world and to promote the building of a more sustainable and prosperous future [22]. At present, research on SUD mainly focuses on two aspects: performance evaluation and the exploration of influencing factors.
Firstly, SUD involves multiple domains and cannot be comprehensively analyzed based solely on individual economic or social factors. Consequently, scholars commonly adopt multi-indicator systems [23] in combination with integrated evaluation methods to assess the level of urban sustainability [24]. Regarding indicator systems, various studies have produced notable results. For example, some researchers have proposed a multidimensional framework covering climate change, energy consumption, infrastructure, and other aspects to evaluate and rank the sustainability of European cities [25]. Others have used the Analytic Hierarchy Process to determine sustainable development (SD) indicators and their priorities to assess sustainability in Iraq [26]. In the context of Chinese cities, some studies have developed a framework comprising nine sustainability goals closely related to urban development and 30 specific indicators to evaluate the progress toward these goals [27]. Other scholars have designed a set of 53 indicators across five domains, economic development, social welfare, environmental resources, etc., to conduct a comprehensive evaluation of urban sustainability. As for evaluation methods, techniques such as Principal Components Analysis [28], the entropy weight method [29], and the super-efficiency SBM Model [30] are widely applied. However, due to the extremely complex relationship between ecological and human systems, a universally endorsed SD evaluation framework has yet to be established. Therefore, composite index evaluation methods are currently regarded as the most appropriate choice, as they can comprehensively reflect the overall state of the society, economy, and environment [31]. A large volume of empirical research has demonstrated that these integrated assessment methods can yield practical conclusions and provide important references for governments in formulating scientific SD policies.
Secondly, regarding the factors influencing SUD, existing research has established a relatively comprehensive framework that covers a wide range of aspects, including the digital economy, environmental regulation, green finance, industrial structure, technological innovation, urban expansion, and land use. For example, some studies have adopted the dynamic QCA approach to examine how the digital economy relates to urban sustainability in a complex manner, with results showing that the digital economy enhances the level of green development in underdeveloped cities [30]. Other studies also highlight that digital and intelligent transformation can effectively promote SUD [32]. Additionally, some researchers have explored the mechanisms through which technological innovation and changes in industrial structure [33] affect SD in China. Green finance is also widely regarded as an important driving force for promoting a green economy and SD in cities [34]. Moreover, some scholars argue that leapfrog urban expansion can negatively impact sustainability, as such overexpansion often leads to land grabbing issues, making it crucial to strengthen the management of urban expansion, land use, and the occupation of agricultural land [35]. Other research focuses on land use, suggesting that curbing ineffective land expansion and improving land use efficiency are key to achieving urban sustainability [1]. In addition, other studies investigate the relationship between land consumption rates and population growth, finding that when population growth outpaces the expansion of urban land, it tends to result in excessive crowding and exacerbates sustainability challenges [36].
In summary, existing studies have conducted in-depth investigations into the causes, assessment approaches, and urban impacts of LRM. At the same time, a large volume of research has emerged concerning the measurement of SUD and its influencing factors. Building on these foundations, we observe that, for China, a major industrial nation, the ILM is particularly pronounced and has exerted significant effects on urban development. However, there is still a scarcity of systematic studies on the effects of ILM on SUD, the underlying mechanisms of such effects, the potential presence of spatial spillover effects and heterogeneity, and whether policy interventions can play a moderating role. This study, from the perspective of factor misallocation, systematically explores the impact mechanisms and spatial spillover effects of ILM on SUD, aiming to address the above-mentioned questions and fill the existing research gap.

2.2. Theoretical Analysis

2.2.1. Industrial Land Misallocation and Sustainable Urban Development

The rational allocation of industrial land directly affects the path and effectiveness of SUD. The theory of SD emphasizes the coordinated advancement of the economy, society, and ecology, requiring that land resource allocation meets current development needs without compromising the living space of future generations. However, in reality, industrial land is often misallocated. Examples include highly polluting enterprises occupying ecologically sensitive areas, inefficient industries entrenched in prime urban locations for extended periods, or serious mismatches between production sites and supporting resources. These issues undermine urban sustainability. From the perspective of the “three-dimensional goals” of SD: economic efficiency, social equity, and ecological environmental protection, ILM often leads to multidimensional negative externalities.
Firstly, at the economic level, according to the theory of factor matching, the efficiency of resource allocation depends on the reasonable coupling of factors such as land, labor, and capital [37]. The misallocation of industrial land disrupts this balance, not only reducing land use efficiency and economic output but also hindering the optimization and upgrading of the industrial structure [8]. For example, traditional industries that consume high levels of energy and yield low outputs occupy premium central urban plots, crowding out modern service industries and high-tech sectors. This results in an imbalance in the land input–output ratio and drags down the overall economic performance of the city.
Secondly, at the social level, ILM may trigger a series of social problems. On one hand, such misallocation may cause a severe separation between employment and residential spaces, exacerbating commuting burdens and social stratification. On the other hand, excessive allocation of industrial land squeezes commercial and residential land, leading to tight housing space in cities and constraining people’s living environments. It may also involve converting original agricultural or ecological land into industrial use, potentially causing land acquisition conflicts and intensifying tensions between governments and residents, thereby increasing public dissatisfaction and governance pressure.
Finally, at the ecological and environmental level, ILM is often closely related to distorted local government incentive mechanisms. Specifically, land finance not only provides an important source of income for local governments, but also profoundly affects the incentive mechanism for land distribution [9,38]. Driven by land finance, local governments tend to supply industrial land to projects with a high investment intensity and quick output, but often with severe pollution and low technological content, in order to pursue short-term GDP growth and fiscal revenue. This incentive mechanism guided by land finance directly triggered ILM. In the pursuit of land transfer fees and tax revenue, local governments neglect the rational allocation of land resources and environmental costs, resulting in excessive concentration of land resources in inefficient and highly polluting industrial projects. This behavior institutionally induces resource misallocation and exacerbates environmental burdens, severely deviating from the goal of coordinated development proposed in the 2030 Agenda.
In summary, this paper proposes Hypothesis 1: ILM has a negative impact on SUD (Figure 2).

2.2.2. The Impact of Industrial Land Misallocation on Sustainable Urban Development Has a Spatial Spillover Effect

As intercity connections grow increasingly close, the impact of ILM has extended beyond the spatial boundaries of individual cities. Therefore, when exploring how such misallocation affects SUD, it is necessary to introduce a perspective of spatial spillover effects. First, the theory of new economic geography suggests that spatial proximity and economic linkages between cities facilitate the flow of production factors and information, leading to the diffusion of economic activities within a region. Against this backdrop, ILM directly affects the efficient use of local resources and the carrying capacity of the ecological environment. Unreasonable land allocation may also lead to intensified environmental pollution, increased energy consumption, and ecosystem degradation, ultimately weakening a city’s potential for SD [6]. Meanwhile, these negative effects can spill over to neighboring areas through mechanisms such as industrial relocation and pollution diffusion. This not only increases the environmental governance burden of surrounding cities but may also disrupt the original coordination of regional development, undermining the overall regional capacity for sustainable growth. Second, cities interact not only in economic activities but also through policy implementation, institutional imitation [39], and competitive dynamics. The oversupply or undersupply of industrial land in one area may influence the land management decisions of nearby cities through “demonstration effects” or “policy competition/cooperation effect” [40], thereby indirectly affecting SD. Additionally, as the land market serves as a regional platform for resource allocation, its price mechanism and supply–demand balance are also influenced by neighboring cities, further intensifying the spatial diffusion of misallocation.
Based on the above theoretical logic, the impact of ILM on SUD is not confined to local boundaries but exhibits spatial spillover characteristics. Therefore, this paper proposes research Hypothesis 2: The impact of ILM on SUD exhibits spatial spillover effects.

2.2.3. The Impact Mechanism of Industrial Land Misallocation on Sustainable Urban Development

ILM may indirectly weaken the SD capacity of cities by suppressing industrial transformation and upgrading. On one hand, the excessive allocation of industrial land to low-efficiency industries results in difficulties for high-tech and high-value-added enterprises to obtain land, thereby constraining their expansion capabilities. This distortion in resource allocation not only impedes the development of advanced manufacturing and modern service industries but also delays the rational transition from the secondary to the tertiary sector [39]. On the other hand, industrial transformation and upgrading are critical channels for achieving green urban development, improving total factor productivity, and reducing environmental pollution. If land resources continue to be occupied by traditional industries, cities will struggle to move away from dependence on energy-intensive and high-emission sectors, thereby facing severe challenges in balancing economic growth with environmental capacity [6]. Therefore, ILM weakens a city’s ability to coordinate economic and environmental development by obstructing structural transformation, thus significantly constraining SUD.
ILM indirectly affects SUD by suppressing the process of urban technological innovation. First, ILM weakens the spatial support foundation for technological innovation. Under such circumstances, high-quality and innovative enterprises face spatial resource crowding and lack sufficient development support. This imbalance in resource allocation limits the effective agglomeration of technological elements and weakens collaboration and interaction among enterprises, thereby affecting the city’s overall innovation capacity [41]. Second, driven by “land finance”, local governments tend to allocate industrial land to traditional and energy-intensive industries. This not only crowds out space for high-tech enterprises and creates an extrusion effect on innovation resources but also weakens the city’s competitiveness in technological transformation [40]. Finally, as technological innovation is the core driving mechanism for achieving green, smart, and inclusive development, ILM fundamentally constrains SUD by impeding technological innovation.
In summary, this study proposes Hypothesis 3: ILM mainly has a negative impact on SUD by constraining the transformation and upgrading of industries and the process of urban technological innovation.
ILM, as a typical manifestation of imbalanced land resource allocation, often stems from local governments’ irrational land allocation decisions driven by economic growth pressures. From the perspective of institutional economics, one major cause of resource misallocation lies in the tendency of local government officials, driven by performance evaluation incentives, to pursue short-term economic growth. This leads to the relaxation of land-use approval standards and large-scale land supply to attract investment, while neglecting the ecological attributes of the land and the long-term SDGs [42]. Against this backdrop, the policy for exit audits of natural resource assets serves as a governance tool aimed at integrating environmental responsibility into the performance evaluation system of officials. It strengthens their awareness of the need to protect and rationally utilize natural resources [42]. From the perspective of institutional change theory, the implementation of this policy represents a process of embedding formal institutions. Through the audit constraint mechanism, this formal institutional embedding encourages local governments to give greater consideration to scientific and long-term factors in the process of land resource allocation, optimizing the spatial layout and utilization efficiency of industrial land, thereby curbing the extensive expansion driven by “land finance”. This process corresponds to the notion in institutional change theory that the introduction and implementation of institutions can alter behavioral logic. The embedding and effective implementation of formal institutions help change the behavioral logic of local officials, requiring them to balance economic growth and ecological protection during their tenure, thus promoting intensive land use and green development. This process of regulating local government behavior through formal institutional embedding exemplifies the application of institutional change theory in the implementation of policy for natural resource asset exit audits and further reinforces the positive regulatory effect of this policy on SUD.
The policy for exit audits of natural resource assets effectively alleviates the negative impact of ILM on SUD through various channels. First, this policy prompts local governments to adjust their land supply strategies, strictly limits land support for inefficient industrial projects, and prioritizes ensuring the land demand is met for high-efficiency projects. Second, the policy promotes improvements in local government target-setting standards by incorporating ecological protection and intensive land use into the evaluation system. This means that local officials not only consider economic growth in their decision-making process, but also take into account the sustainable use of land resources, in order to balance economic growth and ecological protection during their tenure. In addition, by clarifying responsibilities and increasing transparency in policy implementation, the auditing policy strengthens constraints on local government behavior, effectively curbing short-sighted land finance practices and reducing land resource waste and environmental damage caused by the pursuit of short-term economic growth. These mechanisms work together to optimize the spatial layout and efficiency of industrial land use, promoting intensive land use and green development, and thereby alleviating the negative impact of ILM on SUD. Therefore, this study proposes Hypothesis 4: The policy for exit audits of natural resource assets can effectively moderate the negative impact of ILM on SUD.

3. Research Design

3.1. Model Construction

3.1.1. Benchmark Regression Model

First, this study constructs Model (1) to test the effect of ILM on SUD.
S U D i t = α 0 + α 1 I L M i t + α 2 C i t + μ i + δ t + ε i t
In Equation (1), C i t refers to a set of control variables, μ i and δ t represent city and time fixed effects, respectively, and ε i t stands for the random perturbation term.

3.1.2. Spatial Econometrics Model

Based on the research Hypothesis 2 proposed earlier, this paper also needs to examine whether the impact of industrial land misallocation on urban sustainable development exhibits spatial spillover effects. On the one hand, the level of SUD itself demonstrates significant spatial correlation, as cities often show regional agglomeration characteristics in terms of economic development, environmental governance, and social progress. On the other hand, the impact of ILM on SUD is not confined to a single city; rather, it can be transmitted to surrounding areas, thereby generating spatial spillover effects. If the analysis relies solely on the traditional OLS Model, the true impact of ILM on SUD may be underestimated. Therefore, based on theoretical analysis and relevant test results (the results of Moran’s I, LR test, and LM test are shown in Section 5.1), it is necessary to introduce spatial econometric models to more comprehensively and scientifically reveal the spatial spillover effects of ILM on SUD. Commonly used models include the SDM, SEM, and SAR models [43]. Based on this, a general model was established (2).
Y i = β 0 + ρ W Y i + β 1 X i + β 2 W X i + β 3 C i t + β 4 W C i t + ε i t
In Equation (2), Y i is the dependent variable, representing the SUD, X i is the independent variable, representing the ILM, W is the economic distance matrix constructed based on per capita GDP difference, ρ is the spatial autoregressive coefficient, C i t is a set of control variables, and ε i t denotes the random perturbation term.

3.1.3. Mediation Effect Model

Based on Model (1), This research adopts a two-stage approach to examine the mediating mechanism of ILM on SUD, as shown in Equations (3) and (4):
M i t = γ 0 + γ 1 I L M i t + γ 2 C i t + μ i + δ t + ε i t
S U D i t = χ 0 + χ 1 I L M i t + χ 2 M i t + χ 3 C i t + μ i + δ t + ε i t
In Equations (3) and (4), M i t represents the mediating variables, and the remaining variables remain suppressed in Equation (1).

3.1.4. Moderation Effect Model

Based on Model (1), this study introduces the moderating variable and constructs in Model (5).
S U D i t = φ 0 + φ 1 I L M i t + φ 2 A i t + φ 3 I L M i t × A i t + φ 4 C i t + μ i + δ t + ε i t
In Equation (5), A i t represents the moderating variable. I L M i t × A i t represents the interaction term, and the remaining variables remain suppressed in Equation (1).

3.2. Variables

3.2.1. Dependent Variable

In 1997, British scholar John Elkington proposed the theory of the “Triple Bottom Line”. This theory divides corporate responsibility into three dimensions: economic responsibility, environmental responsibility, and social responsibility. Since its introduction, the theory has been widely applied across various fields. When combined with SUD, it can be summarized that SUD should encompass the following three core aspects: economic sustainability, environmental sustainability, and social sustainability. Based on this, the evaluation index system for SUD should also be constructed around these three dimensions: the economic dimension primarily reflects the rationality of urban economic development and its capacity for sustainable growth; the environmental dimension focuses on evaluating the city’s efforts in ecological protection and its capabilities in pollution control during the development process; and the social dimension emphasizes measuring the SD level of urban healthcare, education, and residents’ quality of life. Considering data availability, this paper further constructs an SUD indicator system oriented toward the SDGs [29,30,44], with specific details shown in Table 1, and uses the entropy weight method [29] to measure the level of SUD.
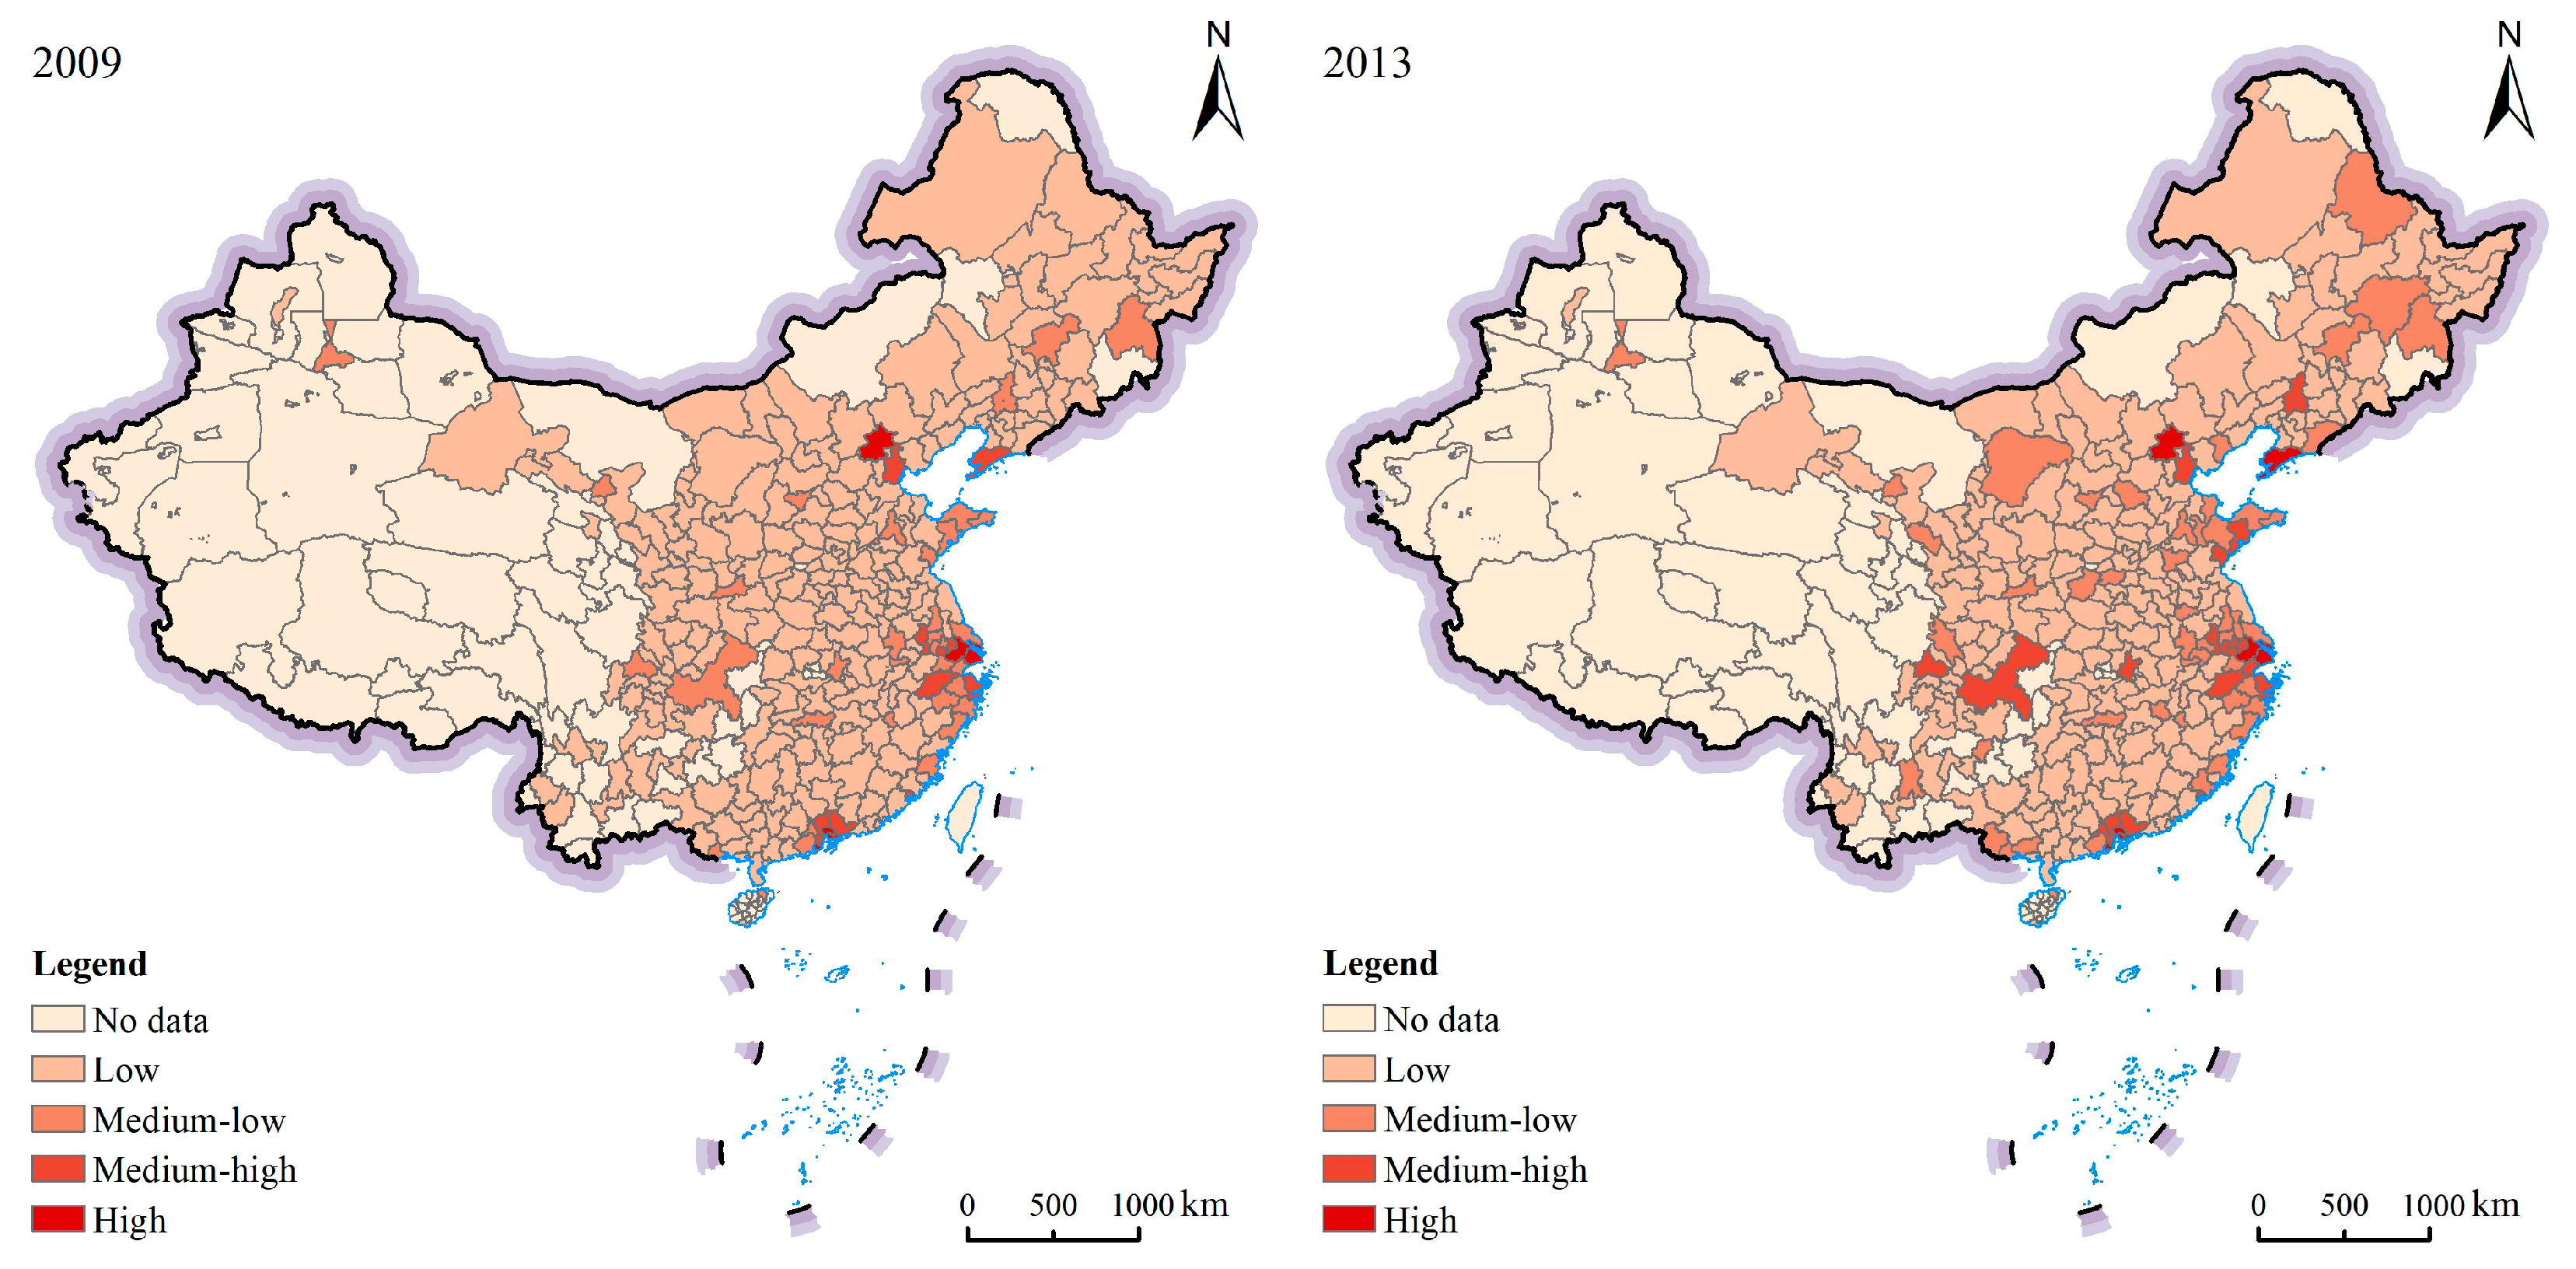
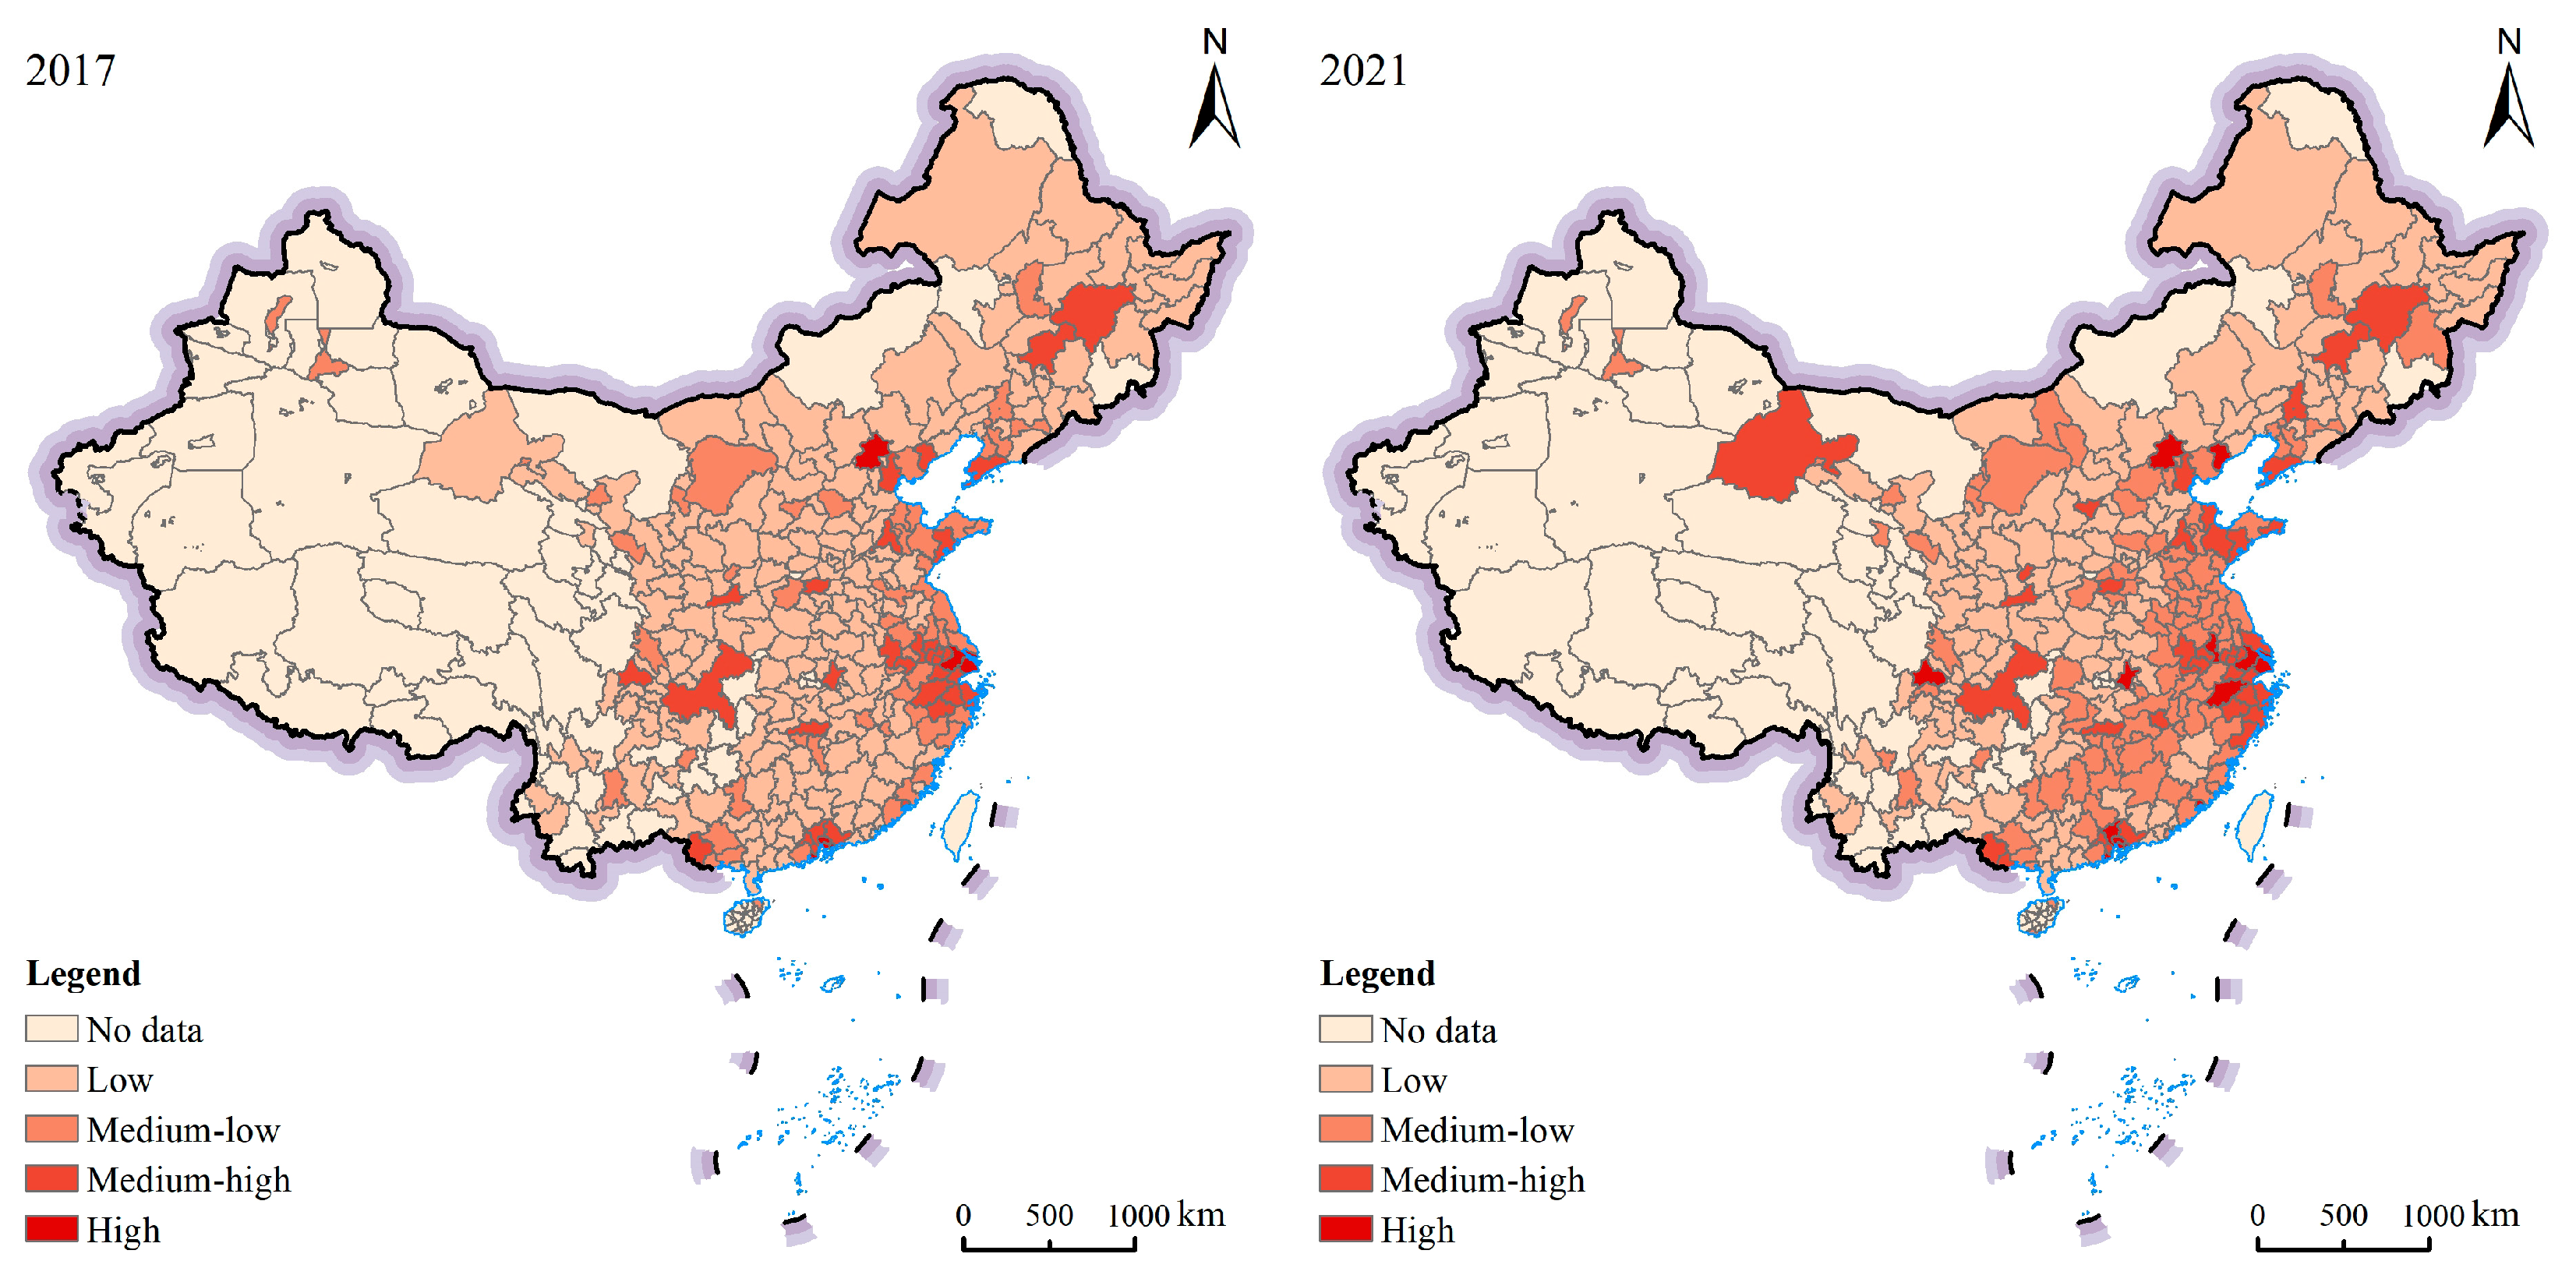
Figure 3 presents the spatial pattern of SUD in China. In this study, the natural breaks method was applied to divide SUD into four categories: low, medium-low, medium-high, and high. The results reveal a distinct east-to-west gradient. The eastern coastal areas consistently form clusters of high-level regions, while the central and western regions are primarily composed of low-level zones. Over time, high-level areas have gradually increased, especially in 2017 and 2021, during which the medium-high and high-level regions in East, South, and portions of Central China significantly expanded. This indicates a continuous improvement in urban sustainability in these areas. Meanwhile, although Southwest, Northwest, and some parts of Northeast China still mostly fall into the low-level category, some areas began to exhibit medium-low or higher levels in later years, suggesting a trend toward more balanced regional development. In general, China’s SUD demonstrated a steady upward trend, with a spatial distribution pattern characterized by a gradient decline from east to west.

3.2.2. Independent Variable

The measurement of the ILM index is mainly based on the theory of factor price determination. This theory holds that, under a fully competitive market mechanism, production factors can be optimally allocated, whereby the marginal cost and marginal output of each factor are consistent with its price. Based on this, the measurement follows the following steps [9]:
(1) Construct the Cobb–Douglas production function.
ln Y i t = δ 0 + δ 1 ln L i t + δ 2 ln K i t + δ 3 ln R i t + ε i t
Y i t represents industrial value-added, L i t represents industrial labor input, K i t represents industrial capital stock, R i t represents industrial land input, δ 0 represents the constant term, δ 1 , δ 2 , and δ 3 represent elasticity coefficients, and ε i t represents the random disturbance term.
(2) Estimate the marginal output of industrial land.
M P i t = δ 3 Y i t R i t
M P i t represents the marginal product of industrial land.
(3) Calculate the degree of ILM.
τ i t = M P i t P i t
ILM is quantified by comparing the marginal output with actual land prices.   P i t represents the price of industrial land per square kilometer. When τ i t = 1, it indicates that there is no misallocation in industrial land; when τ i t > 1, it indicates that there is an oversupply misallocation in industrial land (the actual value is undervalued), i.e., a surplus-type misallocation; when τ i t < 1, it indicates that there is an undersupply misallocation in industrial land (the actual value is overvalued), i.e., a shortage-type misallocation.
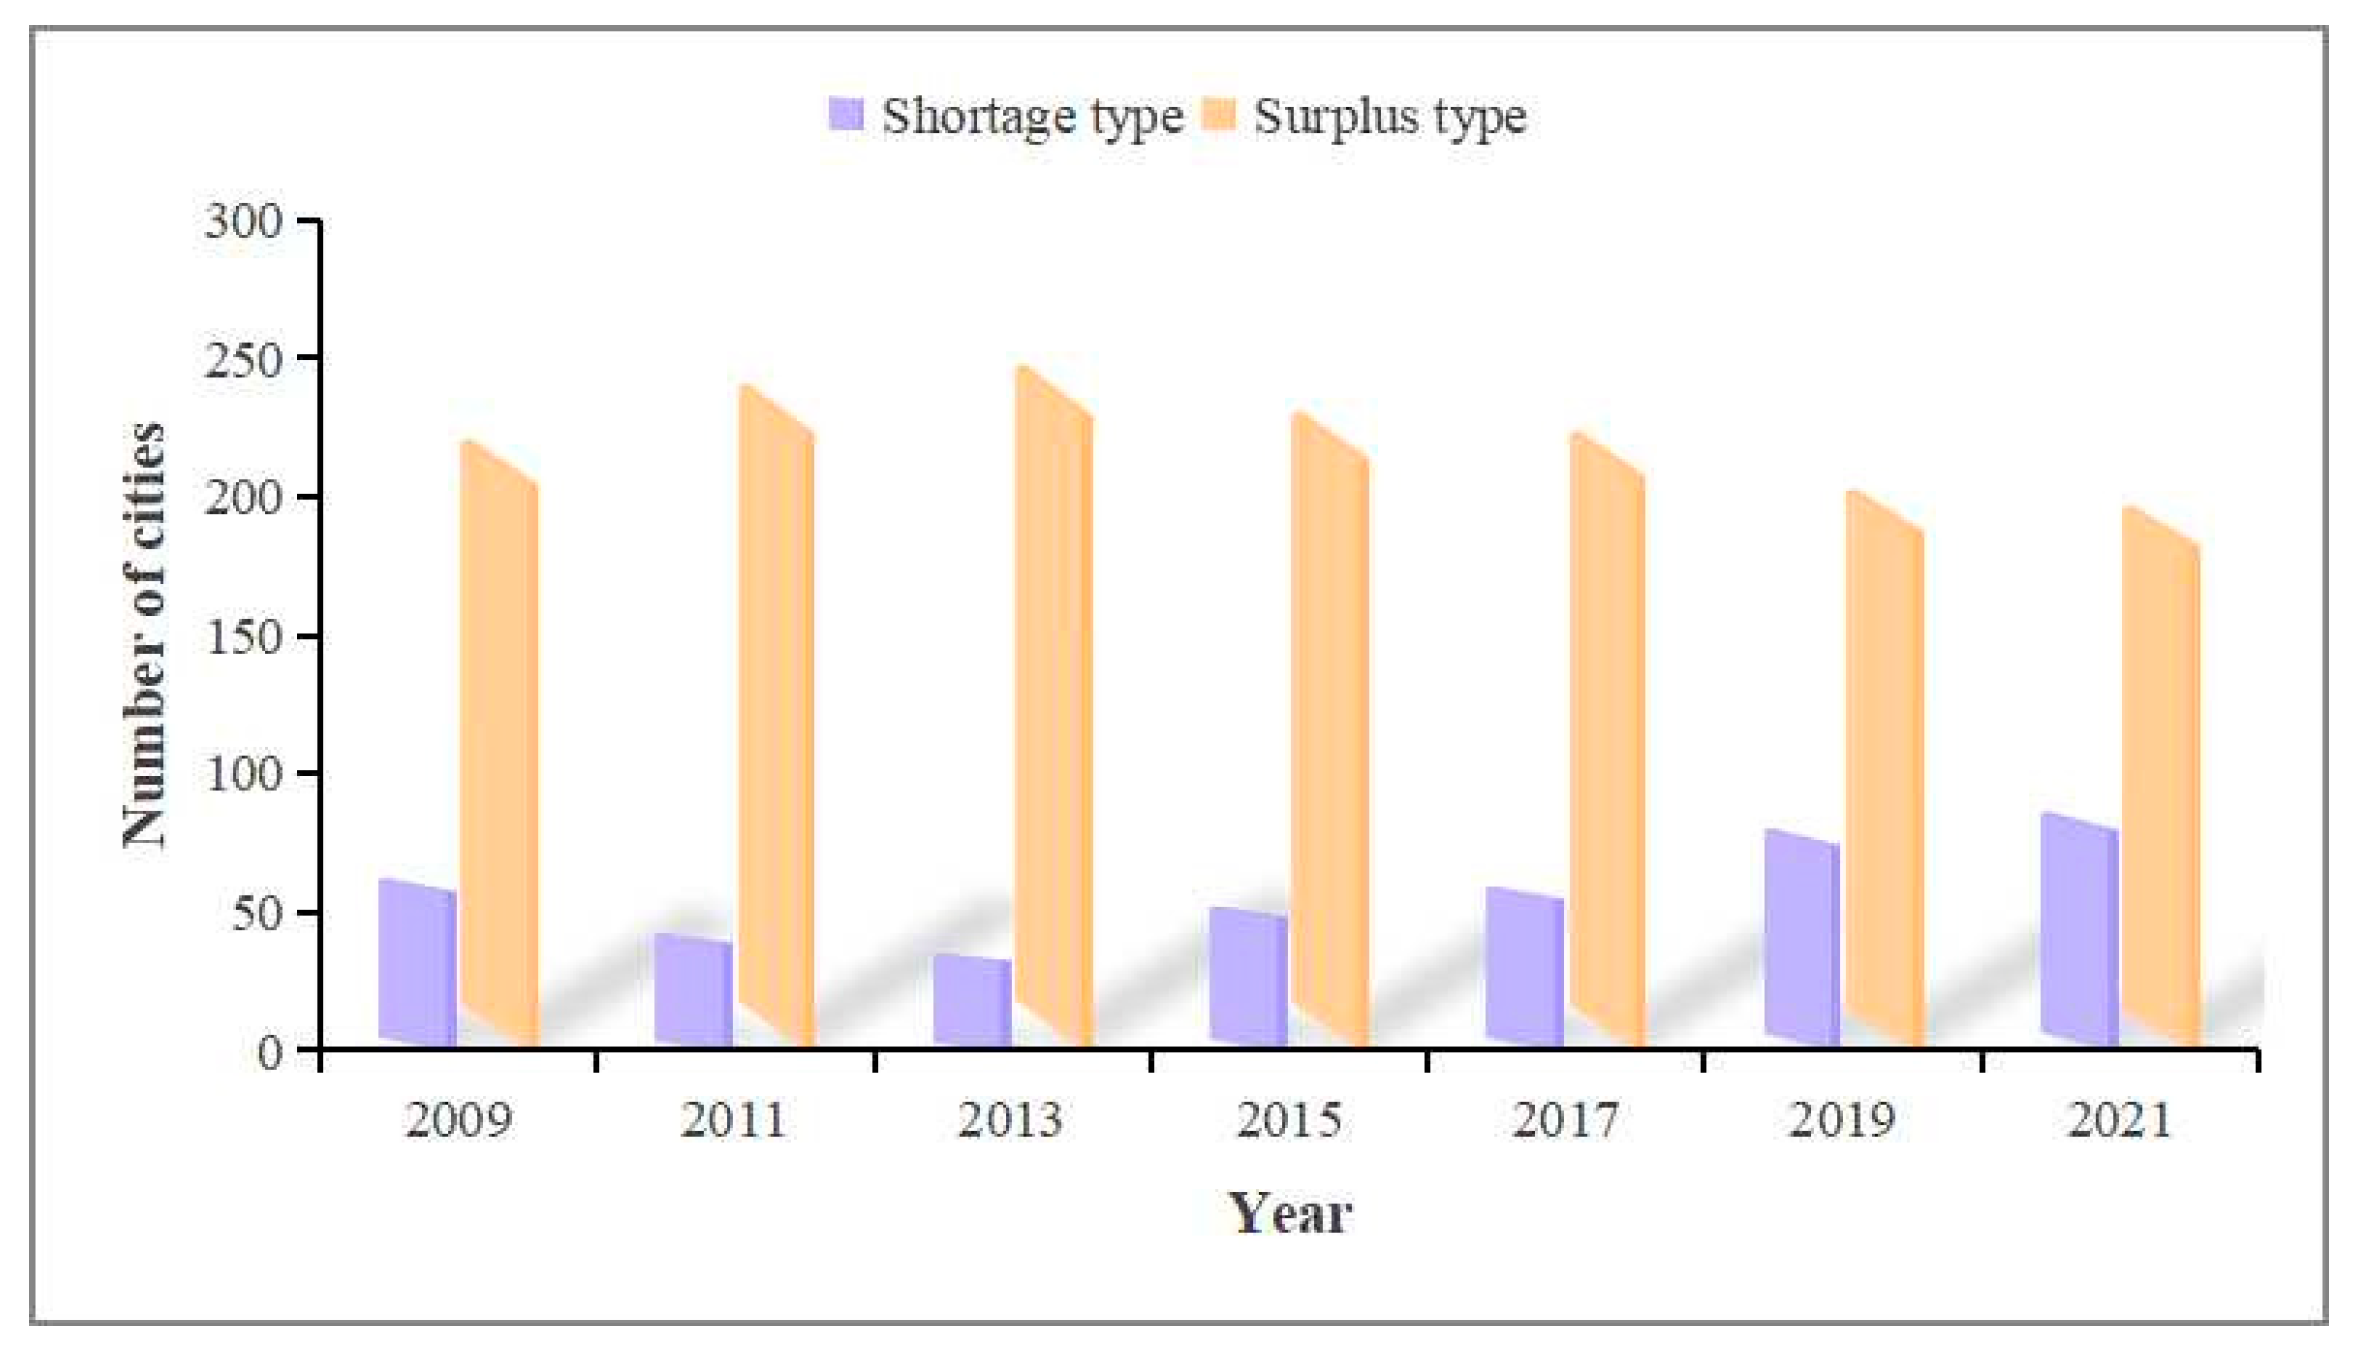
Figure 4 illustrates the evolution of ILM types across Chinese cities from 2009 to 2021, categorized into “shortage-type” and “surplus-type” misallocations. First, surplus-type misallocation cities consistently dominated throughout the study period, maintaining a relatively high and stable number with only slight fluctuations. The trend shows a gradual decline, with the number of such cities decreasing from nearly 250 in 2009 to around 200 by 2021. Second, the number of shortage-type misallocation cities exhibited a steady upward trend, increasing significantly from approximately 50 cities in 2009 to about 90 in 2021, indicating a stable and notable rise. Overall, although surplus-type misallocation remains the predominant form, the steady growth of shortage-type cities signals a shift in some areas from oversupply to undersupply in ILM. This transformation reflects a trend of differentiation and dynamic evolution in the types of ILM in China, suggesting that government land policies should pay closer attention to regional disparities and adopt flexible, adaptive regulatory strategies.

3.2.3. Control Variables

To ensure the robustness of the estimation process and the accuracy of the conclusions, this study selects the following control variables [28,30]: (1) Fiscal Decentralization (Fis): measured by the ratio of budgetary revenue to budgetary expenditure. Greater fiscal decentralization enhances the financial autonomy of local governments, enabling them to promote SUD according to local conditions. (2) Consumption Level (Con): represented by the logarithm of the total retail sales of consumer goods. A higher consumption level reflects an improvement in residents’ quality of life, encourages green consumption and a low-carbon economy, and contributes to the achievement of SDGs. (3) Employment Status (Emp): measured by the logarithm of urban employment. Higher employment rates strengthen social stability and residents’ income levels, providing both economic and social support for SUD. (4) Natural Population Growth Rate (Pop): expressed as the ratio of natural population increases to the total population during the same period. Moderate population growth helps supply labor and market vitality, while excessively rapid growth may increase pressure on resources and the environment, thereby hindering SUD. (5) Level of Financial Development (Fin): measured by the ratio of year-end loans and deposit balances to regional GDP. Financial development provides essential capital support for green industries and infrastructure investments, serving as a vital guarantee for sustained urban growth. (6) Urbanization Rate (Urb): measured by the ratio of urban population to the total regional population. Urbanization facilitates the concentration of resources and optimization of public services, but also requires simultaneous improvements in infrastructure and ecological management to achieve SUD.

3.2.4. Mediating Variables

This study introduces two mediating variables: first, industrial transformation and upgrading (Industrial), measured by the industrial structure upgrading index [39]. In Equation (9), i represents the i-th industry, Y i represents the industrial output value, and Y represents the gross domestic product. Second, urban technological innovation (Innovation), with the proportion of science and technology expenditures in total fiscal expenditures was selected as its proxy indicator [45].
I n d u s t r i a l = i = 1 3 i × ( Y i / Y )

3.2.5. Moderation Variable

To further regulate local governments’ behavior in land allocation, the State Council and the General Office of the CPC Central Committee jointly issued “The policy for exit audits of natural resource asset” in 2015. This policy serves as an important tool for evaluating and assessing leading cadres’ fulfillment of their environmental stewardship responsibilities. According to the document, 2015 is defined as the pilot start year for exit audits of natural resource assets. Based on this, a virtual variable “Policy” is constructed [42]. For any city in the pilot implementation year or thereafter, the value is set to 1, and otherwise to 0.

3.3. Data Source

This study uses panel data from 283 Chinese cities between 2009 and 2021 as the research sample. The industrial land area required for the ILM indicator (i.e., the total supply area of industrial land in each city) is drawn from the China Urban Construction Statistical Yearbook, while industrial land prices are obtained from the China Land Market Network. Specifically, each land transaction record is first matched to its corresponding prefecture-level city based on location; then, during the study period, industrial parcels transferred via public tender, auction, listing, or negotiated agreement are filtered by land use, and their transfer areas and transaction amounts are summed separately; finally, the average industrial land price for each city is calculated by dividing the total transaction amount by the total transaction area. Other variables are mainly sourced from the China City Statistical Yearbook, the EPS database, and the CSMAR database, with interpolation used to fill a small number of missing values. To eliminate the influence of outliers and strengthen robustness, all continuous variables are winsorized at the 1% tails. The descriptive statistics of the basic data for each variable are presented in Table 2.

4. Empirical Analysis Results

4.1. Benchmark Regression Result

To mitigate the impact of extreme values, the natural logarithm of ILM is employed in the subsequent analysis. The results are shown in Table 3. Model (1) does not include control variables and only controls for fixed effects of cities and years; Models (2) to (7) gradually introduce other control variables such as Fis, Con, Emp, etc., which help improve the model’s explanatory power. The results of Model (1) indicate that the regression coefficient of lnILM is negative and statistically significant at the 1% level, indicating that ILM has a significant negative impact on SUD. This result suggests that the improper allocation of industrial land may lead to waste of urban resources, thereby affecting the sustainable growth of the socio-economy. Moreover, the misallocation of industrial land may also cause ecological environmental degradation and a suboptimal infrastructure layout, further restricting urban long-term development. The results of Models (2) to (7) further confirm the negative impact of ILM. Even after introducing control variables, regression results show that the lnILM coefficient consistently holds a negative value with statistical significance, supporting Hypothesis 1 of this paper.

4.2. Robustness Tests

To verify the robustness of the regression results, this paper adopts multiple robustness checks, including introducing lagged variables and handling extreme values. The robustness test results are presented in Table 4. First, considering the potential lagged effect of ILM on SUD, the paper incorporates the first-order lag (L1.lnILM) and the second-order lag (L2.lnILM) of ILM into the regression analysis. The results show that in Column (1), the coefficient of L1.lnILM is −0.189, which is statistically significant at the 1% level, indicating a significant negative lagged effect of ILM on SUD. In Column (2), the coefficient of L2.lnILM is −0.203, also significant at the 1% level, confirming the robustness of the negative lagged effect. Second, in order to control the influence of extreme values on the estimation results, this paper applied 5% winsorization and trimming to all continuous variables. As shown in Columns (3) and (4), after winsorization, the lnILM coefficient was −0.187, which is almost consistent with the baseline regression results, indicating that the extreme values did not distort the core relationship. After trimming, the lnILM coefficient was −0.242, and the absolute value of the coefficient slightly increased, indicating that the presence of extreme values slightly weakened the negative relationship. After trimming, a cleaner negative relationship was restored, and ILM continues to exert a significant negative impact on SUD. Therefore, all robustness checks consistently support the baseline regression results of this study.

4.3. Endogeneity Test

The endogeneity issue of the model may stem from two aspects: on one hand, although the benchmark regression has controlled for some of the key factors influencing SUD, it may still omit some unobservable variables; on the other hand, changes in the level of SUD may also influence local governments’ decisions regarding the allocation of industrial land, which could lead to reverse causality in the model.
To address the potential endogeneity issue in the model, this study selects the interaction term between urban topographic ruggedness and year as an instrumental variable (IV) for ILM [9,41]. Urban topographic ruggedness, as an exogenous natural geographical feature, is closely related to land use. In cities with steeper slopes, land development and use are constrained by natural geographical conditions, resulting in more limited land supply and more intense market competition. Under resource constraints, local governments have a stronger incentive to obtain potential fiscal revenues through low-priced land supply, which may lead to ILM. Moreover, urban topographic ruggedness, as a natural feature, is not significantly related to SUD, thus making urban topographic ruggedness meet the selection criteria for instrumental variables.
The results are shown in Table 5. The regression result in Column (1) shows that the flatter the surface, the lower the degree of ILM. This result is significant at the 1% level. The LM value of the unidentifiability test is 275.368, and the p-value is close to 0, rejecting the unidentifiability hypothesis. Meanwhile, the F-value of the weak instrument test is 296.028, which is above the threshold, indicating that there is no weak instrument issue. From the second-stage estimation results in Column (2), the regression coefficient is negative and significant at the 1% level, further validating Hypothesis 1.

4.4. Heterogeneity Analysis

4.4.1. Regional Heterogeneity

The level of ILM differs by region, and its effect on SUD likewise varies geographically. Based on this, the study divides 283 cities into eastern and central-western regions to examine the regional heterogeneity in the effect of ILM on SUD. As shown in Columns (1) and (2) of Table 6, compared to the eastern region, ILM in the central-western region has a more significant negative impact on SUD. A possible explanation is that the eastern region has a more mature economy. When land prices rise continuously, some industrial enterprises relocate to surrounding or more remote central-western cities to reduce land costs. This relocation reduces local industrial land intensity and helps alleviate environmental pressure from emissions, thereby weakening the negative effect of ILM on sustainability. In contrast, during the industrial transfer process, the central-western region often receives a large influx of traditional manufacturing. Due to underdeveloped planning mechanisms and limited regulatory capacity, land misallocation becomes more severe, posing greater challenges to SUD.

4.4.2. Heterogeneity of Resource Endowments

Given that resource endowments play a vital role in shaping urban development paths, the study also analyzes heterogeneity based on resource endowment. According to the policy document, the sample cities are categorized into resource-based cities and non-resource-based cities. The regression results in Columns (3) and (4) of Table 5 show that the coefficient for non-resource-based cities is significantly negative at the 1% level, whereas the coefficient for resource-based cities is statistically insignificant. This suggests that the inhibiting effect of ILM on SUD is more pronounced in non-resource-based cities. One possible reason is that there are fundamental differences in the development paths of different types of cities. Resource-based cities are highly dependent on natural resources, and their SUD depends more on resource development. In this context, the marginal impact of ILM on SUD is relatively limited. In contrast, the development of non-resource-based cities is driven by the manufacturing and modern service industries, which are highly sensitive to land factors and rely on efficient land allocation to promote enterprise agglomeration and industrial upgrading. Therefore, the negative effects of ILM on SUD in non-resource cities are more significant.

5. Further Analysis

5.1. Spatial Spillover Effects

To further investigate the potential spatial spillover effect of ILM on SUD, this paper firstly tests the spatial autocorrelation of SUD (Table 7). The findings reveal a significantly positive global Moran’s I from 2009 to 2021, suggesting a notable positive spatial autocorrelation in SUD and confirming the necessity of spatial econometric analysis.
The results presented in Table 8 offer clear direction for choosing the appropriate spatial econometric model. The LM, robust LM, LR, and Wald tests all demonstrated statistical significance at the 1% level, indicating that the SDM model is more suitable for this study. Therefore, the study ultimately chose to estimate using the SDM model with time–space fixed effects.
To examine the relationship between ILM and SUD, various models were constructed to explore both direct and indirect effects. According to the regression results presented in Table 9, Model (1), based on an adjacency matrix, shows a direct effect coefficient of −0.139. The result is significant at the 1% threshold, implying that ILM inhibits the SUD of local cities. Meanwhile, the indirect effect coefficient is −0.269, also significant at the 1% level, showing that ILM has a significant negative spillover effect on the SUD of neighboring cities. In Model (2), based on the economic distance matrix, the direct effect coefficient is −0.172 and significant at the 1% significance level, which further verifies the negative impact of ILM on the SUD of local cities. The indirect effect coefficient is also significantly negative, indicating the existence of negative spatial spillover effects. The regression results of the two models are basically consistent, further proving the robustness of the results.
Under the dual role of China’s unique land management system and fiscal system, local governments typically implement the strategy of “low-priced industrial land and high-priced residential land” in order to foster regional economic growth and increase fiscal revenues. This allocation mode has not only become an important tool for economic competition among governments, but also implies increasingly fierce horizontal competition and increased game play among local governments. In this context, local government officials, in order to stand out from their peers in comparisons of political performance, are often more inclined to attract corporate investment by suppressing land prices, implementing zero-price land policies, and even expanding the scale of industrial land supply, thus strengthening the core position of industrial land in local investment promotion. This kind of behavior has triggered the imitation effect and interactive game of inter-regional land allocation strategy, leading to the governments of various regions in the industrial land concessions showing an obvious strategic linkage phenomenon. However, this irrational land allocation behavior not only disrupts the normal order of the land factor market, but also exacerbates the ILM, which further induces the regions to compete to develop capital-intensive industries and heavy industries, squeezes the space for the development of other industries, such as services, and substantively threatens the goal of SUD. In addition, because of the significant spatial correlation of strategic interactions among local governments, the negative effects of this type of industrial land allocation tend to spread spatially, forming a “spillover effect” among cities, with far-reaching impacts on the development path of the entire urban system.

5.2. Mechanism Analysis

In the process of rapid urban expansion, ILM has a negative impact on SUD. To uncover the underlying causes of this phenomenon, it is necessary to systematically analyze its mechanism, focusing on the regulatory role played by administrative intervention and the conduction effect of relevant intermediary variables in the influence path, so as to provide theoretical support for the optimization of urban land management policies.
This study identifies the mediating mechanisms from two perspectives: industrial transformation and upgrading, and urban technological innovation. Table 10 presents the relevant results. Firstly, as shown in Column (1) of Table 10, the coefficient of lnILM is significantly negative, indicating that ILM has a pronounced inhibitory effect on Industrial. In Column (2), the lnILM coefficient remains negative, while the coefficient for Industrial is significantly positive, demonstrating that Industrial helps promote SUD, but ILM, by impeding this transformation process, exerts a negative impact on urban sustainability. Specifically, ILM leads to prime industrial land being occupied by low-end, heavily polluting industries, making it difficult for high-tech, and high-value-added enterprises to obtain the spatial resources needed for development, thereby dispersing innovation factors and suppressing the endogenous momentum for industrial upgrading. Secondly, misallocation exacerbates environmental pressure by concentrating high-pollution industries in suburban areas, not only damaging local ecosystems but also significantly increasing the fiscal burden of environmental governance and public services, eroding the ecological carrying capacity of urban development. Thirdly, the government has failed to align its land-supply mechanisms with industrial guidance. The structural contradiction of “supply–demand misalignment and policy lag” has delayed the transformation of industries from manufacturing to services and from low-end to high-end. These multiple effects jointly inhibit the optimization and upgrading of the industrial structure, ultimately constraining the potential for SUD.
The results in Column (3) of Table 10 show that the lnILM coefficient is significantly negative, indicating that ILM has an inhibitory effect on Innovation. In Column (4), the lnILM coefficient remains negative, while the Innovation coefficient is significantly positive, further indicating that ILM negatively impacts SUD by weakening innovation momentum. The mechanism behind this negative impact may be that ILM leads to a large amount of land being occupied by low-value-added and high-pollution traditional industries, thereby compressing the land space available for high-tech and green industries. This prevents research institutions, high-end talent, and innovative enterprises from achieving economies of scale and cluster synergy. Additionally, these backward industries, lacking modern environmental protection facilities and intelligent production models, not only exacerbate environmental pollution and resource waste but also increase the city’s overall operational costs. More importantly, limited technological innovation capabilities hinder the widespread adoption of next-generation clean energy, a circular economy, and carbon-neutral technologies, thereby weakening the competitive advantage in SUD. In summary, the misallocation of industrial land use impedes urban innovation, exacerbates environmental and economic pressures, and ultimately suppresses SUD.
The constructed dummy variable Policy and its interaction with lnILM are both included in the model for estimation, with results shown in Column (5) of Table 10. The coefficient on lnILM is negative and significant at the 1% level, indicating that ILM substantially inhibits SUD. However, its interaction term with the policy for exit audits of natural resource assets shows a positive and statistically significant effect at the 1% level, implying that implementing the policy helps to alleviate the adverse impact of ILM on SUD. This result can be attributed to the following factors. On the one hand, the policy for exit audits of natural resource assets emphasizes the systematic review of natural resource use by local governments at the end of their term of office, and builds a traceable accountability mechanism to regulate the development and use of industrial land; on the other hand, the policy incorporates the responsibility for environmental protection into the performance appraisal system of leading cadres, which guides the local governments to take into account ecological benefits while pursuing economic growth, and helps correct the ILM. The synergistic promotion of the above two paths significantly reduces the degree of ILM, thus weakening its constraints on the SUD.

6. Discussion

6.1. Comparison with Existing Literature

The main results of this study are generally consistent with the existing research, while also revealing certain differences and innovations. First, at the overall level, the study finds that most cities exhibit a surplus-type misallocation, which is highly consistent with Liu et al.’s [46] findings on industrial land oversupply in the Yangtze River Delta region. Second, regarding the impact mechanism, this study shows that ILM significantly hinders SUD, mainly through obstructing industrial transformation and upgrading, as well as urban technological innovation. This result is consistent with Nie et al. [47], who demonstrated that ILM significantly reduces GTFP by restricting innovation ability. It is also in line with Wen et al.’s findings, which demonstrate that LRM significantly hampers the improvement of urban carbon emission efficiency. Such negative impacts are mainly transmitted through the obstruction of industrial structure upgrading and green technological innovation [48]. Third, in terms of heterogeneity analysis, the study reveals that the inhibitory effects of ILM are stronger in central and western regions and non-resource-based cities. This finding is in line with Chen et al., who argued that the higher level of marketization in eastern regions can partially cushion the negative effects of land misallocation [49]. In addition, this study confirms the negative spatial spillover effects of ILM on SUD. More importantly, unlike the existing literature that mainly focuses on land marketization reforms [6] or land use regulations, this study further discovers that the policy for exit audits of natural resource assets can effectively mitigate the adverse effects of ILM on SUD. This finding not only underscores the crucial role of institutional arrangements in optimizing land resource allocation, but also provides new empirical evidence for promoting SUD through institutional innovation.

6.2. Theoretical Implications

To further elucidate the theoretical implications of this study, we will discuss it from the following aspects: (1) Enriching the theoretical connotation of the relationship between land factor allocation and SUD. Previous research has mostly focused on the impact of land use efficiency and other factors on SUD. This paper, from the unique perspective of ILM, reveals its mechanism with respect to SUD, expanding the theoretical boundaries of the relationship between land factor allocation and SUD, and supplying new theoretical insights into the influence of land factors on SUD. (2) Broadening the use of spatial economics theory in land resource studies. Through empirical analysis of the spatial spillover effects of ILM on SUD, this paper verifies the spatial negative externality of ILM. This research further expands the application scope of spatial economics theory in the field of land resources. (3) The multidimensional impact mechanism of ILM. The study reveals that ILM hinders SUD by restricting industrial transformation and upgrading and urban technological innovation. This finding helps to improve the theoretical system of SUD, especially in terms of the impact mechanism of factor misallocation on urban development potential, deepening the understanding of the intermediary role of industrial transformation and upgrading and urban technological innovation in promoting SUD.

6.3. Practical Implications

The practical implications of this study include the following aspects: (1) Provide a decision-making basis for the optimal allocation of urban land resources. The research findings indicate that most cities exhibit the surplus-type misallocation pattern, and ILM has a significant negative impact on SUD. This suggests that governments should place a greater emphasis on the rational allocation of industrial land, approaching land use planning from a holistic urban development perspective. A land allocation mechanism centered on demand orientation and industrial compatibility should be established to avoid an excessive supply of industrial land and enhance the efficiency of land use, thereby promoting SUD and providing scientific evidence for urban land planning and policy formulation. (2) Assist in the SUD of the central-western regions and non-resource-based cities. It was found that the inhibitory impact of ILM is notably stronger in these areas. This provides a reference for these areas to formulate targeted land policies. It is recommended that these regions focus more on the precise allocation of industrial land in land use planning, avoid exacerbating the misallocation problem, and thus promote regional coordinated development and narrow the development gap with the eastern regions. (3) Promote industrial structure optimization and urban technological innovation. The study clarifies that ILM constrains SUD by hindering industrial transformation and upgrading and urban technological innovation. This provides direction for the adjustment of urban industrial development policies. Cities should strengthen the rational control of industrial land, guide land resources towards emerging industries such as high-end manufacturing and high-tech industries, promote the optimization and upgrading of the industrial structure, and simultaneously increase investment and support for technological innovation to enhance the capability of SUD. (4) Provide reference for optimizing the policy for exit audits of natural resource assets. The study finds that the pilot policy helps alleviate the misallocation of industrial land, thereby mitigating its negative impact on SUD. This offers empirical support for the further promotion and improvement of the departure audit policy. It is recommended to further optimize the content and methods of audits during policy implementation, and to strengthen supervision over the entire process of local governments’ industrial land supply and utilization. These measures can enhance the effectiveness of the policy and better promote SUD.

7. Conclusions and Future Research

7.1. Conclusions

Land serves as the spatial carrier for socio-economic activities, and its spatial configuration significantly influences the potential for SUD. Based on land transaction data and statistical yearbook data from 2009 to 2021, this paper examines the role of ILM in SUD and its spatial spillover effects from the perspective of factor misallocation. The main findings include the following: (1) In terms of the types of ILM, most cities show characteristics of surplus-type misallocation. (2) During the study period, the overall level of SUD improved, with a spatial distribution that decreased in a gradient from east to west. (3) ILM significantly inhibits SUD, and this conclusion holds true after multiple robustness tests. (4) For the central-western regions and non-resource-based cities, the inhibiting effect of ILM on SUD is particularly significant. (5) The impact of ILM on SUD has a significant negative spatial spillover effect, and this result remains robust in spatial models based on economic distance matrices. (6) ILM restricts SUD by hindering industrial transformation and upgrading and urban technological innovation. Furthermore, the implementation of the pilot policy for exit audits of natural resource assets helps alleviate the problem of ILM, thereby reducing its negative impact on SUD.

7.2. Limitations and Future Research

Although this paper reveals the impact mechanisms of ILM on SUD and its spatial spillover effects, there are still some limitations in the research that are worth further exploration in future studies. First, since the data mainly comes from land transactions and statistical yearbooks; there is a lack of in-depth analysis at the micro-level (such as at the enterprise level), which may underestimate the multi-level impact mechanisms of ILM. In the future, with the enrichment of data, a multi-scale research framework can be constructed, combining business data and dynamic analysis at the individual level, in order to more comprehensively reveal the complex pathways of ILM’s impact on economic benefits, social benefits, and environmental effects. Second, ILM is divided into shortage-type misallocation and surplus-type misallocation. Future research can further explore the impact of these two types on SUD and their differences in order to enrich the understanding of the relationship between ILM and SUD. Third, this paper’s examination of administrative intervention effects is limited to the pilot policy for exit audits of natural resource assets. Future studies can further introduce more types of policy innovations for comparative analyses, exploring the applicability and effects of different policies in various regions and industries, and providing more practical policy recommendations for the optimal allocation of industrial land.

Author Contributions

Conceptualization, S.Z.; Methodology, S.Z.; Software, S.Z.; Data curation, S.Z.; Writing—original draft, S.Z.; Writing—review & editing, S.Z.; Supervision, X.C.; Project administration, X.C. All authors have read and agreed to the published version of the manuscript.

Funding

This work is financially supported by the Major Project of the Ministry of Natural Resources of China (GHGZ191215-01).

Data Availability Statement

The data presented in this study are available on request from the corresponding author.

Conflicts of Interest

The authors declare no conflict of interest.

References

  1. Wang, C.; Liu, S.; Feng, T.; Liu, Y.; Liu, Y.; Hu, Z.; Yang, L.; Niu, Q.; Mao, X. Is the assessment approach of sustainable development goal 11.3.1 justified? Evidence from the drivers of future urban land use efficiency. J. Clean. Prod. 2024, 444, 141147. [Google Scholar] [CrossRef]
  2. Luo, J.; Wu, Y.; Zhang, L. Prediction and evaluation of industrial land intensive use: Adding policy impact to system dynamics model. Systems 2024, 12, 464. [Google Scholar] [CrossRef]
  3. OECD. The Governance of Land Use in OECD Countries: Policy Analysis and Recommendations; OECD Publishing: Paris, France, 2017. [Google Scholar]
  4. Zhao, A.; Huang, J.; Gao, F.; Meng, H.; Peng, C. Regional allocation of industrial land in industrializing China: Does spatial mismatch exist? Landscape Res. 2023, 48, 396–411. [Google Scholar] [CrossRef]
  5. Hu, J.; Du, J. Marketization and resource mismatches: Evidence from China’s land resource allocation. Singap. Econ. Rev. 2024, 1–23. [Google Scholar] [CrossRef]
  6. Du, W.; Li, M. The impact of land resource mismatch and land marketization on pollution emissions of industrial enterprises in China. J. Environ. Manag. 2021, 299, 113565. [Google Scholar] [CrossRef]
  7. Bian, Y.; Song, K.; Bai, J. Market segmentation, resource misallocation and environmental pollution. J. Clean. Prod. 2019, 228, 376–387. [Google Scholar] [CrossRef]
  8. Shen, L.; Zhang, L.; Bao, H.; Wong, S.; Du, X.; Wei, X. An empirical study on the mismatch phenomenon in utilizing urban land resources in China. Land 2023, 12, 1196. [Google Scholar] [CrossRef]
  9. Zhou, D.; Hu, Y.; Sun, Q.; Xie, D. Land resource mismatch and energy efficiency: Evidence from 243 cities in China. Energ. Policy 2023, 183, 113800. [Google Scholar] [CrossRef]
  10. Hasse, J.E.; Lathrop, R.G. Land resource impact indicators of urban sprawl. Appl. Geogr. 2003, 23, 159–175. [Google Scholar] [CrossRef]
  11. Valtonen, E.; Falkenbach, H.; Viitanen, K. Securing public objectives in large-scale urban development: Comparison of public and private land development. Land Use Policy 2018, 78, 481–492. [Google Scholar] [CrossRef]
  12. Britos, B.; Hernandez, M.A.; Robles, M.; Trupkin, D.R. Land market distortions and aggregate agricultural productivity: Evidence from Guatemala. J. Dev. Econ. 2022, 155, 102787. [Google Scholar] [CrossRef]
  13. Xu, J.; Qin, Y.; Xiao, D.; Li, R.; Zhang, H. The impact of industrial land mismatch on carbon emissions in resource-based cities under environmental regulatory constraints—Evidence from China. Environ. Sci. Pollut. R. 2024, 31, 56860–56872. [Google Scholar] [CrossRef] [PubMed]
  14. Wang, D.; Ren, C.R.; Zhou, T. Understanding the impact of land finance on industrial structure change in China: Insights from a spatial econometric analysis. Land Use Policy 2021, 103, 105323. [Google Scholar] [CrossRef]
  15. Han, F.; Huang, M. Land Misallocation and Carbon Emissions: Evidence from China. Land 2022, 11, 1189. [Google Scholar] [CrossRef]
  16. Arvin, M.B.; Pradhan, R.P.; Norman, N.R. Transportation intensity, urbanization, economic growth, and CO2 emissions in the G-20 countries. Util. Policy 2015, 35, 50–66. [Google Scholar] [CrossRef]
  17. Liu, J.X.; Wang, Z.; Duan, Y.F.; Li, X.R.; Zhang, M.Y.; Liu, H.Y.; Xue, P.; Gong, H.B.; Wang, X.; Chen, Y.; et al. Effects of land use patterns on the interannual variations of carbon sinks of terrestrial ecosystems in China. Ecol. Indic. 2023, 146, 109914. [Google Scholar] [CrossRef]
  18. Li, B.Q.; Wang, Z.Q.; Xu, F. Exploring the effects of market-oriented reforms on industrial land use eco-efficiency in China: Evidence from a spatial and non-linear analysis. Environ. Impact Asses 2023, 102, 107211. [Google Scholar] [CrossRef]
  19. Tang, P.; Feng, Y.; Li, M.; Zhang, Y.Y. Can the performance evaluation change from central government suppress illegal land use in local governments? A new interpretation of Chinese decentralisation. Land. Use Policy 2021, 108, 105578. [Google Scholar] [CrossRef]
  20. Gao, X.C.; Wang, S.; Ahmad, F.; Chandio, A.A.; Ahmad, M.; Xue, D. The nexus between misallocation of land resources and green technological innovation: A novel investigation of Chinese cities. Clean. Technol. Envir 2021, 23, 2101–2115. [Google Scholar] [CrossRef]
  21. Chen, S.R.; Feng, Y.J.; Tong, X.H.; Liu, S.; Xie, H.; Gao, C.; Lei, Z.K. Modeling ESV losses caused by urban expansion using cellular automata and geographically weighted regression. Sci. Total Environ. 2020, 712, 136509. [Google Scholar] [CrossRef] [PubMed]
  22. Lu, Y.; Nakicenovic, N.; Visbeck, M.; Stevance, A.S. Policy: Five priorities for the un sustainable development goals. Nature 2015, 520, 432–433. [Google Scholar] [CrossRef]
  23. Morse, S. Developing Sustainability Indicators and Indices. Sustain. Dev. 2015, 23, 84–95. [Google Scholar] [CrossRef]
  24. Secundo, G.; Ndou, V.; Del Vecchio, P.; De Pascale, G. Sustainable development, intellectual capital and technology policies: A structured literature review and future research agenda. Technol. Forecast. Soc. 2020, 153, 119917. [Google Scholar] [CrossRef]
  25. Meijering, J.V.; Tobi, H.; Kern, K. Defining and measuring urban sustainability in Europe: A Delphi study on identifying its most relevant components. Ecol. Indic. 2018, 90, 38–46. [Google Scholar] [CrossRef]
  26. Ameen, R.F.M.; Mourshed, M. Urban sustainability assessment framework development: The ranking and weighting of sustainability indicators using analytic hierarchy process. Sustain. Cities Soc. 2019, 44, 356–366. [Google Scholar] [CrossRef]
  27. Chen, L.; Shuai, C.Y.; Chen, X.; Sun, J.R.; Zhao, B. Toward sustainable urban development: Identifying principal SDG indicators for Chinese cities. Adv. Sustain. Syst. 2025, 9, 2400894. [Google Scholar] [CrossRef]
  28. Wu, T.; Xu, W.; Kung, C.-C. The impact of data elements on urban sustainable development: Evidence from the big data policy in China. Technol. Soc. 2025, 81, 102800. [Google Scholar] [CrossRef]
  29. Liu, M.; Liu, C.; Yang, Q.; Zhao, J. Spatiotemporal characteristics and interactive effect between urbanization and sustainable urban development: Evidence from Yangtze River delta. Land 2024, 13, 965. [Google Scholar] [CrossRef]
  30. Bai, X.P.; Shen, Q.Q. Exploring impact of digital economy on sustainable urban development by panel data of 30 underdeveloped cities in China. Sci. Rep. 2025, 15, 13325. [Google Scholar] [CrossRef]
  31. Schoenaker, N.; Hoekstra, R.; Smits, J.P. Comparison of measurement systems for sustainable development at the national level. Sustain. Dev. 2015, 23, 285–300. [Google Scholar] [CrossRef]
  32. Yuan, C.L.; Liu, J.; Fan, Y.X. Exploring the dynamics of urban digital intelligent transformation: Sustainable development through the national AI innovation pilot zone. Environ. Dev. Sustain. 2025. [Google Scholar] [CrossRef]
  33. Zhang, X.; Zheng, J.Y.; Wang, L.G. Can the relationship between atmospheric environmental quality and urban industrial structure adjustment achieve green and sustainable development in China? A Case of Taiyuan City. Energies 2022, 15, 3402. [Google Scholar] [CrossRef]
  34. Zeng, M.; Zhang, W.K. Green finance: The catalyst for artificial intelligence and energy efficiency in Chinese urban sustainable development. Energ. Econ. 2024, 139, 107883. [Google Scholar] [CrossRef]
  35. Masha, M.; Tadila, G.; Bojago, E. GIS-based analysis of urban expansion in Wolaita Sodo, South Ethiopia: Implications for sustainable development. Discov. Sustain. 2025, 6, 270. [Google Scholar] [CrossRef]
  36. Bounoua, L.; Bachir, N.; Souidi, H.; Bahi, H.; Lagmiri, S.; Khebiza, M.Y.; Nigro, J.; Thome, K. Sustainable development in Algeria’s urban areas: Population growth and land consumption. Urban. Sci. 2023, 7, 29. [Google Scholar] [CrossRef]
  37. Lu, X.H.; Shi, Z.X.; Li, J.; Dong, J.H.; Song, M.J.; Hou, J. Research on the impact of factor flow on urban land use efficiency from the perspective of urbanization. Land 2022, 11, 389. [Google Scholar] [CrossRef]
  38. Gu, H.; Guo, G.; Li, C. Treating the symptoms as well as the root causes: How the digital economy can mitigate the negative impacts of land resource mismatches on urban ecological resilience. Land 2024, 13, 1463. [Google Scholar] [CrossRef]
  39. Wang, J.; Wu, H.; Xiao, D.; Luo, X.; Liu, Y.; Wang, W. Can the digital economy address the loss of green development efficiency due to resource mismatch? Evidence from China’s land transaction markets. J. Environ. Plann Man. 2025, 68, 406–436. [Google Scholar] [CrossRef]
  40. Li, F.; Ma, R.; Du, M.; Ding, X.; Feng, J.; Jing, Y. The impact of land resource mismatch and environmental regulation on carbon emissions: Evidence from China. J. Environ. Plann Man. 2025, 68, 245–266. [Google Scholar] [CrossRef]
  41. Zhang, H.; Song, Y.; Zhang, M. How does land resource mismatch affect urban energy low-carbon transition? Urban. Clim. 2024, 58, 102236. [Google Scholar] [CrossRef]
  42. Zhang, X.; Ran, Q.; Xu, Y.; Jin, Y.; Ge, W. Regional differentiation of the pollution reduction effect of accountability audit of natural resource under the perspective of spatial mismatch in land supply: Evidence from China. J. Environ. Manage 2025, 384, 125554. [Google Scholar] [CrossRef]
  43. Lesage, J.; Pace, R.K. Introduction to Spatial Econometrics; CRC Press: Boca Raton, FL, USA, 2008. [Google Scholar]
  44. Qiao, Z.; Xu, X.; Zou, W.; Huang, Y. Urban sustainable development goals and ecosystem services: Pathways to achieving coordination. Land. Use Policy 2024, 146, 107317. [Google Scholar] [CrossRef]
  45. Wang, Y.; Zhang, K.X. Industrial and financial cooperation, heterogeneous green technological innovation, and urban low carbon transformation. Int. Rev. Econ. Financ. 2025, 102, 104380. [Google Scholar] [CrossRef]
  46. Liu, K.; Du, R.; He, J.X. Fluctuating development traits of industrial land mismatch and its influence on urban ecological modernization. Land 2025, 14, 1035. [Google Scholar] [CrossRef]
  47. Nie, L.; Ren, Z.; Wu, Y.; Luo, Q. Urban industrial land misallocation and green total factor productivity: Evidence from China’s Yellow River basin regions. Aust. Econ. Pap. 2024, 63, 646. [Google Scholar] [CrossRef]
  48. Wen, Z.; Lee, W.-S.; Woo, S. Impact of land resource misallocation on carbon emission efficiency: Empirical evidence from 274 cities in China. Front. Environ. Sci. 2025, 13, 1652558. [Google Scholar] [CrossRef]
  49. Chen, M.; Zeng, L.; Deng, Y.; Chen, S.; Gu, X. The impact of land marketization on urban resilience: Empirical evidence from Chinese cities. Land 2024, 13, 1385. [Google Scholar] [CrossRef]
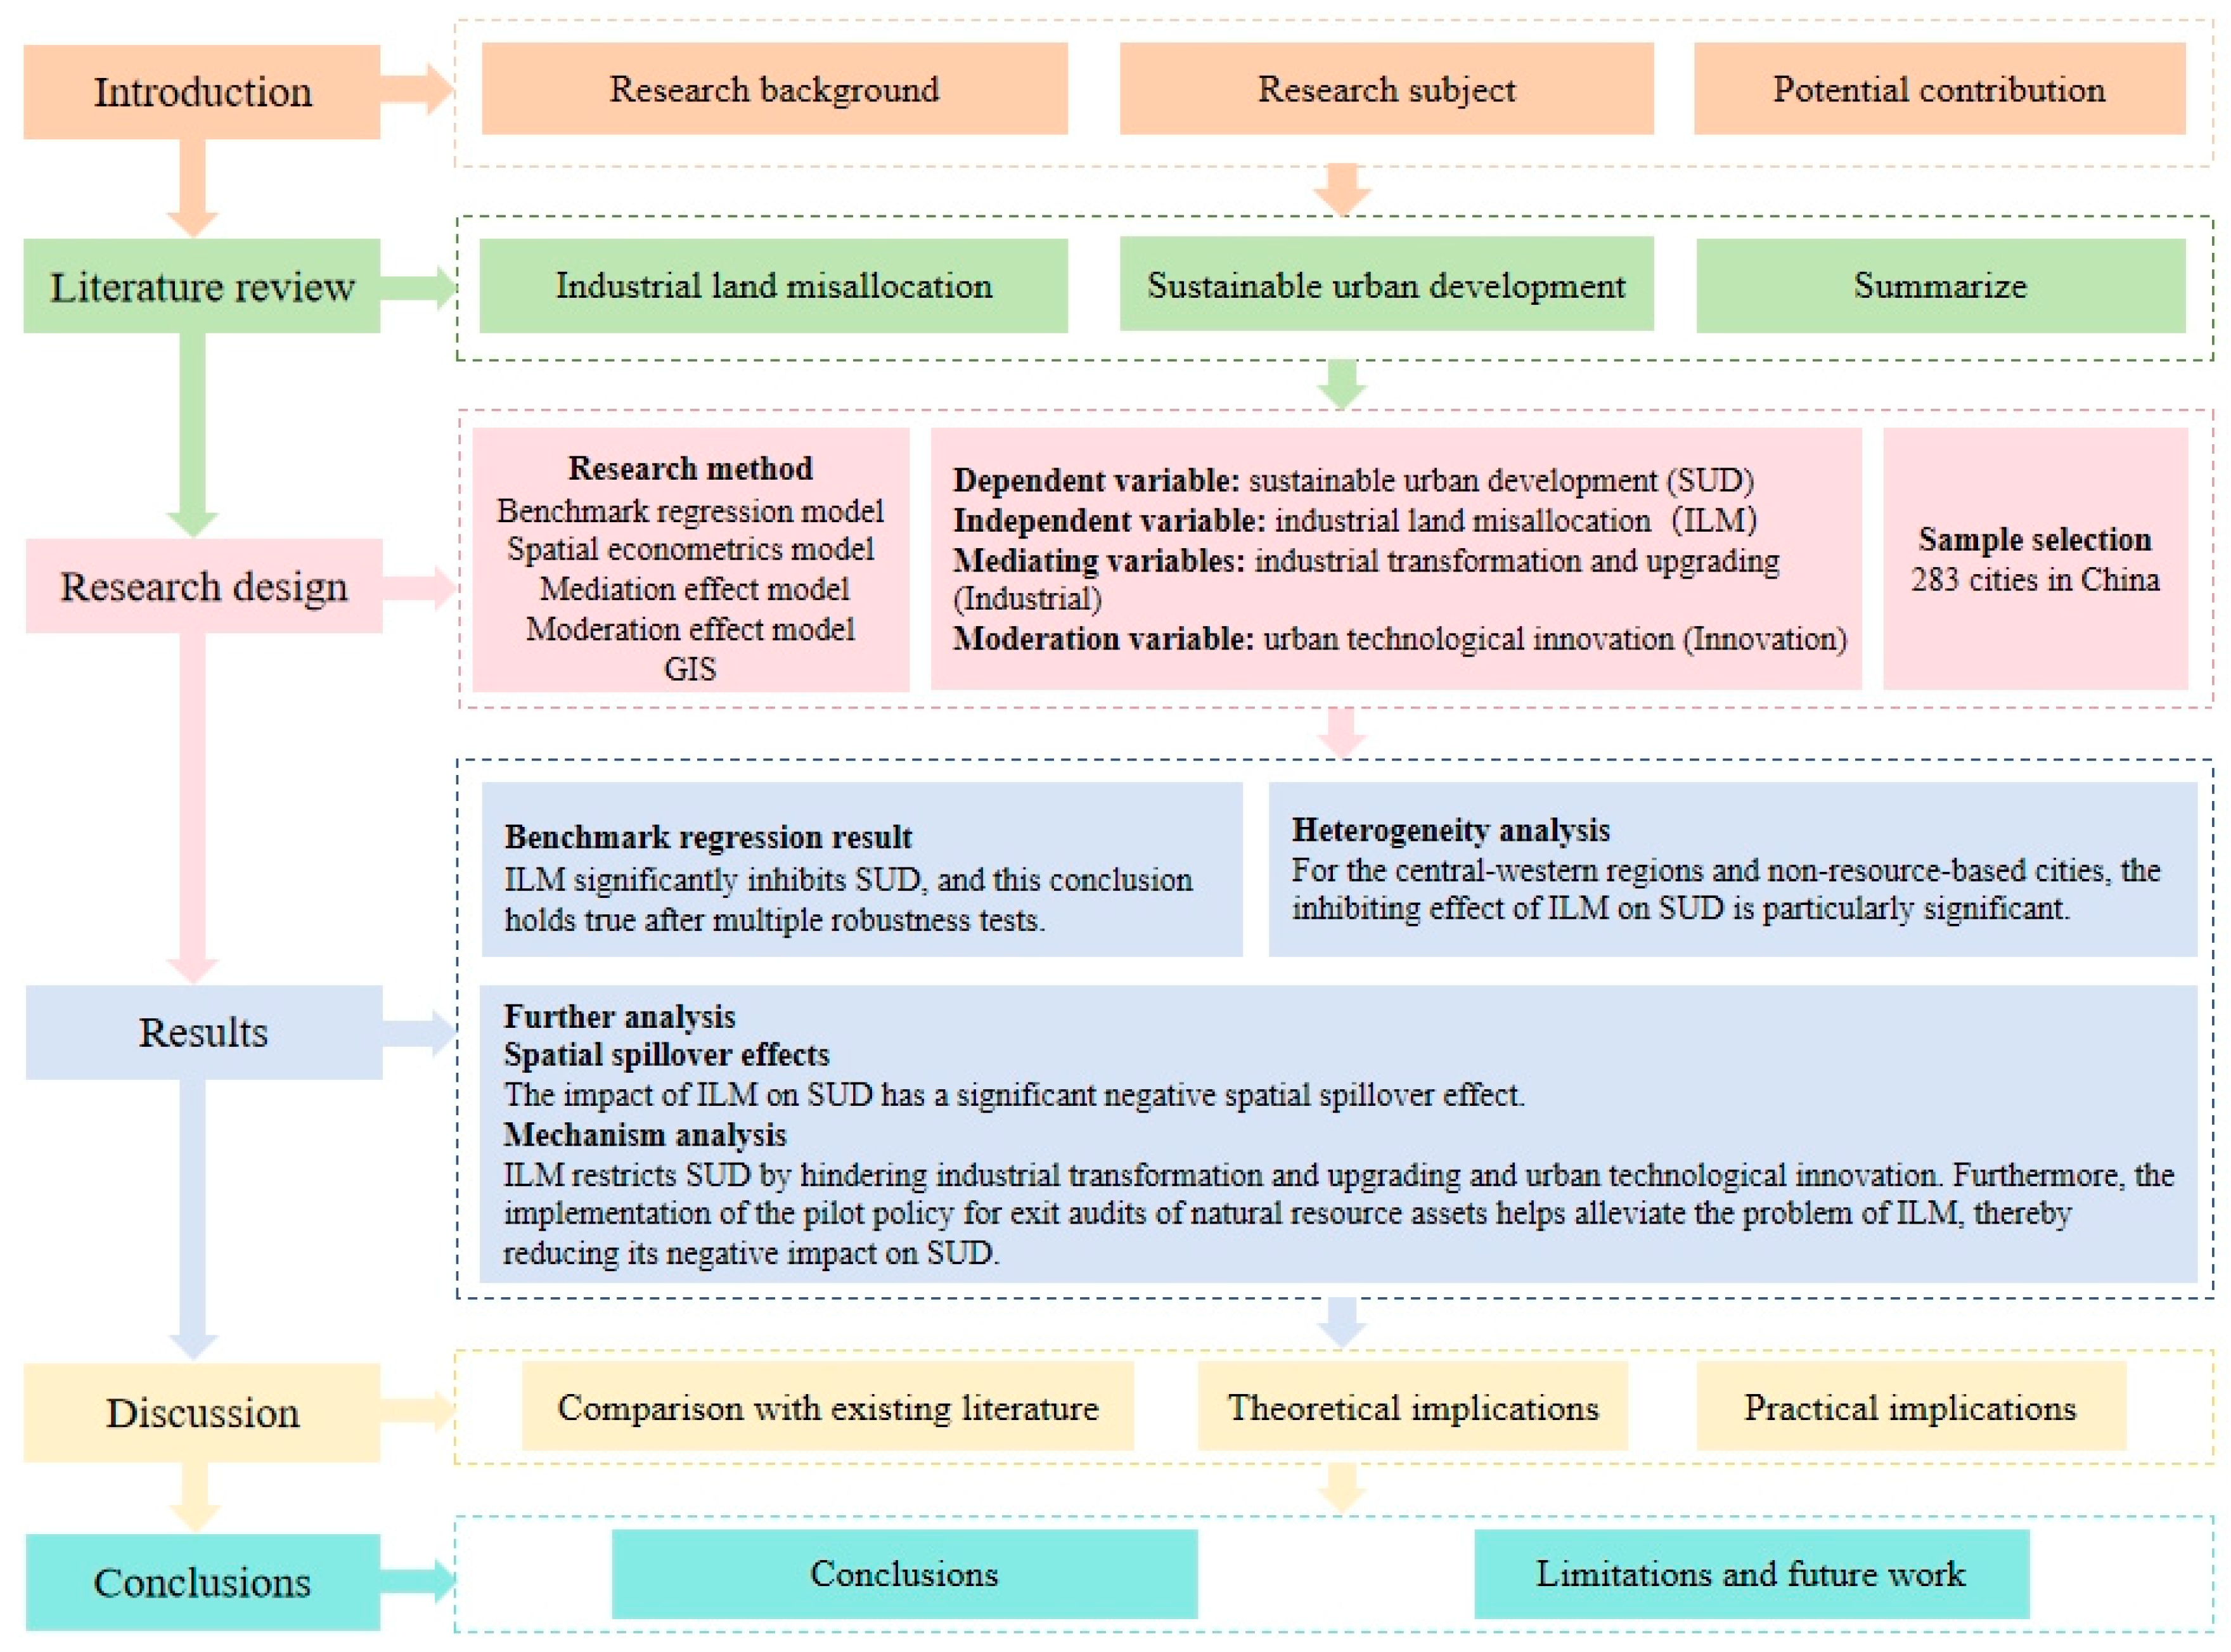
Figure 1. Research process.
Land 14 01976 g001
Figure 2. Impact Mechanism.
Land 14 01976 g002
Figure 3. The spatial distribution characteristics of SUD.
Land 14 01976 g003aLand 14 01976 g003b
Figure 4. The classification features of ILM.
Land 14 01976 g004
Table 1. The indicator system of SUD.
SystemIndicatorSDG TypeTargetAttribute
EconomyRegional GDP per capita (10,000 RMB/person)SDG 8-Economic Growth8.1+
Regional GDP growth rate (%)SDG 8-Economic Growth8.1+
Number of invention patents granted per 1 billion RMB of regional GDP (units/billion RMB)SDG 9-Innovation and Infrastructure9.5+
R&D expenditure as a percentage of regional GDP (%)SDG 9-Innovation and Infrastructure9.5+
Amount of actual foreign investment used (billion USD)SDG 17-Partnerships for the Goals17.3+
Total import and export as a percentage of regional GDP (%)SDG 17-Partnerships for the Goals17.11+
SocietyPer capita disposable income (10,000 RMB)SDG 1-No Poverty
/SDG 10-Reduced Inequality
1.1/10.1+
Education expenditure as a percentage of fiscal expenditure (%)SDG 4-Quality Education4.1+
Number of books per 100 people in public libraries (volumes)SDG 4-Quality Education4.2+
Number of hospital beds per 10,000 people (beds)SDG 3-Good Health and Well-being3.8+
EnvironmentRoad area per capita (m2/person)SDG 11-Sustainable Cities and Communities11.2+
Green coverage rate of built-up areas (%)SDG 11/SDG 1511.7/15.1+
Centralized treatment rate of sewage treatment plants (%)SDG 12-Responsible Consumption and Production12.2+
Harmless treatment rate of domestic waste (%)SDG 12-Responsible Consumption and Production12.5+
Utilization rate of industrial solid waste (%)SDG 12-Responsible Consumption and Production12.5+
Industrial wastewater discharge per unit of industrial output (tons/10,000 RMB)SDG 6-Clean Water and Sanitation6.3
Industrial sulfur dioxide emissions per unit of industrial output (tons/10,000 RMB)SDG 13-Climate Action13.2
Industrial smoke and dust emissions per unit of industrial output (tons/10,000 RMB)SDG 13-Climate Action13.2
Table 2. Descriptive statistics.
VariableObservationMeanSDMinMax
SUD36790.0590.0410.0200.252
ILM36797.51512.2810.04773.691
Fis36790.4560.2210.0921.006
Con36796.3041.0633.8648.984
Emp36793.5920.8351.9636.225
Pop36795.5905.214−8.05021.300
Fin36792.4341.1210.9786.725
Urb36790.5490.1540.2450.949
Policy36790.3750.48401
Industrial36791.0160.5800.1085.348
Innovation36791.6491.6750.05720.683
Table 3. Results of baseline panel regression.
(1)(2)(3)(4)(5)(6)(7)
VariableSUDSUDSUDSUDSUDSUDSUD
lnILM−1.000 ***
(−22.99)
−0.486 ***
(−14.22)
−0.425 ***
(−12.97)
−0.405 ***
(−12.66)
−0.417 ***
(−12.80)
−0.278 ***
(−8.24)
−0.188 ***
(−5.61)
Fis 11.88 ***
(52.92)
8.788 ***
(32.45)
8.191 ***
(30.61)
8.183 ***
(30.58)
7.908 ***
(30.10)
5.125 ***
(15.73)
Con 1.103 ***
(18.75)
−0.180 *
(−1.65)
−0.179 *
(−1.65)
0.108
(0.99)
0.376 ***
(3.47)
Emp 1.813 ***
(13.79)
1.804 ***
(13.72)
1.326 ***
(9.89)
1.157 ***
(8.82)
Pop 0.017 *
(1.95)
0.020 **
(2.37)
0.030 ***
(3.55)
Fin 0.600 ***
(12.72)
0.455 ***
(9.64)
Urb 5.999 ***
(13.83)
Constant7.076 ***
(89.27)
1.074 ***
(8.39)
−4.536 ***
(−14.03)
−2.703 ***
(−7.90)
−2.753 ***
(−8.03)
−4.366 ***
(−12.17)
−7.283 ***
(−17.83)
Observations3679367936793679367936793679
City FEYesYesYesYesYesYesYes
Year FEYesYesYesYesYesYesYes
Number of cities 283283283283283283283
R-squared0.2660.4570.5430.5330.5330.5780.619
Note: t-statistics are shown in parenthesis. * p < 0.1; ** p < 0.05; *** p < 0.01, the following content also applies. The original values of the dependent variable are between 0 and 1. For ease of observation, the results reported in the table are the product of the dependent variable multiplied by 100; dividing the coefficient by 100 yields the interpretation of the original scale.
Table 4. Results of robustness test.
(1) One-Period Lag(2) Two-Period Lag(3) 5% Winsorization(4) 5% Trimming
VariableSUDSUDSUDSUD
L1.lnILM−0.189 ***
(−5.31)
L2.lnILM −0.203 ***
(−5.39)
lnILM −0.187 ***
(−7.08)
−0.242 ***
(−6.97)
Control variableYesYesYesYes
Constant−7.308 ***
(−16.79)
−7.218 ***
(−15.43)
−5.583 ***
(−18.00)
−2.440 ***
(−5.83)
City FEYesYesYesYes
Year FEYesYesYesYes
Observations 3396311336792010
R-squared0.6170.6170.6660.499
Table 5. Results of instrumental variable regression.
(1) IV-Ⅰ(2) IV-Ⅱ
VariablelnILMSUD
lnILM −0.644 ***
(−5.14)
IV0.062 ***
(17.21)
Kleibergen–Paap rk LM275.368
[0.000]
Cragg–Donald Wald F296.028
[16.38]
Control variableYesYes
City FEYesYes
Year FEYesYes
Observations 36793679
Table 6. Results of the heterogeneity analysis.
(1)
Eastern
(2)
Western-Central
(3) Resource
-Based Cities
(4) Non-Resource-Based Cities
VariableSUDSUDSUDSUD
lnILM−0.085
(−1.24)
−0.198 ***
(−6.63)
−0.154
(−1.46)
−0.200 ***
(−8.08)
Control variableYesYesYesYes
City FEYesYesYesYes
Year FEYesYesYesYes
Observations 1300237914692210
R-squared0.7080.4670.3710.641
Table 7. Spatial correlation test for SUD.
YearMoran’s IZ-ValuesYearMoran’s IZ-Values
20090.445 ***11.21620100.430 ***10.806
20110.404 ***10.13420120.395 ***9.912
20130.381 ***9.55020140.395 ***9.897
20150.395 ***9.89720160.402 ***10.028
20170.399 ***9.94020180.398 ***9.921
20190.352 ***8.78620200.339 ***8.438
20210.340 ***8.453
Table 8. Model applicability test.
TestStatisticp-Value
LM-lag556.6900.000
Robust LM-lag12.5110.000
LM-error1750.1050.000
Robust LM-error1205.9260.000
LR-lag49.060.000
LR-error220.140.000
WALD-lag66.870.000
WALD-error207.270.000
Table 9. Spatial econometric model estimation results.
(1) Adjacent Matrix(2) Economic Distance Matrix
Effect Decomposition Effect Decomposition
VariableSUDAverage Direct EffectAverage Indirect EffectSUDAverage Direct EffectAverage Indirect Effect
lnILM−0.120 ***
(−3.71)
−0.139 ***
(−4.18)
−0.269 ***
(−3.70)
−0.163 ***
(−5.18)
−0.172 ***
(−5.32)
−0.287 **
(−2.39)
W × lnILM −0.112 **
(−2.28)
−0.132
(−1.60)
ρ0.428 ***
(22.37)
0.352 ***
(12.29)
sigma2_e5.175 ***
(42.08)
5.429 ***
(42.57)
Observations 36793679
Number of cities283283
Control variableYesYes
R-squared0.6300.628
Note: Values in parentheses are z-statistics. * p < 0.1, ** p < 0.05, *** p < 0.01, the following content also applies.
Table 10. Results of mediation effect test and moderating effect test.
(1)(2)(3)(4)(5)
VariableIndustrialSUDInnovationSUDSUD
lnILM−0.064 ***
(−11.57)
−0.144 ***
(−4.25)
−0.033 **
(−2.00)
−0.163 ***
(−5.24)
−1.164 ***
(−20.68)
Industrial 0.682 ***
(6.89)
0.357 ***
(4.45)
Innovation 0.741 ***
(24.15)
lnILM × Policy 0.357 ***
(4.45)
Control variableYesYesYesYesYes
Constant0.644 ***
(9.51)
−7.723 ***
(−18.79)
−2.595 ***
(−12.70)
−5.359 ***
(−13.82)
7.133 ***
(46.39)
City FEYesYesYesYesYes
Year FEYesYesYesYesYes
Observations36793679367936793679
Number of cities283283283283283
R-squared0.4310.6260.4160.6740.540
Disclaimer/Publisher’s Note: The statements, opinions and data contained in all publications are solely those of the individual author(s) and contributor(s) and not of MDPI and/or the editor(s). MDPI and/or the editor(s) disclaim responsibility for any injury to people or property resulting from any ideas, methods, instructions or products referred to in the content.