1. Introduction
Air quality is not just about what people breathe; it shapes health, the climate, food systems, and the balance of ecosystems [
1,
2,
3]. Air quality can contribute to the 3rd goal of the UN Sustainable Development Goals (Good health and well-being). Goal 11: Sustainable cities and communities are also addressed if the air quality is suitable for human beings. The air quality is deteriorating both in developed and developing nations. In Türkiye and worldwide, land use is changing fast [
4,
5,
6,
7]. Population, cities, and industries are expanding, and farmland is being pushed harder than ever [
8,
9,
10,
11]. These shifts do not happen in a vacuum. They change how heat moves through the environment, increase harmful emissions, and make it harder for polluted air to disperse, especially where land development moves quickly [
12,
13,
14].
Major cities like İstanbul, Ankara, İzmir, and Bursa have seen some of the most intense transformations [
15,
16,
17]. They have spread outward, and rural areas have seen forests cut back and farming practices shift [
18,
19,
20]. Urbanization of forests and agricultural lands disrupts natural air purification, leading to heat islands and increased degradation. The country’s diverse climate and geography create regional disparities. Satellite technologies (TROPOMI, Landsat, and MODIS) allow monitoring of land-atmosphere interactions.
The relationship between land use and land cover changes (LULC) and air quality has been the subject of numerous studies on a global scale. Fang et al. [
21] examined the impact of urbanization on air quality in China using spatial regression models and revealed a significant relationship between urban sprawl and air pollution. Similarly, Fu and Tai [
22] examined the impact of climate and land cover changes on tropospheric ozone concentrations in East Asia and noted that changes in vegetation play a significant role in air quality. In a study of 659 districts in India, Gao et al. [
23] emphasized the importance of urban green spaces in improving air quality.
Studies in the United States reveal similar results. Superczynski and Christopher [
24] investigated the relationship between land use and air pollution in Alabama using remote sensing and GIS techniques and found that air quality declined significantly in industrial areas. Li et al. [
25] examined the effects of urbanization on regional meteorology and air quality in Southern California and stated that the urban heat island effect increases air pollution.
Studies conducted in Asia highlight the importance of regional dynamics. Vadrevu et al. [
26] synthesized the relationship between land use changes and air pollution in Asia and emphasized the importance of regional-scale policy development. Zhu et al. [
27] analyzed the correlation between land use/cover changes and air pollutants in Wuyishan, China, and demonstrated the positive impact of forested areas on air quality.
The existing literature lacks an integrated study that systematically examines the relationship between LULC changes and multiple air pollutants nationally and over a long time in Türkiye. Addressing this research gap, this study aims to monitor six key pollutants (Sulfur Dioxide (SO2), Ozone (O3), Aerosol Index (AI), Carbon Dioxide (CO2), Nitrogen Dioxide (NO2), and Formaldehyde (HCHO)) using the TROPOMI sensor on the Sentinel-5P satellite and satellite data from the ESA Climate Change Initiative for the period 2018–2024. Patterns and potential causal relationships will be revealed by comparing the changes in pollutants over time with land use transformations.
The primary objective of this study is to quantitatively understand the impact of LULC changes on air quality in Türkiye (
Figure 1) and to provide evidence-based recommendations for land management strategies that can effectively reduce pollution. The findings will help identify high-risk areas, understand pollutant sources, and provide practical guidance based on sophisticated satellite data for urban planning, agriculture, and environmental protection policies.
This study is the first national-scale study to examine the relationship between land use/land cover changes and air quality in Türkiye using six pollutant parameters (SO2, NO2, CO2, O3, AI, and HCHO) and six years of satellite data. The study’s innovative approach goes beyond traditional air quality monitoring methods and relies on the integrated analysis of multiple satellite datasets (Sentinel-5P, MODIS, Landsat) on the Google Earth Engine platform. This comprehensive methodology, with its ability to simultaneously assess both spatial and temporal dynamics, fills the existing gap in the literature and enables the development of policy recommendations tailored to Türkiye’s unique geographical conditions.
Research Questions
This study is structured around how changes in land use/land cover in Türkiye affect the spatial and temporal distribution of multiple air pollutants. The research is structured around four main themes to explore this fundamental question in depth. First, we examine cause-and-effect relationships such as the contribution of land use intensity to the formation of highly polluted regions, the degree to which urban and industrial sprawl is associated with high pollution levels, and the impact of vegetation loss on air quality. Second, we conduct comparative and spatial analyses, such as differences in land use composition between highly and moderately polluted regions, the spatial distribution of high and low-polluted areas, and the distinct terrain patterns exhibited by rural areas with low air quality compared to urban polluted regions. The third theme focuses on the temporal analysis of land use change dynamics in the most polluted regions of Türkiye during the 2019–2024 period and the role of urban-industrial sprawl in worsening air quality trends. Finally, policy and sustainability implications are explored, such as land management strategies to reduce excessive pollution in urban centers and the potential of green space types such as forests and meadows to improve air quality in polluting hotspots. This comprehensive set of questions aims to fill the gap in the existing literature and produce data-driven, actionable outcomes for policymakers.
2. Materials and Methods
2.1. Data Sources and Preprocessing
Different datasets were used for this study. Data preprocessing approaches were designed based on the multi-satellite data integration methodologies that Ayoobi et al. [
28] and Cakmak et al. [
29] proposed. The primary data sources of the study consist of atmospheric pollutant data, thermal data, and land cover data. The atmospheric pollutant data include daily measurements of SO
2, NO
2, CO
2, O
3, HCHO, and AI obtained from the TROPOMI sensor on the Sentinel-5P satellite at a spatial resolution of 0.01° × 0.01°. Land Surface Temperature (LST) data from the MODIS (MOD11A2) product at a spatial resolution of 1 km and in the form of 8-day composites were used as the thermal data source. Land cover data were obtained from Landsat with a resolution of 30 m and MODIS terrain classification products with a resolution of 500 m.
In the data preprocessing stage, cloud masking algorithm and atmospheric correction methods were applied [
30,
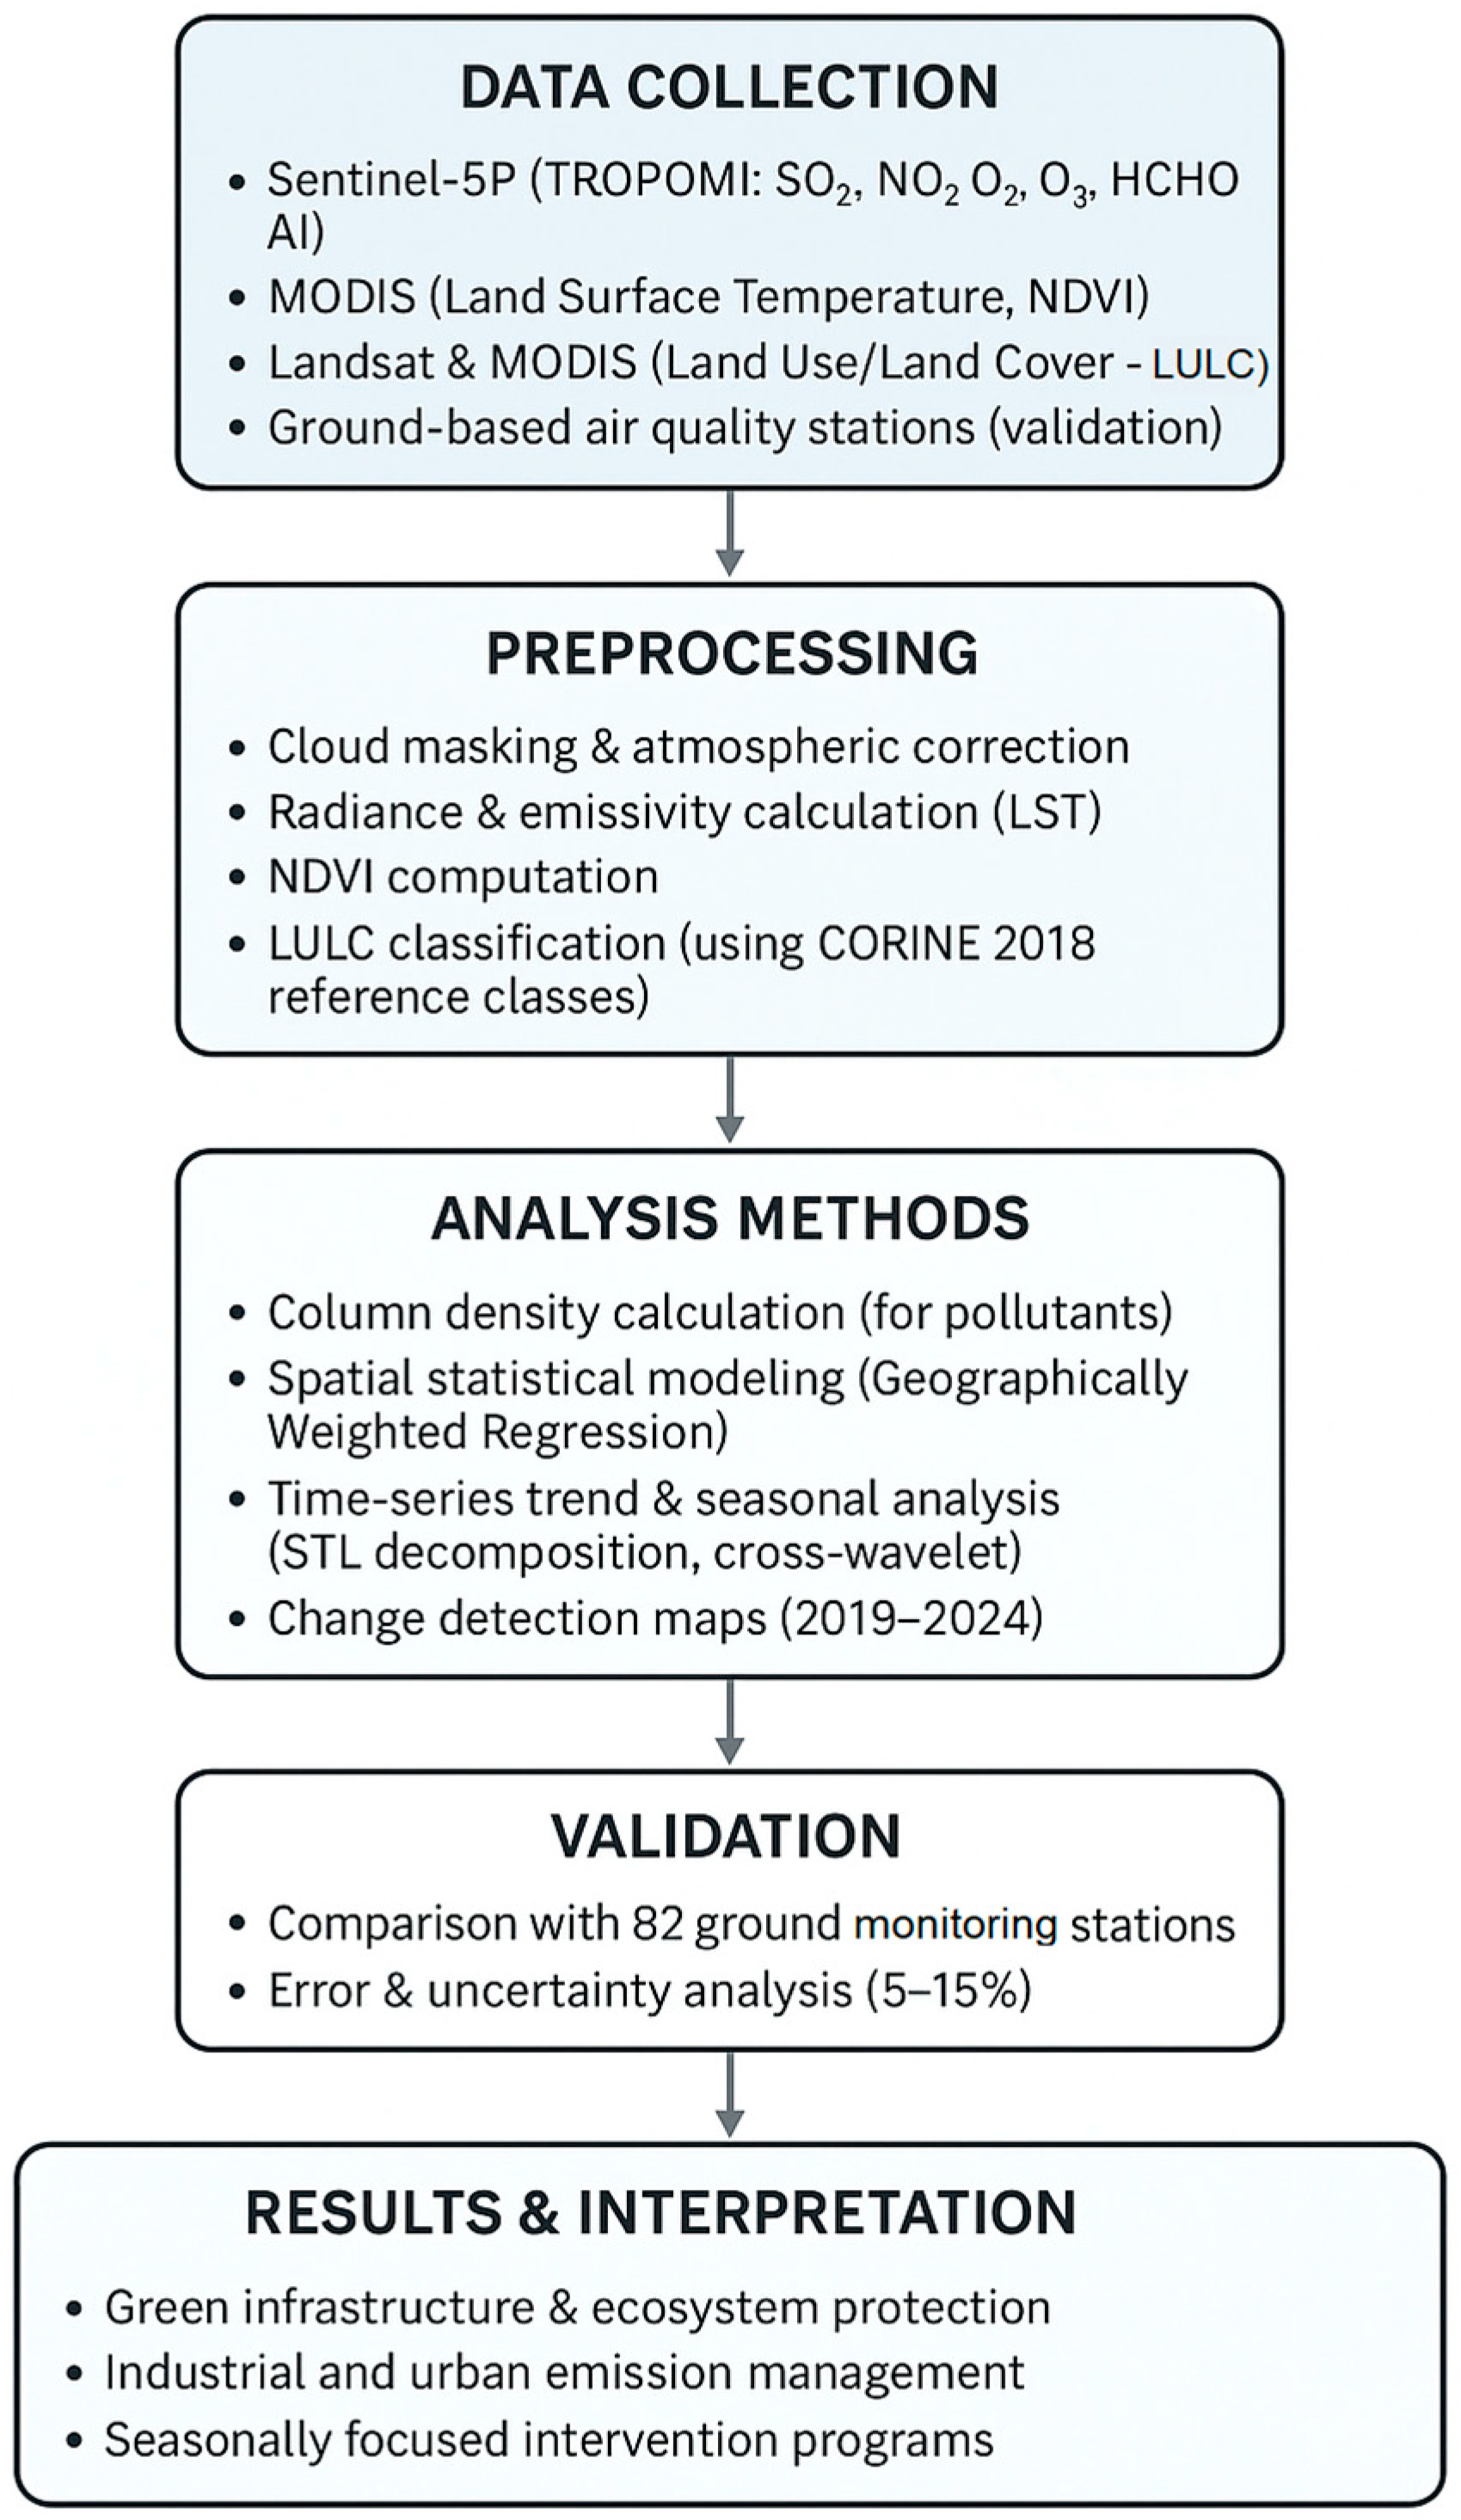
31]. Especially for TROPOMI data, the Rayleigh correction was applied to minimize scattering effects. The methodological framework of this study is shown in
Figure 2.
2.2. Pollutant Column Density Calculation
For the column density calculations of atmospheric pollutants, the basic physical equation used by Yilmaz et al. [
32] in their wildfire emissions study was adopted (Equation (1)).
where
is the number of molecules per unit area (molecules/cm
2), obtained directly from TROPOMI L2 products,
A is Avogadro’s number (6.022 × 10
23 molecules/mol),
μ is the molecular weight of the relevant gas (g/mol). For example, NO
2 is 46.0055 g/mol,
g: Gravitational acceleration (9.81 m/s
2), which may vary slightly depending on latitude and altitude.
These calculations were made in parallel for each Google Earth Engine platform pixel, and monthly averages were created.
2.3. LULC Classification
Landsat 8 OLI/TIRS and MODIS MCD12Q1 data provided by USGS Earth Explorer were downloaded for 2023. MODIS [
33,
34] and Landsat data [
35,
36] are frequently used in LULC map production of large areas.
Preprocessing was first applied to these data. Atmospheric Correction, Mosaicization, and Clipping were performed in this phase. In the second phase, a classification algorithm was applied to Türkiye, using the CORINE 2018 classes as a reference. Postprocessing included Filtering and Class Merging. Both maps achieved an accuracy of 85%+ to CORINE standards. Using Landsat and MODIS data, the LULC of the study area was classified into six major classes: irrigated agriculture, dry farming, urban, forest, pasture, and water. This land cover classification is essential to compare air quality between urban and non-urban areas.
2.4. Land Surface Temperature (LST) Calculation
The radiance-based transformation algorithm was used to process MODIS LST data. The general formula for the LST is shown in Equation (2) [
37].
where LST is the land surface temperature (°C), BT is the radiance temperature (Kelvin) calculated from thermal bands, MODIS bands 31 (10.78–11.28 μm) and 32 (11.77–12.27 μm) were used,
λ is the effective wavelength (μm). 11.03 μm for MODIS band 31 and 12.02 μm for band 32, physical constant
ρ: h × c/σ = 1.438 × 10
−2 mK (Planck’s constant × speed of light/Stefan-Boltzmann constant),
ε is the surface emissivity, calculated based on NDVI and calibrated according to land cover type.
Considering the quality control flags in the MODIS products, these calculations were made, and anomalous values were filtered.
2.5. Vegetation Analysis (NDVI)
The Normalized Vegetation Index (NDVI) method, successfully applied by Hussain et al. [
38], was used to analyze vegetation changes as seen in Equation (3).
where
ρNIR is the near-infrared band reflectance value (B5 for Landsat 8, 0.85–0.88 μm),
ρRed is the red band reflectance value (B4 for Landsat 8, 0.64–0.67 μm), NDVI values are normalized in the range [−1, 1], with values above 0.3 indicating healthy vegetation.
2.6. Spatial Statistical Modeling
The Geographically Weighted Regression (GWR) model was applied to model the relationships between LULC changes and air quality parameters [
39]. The general form of the model is seen in Equation (4).
where
yi is the dependent variable at location
i (e.g., NO
2 concentration), (
ui,
vi) are the coordinates of location i (WGS84 projection),
β0 is the constant term (intercept),
βk is the regression coefficient of the kth independent variable,
xik is the Kth coefficient at location i of the independent variable (e.g., urbanization rate), and
εi is the error term.
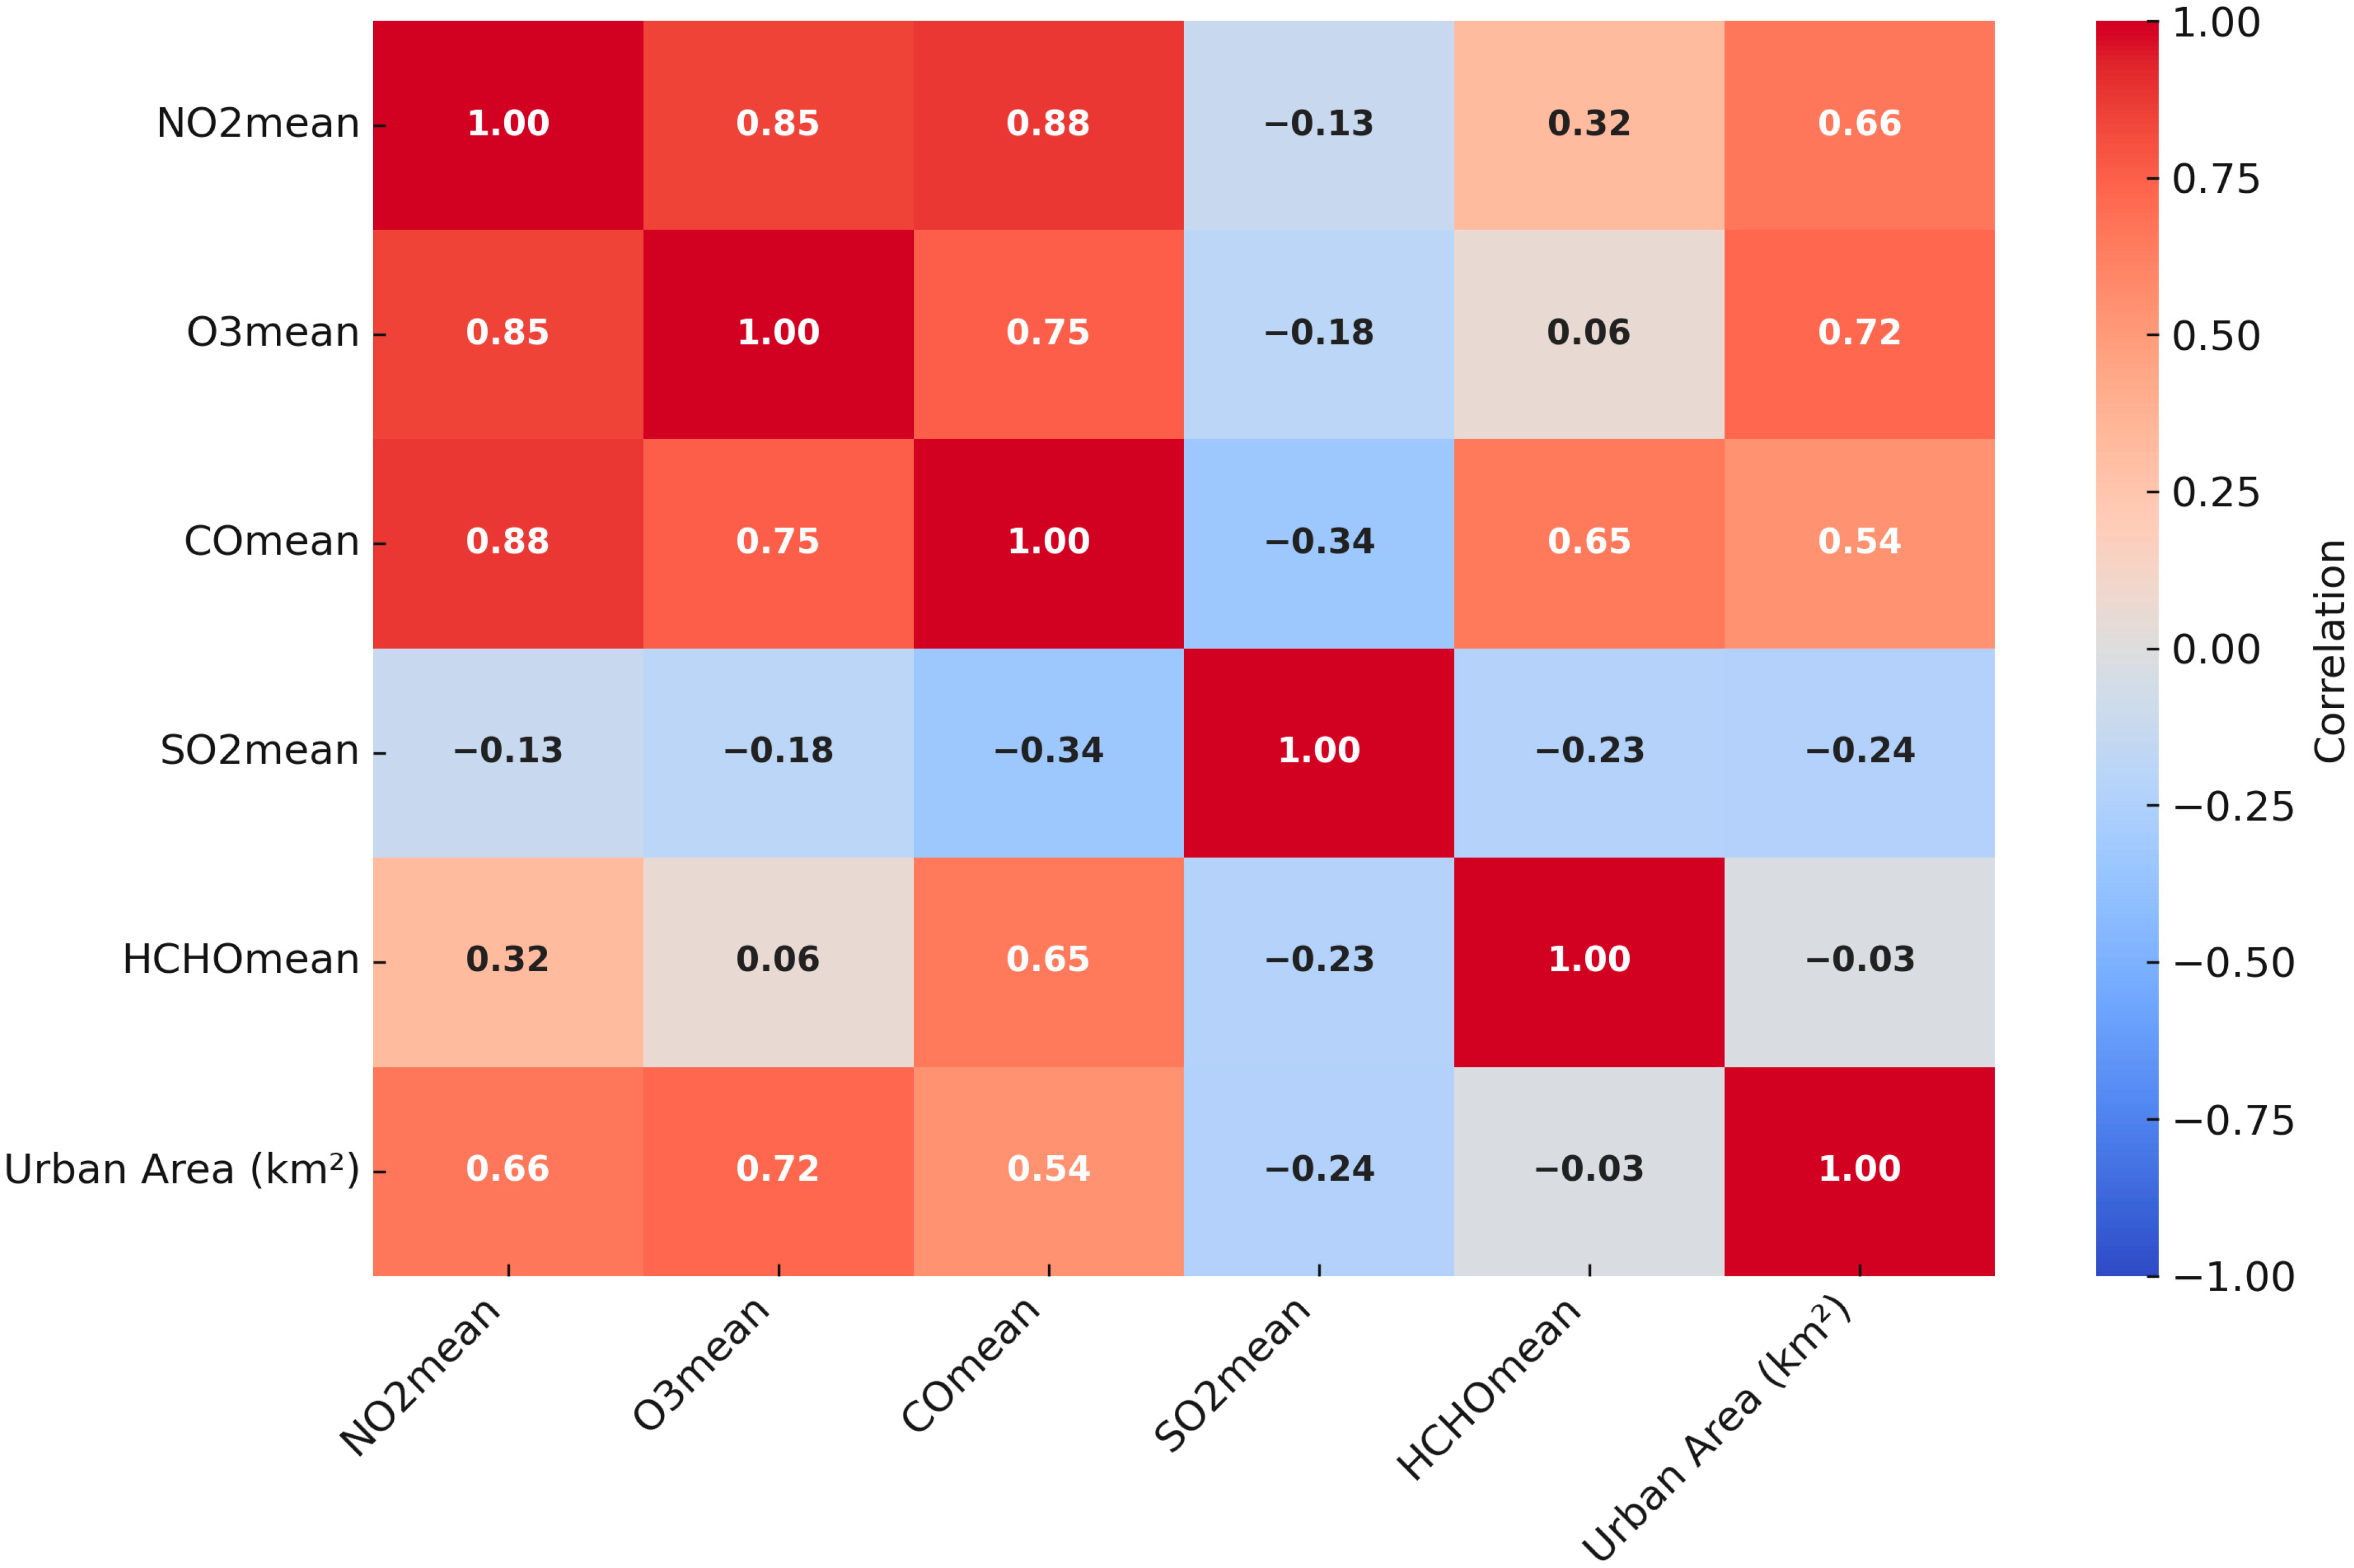
The analysis of the correlation heatmap provides a comprehensive understanding of the relationship between urban area size and air pollution parameters, offering insights into how urban growth affects air quality dynamics.
The results indicate that a strong positive correlation exists between urban area size and NO2 (0.66), O3 (0.72), and CO (0.54). This finding suggests that as cities expand, the concentrations of these pollutants tend to increase significantly. The elevated levels of NO2 are likely associated with higher traffic density, intensified industrial activities, and increased fossil fuel consumption, all more pronounced in larger metropolitan areas such as Istanbul, Ankara, and Izmir. Similarly, O3, which exhibited the highest correlation, is primarily formed through photochemical reactions involving NOX and volatile organic compounds (VOCs). The larger the urban area, the more emissions are generated, creating optimal conditions for ozone formation. The moderate correlation between CO and urban area size further reflects the impact of transportation and residential heating on air quality, albeit to a lesser degree than NO2 and O3.
In contrast, a weak negative correlation was observed between urban area size and SO2 (−0.24). This indicates that SO2 concentrations are less dependent on the extent of urbanization and are instead strongly influenced by specific point sources, such as coal-fired power plants and industrial facilities, which may be located outside densely populated urban cores. HCHO displayed almost no correlation (−0.03) with urban area size, implying that its presence is driven by highly localized factors, including biomass burning, agricultural practices, and specific industrial processes, rather than general urban expansion.
Overall, the findings reveal that urban growth is a key driver of air pollution, particularly for NO
2, O
3, and CO, which are closely linked to transportation and energy consumption patterns. Conversely, SO
2 and HCHO concentrations are shaped by localized and industrial sources, requiring targeted and region-specific monitoring and regulation. These results underscore the necessity of integrated urban planning strategies that address the environmental impacts of rapid urbanization. Policies aimed at improving public transportation, promoting renewable energy, and controlling emissions from industrial and traffic sources are essential to mitigating the detrimental effects of urban expansion on air quality. By doing so, sustainable urban development can be fostered while reducing the adverse health and environmental impacts associated with urban-related air pollution (
Figure 3).
2.7. Time Series Analysis
For the temporal analysis, data for 2018–2024 were processed using the spatiotemporal correlation analysis method proposed by Mishra and Mathew [
40]. This method includes extracting trend components (STL decomposition), seasonality modeling, and residual analysis. Additionally, cross-wavelet analysis was applied to determine the lagged relationships between urban heat island (UHI) and air pollution [
41]. A Gaussian kernel function and adaptive bandwidth were used in the model optimization to minimize spatial autocorrelation.
2.8. Validation
The validation process for the study consisted of two stages. In the first stage, ground measurements from 82 air quality monitoring stations belonging to the Ministry of Environment and Urbanization were compared with satellite measurements using Pearson correlation and RMSE metrics. In the second stage, uncertainty values (5–15%) from sensor documentation were integrated into the final results using propagation formulas. This comprehensive methodological approach allowed for the accurate depiction of both regional differences and temporal dynamics. In particular, thanks to the high processing power provided by Google Earth Engine, six years of data across Türkiye could be analyzed at daily resolution.
It should be noted that while the 5–15% uncertainty in the datasets affects the precision of absolute concentration values, it does not undermine the validity of the spatial and temporal trends identified in this study. Key findings, such as seasonal patterns (increases in NO2/SO2 in winter and O3 in summer) and urban-rural differences, are significantly above the uncertainty range. Therefore, while uncertainty affects the precision of quantitative estimates, relative comparisons and trend analyses are less affected, preserving the robustness of the main conclusions.
The RMSE values calculated from the new dataset indicate the agreement between satellite observations and ground-based measurements for each gas type. These results are crucial for identifying which parameters are more reliable and where caution is needed when interpreting satellite data.
For NO2, the RMSE value is 0.000028, which is extremely low. This indicates a firm agreement between satellite and ground-based measurements. Since NO2 is primarily associated with industrial activities, thermal power plants, and heavy traffic, this low error level suggests that satellite data for NO2 can be confidently used for monitoring and modeling air quality, especially in highly industrialized regions such as Zonguldak, Manisa, and Sivas. Such high reliability strengthens the applicability of these results for policy-making and environmental management.
For HCHO, the RMSE is 0.000096, which is also very low, showing excellent agreement between satellite and ground observations. Formaldehyde is a secondary pollutant produced by biomass burning and industrial processes. The low RMSE value indicates that satellite-based HCHO data can be used effectively alongside ground measurements for accurate air quality assessments, particularly in regions affected by industrial emissions.
SO2 has an RMSE of 0.000491, which is also considered low. This demonstrates strong consistency between satellite and ground station measurements. Since SO2 is predominantly emitted from thermal power plants and specific industrial processes, its low error level is particularly valuable for modeling and monitoring air pollution in industrial areas and evaluating the effectiveness of emission control policies.
For CO2, the RMSE is 0.028765, a low error level. This suggests that satellite and ground data are generally consistent, although some differences may occur in areas with localized emission sources, such as urban traffic hotspots. While CO satellite data are relatively reliable, caution is warranted when analyzing highly localized emission patterns.
O3 shows an RMSE of 0.143497, which represents a low error level. Ozone is a secondary pollutant formed through complex photochemical reactions strongly influenced by meteorological conditions. These factors contribute to discrepancies between satellite observations and ground measurements. Therefore, O3 satellite data should not be used in isolation and must be supplemented with ground-based measurements for accurate interpretation.
Lastly, the AI has a relatively high RMSE of 0.680122, indicating substantial discrepancies between satellite and ground data. Aerosol concentrations fluctuate rapidly and depend highly on local sources and atmospheric conditions. This mismatch becomes even more pronounced in urban environments with complex emission sources. Consequently, AI data should always be interpreted cautiously and validated with local ground measurements.
3. Results
This study investigated the impacts of LULC changes on six key air pollutants in Türkiye during 2019–2024 using TROPOMI/Sentinel-5P data. Landsat and MODIS datasets were integrated to produce detailed LULC maps. This approach revealed the relationships between LULC and air pollutants across Türkiye. The findings indicate that the spatial-temporal distribution of each pollutant is directly related to its LULC composition and change.
3.1. Detected Values for the Air Pollutants
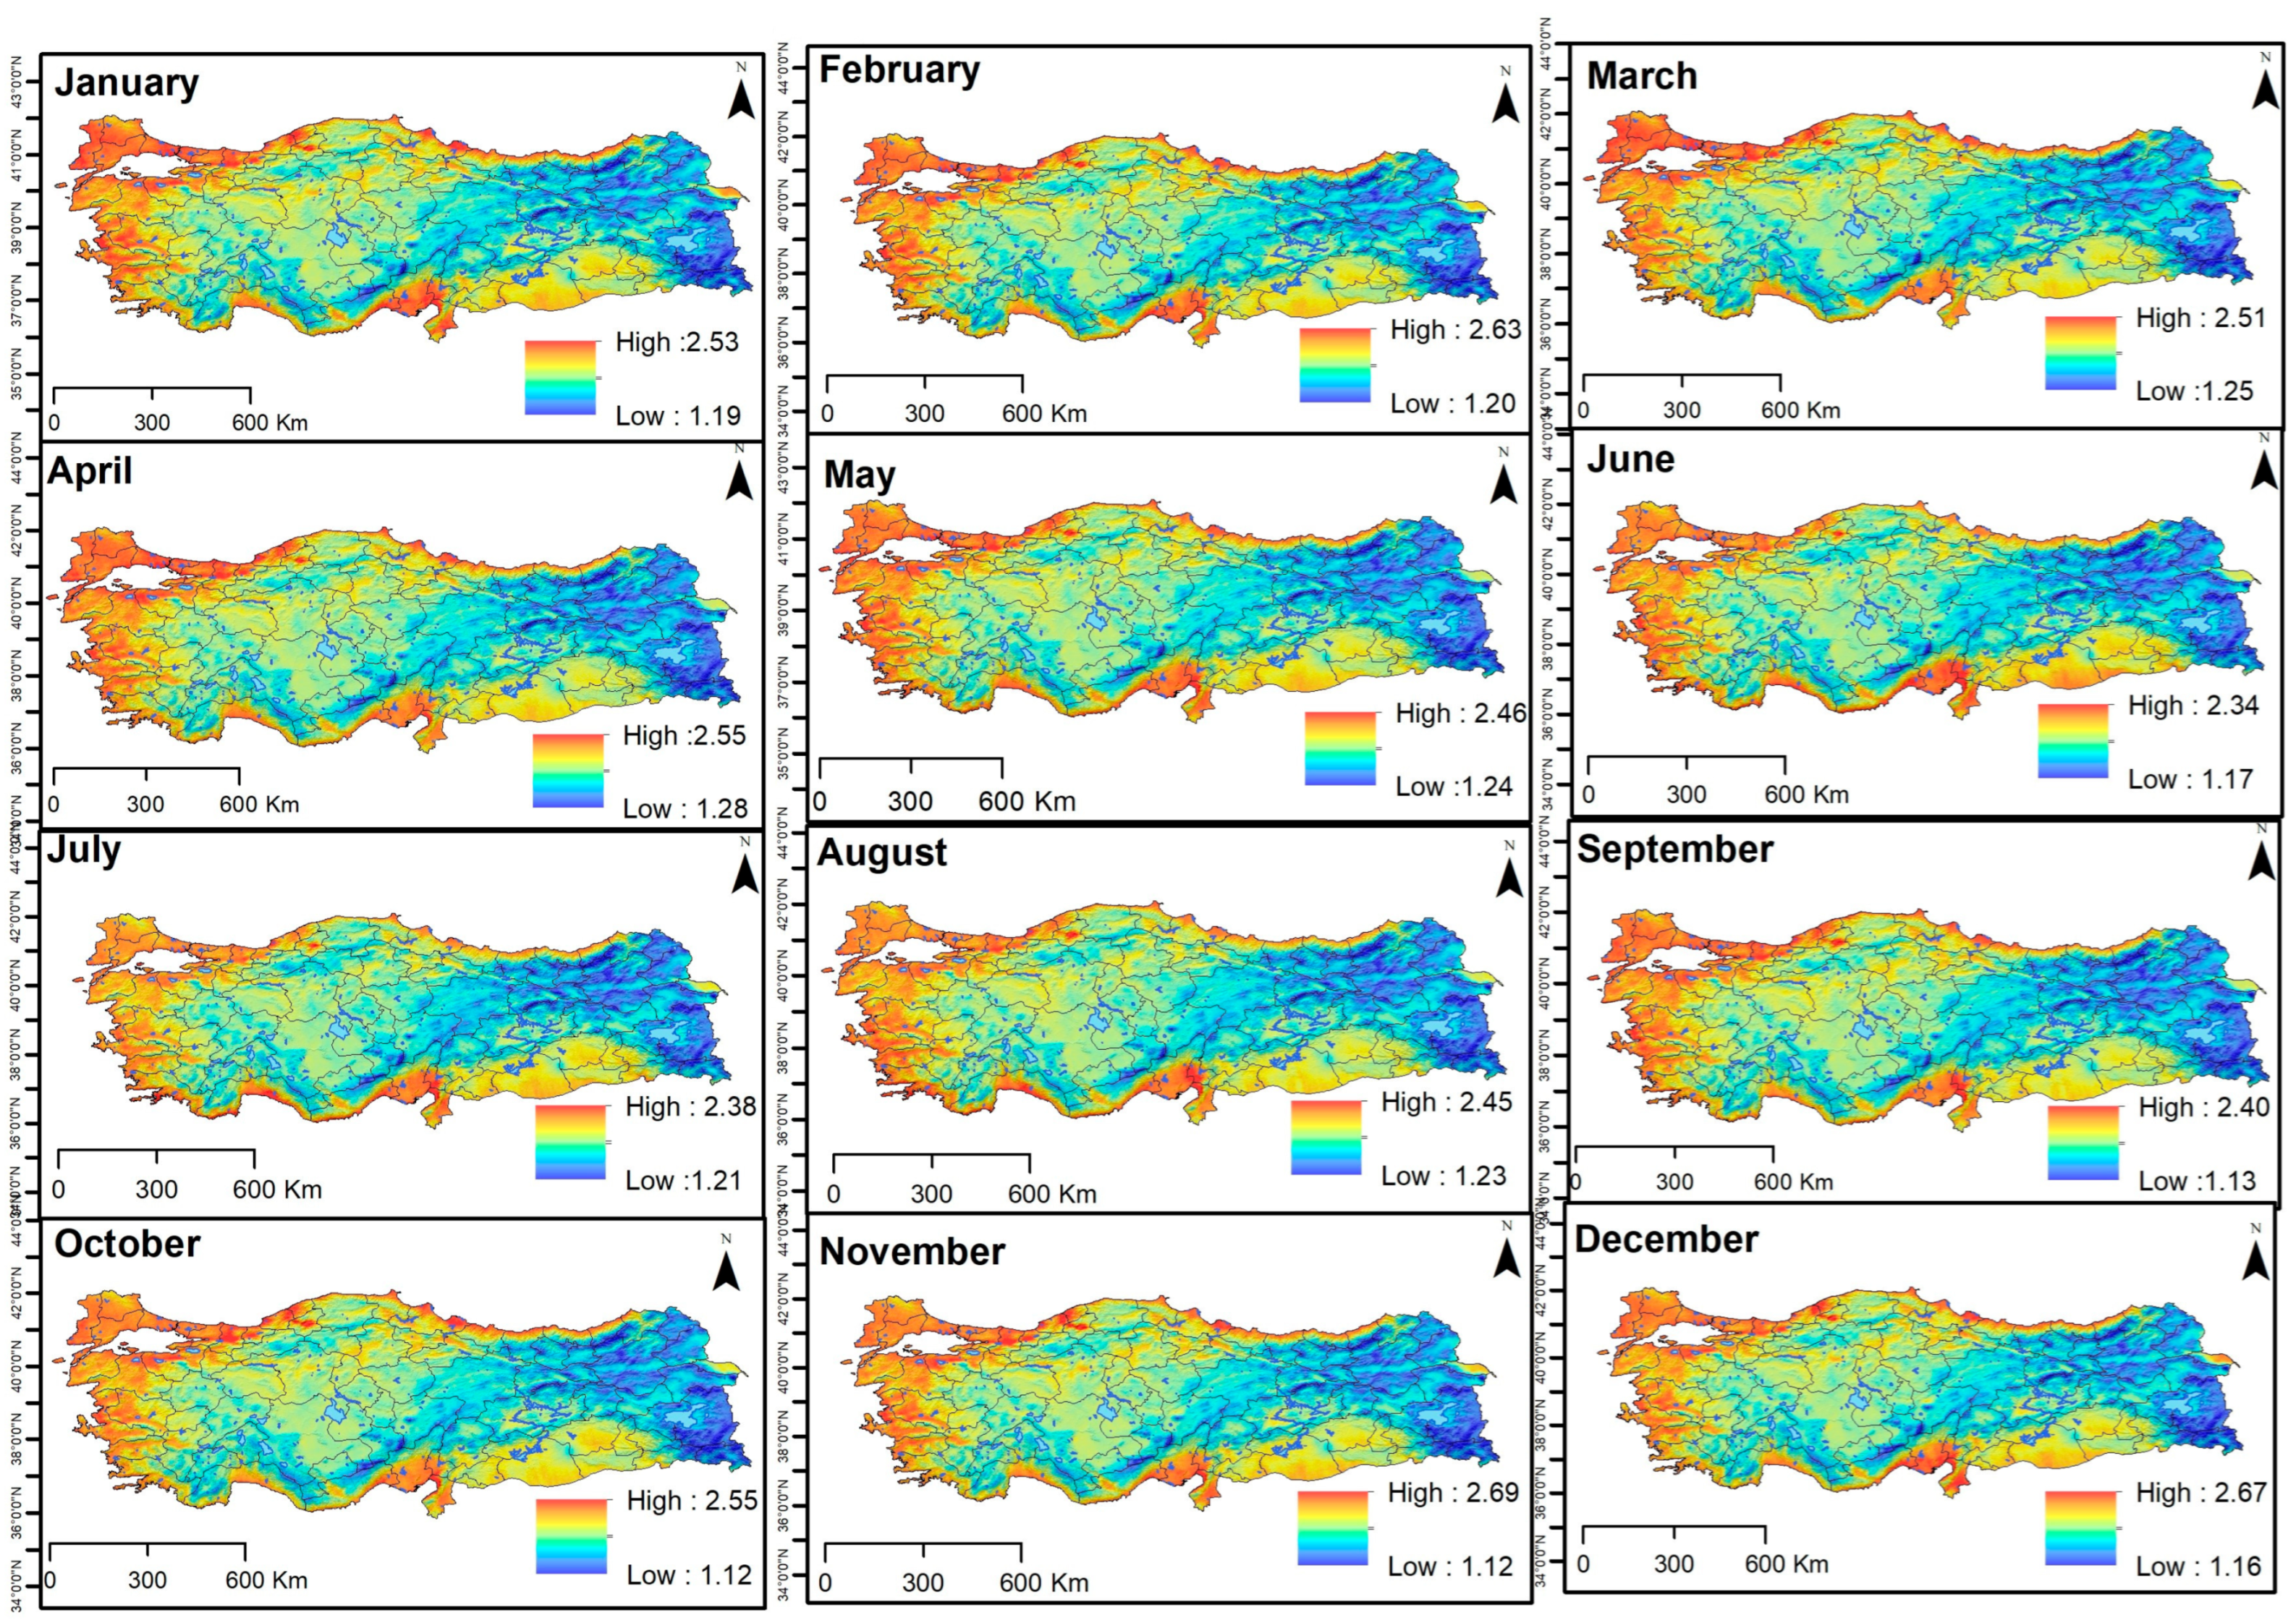
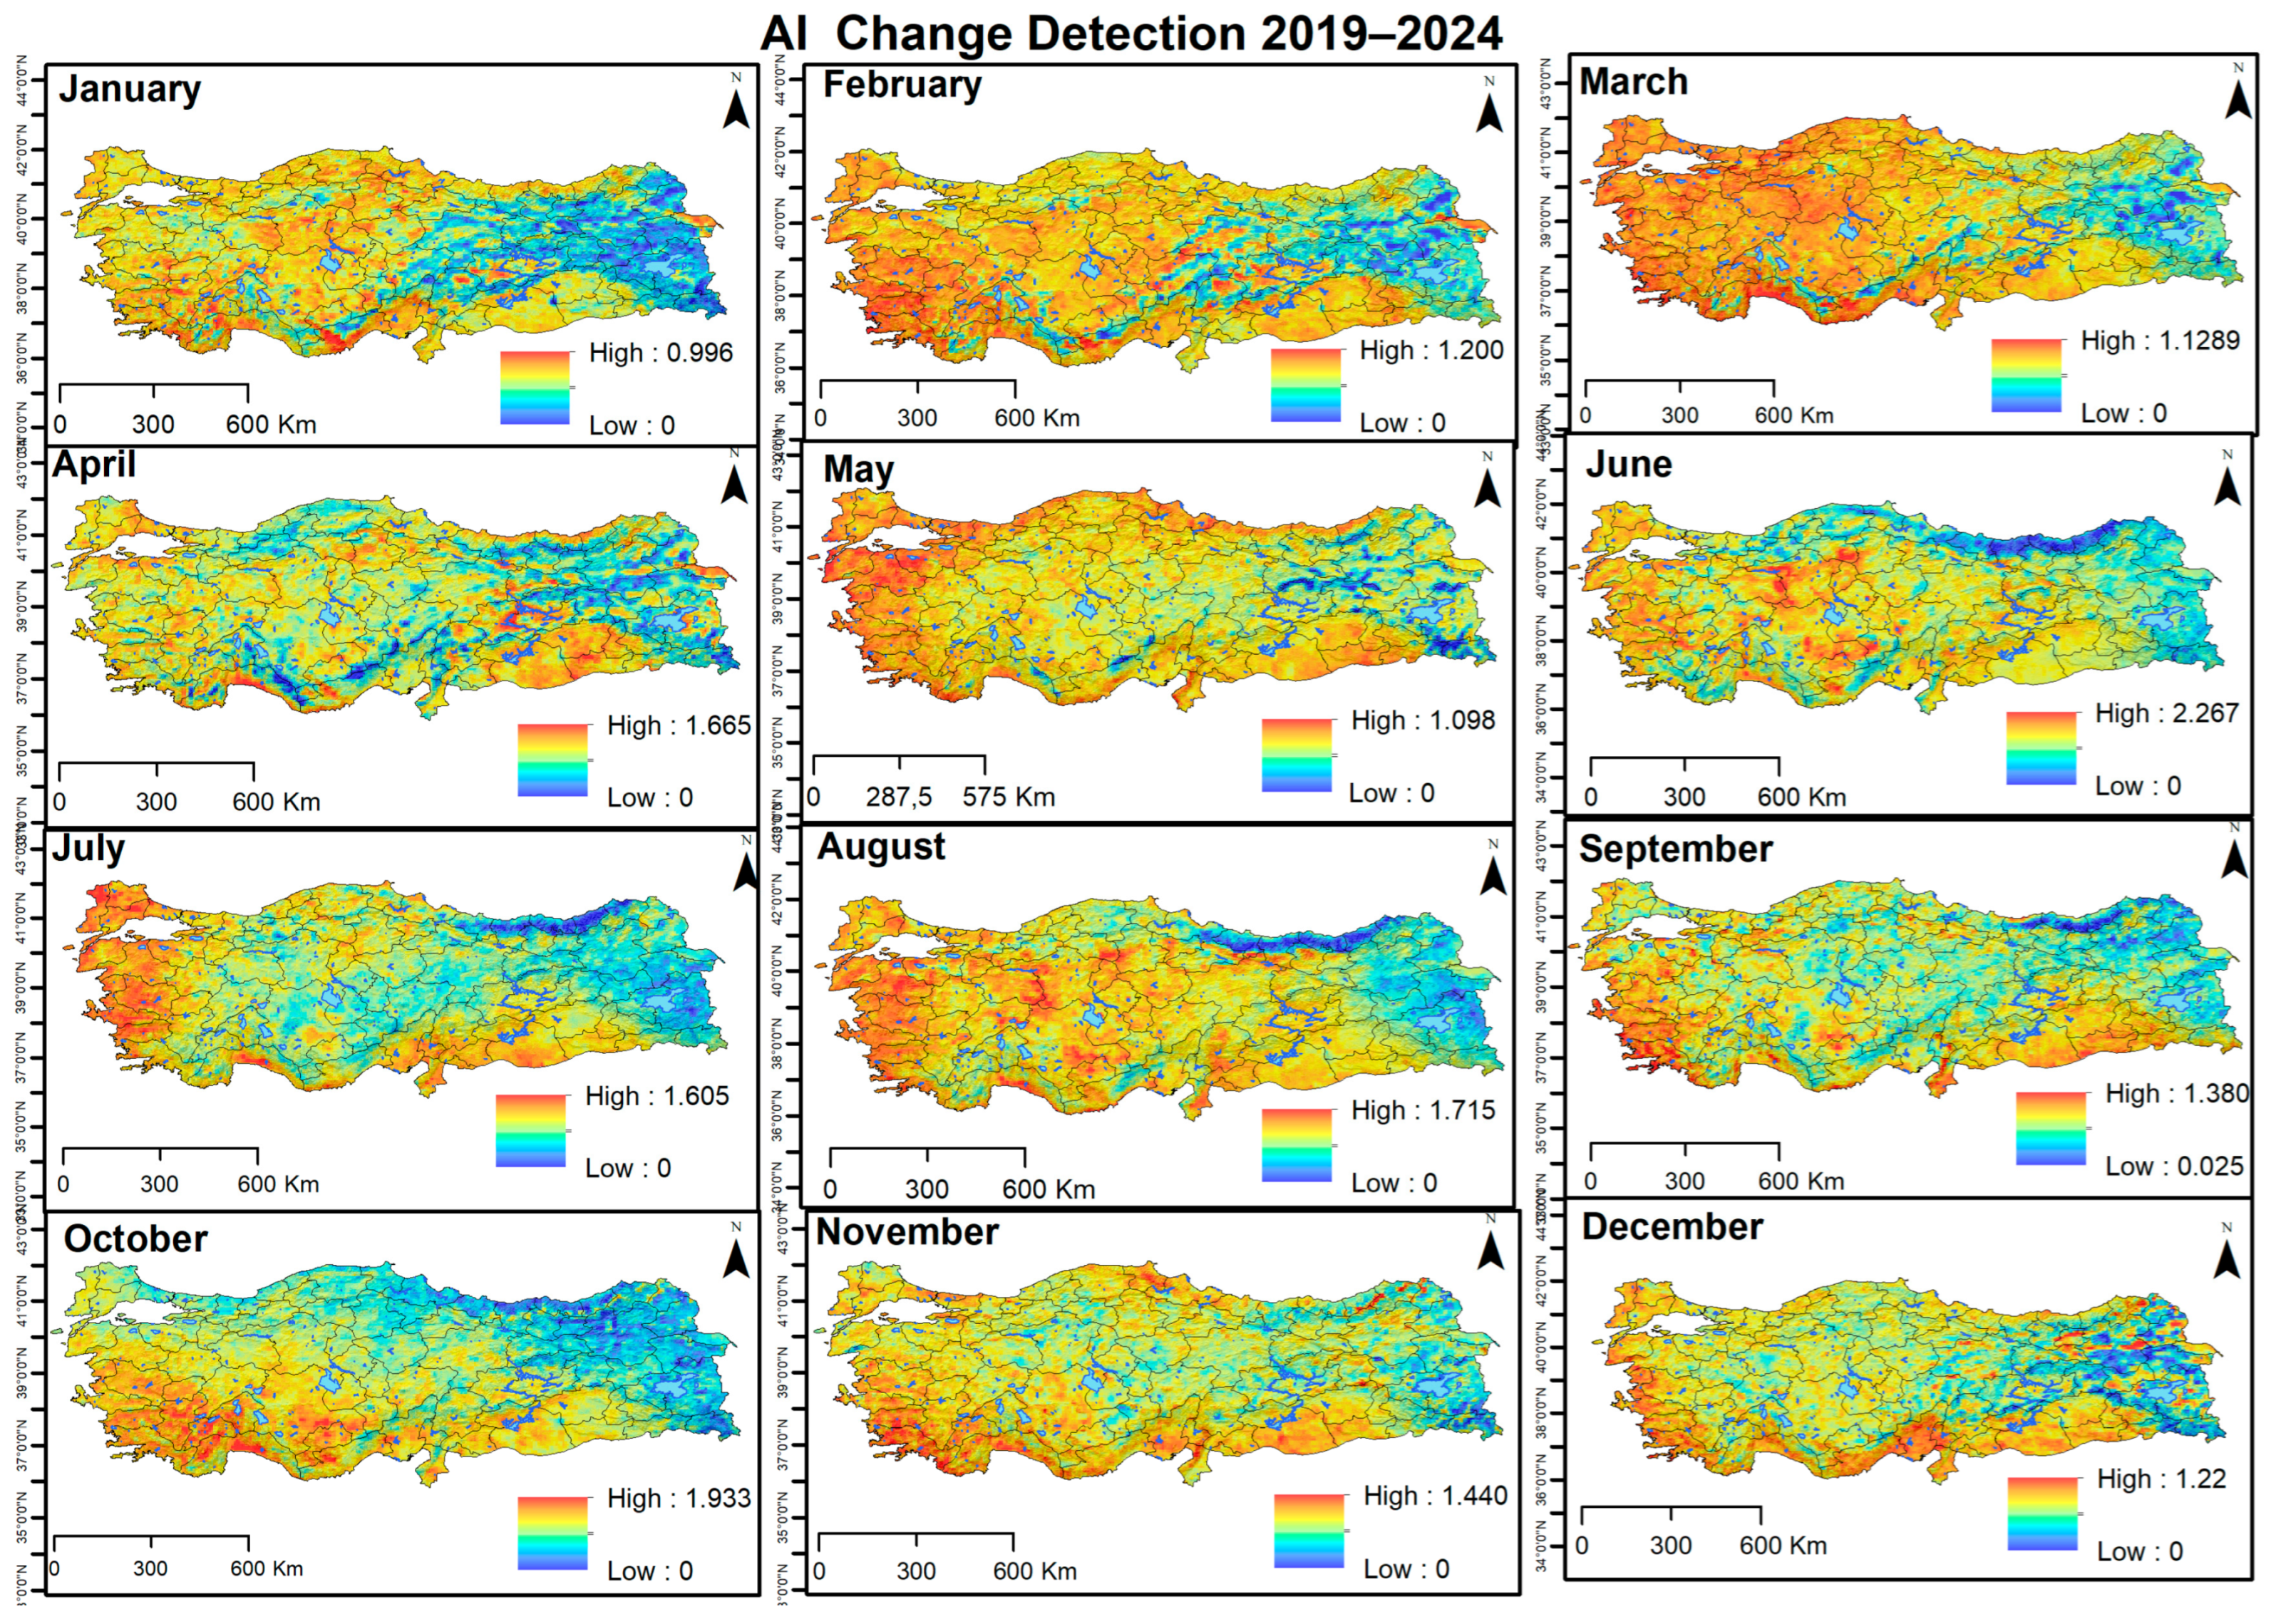
AI values remained high throughout the year, particularly in agricultural areas of Central Anatolia (Konya, Kayseri, Sivas, Turkey) and in the industrially dense provinces of the Marmara Region (
Figure 4). In spring and summer, values increased sharply due to dust transport from Syria and Iraq [
42]. In inland areas with low wind speeds, aerosols remained suspended in the air for extended periods, negatively impacting visibility and transportation safety.
CO
2 levels peaked during winter due to increased heating fuel use and energy production (
Figure 5). Compared to other provinces in Türkiye, heavy traffic and construction pressures have led to high CO
2 concentrations year-round in metropolitan areas such as Istanbul, Ankara, and Bursa. While relative decreases were observed in the summer, CO
2 remained high in regions with ongoing industrial production.
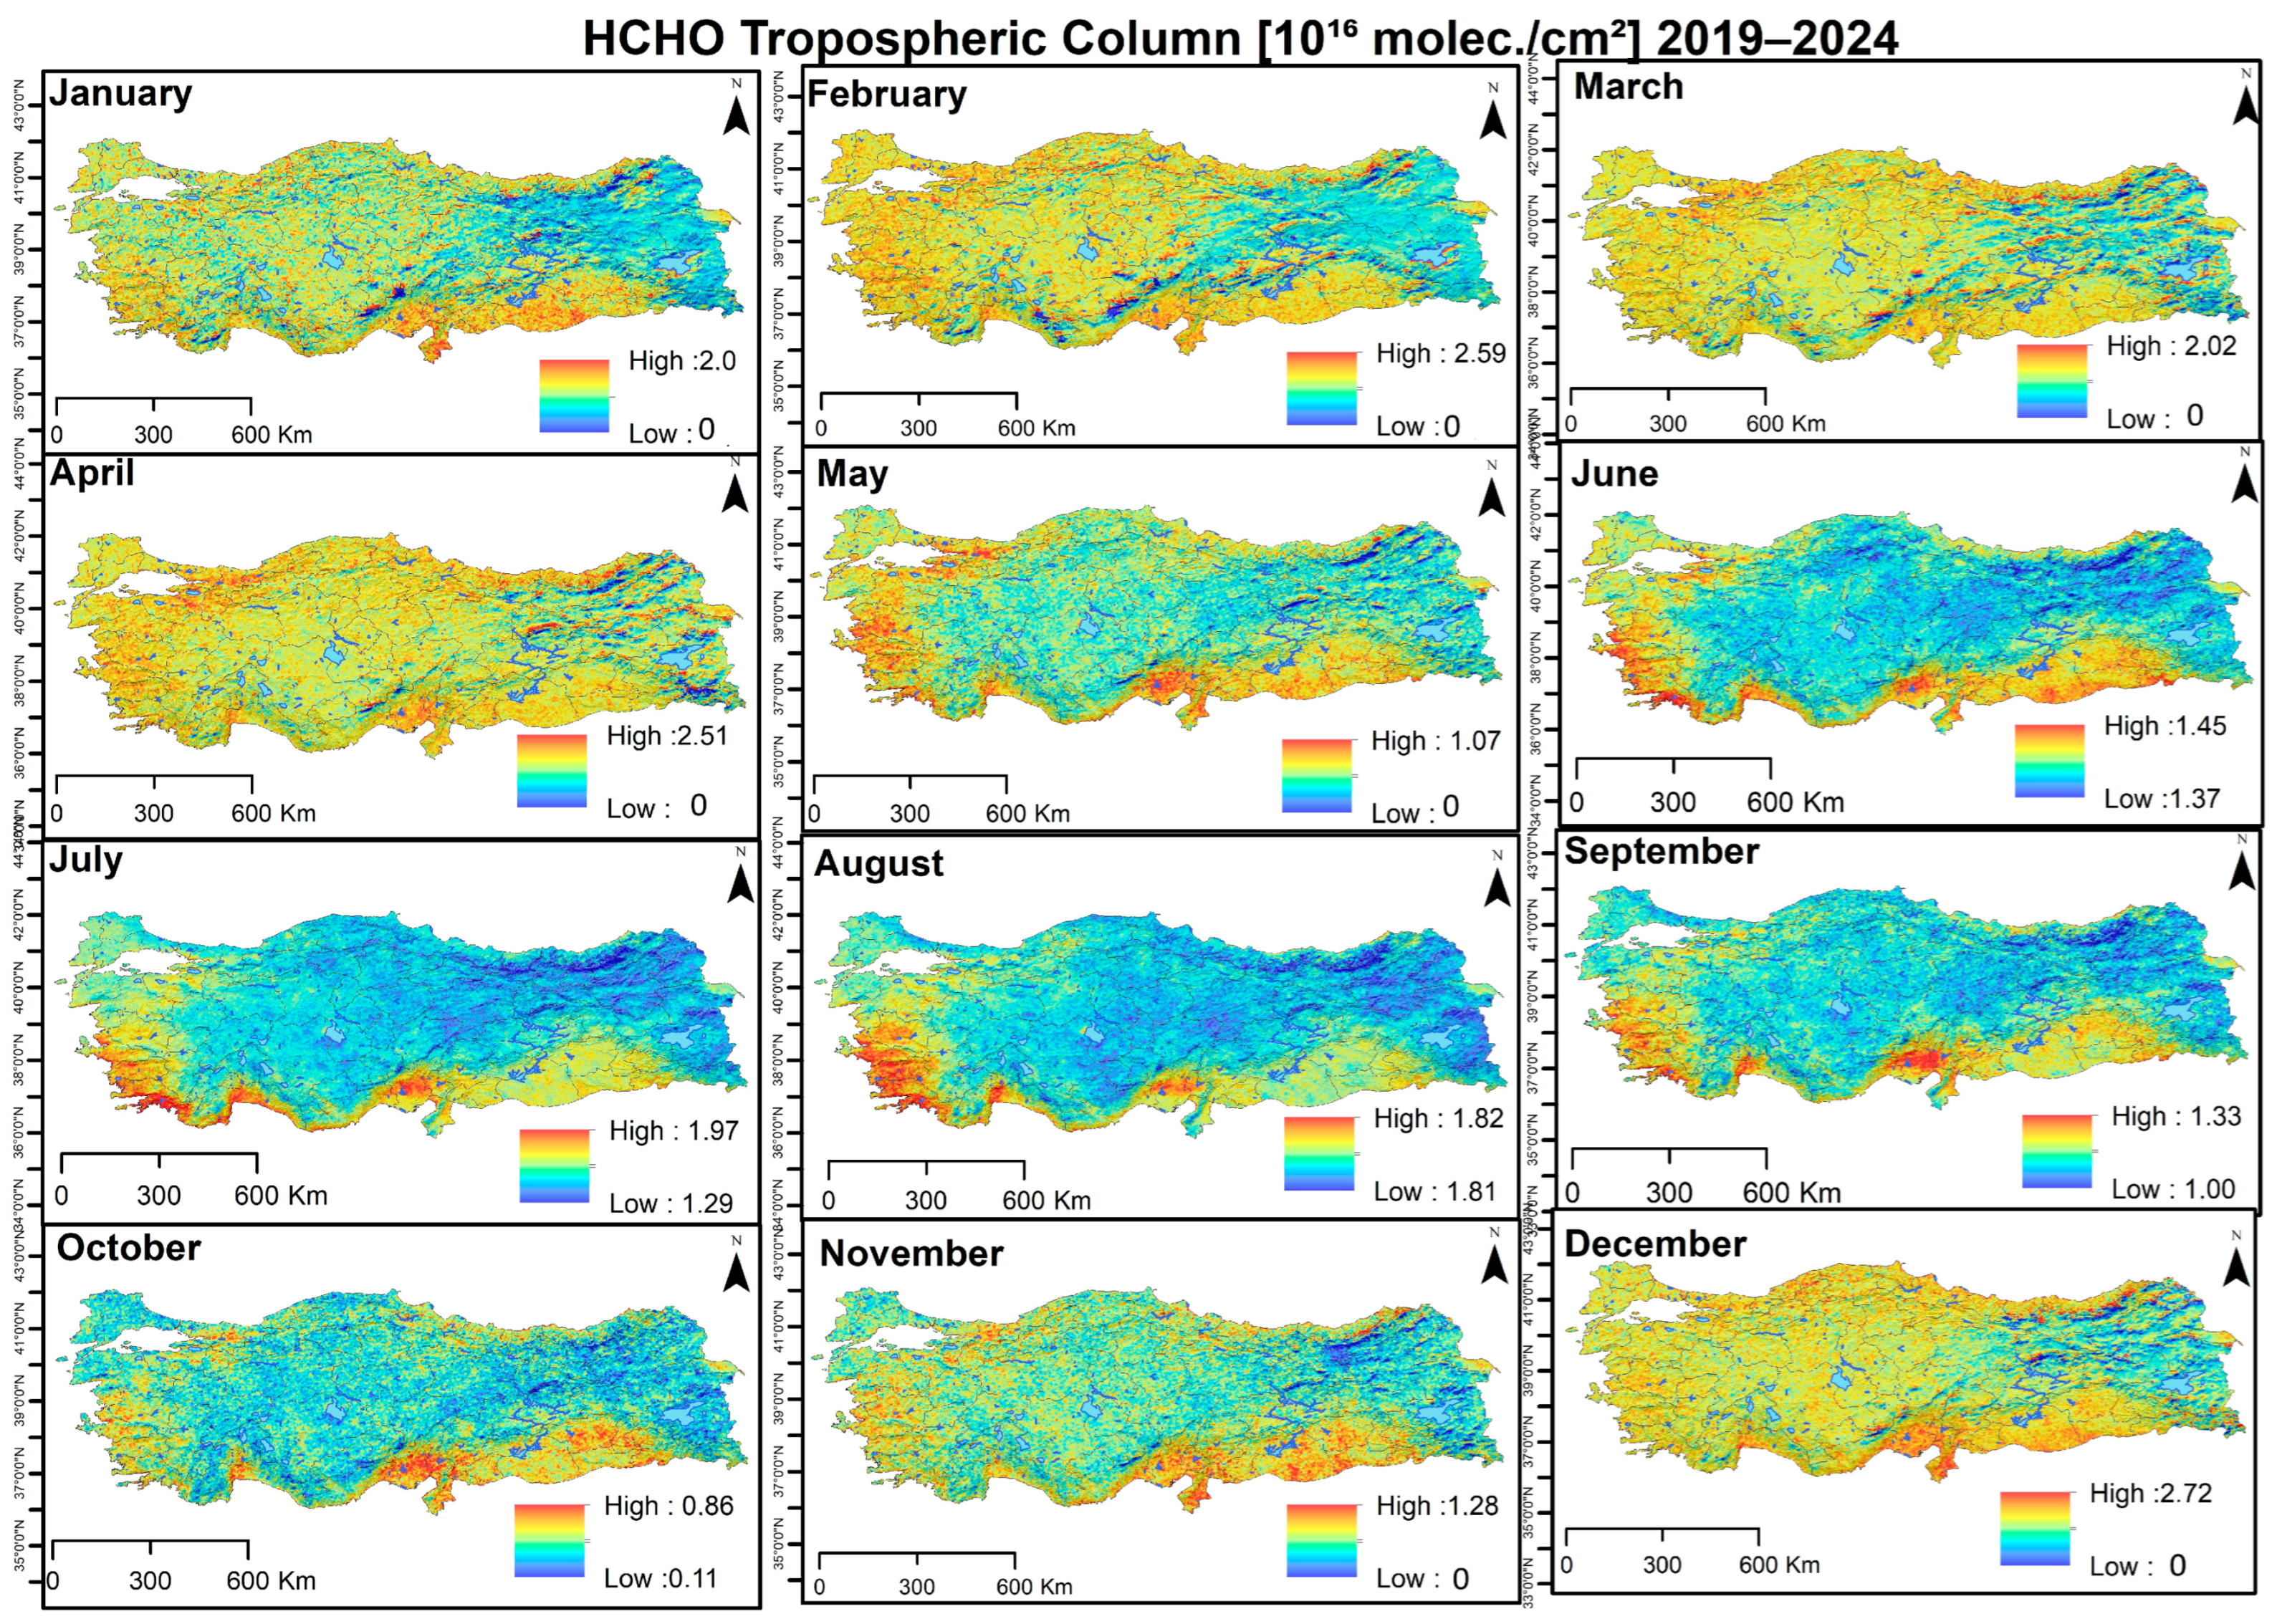
Formaldehyde (HCHO) levels peak during the spring-summer period in industrial zones (Kocaeli, Izmir) and areas of intensive agricultural activity (
Figure 6). This increase is associated with biomass combustion and agricultural waste incineration. The toxic and carcinogenic effects of HCHO [
43] increase the risk to public health in these regions.
NO
2 levels remained high in metropolitan centers yearly (
Figure 7). During the winter months, fossil fuel use for heating and inversion conditions increased NO
2 accumulation, while traffic congestion and industrial activity continued to have an impact during the summer months. The spatial distribution of NO
2 is highly consistent with maps of urban expansion areas.
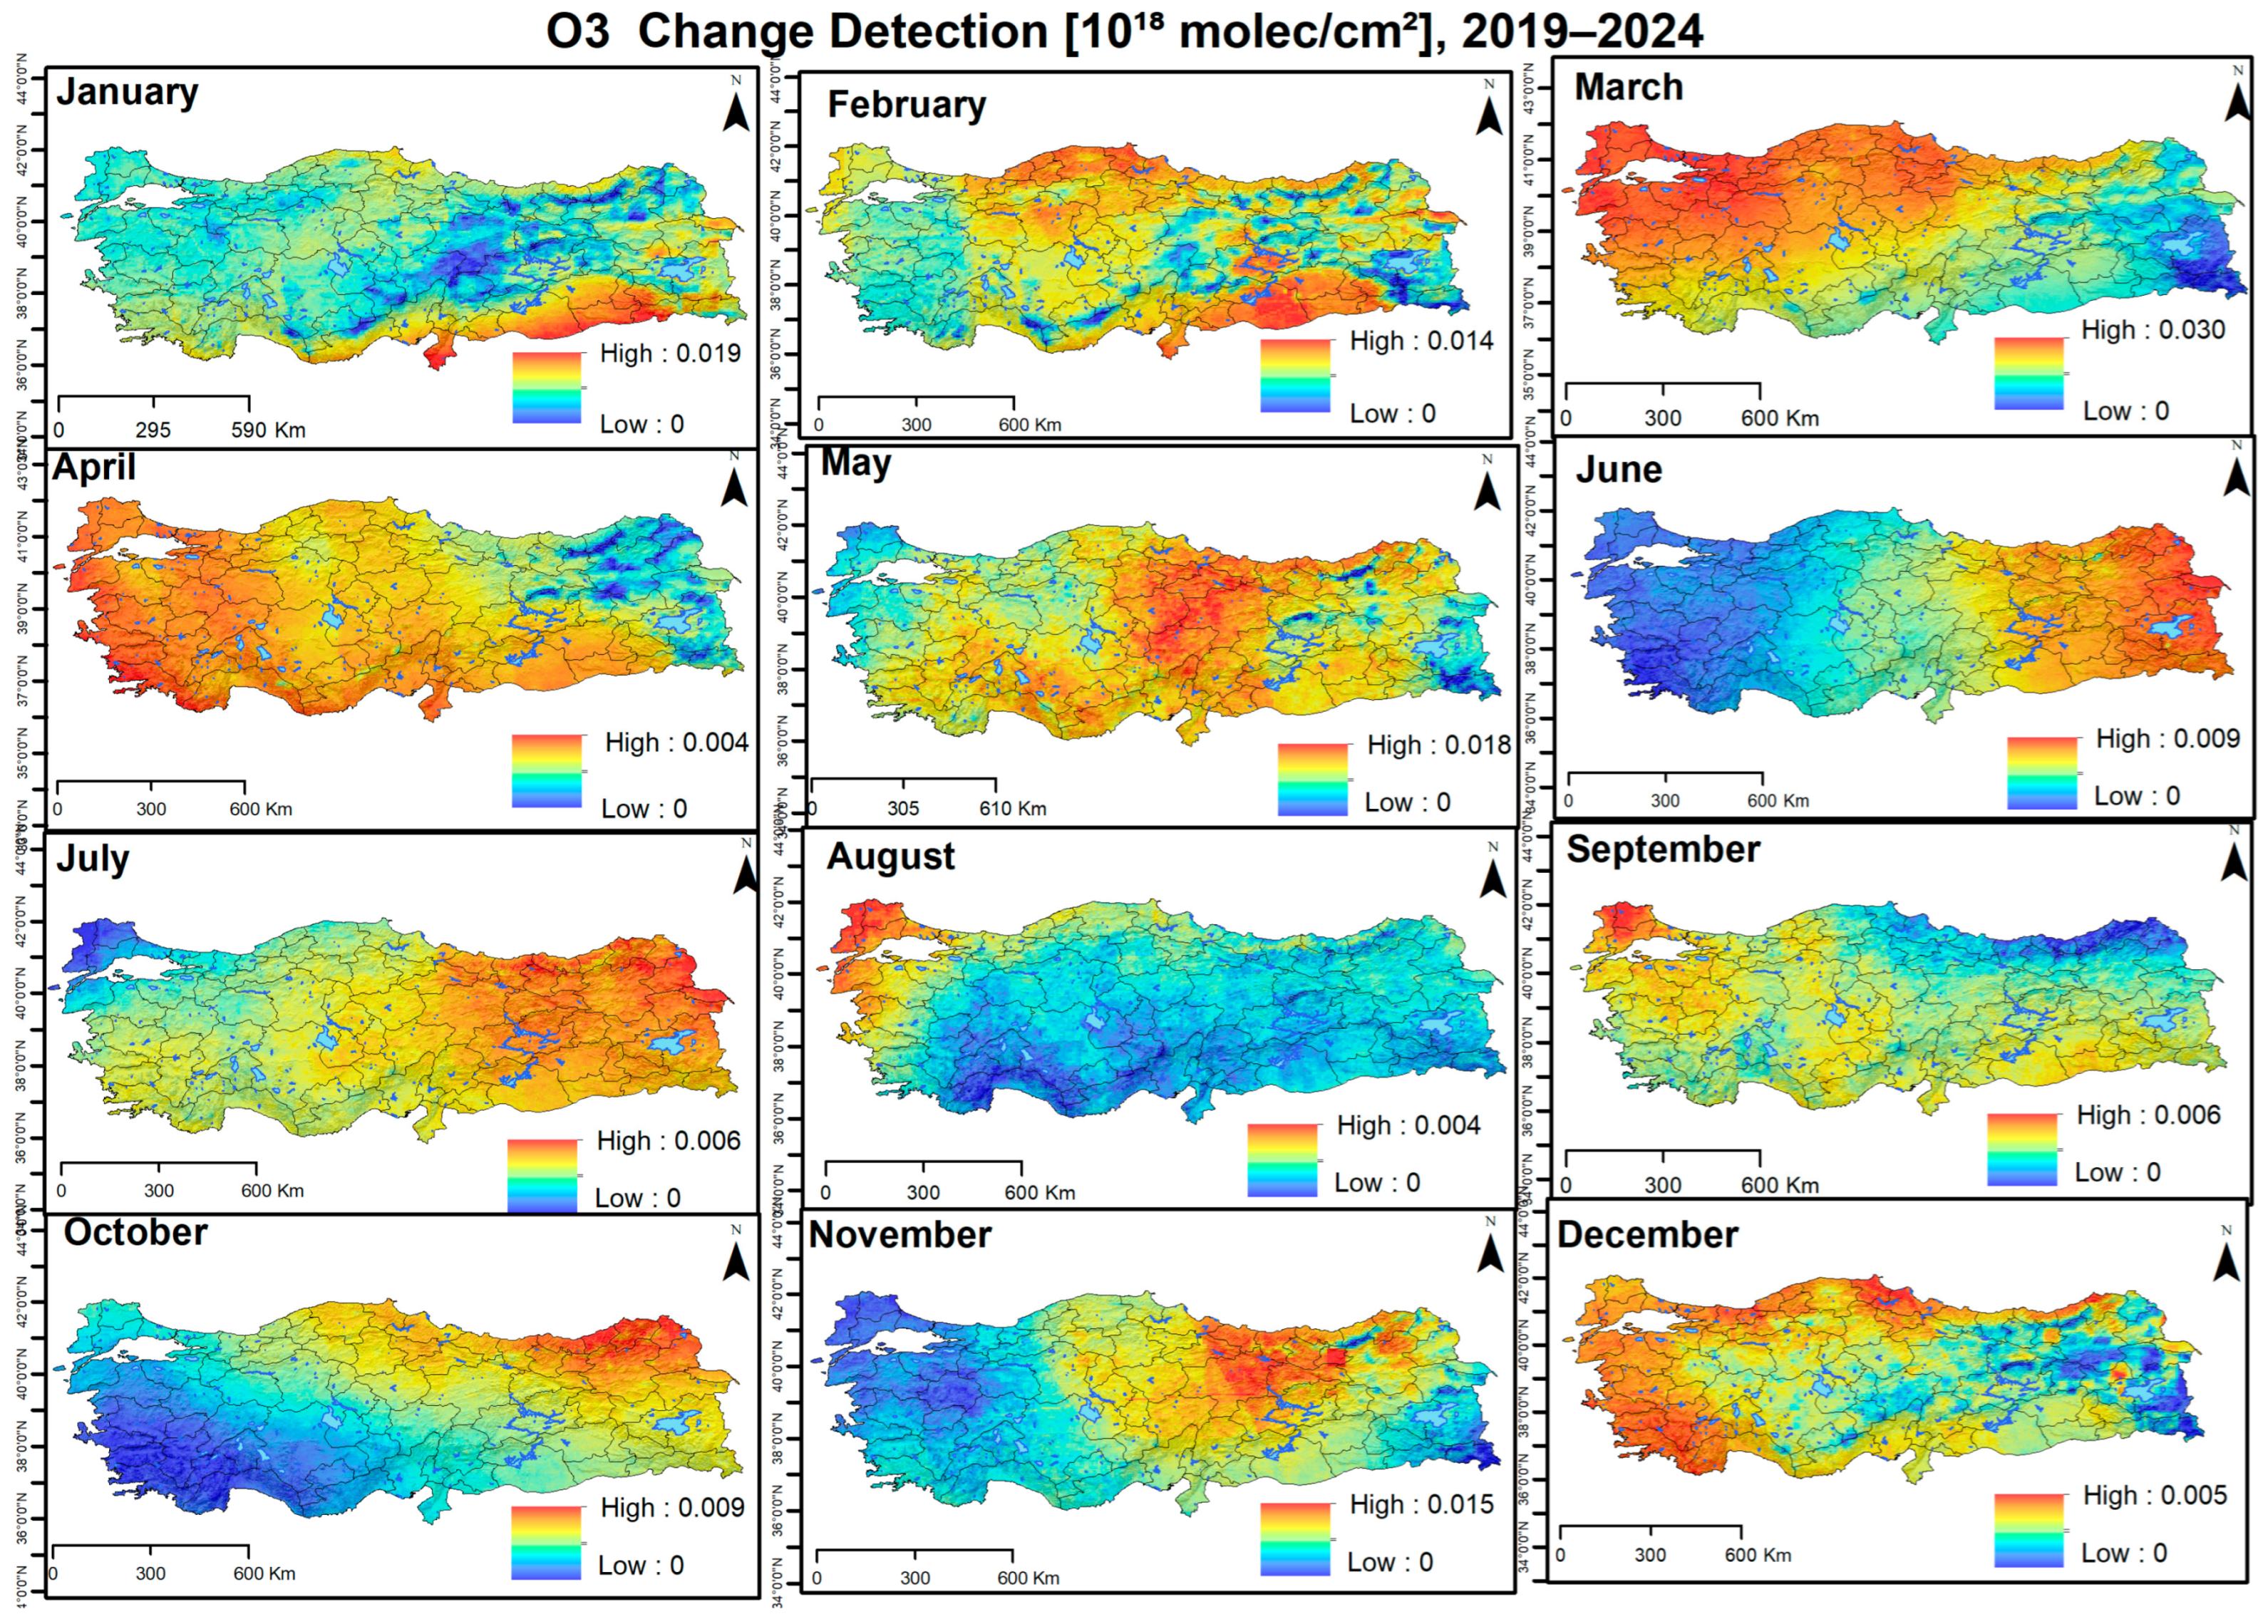
Ozone (O
3) levels have increased along the Aegean and Mediterranean coasts, particularly during summer, due to photochemical reactions (
Figure 8). There is a strong correlation between periods of high land surface temperatures and O
3 increases. This critical factor can lead to photosynthesis loss and yield reductions in crops [
44].
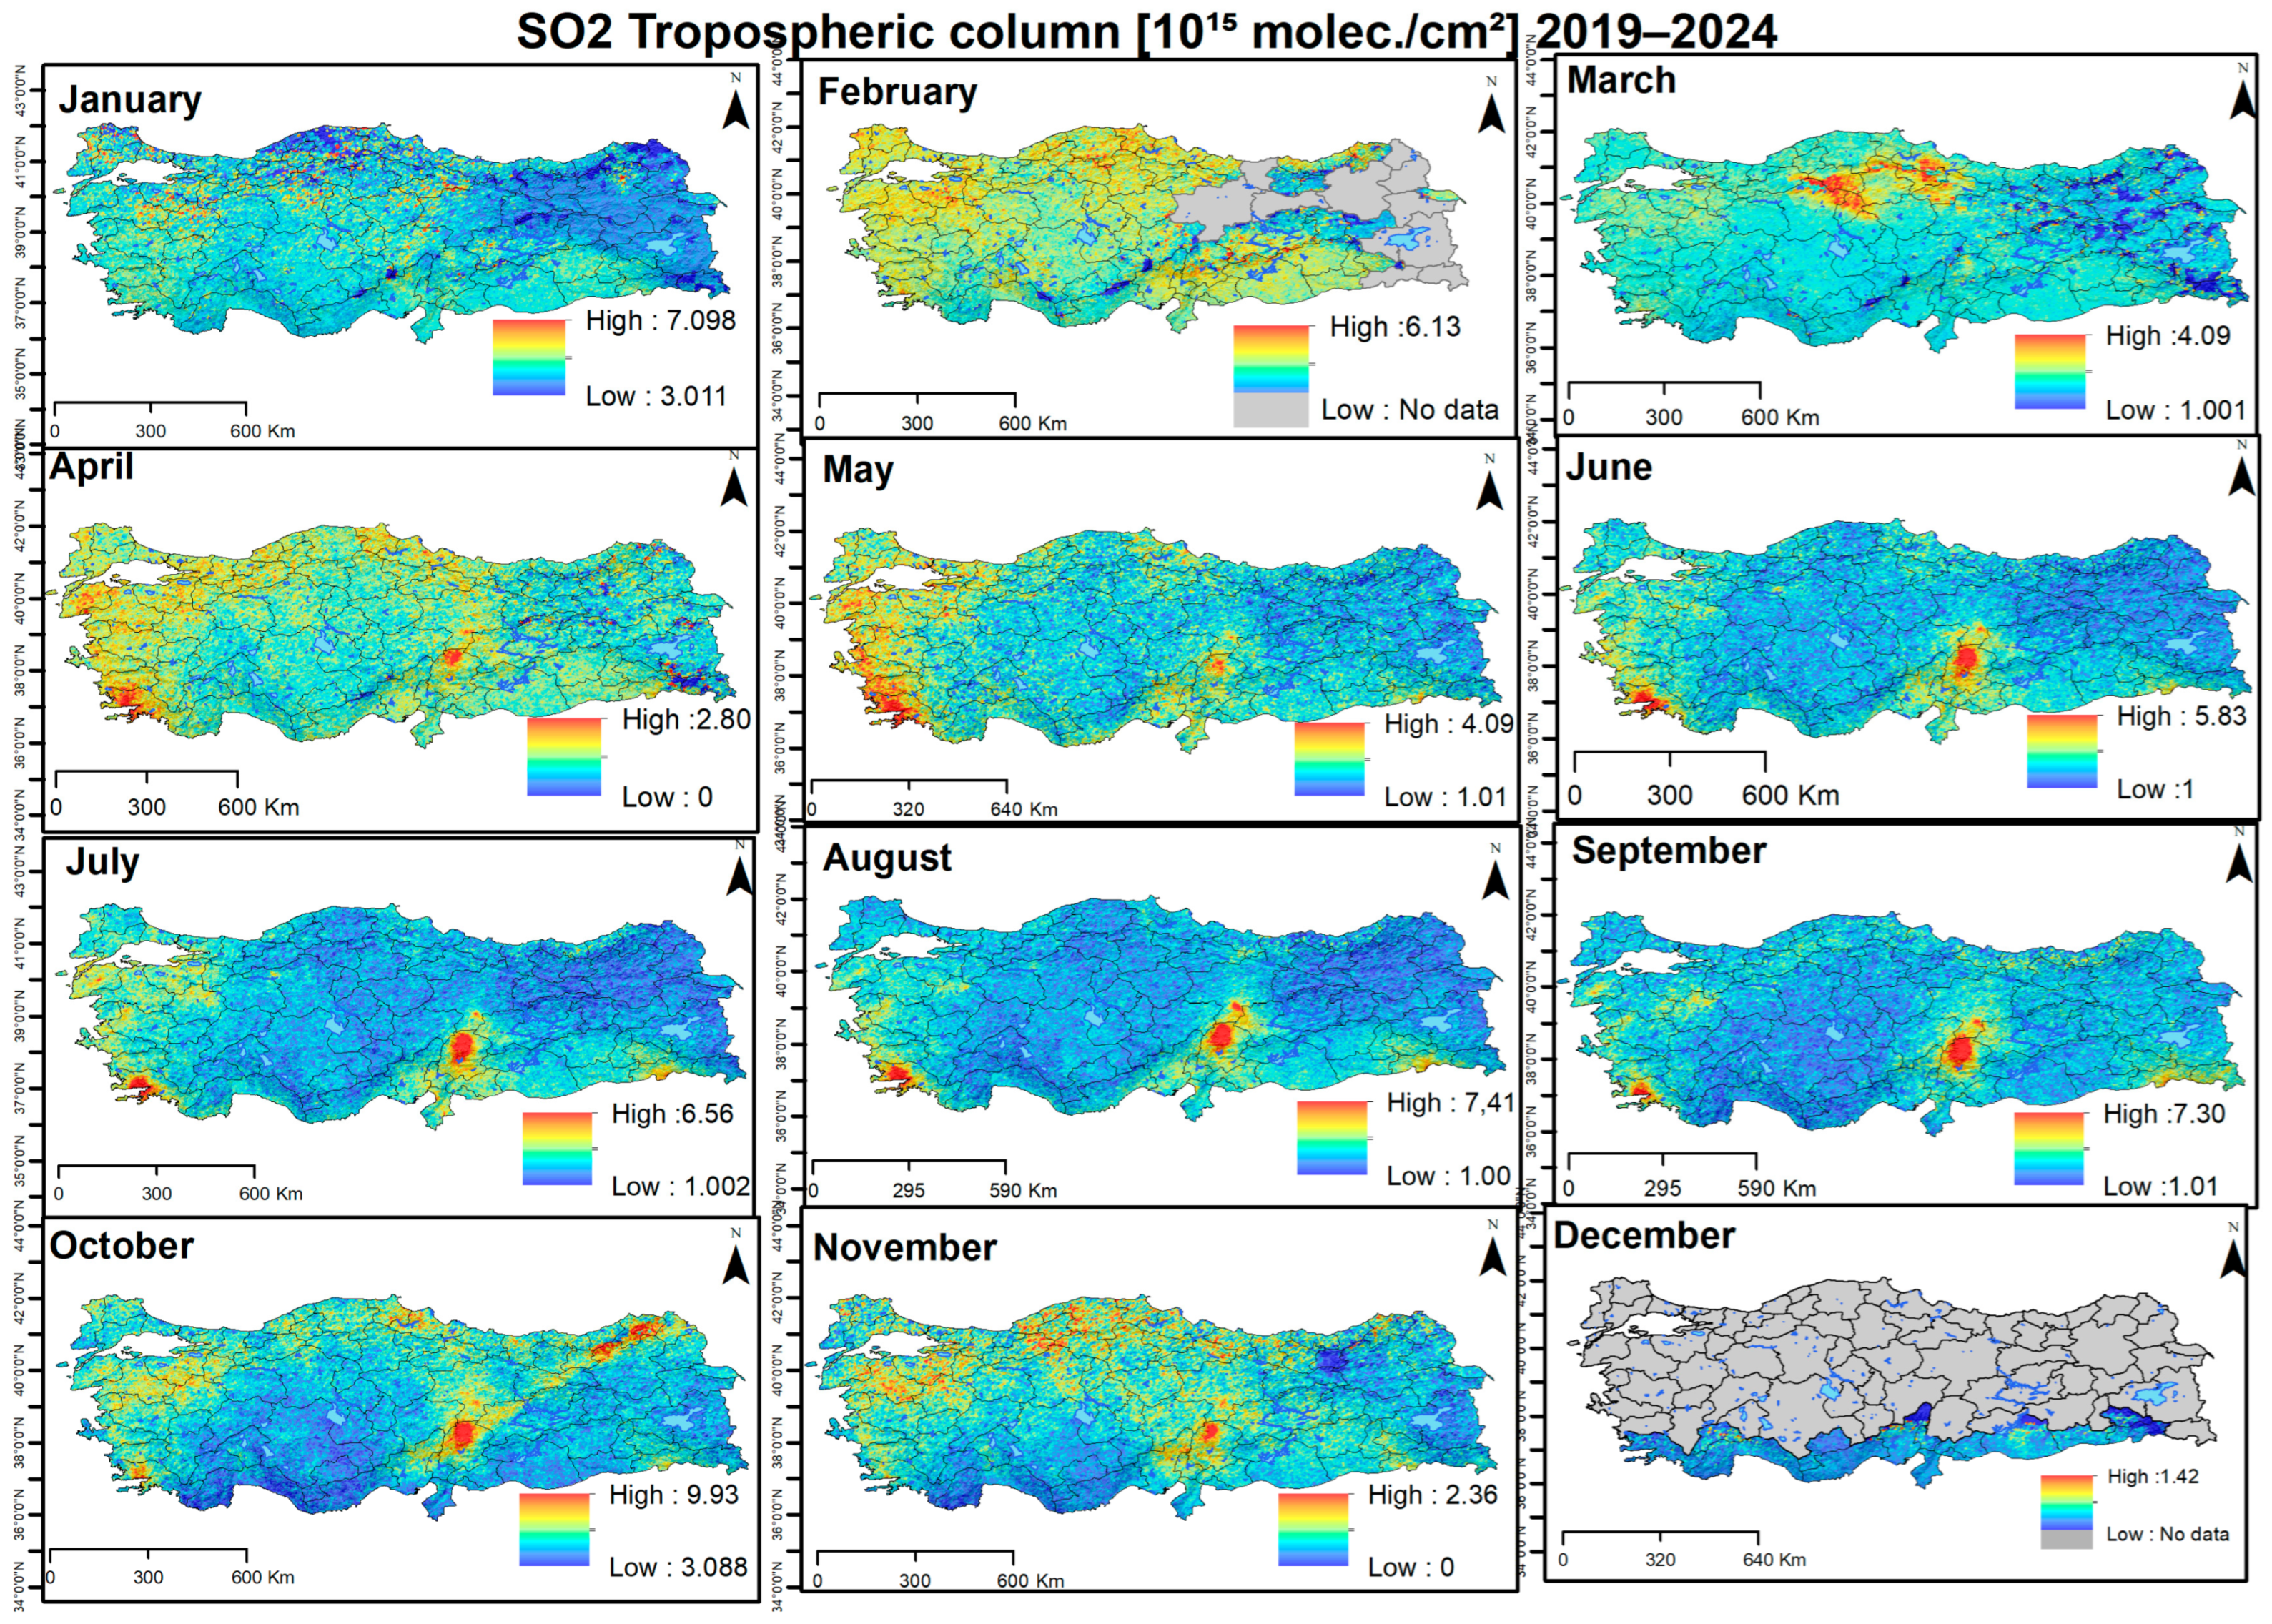
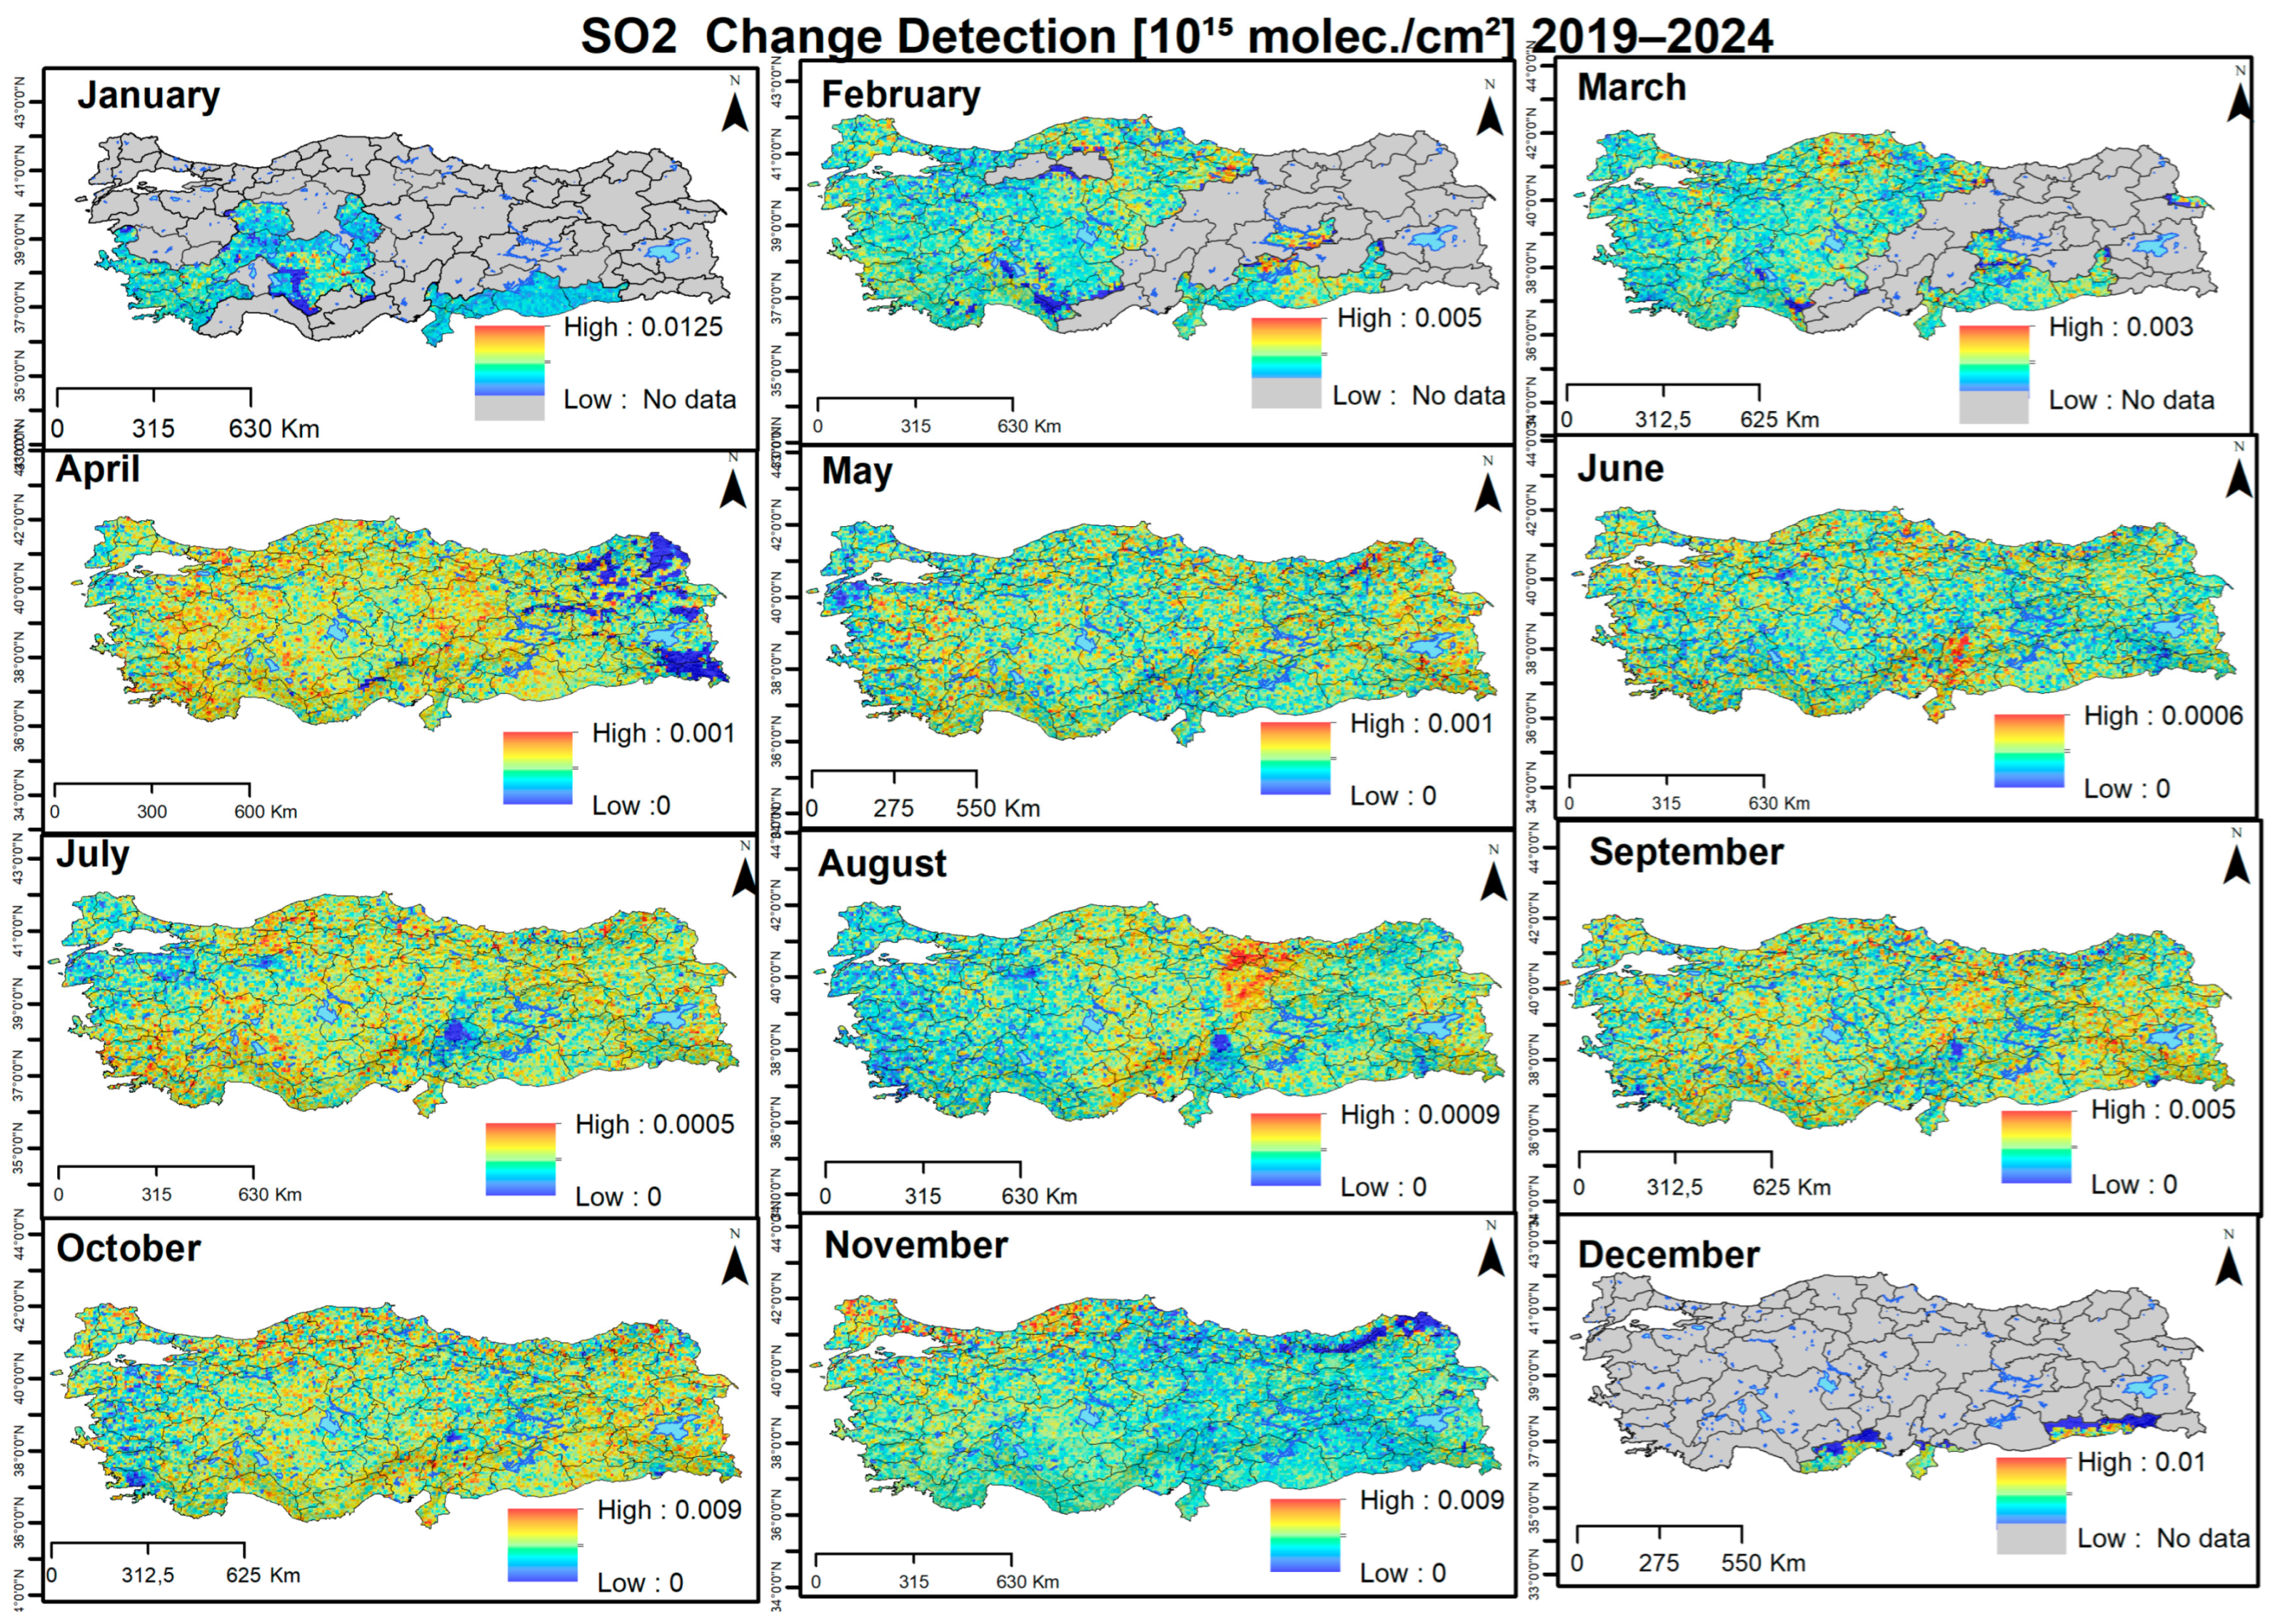
In regions with a high concentration of thermal power plants, such as Zonguldak, Manisa, and Sivas, SO
2 values remained higher throughout the year than in other provinces in Türkiye (
Figure 9). Peak values were recorded in winter due to increased heating and energy demand. The spatial distribution of SO
2 overlaps with the LULC classes, where thermal power plants and heavy industry investments are concentrated.
Multi-figures showing the temporal changes in pollutants in
Figure 10,
Figure 11,
Figure 12,
Figure 13,
Figure 14 and
Figure 15 show significant increasing trends in NO
2 and SO
2 in the winter months and AI, HCHO, and O
3 in the spring-summer periods between 2019 and 2024. CO
2, on the other hand, exhibited a continuous increasing trend, except for the decrease during the pandemic period (2020).
3.2. Change Detection for Pollutants (SO2, O3, AI, CO2, NO2, HCHO)
This section examines changes in SO
2, O
3, AI, CO
2, NO
2, HCHO. Red-colored areas on the change detection maps indicate areas where pollutant values have increased. The January map of the AI change detection shows a red-intensive effect in the southern and western parts of Türkiye. This indicates that AI values increased, particularly in western and southern Türkiye in January. In March, western Türkiye is shown in darker red. This indicates a significant increase in AI values in western Türkiye between March 2019 and 2024. In December, AI values increased in the Central Anatolian Region of Türkiye (
Figure 10).
The map below illustrates the fluctuations in Türkiye’s CO
2 values between 2019 and 2024. Certain regions of Türkiye are worthy of particular attention on this map. In January, there was an increase in CO
2 levels in the Eastern Mediterranean Region and the vicinity of Bursa city. As demonstrated in
Figure 11, there has been an increase in CO
2 levels in the northern part of Türkiye and the central and eastern parts of the Black Sea region in July.
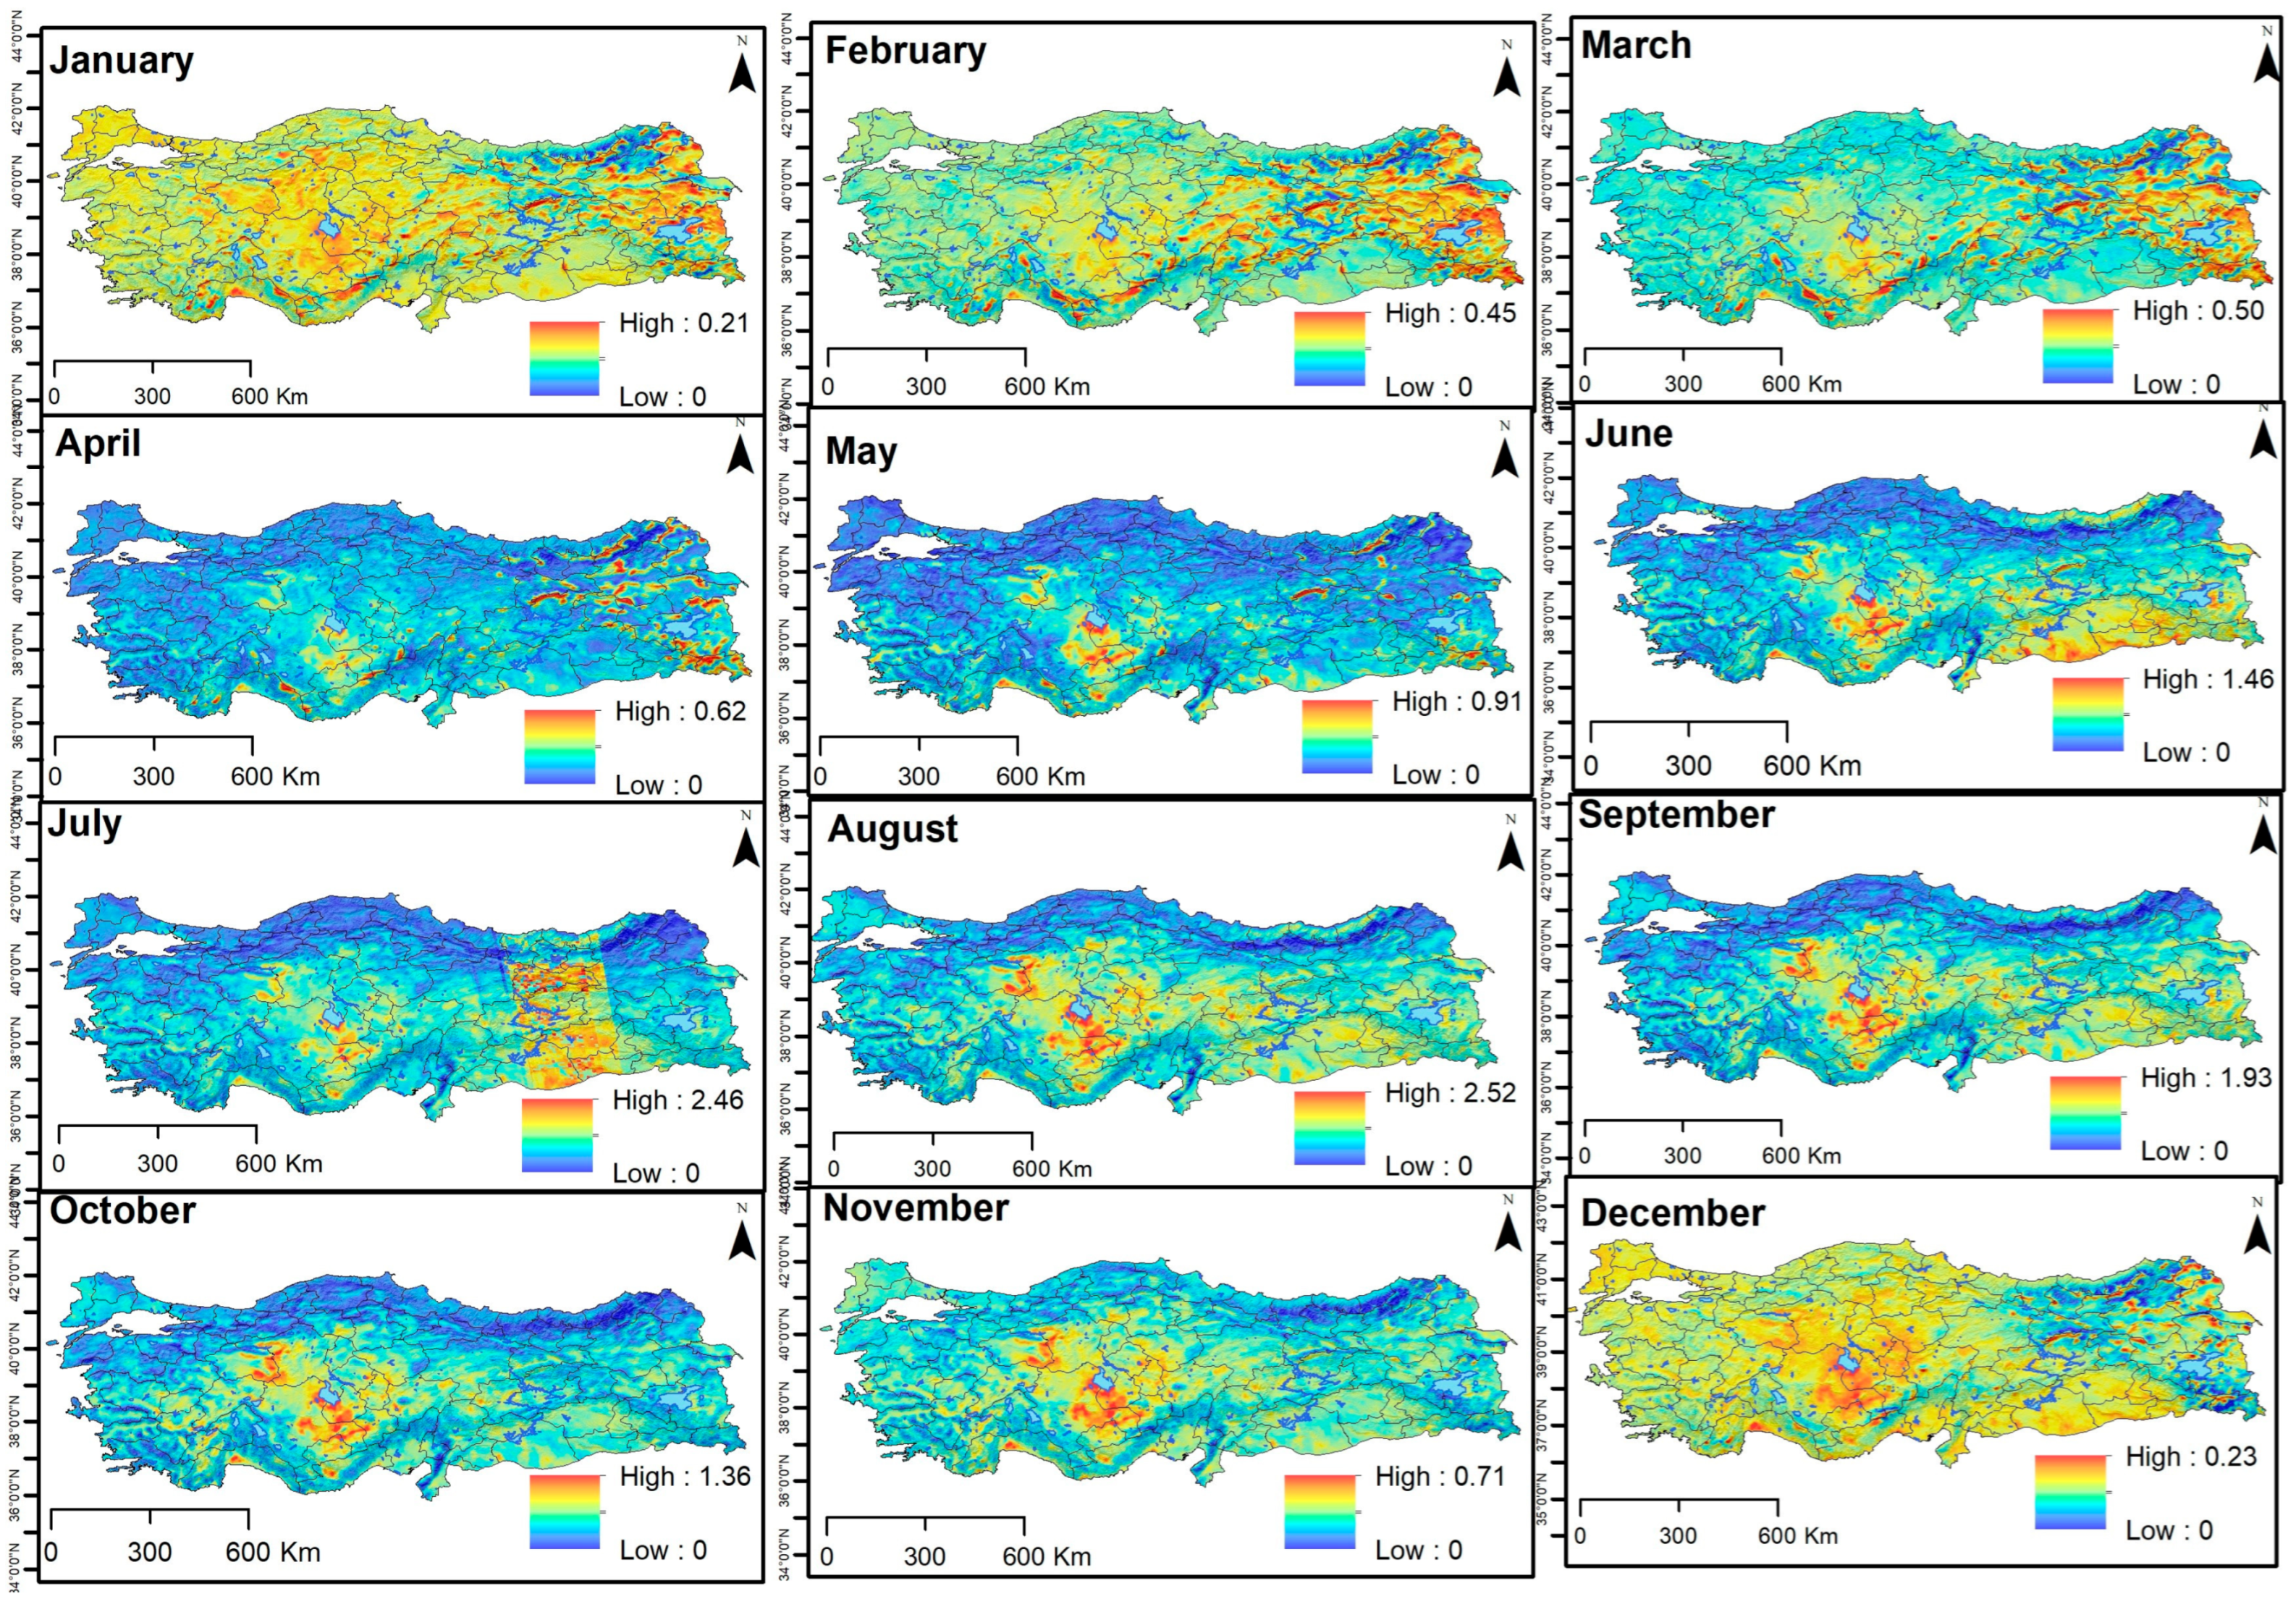
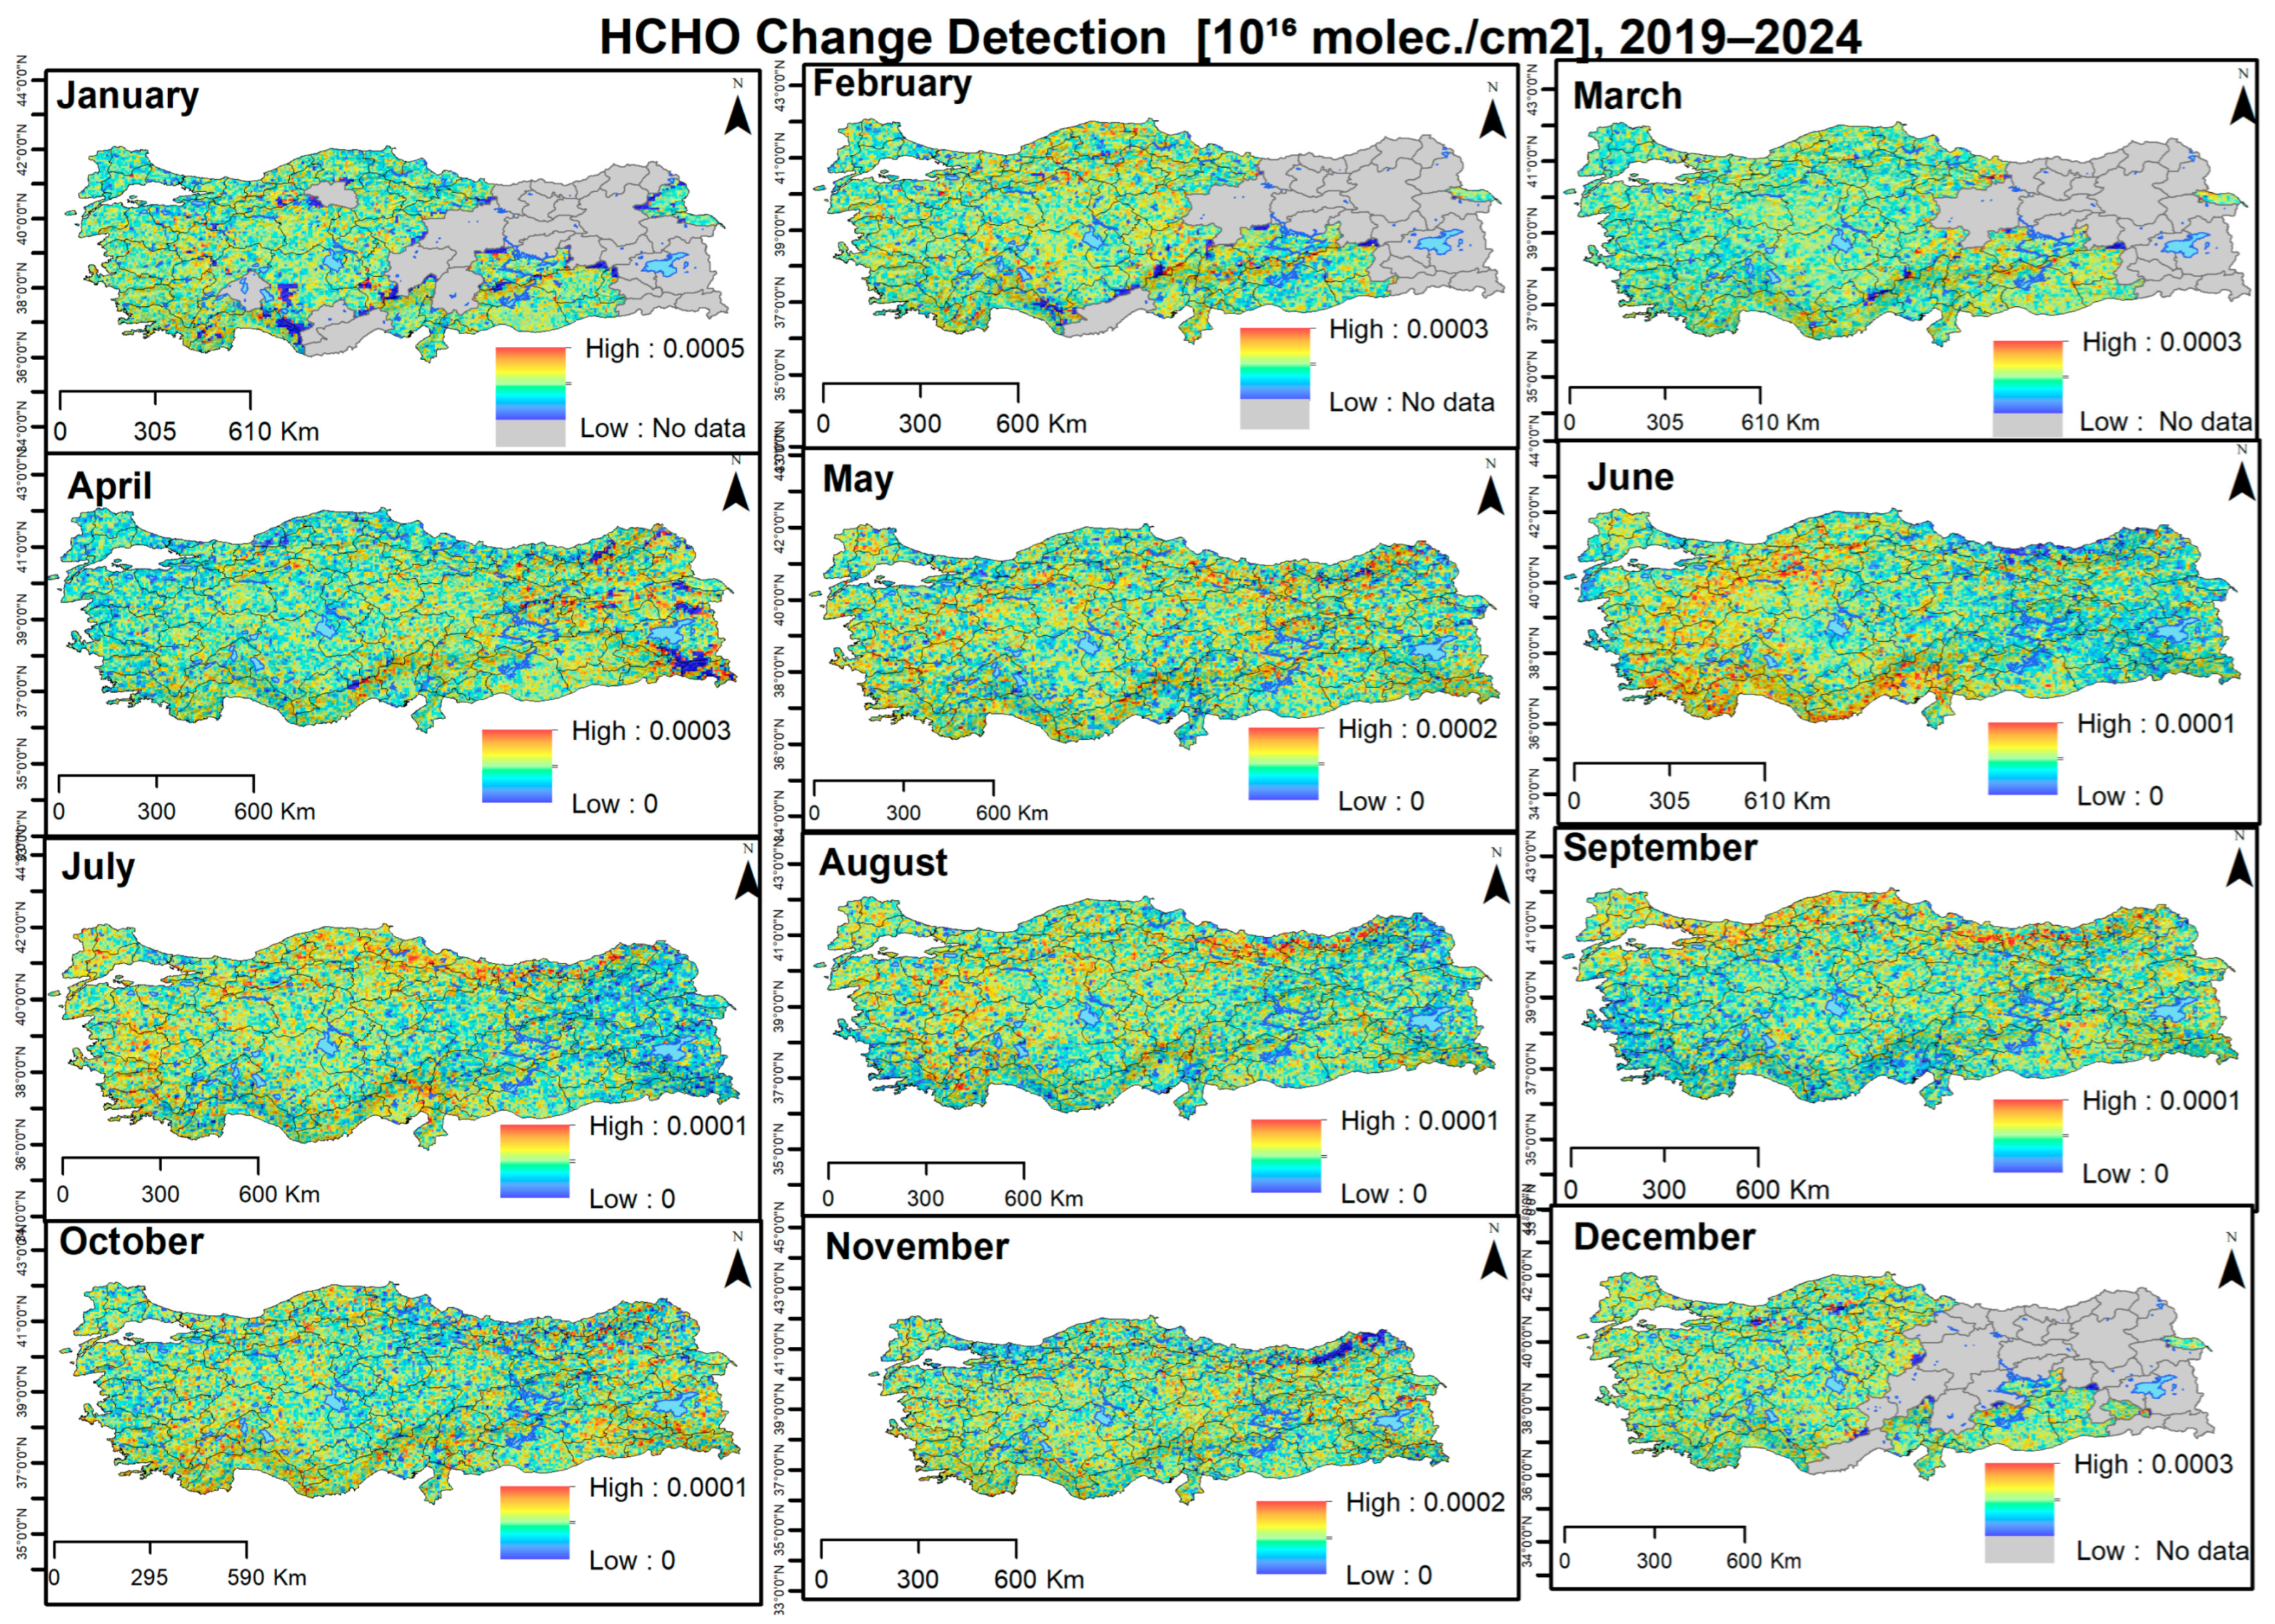
The regions within Türkiye that demonstrated the most substantial alterations in HCHO values were located in the country’s northernmost reaches. The HCHO values exhibited a more substantial increase in the Black Sea region of Türkiye, particularly during August and September, compared to other areas. As illustrated in
Figure 12, the highest increases in HCHO values were observed in June in the southern regions of Türkiye, particularly along the Mediterranean coast.
Changes in NO
2 levels are observed in different regions of Türkiye monthly. For instance, the most significant changes in January were observed near Gaziantep in the southeast and around Izmir on the Aegean coast. As illustrated in
Figure 13, the most significant variations in NO
2 levels are observed near the Gaziantep-Osmaniye line and the Ankara-Eskişehir line during February. As demonstrated in
Figure 13, the most significant changes in NO
2 levels are evident in Istanbul and its surrounding areas in March. In April, Gaziantep and its surrounding areas are prominent in southeastern Türkiye. NO
2 alterations are substantial between August and October in Istanbul and its surrounding areas.
O
3 levels exhibit regional variation rather than being consistent at the microscale. As demonstrated in
Figure 14, there is an increase in O
3 levels in southeastern Türkiye and the eastern Mediterranean region in January. Observations have also been made in the Southeastern Anatolia Region, with changes noted in February. Furthermore, a notable increase in O
3 levels was evident in the northern sector’s central region of the Black Sea in February. There was a significant increase in O
3 levels in northwestern Türkiye during March. There is a significant increase in O
3 levels across almost all of Türkiye in April. In June, there was an increase in O
3 values in eastern Türkiye.
In April, SO
2 changes are particularly evident. During this period, SO
2 increases are observed in all regions except some parts of eastern Türkiye. As illustrated in
Figure 15, the highest increases in SO
2 levels were observed in the eastern region of Türkiye during August.
3.3. Relation Between Land Use and Air Quality
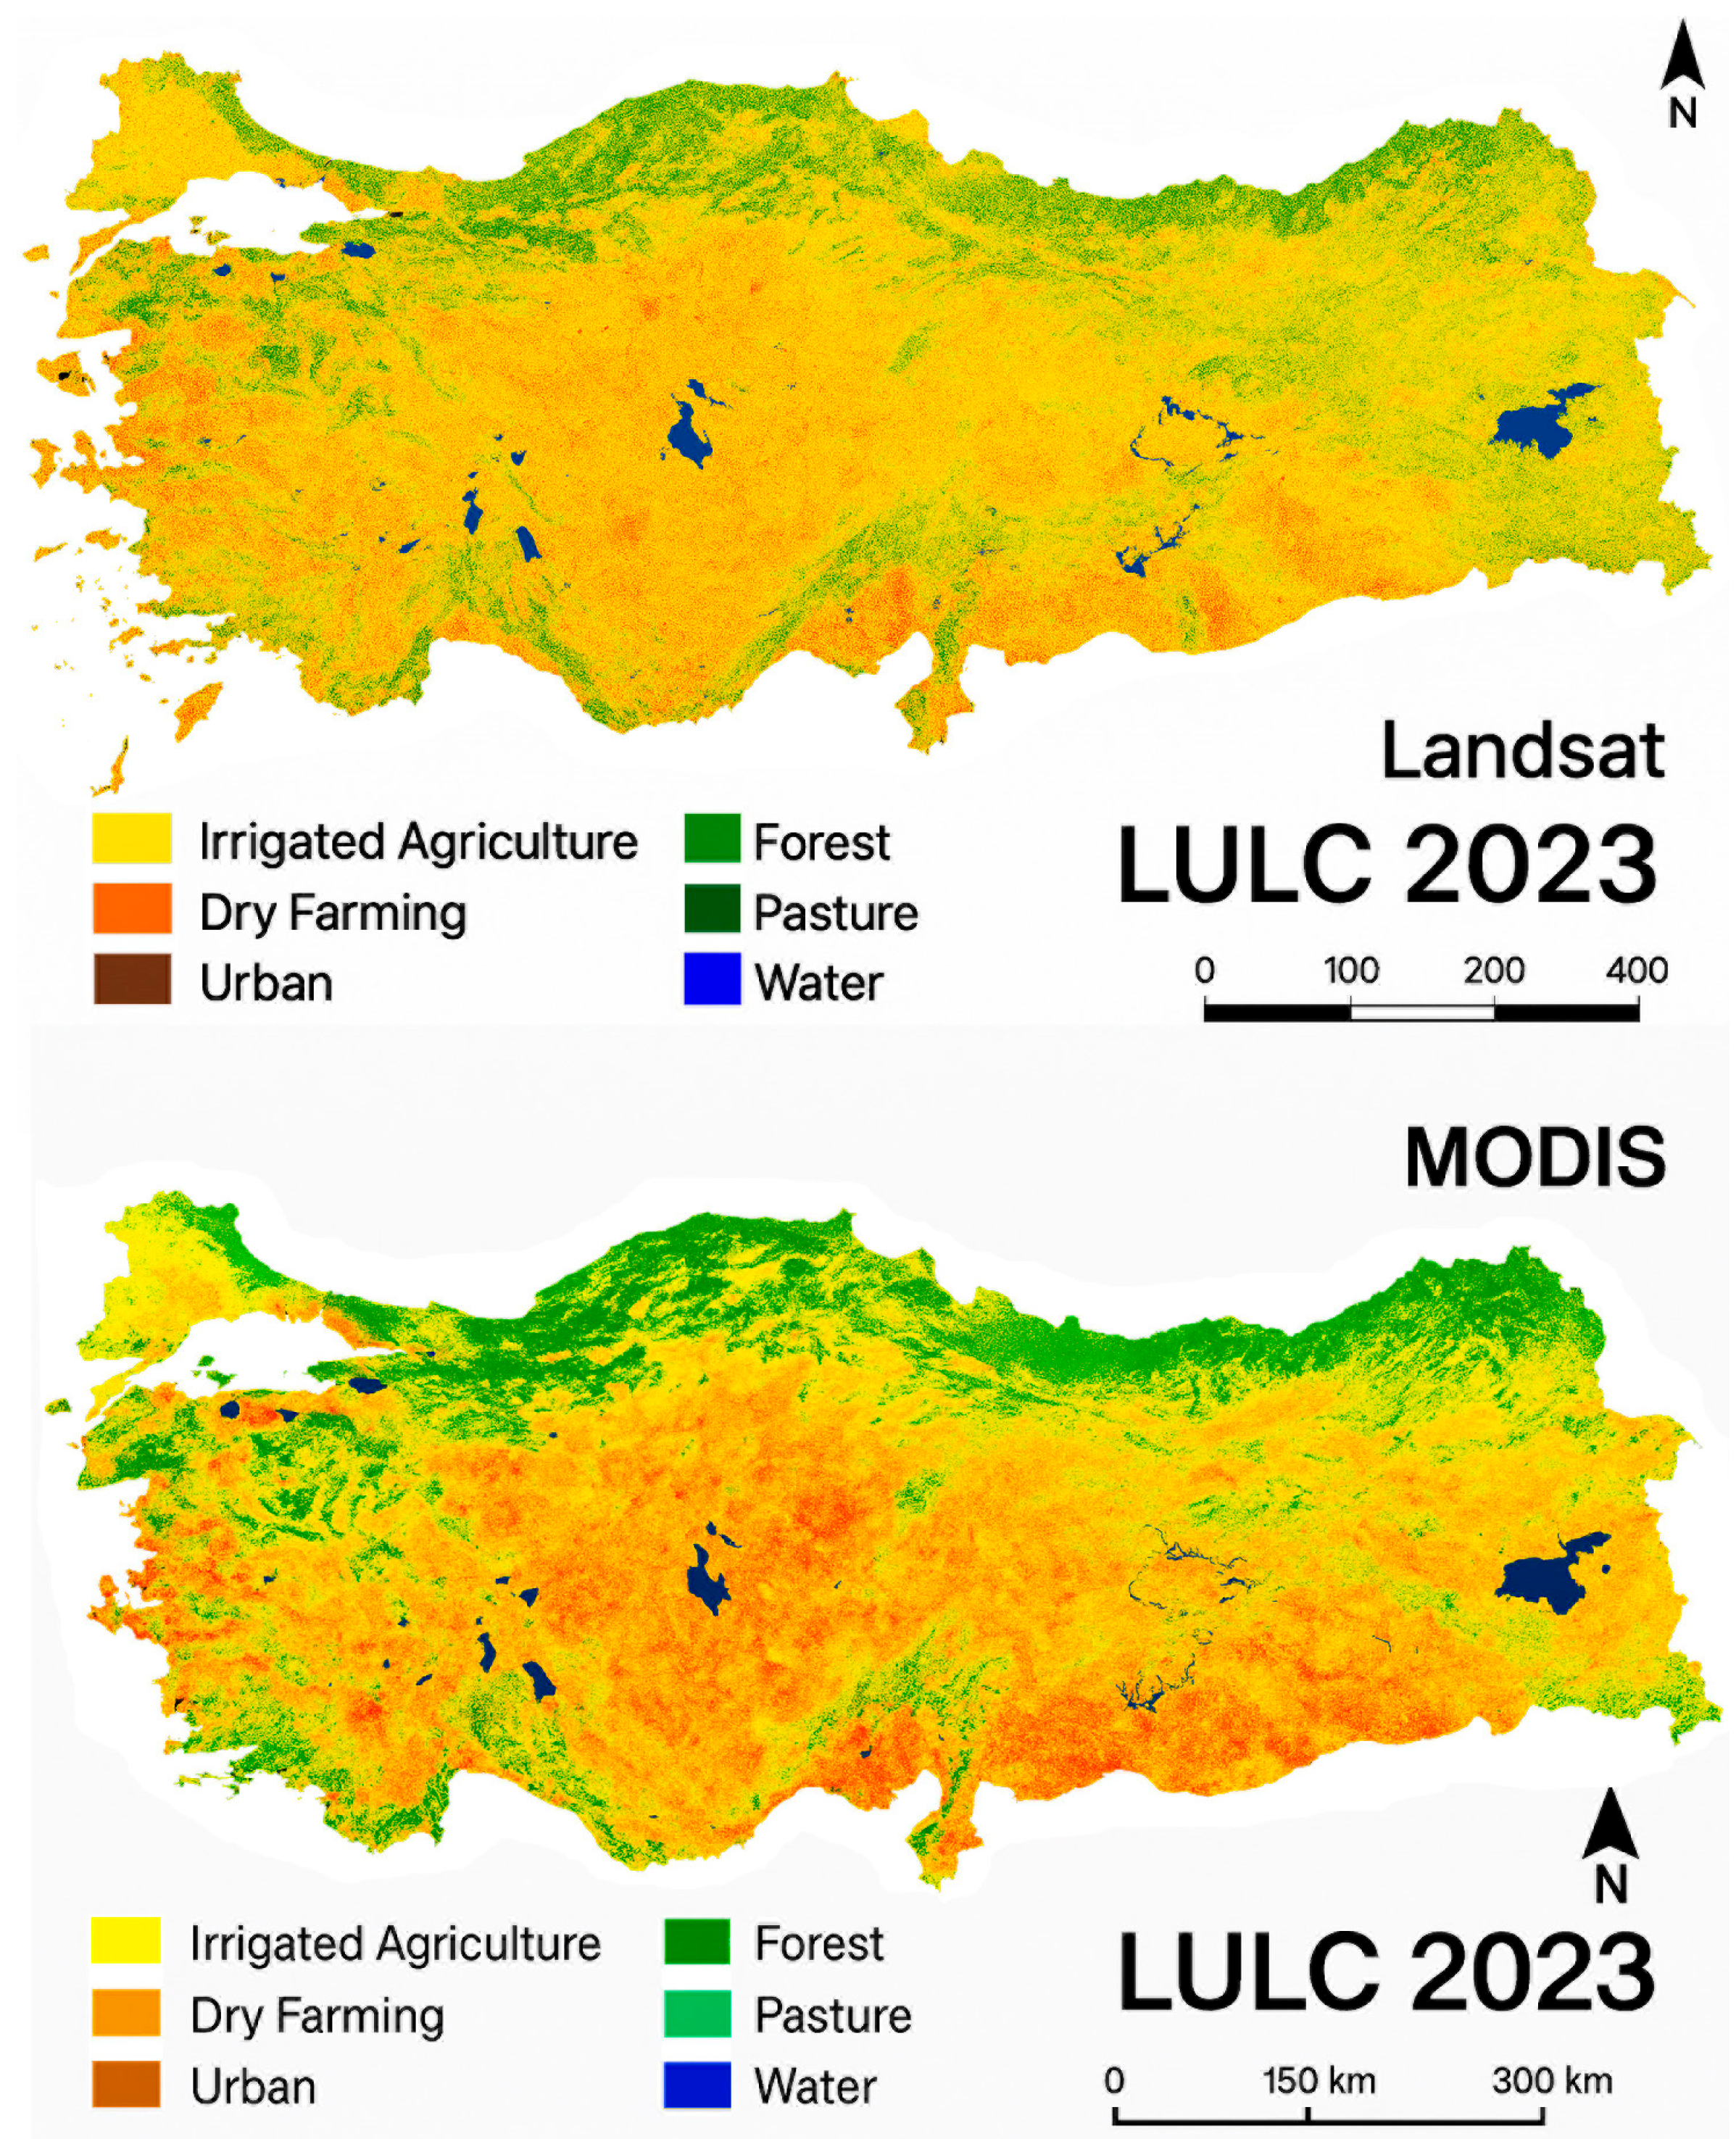
The LULC maps (different resolution datasets) shown in
Figure 16 and
Figure 17 show the expansion of urban areas, particularly along the Marmara, Aegean, and Mediterranean coasts, while agricultural lands intensify in Central Anatolia. These changes are consistent with the spatial distribution patterns of pollutants.
The findings reported in articles investigating land cover changes in Türkiye are as follows [
45,
46,
47,
48,
49,
50]:
Rapid urban growth across Türkiye is shrinking agricultural land, particularly in the Marmara, Aegean, and Mediterranean regions. While forest areas have increased significantly since the 2000s, some regions are experiencing significant losses due to fires and mining activities. Satellite data can be used to determine crop patterns and estimate yields in agricultural production areas, playing a critical role in food security planning. Drought, land degradation, and depletion of water resources, especially in Southeastern and Central Anatolia, can be identified using satellite-based indicators. The impacts of land use changes on ecosystem services, carbon balance, and biodiversity can be reflected in models.
In urbanized and industrialized areas with low NDVI values, higher NO
2, SO
2, and HCHO levels are observed compared to other provinces (
Figure 17). Forest and grassland areas with high NDVI values generally showed lower pollutant concentrations, demonstrating the role of green cover in improving air quality [
51].
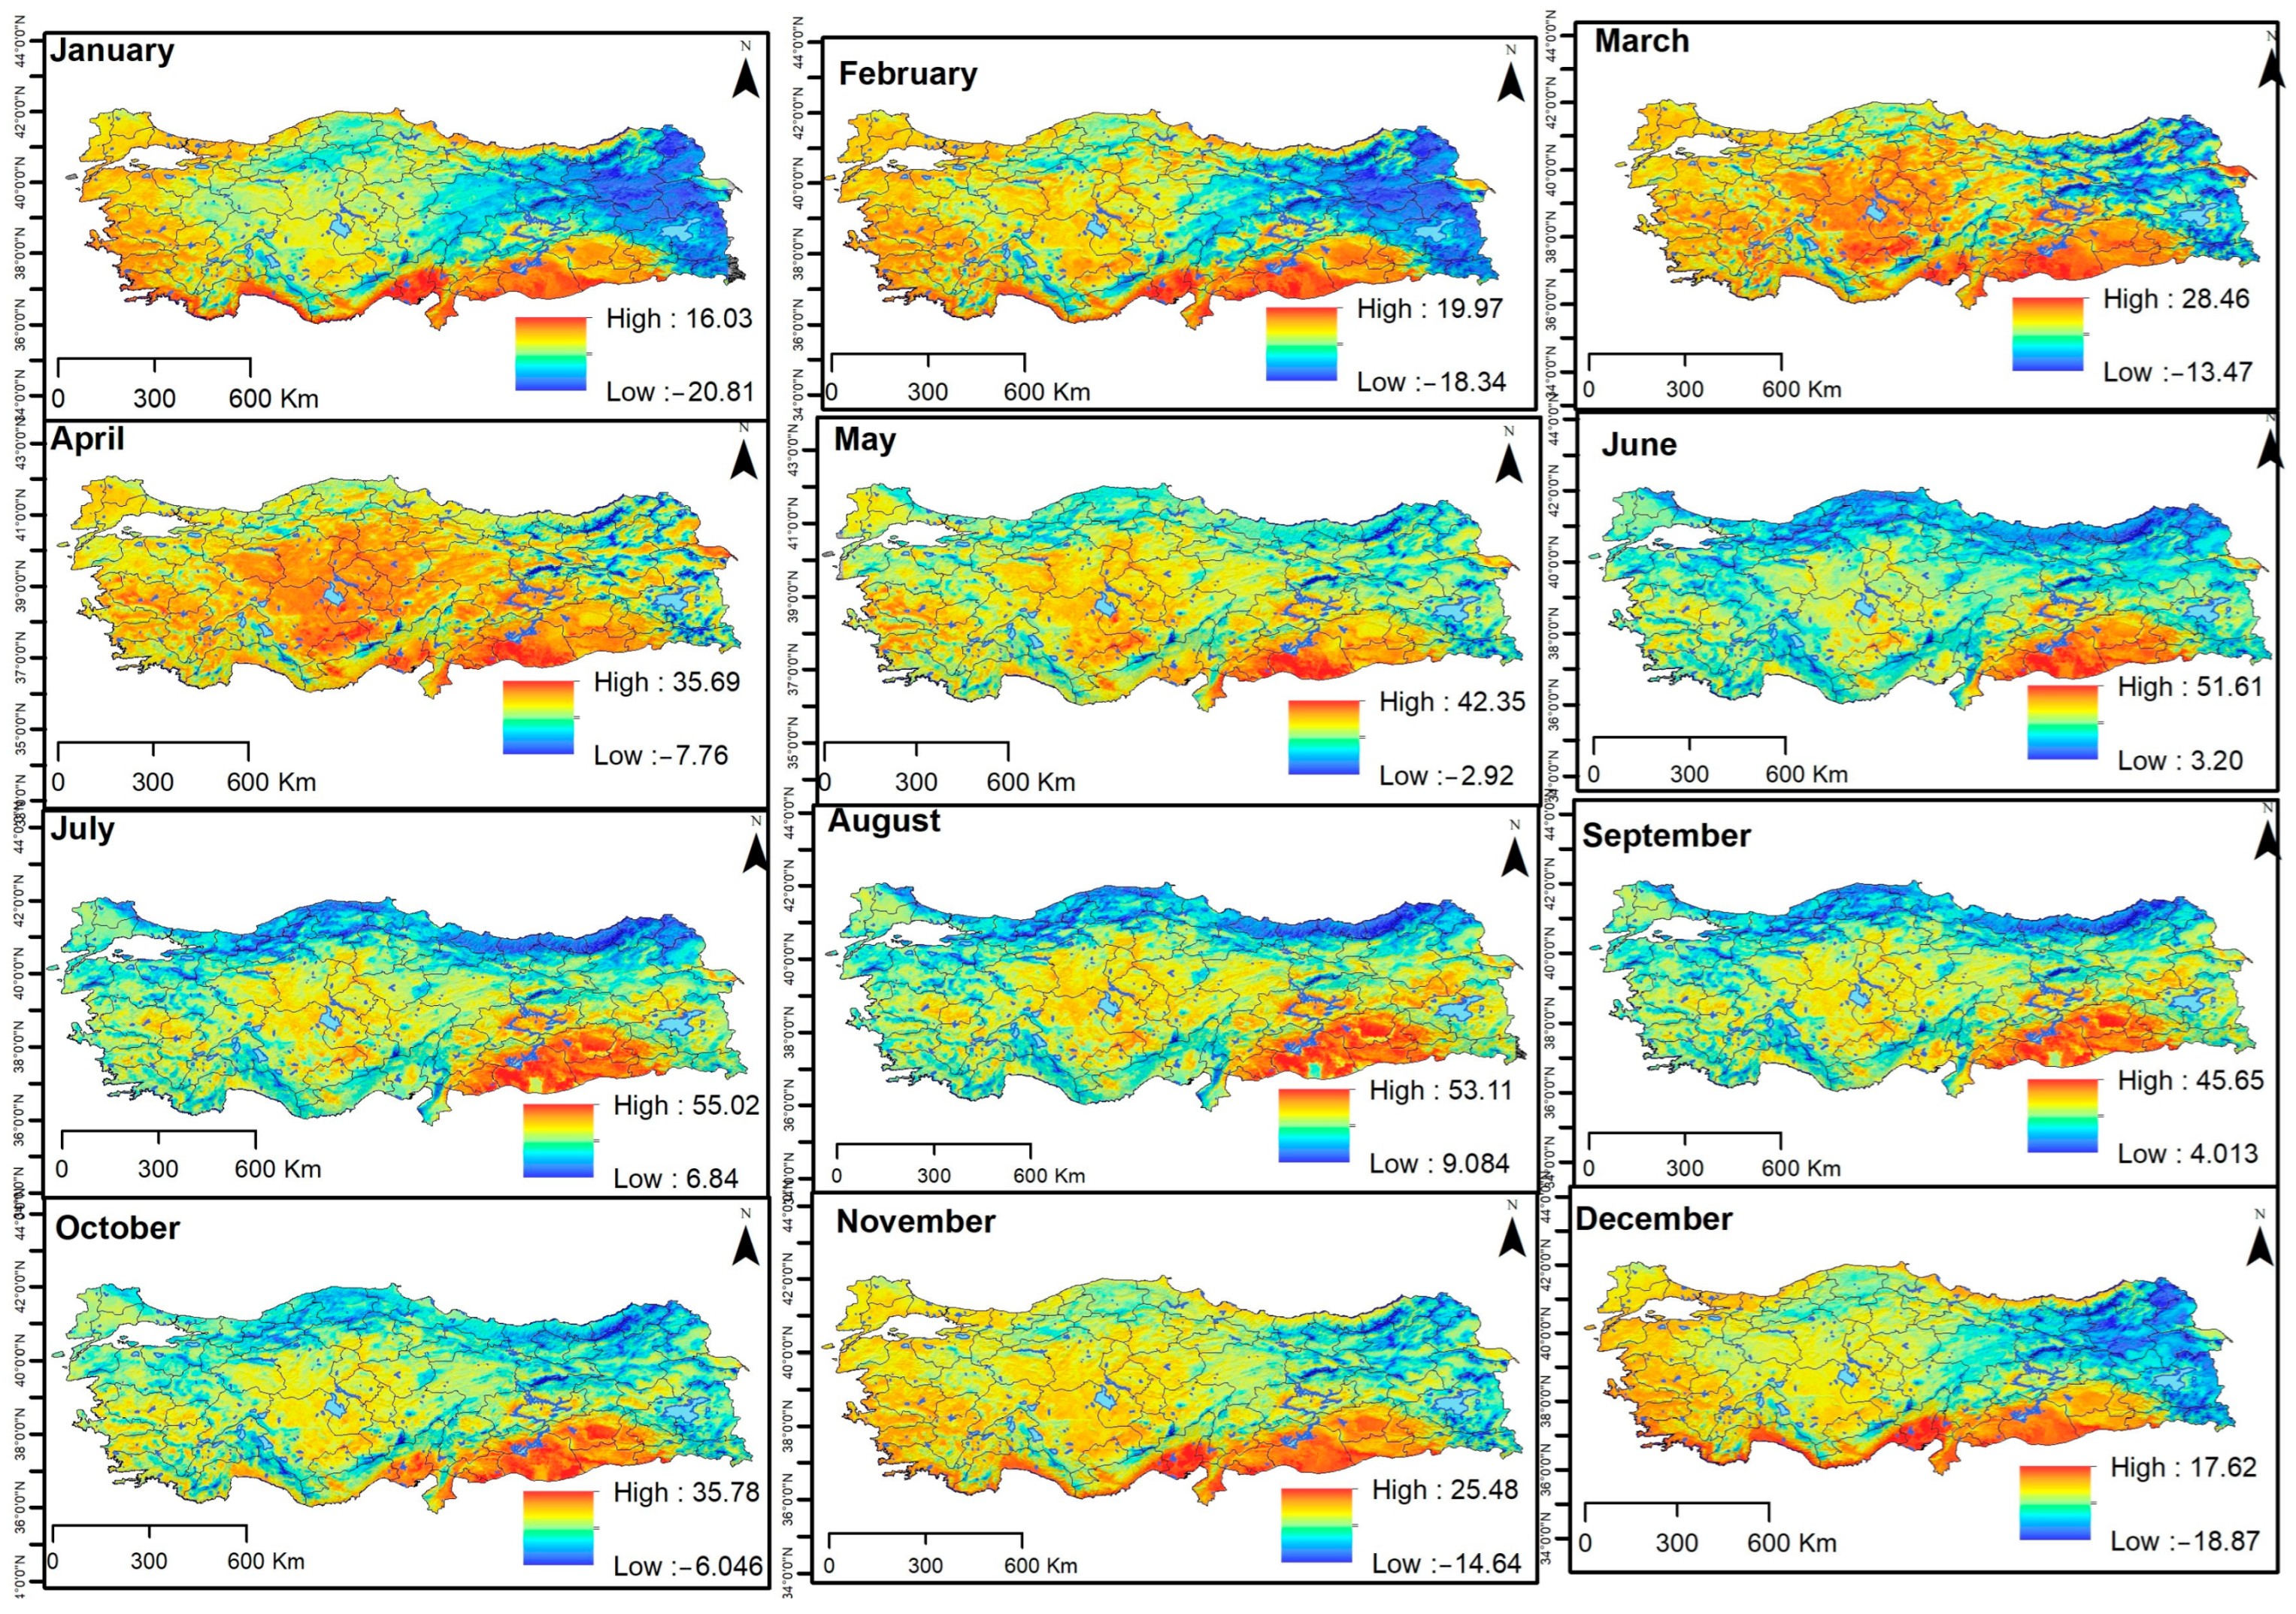
High LST values were recorded in areas where the urban heat island effect was particularly intense during summer (
Figure 18). These areas are also the provinces with the highest O
3 and NO
2 levels in Türkiye.
The spatial distribution of AI, CO2, HCHO, NO2, O3, and SO2 by province shows that pollution centers in Türkiye are concentrated in the Marmara and Aegean coasts, Central Anatolian agricultural basins, and thermal power plant regions. These patterns reveal the determinant role of LULC composition and land management policies on air quality.
The Aerosol Index was particularly high in inland regions (e.g., Konya, Kayseri, Sivas) and some Marmara provinces with high industrial density. This indicates that dust, smoke, and similar particulate matter remain suspended in the air for extended periods. Regions with a continental climate may hinder the dispersion of aerosols due to weaker winds.
AI in Türkiye generally increases during dust transport events originating from Syria and Iraq [
42]. Aerosols can reflect or absorb sunlight, reducing the amount of solar energy reaching the ground. Furthermore, aerosols, especially PM2.5 (under 2.5 microns), can penetrate the lungs and trigger asthma, bronchitis, COPD, and pneumonia [
52]. In places with high AI values, visibility decreases due to air pollution. Land, sea, and air transportation can be negatively affected.
CO2 levels are generally higher in cities with high population density and traffic congestion. Significant CO2 levels have been observed in major cities such as Istanbul, Ankara, and Bursa. Heat emissions can also cause this gas to increase during winter. This gas is lower in some Eastern Anatolia and the Black Sea region rural provinces.
Increased CO
2 can cause local and global problems. As CO
2 levels increase, heat is trapped in the atmosphere, increasing the earth’s average temperature [
53,
54]. Some global problems caused by increased CO
2 in the atmosphere include glacier melting, rising sea levels, and increased frequency of extreme weather events.
CO
2 also harms human health [
55]. CO
2 is not toxic, but high CO
2 levels in indoor environments cause serious health problems. In metropolitan cities, CO
2 emissions from energy production, transportation, and construction are particularly high [
56].
HCHO is a reactive gas in the atmosphere formed by natural and anthropogenic processes. HCHO levels are primarily due to industrial activities, biomass combustion, and some agricultural practices [
57]. Data show this gas is also high in industrial and densely populated areas, while levels are lower in rural and non-agricultural areas. Western provinces (such as İzmir and Kocaeli) and some central Anatolian cities are particularly notable for this gas.
Anthropogenic sources that increase HCHO levels in cities include motor vehicle exhaust (especially diesel), industrial facilities, and burning wood and coal [
58]. Furthermore, formaldehyde is a primarily toxic gas and is classified by the World Health Organization (WHO) as a Group 1 carcinogen (substances known to cause cancer in humans) [
43].
NO
2 is a reactive gas typically produced by the combustion of fossil fuels (gasoline, diesel, coal, natural gas). It is one of the primary pollutants of urban air and is primarily released into the atmosphere from sources such as vehicle exhaust, industrial chimneys, and power plants [
59]. The highest NO
2 values are observed in metropolitan areas (especially in industrialized provinces with high traffic density, such as Istanbul, Ankara, and Izmir). Provinces in the Thrace and Marmara Regions (e.g., Tekirdağ, Kocaeli) also have high values. These regions have industry and intensive road transportation. Provinces in Eastern and Southeastern Anatolia (e.g., Hakkari, Bitlis) generally have lower average NO
2 values, indicating relatively low industrial and traffic density.
There are two types of ozone. O
3 concentrations in the stratosphere are called “good ozone” [
60]. Good ozone gases in the stratosphere protect living things by absorbing harmful UV rays from the sun. O
3 concentrations formed in the troposphere, near the surface, are called “bad ozone” [
60]. This ozone is an air pollutant and is harmful to human health. High surface ozone damages plant tissues: It reduces photosynthesis, causes effects such as leaf spotting, yellowing, and premature aging, and leads to yield reductions, particularly in crops such as wheat, corn, and potatoes [
44].
Ozone gas generally accumulates on the surface during sunny, hot, and stable weather conditions. Therefore, provinces in the Aegean and Mediterranean regions (e.g., Aydın, Muğla, Antalya) may have higher values. Moderate O3 concentrations have also been observed in Central Anatolia. Photochemical reactions may increase in these regions due to the high temperature and sunshine duration.
SO
2 is most commonly produced by the combustion of fossil fuels (especially coal and diesel). Thermal power plants, stoves, heating systems, diesel-powered vehicles, volcanic activity, and industrial facilities are significant sources of SO
2 [
61,
62].
Provinces with a high concentration of industrial zones and thermal power plants are noteworthy in the SO2 distribution. For example, provinces such as Zonguldak, Manisa, and Sivas may have high values. Sulfur dioxide is primarily emitted from fossil fuel use and industrial chimneys. Therefore, provinces with industrial investments and coal-fired power plants are at the forefront.
A holistic analysis of the findings indicates that air pollution in Türkiye varies seasonally, spatially, and sectorally, with urban expansion, industrial production, and agricultural activities having the dominant impacts on pollution. Between 2019 and 2024, the decrease in green spaces and the increase in artificial surfaces led to persistent increases in NO2, SO2, HCHO, and AI values. These results highlight the urgent need for integrated air quality management, green infrastructure strengthening, and emission control policies.
4. Discussion
This study, conducted using satellite data, assessed the impacts of land use/land cover changes on air quality in Türkiye and revealed how urban expansion, industrial activities, and deforestation shape pollutant concentrations. Our findings are consistent with international literature but offer new perspectives reflecting region-specific dynamics. As in the study conducted by Fang et al. [
21] in China, strong correlations were found between urbanization and increases in NO
2 levels, particularly evident in metropolitan areas. However, in contrast to their focus on industrial emissions, our study revealed the significant role of agricultural practices in aerosol pollution in Anatolia, a finding more similar to Gao et al.’s [
23] findings in agricultural regions of India.
The photochemical ozone formation observed in the Mediterranean region in our study mirrors that documented in Southern Europe. However, it has a higher seasonal amplitude due to Türkiye’s unique topographic and climatic conditions. In contrast to the constant rural-urban pollution gradients identified in European studies, our study revealed sharp transitions at topographic boundaries, particularly between coastal and inland areas.
Compared to Zou et al.’s [
63] study on urban sprawl, our study revealed more complex relationships between urban heat islands and pollutant distribution in Turkish cities due to the interaction of sea breezes and topographic influences. Furthermore, while Superczynski and Christopher [
24] attributed pollution patterns primarily to transportation in their Alabama study, our multivariate analysis revealed equal contributions from industrial areas, transportation networks, and residential heating in Türkiye.
The vegetation-air quality relationship examined in our study demonstrates similarities and differences with findings from other regions. Guo et al. [
23] reported strong negative correlations between green spaces and PM
2.5 in Tianjin, while our study found stronger associations with gaseous pollutants (NO
2, SO
2, O
3) in Turkish cities, demonstrating that the role of vegetation extends beyond particle retention to include gas-phase interactions.
This research contributes to the field’s knowledge by integrating multiple satellite datasets to create a comprehensive pollution-LULC interaction model specific to the Eastern Mediterranean region. Our temporal analysis (2018–2024), which includes post-pandemic recovery models, illuminates a topic not addressed in previous studies by revealing how economic recovery accelerates pollution trends in industrial corridors. Our findings provide valuable comparisons to similar developing economies experiencing rapid urbanization while maintaining important agricultural sectors. Vadrevu et al. [
26] emphasized in the synthesis study in Asia that the need for regional-scale policy development remains valid in Turkey, and this study provides a data-based contribution to this need.
Urban expansion and industrial activities caused a significant increase in NO
2 and CO
2 emissions. These findings align with similar observations in metropolitan and heavily industrialized regions following the COVID-19 lockdown period, where renewed human activities resulted in elevated levels of NO
2, CO, SO
2, and aerosol optical depth, as documented in a recent spatiotemporal analysis of air pollutants in the Dhaka Division by Hossin et al. [
64]. Matci et al. [
65] documented the decrease in NO
2 levels in Türkiye during the COVID-19 restrictions period using Sentinel-5P data, demonstrating the direct impact of urban activities on air quality. Similarly, this study found that traffic and industrial density increased NO
2 and CO
2 emissions in metropolitan areas such as Istanbul, Ankara, and Izmir. Yagmur Aydin and Aydin [
66] estimated ground-level NO
2 concentrations in Istanbul using machine learning models, emphasizing the importance of integrating satellite data with ground-based measurements. This finding supports the validity of the TROPOMI data used in this study.
The impact of forest fires on air quality was demonstrated by Yilmaz et al. [
32] and Çinar et al. [
67] through increased CO
2 and aerosol levels in the Manavgat and Marmaris fires. As investigated earlier by Baltaci & Ezber [
42], in this study, the elevated AI (Aerosol Index) in inland regions was linked to dust transport from Syria and Iraq and local agricultural activities. A study by Serifoglu Yilmaz [
68] documented increases in NO
2 and CO
2 after the fires, up to 260%, which supports this study’s regional AI findings.
Regarding industrial pollution, Uyar and Akcin [
69] analyzed methane emissions from coal mines in Zonguldak. In this study, SO
2 was detected at high concentrations in regions with a high concentration of thermal power plants (Manisa, Zonguldak), demonstrating the decisive role of industrial activities on regional air quality. Yücer et al. [
70] demonstrated the impact of industrial density on PM10 and SO
2 distribution in their study in İzmit, which is consistent with this study’s findings in industrial zones.
The relationship between urban heat island (UHI) and air pollution was investigated by Wang et al. [
71] and Fuladlu and Altan [
72], finding significant correlations between surface temperature and NO
2 and O
3. This study also observed that photochemical reactions increase surface ozone in the Mediterranean and Aegean regions. Furthermore, Bhandari and Zhang [
51] emphasized the role of green infrastructure in reducing UHI and air pollution, and this finding was supported by the negative correlation between NDVI and pollutants in this study.
Regarding the impact of agricultural activities, Çınar et al. [
73] documented how stubble burning increases SO
2 levels in Mardin-Diyarbakır. This study confirms the impact of agricultural activities on regional air quality by detecting high AI values in agricultural areas in central Anatolia. A study by Yasan et al. [
74] in Istanbul revealed that urban sprawl increased by 14% between 1996 and 2021, significantly impacting air quality.
These findings support the consistency of the TROPOMI data used in this study. Furthermore, a study conducted by Nabizada et al. [
75] in Afghanistan emphasized the importance of spatial and temporal analysis of NO
2 distribution, consistent with this study’s findings regarding regional differences. The effectiveness of satellite-based monitoring systems (Sentinel-5P, MODIS), in particular, in air quality management has been confirmed by many studies in the literature, including Li et al. [
76], Jodhani et al. [
77], and Yilgan et al. [
78]. These findings further emphasize the importance of data-driven decision support systems for sustainable urban planning and environmental policies. As Mustafa et al. [
79] and Saha et al. [
80] emphasize, integrated air quality management systems and green infrastructure planning should form the basis of future pollution control strategies.
Using satellite-based data, this study fills a significant gap by revealing the complex relationship between land use/cover changes and air quality in Türkiye. The findings suggest that maintaining and increasing green infrastructure, particularly in urban and industrial areas, can improve air quality and mitigate climate change. Future studies are recommended to develop more detailed local-scale monitoring systems and holistic models incorporating socioeconomic factors. Such studies will guide policymakers in achieving sustainable development goals.
The seasonal findings of this study highlight the need to develop seasonally focused policy strategies for air pollution management in Türkiye. The significant increase in NO2 and SO2 concentrations during the winter months stems from fossil fuel-based heating and energy production and was observed more prominently in regions with a high concentration of thermal power plants and in metropolitan areas. Increases in O3, AI, and HCHO concentrations during the spring and summer months were associated with photochemical reactions, agricultural activities, stubble burning, and industrial emissions. In light of these findings, it is recommended to restrict coal use for heating during the winter, mandate flash gas desulfurization systems in thermal power plants, and install continuous emission monitoring systems in industrial facilities. For the summer months, it is critical to implement measures such as effectively banning stubble burning, imposing seasonal restrictions on industrial facilities with high VOC emissions, and restricting vehicle use in metropolitan areas.
According to a systematic review by Knight et al. [
81], the effectiveness of urban greening projects has shown limited effectiveness in reducing surface ozone concentrations, while dense vegetation, in particular, has been reported to reduce ultraviolet radiation exposure by 15–25% and reduce the urban heat island effect by 1–2 °C. Regarding NO
2 pollution, Chauhan et al. [
82] used machine learning models to predict that a 10% increase in green infrastructure could contribute to a 3–5% reduction in traffic-related NO
2 emissions. These findings suggest that plant species selection and layout strategies should be optimized for specific pollutant types when planning green infrastructure investments.
4.1. Limitations
While the findings of this comprehensive study, which evaluates the relationship between land use/changes and air quality at a national scale in Türkiye, yield significant results, the study has some limitations. Addressing these limitations in future research will contribute to a more in-depth understanding of the subject.
There is a trade-off between the spatial and temporal resolutions of the satellite data used in the study. While TROPOMI data provides daily temporal resolution, its spatial resolution of approximately 1.1 km masks hyper-local pollution gradients and small-scale land use characteristics that significantly impact air quality. In contrast, satellites with higher spatial resolution, such as Landsat, have lower temporal resolution.
Meteorological conditions such as cloud cover and atmospheric humidity can affect the quality and continuity of satellite data, leading to data loss or increased uncertainty. This can create gaps in daily datasets, especially during winter months and in coastal areas.
While the study focuses on six major air pollutants, it does not include other pollutants critical to public health and climate change, such as particulate matter (PM2.5 and PM10) and methane (CH4). Therefore, the relationship of these pollutants to land use changes has not been fully assessed.
While land use/land cover classifications have been validated with the CORINE dataset, they may not fully reflect local-scale dynamics and nuanced land use details. For example, the classification process may overlook heterogeneous structures within a pixel or differences in agricultural practices.
Finally, the lack of socioeconomic variables such as population growth, energy consumption patterns, and industrial production data in the models prevented the analysis of the indirect effects of the socioeconomic drivers underlying pollution changes.
4.2. Recommendations for Future Studies
Future studies should adopt a multi-scale and interdisciplinary approach to overcome these limitations. Integrating data from unmanned aerial vehicles and ground sensor networks with satellite data is crucial to capturing hyper-local relationships. Machine learning and AI-powered fusion algorithms can enable the creation of continuous, high-resolution datasets by combining datasets with different spatial and temporal resolutions.
Studying pollutants such as PM2.5 and PM10 is critical for identifying public health risks and must be included in future studies. Furthermore, modeling the impacts of agricultural activities, stubble burning practices, and climate change on air quality will enable integrated consideration of rural and urban management strategies.
Integrating socioeconomic data into the model is essential for understanding the anthropogenic factors behind changes in pollution. Ultimately, an integrated monitoring and analysis framework that combines satellite data, ground measurements, socioeconomic indicators, and advanced modeling techniques will provide a more robust data-driven decision support system for sustainable urban planning and environmental policies.
5. Conclusions
This study comprehensively demonstrated the spatial and temporal impacts of LULC changes on air quality in Türkiye during 2019–2024, using high-resolution satellite data and spatial statistical methods. The findings demonstrate that urban expansion, industrial concentration, agricultural activities, and deforestation significantly impact different pollutants. Specifically, it was revealed that NO2 and CO2 emissions are primarily driven by traffic and energy consumption in metropolitan areas. The increase in AI values is directly related to dust transport and agricultural practices in Central and Southeastern Anatolia. O3 levels increase through photochemical reactions due to high temperatures and duration of sunshine along the Mediterranean and Aegean coasts. These patterns were evaluated holistically, not only based on individual pollutants but also using LULC composition, NDVI, and LST data.
One of the study’s most important findings is the quantitative confirmation of green spaces’ air quality regulatory function. The significantly lower pollutant concentrations in areas with forests and meadows with high NDVI values demonstrate that green infrastructure provides a critical ecosystem service at both urban and rural scales. Conversely, the increase in the proportion of artificial surfaces and industrial areas has exacerbated the deterioration trend in air quality indicators. This suggests urban planning policies should focus on spatial growth and maintaining ecological balance.
The study also sheds light on the seasonal patterns of pollutants. Combustion pollutants such as NO2 and SO2 peak in winter, while AI, HCHO, and O3 peak in spring-summer. This finding highlights the importance of implementing seasonally focused measures in air pollution management. For example, promoting emission-reducing technologies for heating fossil fuel use in the winter months and prioritizing traffic management and shading/greening projects to reduce photochemical ozone formation in the summer months would be effective.
The findings from this study indicate that the policy set to reduce air pollution in Türkiye should be shaped along three principal axes:
Green infrastructure and ecosystem protection: Protecting and increasing forests, meadows, and other green areas strategically reduces the urban heat island effect and pollutant accumulation.
Industrial and urban emission management: Advanced filtration technologies and renewable energy sources should be encouraged to control emissions from thermal power plants, heavy industrial facilities, and traffic.
Seasonally focused intervention programs: Preventive and mitigating action plans should be developed to address NO2 and SO2 concentrations in winter, and O3 and AI concentrations in summer.
In conclusion, this research has revealed the multidimensional impacts of LULC changes on air quality in Türkiye at high spatial and temporal resolution, offering important implications for both science and practice. The study powerfully demonstrates that the success of sustainable urbanization, industrial planning, and land management policies depends on holistic and continuous monitoring of environmental data. The results provide a comprehensive understanding of the current situation and a foundation for guiding future environmental planning and national air quality management strategies.

