Article

Study on Intelligent Classing of Public Welfare Forestland in Kunyu City

1
The College of Forestry, Beijing Forestry University, 35 Tsinghua East Rd., Beijing 100083, China
2
Survey Planning and Design Institute, State Forestry and Grassland Administration, Beijing 100714, China
*
Author to whom correspondence should be addressed.
Land 2025, 14(1), 89; https://doi.org/10.3390/land14010089
Submission received: 4 November 2024 / Revised: 25 December 2024 / Accepted: 26 December 2024 / Published: 5 January 2025
(This article belongs to the Special Issue Smart Land Management)

Abstract

:
Manual forestland classification methods, which rely on predetermined scoring criteria and subjective interpretation, are commonly used but suffer from limitations such as high labor costs, complexity, and lack of scalability. This study proposes an innovative machine learning-based approach to forestland classification, utilizing a Support Vector Machine (SVM) model to automate the classification process and enhance both efficiency and accuracy. The main contributions of this work are as follows: A machine learning model was developed using integrated data from the Third National Land Survey of China, including forestry, grassland, and wetland datasets. Unlike previous approaches, the SVM model is optimized with Grid Search (GS), Genetic Algorithm (GA), and Particle Swarm Optimization (PSO) to automatically determine classification parameters, overcoming the limitations of manual rule-based methods. The performance of the SVM model was evaluated using confusion matrices, classification accuracy, and Matthews Correlation Coefficient (MCC). A comprehensive comparison under different optimization techniques revealed significant improvements in classification accuracy and generalization ability over manual classification systems. The experimental results demonstrated that the GA-SVM model achieved classification accuracies of 98.83% (test set) and 99.65% (overall sample), with MCC values of 0.9796 and 0.990, respectively, outpacing other optimization algorithms, including Grid Search (GS) and Particle Swarm Optimization (PSO). The GA-SVM model was applied to classify public welfare forestland in Kunyu City, yielding detailed classifications across various forestland categories. This result provides a more efficient and accurate method for large-scale forestland management, with significant implications for future land use assessments. The findings underscore the advantages of the GA-SVM model in forestland classification: it is efficient, accurate, and easy to operate. This study not only presents a more reliable alternative to conventional rule-based and manual scoring methods but also sets a precedent for using machine learning to automate and optimize forestland classification in future applications.

1. Introduction

As an important natural resource, forestland resources are not only the material basis for forestry development but also an important means of production required for production [1], and a key element of ecological civilization construction [2]. Kunyu City, Xinjiang Province, is one of the most important areas for ecological governance in China because of its important geographical location and ecological location [3]. Forestland gradation and classification involves the evaluation and grading of the quality of forestland under specific uses [4]. On 1 December 2021, China officially issued and implemented the “Technical Specification for gradation and classification on forest land” (T/CREVA 3101-2021) to provide technical guidance for forestland grading and classing. The classification of forestland reveals the differences in forestland utilization and regional differences within the region, and the classification of public forestland is of great significance to the protection of forestland resources [2]. Therefore, the classing of public forestland in Kunyu City can provide technical support for forestland protection.
Due to the natural environment change, land use change, policy regulation adjustment, ecological protection demand, and other reasons, the forestland classing results need to be updated regularly and comprehensively to ensure the current situation and practicability of forestland classing. The classification of forestland is usually based on multi-source data and according to the Technical Specification for the gradation and classification on forest land (T/CREVA 3101-2021), which has some problems such as complicated calculation, low efficiency, and large labor time cost. Therefore, this paper explores a method to achieve intelligent classing of forestland in order to improve the efficiency of forestland classification.
Classing forestland is fundamentally a classification problem, for which numerous techniques have been developed, including K-nearest neighbor (KNN), decision trees, neural networks, and Support Vector Machines (SVMs). KNN methods are simple but computationally inefficient for large datasets and sensitive to irrelevant parameters [5,6]. Decision trees offer faster training but lack flexibility in parameter modeling [7]. Neural networks, while versatile, require complex design choices and are highly sensitive to noisy data [8]. Among them, SVMs stand out for their robust theoretical foundation, excellent generalization ability, and superior performance in classification tasks [9,10,11].
SVMs have been successfully applied in agricultural land classification, demonstrating advantages over other methods. For instance, Wang et al. applied the decision tree model, BP neural network, logistic regression model, and other classification methods in the classification of agricultural land in Longchuan County [12]. Zhang et al. graded the cultivated land in Xiangyang City by BP neural network method [13]. Fan et al. screened typical samples through the Self-Organizing Feature Mapping (SOM) network and used a BP neural network and Support Vector Machine to grade cultivated land [14]. Zhu et al. used the factor method and SVM model respectively to grade cultivated land in Fengxin County [15]. Ren et al. graded cultivated land based on the factor method, the BP neural network model, and the SVM model [16]. These studies highlight SVM’s robustness and versatility, yet they also underscore challenges related to parameter optimization, which significantly influences classification accuracy.
When SVM model is used for classification, the choice of SVM model parameters is the key to the accurate classification of the model [17,18]. Previous studies have explored various optimization methods, including Grid Search (GS), Genetic Algorithm (GA), and Particle Swarm Optimization (PSO), to enhance model performance. Huang et al. adopted all three parameter optimization methods, PSO (Particle Swarm Optimization), GA (Genetic Algorithm), and GS (Grid Search method), to identify the risks of a railway transport system for dangerous goods [19]. Zhang et al. used the GA and PSO parameter optimization methods combined with 5-fold cross-validation to optimize the SVM model to draw a landslide susceptibility map [20]. Some scholars optimized the SVM model using the Whale optimization algorithm (WOA), Harris haw Optimization (HHO), and Moth Flame optimization (MFO) and applied it to the fields of tunnel extrusion classification and rock burst hazard rating [21,22]. These optimization methods have improved the adaptability and precision of SVM in various fields, but their application in forestland classification remains underexplored.
To address the challenges of inefficient, labor-intensive, and complex processes in forestland classification, this study introduces an intelligent classification approach using a Support Vector Machine (SVM) model. The proposed method integrates multiple parameter optimization techniques, including Particle Swarm Optimization (PSO), Genetic Algorithm (GA), and Grid Search (GS), to identify the optimal parameter combination (C and g) for SVM. This ensures enhanced classification accuracy and generalization capabilities. Unlike conventional rule-based or manual scoring methods, which often involve subjective judgment and are time-consuming, this model automates the classification process, significantly reducing computational complexity and human intervention. The method is specifically designed to support efficient and timely updates of public welfare forestland classification in Kunyu City, offering a scalable and robust solution for dynamic forestland management.

2. Materials and Methods
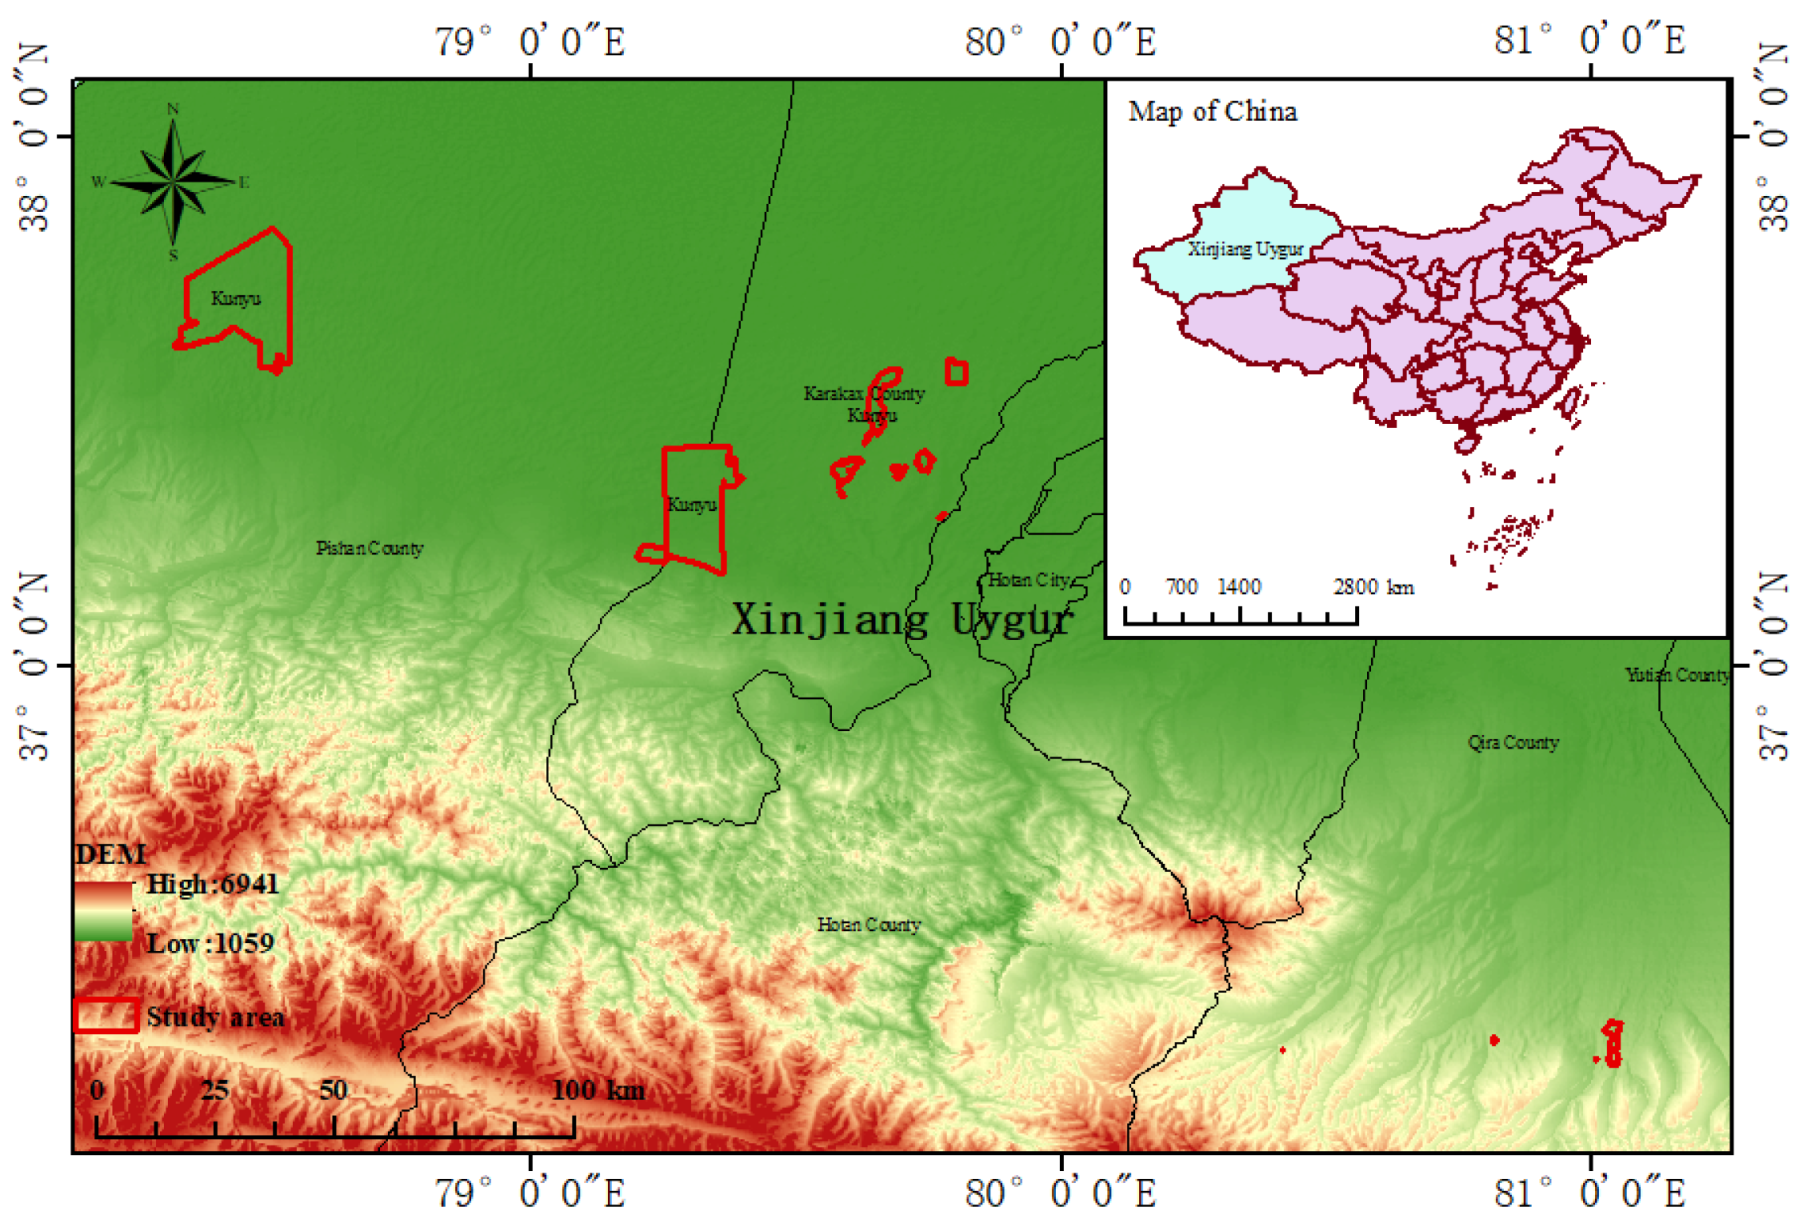
2.1. Research Area

Kunyu City, situated in Xinjiang Province, lies at the northern foothills of the Karakoram Mountains and the southern edge of the Tarim Basin in the Hotan region (Figure 1). The topography is characterized by elevated terrain in the south and east, descending toward lower elevations in the north and west, resulting in an overall flat landscape. Kunyu City belongs to the warm temperate climate and has sufficient light, rich heat, long frost-free periods, large temperature differences between day and night, and an annual average temperature of about 12.2 °C. The water resources of Kunyu city mainly come from mountain glaciers, snow melting, and precipitation in mountain areas. The main water sources in the region include the Pishan River, the Sangchu River, the Kalakash River, the Noor River, and small reservoirs. Most of Kunyu City is located in the oasis plain area, and the soil types mainly include brown-desert soil, meadow soil, aeolian sand soil, and a small part of saline soil, wherein, brown-desert soil is a zonal soil type in Tarim Basin.
The dominant tree species in Kunyu City are poplars (Populus spp.), Tamarix (Tamarix chinensis), and willow bushes, but elm (Ulmus pumila), jujube (Elaeagnus angustifolia), Populus (Populus euphratica), ash (Fraxinus spp.), apple (Malus pumila), almond (Armeniaca vulgaris), and other hard broad species play roles in wind protection and sand fixing and farmland protection.
The study area was the national public welfare forestland and general public welfare forestland in Kunyu City. The national public welfare forestland is 596.75 hectares, 26 patches, accounting for 7.60% of the area; the general public forestland is 7252.83 hectares, 5660 patches, accounting for 92.40% of the area. There are 1708.71 hectares of arbor forestland, 3443 patches; 4762.04 hectares of shrub forestland, 442 patches; and 1374.67 hectares of other forestland, 1656 map patches.

2.2. Data Sources and Preprocessing

The data integration utilized forestry, grassland, and wetland data combined with the Third National Land Survey data, with classification units based on land change survey polygons. The Climate AP software (v2.30) was used to obtain the average annual temperature and precipitation data for the study area over the past 30 years.
According to the “Technical Specification for gradation and classification on forest land” (T/CREVA 3101-2021), the gradation and classification indicators for public welfare forests in Kunyu City included average annual temperature, average annual precipitation, slope, soil thickness level, humus thickness, biodiversity, canopy density, and public welfare forest protection level. The range normalization method was applied to standardize the indicators, enhancing model accuracy, computational efficiency, convergence, and generalization ability. The calculation formula is as follows,
For positive indicators, the transformation formula is
y ij = X ij min 1 i m X ij max 1 i m X ij min 1 i m X ij , 1 i m , 1 j m
For negative indicators, the transformation formula is
y ij = max 1 i m X ij X ij max 1 i m X ij min 1 i m X ij   , 1 i m , 1 j m
where X ij represents the actual value of the indicator; max 1 i m X ij represents the maximum value of the indicator; and min 1 i m X ij represents the minimum value of the indicator. After the range normalization, the indicator values are standardized within the range of 0 to 1, where 1 represents the optimal value and 0 represents the worst value.

2.3. Model Establishment

2.3.1. Sample Training Set

A total of 1139 data samples were extracted from the overall sample to train the model, and the training set and test set were divided according to a 7:3 ratio.
According to the “Technical Specification for gradation and classification on forest land” (T/CREVA 3101-2021), the training samples were classed. Among them, there were 19 in class 1, 133 in class 3, 89 in class 4, and 898 in class 5.

2.3.2. Support Vector Machine Model

The core concept of a Support Vector Machine (SVM) is to minimize structural risk by using kernel functions to map the original space to a high-dimensional feature space, thereby enabling nonlinear transformations of the data. In high-dimensional feature spaces, SVM maximizes classification intervals by constructing an optimal hyperplane. The hyperplane can separate data points of different categories as much as possible to improve the accuracy and stability of classification. Common kernel functions are linear kernel function, polynomial kernel function, radial basis kernel function, and Sigmoid kernel function.
The SVM model forms the core of the classification framework. To enhance its performance, three optimization algorithms—Grid Search (GS), Genetic Algorithm (GA), and Particle Swarm Optimization (PSO)—are used to tune its hyperparameters (C and g). K-fold cross-validation (K-CV) is incorporated within the optimization process to evaluate the performance of candidate parameter combinations on the training set. This interaction ensures that the optimized parameters not only maximize accuracy but also generalize well to unseen data.

2.3.3. Parameter Optimization

The choice of penalty parameter C and kernel parameter g is very important when using SVM model to build classification model. Specifically, C controls the trade-off between achieving a low error on the training data and minimizing model complexity to avoid overfitting, while g defines the influence range of a single training example in the radial basis function (RBF) kernel. In this study, Grid Search (GS) [23], Genetic Algorithm (GA) [24] and Particle Swarm Optimization (PSO) [25] were used for parameter optimization.

2.3.4. K-Fold Cross-Validation

K-fold cross-validation (K-CV) involves randomly splitting the dataset into K mutually exclusive, equally sized subsets. In each iteration, K-1 subsets are used for training, while the remaining subset serves as the test set. This process is repeated K times, producing K training and test sets. The final model selection is based on the average error across all K test sets, identifying the optimal hyperparameter configuration.

2.3.5. Model Evaluation Metrics

The model evaluation metrics include AUC, confusion matrix, accuracy, and Matthews Correlation Coefficient (MCC). Both accuracy and MCC are calculated based on the confusion matrix. AUC measures the ability of the model to distinguish between classes across all classification thresholds, while MCC evaluates classification performance considering all elements of the confusion matrix, providing a balanced measure even for imbalanced datasets.
The proposed model follows a structured workflow: a stratified random sample of 1139 data points is extracted from the overall dataset of 5686 plots to ensure representative class distributions, which is then divided into training and test sets in a 7:3 ratio. Using K-fold cross-validation, SVM hyperparameters (C and g) are optimized with Grid Search (GS), Genetic Algorithm (GA), and Particle Swarm Optimization (PSO). The resulting models (GS-SVM, GA-SVM, and PSO-SVM) are evaluated on both the test set and the full dataset using metrics such as accuracy, AUC, confusion matrix, and MCC. The best-performing model, PSO-SVM, is subsequently applied to classify all 5686 plots, providing grade predictions for each plot.

2.4. Software Tools

The training and testing of the SVM model were performed in Matlab2022a, utilizing Libsvm-3.22 and the Genetic Algorithm Toolbox (gatbx) developed by the University of Sheffield. Specifically, the functions SVMcgForClass, gaSVMcgForClass, and psoSVMcgForClass were employed to optimize the model parameters.

3. Results and Analysis

3.1. SVM Parameter Optimization
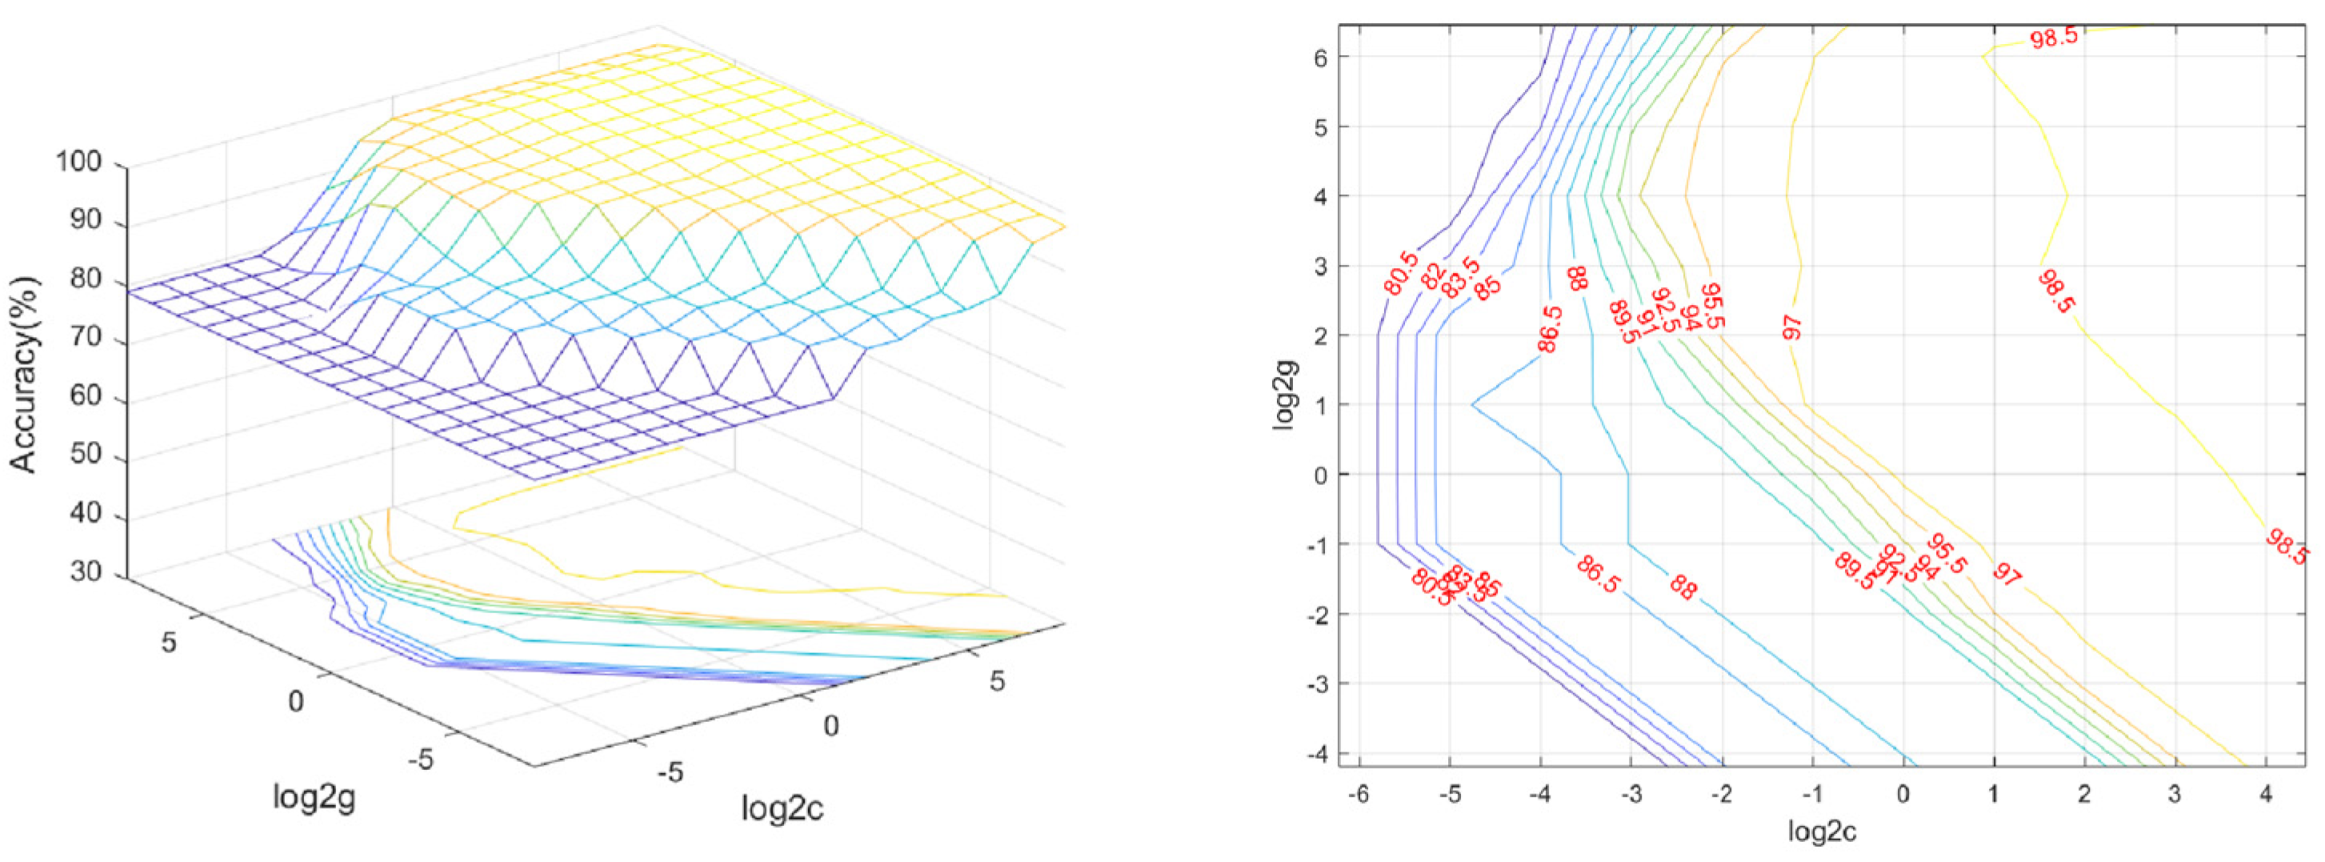
Given the diverse evaluation objectives, variations in spatiotemporal scales, and the complexity of the forestland gradation and classification data structure, the model should possess generalization capability. And, the radial basis function (RBF) kernel is widely recognized as one of the most commonly used kernel functions across various applications due to its flexibility and effectiveness in handling nonlinear relationships [26]. Therefore, the radial basis function (RBF) was selected as the kernel function [27].
Based on the selection of the radial basis function (RBF) kernel, Grid Search, Genetic Algorithm, and Particle Swarm Optimization were applied sequentially for parameter tuning, combined with five-fold cross-validation. The goal was to identify the optimal combination of C and g that achieved the best classification performance, resulting in an improved classification model to class forestland.

3.1.1. Grid Search

After normalizing the sample points, the Grid Search method was employed to optimize the SVM model parameters. The ranges for g and C were set as 2−8, 2−7, 2−6, 2−5, ... , 28, with a step size of 1. The optimal parameter combination within this grid was determined using 5-fold cross-validation. Figure 2 illustrates the hyperparameter optimization process, yielding the final hyperparameters C = 128 and g = 4, with a cross-validation rate of 99.3719%, representing the optimal combination for this model.
The optimal parameter combination C = 128 and g = 4 was applied to the SVM classification model for forestland classification. As shown in Figure 3, the classification results correspond to the labels class 1, class 3, class 4, and class 5 for public welfare forestland grading in Kunyu City. The GS-SVM model achieved an accuracy of 88.0466% on the test set, which comprised 343 samples, with 302 correctly classified. The classification accuracy for class 1 was 100% (3/3) with a 0% error rate; for class 3, accuracy was 5% (2/40) with a 95% error rate; for class 4, accuracy was 90.3% (28/31) with a 9.7% error rate; and for class 5, accuracy was 100% (269/269) with a 0% error rate.

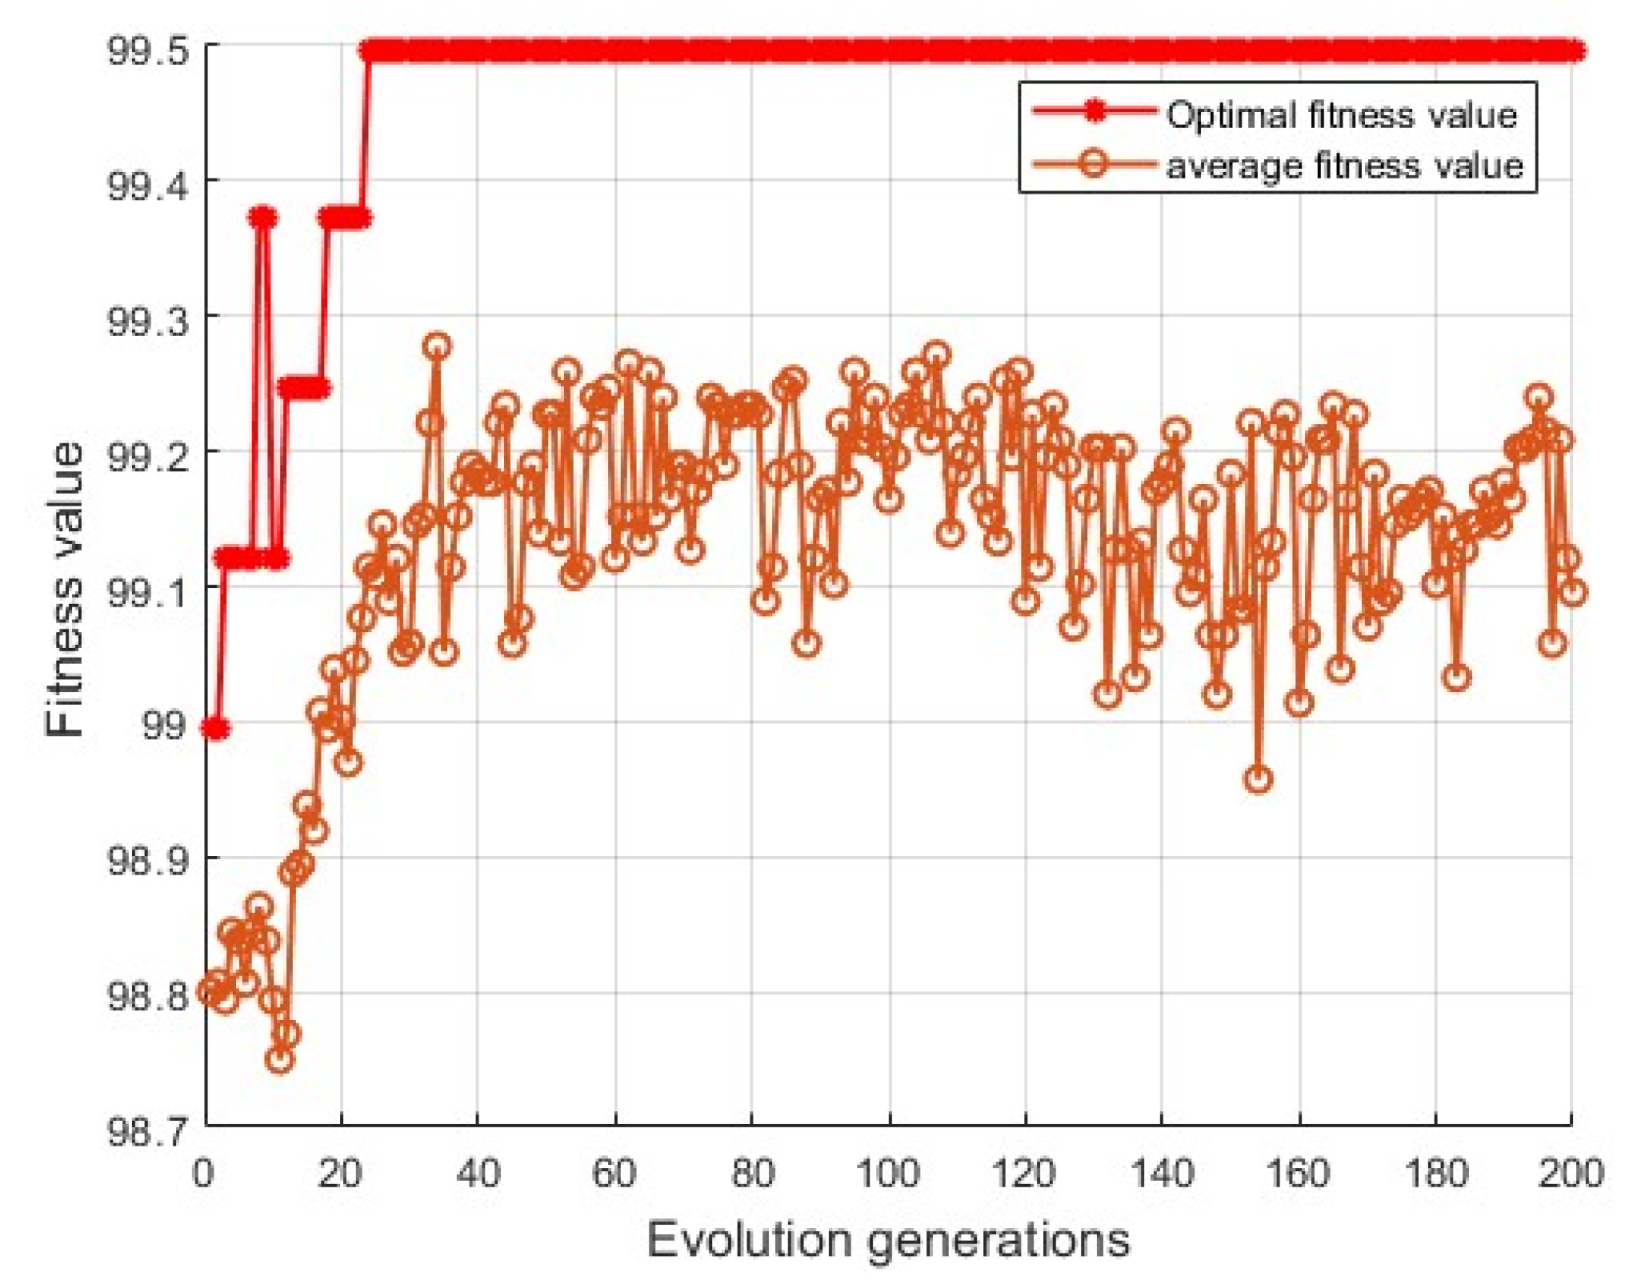
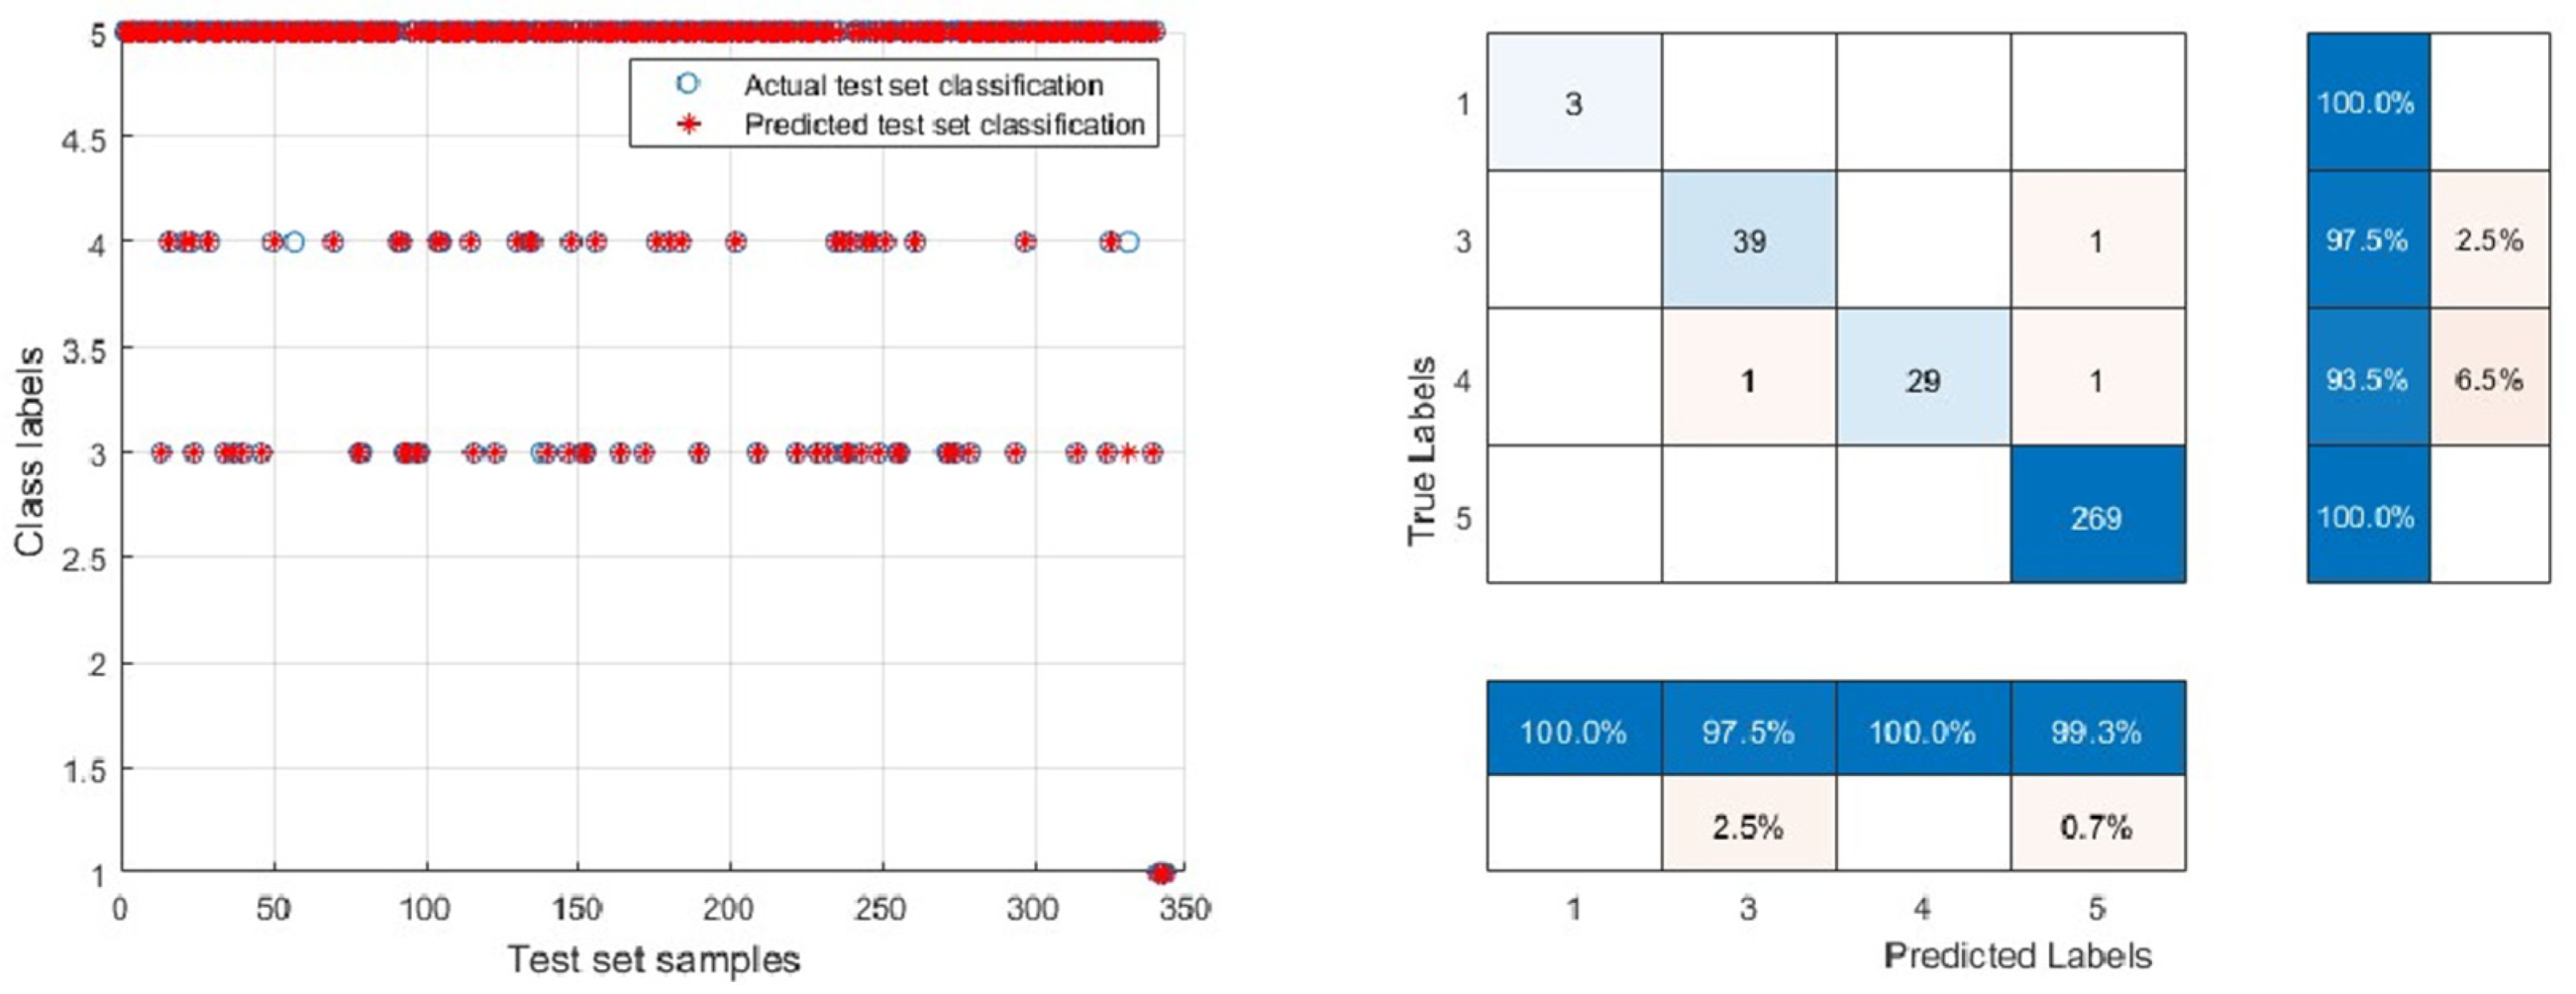
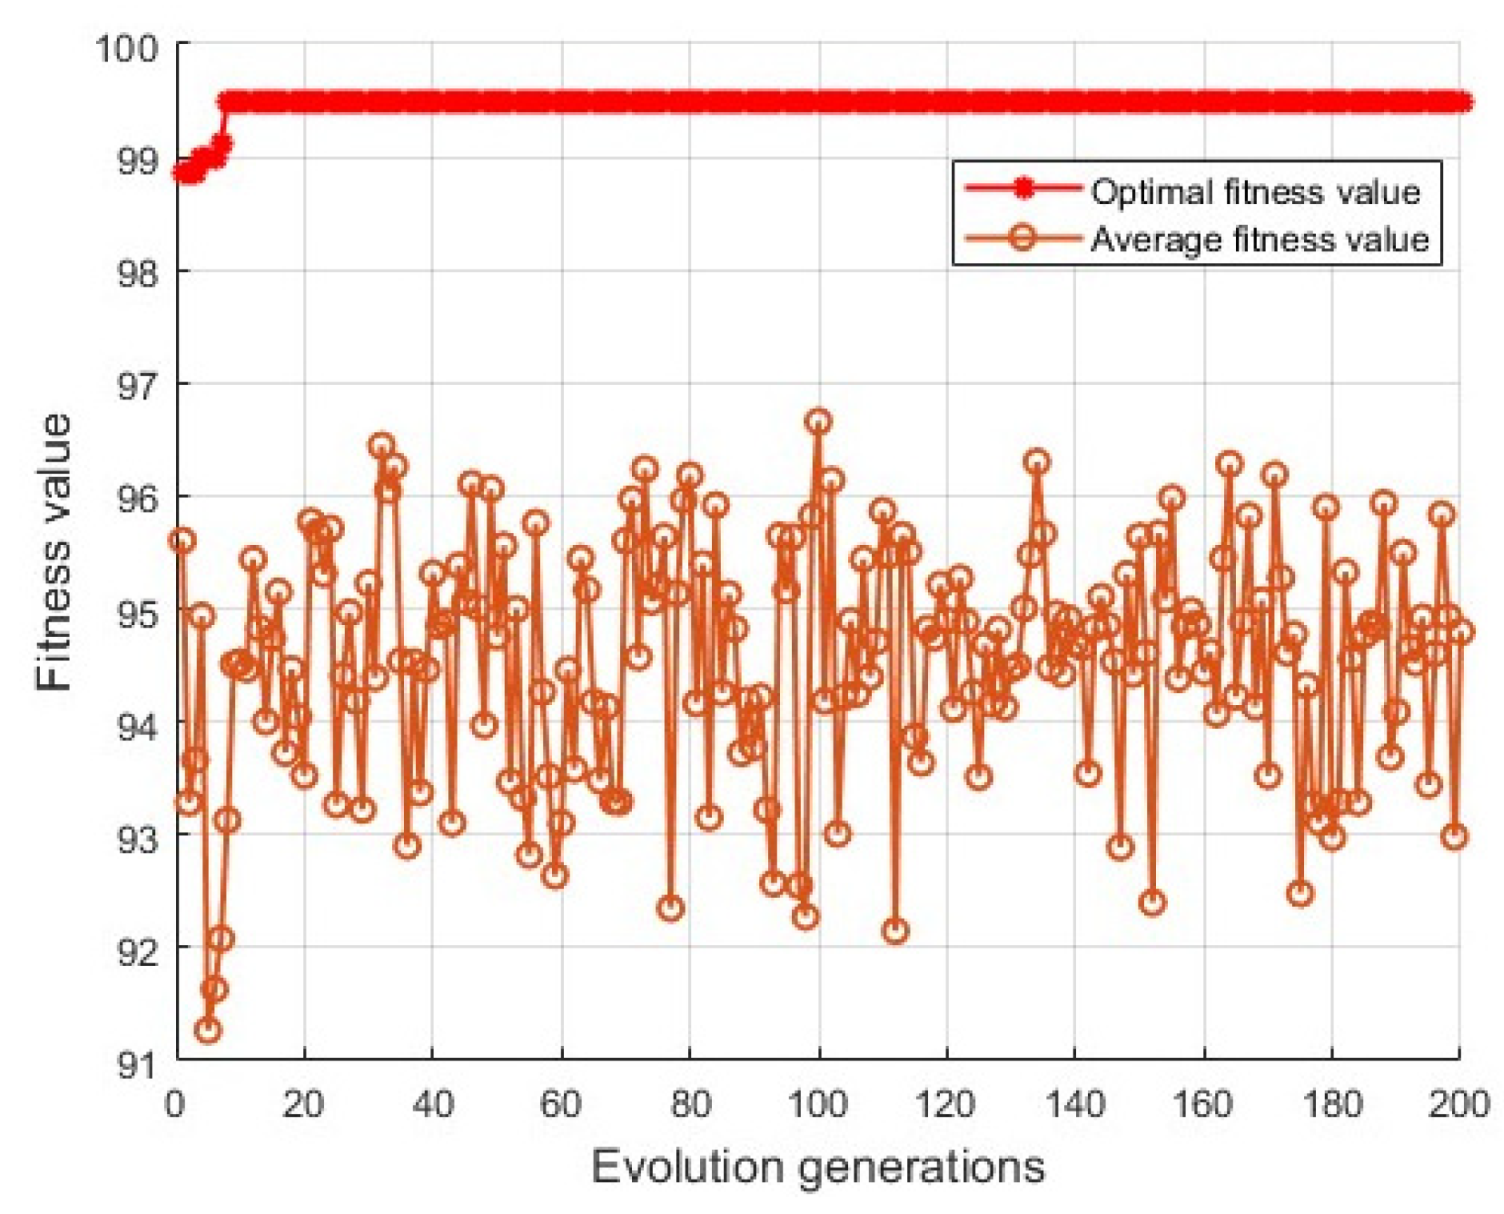
3.1.2. Genetic Algorithm

After normalizing the sample points, a Genetic Algorithm was employed to optimize the SVM model parameters. The final configuration included a population size of 20, a crossover probability of 0.9, parameter C within [0, 100], and parameter g within [0, 100]. The algorithm ran for 200 iterations with 5-fold cross-validation. The resulting fitness curve (the maximum function value in this study corresponds to the highest fitness score achieved during the Genetic Algorithm optimization process) for the GA-SVM parameters is shown in Figure 4, yielding optimal parameters C = 75.5214 and g = 4.7097, with a cross-validation rate of 99.4975%.
The optimal parameter combination C = 75.5214 and g = 4.7097 was applied to the SVM classification model for forestland classification. As shown in Figure 5, the classification results correspond to the class labels of 1, 3, 4, and 5 for the public welfare forestland classification in Kunyu City. The GA-SVM model achieved a classification accuracy of 99.1254% on the test set, which consisted of 343 samples with 340 correctly classified. The classification accuracy for class 1 was 100% (3/3), with a classification error rate of 0% (0/3); for class 3, the accuracy was 97.5% (39/40), with an error rate of 2.5% (1/40); for class 4, the accuracy was 93.5% (29/31), with an error rate of 6.5%; and for class 5, the accuracy was 100% (269/269), with an error rate of 0% (0/269).

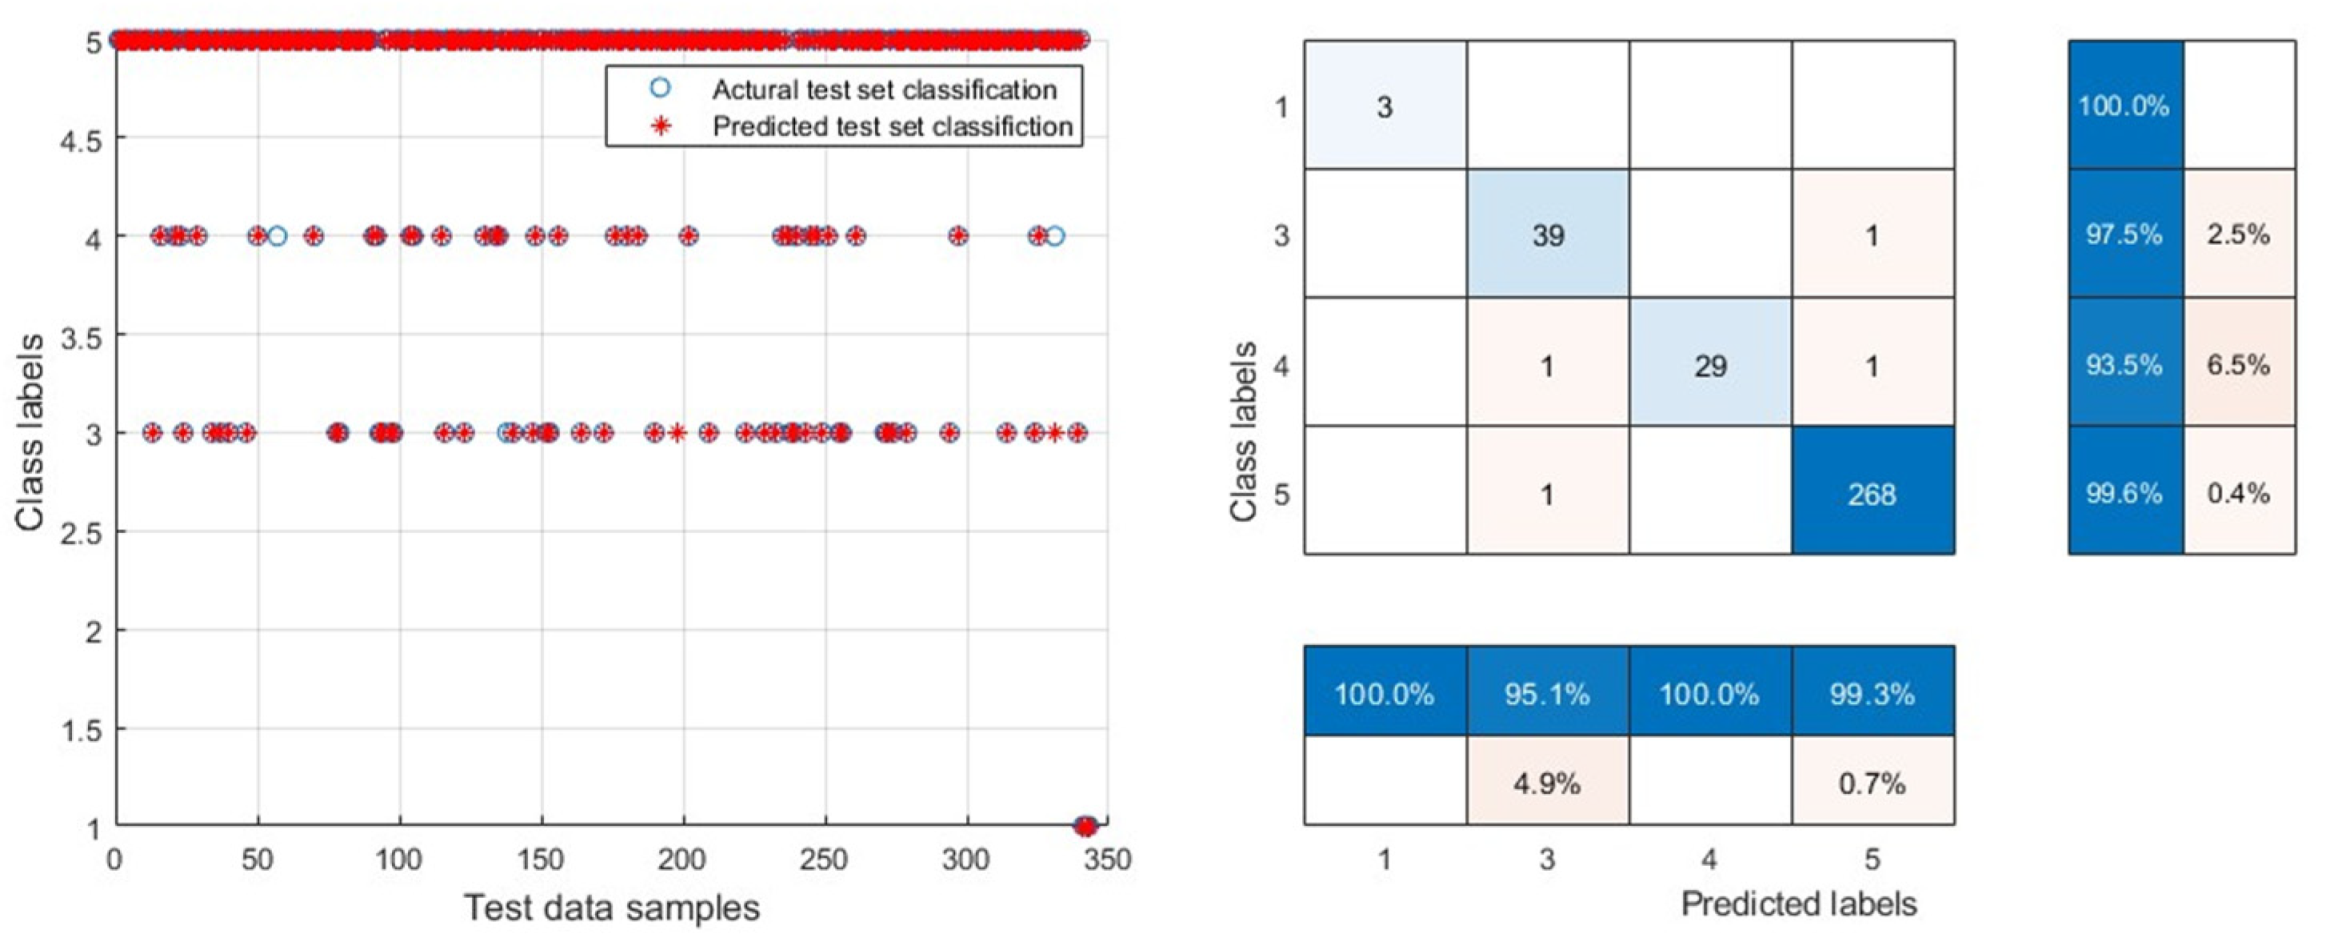
3.1.3. Particle Swarm Optimization

After normalizing the sample points, a Particle Swarm Optimization (PSO) algorithm was used to optimize the SVM model parameters. The final settings included initial learning factors C1 = 1.5 and C2 = 1.7, an inertia weight of 0.6, a population size of 20, and a termination generation of 200, with 5-fold cross-validation. Following 200 iterations, the PSO-SVM fitness curve was generated (see Figure 6), yielding optimal parameters C = 100 and g = 5.0707, with a 5-fold cross-validation rate of 99.3719%.
The optimal parameter combination C = 100 and g = 5.0707 was applied to the SVM classification model for forestland classification. As shown in Figure 7, classification results 1, 3, 4, and 5 correspond to class labels 1, 3, 4, and 5 for public welfare forestland classing in Kunyu City. The PSO-SVM model achieved an accuracy of 98.8338% on the test set, which consisted of 343 samples, with 339 correctly classified. The classification accuracy for class 1 was 100% (3/3), with a 0% error rate; for class 3, accuracy was 97.5% (39/40), with a 2.5% error rate; for class 4, accuracy was 93.5% (29/31), with a 6.5% error rate; and for class 5, accuracy was 99.6% (268/269), with a 0.4% error rate.
The training set samples achieved over 75% accuracy in 5-fold cross-validation across all three optimization algorithms, indicating that the samples are effective for model training and meet the modeling standards. Performance comparisons for the GS-SVM, GA-SVM, and PSO-SVM models on the test set are shown in Table 1. The classification accuracies for the test set were 88.0466% for GS-SVM, 99.1254% for GA-SVM, and 98.8338% for PSO-SVM. The MCC values for GS-SVM, GA-SVM, and PSO-SVM were 0.6747, 0.9796, and 0.9697, respectively. Both GA-SVM and PSO-SVM demonstrated strong classification performance, but GA-SVM had a shorter runtime of 53.1456 s compared to PSO-SVM’s 125.5197 s. Therefore, GA-SVM is preferred for forestland classification in Kunyu City.

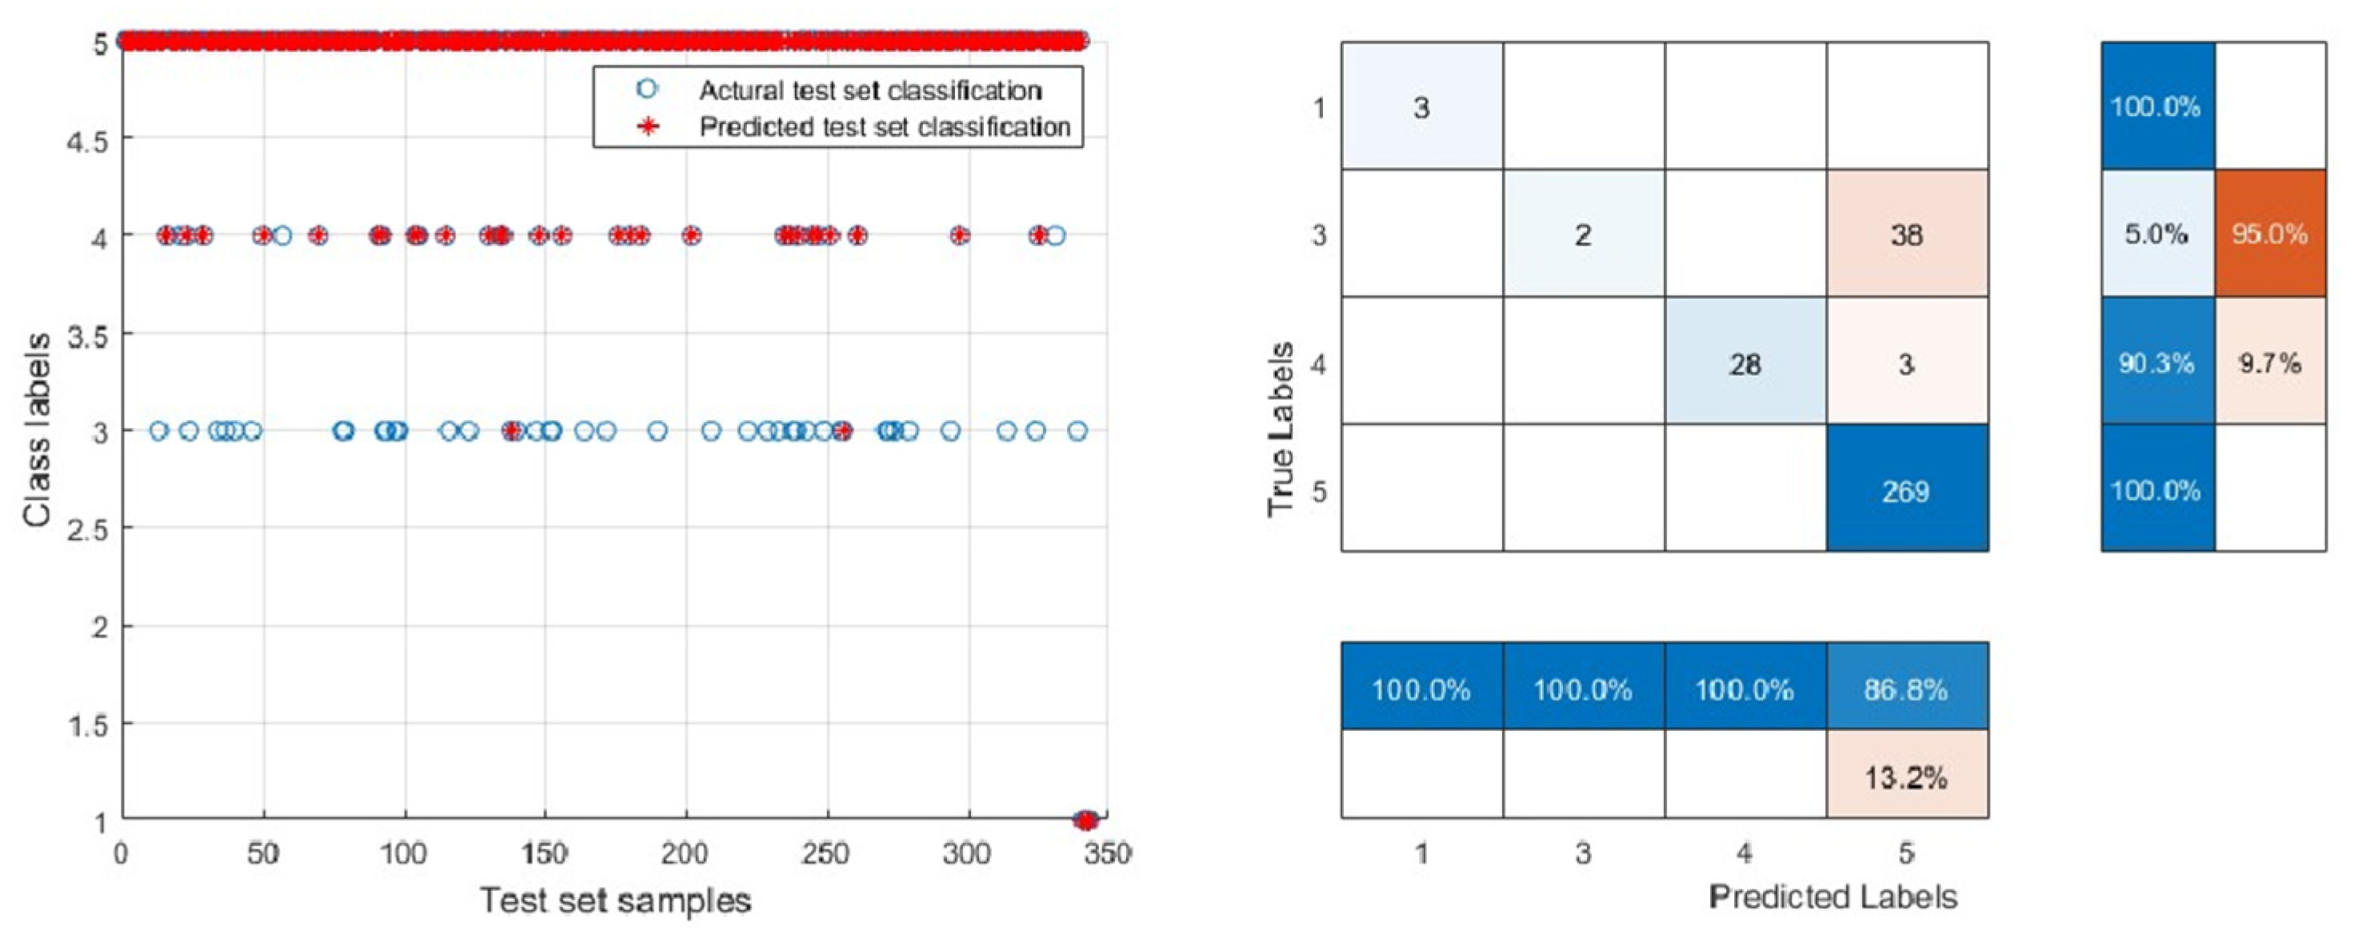
3.2. Validation and Comparison of Model Generalization Ability

To assess the generalization ability of the GS-SVM, GA-SVM, and PSO-SVM models, the classification levels of all 5686 classification units in the study area were first determined according to the “Technical Specification for Gradation and Classification on Forest Land” (T/CREVA 3101-2021). The trained models from Section 3.1 were then applied to determine the levels of these classification units. The generalization abilities of the models were compared using performance evaluation metrics, including confusion matrix, accuracy, and Matthews Correlation Coefficient (MCC).
Figure 8 illustrates the ROC curves of the GS-SVM, GA-SVM, and PSO-SVM classification models. For class 1, all three models performed well, achieving an AUC value of 1.00. In class 3, the AUC values for the GS-SVM, GA-SVM, and PSO-SVM models were 0.49, 0.66, and 0.66, respectively. For class 4, the AUC values for all three models were 0.99. In class 5, the AUC values for the GS-SVM, GA-SVM, and PSO-SVM models were 0.58, 0.53, and 0.52, respectively.
Table 2 presents the confusion matrix for the GS-SVM, GA-SVM, and PSO-SVM models. Table 3 displays the performance of each model in terms of accuracy and Matthews Correlation Coefficient (MCC) across different classification levels and overall. Both GA-SVM and PSO-SVM demonstrated superior classification accuracy and MCC compared to GS-SVM. The GS-SVM exhibited limitations in handling complex classification tasks, with an accuracy of only 2.2% and an MCC of 0.096 in class 3.
Combining the results from Figure 8, Table 2 and Table 3, this study indicates that the GA-SVM model exhibits superior generalization performance compared to both PSO-SVM and GS-SVM.

3.3. SVM Model for Classification of Public Welfare Forestland in Kunyu City

Based on the GA-SVM model, all 5686 samples from the study area were input to determine the classification levels of public welfare forestland in Kunyu City. The results indicate that the classification levels are distributed across classes 1, 3, 4, and 5. According to Table 4, there are 26 patches of class 1 forestland, covering an area of 596.75 hectares, which accounts for 7.60% of the total area. This includes 586.78 hectares of shrub forestland and 9.97 hectares of other forest types. For class 3, there are 599 patches covering 235.45 hectares, representing 3.00% of the area, which consists of 9.46 hectares of shrub forestland, 42.95 hectares of other forest types, and 183.04 hectares of arbor forestland. Class 4 comprises 375 patches with an area of 4135.57 hectares, accounting for 52.69%, including 4016.59 hectares of shrub forestland, 90.15 hectares of other forest forestland types, and 28.83 hectares of arbor forestland. Class 5 includes 4686 patches, representing 36.71% of the area, with a total area of 2881.81 hectares, including 153.31 hectares of shrub forestland, 1374.85 hectares of other forestland types, and 1496.70 hectares of arbor forestland. The spatial distribution of public welfare forestland classification in Kunyu City is shown in Figure 9.

4. Discussion

This study applied the SVM model to the classification of public welfare forestland, utilizing GS, GA, and PSO optimization algorithms. The GA-SVM was identified as the optimal model and was subsequently applied to the classification of public welfare forestland in Kunyu City. The following subsections provide an in-depth discussion of the findings and their implications.

4.1. Model Parameter Optimization

By comparing the performance of the GS-SVM, GA-SVM, and PSO-SVM models, the results indicate that the GA-SVM outperforms both the GS-SVM and PSO-SVM models. This improvement is primarily attributed to the Genetic Algorithm (GA), which excels in parameter optimization through a global search, maintenance of population diversity, and dynamic parameter adjustments. These features enable it to more effectively avoid local optima and identify better parameter combinations, making it particularly suitable for handing complex and imbalanced datasets [28]. In contrast, the GS-SVM conducts a search on a fixed parameter grid, which, while systematic, has a limited search scope. This approach makes it prone to getting stuck in local optima and results in lower computational efficiency [29]. The PSO-SVM has a weaker ability to maintain diversity, making it prone to premature convergence to local optima [30]. This aligns with the findings in previous studies, which have demonstrated GA’s effectiveness in applications such as land-cover classification [31], voltage stability monitoring [32], and soil liquefaction prediction [33].
One of the key challenges in this study is the class imbalance in the dataset, particularly in underrepresented categories such as class 1. While GA itself does not directly address class imbalance, its parameter optimization capabilities can indirectly alleviate the issue. For instance, by optimizing the penalty parameter C, the model can adjust the trade-off between correctly classifying minority samples and avoiding overfitting to majority classes. Additionally, the kernel parameter g influences the decision boundaries, enabling the model to capture subtle patterns in minority classes. Previous research supports this approach, showing that GA combined with SVM can significantly improve classification performance in imbalanced scenarios by optimizing hyperparameters sensitive to minority classes [33].
In summary, GA-SVM outperformed GS-SVM and PSO-SVM by achieving higher classification accuracy, better stability, and improved adaptability to imbalanced datasets. These findings not only confirm GA’s superiority as an optimization algorithm but also underscore its potential for tackling complex classification tasks, such as forestland classification, where data characteristics present unique challenges.

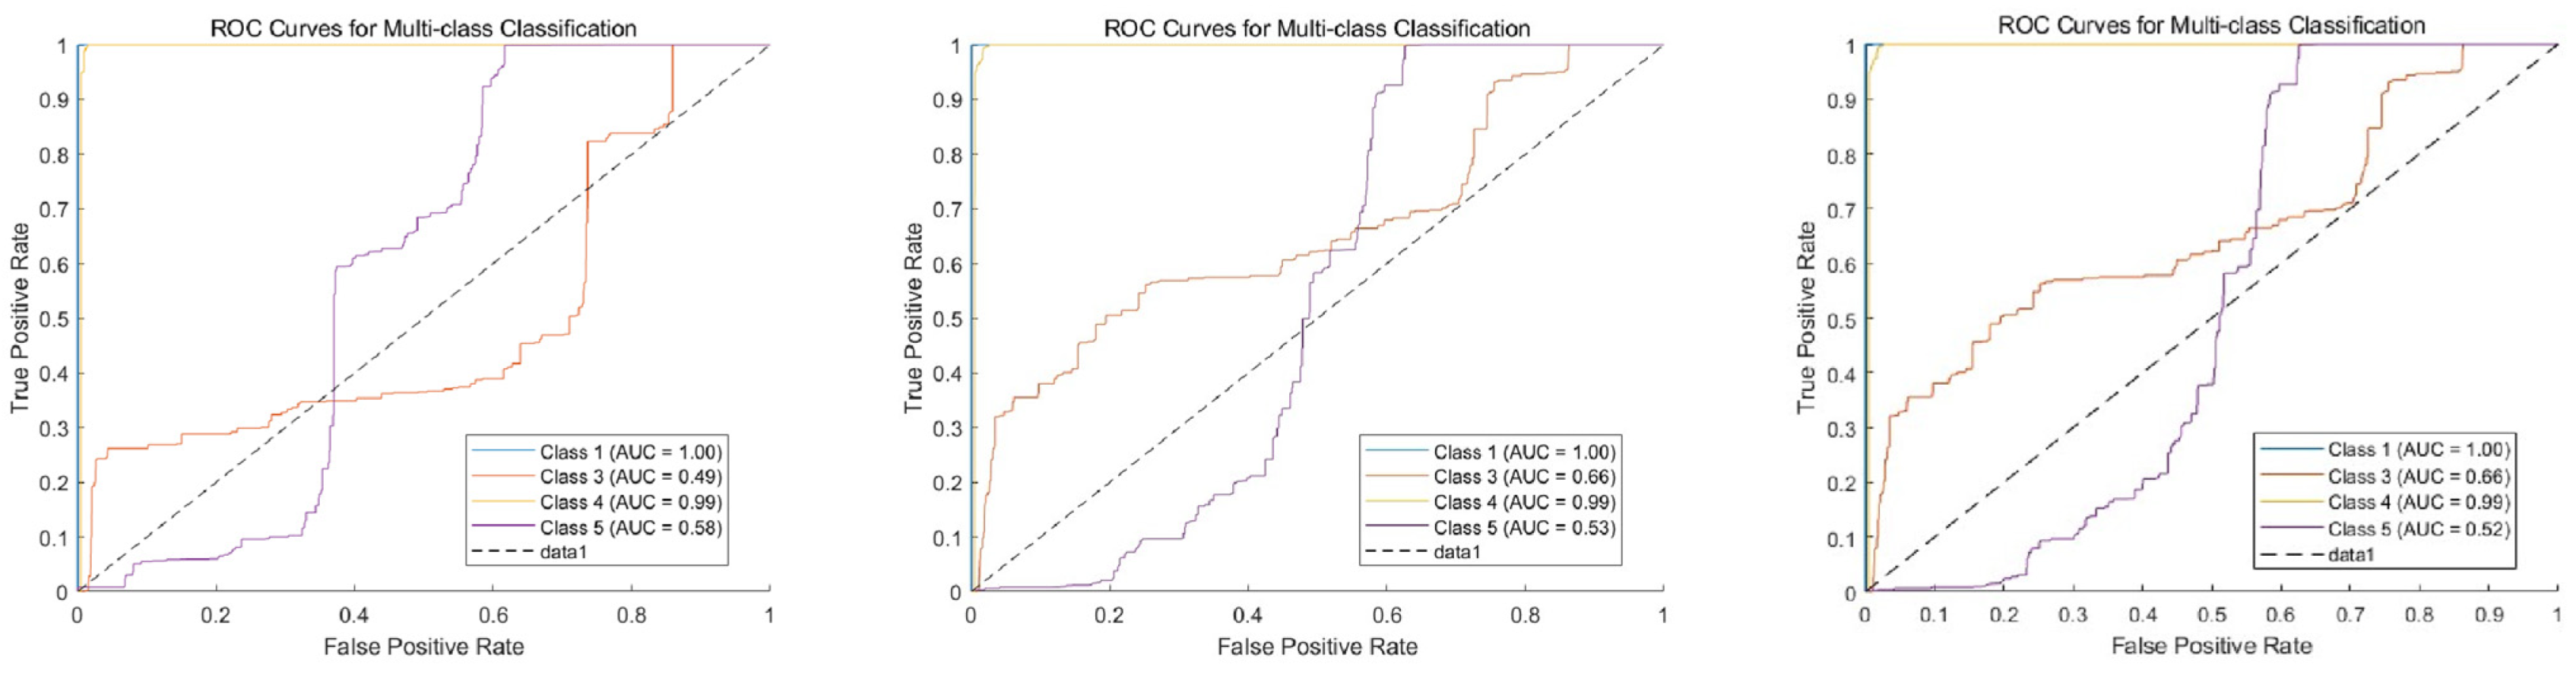
4.2. Evaluation Metrics for Imbalanced Datasets

This study employs evaluation metrics such as AUC, confusion matrix, accuracy, and MCC to assess the performance of the models. These metrics reflect the classification performance of different models across various categories and identify GA-SVM as the optimal model for classifying public welfare forestland in Kunyu City. However, the AUC values for class 3 and class 5 among the three models are notably poor, which may be due to the AUC’s suboptimal performance on imbalanced datasets [34,35], while MCC and other metrics exhibit more stable results in such contexts [36,37]. In imbalanced datasets, combining evaluation metrics such as confusion matrix, accuracy, and MCC provides a more comprehensive assessment of model performance.
The importance of employing comprehensive evaluation metrics, particularly MCC, in addressing imbalanced datasets has been demonstrated across various domains. For example, ref. [38] reported that MCC provided a robust and balanced assessment of landslide susceptibility mapping when combined with confusion matrix and AUC. This study achieved an MCC of 0.915, illustrating the metric’s reliability in handling skewed class distributions. Similarly, ref. [39] highlighted the critical role of MCC in evaluating modified deep learning models for detecting potato leaf diseases. MCC values as high as 99.5% reinforced its ability to capture the nuanced classification performance in highly imbalanced datasets, complementing traditional metrics like accuracy and AUC.
In this study, MCC effectively complemented AUC by accounting for all elements of the confusion matrix, ensuring a more balanced evaluation across classes. Combining MCC with metrics like accuracy and confusion matrix provided a holistic framework for assessing model performance, capturing both overall accuracy and class-specific imbalances. This comprehensive approach underscores the reliability of GA-SVM in addressing challenges associated with imbalanced datasets, validating the effectiveness of MCC as a primary evaluation metric.

4.3. Performance of Different Classifications

This study shows that the data for class 1 has strong discriminability and good classification performance. The model misclassifies instances in class 3 and class 5, which may be due to overlapping features and insufficient distinction between these classes. Additionally, although class 5 consists of the majority of samples, its distribution may be uneven, making it difficult for the classification model to learn effective decision boundaries. These issues highlight areas for potential improvement in the model’s performance.
Future enhancements could focus on feature selection and sample preprocessing to address these challenges. For feature selection, methods like the Pearson correlation coefficient can be used for initial feature screening, while Maximum Relevance Minimum Redundancy (mRMR) approaches can reduce feature overlap among different classes [40,41]. In terms of sample preprocessing, techniques such as resampling [42,43], weighted loss function [44,45], and data augmentation techniques [46] can be applied to balance the dataset. Additionally, techniques such as Self-Organizing Feature Mapping (SOM) can be utilized to learn the distribution of the samples as effectively as possible [14].
Integrating these methods into the GA-SVM framework could enhance its ability to distinguish between overlapping classes and improve overall classification performance. Further research could also explore advanced hybrid approaches that combine feature selection and preprocessing to address these challenges effectively.

5. Conclusions

Current forestland classification techniques face significant challenges, including complex operational processes and high time and labor costs. This study proposes an intelligent classification approach by applying the Genetic Algorithm Support Vector Machine (GA-SVM) model for classifying public welfare forestland in Kunyu City. The integration of GA for parameter optimization enhances the SVM model’s performance, automating the classification process, simplifying operations, and providing a scalable solution for intelligent forestland classification. This approach offers a practical model for addressing the limitations of traditional methods and supports the development of intelligent forestland management systems.
This study highlights the practical value of GA-SVM in improving classification efficiency and reliability, supporting better ecological resource management. By maintaining high classification accuracy and automating complex tasks, the proposed model demonstrates its potential for broader applications in forestland management.
Despite its contributions, the current model lacks a fully automated system for multi-source data integration and real-time updates, limiting its adaptability to dynamic environments. Future research will focus on developing a comprehensive intelligent platform that integrates real-time data collection, classification, and database management. Additionally, exploring advanced machine learning models will enhance system scalability and classification performance.
This study provides a strong foundation for next-generation forestland management tools, addressing critical challenges in the field and paving the way for more intelligent and efficient ecological resource management.

Author Contributions

Conceptualization, M.S., H.Y. and J.W.; methodology, M.S., H.Y. and J.W.; software. M.S. and J.Q.; data curation, M.S., H.Y. and J.Q.; writing—original draft preparation, M.S.; writing—review and editing, H.Y. and J.W. All authors have read and agreed to the published version of the manuscript.

Funding

This research was funded by the National Forestry and Grassland Administration (20230303).

Data Availability Statement

The original contributions presented in the study are included in the article, further inquiries can be directed to the corresponding author.

Conflicts of Interest

The authors declare no conflicts of interest.

References

  1. Wang, X.; Li, W. Land Price Model Based on Forest Land Classification. Mod. Inf. Technol. 2019, 3, 18–19. [Google Scholar] [CrossRef]
  2. Wu, Y.; Xue, H.; Wu, K. Construction of technical specification for forest land grading. China Land 2022, 20–21. [Google Scholar] [CrossRef]
  3. Yang, H.; Feng, X.; Cui, W.; Zhang, X. Discussion on the construction and management of protected natural areas in Xinjiang Production and Construction Corps. For. Constr. 2023, 9–12. [Google Scholar]
  4. Qiu, Y.; Zheng, Y. A Background Analysis and Technical Framework on Forest Land Classification and Evaluation. For. Resour. Manag. Ment. 2006, 1–5. [Google Scholar] [CrossRef]
  5. Altman, N.S. An Introduction to Kernel and Nearest-Neighbor Nonparametric Regression. Am. Stat. 1992, 46, 175–185. [Google Scholar] [CrossRef]
  6. Zhang, Y.; Cao, G.; Wang, B.; Li, X. A novel ensemble method for k-nearest neighbor. Pattern Recognit. J. Pattern Recognit. Soc. 2019, 85, 13–25. [Google Scholar] [CrossRef]
  7. Trabelsi, A.; Elouedi, Z.; Lefevre, E. Decision tree classifiers for evidential attribute values and class labels. Fuzzy Set. Syst. 2019, 366, 46–62. [Google Scholar] [CrossRef]
  8. Zhang, M.; Qu, H.; Xie, X.; Kurths, J. Supervised learning in spiking neural networks with noise-threshold. Neurocomputing 2017, 219, 333–349. [Google Scholar] [CrossRef]
  9. Fernandez-Delgado, M.; Cernadas, E.; Barro, S.; Amorim, D. Do we Need Hundreds of Classifiers to Solve Real World Classification Problems? J. Mach. Learn. Res. 2014, 15, 3133–3181. [Google Scholar]
  10. Burbidge, R.; Trotter, M.; Buxton, B.; Holden, S. Drug design by machine learning: Support vector machines for pharmaceutical data analysis. Comput. Chem. 2001, 26, 5–14. [Google Scholar] [CrossRef]
  11. Vapnik, V.N. The Nature of Statistical Learning Theory; Springer: Berlin/Heidelberg, Germany, 1995. [Google Scholar]
  12. Wang, L.; Tian, J.; Liu, J. Farmland classification based on data mining classification method. Trans. CSAE 2009, 25, 262–267. [Google Scholar]
  13. Zhang, Z.H.; Nie, Y.; Ma, Z.Y. Evaluation of cultivated land quality based on BP neural network method: A case study at Xiangyang urban area. China Agric. Inform. 2019, 31, 72–83. [Google Scholar]
  14. Fan, S.; Qiu, L.; Ru, K.; Chen, Q.; Hu, Y. Classification method of agricultural land quality based on back propagation neural network and support vector machine. J. China Agric. Univ. 2018, 23, 138–148. [Google Scholar]
  15. Zhu, X.; Zhang, L.T.; Jin, H.H. Cultivated Land Quality Assessment Methodology Based on Factor Method and SVM Model. Chin. J. Soil. Sci. 2020, 51, 561–567. [Google Scholar] [CrossRef]
  16. Ren, B.; Zhang, Q.; Zhou, X. Research on Cultivated Land Quality Evaluation Based on Data Mining Model. Jiangxi Sci. 2022, 40, 1091–1095. [Google Scholar] [CrossRef]
  17. Ali, A.H.; Abdullah, M.Z. An Efficient Model for Data Classification Based on SVM Grid Parameter Optimization and PSO Feature Weight Selection. Int. J. Integr. Eng. 2020, 12, 1–12. [Google Scholar]
  18. Wumaier, T.; Xu, C.; Guo, H.Y.; Jin, Z.J.; Zhou, H.J. Fault Diagnosis of Wind Turbines Based on a Support Vector Machine Optimized by the Sparrow Search Algorithm. IEEE Access 2021, 9, 69307–69315. [Google Scholar] [CrossRef]
  19. Huang, W.; Liu, H.; Zhang, Y.; Mi, R.; Tong, C.; Xiao, W.; Shuai, B. Railway dangerous goods transportation system risk identification: Comparisons among SVM, PSO-SVM, GA-SVM and GS-SVM. Appl. Soft Comput. 2021, 109, 16. [Google Scholar] [CrossRef]
  20. Zhang, Y.B.; Xu, P.Y.; Liu, J.; He, J.X.; Yang, H.T.; Zeng, Y.; He, Y.Y.; Yang, C.F. Comparison of LR, 5-CV SVM, GA SVM, and PSO SVM for landslide susceptibility assessment in Tibetan Plateau area, China. J. Mt. Sci.-Engl. 2023, 20, 979–995. [Google Scholar] [CrossRef]
  21. Zhou, J.; Yang, P.X.; Peng, P.A.; Khandelwal, M.; Qiu, Y.G. Performance Evaluation of Rockburst Prediction Based on PSO-SVM, HHO-SVM, and MFO-SVM Hybrid Models. Min. Met. Explor. 2023, 40, 617–635. [Google Scholar] [CrossRef]
  22. Zhou, J.; Zhu, S.L.; Qiu, Y.G.; Armaghani, D.; Zhou, A.N.; Yong, W.X. Predicting tunnel squeezing using support vector machine optimized by whale optimization algorithm. Acta. Geotech. 2022, 17, 1343–1366. [Google Scholar] [CrossRef]
  23. Gao, X.; Hou, J. An improved SVM integrated GS-PCA fault diagnosis approach of Tennessee Eastman process. Neurocomputing 2016, 174, 906–911. [Google Scholar] [CrossRef]
  24. Wu, C.H.; Tzeng, G.H.; Goo, Y.J.; Fang, W.C. A real-valued genetic algorithm to optimize the parameters of support vector machine for predicting bankruptcy. Expert. Syst. Appl. 2007, 32, 397–408. [Google Scholar] [CrossRef]
  25. Huang, C.; Dun, J.F. A distributed PSO-SVM hybrid system with feature selection and parameter optimization. Appl. Soft Comput. 2008, 8, 1381–1391. [Google Scholar] [CrossRef]
  26. Cervantes, J.; Garcia-Lamont, F.; Rodríguez-Mazahua, L.; Lopez, A. A comprehensive survey on support vector machine classification: Applications, challenges and trends. Neurocomputing 2020, 408, 189–215. [Google Scholar] [CrossRef]
  27. Song, S.; Zhan, Z.; Long, Z.; Zhang, J.; Yao, L. Comparative study of SVM methods combined with voxel selection for object category classification on fMRI data. PLoS ONE 2011, 6, e17191. [Google Scholar] [CrossRef]
  28. Wang, J.; Ran, R.; Song, Z.; Sun, J. Short-Term Photovoltaic Power Generation Forecasting Based on Environmental Factors and GA-SVM. J. Electr. Eng. Technol. 2017, 12, 64–71. [Google Scholar] [CrossRef]
  29. Phan, A.V.; Le Nguyen, M.; Bui, L.T. Feature weighting and SVM parameters optimization based on genetic algorithms for classification problems. Appl. Intell. 2017, 46, 455–469. [Google Scholar] [CrossRef]
  30. Li, X.Z.N. A Method of Depression Recognition Based on Visual Information. J. Med. Imaging Health Inform. 2017, 7, 1572–1579. [Google Scholar] [CrossRef]
  31. Sukawattanavijit, C.; Chen, J.; Zhang, H.S. GA-SVM Algorithm for Improving Land-Cover Classification Using SAR and Optical Remote Sensing Data. IEEE Geosci. Remote Sens. 2017, 14, 284–288. [Google Scholar] [CrossRef]
  32. Sajan, K.S.; Kumar, V.; Tyagi, B. Genetic algorithm based support vector machine for on-line voltage stability monitoring. Int. J. Elec. Power 2015, 73, 200–208. [Google Scholar] [CrossRef]
  33. Xue, X.H.; Xiao, M. Application of genetic algorithm-based support vector machines for prediction of soil liquefaction. Env. Earth Sci. 2016, 75, 874. [Google Scholar] [CrossRef]
  34. Richardson, E.; Trevizani, R.; Greenbaum, J.A.; Carter, H.; Nielsen, M.; Peters, B. The receiver operating characteristic curve accurately assesses imbalanced datasets. Patterns 2024, 5, 100994. [Google Scholar] [CrossRef]
  35. Liu, Y.J.; Li, Y.Z.; Xie, D.J. Implications of imbalanced datasets for empirical ROC-AUC estimation in binary classification tasks. J. Stat. Comput. Sim. 2024, 94, 183–203. [Google Scholar] [CrossRef]
  36. Chicco, D.; Jurman, G. The advantages of the Matthews correlation coefficient (MCC) over F1 score and accuracy in binary classification evaluation. BMC Genom. 2020, 21, 6. [Google Scholar] [CrossRef]
  37. Boughorbel, S.; Jarray, F.; El-Anbari, M. Optimal classifier for imbalanced data using Matthews Correlation Coefficient metric. PLoS ONE 2017, 12, e0177678. [Google Scholar] [CrossRef]
  38. Sharma, N.; Saharia, M.; Ramana, G.V. High resolution landslide susceptibility mapping using ensemble machine learning and geospatial big data. Catena 2024, 235, 107653. [Google Scholar] [CrossRef]
  39. Lanjewar, M.G.; Morajkar, P.; Payaswini, P. Modified transfer learning frameworks to identify potato leaf diseases. Multimed. Tools Appl. 2023, 83, 50401–50423. [Google Scholar] [CrossRef]
  40. Sun, K.; Li, G.; Chen, H.; Liu, J.; Li, J.; Hu, W. A novel efficient SVM-based fault diagnosis method for multi-split air conditioning system’s refrigerant charge fault amount. Appl. Therm. Eng. 2016, 108, 989–998. [Google Scholar] [CrossRef]
  41. Biswas, P.; Samanta, T. A Method for Fault Detection in Wireless Sensor Network Based on Pearson’s Correlation Coefficient and Support Vector Machine Classification. Wirel. Pers. Commun. 2022, 123, 2649–2664. [Google Scholar] [CrossRef]
  42. Koziarski, M.; Wozniak, M.; Krawczyk, B. Combined Cleaning and Resampling algorithm for multi-class imbalanced data with label noise. Knowl.-Based Syst. 2020, 204, 106223. [Google Scholar] [CrossRef]
  43. Wah, Y.B.; Ismail, A.; Azid, N.; Jaafar, J.; Aziz, I.A.; Hasan, M.H.; Zain, J.M. Machine Learning and Synthetic Minority Oversampling Techniques for Imbalanced Data: Improving Machine Failure Prediction. CMC-Comput. Mater. Con. 2023, 75, 4821–4841. [Google Scholar] [CrossRef]
  44. Peng, L.Z.; Zhang, H.L.; Yang, B.; Chen, Y.H. A new approach for imbalanced data classification based on data gravitation. Inf. Sci. 2014, 288, 347–373. [Google Scholar] [CrossRef]
  45. Chao, X.R.; Kou, G.; Peng, Y.; Fernández, A. An efficiency curve for evaluating imbalanced classifiers considering intrinsic data characteristics: Experimental analysis. Inf. Sci. 2022, 608, 1131–1156. [Google Scholar] [CrossRef]
  46. Guo, J.; Wang, M.; Sun, L.; Xu, D. New method of fault diagnosis for rolling bearing imbalance data set based ongenerative adversarial network. Comput. Integr. Manuf. Syst. 2022, 28, 2825–2835. [Google Scholar] [CrossRef]
Figure 1. The geographical location of Kunyu, China.
Land 14 00089 g001
Figure 2. GS-SVM parameter selection diagram.
Land 14 00089 g002
Figure 3. Actual and predicted classifications of test set and confusion matrix for the GS-SVM model. The confusion matrix on the right uses a color-coding scheme where dark blue on the diagonal indicates correctly classified samples, with deeper shades representing higher accuracy. Off-diagonal orange regions indicate misclassified samples, with deeper shades corresponding to higher misclassification rates. The same applies to all confusion matrix presented hereinafter.
Land 14 00089 g003
Figure 4. Fitness curve of GA-SVM parameters.
Land 14 00089 g004
Figure 5. Actual and predicted classifications of the test set and the confusion matrix for the GA-SVM model.
Land 14 00089 g005
Figure 6. Fitness curve of PSO-SVM parameters.
Land 14 00089 g006
Figure 7. Actual and predicted classifications of the test set and confusion matrix for the PSO-SVM model.
Land 14 00089 g007
Figure 8. ROC curve of GS-SVM, GA-SVM, and PSO-SVM classification models.
Land 14 00089 g008
Figure 9. Part layout of Kunyu Public Forestland Classification based on GA-SVM model.
Land 14 00089 g009
Table 1. Test sample classification results by different optimization algorithms.
SVM TypeBest CBest gTest Set Classification Accuracy/%
[Number of Errors/Total Number of Samples]
MCCRun Time t/s
GS-SVM128488.0466 [302/343]0.67476.9008
GA-SVM75.52144.709799.1254 [340/343]0.979653.1456
PSO-SVM1005.070798.8338 [339/343]0.9697125.5197
Table 2. Confusion matrix of different SVM models.
Classifier TypeForestland Classification
Class 1Class 3Class 4Class 5
GS-SVMClass 126///
Class 3/13/10
Class 4//3593
Class 5/586194670
GA-SVMClass 126///
Class3/59513
Class 4//3705
Class 5/474765
PSO-SVMClass 126///
Class 3/59515
Class 4//3705
Class 5/474673
Table 3. Classification accuracy of different SVM models on the entire dataset.
Forestland
Classification
Class 1Class 3Class 4Class 5Overall
Accuracy MCCAccuracy MCCAccuracy MCCAccuracy MCCAccuracy MCC
GS-SVM100%12.20%0.09695%0.96999.70%0.58089.13%0.661
GA-SVM100%199.30%0.99197.90%0.98299.80%0.98799.65%0.990
PSO-SVM100%198.80%0.96098.70%0.97099.80%0.96299.61%0.973
Table 4. Classification distribution table of public welfare forest in Kunyu City based on GA-SVM model.
ClassShrub ForestlandOther Forestland Arbor ForestlandTotal
Patch CountArea (ha)Patch CountArea (ha)Patch CountArea (ha)Patch CountArea (ha)
125586.78 19.97 --26596.75
3239.46 11042.95 466183.04 599235.45
42904016.59 4790.15 3828.83 3754135.57
5197153.31 15181231.80 29711496.70 46862881.81
Total5354766.14 16761374.87 34751708.57 56867849.58
Disclaimer/Publisher’s Note: The statements, opinions and data contained in all publications are solely those of the individual author(s) and contributor(s) and not of MDPI and/or the editor(s). MDPI and/or the editor(s) disclaim responsibility for any injury to people or property resulting from any ideas, methods, instructions or products referred to in the content.

