Article

Innovative Fly-Ash-Based Soil Crust Rehabilitation: Enhancing Wind Erosion Resistance in Gravel-Layered Desert Mining Areas

1
School of Geology and Mining Engineering, Xinjiang University, Urumqi 830017, China
2
School of Environment Science & Spatial Informatics, China University of Mining & Technology, Xuzhou 221116, China
*
Author to whom correspondence should be addressed.
Land 2025, 14(1), 36; https://doi.org/10.3390/land14010036
Submission received: 18 November 2024 / Revised: 13 December 2024 / Accepted: 25 December 2024 / Published: 27 December 2024

Abstract

:
Gravel layers are vital ecological barriers in Gobi Desert mining areas. However, open-pit activities increase wind and soil erosion. Thus, the effects of fly ash addition, water content, and compaction on the shear strength and wind erosion resistance of soil crusts were explored by compaction tests, direct shear tests, and wind tunnel experiments. (1) The results of the direct shear test and vane shear test show that the modified soil sample achieved the maximum shear strength under the conditions of 15% fly ash content, 13% water content, and 3 compaction cycles. (2) The results of the wind tunnel test indicate that the wind erosion resistance of the gravel layer soil crust was improved after fly ash treatment. Compared to the untreated soil crust, the wind erosion amount of the treated soil was reduced by 23%. (3) Microscopic analysis revealed that hydration products from fly ash filled the soil pores, enhancing particle bonding and soil structure, using a scanning electron microscope (SEM) and an X-ray fluorescence spectrometer (XRF). (4) Considering the water scarcity in the Eastern Junggar Coalfield of China, a revised rehabilitation scheme was selected, involving 11% water content and single compaction, offering a balance between performance and economic efficiency. This study provides a novel approach to gravel layer restoration in arid mining regions using fly ash as a soil stabilizer, offering a sustainable method to enhance wind erosion resistance and promote fly ash recycling.

1. Introduction

The Eastern Junggar Coalfield in Xinjiang, China, is situated within a vast expanse of the Gobi Desert, where a distinctive gravel layer, known as the “gravel layer”, extensively covers the surface. This gravel layer, typically 1–5 cm thick, plays a fundamental role in the Gobi ecosystem. It serves as a protective shield, reducing the vulnerability of the underlying soil to wind erosion by increasing surface roughness and dissipating wind energy. The gravel layer also acts as a physical barrier, preventing fine soil particles from being removed by strong winds [1]. In arid regions like the Eastern Junggar Coalfield, where vegetation cover is sparse and wind speeds are often high [2,3], the preservation of the gravel layer is crucial for preventing desertification and maintaining soil stability. Thus, protecting the gravel layer is a key strategy for effective wind erosion control and the preservation of fragile desert ecosystems.
However, the Eastern Junggar Coalfield is also one of China’s largest coal-producing regions, with extensive open-pit coal mining activities. These mining operations have caused widespread disturbance to the Gobi’s gravel layer [4]. The removal of surface layers during mining, combined with the heavy machinery used in the extraction process, results in the destruction of the gravel layer. This degradation of the gravel layer leaves the underlying soils exposed to the forces of wind erosion, leading to accelerated rates of desertification in the region. The ecological consequences are severe, as the loss of the gravel layer disrupts the natural processes of soil formation and increases the region’s susceptibility to further environmental degradation. Therefore, the protection and restoration of the gravel layer in mining areas are vital to regional ecological security, especially in the context of climate change and increasing human activity.
In recent years, there has been growing interest in the restoration of gravel layers in desert ecosystems, particularly in mining areas. Research has focused on several key areas: understanding the distribution and formation mechanisms of gravel layers [5,6,7], analyzing their role in reducing wind erosion [8,9,10,11,12,13,14,15], and developing techniques for restoring disturbed gravel layers. Techniques such as remote sensing have been used to monitor the condition of gravel layers across large areas [16], while some studies have proposed using chemical soil stabilizers to restore the wind erosion resistance of disturbed areas. Koohestani et al. [17] utilized sodium silicate as a soil stabilizer to improve the wind erosion resistance of the surface. Yang et al. [18] incorporated fly ash and polyacrylamide into sandy soil in the Yellow River Basin in Inner Mongolia, and observed a significant increase in the threshold wind speed required to initiate wind erosion after the addition of fly ash. Other approaches involve ecological engineering methods [19], such as re-establishing natural vegetation to support the recovery of gravel layers. While these studies provide valuable insights, many restoration techniques remain limited in their applicability, especially in harsh environments where water resources are scarce and economic constraints limit large-scale interventions. Additionally, few studies have explored sustainable and cost-effective solutions that leverage locally available materials, such as industrial byproducts, to address these challenges.
To address these challenges, fly ash, a byproduct of coal combustion, has been proposed as a soil stabilizer for soil crusts in gravel layer restoration. Fly ash has been shown to improve soil cohesion and compaction, enhancing wind erosion resistance [20,21]. In this study, the effects of fly ash amendment, water content [22], and compaction [23] on the shear strength and wind erosion resistance of gravel layer soils are investigated. Optimal parameters are identified, balancing environmental and economic considerations, particularly in water-scarce regions like the Eastern Junggar Coalfield. Scanning electron microscopy (SEM) is used to analyze the microscopic mechanisms of soil stabilization.
The primary objectives of this research are to (1) evaluate the efficacy of fly ash as a soil stabilizer, (2) optimize restoration parameters, (3) elucidate the microscopic mechanisms of soil stabilization, (4) assess wind erosion mitigation, and (5) promote sustainable utilization of industrial byproducts. This study contributes to the recycling of industrial byproducts, offering a practical solution to the environmental challenges posed by coal mining activities.

2. Materials and Method
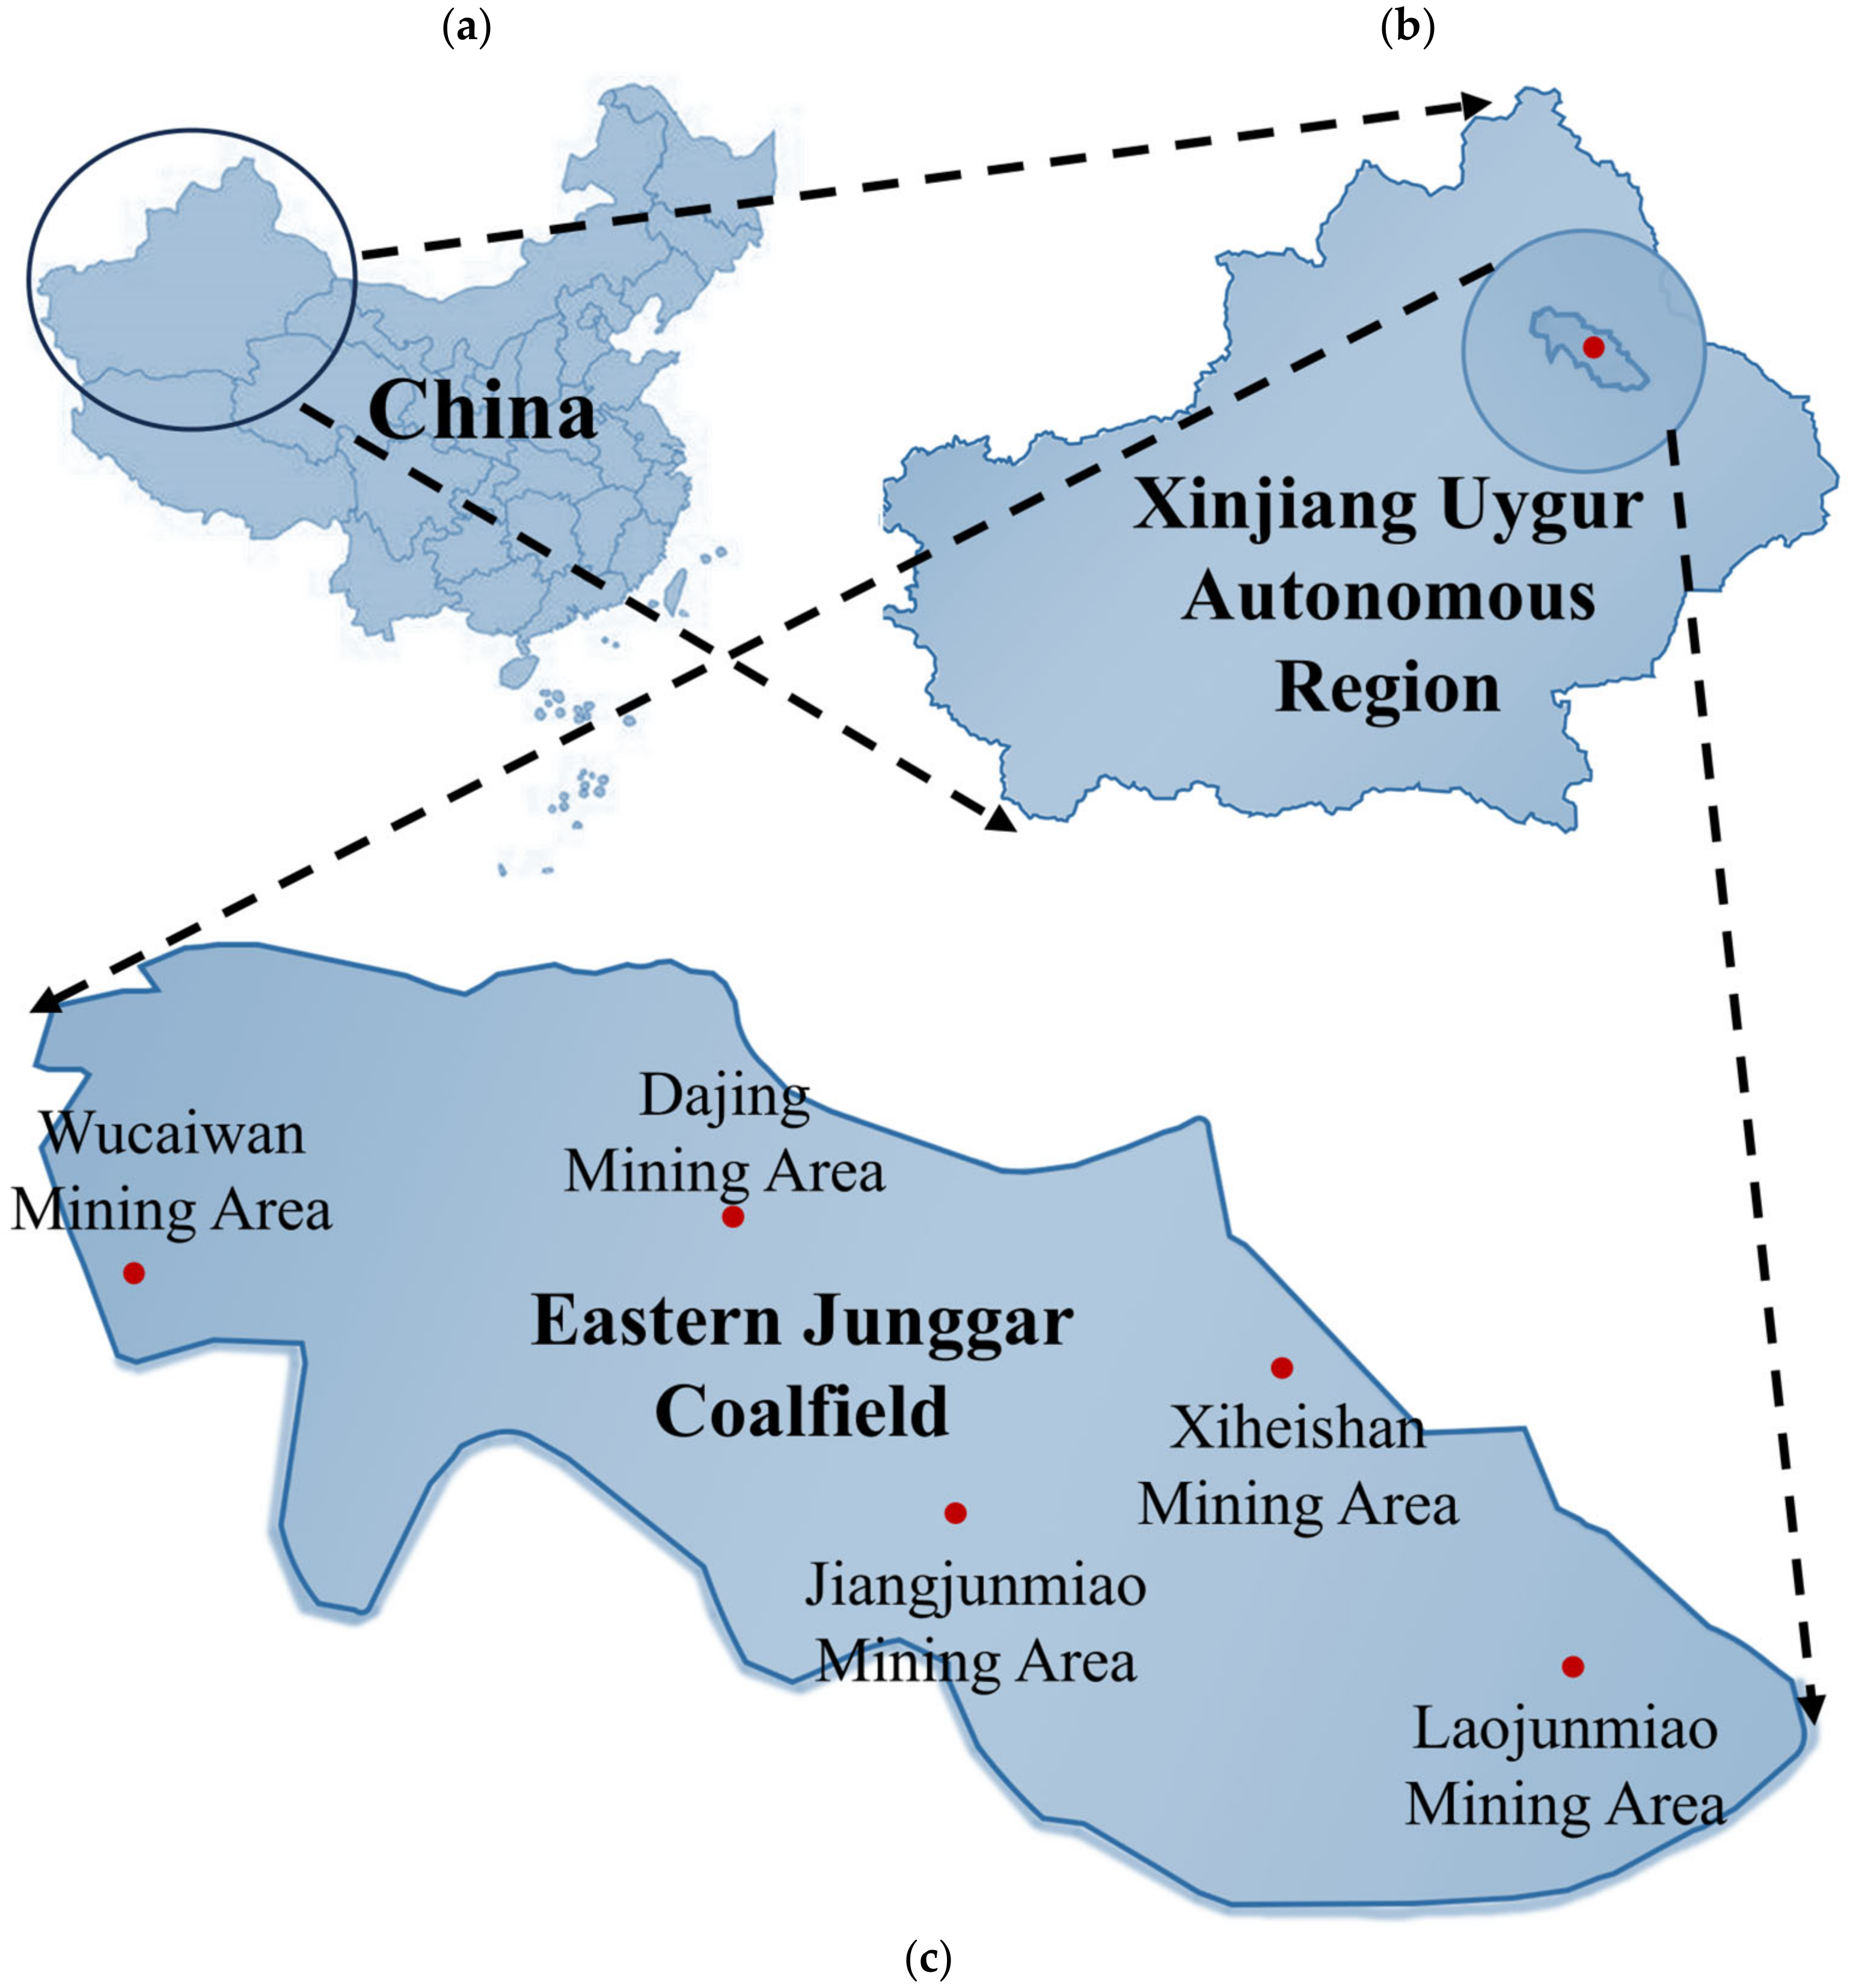
2.1. Study Area

The Eastern Junggar Coalfield is located within the Changji Hui Autonomous Prefecture and is one of the five major coalfields in Xinjiang (Eastern Junggar, Ili, Tuha, Kubai, and Hefeng-Karamay). It is also the largest known intact coalfield in China. The coalfield stretches 220 km from east to west and spans 60 km from north to south, covering an area of 15,500 km2. It includes five major mining districts: Wucaiwan, Dajing, Jiangjunmiao, Xiheishan, and Laojunmiao. The Eastern Junggar Coalfield lies in the heart of the Eurasian continent, characterized by a typical continental arid and semi-arid climate. The average annual temperature is approximately 3 °C, with significant seasonal temperature differences. In summer, temperatures can reach as high as 41.2 °C, while in winter, they can drop as low as −49.8 °C. Precipitation is unevenly distributed, with around 39 mm of rainfall in summer. Stable snow cover usually forms in winter, and the freezing period lasts for 5.5 months. Summer precipitation is significantly higher than in winter, and surface water resources are relatively scarce, with no perennial surface water flow. The wind direction varies considerably across different regions of the coalfield, and the average annual wind speed is relatively high, with wind force typically ranging from level 4 to 5, occasionally reaching level 10. The soil fertility in the coalfield is low, and surface vegetation is sparse, with a coverage rate of about 5–10%. The gravel layer in the study area is extensive, and due to the deep burial of groundwater, soil salinization is not significant.

2.2. Materials

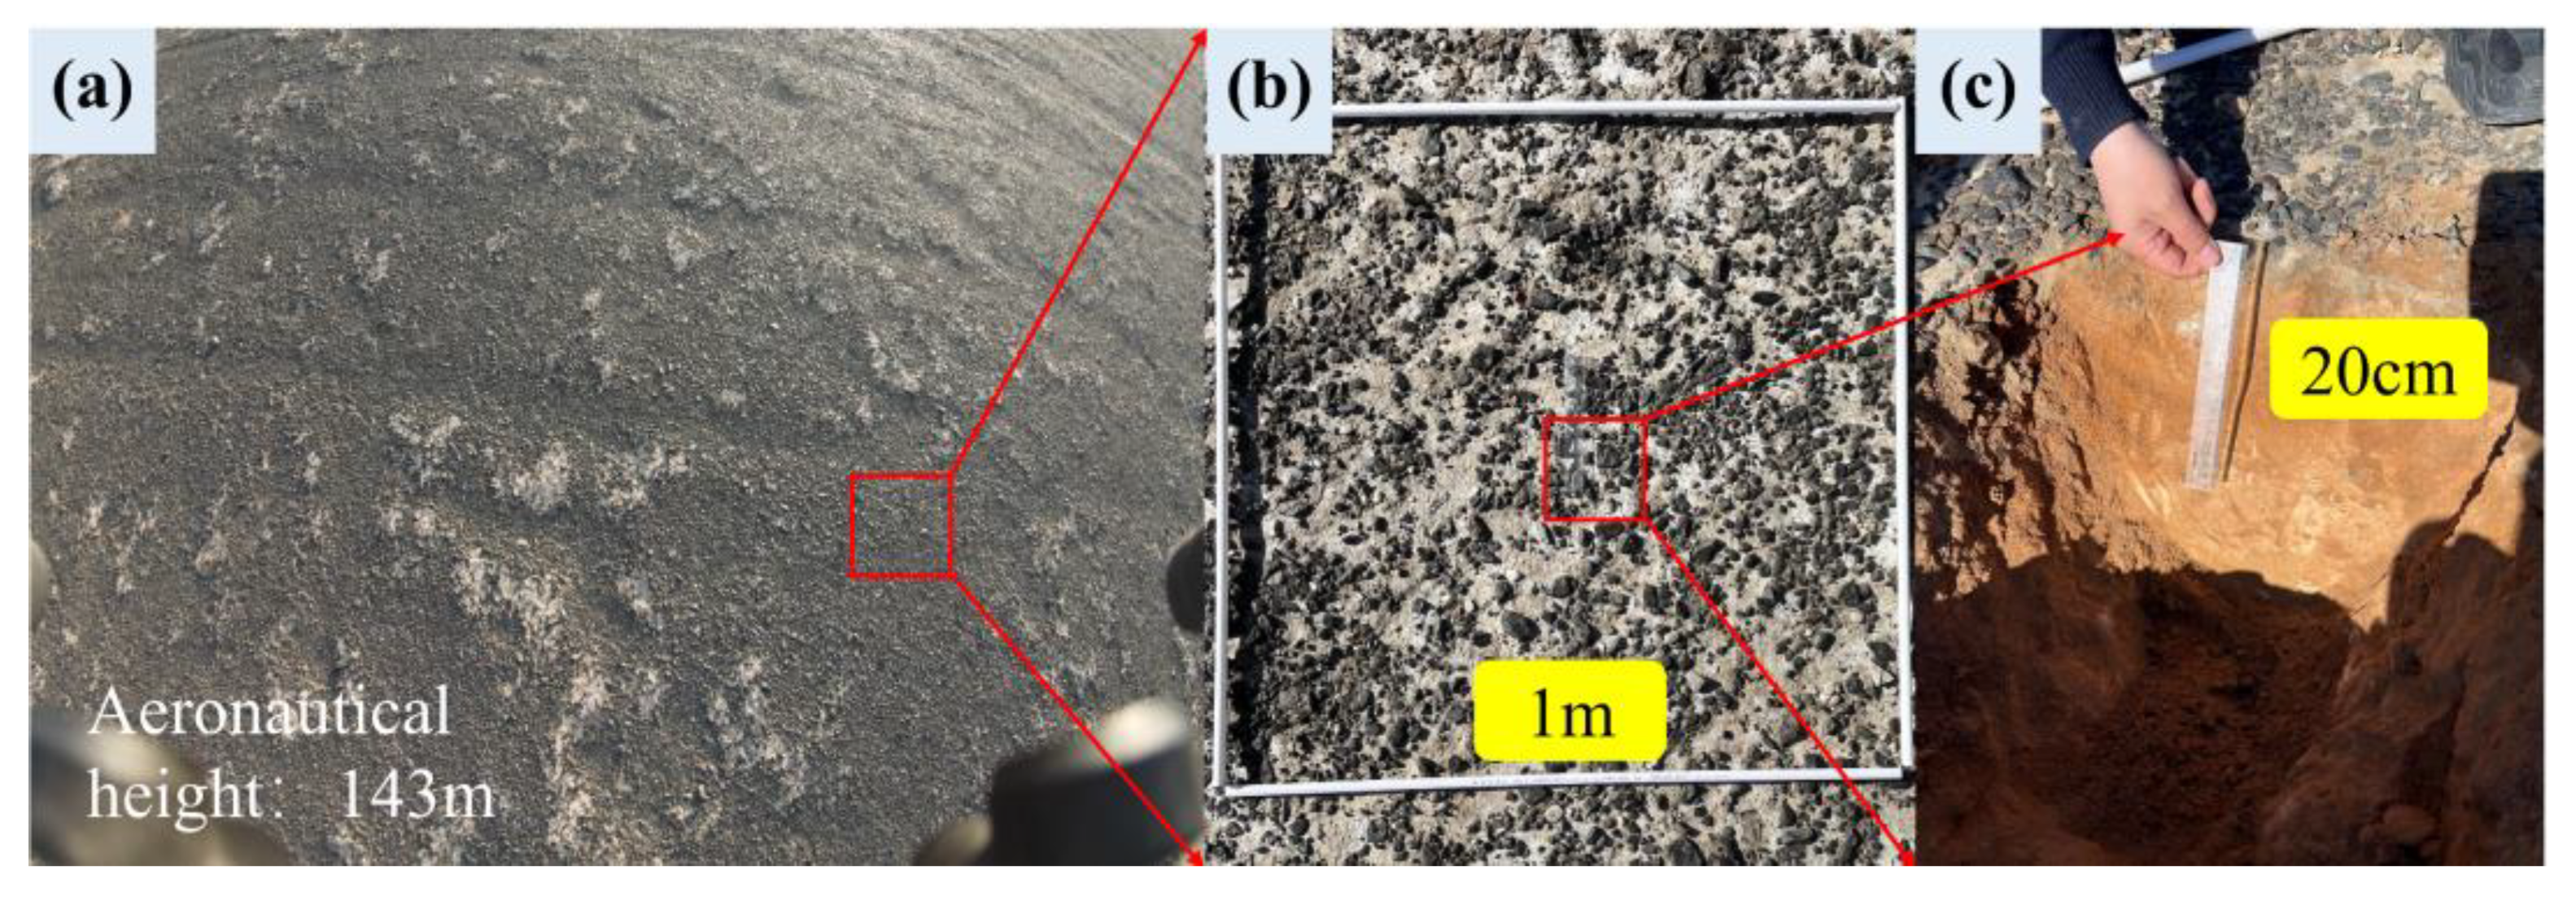
2.2.1. Collected Soil

In order to investigate the intrinsic relationship between the shear strength and wind erosion resistance of the gravel layer soil crust, two sampling points were selected in each of the five major mining districts of Eastern Junggar Area, with a sampling depth ranging from 0 to 30 cm. The locations of the sampling points are shown in Figure 1, and photographs of the sampling points are provided in Figure 2. The collected soil samples were subjected to a series of tests in accordance with the testing methods specified in the Chinese standard “Standard for Soil Testing Methods” (GB/T 50123-2019) [24]. The basic physical parameters of the gravel layer soil, including natural moisture content, natural density, saturated moisture content, and the composition of particles with different particle sizes, were obtained, as summarized in Table 1. The experiment was conducted with three parallel groups. The standard deviation and standard error of the data were calculated, and the average values of the three groups were used for plotting and analysis.

2.2.2. Fly Ash

The fly ash used in the experiment was collected from the North Power Plant in Wucaiwan, located in the Zhundong Economic Development Zone, Changji Hui Autonomous Prefecture, Xinjiang, China. The chemical composition of the fly ash was analyzed using an X-ray fluorescence spectrometer (XRF), as shown in Table 2. The heavy metal content in the fly ash was detected using atomic absorption spectrometry, and when compared with the Chinese standard “Soil Environmental Quality Risk Control Standard for Soil Contamination of Agricultural Land” (GB 15618-2018) [25], the heavy metal content was found to be below the permissible limits, as shown in Table 3.

2.3. Experimental Plan

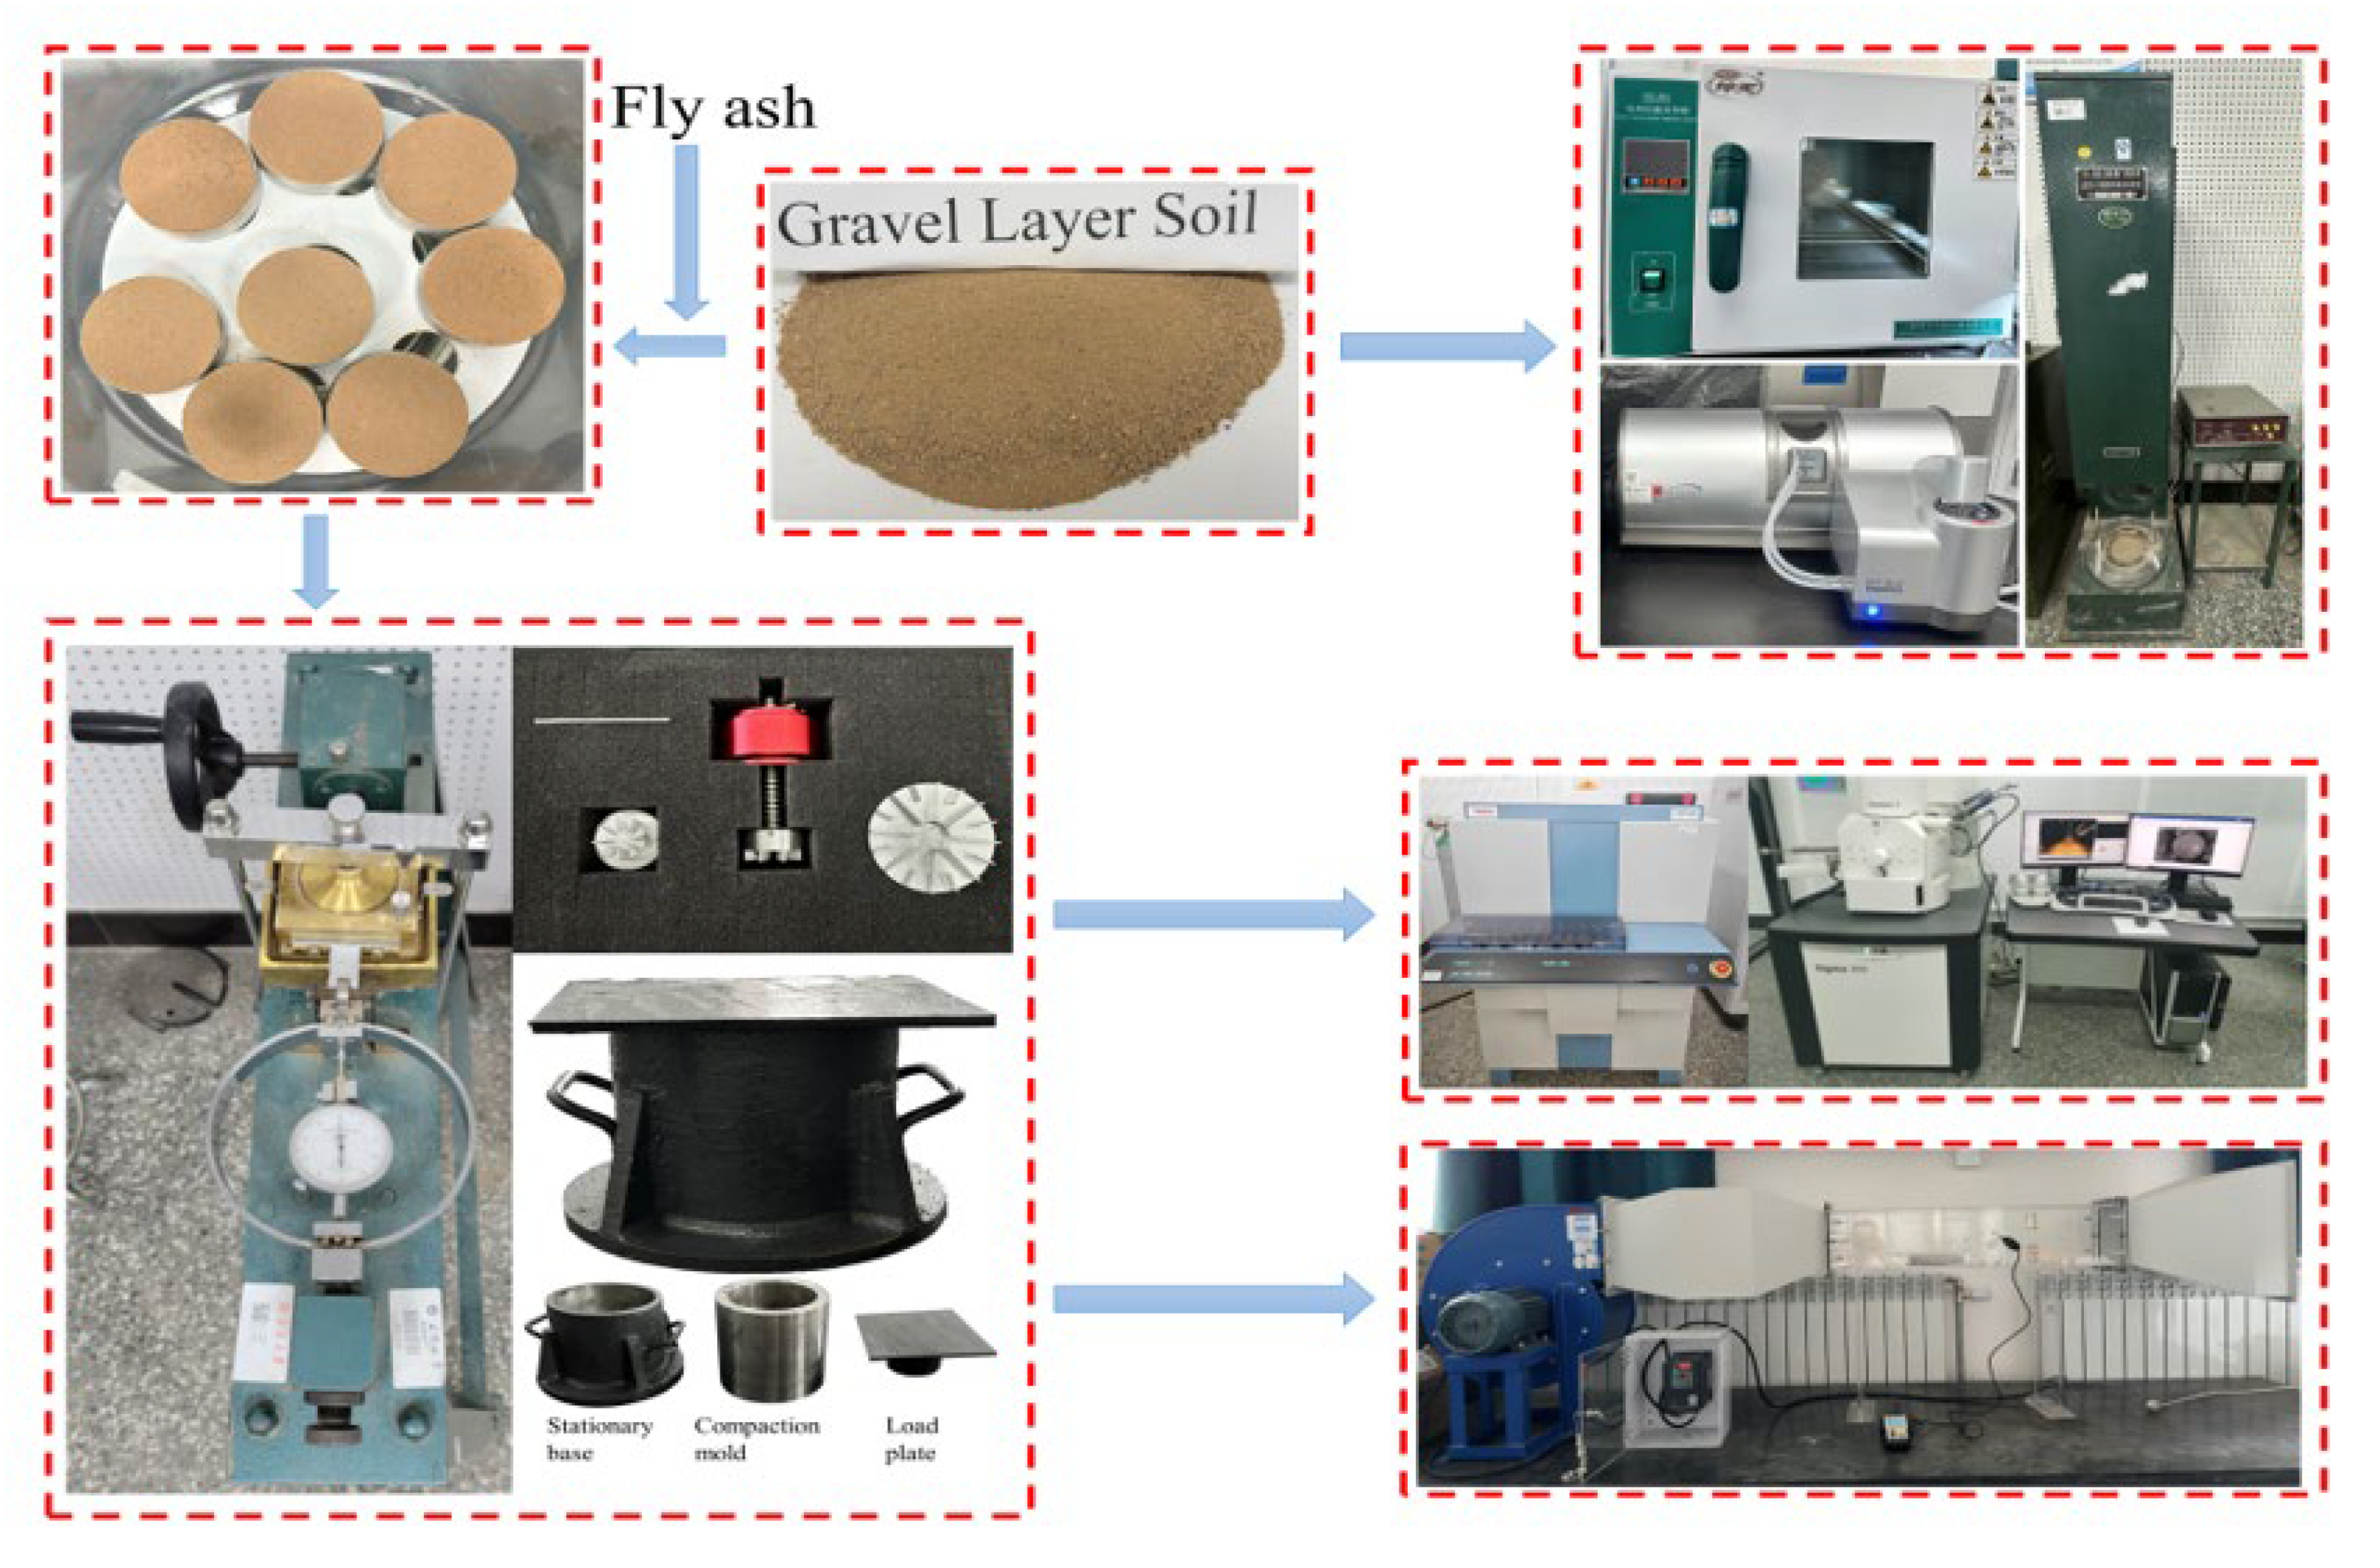
2.3.1. Experimental Approach

In order to investigate the effects of fly ash on improving the gravel layer soil, with the aim of enhancing its physical–mechanical strength and wind–sand fixation performance, the gravel layer soil was brought back to the laboratory for the testing of basic physical parameters. First, compaction tests [26,27] were conducted to determine the maximum dry density and optimum moisture content of the gravel layer soil with different fly ash incorporation ratios, providing the necessary sample preparation parameters for subsequent experiments. Second, direct shear tests [28] and vane shear tests were performed to determine the technically and economically optimal fly ash incorporation ratio, water content, and compaction frequency, which are key parameters for the reconstruction process. Next, XRF, SEM, and other analytical techniques were employed to analyze the composition and microstructure of the modified gravel layer soil, in order to explore the micro-mechanisms by which fly ash enhances the physical-mechanical strength of the soil. Based on these analyses, wind tunnel tests [29] were conducted to evaluate the improvement in wind erosion resistance and sand fixation by the fly-ash-modified gravel layer soil crust. The experimental procedure is shown in Figure 3. It is worth noting that the moisture content involved in this study refers to the gravimetric moisture content.
According to the literature [30,31], to ensure the economic feasibility and practicality of experiments, fly ash content is generally set at 5%, 10%, 15%, 20%, 25%, and 30%. These mixing ratios are commonly used in experiments and are considered representative and standardized, avoiding excessively high ratios that could result in uneconomical outcomes or poor mechanical performance. After conducting further preliminary experiments, it was found that soil samples with fly ash content ratios of 25% and 30% exhibited poor mechanical properties. Therefore, the fly ash content in this study was ultimately set at 5%, 10%, 15%, and 20%.

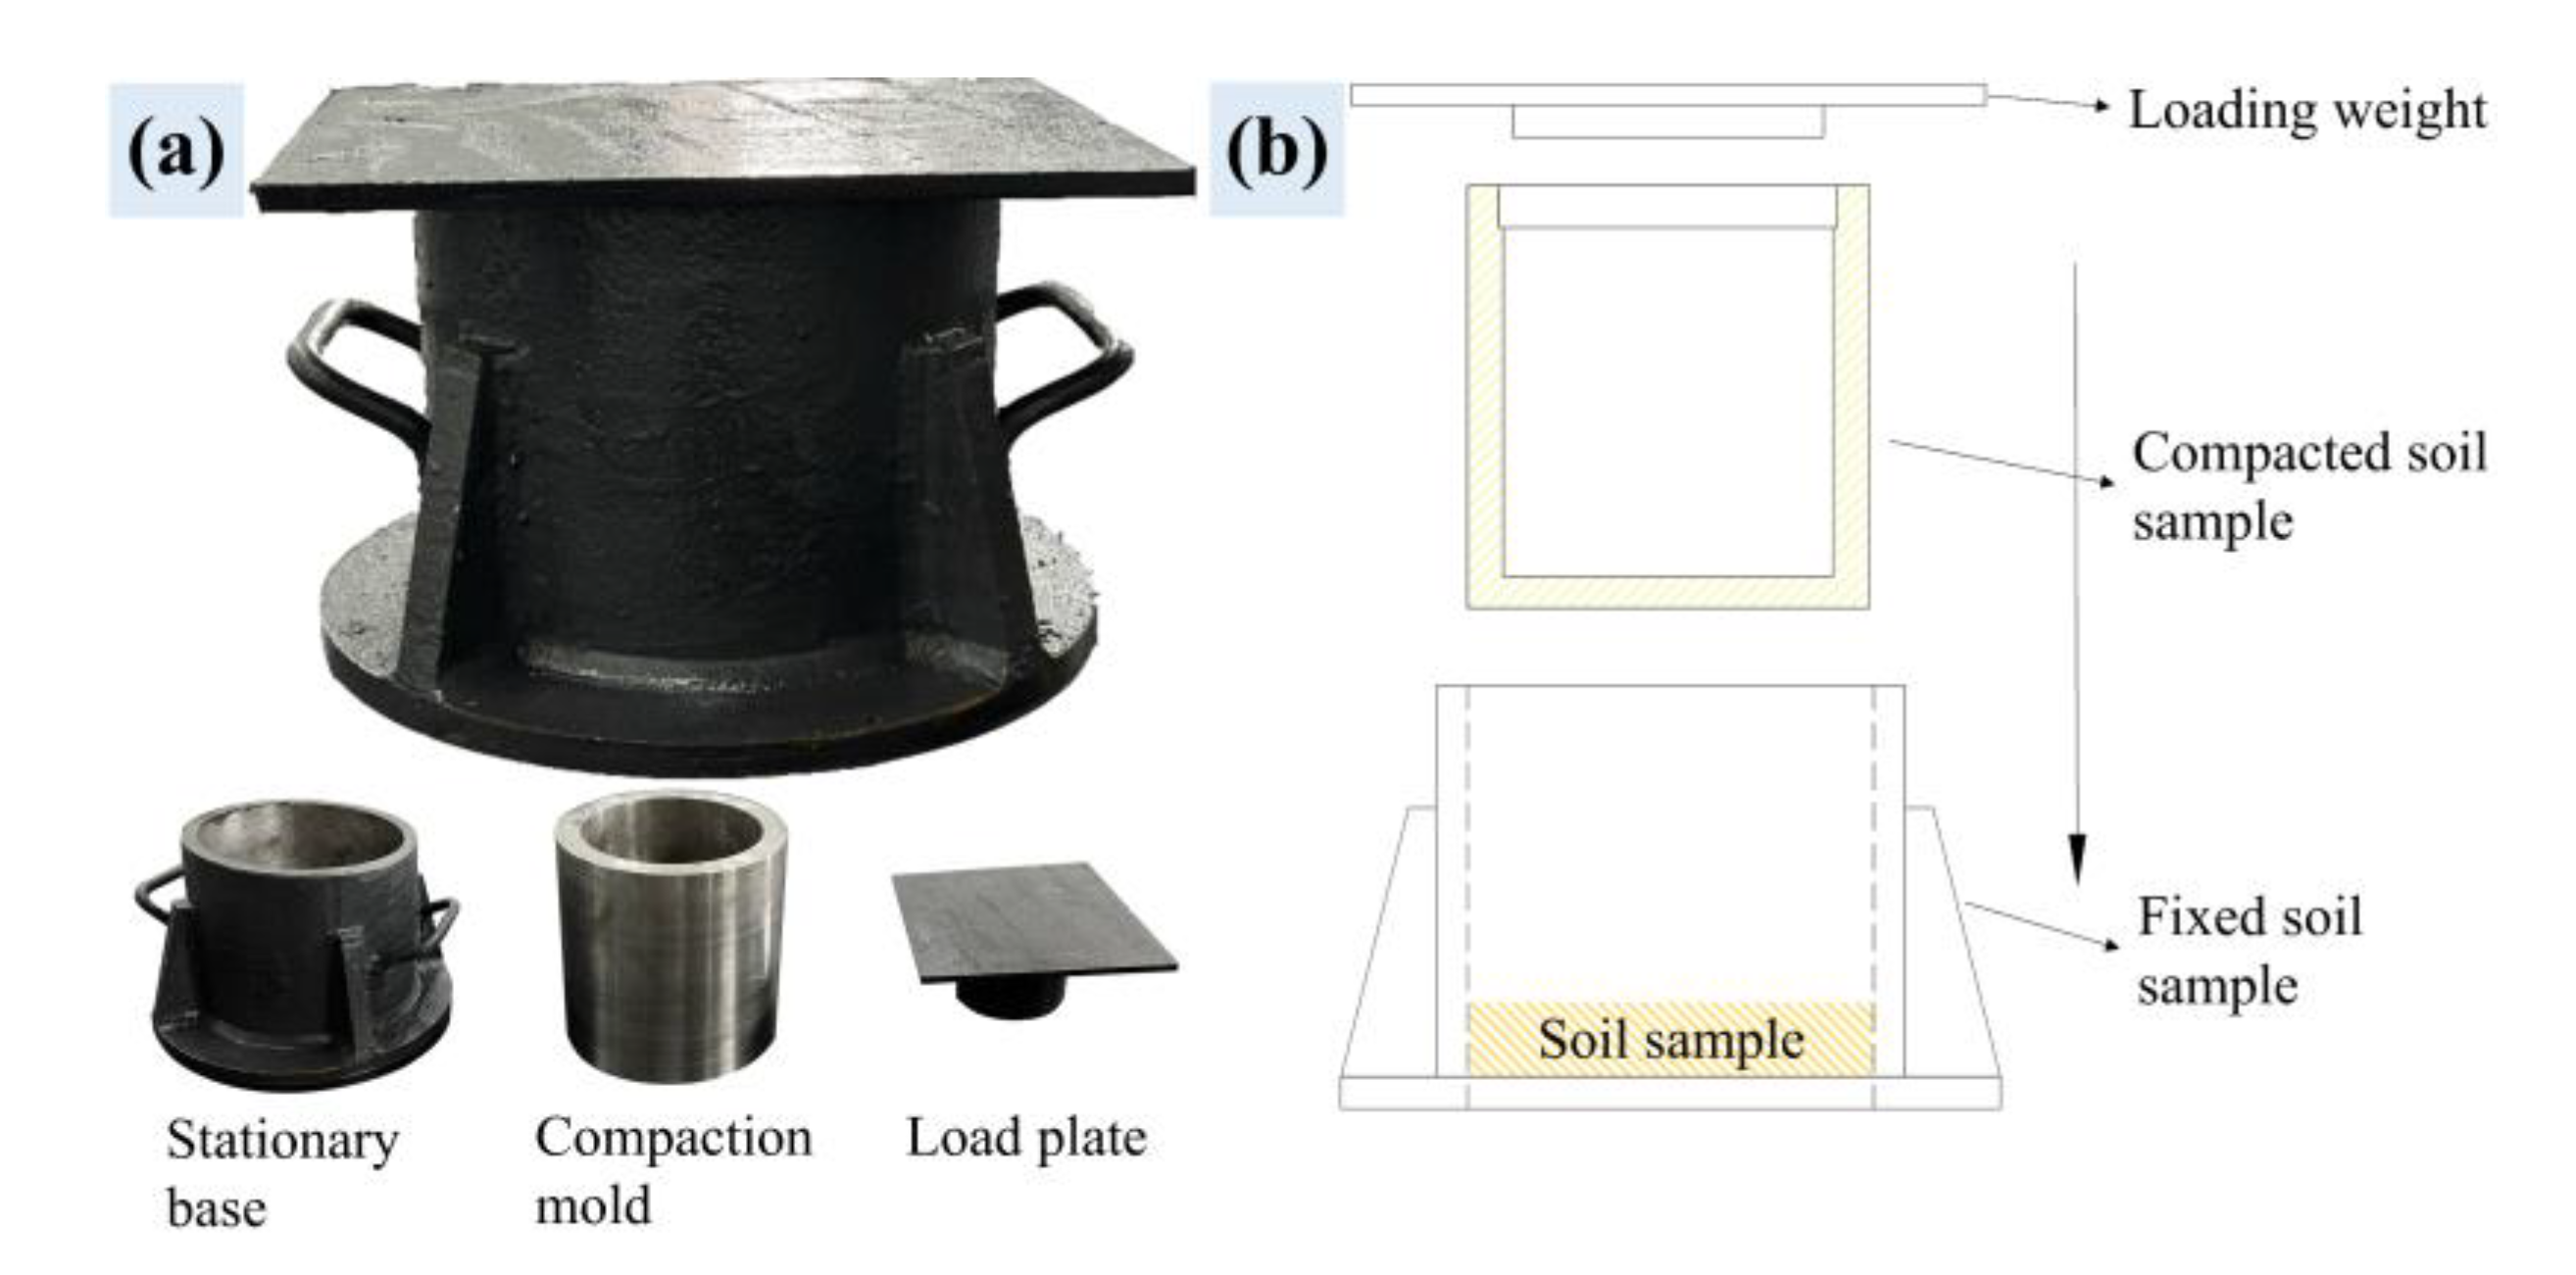
2.3.2. Compaction Test

The collected soil samples were subjected to crushing, drying, and sieving treatments. After drying, the moisture content of the soil samples was determined to be 1.58%. The fly ash was added in proportions of 0%, 5%, 10%, 15%, and 20%, resulting in five different mixtures. For each mixture, five different moisture contents—9%, 11%, 13%, 15%, and 17%—were tested by adding water to achieve the corresponding moisture levels. Compaction tests were conducted using the JDS-2 lightweight compaction apparatus, produced by Nanjing Soil Instrument Co., Ltd. According to the method specified in the Chinese standard “Soil Testing Method Standards” (GB/T 50123-2019), the soil was added in three layers, with each layer compacted using a 2.5 kg hammer falling freely from a height of 305 mm. Each layer of soil was compacted with 25 blows. The moisture content and density of the compacted soil were then measured, and the maximum dry density and optimum moisture content of the soil samples with different fly ash proportions were determined.

2.3.3. Direct Shear Test

Based on the optimum moisture content and maximum dry density of each soil sample obtained from the compaction tests, undisturbed ring shear samples for direct shear testing were prepared following the methods outlined in the “Standard for Soil Testing Methods” (GB/T 50123-2019). The ZJ-type strain-controlled direct shear apparatus was employed to conduct shear tests on soil samples with different fly ash incorporation ratios (0%, 5%, 10%, 15%, and 20%) under four different vertical pressures (100 kPa, 200 kPa, 300 kPa, and 400 kPa). The fly ash incorporation ratio that resulted in the optimal shear strength was selected from the five ratios. Subsequently, based on this, direct shear tests were performed on fly-ash-based soil samples with five different moisture contents to identify the moisture content that yielded the highest shear strength. The experiment was conducted with three parallel groups. The standard deviation and standard error of the data were calculated, and the average values of the three groups were used for plotting and analysis.

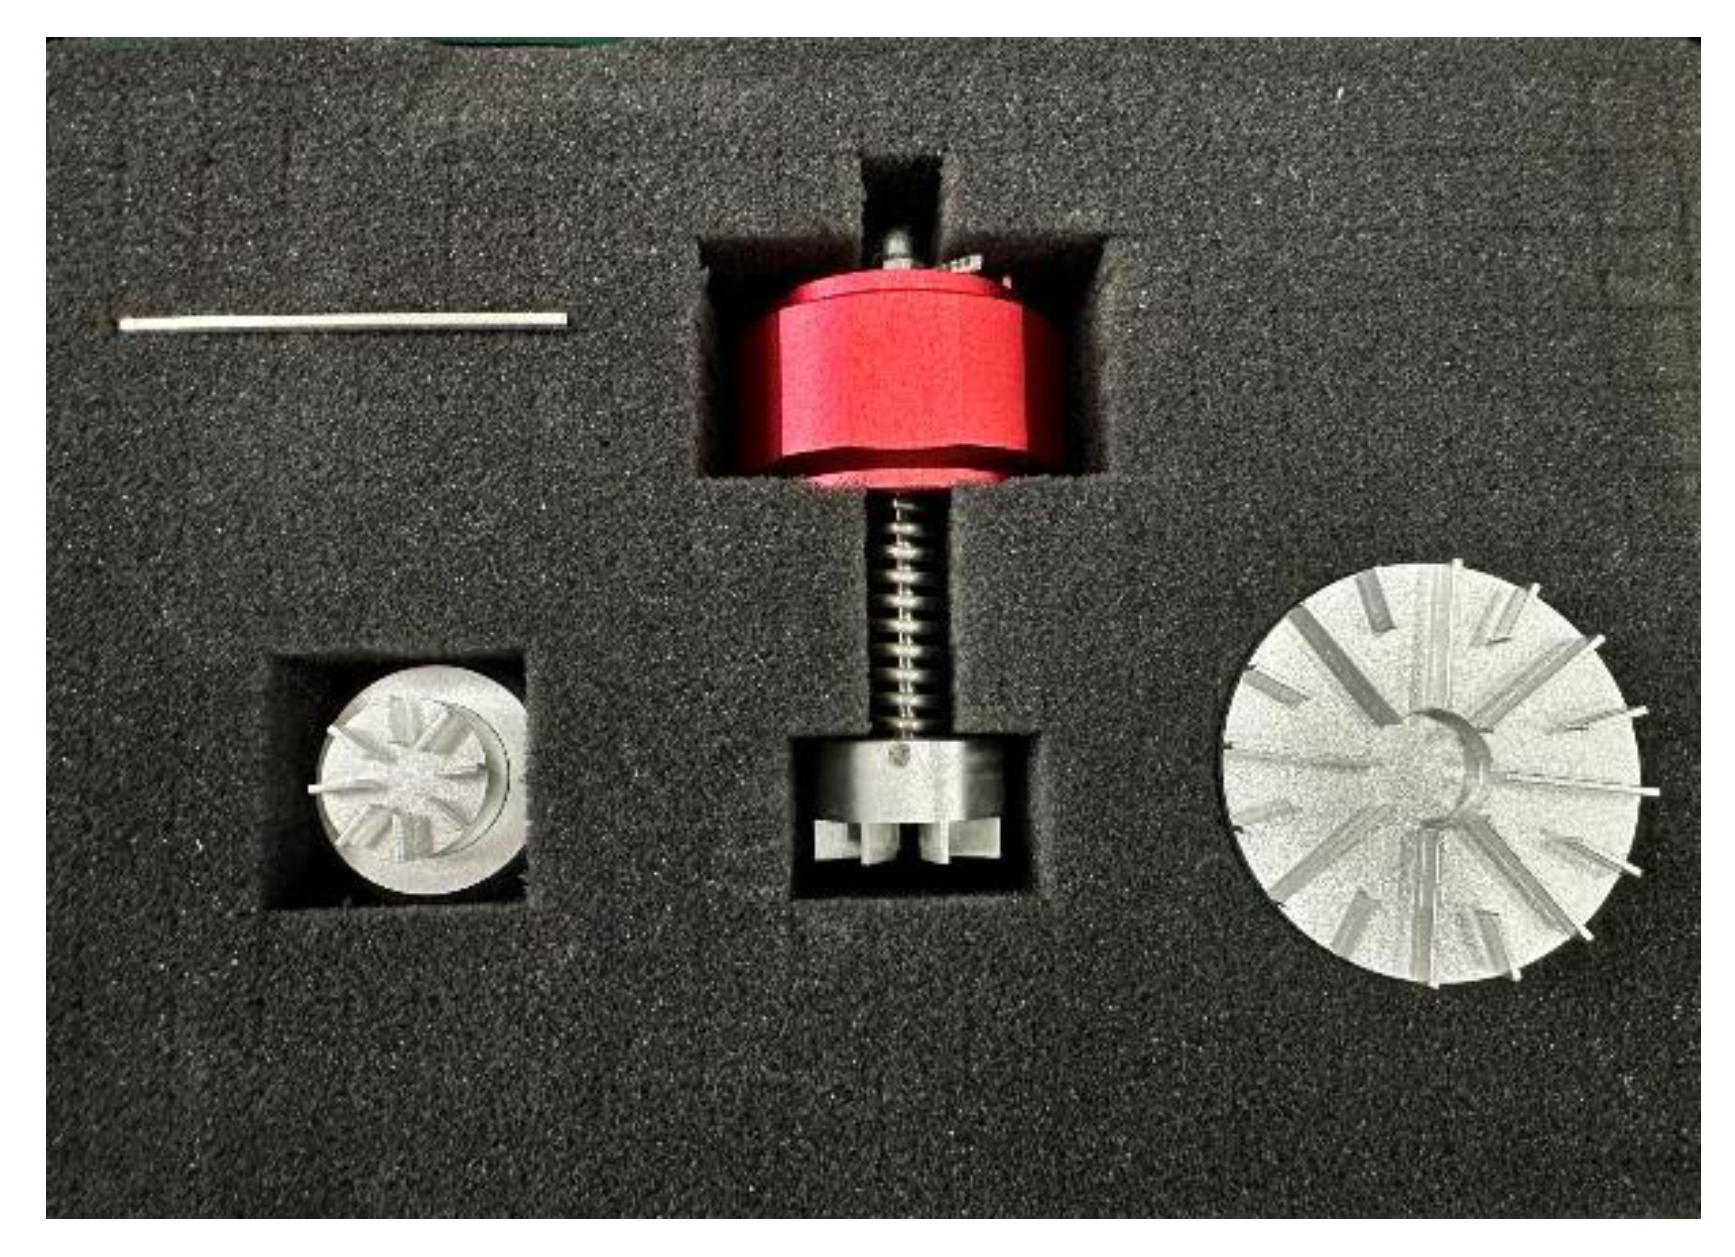
2.3.4. Vane Shear Test

In the Xinjiang region, the commonly used land reclamation machinery is the crawler bulldozer, which exerts a ground pressure of 33.7 kPa during each operation. A custom-made compaction device was used to simulate the compaction effect of this machinery on the surface. The compaction apparatus and its schematic diagram are shown in Figure 4. The weight is placed on the pressure plate to compact the soil sample in the base. The number of compaction cycles is controlled by adjusting the compaction time, with 10 min set as one compaction cycle [32]. Different compaction cycles were applied to the soil samples, and a miniature cruciform shear apparatus, produced by Changzhou Ying’an Yang Instrument Co., Ltd., (shown in Figure 5) was used to shear the compacted ex situ soil. The shear strength of the soil was then estimated based on the readings indicated by the instrument. The changes in shear strength of the soil under different compaction cycles were observed. Additionally, undisturbed soil samples were taken using the ring knife method, and the bulk density of the compacted soil was measured. The experiment was conducted with three parallel groups. The standard deviation and standard error of the data were calculated, and the average values of the three groups were used for plotting and analysis.

2.3.5. Microscopic Test

Dry soil samples from the gravel layer and fly-ash-modified gravel layer were ground into a uniform fine powder and sieved through a 200-mesh sieve. The soil samples and binder were evenly mixed and placed in a mold, then compacted under high pressure to form circular specimens with a diameter of 32 mm. The major components of the gravel layer soil and the fly-ash-modified gravel layer soil were analyzed using the Thermo Scientific ARL9900X X-ray fluorescence (XRF) spectrometer, manufactured by Thermo Fisher Scientific. The aim was to explore the changes in composition before and after the modification with fly ash, and to reveal the microscopic mechanism by which fly ash enhances the shear strength of the gravel layer soil from the perspective of its compositional changes.
After completing the direct shear test, small pieces of the sheared soil, approximately 5 mm × 5 mm × 2 mm in size, were carefully and slowly extracted from the tested samples. These extracted soil pieces were fixed onto the sample holder using conductive adhesive, and the surface dust was blown off. The samples were then placed in an ion sputtering device for 90 s of gold coating to improve their conductivity. Scanning electron microscopy (SEM) experiments were conducted using a Zeiss Sigma 300 scanning electron microscope, manufactured by Zeiss, to analyze the microstructural changes in the gravel layer soil before and after modification with fly ash. The microstructural changes before and after modification were observed and analyzed, revealing the microscopic mechanisms by which fly ash enhances the shear strength of gravel layer soil from a structural perspective.

2.3.6. Wind Tunnel Test

Wind tunnel experiments were conducted to simulate the erosion of the gravel layer soil crust under wind forces. In this study, the gravel layer soil crust was the primary focus, and no surface gravel was included in the experimental setup. An MWJY-006 small wind tunnel testing machine, manufactured by Nanjing Meiwen Science & Education Instrument Co., Ltd. (as shown in Figure 6), with dimensions of 800 mm × 200 mm × 200 mm, was employed. Wind speed was measured using an HT9829 hot-wire anemometer, manufactured by Dongguan Xinst Electronics Co., Ltd. After stabilizing the wind speed, soil samples, which had been treated with fly ash, water, and compacted, were introduced into the wind tunnel. The soil samples, with dimensions of Φ160 mm × 26 mm, were subjected to erosion under constant wind speed for 30 min. The mass of the samples was recorded every 5 min, and the cumulative mass loss was determined by calculating the difference in mass over each interval, indicating the progression of soil erosion. The experiment was conducted with three parallel groups. The standard deviation and standard error of the data were calculated, and the average values of the three groups were used for plotting and analysis.

3. Results

3.1. Results of Tests on Fly Ash

The content of the major chemical components and heavy metals in the fly ash was analyzed, and the processed data are presented in Table 2 and Table 3. The content of SiO2 and Al2O3 in the fly ash is relatively high, accounting for 51.2% and 28.9%, respectively, while the content of other substances is comparatively lower. Specifically, Fe2O3 accounts for 7.3%, CaO for 4.7%, K2O for 2.7%, TiO2 for 2.1%, SO3 for 1.1%, Na2O for 0.6%, MgO for 0.5%, and P2O5 for 0.5%. The content of heavy metals in the fly ash, including cadmium, mercury, arsenic, copper, lead, chromium, nickel, and zinc, are 168.18, 67.06, 14,481.04, 19,680.21, 15,619.51, 52,290.80, 25,689.10, and 63,024.80 µg/kg, respectively. All measured values are below the pollution standards specified in the relevant regulations.

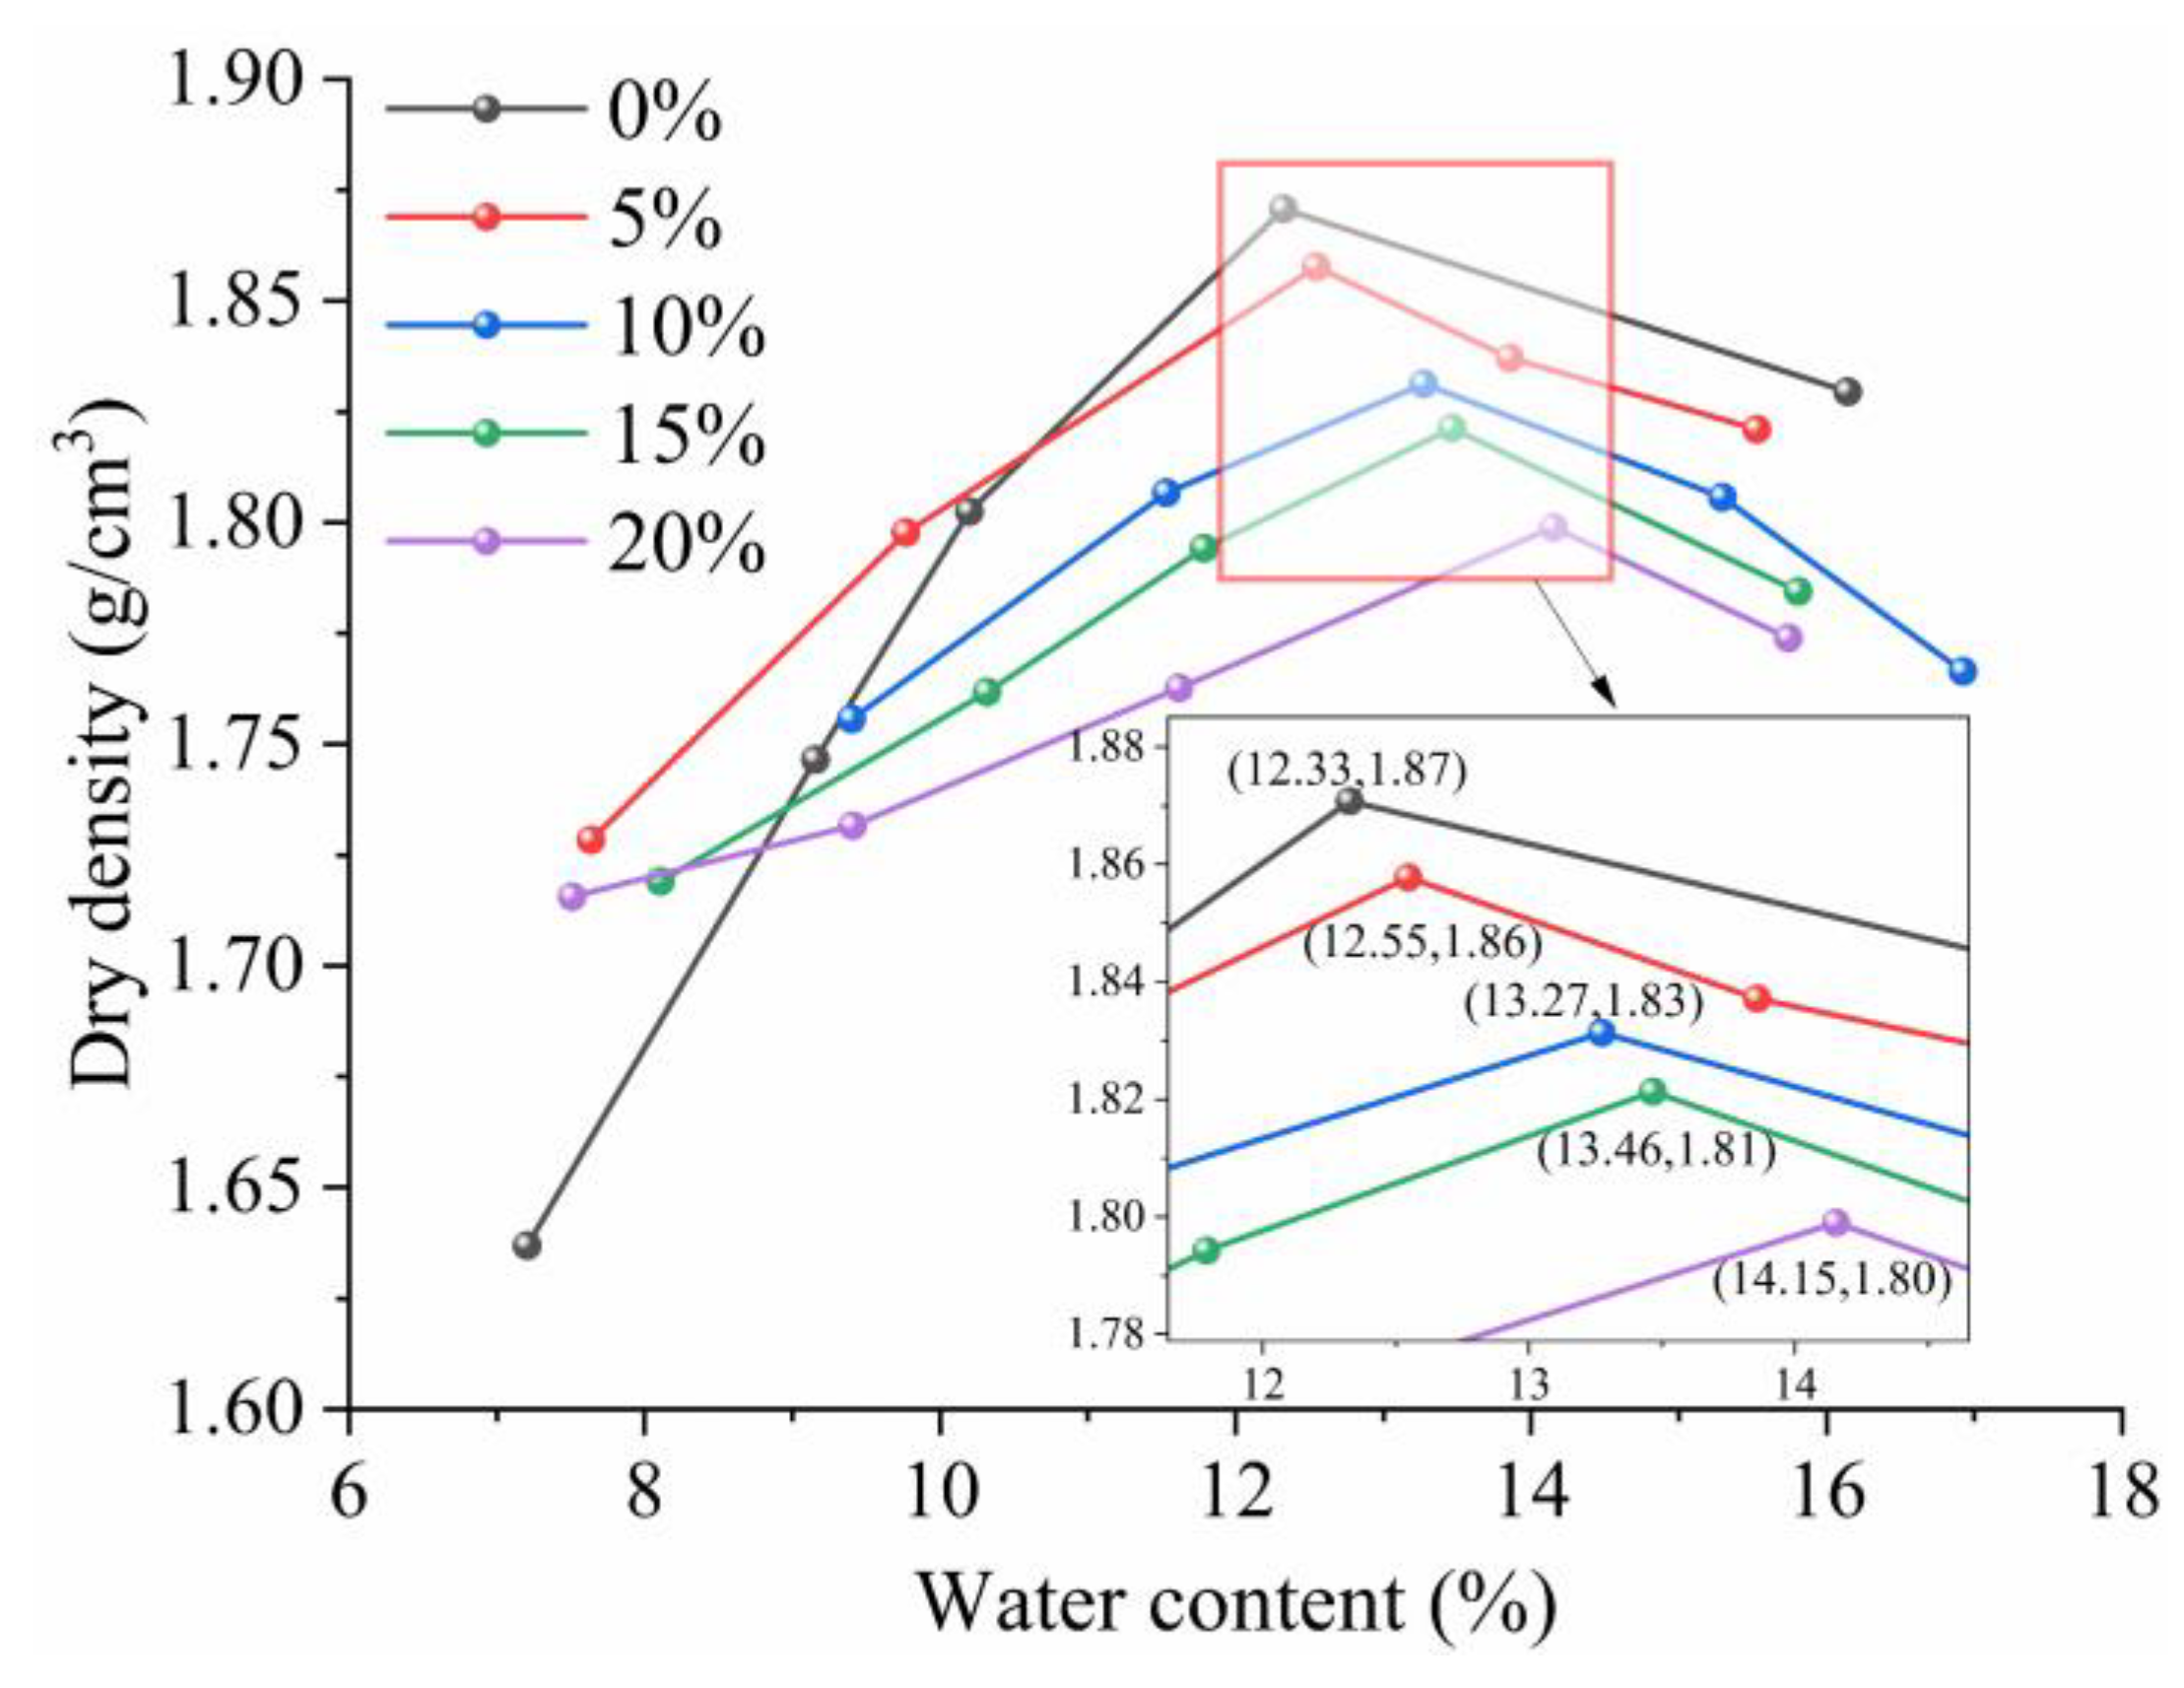
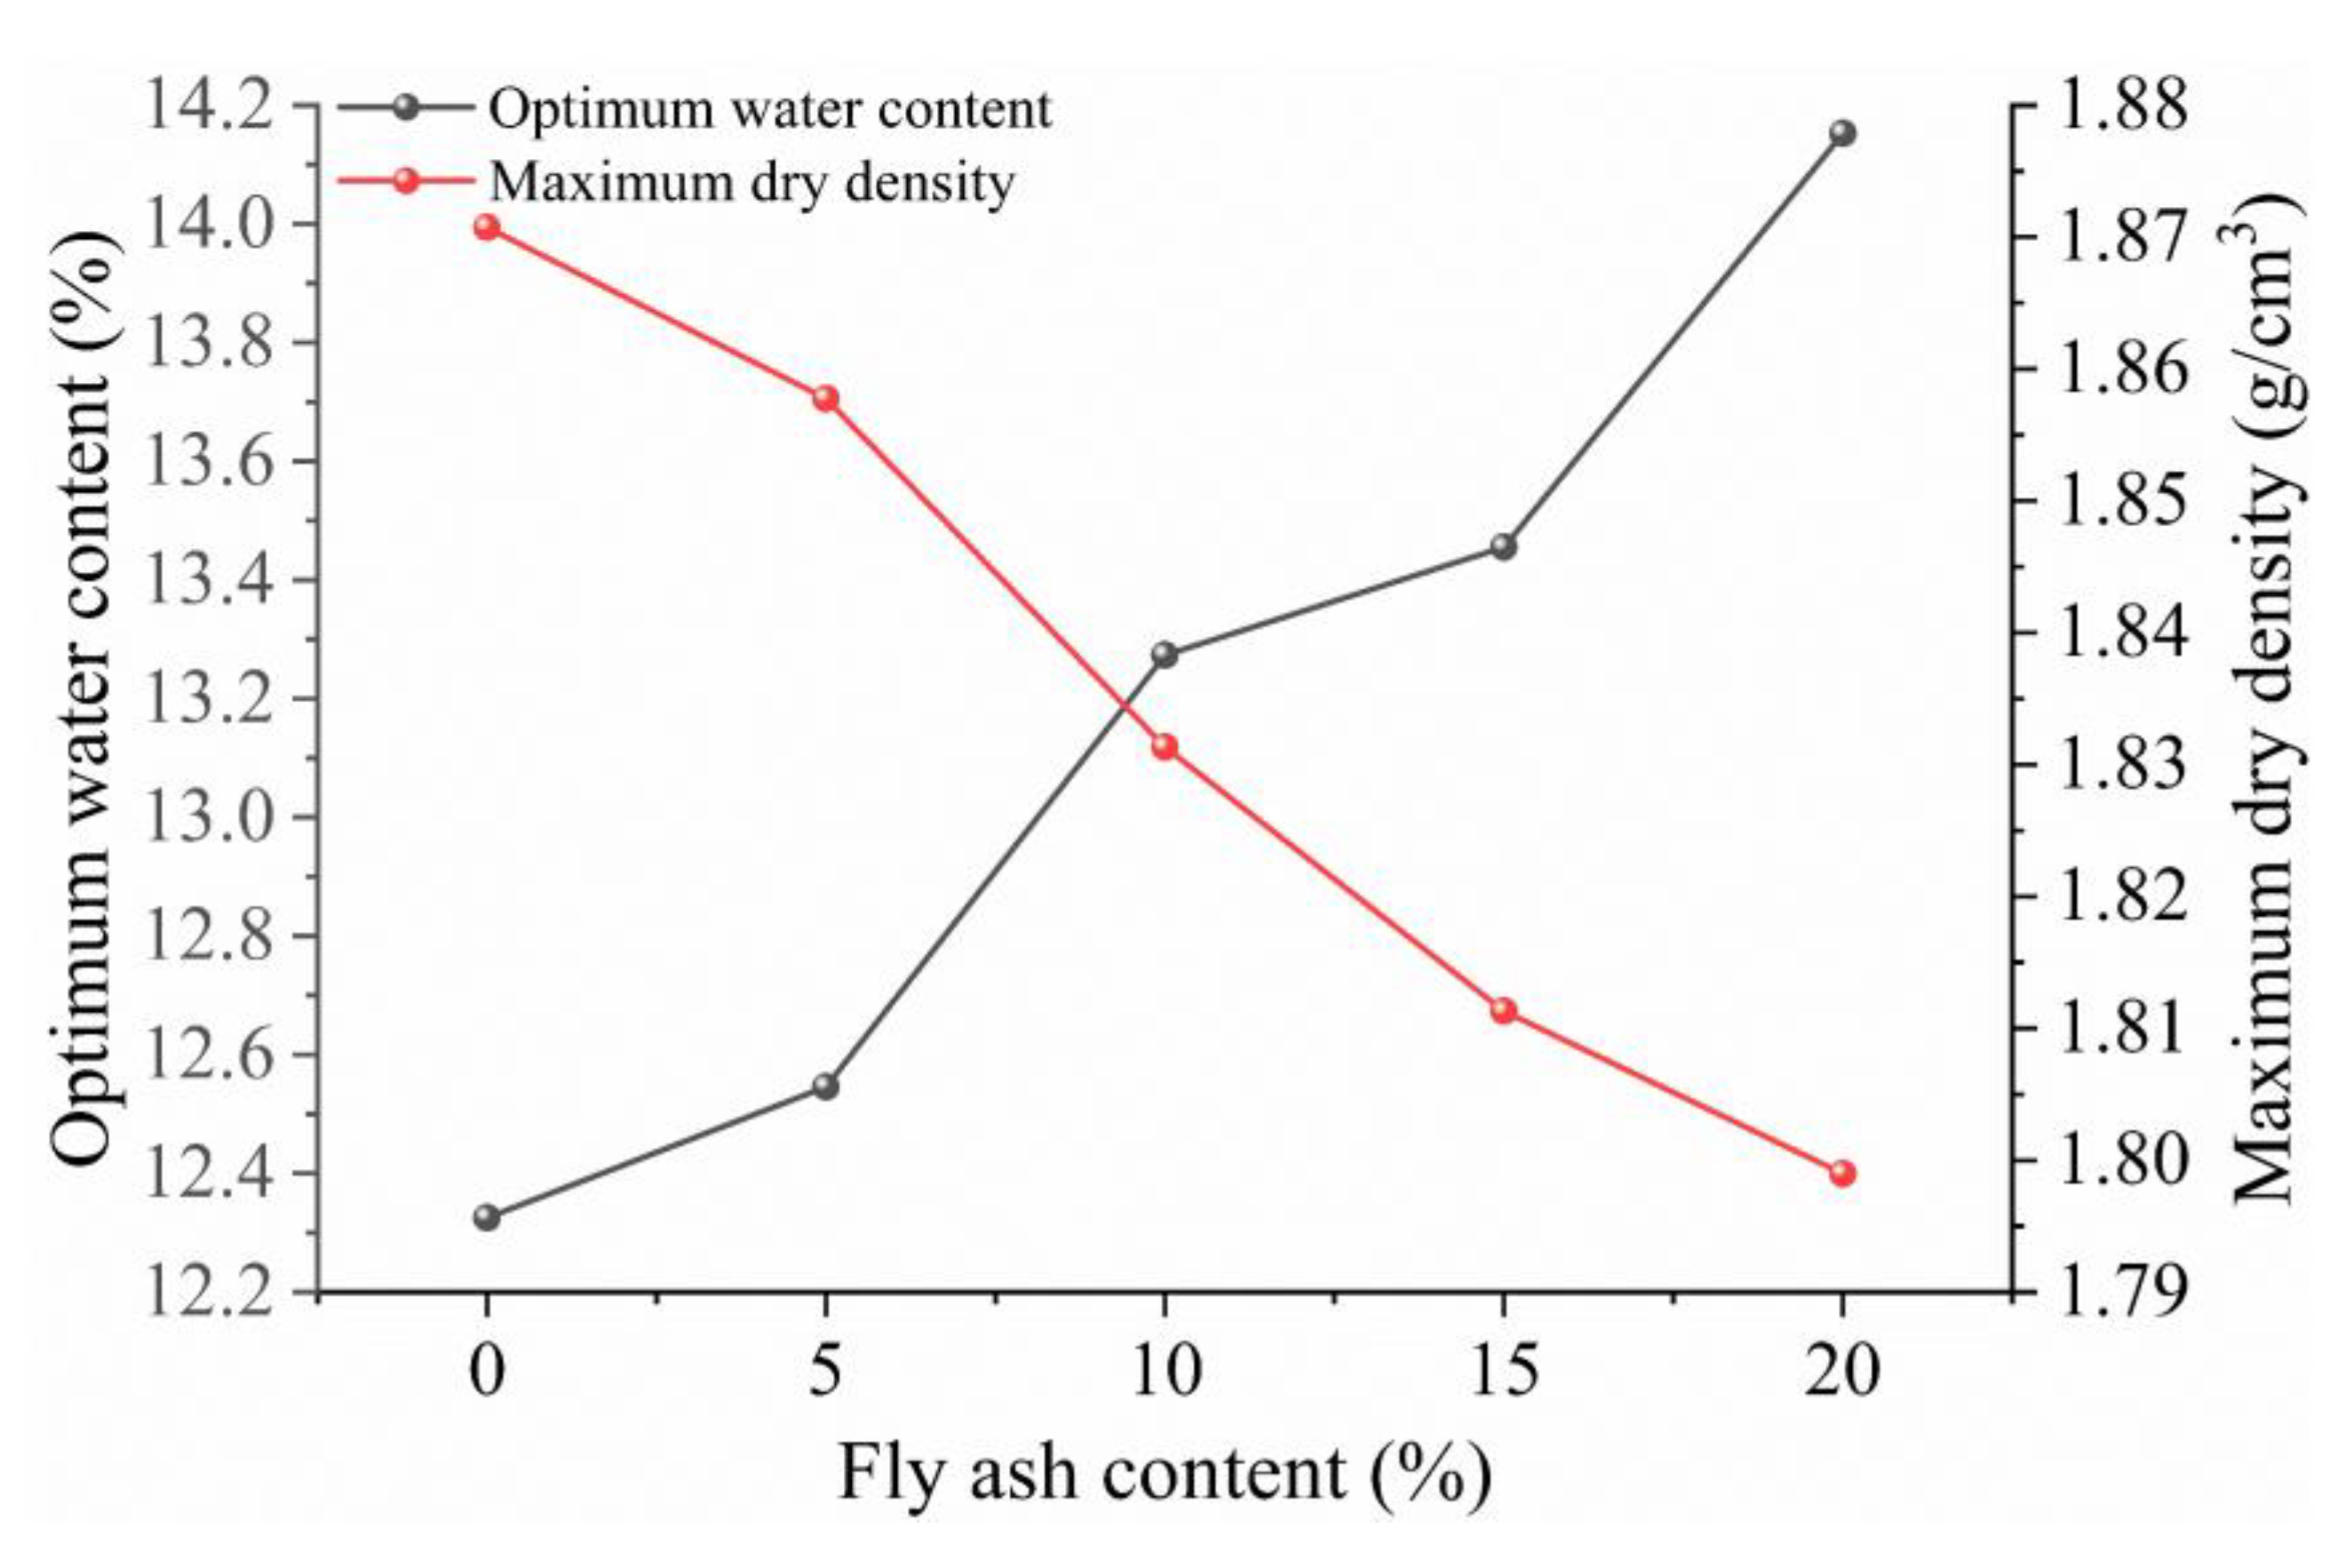
3.2. Results of Compaction Test

The maximum dry density and optimum moisture content of soil samples with different fly ash contents were obtained through compaction tests, and the compaction curves were plotted using the processed data, as shown in Figure 7. It can be observed from the figure that the compaction curves of the soil samples exhibit a “convex” shape. As the moisture content increases, the dry density of the soil samples with different fly ash contents first increases and then decreases. The peak of the curve corresponds to the optimum moisture content and maximum dry density, with the horizontal and vertical coordinates representing these values, respectively.
For the soil sample without fly ash, the optimum moisture content is 12.33% and the maximum dry density is 1.87 g/cm3. For the soil sample with 5% fly ash, the optimum moisture content is 12.55% and the maximum dry density is 1.86 g/cm3. For the soil sample with 10% fly ash, the optimum moisture content is 13.27% and the maximum dry density is 1.83 g/cm3. For the soil sample with 15% fly ash, the optimum moisture content is 13.46% and the maximum dry density is 1.81 g/cm3. For the soil sample with 20% fly ash, the optimum moisture content is 14.15% and the maximum dry density is 1.80 g/cm3.
The obtained optimum moisture content and maximum dry density were plotted as a relationship curve (Figure 8) to explore the correlation between the three factors. From the figure, it can be observed that as the fly ash content increases, the optimum moisture content shows an increasing trend, while the maximum dry density of the soil samples exhibits a decreasing trend.

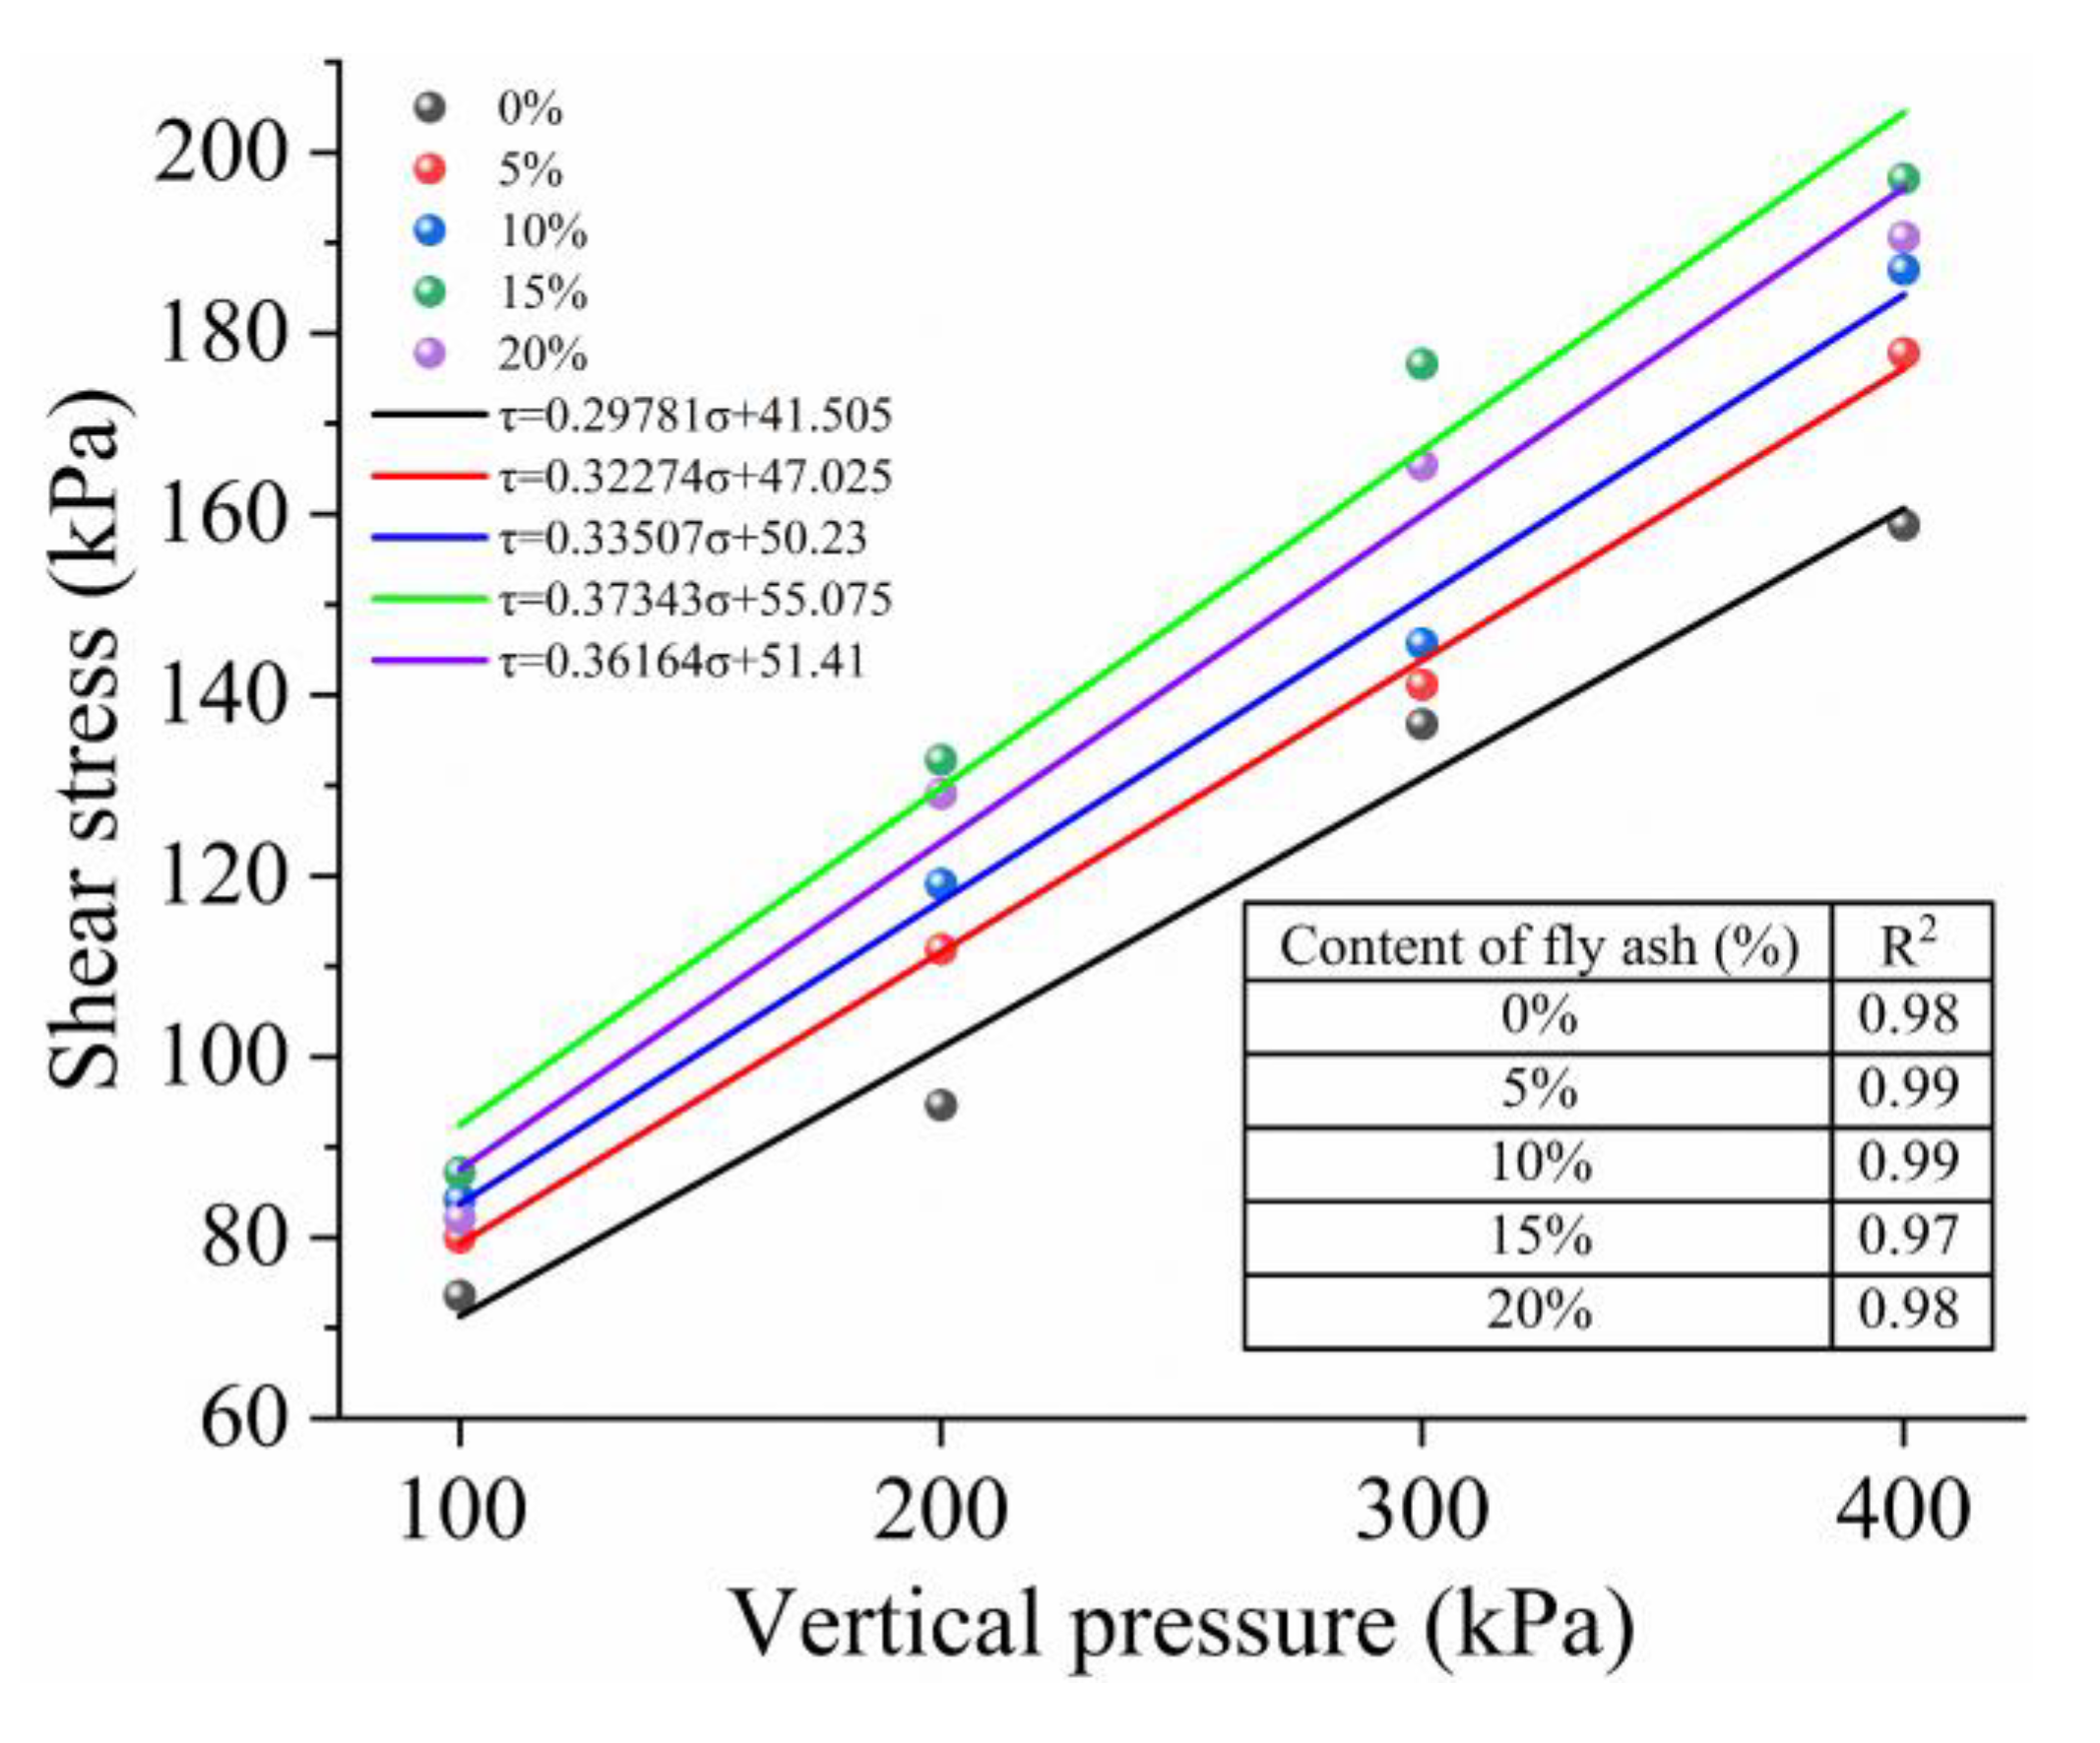
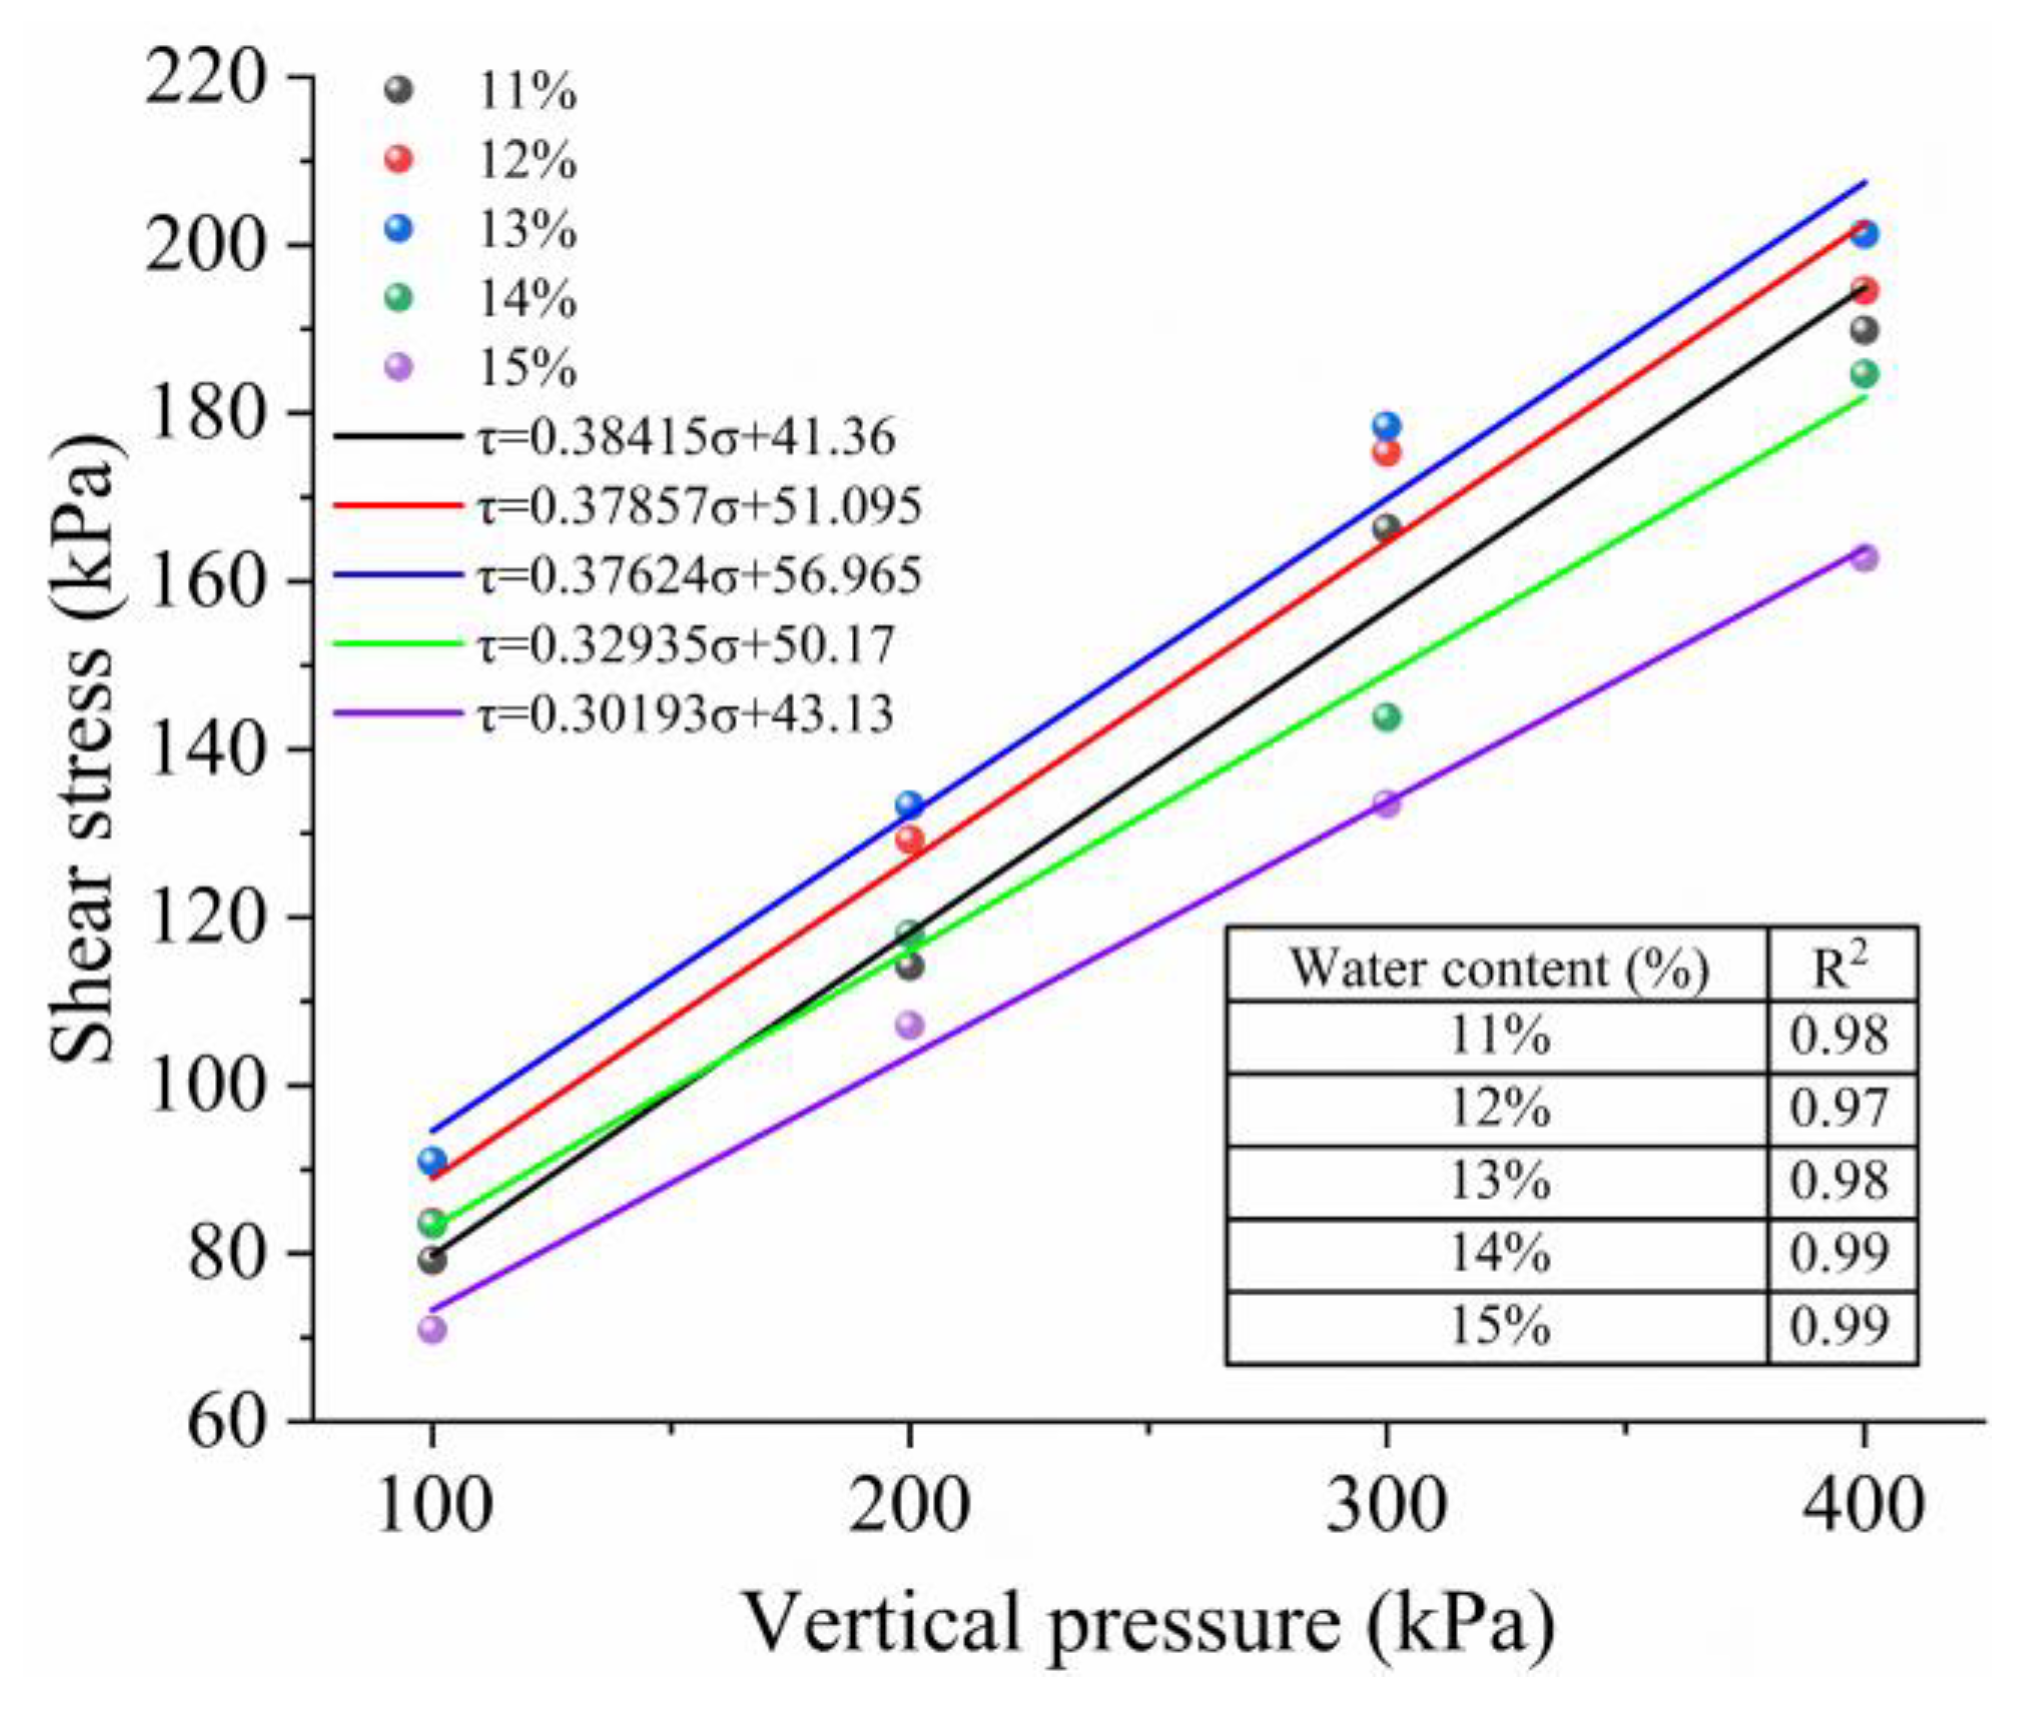
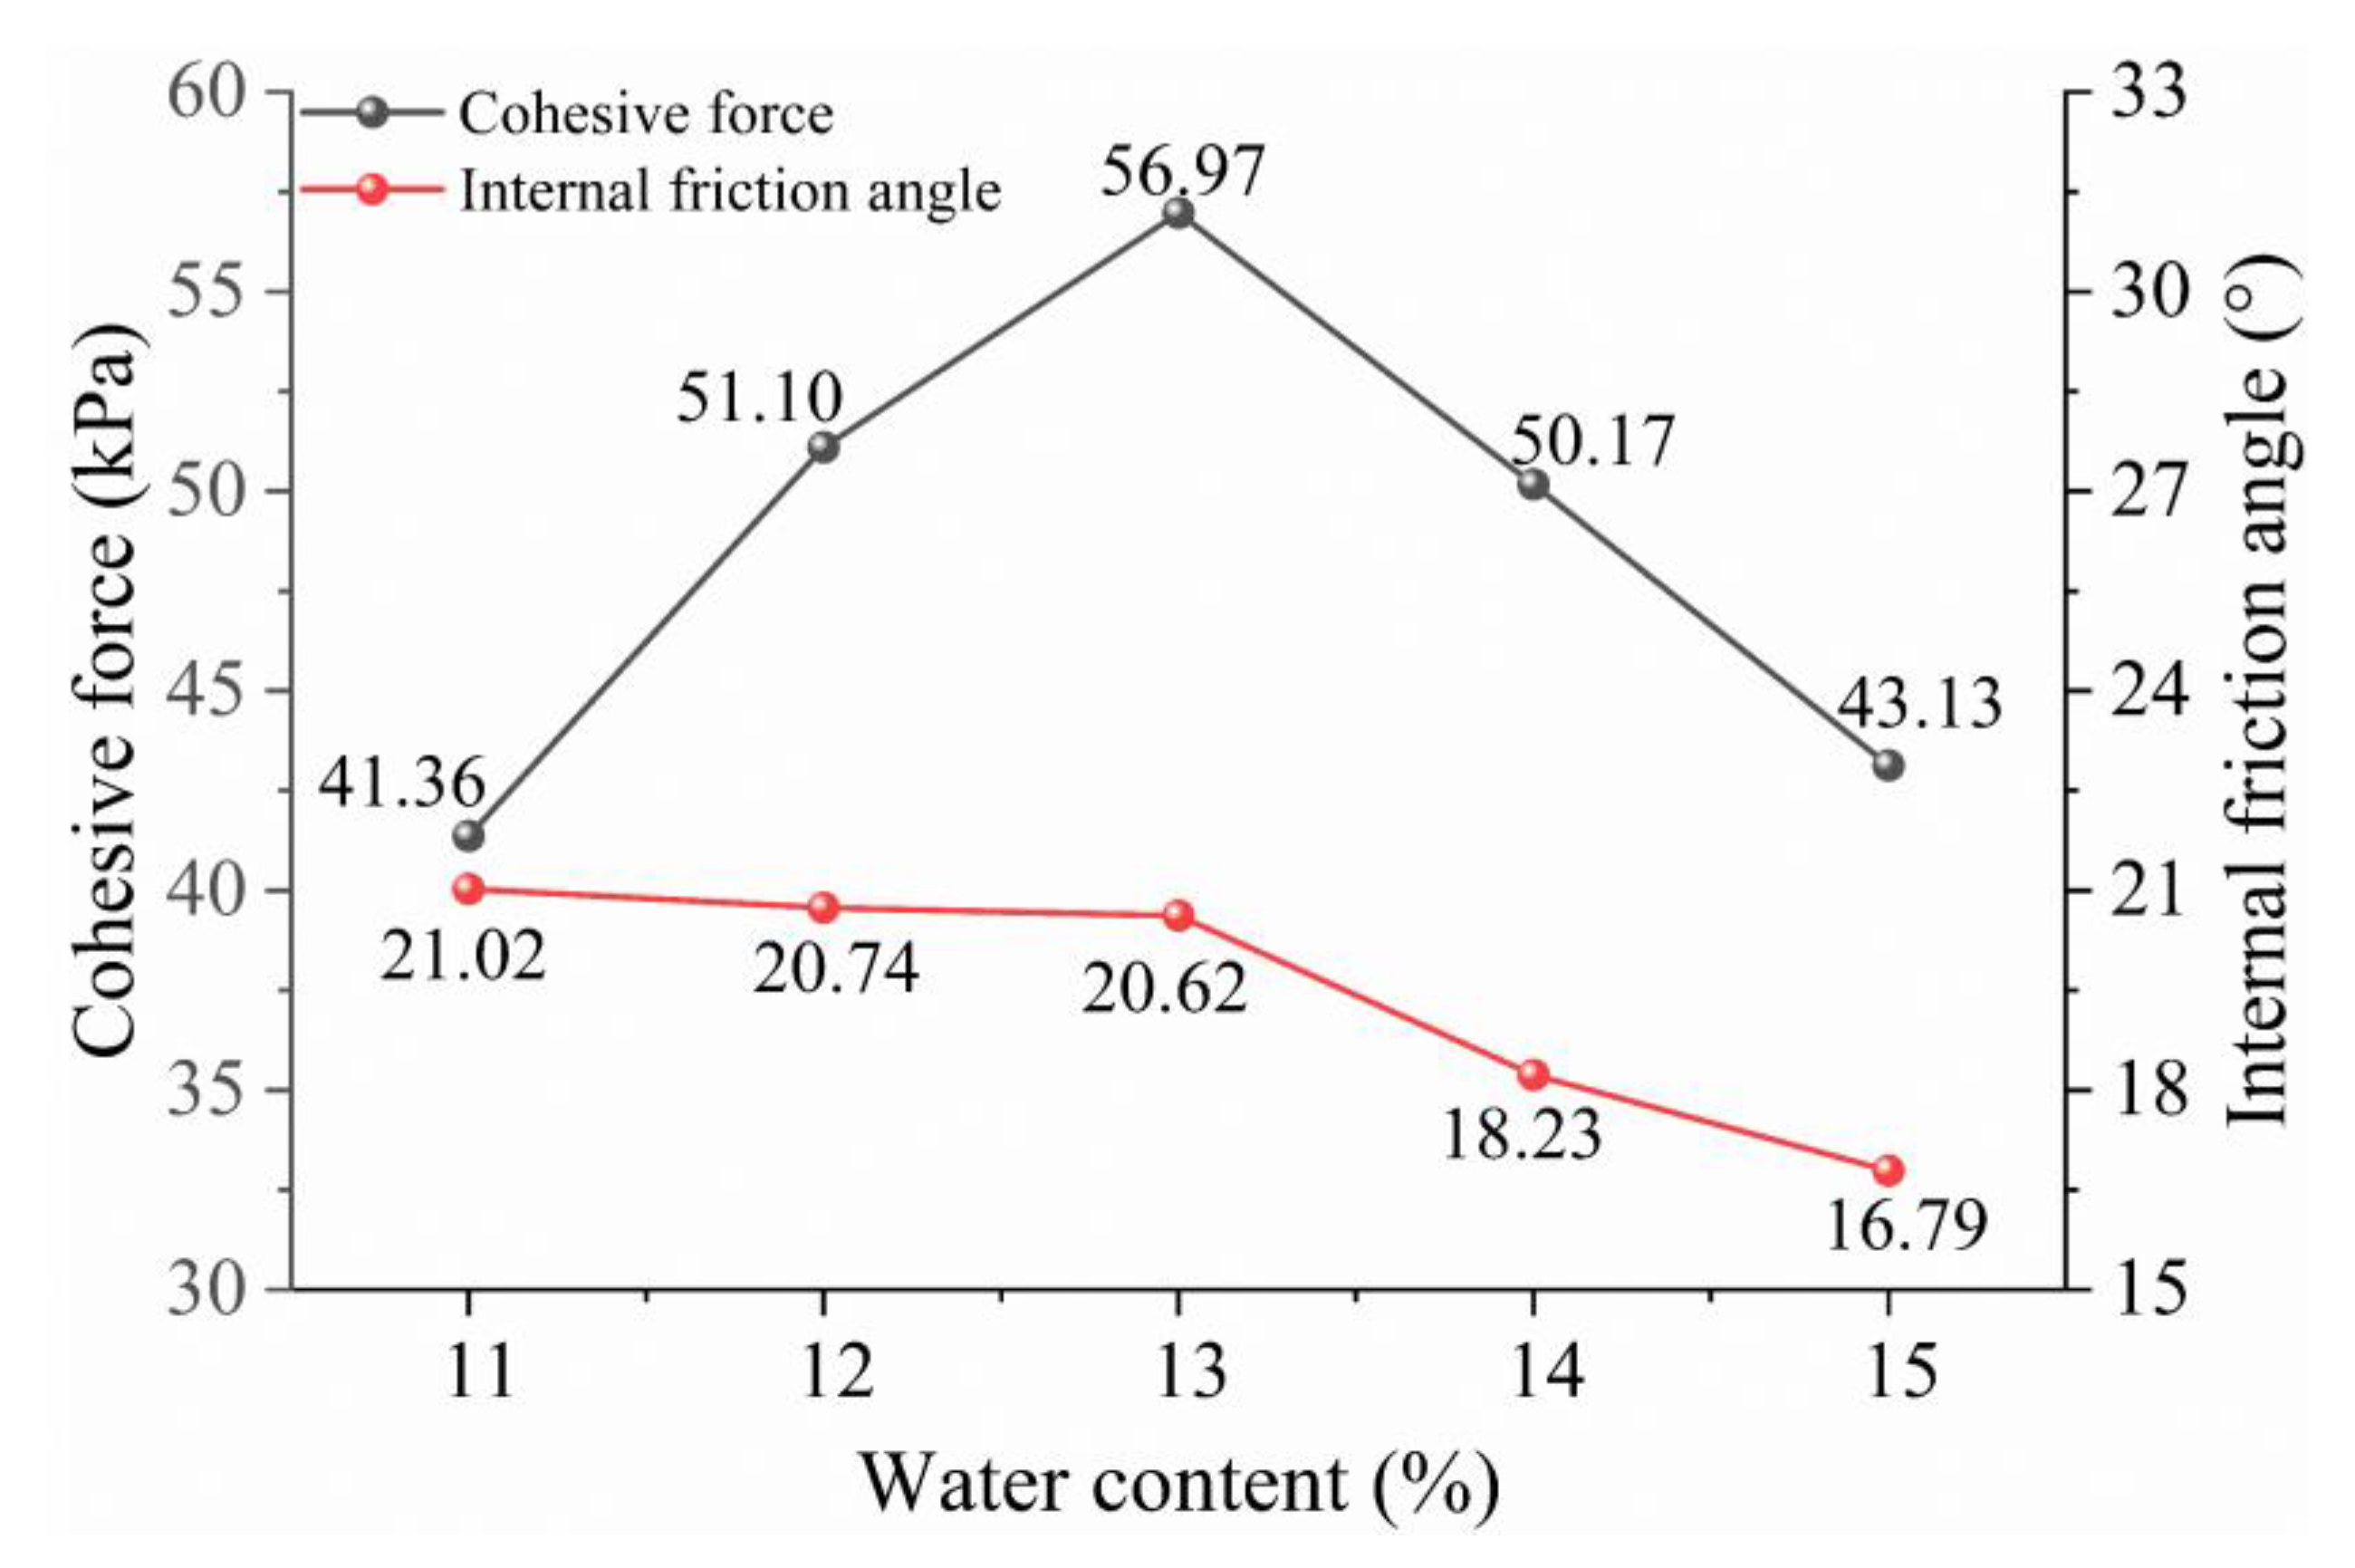
3.3. Results of Direct Shear Test

3.3.1. Effects of Fly Ash Proportion on the Shear Strength of Gravel-Layered Soils

The incorporation of fly ash alters the soil’s water demand; therefore, the optimal moisture content corresponding to each fly ash proportion, as determined from compaction tests, was utilized for sample preparation. This approach ensures that the soil samples with each ash content reach their maximum compaction state, thereby obtaining more accurate shear strength data. The direct shear test was conducted to investigate the effect of fly ash content on the shear strength of the gravel layer soil. During the experiments, no peak shear strength was observed. According to the testing methods specified in the Standards for Geotechnical Testing Methods (GB/T 50123-2019), the shear stress corresponding to a shear displacement of 4 mm was taken as the shear strength.
The three sets of parallel experimental data were processed, and the standard errors were calculated to validate the reliability of their mean values. Data analysis revealed that the standard errors of the three sets were close to the mean values, indicating that the mean values are reliable.
Figure 9 presents the shear strength curves of the soil samples with different ash content under varying vertical pressures. When the vertical pressure is 100 kPa, the shear strength of the soil samples with 5%, 10%, 15%, and 20% fly ash content increased by 6.41 kPa, 10.63 kPa, 13.65 kPa, and 8.6 kPa, respectively, compared to the soil without fly ash. When the vertical pressure is 200 kPa, the shear strength of the soil samples with 5%, 10%, 15%, and 20% fly ash increased by 17.23 kPa, 24.42 kPa, 38.14 kPa, and 34.42 kPa, respectively, compared to the control. At 300 kPa vertical pressure, the shear strength of the soil samples with 5%, 10%, 15%, and 20% fly ash increased by 4.36 kPa, 8.88 kPa, 39.81 kPa, and 28.62 kPa, respectively. At 400 kPa vertical pressure, the corresponding increases in shear strength were 19.01 kPa, 28.23 kPa, 38.3 kPa, and 31.81 kPa. With the increase in fly ash content, the shear strength of the soil generally increased initially, followed by a decrease under different vertical pressures. The peak shear strength of the soil is achieved when the fly ash content is 15%.
Shear strength is an important physical parameter for describing the strength of soil, typically expressed in terms of cohesion and the internal friction angle. During the experiments, shear tests were conducted under four different vertical loads. According to the Mohr–Coulomb criterion, shear strength and vertical pressure were subjected to linear fitting, allowing for the determination of the soil samples’ cohesion and internal friction angle. The expression for shear strength is given as follows:
τ f = σ tan φ + c
In the equation, τ f represents the shear strength of the soil, measured in kPa; σ denotes the magnitude of the vertical load, also in kPa; φ is the internal friction angle, measured in degrees; and c signifies the cohesion.
Through linear fitting, the relationship curves between shear strength and vertical pressure for different fly ash proportions are presented in Figure 10. The R2 values are close to 1, indicating a good fit.
The relationship between fly ash content and both cohesion and internal friction angle is shown in Figure 11. When the fly ash proportion is 0%, the cohesion of the soil sample is measured at 41.51 kPa, with an internal friction angle of 16.58°. At a 5% fly ash proportion, the cohesion is recorded at 47.03 kPa, with an internal friction angle of 17.88°. At a 10% fly ash proportion, the cohesion increases to 50.23 kPa, with an internal friction angle of 18.52°. Finally, at a 15% fly ash proportion, the cohesion reaches 55.08 kPa, with an internal friction angle of 20.47°. At a 20% fly ash proportion, the cohesion is 51.41 kPa, with an internal friction angle of 19.88°. An initial increase followed by a decrease in cohesion and internal friction angle is observed, with the maximum values occurring at a fly ash content of 15%, which is consistent with the trend of shear strength.

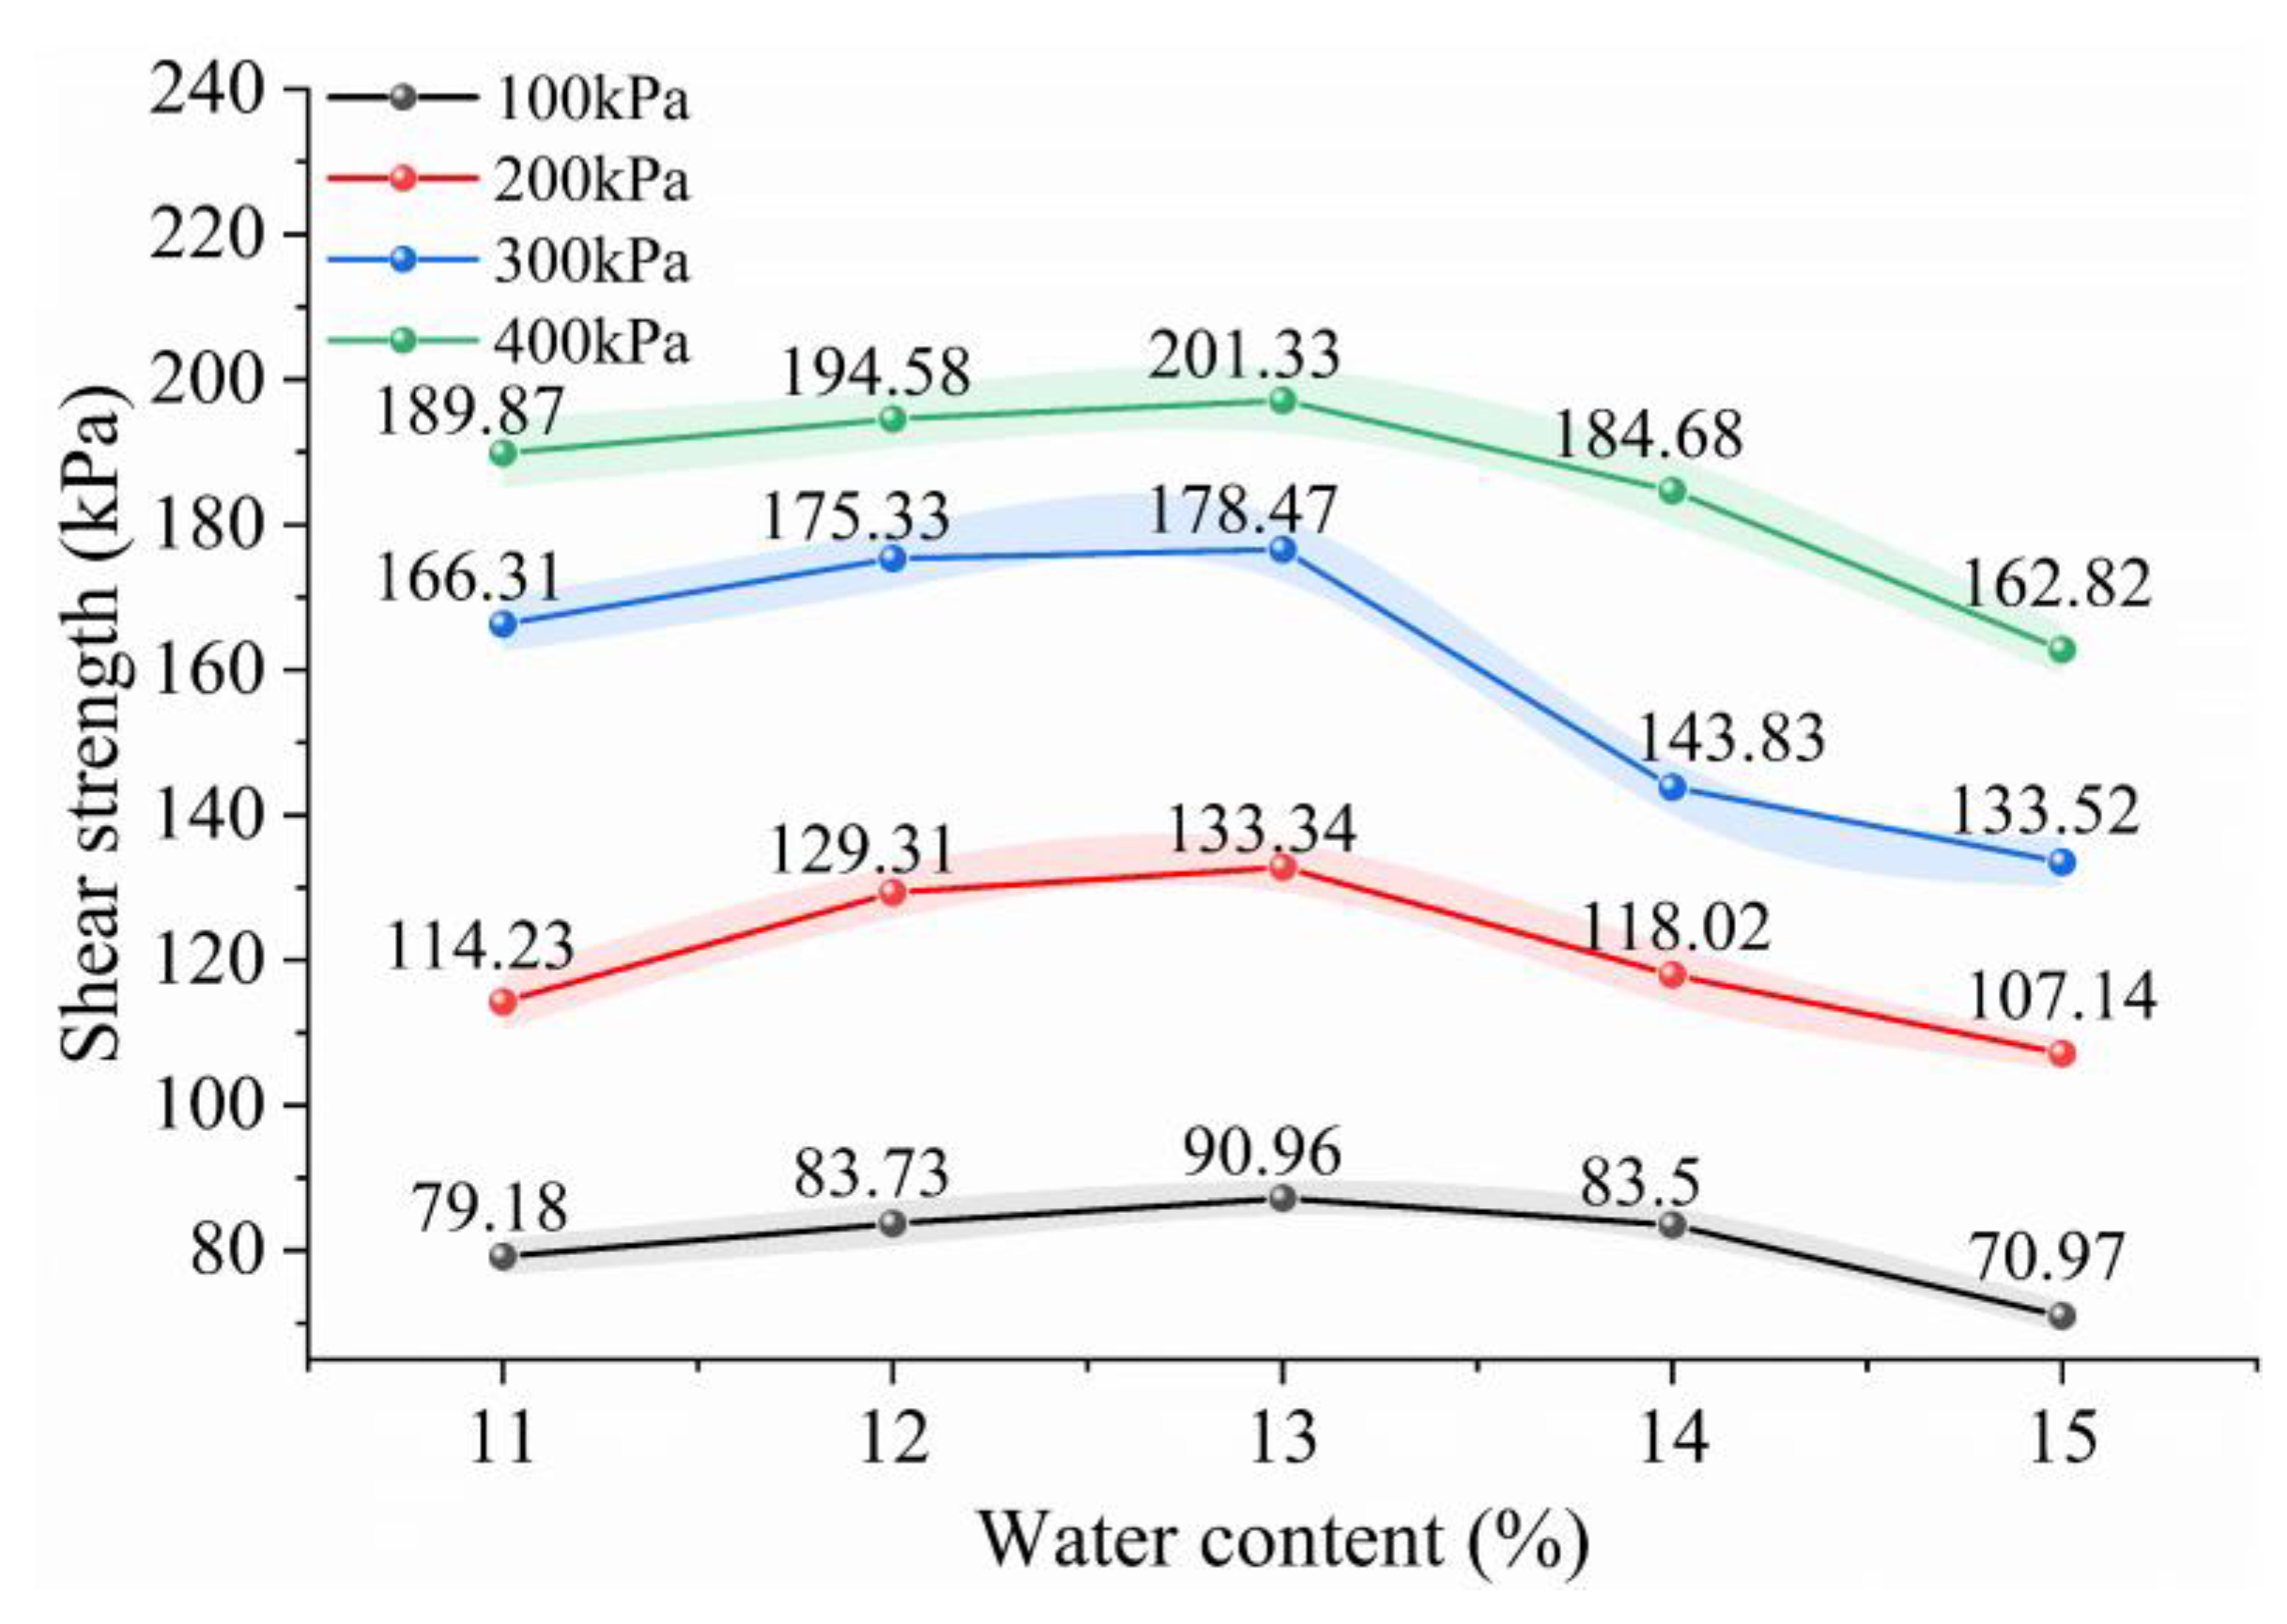
3.3.2. Effects of Water Content on the Shear Strength of Gravel-Layered Soils

The optimum moisture content can be considered as the best compaction state of the soil, at which the soil achieves its highest density. However, this does not necessarily mean that the shear strength is also at its maximum. To further investigate the influence of moisture content on the shear strength of gravel layer soil, direct shear tests were conducted on soil samples with a 15% fly ash content. The moisture content at which the shear strength of the soil is highest typically lies near its optimum moisture content. Therefore, several moisture content points, specifically 11%, 12%, 13%, 14%, and 15%, were selected around the optimum moisture content. Direct shear tests were then performed to determine the shear strength of the soil samples at these different moisture contents.
After the experimental data were processed, Figure 12 was generated to illustrate the shear strength curves of soil samples at different water contents under various vertical pressures. When the vertical pressure is 100 kPa, the shear strengths of soil samples with moisture contents of 11%, 12%, 14%, and 15% are reduced by 11.78 kPa, 7.23 kPa, 7.46 kPa, and 19.99 kPa, respectively, compared to the soil sample with a moisture content of 13%. When the vertical pressure is 200 kPa, the shear strengths of soil samples with moisture contents of 11%, 12%, 14%, and 15% are reduced by 19.11 kPa, 4.03 kPa, 15.32 kPa, and 26.2 kPa, respectively, compared to the soil sample with a moisture content of 13%. When the vertical pressure is 300 kPa, the shear strengths of soil samples with moisture contents of 11%, 12%, 14%, and 15% are reduced by 12.16 kPa, 3.14 kPa, 34.64 kPa, and 44.95 kPa, respectively, compared to the soil sample with a moisture content of 13%. When the vertical pressure is 400 kPa, the shear strengths of soil samples with moisture contents of 11%, 12%, 14%, and 15% are reduced by 11.46 kPa, 6.75 kPa, 16.65 kPa, and 38.51 kPa, respectively, compared to the soil sample with a moisture content of 13%. Under different vertical pressures, the shear strength of the soil initially increases and then decreases with increasing moisture content. The overall shear strength of the soil is maximized when the moisture content is 13%.
The same method was applied, and the relationship curves between shear strength and vertical pressure for different water contents were obtained through linear fitting, as shown in Figure 13. The R2 values were all close to 1, indicating a good fit.
Figure 14 shows the relationship curves between moisture content, cohesion, and internal friction angle. When the water content was 11%, the cohesion of the soil sample was 41.36 kPa, and the internal friction angle was 21.02°. At 12% water content, the cohesion was 51.10 kPa, and the internal friction angle was 20.74°. For 13% water content, the cohesion reached 56.97 kPa, and the internal friction angle was 20.62°. When the water content was 14%, the cohesion decreased to 50.17 kPa, with an internal friction angle of 18.23°. Finally, at 15% water content, the cohesion further dropped to 43.13 kPa, and the internal friction angle was 16.79°. As the moisture content increases, the cohesion of the soil initially increases and then decreases. The maximum cohesion is observed at a moisture content of 13%. In contrast, the internal friction angle gradually decreases with the increase in moisture content.

3.4. Results of Vane Shear Test

Based on preliminary field tests, in situ measurements of the surface gravel layer soil crust were conducted using a miniaturized cruciform shear device. Shear strength data were obtained from multiple testing points in the Eastern Junggar Coalfield, with an average value of 27.7 kPa. The results are presented in Table 4.
The effect of compaction frequency on the shear strength of the gravel layer soil was investigated using a vane shear test. The soil samples were prepared under conditions of 15% fly ash content and 13% moisture content, and compacted incrementally. By the fifth compaction, a general trend in the change of shear strength had emerged. The resulting data were plotted as a compaction curve, as shown in Figure 15. Prior to compaction, the shear strength of the soil sample was 5 kPa, and its soil bulk density was 1.37 g/cm3. After one compaction cycle, the shear strength increased to 29.67 kPa, and the bulk density was 1.43 g/cm3. After two compaction cycles, the shear strength reached 49.83 kPa, with a bulk density of 1.51 g/cm3. With three compaction cycles, the shear strength peaked at 53.75 kPa, and the bulk density was 1.54 g/cm3. After four cycles, the shear strength decreased to 35.00 kPa, and the bulk density was 1.45 g/cm3. Finally, after five compaction cycles, the shear strength was 31.50 kPa, and the bulk density remained at 1.45 g/cm3. As the number of compaction cycles increased, both the shear strength and bulk density exhibited a trend of initially increasing and then decreasing. The peak values for both shear strength and bulk density were reached after three compaction cycles.

3.5. Results of Microscopic Test

3.5.1. Results of XRF

The XRF analysis was employed to investigate the changes in the primary chemical compositions of gravel layer soil before and after modification with fly ash. Due to the extremely low energy of the fluorescent X-rays produced by elements such as hydrogen (H), helium (He), carbon (C), nitrogen (N), oxygen (O), fluorine (F), sodium (Na), and others, these signals are easily absorbed by the sample itself or by air. This results in very low sensitivity or even undetectable signals for these elements in XRF analysis. Therefore, the reaction progress can be indirectly inferred through the changes in the content of the major reactants.
The XRF analysis results are shown in Figure 16. Before the addition of fly ash, the composition of the gravel layer soil consisted of 62.90% SiO2, 12.50% Al2O3, 5.02% CaO, 4.77% Fe2O3, 3.06% Na2O, 2.33% MgO, and 2.26% K2O. After modification with fly ash, the composition of the gravel layer soil changed to 49.38% SiO2, 15.64% Al2O3, 6.44% CaO, 3.47% Fe2O3, 2.99% Na2O, 2.34% MgO, and 1.84% K2O.

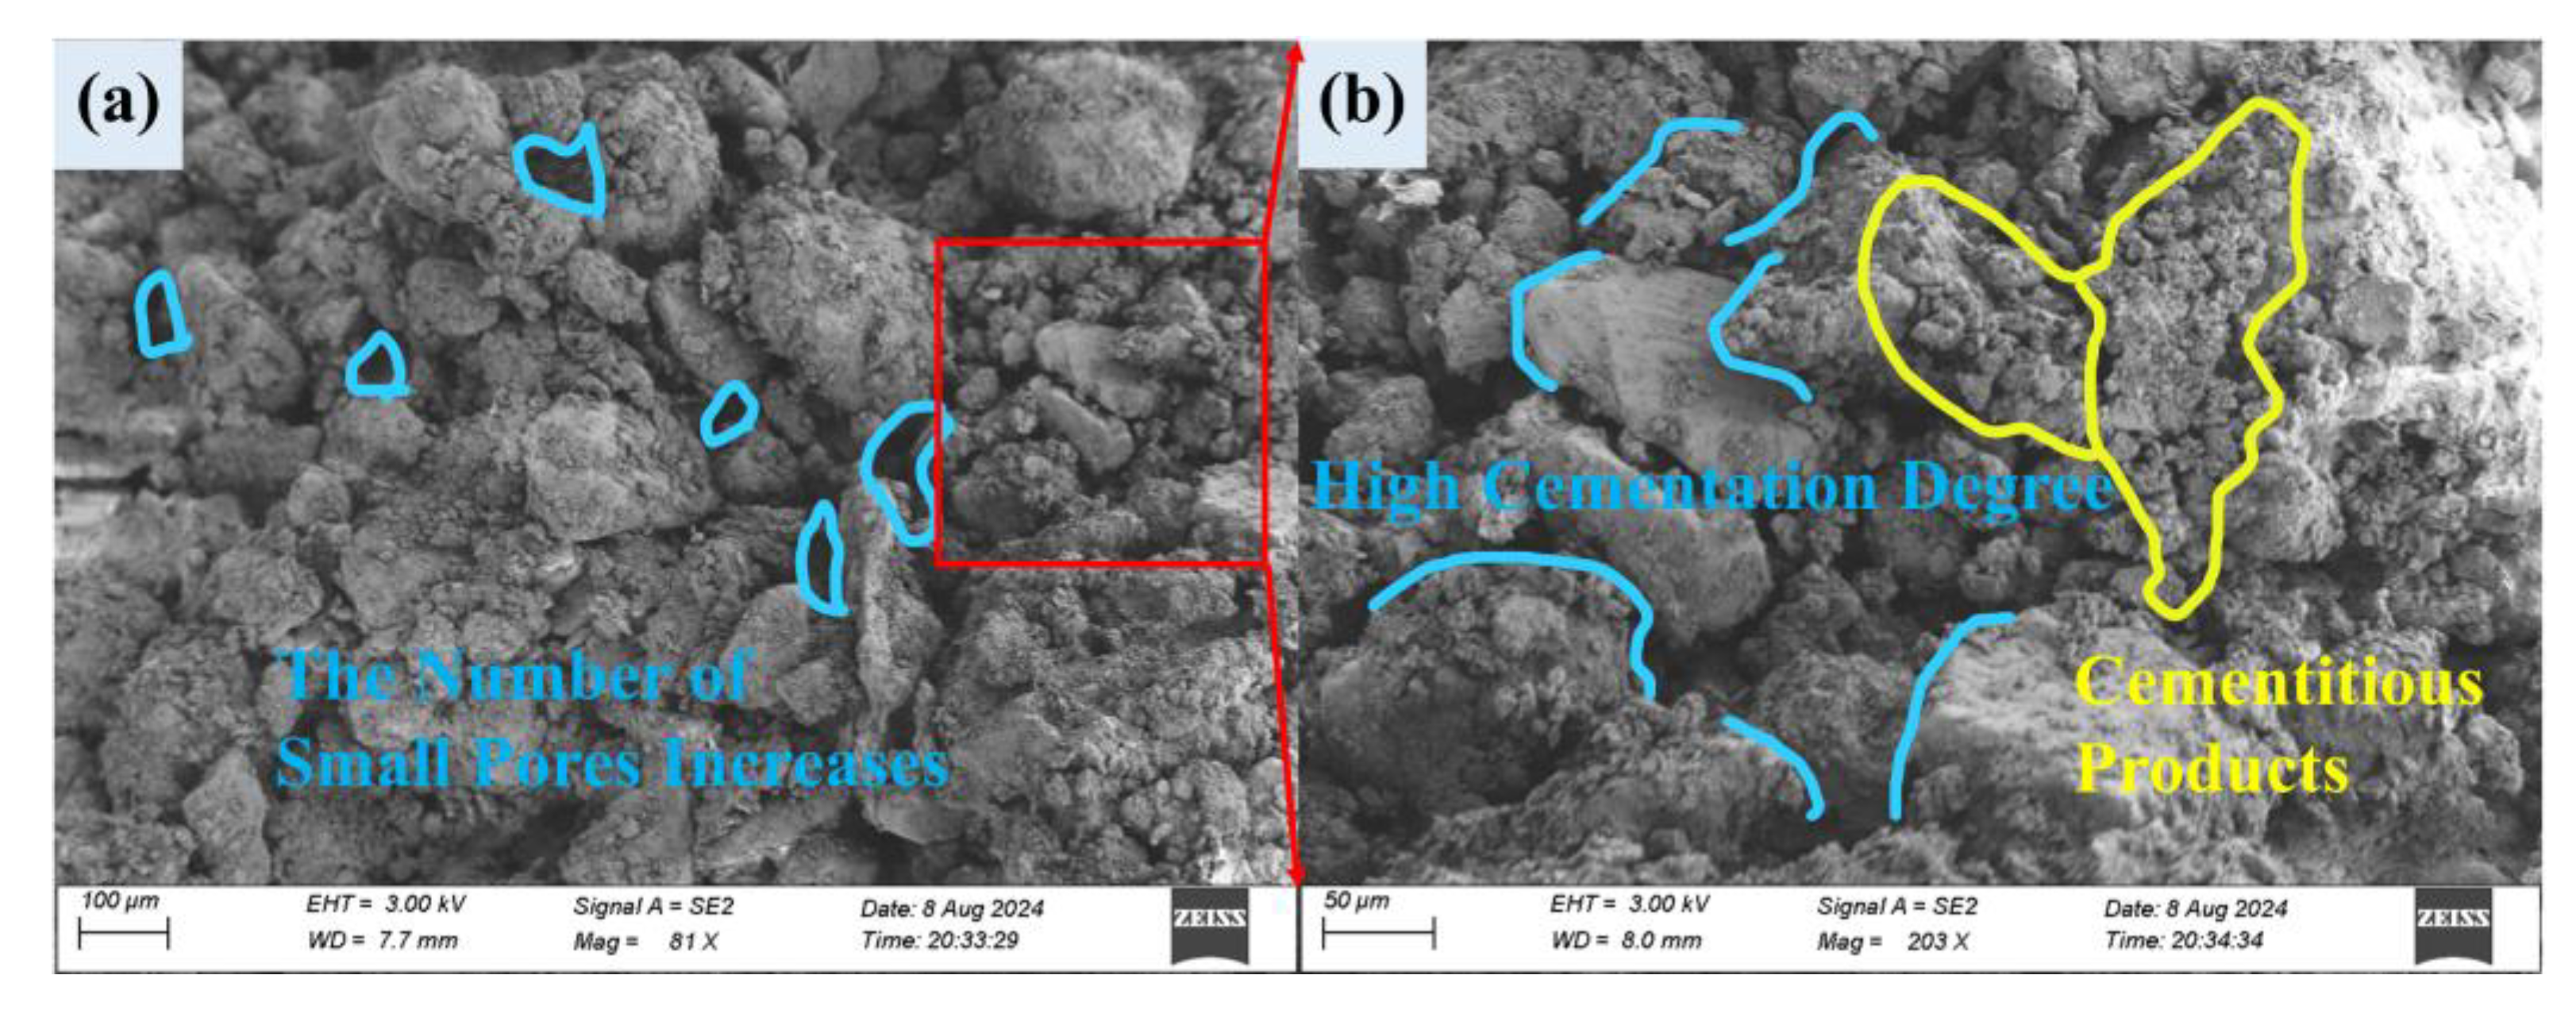
3.5.2. Results of SEM

The microstructural changes in the gravel layer soil before and after fly ash modification were investigated using scanning electron microscopy (SEM). Both untreated soil samples and soil samples with 15% fly ash content were examined under SEM. The microstructure of the untreated soil sample is shown in Figure 17. At 500× magnification, the surface of the soil exhibits a rough and uneven texture, with a relatively loose skeleton and numerous large, irregular pores. At 1000× magnification, the bonding between particles is weak, and the soil exhibits poor compaction.
The microstructure of the soil sample with 15% fly ash content is shown in Figure 18. At 500× magnification, the surface of the gravel layer soil with 15% fly ash is relatively smooth, with a reduction in the number of large pores and an increase in the number of smaller pores. At 1000× magnification, agglomerates of particles can be observed, which are bonded together. These materials are attached to the soil surface and fill the pores within the soil, enhancing the bonding between particles.

3.6. Results of Wind Tunnel Test

Wind tunnel tests were conducted to measure the mass loss of the reconstructed gravel layer soil crust under constant wind speed erosion, in order to evaluate its wind erosion resistance. Considering the arid climate, minimal precipitation, and high evaporation rates in the Eastern Junggar Coalfield, water resources are severely limited, making reduced water content a critical factor for cost-effective soil stabilization. Therefore, with a fixed 15% fly ash content and a single compaction cycle, soil samples with water contents of 10%, 11%, 12%, and 13% were prepared to test their wind erosion resistance. The optimal sand fixation ability and the minimal water content required for the best performance were identified based on the results.
Taking into account the local environmental conditions and the technical specifications of the wind tunnel apparatus, the wind speed for this experiment was set at 8 m/s. The cumulative wind erosion of fly-ash-modified samples with different moisture con-tents, along with unamended samples, is illustrated in Figure 19. Over time, the wind erosion of both fly-ash-modified gravel-layered soil crusts and reconstructed gravel-layered soil crusts progressively increased. The cumulative erosion amounts for fly-ash-amended samples with moisture contents of 13%, 12%, and 11% were observed to be 11.81 g, 13.22 g, and 14.92 g, respectively. For the unamended sample with a moisture content of 12%, cumulative erosion reached 15.48 g, whereas the fly-ash-amended sample with a 10% moisture content exhibited a cumulative erosion of 16.75 g.

4. Discussion

4.1. Analysis of Compaction Test

Based on the results of the above experiments, it can be observed that the compaction curve shows an initial increase followed by a decrease. This trend is attributed to the variation in the thickness of the water film between soil particles. When the water content is low, the water film between the particles is thin, leading to larger resistance between the particles and a significant counteracting effect on the compaction work, resulting in a lower dry density. As the water content increases, the water film becomes thicker, causing an increase in dry density until the maximum dry density is reached. However, with a further increase in water content, free water and closed air fill the soil pores, which leads to a reduction in dry density. The incorporation of fly ash causes a hydration reaction that consumes a certain amount of water. Therefore, as the fly ash content increases, the water demand also increases, resulting in a higher optimum moisture content for the soil sample. At the same time, fly ash has a relatively low density, and an increase in the fly ash content leads to a decrease in the maximum dry density of the soil sample. This conclusion is consistent with previous research [33].

4.2. Analysis of Direct Shear Test

In this study, the use of 15% fly ash to improve the gravel layer soil demonstrated good shear strength performance. A similar conclusion was drawn by Cheng et al. [34] in their previous research. Cohesion and internal friction angle are key parameters of shear strength. On one hand, the addition of fly ash fills the pores in the soil, enhancing the bonding and interlocking forces between soil particles, which improves both the cohesion and internal friction angle of the soil. On the other hand, fly ash undergoes a hydration reaction with water, generating cementitious products, which further strengthens the soil structure. These two factors together contribute to the improvement in shear strength. However, as the fly ash content continues to increase, the fine particle size of fly ash may cause particle sliding, leading to “slippage” and a reduction in the soil’s shear strength, cohesion, and internal friction angle.
Water content is also a critical factor affecting soil shear strength. In previous studies, Wan [35] also observed that soil shear strength follows a trend of initially increasing and then decreasing with increasing water content. This is because a layer of bound water film exists between soil particles. When the water content is below the optimum moisture content, the thickness of the bound water film gradually increases with increasing water content, resulting in an increase in cohesion. When the water content exceeds the optimum moisture content, the amount of free water continues to increase, reducing the adsorptive forces between particles, which in turn decreases cohesion. The reduction in internal friction angle is primarily due to the increasing thickness of the water film, which weakens the resistance to relative particle movement and mechanical interlocking, leading to a decrease in the internal friction angle.

4.3. Analysis of Vane Shear Test

Different compaction levels can alter the physical and mechanical properties of soil [36]. In this experiment, the changes in shear strength of the soil as the number of compactions increases can be generally divided into four stages:
The first stage is characterized by the compaction process, where soil particles become denser and pore spaces decrease. This leads to a significant increase in both the bulk density and shear strength of the soil.
The second stage sees continued increases in shear strength and bulk density, although at a progressively slower rate. This indicates that the pores in the soil are nearly filled.
In the third stage, the soil’s bulk density and shear strength approach saturation. Further increases in the number of compactions can no longer enhance the vertical compaction of the soil. Instead, the soil begins to expand laterally, which disrupts the previously stabilized structure, causing both shear strength and bulk density to decrease.
In the fourth stage, the internal rearrangement and structural adjustments of the soil reach completion, and the overall performance stabilizes into a new equilibrium state. The rate of decline in shear strength and bulk density slows, but remains at a lower level.
Although the peak shear strength is achieved after three compactions, the shear strength obtained after just one compaction already exceeds the average shear strength of natural gravel layer soil crusts. This suggests that compaction after a single pass can effectively reduce the economic costs in practical engineering applications.

4.4. Analysis of Microscopic Test

The improvement in the shear strength of gravel layer soil is closely related to changes in its composition and microstructure. The main component of gravel layer soil is SiO2, followed by Al2O3. When fly ash is incorporated into the gravel layer soil, a hydration reaction occurs between the fly ash and water. During this process, CaO hydrolyzes, providing an alkaline environment for subsequent reactions. On the one hand, Ca2+ and Mg2+ ions from the fly ash exchange with K+ and Na+ ions in the soil, enhancing the cohesion between soil particles. On the other hand, due to aggregation and cementation, SiO2 and Al2O3 react with water to form cementitious products such as CaO·SiO2·H2O and CaO·Al2O3·H2O. These cementitious products bond the particles into clusters and fill the pores between soil particles. The contact mode between the framework particles changes from point-to-plane and point-to-point contact to plane-to-plane contact and surface bonding, making the soil structure more stable. This manifests macroscopically as an improvement in shear strength. Similar explanations for this mechanism have also been provided by Ma et al. [37]. The chemical reactions involved are expressed in Equations (2)–(4).
C a O + H 2 O C a ( O H ) 2
C a ( O H ) 2 + S i O 2 + n H 2 O C a O · S i O 2 · n H 2 O
C a ( O H ) 2 + A l 2 O 3 + n H 2 O C a O · A l 2 O 3 · n H 2 O

4.5. Analysis of Wind Tunnel Test

Based on the results of wind tunnel tests, it was found that the cumulative wind erosion of fly-ash-modified soil samples with moisture contents of 11%, 12%, and 13% was reduced by 4%, 15%, and 23%, respectively, compared to the gravel layer soil samples without fly ash, indicating a varying degree of improvement in wind erosion resistance. This enhancement is attributed to the cementitious materials generated by the hydration reaction of fly ash, which stabilized the surface soil structure of the gravel layer, forming a hard crust on the surface that increases resistance to wind forces.
However, the fly-ash-modified soil sample with a moisture content of 10% showed an 8% increase in cumulative wind erosion compared to the sample without fly ash, resulting in a decrease in wind erosion resistance. This can be explained by the lower moisture content, which weakens the bonding ability between soil particles, causing the surface structure to become loose, making it difficult to form a protective crust. As a result, the surface is more susceptible to wind erosion. Additionally, the fine particles of fly ash, when insufficiently hydrated, do not bind effectively, and can easily be blown away by the wind, further exacerbating wind erosion. This phenomenon is one of the key reasons for severe land degradation in arid and semi-arid regions.

5. Conclusions

This study focuses on the use of fly ash from the Eastern Junggar Coalfield as a soil stabilizer for treating gravel layer soil. Direct shear tests and vane shear tests were conducted to summarize the effects of fly ash, water content, and compaction on shear strength. Using methods such as X-ray fluorescence (XRF) and scanning electron microscopy (SEM), the microscopic mechanisms by which fly ash enhances the shear strength of soil were revealed. Wind tunnel tests were then performed to evaluate the effectiveness of fly ash in improving the wind erosion resistance of the reconstructed gravel-layer soil crust. Finally, considering the local water scarcity, an economically and technically reasonable set of reconstruction parameters was determined, including the optimal fly ash content, water addition, and compaction cycles. The conclusions are as follows:
(1)
The shear strength of gravelly soil layers is influenced by variations in fly ash content, water content, and compaction frequency. Proper control of these factors can significantly enhance the shear strength of the soil. The optimal shear strength of the gravelly soil was achieved when the fly ash content was 15%, the water content was 13%, and the soil was compacted three times.
(2)
The material composition and microstructure of the gravelly soil layer change before and after the addition of fly ash. The fly ash undergoes a hydration reaction, and the resulting cementitious products bind the soil particles together, filling the internal pores of the soil and thereby enhancing its strength.
(3)
Fly ash significantly improves the wind erosion resistance of the gravelly soil layer, reducing the wind erosion amount by approximately 23%. However, a decrease in moisture content weakens its wind erosion resistance. The critical moisture content required to maintain the wind erosion resistance of the reconstructed gravelly soil skin is 11%, where the wind erosion amount is reduced by about 4%. Considering the water scarcity in the Quandong coalfield and the engineering economic factors, the optimal process parameters for reconstructing the gravelly soil layer were determined to be a fly ash content of 15%, a moisture content of 11%, and a compaction frequency of 1 time.
This study aimed to enhance the shear strength and wind erosion resistance of the gravelly soil layer using fly ash, and to identify economically and technically feasible reconstruction parameters. Therefore, future research could focus on several aspects, including the diversity of soil stabilizers, the practical applicability in field conditions, and the long-term effectiveness of the improvement. Further exploration of the application of fly ash in the reconstruction of gravelly soil layers is needed. Additionally, the ecological benefits and sustainability of reconstructed gravelly soil layers are also important directions for future research. Investigating the effects of these improvements on plant growth, nutrient cycling, and microbial communities will help provide a comprehensive assessment of the ecological remediation potential of fly ash, offering more integrated solutions for desert ecological restoration.

Author Contributions

Conceptualization, Z.H.; formal analysis, J.L., G.L. and M.X.; investigation, Y.Z., W.G., J.L. and M.X.; writing—original draft, Y.Z.; visualization, X.Z.; supervision, W.G. and G.L.; funding acquisition, W.G. All authors have read and agreed to the published version of the manuscript.

Funding

This research was funded by the Xinjiang Tianshan Talents—Youth Top-notch Scientific and Technological Innovation Talent Training Program (2023TSYCCX0081).

Data Availability Statement

The original contributions presented in this study are included in the article. Further inquiries can be directed to the corresponding author.

Conflicts of Interest

The authors declare that they have no conflicts of interest to report regarding the present study.

Correction Statement

This article has been republished with a minor correction to the readability of figure1. This change does not affect the scientific content of the article.

References

  1. Liu, J.; Kimura, R.; Wu, J. Aerodynamic Characteristics Over Fine-Grained Gravel Surfaces in a Wind Tunnel. Front. Earth Sc-Switz. 2021, 9, 758910. [Google Scholar] [CrossRef]
  2. Yan, H.; Wang, S.; Wang, C.; Zhang, G. Impact of wind erosion on carbon cycle of fragile ecosystem in northern china. Quat. Sci. 2004, 24, 672–677. [Google Scholar]
  3. Wu, Y.; Jia, Z.; Li, W.; Gao, S.; Zhang, X.; Niu, X.; Huang, Y. Gravel Mulching Significantly Improves Crop Yield and Water Productivity in Arid and Semi-Arid Regions of Northwest China: Evidence from a Meta-Analysis. Agronomy 2024, 14, 1717. [Google Scholar] [CrossRef]
  4. Mao, X.; Cao, Y.; Ding, Z.; Yang, J.; Zheng, J. Combining a saltation impact sensor and a wind tunnel to explore wind erosion processes-A case study in the Eastern Junggar mining area, Xinjiang, China. J. Soil Water Conserv. 2022, 77, 389–402. [Google Scholar] [CrossRef]
  5. Yu, K.; Lehmkuhl, F.; Schluetz, F.; Diekmann, B.; Mischke, S.; Grunert, J.; Murad, W.; Nottebaum, V.; Stauch, G.; Zeeden, C. Late Quaternary environments in the Gobi Desert of Mongolia: Vegetation, hydrological, and palaeoclimate evolution. Palaeogeogr. Palaeoclimatol. Palaeoecol. 2019, 514, 77–91. [Google Scholar] [CrossRef]
  6. Mu, Y.; Wang, F.; Zheng, B.; Guo, W.; Feng, Y. McGET: A rapid image-based method to determine the morphological characteristics of gravels on the Gobi desert surface. Geomorphology 2018, 304, 89–98. [Google Scholar] [CrossRef]
  7. Shen, Y.; Wang, X.; Cheng, W.; Wu, J.; Lu, Q.; Feng, Y. Integrated physical regionalization of stony deserts in China. Prog. Geogr. 2016, 35, 57–66. (In Chinese) [Google Scholar]
  8. Wang, X.; Lang, L.; Hua, T.; Zhang, C.; Wang, Z. Gravel Cover of Gobi Desert and Its Significance for Wind Erosion: An experimental study. J. Desert Res. 2013, 33, 313–319. [Google Scholar]
  9. Zhang, K.; Zhang, W.; Qu, J.; An, Z.; Tan, L. Study on Dynamic Properties of Gobi Surface with Different Gravel Coverage. Arid Zone Res. 2012, 29, 1077–1082. (In Chinese) [Google Scholar] [CrossRef]
  10. Zhang, W.; Tan, L.; Zhang, K.; An, Z. Field Wind Tunnel Simulation of the Process of Aeolian Erosion and Deposition of Gravel Beds with Different Coverage. Sci. Geogr. Sin. 2012, 32, 1370–1376. [Google Scholar]
  11. Mu, Q.; Liao, J.; Ma, C.; Miao, T. Effect of rough elements on soil erosion. Acta Pedol. Sin. 2008, 45, 1026–1033. [Google Scholar]
  12. Zhang, C.L.; Zou, X.Y.; Gong, J.R.; Liu, L.Y.; Liu, Y.Z. Aerodynamic roughness of cultivated soil and its influences on soil erosion by wind in a wind tunnel. Soil Tillage Res. 2004, 75, 53–59. [Google Scholar] [CrossRef]
  13. Tan, L.; Zhang, W.; Qu, J.; Zhang, K.; An, Z.; Wang, X. Aeolian sand transport over gobi with different gravel coverages under limited sand supply: A mobile wind tunnel investigation. Aeolian Res. 2013, 11, 67–74. [Google Scholar] [CrossRef]
  14. Tu, Y.; Dong, M.; Wuda, B. Simulation study of soil wind erosion and blowouts along the Xilin Gol Provincial Highway. J. Shanxi Agric. Univ. (Nat. Sci. Ed.) 2023, 43, 119–128. (In Chinese) [Google Scholar] [CrossRef]
  15. Liu, X.; Dong, Z. Aerodynamic roughness of gravel beds. J. Desert Res. 2003, 23, 38–45. [Google Scholar]
  16. Zhang, J.; Bai, Z.; Yang, B. Gravel layer layer in the desert open-pit mining area of Xinjiang: Ecological damage and reconstruction method. Earth Sci. Front. 2021, 28, 142–152. [Google Scholar]
  17. Koohestani, B.; Darban, A.K.; Mokhtari, P.; Darezereshki, E.; Yilmaz, E. Geopolymerization of soil by sodium silicate as an approach to control wind erosion. Int. J. Environ. Sci. Technol. 2021, 18, 1837–1848. [Google Scholar] [CrossRef]
  18. Yang, K.; Tang, Z.; Zhao, Z.; Feng, J.; Guo, P.; Ding, T. Wind tunnel experimental study on sand-fixing effect of fly ash and polyacrylamide. Trans. Chin. Soc. Agric. Eng. 2012, 28, 54–59. [Google Scholar]
  19. Li, Z.; Zhang, W. Ecological restoration measures for the destruction of the gravel layer in the Gobi Desert. J. Green Sci. Technol. 2016, 2, 11–12. (In Chinese) [Google Scholar] [CrossRef]
  20. Gao, Z.; Zhong, X.; Wang, J.; Liu, Z. Dynamic characteristics of saturated loess improved by fly ash. World Earthq. Eng. 2019, 35, 91–98. [Google Scholar]
  21. Zaady, E.; Katra, I.; Barkai, D.; Knoll, Y.; Sarig, S. The Coupling Effects of Using Coal Fly-Ash and Bio-Inoculant for Rehabilitation of Disturbed Biocrusts in Active Sand Dunes. Land Degrad. Dev. 2017, 28, 1228–1236. [Google Scholar] [CrossRef]
  22. Ahmad, W.; Uchimura, T. The Effect of Moisture Content at Compaction and Grain Size Distribution on the Shear Strength of Unsaturated Soils. Sustainability 2023, 15, 5123. [Google Scholar] [CrossRef]
  23. Zhang, J.R.; Jiang, T.; Wang, X.C.; Liu, C.; Huang, Z.Q. Influences of Drying and Wetting Cycles and Compaction Degree on Strength of Yudong Silt for Subgrade and Its Prediction. Adv. Civ. Eng. 2018, 2018, 10. [Google Scholar] [CrossRef]
  24. GB/T 50123-2019; Standard for Geotechnical Testing Method. Chinese Standard: Beijing, China, 2019. (In Chinese)
  25. GB 15618-2018; Soil Environmental Quality-Risk Control Standard for Soil Contamination of Agricultural Land. Chinese Standard: Beijing, China, 2018. (In Chinese)
  26. Tang, H.; Yang, Z.; Zhu, H.; Dong, H. Experimental Study on the Mechanical Properties of Xinyang Red Clay Improved by Lime and Fly Ash. Appl. Sci. 2023, 13, 6271. [Google Scholar] [CrossRef]
  27. Zhang, Y.; Jiang, T.; Li, S.; Wang, W. Engineering Properties and Environmental Impact of Soil Mixing with Steel Slag Applied in Subgrade. Appl. Sci. 2023, 13, 1574. [Google Scholar] [CrossRef]
  28. Adajar, M.A.; Tan, J.; Ang, A.B.; Lim, M.L.; Seng, K.R.; Sy, V.P. Shear Strength and Durability of Expansive Soil Treated with Recycled Gypsum and Rice Husk Ash. Appl. Sci. 2024, 14, 3540. [Google Scholar] [CrossRef]
  29. Zhou, J.; Wang, H.; Han, B. Sand Supply Affects Wind Erosion Efficiency and Sand Transport on Sand-Cemented Body Mulch Bed. Atmosphere 2024, 15, 571. [Google Scholar] [CrossRef]
  30. Hu, B.; Hu, Q.; Liu, Y.; Tao, G. Research on the Improvement of Granite Residual Soil Caused by Fly Ash and Its Slope Stability under Rainfall Conditions. Appl. Sci. 2024, 14, 3734. [Google Scholar] [CrossRef]
  31. Simatupang, M.; Mangalla, L.K.; Edwin, R.S.; Putra, A.A.; Azikin, M.T.; Aswad, N.H.; Mustika, W. The Mechanical Properties of Fly-Ash-Stabilized Sands. Geosciences 2020, 10, 132. [Google Scholar] [CrossRef]
  32. Cui, S.; Zhang, H. Study on the expansion characteristics of static compacted bentonite-sand mixtures. Radiat. Prot. 2012, 32, 289–295. (In Chinese) [Google Scholar]
  33. Yang, G.J.; Mo, P.; Tian, Q.Q.; Miao, Q.H.; Liu, D.T.; Pan, J.K. Study on Strength and Micromorphology of Expansive Soil Improved by Cement-Coal Gangue under Dry-Wet Cycle. Adv. Civ. Eng. 2024, 2024, 12. [Google Scholar] [CrossRef]
  34. Cheng, Z.; Cui, G.; Yang, Z.; Gang, H.; Gao, Z.; Zhang, D.; Xi, C. Improvement of the Salinized Soil Properties of Fly Ash by Freeze-Thaw Cycles: An Impact Test Study. Sustainability 2021, 13, 2908. [Google Scholar] [CrossRef]
  35. Wan, J.; Zhu, J.; Xiao, H.L.; Ma, Q. Study on Mechanical and Ecological Properties of Fly Ash Substrate for Ecological Slope Protection. Adv. Civ. Eng. 2019, 2019, 11. [Google Scholar] [CrossRef]
  36. Schäffer, B.; Attinger, W.; Schulin, R. Compaction of restored soil by heavy agricultural machinery—Soil physical and mechanical aspects. Soil Tillage Res. 2007, 93, 28–43. [Google Scholar] [CrossRef]
  37. Ma, B.H.; Cai, K.; Zeng, X.; Li, Z.; Hu, Z.Y.; Chen, Q.N.; He, C.B.; Chen, B.C.; Huang, X.C. Experimental Study on Physical-Mechanical Properties of Expansive Soil Improved by Multiple Admixtures. Adv. Civ. Eng. 2021, 2021, 15. [Google Scholar] [CrossRef]
Figure 1. Locations of the sampling sites. (a) China. (b) Xinjiang Uighur Autonomous Region. (c) Eastern Junggar Coalfield.
Land 14 00036 g001
Figure 2. Real view of the study area. (a) Aerial drone view of the study area. (b) Local surface map. (c) Section view.
Land 14 00036 g002
Figure 3. Experimental process flow diagram.
Land 14 00036 g003
Figure 4. Homemade compaction device. (a) Actual image. (b) Schematic diagram.
Land 14 00036 g004
Figure 5. Mini vane shear apparatus.
Land 14 00036 g005
Figure 6. Miniature wind tunnel test apparatus. (a) Actual image. (b) Schematic diagram.
Land 14 00036 g006
Figure 7. Compaction curves of soil samples with varying fly ash proportions.
Land 14 00036 g007
Figure 8. Relationship curves among optimal moisture content, maximum dry density, and fly ash proportion.
Land 14 00036 g008
Figure 9. Fly ash proportion and shear strength curve.
Land 14 00036 g009
Figure 10. The relationship curve between the shear strength of soil with different fly ash contents and vertical pressure.
Land 14 00036 g010
Figure 11. The relationship curves between cohesion, internal friction angle, and fly ash content.
Land 14 00036 g011
Figure 12. Water content and shear strength curve.
Land 14 00036 g012
Figure 13. The relationship curve between the shear strength of soil at different water contents and vertical pressure.
Land 14 00036 g013
Figure 14. The relationship curves between cohesion, internal friction angle, and water content.
Land 14 00036 g014
Figure 15. The relationship curves between shear strength, bulk density, and the number of compaction cycles.
Land 14 00036 g015
Figure 16. Comparison of the material composition of gravel-layered soil before and after reconstruction. (a) The natural gravel-layered soil. (b) The reconstituted gravel-layered soil.
Land 14 00036 g016
Figure 17. Microstructural images of soil sample with 0% fly ash content. (a) 500×. (b) 1000×.
Land 14 00036 g017
Figure 18. Microstructural images of soil sample with 15% fly ash content. (a) 500×. (b) 1000×.
Land 14 00036 g018
Figure 19. Cumulative wind erosion relationship diagram.
Land 14 00036 g019
Table 1. Basic physical parameters of soil from the gravel layer.
In Situ Water Content (%)In Situ Density (g/cm3)Saturated Water Content (%)Percentage of Particle Size Composition (%)
>0.0750.075–0.002<0.002
11.58 ± 0.061.51 ± 0.0218.61 ± 0.0441.022.037.0
Table 2. The selected chemical composition of fly ash.
Chemical CompositionSiO2Al2O3Fe2O3CaOK2OTiO2SO3Na2OMgOP2O5
Content (%)51.228.97.34.72.72.11.10.60.50.5
Table 3. Heavy metal composition and content of fly ash.
Heavy MetalCadmiumMercuryArsenicCopperLeadChromiumNickelZinc
Content (μg/kg)168.1867.0614,481.0419,680.2115,619.5152,290.8025,689.1063,024.80
Standard (μg/kg)300130040,00050,00070,000150,00060,000200,000
Table 4. Shear strength of the soil crust of the gravel layer in the Eastern Junggar Coalfield.
Detection PointShear Stress (kPa)Average Value (kPa)
Jiangjunmiaodetection point 148.9327.7
detection point 240.91
Wucaiwandetection point 137.87
detection point 237.09
Dajingdetection point 129.03
detection point 228.50
Xiheishandetection point 122.77
detection point 210.79
Laojunmiaodetection point 18.89
detection point 212.21
Disclaimer/Publisher’s Note: The statements, opinions and data contained in all publications are solely those of the individual author(s) and contributor(s) and not of MDPI and/or the editor(s). MDPI and/or the editor(s) disclaim responsibility for any injury to people or property resulting from any ideas, methods, instructions or products referred to in the content.

