Article

Spatial Heterogeneity of Planning Influencing Factors on Residents’ SWB in Historic Conservation Area of China: Three Cases from Yangzhou

by
Yue Chen
,
Yiting Shen
and
Can Wang
*
Department of Urban and Rural Planning, School of Architecture, Soochow University, Suzhou 215006, China
*
Author to whom correspondence should be addressed.
Land 2025, 14(1), 29; https://doi.org/10.3390/land14010029
Submission received: 30 November 2024 / Revised: 23 December 2024 / Accepted: 25 December 2024 / Published: 27 December 2024

Abstract

:
Cultural heritage conservation planning in China advocates for differentiated planning measures tailored to different heritage elements with diverse values, functions, and locations. However, limited research has focused on the spatial heterogeneity of these multi-dimensional planning measures and the subjective well-being (SWB) of residents within these protected historic districts. This study investigates the spatial differentiation pattern and mechanism of residents’ SWB in three Historic Conservation Areas of Yangzhou, China, by employing a combination of spatial data digitization and data spatialization methods. The findings reveal: (1) All three cases demonstrate notable spatial differentiation in terms of residents’ SWB; (2) A common feature across the three cases is that strengthening community participation, tourism traffic control, and housing improvement projects can significantly improve residents’ SWB. But proximity to historic buildings has little explanatory power for the spatial differentiation of residents’ SWB; (3) Planning factors of traffic accessibility, public facility accessibility, park service areas, and NIMBY areas of public toilets, have significant spatial heterogeneous effects on residents’ SWB across the three cases, which are closely correlated to the varying degrees of tourism development within each district. The findings of this study provide targeted planning strategies for historic districts with different functional orientations and heritage conservation duties, aimed at more effectively enhancing the well-being of heritage site residents by utilizing limited public resources.

1. Introduction

China’s cultural heritage conservation has undergone a systematic shift at the end of the 20th century, transitioning from a focus on individual cultural relics to a prioritization of large-scale historic cities [1,2]. Up to now, a three-tiered conservation system has been in place, encompassing historic cities, historic districts, and historic buildings [3]. Furthermore, statutory urban master plans are supported by specialized heritage conservation frameworks, including Historic City Conservation Planning and Historic District Conservation Planning. These serve as comprehensive public policies designed to guide cultural heritage conservation and reuse activities in heritage sites, while promoting local economic revitalization and enhancing the well-being of residents in a balanced manner [4].
Under this framework, the existing literature on the impact of urban planning on the well-being of heritage site residents can be categorized into two levels of analysis. The first level examines the contradiction and unity among the three main goals of cultural heritage conservation, local economic revitalization, and the enhancement of residents’ well-being [5,6,7]. Especially in institutional environments where local voices are relatively marginalized, it is essential to strengthen resident participation and prioritize socially oriented initiatives [8,9,10,11]. In turn, the improvement of well-being not only enhances residents’ sense of meaning and harmony in personal development but also fosters place attachment, which in turn encourages positive attitudes of residents toward tourism development as well as cultural heritage conservation [12,13,14]. The second level focuses on the specific effects of widely implemented conservation and (re)development activities on residents’ well-being [15,16]. For instance, heritage tourism can bring positive outcomes, including economic growth, employment opportunities, cultural revitalization, infrastructure development, and improved social services. At the same time, without foresighted management, these activities may also result in negative consequences, such as over-commercialization, forced population displacement, increased crime rates, and cultural erosion [17,18]. Additionally, another stream of research assesses the social performance of public policies targeting heritage sites, such as conservation planning, by developing comprehensive indicator systems [19,20,21].
The existing literature has extensively examined the impact of various planning measures on the well-being of heritage site inhabitants. However, limited attention has been given to the spatial differentiation of residents’ subjective well-being (SWB) and its spatial correlation with these planning measures. In practice, China’s historic district conservation encompasses a diverse array of planning measures that are respectively driven by cultural, economic, and social goals. Additionally, these planning measures exhibit differences in terms of spatial distribution, construction timing, investment intensity, and operational cycles. Consequently, they may exert significant spatial heterogeneity effects on residents’ subjective well-being. However, this aspect has received little attention in the existing literature.
Given the diversity of planning measures and the complexity of their resultant social impacts, precisely assessing the spatial effects of cultural heritage conservation planning on residents’ SWB has emerged as an important research topic. This paper examines three historic districts in Yangzhou, China, with the aim of investigating the spatial heterogeneity of multi-dimensional planning measures in terms of residents’ SWB. Specifically, the classical multiple regression model is used to organize multivariate variables, including residents’ SWB (dependent variable), multi-dimensional planning measures (independent variables), and control variables such as residents’ individual attributes. Second, a series of data spatialization and digitization methods are employed to describe the spatial differentiation pattern of the dependent variable and the independent variables. Finally, by integrating the geographic detector and multiple regression analyses, we identify the planning determinants of residents’ SWB along with their explanatory power ranking in each case and influence directions. Based on these findings, supplemented by a literature review and in-depth resident interviews, this paper investigates the spatial impact mechanisms of planning measures with respect to residents’ SWB, and proposes tailored planning suggestions for each analyzed historic district.

2. Literature Review

2.1. Influencing Factors of SWB

Based on the existing literature, the factors influencing residents’ subjective well-being can be categorized into four dimensions: individual attributes, social support factors, living environment factors, and macro-contextual factors (Table 1).

2.1.1. Individual Attribute

Firstly, resident attributes include basic demographic factors such as gender, age, education level, marital status, income level, and number of children [22]. They also encompass physical and mental health conditions, personality traits—such as extroversion, introversion, and agreeableness [23]—and work status, religious beliefs, and political orientation [22]. Furthermore, personal aspirations play a significant role in subjective well-being [24].

2.1.2. Social Support

Social support factors refer to the material and emotional assistance provided by family members, friends, neighbors, and other social groups, which can alleviate psychological stress and thereby enhance individual well-being [23]. For instance, participating in social organizations helps individuals establish closer, more diverse social networks, fosters the accumulation of social capital, and ultimately boosts personal well-being. In smaller spatial units, a sense of community altruism tends to prevail, where stronger social bonds encourage individuals to prioritize the well-being of others, regardless of their own position [25]. But studies have shown that the impact of social support on well-being is moderated by the individual’s socioeconomic status [26,27,28].

2.1.3. Living Environment

Numerous studies have demonstrated that the built environment has a lasting and significant impact on an individual’s subjective well-being [29,30,31]. The author categorizes the factors of the built environment into physical and non-physical components.
Physical factors of the built environment include housing, housing support facilities, road infrastructure, public facilities, public spaces, as well as broader urban ecological conditions, residential location, traffic convenience, and the accessibility of large public facilities and public spaces [32,33].
Non-physical factors of the built environment include the intangible cultural environment of daily living spaces, community services, and the level of community governance and participation [5,10]. For instance, in historic towns, the rich cultural heritage and the cultural and social environment it supports play a significant role in enhancing residents’ well-being [13,34]. Additionally, the demographic composition of the community and the neighborhood effects it generates also have a crucial impact on residents’ subjective well-being [24,26,35].

2.1.4. Macro Background

Some scholars argue that a country’s or region’s economic development level, cultural environment, employment conditions, government governance, development policies, and social welfare all influence individual well-being [25,36]. However, other researchers have found that there is little difference in happiness levels between residents of wealthy and poor countries, suggesting that macro-level factors have a limited impact on individual well-being. As economies grow, material needs evolve toward more enjoyment-oriented demands, resulting in diminishing returns from material conditions in terms of happiness. Simultaneously, increasing social inequality triggers relative deprivation, which offsets the benefits of economic growth. As a result, subjective well-being stagnates rather than increases with economic growth [37].

2.2. Impacts of Heritage Conservation Planning on Residents’ SWB

Based on the literature review above, it is clear that heritage conservation planning primarily impacts residents’ SWB through interventions in the “living environment factors” of heritage sites and the broader urban environment. These interventions can lead to both positive and negative effects on local society (Table 2).

2.2.1. Positive Impacts

(1) Socially-oriented infrastructure upgrades, household connections to municipal pipelines, traffic calming measures, housing repair subsidies, and other planning interventions designed to improve the living environment can significantly enhance the life satisfaction and subjective well-being of residents in historic districts [38,39].
(2) Even tourism development projects driven by economic efficiency can indirectly improve the quality of life for local residents by upgrading infrastructure, enhancing the environmental aesthetics of commercial streets targeted at tourists, and providing fire safety facilities and sanitation services that exceed the standards of typical residential communities [18,40];
(3) Additionally, the development of cultural industries can help increase employment opportunities for local residents, drive up asset prices, and boost rental income for homeowners, thereby enhancing economic well-being [41]. The involvement of market forces can support the compatible livelihood development of heritage site communities, compensating for the shortcomings of government resources in public services [42];
(4) Culturally-oriented adaptive reuse of historic buildings, museum projects, and the restoration of historical gardens and water systems can improve residents’ physical and mental well-being by providing free access to public cultural facilities and blue-green spaces, thereby enhancing their overall happiness and quality of life [16,43,44,45];
(5) Finally, extensive research indicates that public participation mechanisms in the planning and implementation processes can not only help residents secure more community development resources and share in the benefits generated by cultural heritage reuse but also foster a sense of ownership and belonging, thereby enhancing residents’ subjective well-being [46,47]. However, some critical studies argue that public participation may lead to heritage degradation and reduce economic efficiency [48,49].

2.2.2. Negative Impacts

(1) In developing countries experiencing rapid urbanization and industrialization, economic development pressures often lead to forced relocation strategies in historic districts, aimed at maximizing land redevelopment profits. This, in turn, undermines the well-being of displaced residents and exacerbates social inequities [50,51,52];
(2) Tourism development can result in a situation where the combined demand from residents and tourists exceeds the local infrastructure’s capacity, leading to issues such as waste pollution, noise pollution, and traffic congestion, all of which disrupt the daily lives of residents [50,53,54];
(3) Even cultural industry projects with initially high social performance can result in over-commercialization and tourism gentrification. These issues gradually displace community shops, social spaces, and public service facilities that serve local residents, leading to higher living costs and a decline in the quality of life for the local population [55,56];
(4) Excessively strict construction controls and heritage preservation requirements that heavily restrict residents’ ability to modify and improve their homes can drive relatively wealthier families to move out [57]; As original residents gradually leave, historically vibrant neighborhoods transform into “empty shells,” visited only by tourists during their leisure time. Consequently, the value of historical sites as “living heritage” is diminished [58,59];
(5) Elite-led preservation and development initiatives often overlook the cultural identity of local residents, neglecting bottom-up community awareness and local wisdom. While these efforts may yield short-term success in cultural protection, they can negatively affect the emotional connection and feedback from local residents. Without the support of the community, the sustainable development of heritage sites loses a vital internal driving force [9,60].
In summary, planning measures with different value orientations and objectives have varying impacts on residents’ well-being, often leading to a complex coexistence of both positive and negative effects. However, there is limited research comparing these complex planning measures in terms of their relative influence and cumulative effects on residents’ well-being within the same historical district. Notably, there is a lack of spatial analysis that examines the spatial heterogeneous effects of preservation planning, particularly those focused on physical space interventions, on residents’ well-being.

3. Methodology

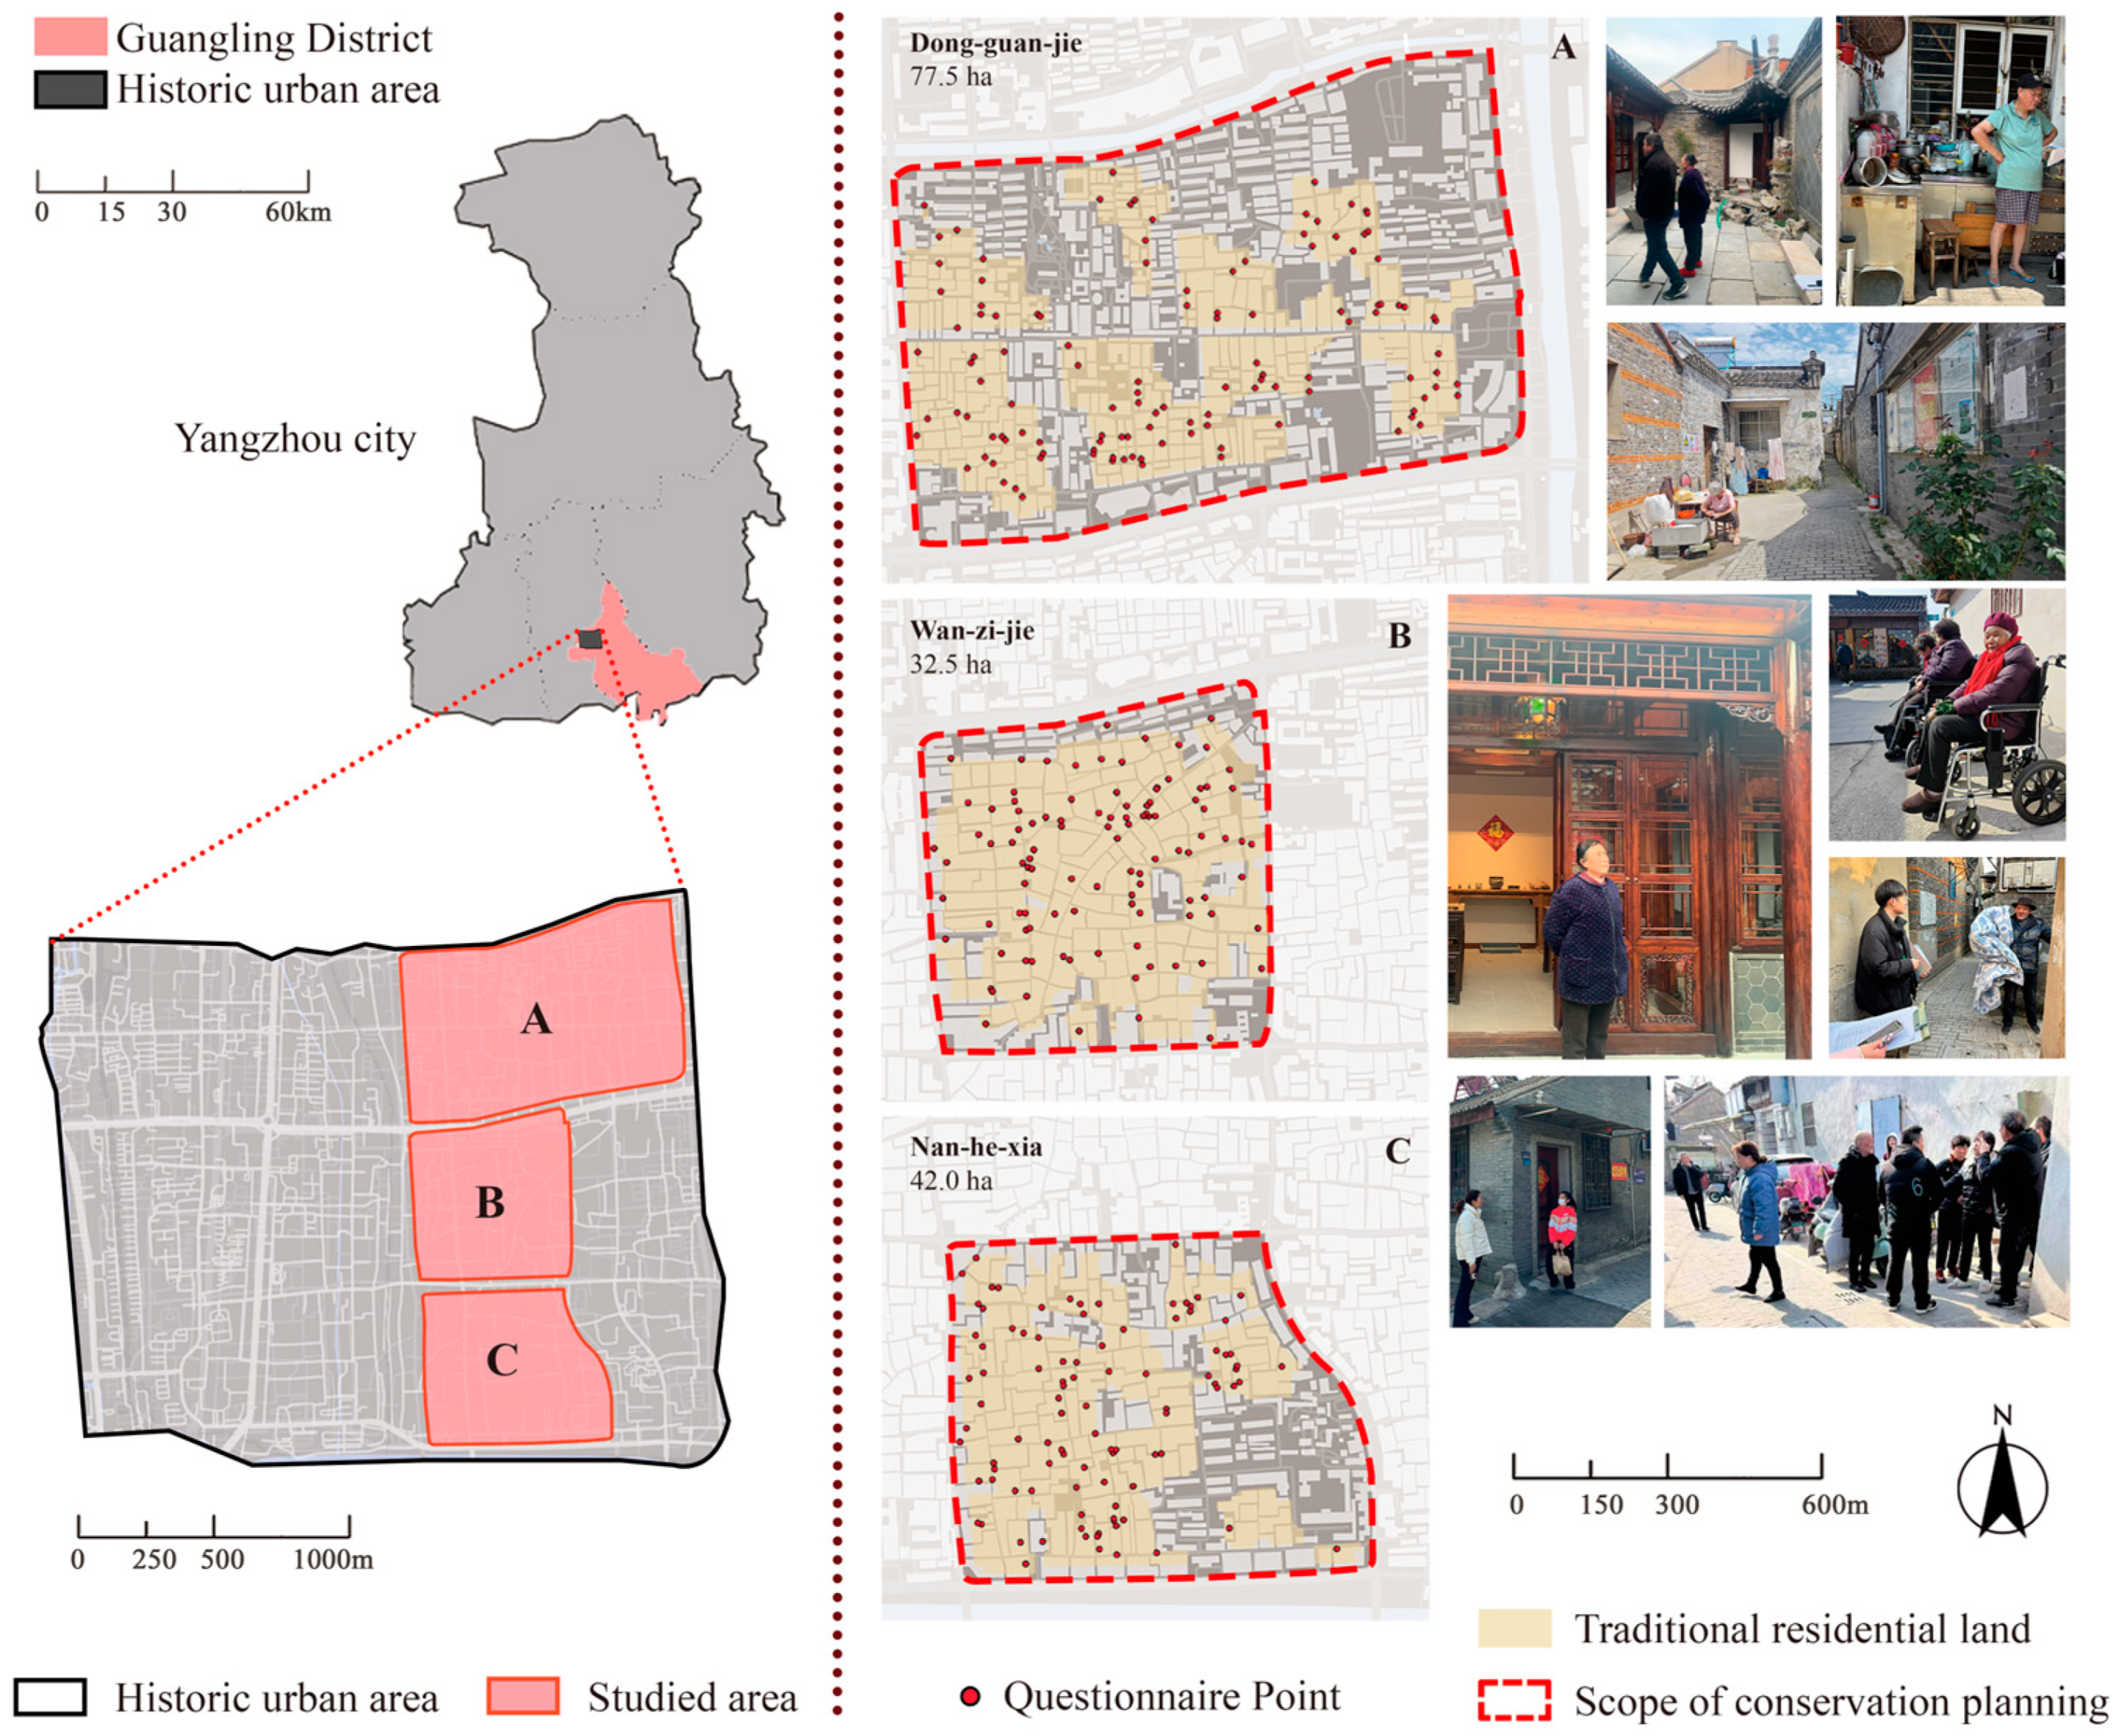
3.1. Study Area and Data Source

Yangzhou, located in the central part of Jiangsu Province, China, was listed as one of the first batch of National Historic Cities in 1982. Within the old city area of Yangzhou, several historic conservation areas are distributed. These areas serve not only as daily living spaces for local residents but also as popular destinations for tourists, attracting both sightseeing and consumption activities. According to government data, in 2001, the Yangzhou Municipal Government began preparing a regulatory plan for the old city, which clearly defined the guiding principles for overall preservation. This avoided large-scale demolition and forced population relocation within the old city, laying a solid foundation for subsequent preservation efforts in historical districts.
This study focuses on three historic districts within the Ming and Qing old city area of Yangzhou. From north to south, they are: the Dongguan Historic Conservation Area (hereafter District A), the Wanzi Street Historic Conservation Area (hereafter District B), and the Nanhexia Historic Conservation Area (hereafter District C) (Figure 1).
As shown in the figure above:
District A covers an area of 77.5 hectares, with traditional residential land covering 29.6 hectares, accounting for 38.2% of the total area. It is situated in the northeast corner of the ancient city of Yangzhou, adjacent to the historic canal and its eastern entrance, boasting excellent transportation infrastructure. During the Ming and Qing Dynasties, District A emerged as a pivotal center for commerce, craftsmanship, and religious culture in ancient Yangzhou. Functionally, it is designated as a historical area primarily characterized by commercial and residential uses. The diverse demographic composition of Block A includes affluent merchants alongside common artisans and citizens. Consequently, the preserved architectural heritage encompasses grand mansions and private gardens, many of which have been repurposed into public cultural venues and parks, as well as a significant number of small shops and traditional residences. Within the middle of District A lies Dong-guan-jie, an east-west thoroughfare that serves as both the gateway and namesake for this district.
District B spans 32.5 hectares, with 25.7 hectares dedicated to traditional residential land, accounting for 79.1% of the total area. It is located in the east-central part of the old town, with general traffic conditions. Historically, District B was a place where ordinary citizens lived together. Therefore, among the preserved historical buildings, small traditional residential buildings are the main ones. The outer street space is relatively narrow, and there are no large private gardens or open Spaces. Inside the block, there is a diagonal street Wan-zi-jie from the northeast corner to the southwest corner, which is the spatial character and the source of the name of District B.
District C has a conservation area of 42.0 hectares, with traditional residential land covering 23.8 hectares, accounting for 56.7% of the total area. It is situated in the southeastern quadrant of the ancient city, adjacent to the ancient canal and its secondary entrance. Despite its distance from the city center, this area boasts a tranquil environment and well-developed transport links. Consequently, in the Ming and Qing Dynasties, District C became a preferred residence for affluent salt merchants. To this day, it retains numerous well-preserved salt merchant residences and private gardens. The predominant residential types are large courtyard houses and garden residences. The external streets exhibit a harmonious spatial scale, featuring several concentrated street squares and open spaces that serve as vital venues for community interaction and activities.
The research data consist of two parts: the first includes preservation planning documents, policy records, and departmental interview transcripts provided by the government. The second component includes data from survey questionnaires and selected resident interviews conducted in the study area. From March to May 2024, the author and the research team conducted an equidistant sampling survey across the three districts, ensuring that every traditional residential area was fully covered. A total of 350 questionnaires were distributed, with 322 valid responses collected, yielding a valid response rate of 92%. Each questionnaire gathered information on the respondent’s family and housing situation, their overall life satisfaction, and satisfaction with specific planning measures. Additionally, each questionnaire was linked to the geographic coordinates of the respondent’s residence and the street name, allowing for spatial analysis.

3.2. Research Design

This study uses residents’ SWB as the dependent variable and multi-dimensional planning measures as the independent variables, with a focus on examining the explanatory power of planning factors on the spatial differentiation of residents’ SWB. Additionally, based on a comparative analysis of three cases, the study explores the spatial heterogeneous effects of diverse planning measures on residents’ SWB under different conservation and development models.
First, the spatial differentiation pattern of the dependent variable is described. Based on the characteristics of the equidistant sampling data, the Kriging interpolation method is used to predict and describe the spatial pattern of residents’ SWB across the entire district. This analysis is conducted using ArcGIS Pro 3.2.0.
Next, the specific content and quantitative indicators of the independent variables are identified, and the spatial patterns of each independent variable are described. The former is derived through the analysis of planning documents. In addition to the data directly obtained from the survey, several spatial analysis methods, such as the origin-destination cost matrix, service area method, and kernel density estimation, are applied to spatialize the implementation effects of the planning measures. More importantly, each sample’s exposure to planning interventions is transformed into quantifiable values for further analysis.
Finally, the Geographical Detector method is used to assess the explanatory power of multi-dimensional planning measures on the spatial differentiation of residents’ SWB. The Geographical Detector method is implemented using GeoDetector 2.0. Additionally, a multiple linear regression model is employed to determine the direction of positive and negative impacts of planning measures on residents’ SWB, using Stata/MP 18.0. Based on these analyses, a comparative case study is conducted to summarize the spatial heterogeneous effects of key planning measures on residents’ SWB under different conservation and development models.

3.3. Dependent Variable

In current academic research, the measurement of SWB primarily relies on the self-reporting inquiry method. Depending on the number of items included, these scales can be classified into single-item scales and multi-item scales. The main advantage of single-item scales is their simplicity, allowing for quick completion and easy comprehension. However, their primary disadvantage is their lack of comprehensiveness and relatively lower reliability, making them more susceptible to random factors. In contrast, multi-item scales are more comprehensive and reliable, offering a detailed assessment of SWB. However, they require more time to complete, are more complex, and can be more challenging for respondents to understand.
Considering the high proportion of elderly residents, as well as the significant presence of illiterate and low-education individuals in historic districts, their cognitive and comprehension abilities regarding survey questionnaires are often limited. Therefore, a single-item scale was adopted to measure residents’ SWB. During the initial design of the scale, the Cantril Self-Anchoring Scale (SAS) was referenced. However, it was observed during the survey that respondents in China are more accustomed to evaluating their SWB using a percentage scale and found the 11-step structure of the SAS method less intuitive. As a result, a 0–100 point percentage-based single-item scale was ultimately chosen as the method for measuring SWB in this study.

3.4. Independent Variable

Based on the literature review, planning measures that have a significant impact on residents’ SWB were selected as the key independent variables for this study. These measures are divided into two main categories: non-physical planning measures and physical planning measures.
In terms of non-physical planning measures, the focus is primarily on the content of community development planning. Ultimately, two factors, “community planning service” and “community participation”, were selected. A 5-point Likert scale was used to collect data through the survey. For indicator evaluation, “quality of community planning service” was coded as follows: 1 = very low quality; 5 = very high quality. The “degree of community participation” was coded as: 1 = low level of participation; 5 = high level of participation.
In terms of physical planning measures, considering that the majority of historic districts are “open block communities”, residents’ SWB is influenced not only by the conservation planning of the historic district itself and historic building conservation projects but also by broader interventions from the macro-level historic city conservation planning. Therefore, physical planning measures are divided into three scales: city, community, and household, corresponding to the three levels of China’s cultural heritage conservation system: historic cities, historic districts, and historic buildings. Given the complexity of the implementation effects of physical planning measures, the following section will provide a detailed explanation of the design of their evaluation indicators, as well as the specific quantification methods used:

3.4.1. Physical Planning Measures on City Scale

At the city scale, the focus is on four-dimensional planning measures within the historic urban area: transportation planning, public facility planning, public space planning, and sanitation facility planning. The indicator design and data quantification methods are outlined in the table below (Table 3):
(1) The “traffic accessibility” indicator reflects the impact of traffic control measures in the historic urban area and historic districts on residents’ daily lives. Specifically, the Origin-Destination (OD) cost matrix method is used to spatialize the data on traffic accessibility.
(2) The “facility accessibility” indicator reflects the outcomes of public facility planning. Facility types are categorized into: tourist facilities, resident facilities, and shared facilities. Specifically, network-based open-source POI data and ArcGIS Pro 3.2.0 are used to perform kernel density analysis, assigning accessibility values to the samples.
(3) The “service area of large park and small park” indicator reflects the implementation effects of public space planning. Specifically, park service area analysis is conducted based on park planning data provided by government departments. Following existing studies, the service radius for large parks is set at 500 m, and for small parks, it is set at 80 m [61]. The final classification data assign samples either within the service area or outside the service area.
(4) The “NIMBY area of public toilet” (also considered as a service area) indicator reflects the impact of public toilets on residents living in close proximity. Similarly, the service area analysis method is applied, with the odor dispersion radius set at 50 m, based on existing literature, to assess the spatial influence of public toilets on nearby residents.
It should be noted that, based on data provided by government departments, there are no large waste transfer stations within or around the study area, only small waste collection bins, which have 100% coverage. As a result, the spatial distribution of waste collection bins is not included in this study. Additionally, due to the narrow roads in the historic urban area, even small parks and public toilets located outside the district can potentially affect residents living along the streets of historic districts. Therefore, the impact of small parks and public toilets is analyzed at the urban scale rather than the community scale.

3.4.2. Physical Planning Measures on Community Scale

At the community scale, the focus is on cultural heritage conservation, economic development planning, and the physical image and infrastructure renewal of historic districts. The corresponding evaluation indicators and quantification methods include:
(1) The “buffer zone of cultural relic” indicator reflects the impact of cultural relic conservation projects on surrounding residents. Specifically, following relevant regulations on the construction control requirements for surrounding environments, a 50 m buffer zone radius is set. The service area analysis method is similarly applied to assign values to the samples;
(2) The “commercialization of access street” indicator reflects the impact of economic development planning on residents’ SWB. This indicator includes five levels: 1 = Undeveloped internal streets and alleys; 2 = Sporadically developed internal streets and alleys; 3 = Partially developed internal streets and alleys; 4 = One-sidedly developed urban roads; 5 = Fully developed internal streets and alleys;
(3) The “physical upgrading of access street” indicator includes improvements in building facades, road surface updates, landscape design, as well as infrastructure projects such as underground electrical wiring and the construction of underground utility tunnels. Based on field surveys, this indicator is divided into 9 levels: 1 = Very low, 9 = Very high.

3.4.3. Physical Planning Measures on Household Scale

At the household scale, the focus is on basic housing improvement needs. The evaluation indicators include:
(1) Residents’ subjective satisfaction with the government’s provision of “housing maintenance” for traditional residences. In the survey, a Likert scale was used for evaluation, divided into 5 levels: 1 = Very dissatisfied, 5 = Very satisfied;
(2) Government housing security programs for vulnerable groups, which encourage residents of traditional homes to install modern flush toilets and provide subsidies for those willing to install them. Similarly, data were collected through the survey, with coding as follows: 1 = Has a flush toilet, 0 = Does not have a flush toilet.

3.5. Control Variable

Control variables include individual attributes, social support factors, and inherent human settlement environment factors not affected by conservation planning. Specifically: (1) Gender, age, Hukou, education level, and income education. (2) Family structure, neighborly relations, and length of residence. (3) Housing property rights, housing area, and quality of community planning service, unaffected by the participation of conservation planning. Detailed data can be found in Appendix A.
In addition, macro background factors were not considered in this study, as the three research objects are located in the same city and are spatially adjacent. Therefore, the macro-institutional, economic, and cultural backgrounds are similar, and thus no variables were set for these factors.

3.6. Spatial Analysis Method

3.6.1. Kriging Interpolation

The Kriging interpolation method is a spatial interpolation technique based on geostatistics, used to make unbiased, optimal estimates of unknown points within a limited area. This method is based on the semi-variogram and predicts the attributes of unknown points by analyzing the spatial correlation between known sample points [62,63]. The interpolation formula is as follows:
Z ( x 0 ) = i = 1 N λ i Z ( X i )
In this equation, Z ( x 0 ) is the value of the point to be predicted, Z ( X i ) represents the known sample point values, and λ i is the weight, determined by the spatial relationship between sample points and the target point. The fitting of the semi-variogram accurately describes the correlation between spatial points, ensuring that the interpolation results are both unbiased and optimal. In ordinary Kriging, the weights λ i depend on the spatial relationship between measurement points, the distance to the target point, and the model fitted to the spatial relationship of surrounding sample values.
Currently, the Kriging interpolation method is widely applied in fields such as geographic information systems, environmental science, soil research, and urban land value studies. In this study, the Kriging interpolation method will be used to spatially visualize the data of the dependent variable, residents’ SWB, in order to describe the spatial differentiation characteristics of residents’ SWB.

3.6.2. Origin-Destination Cost Matrix

Origin-Destination cost matrix (OD cost matrix) is a spatial analysis method based on urban road networks, used to assess traffic accessibility. This method utilizes the network analysis module in ArcGIS to assign different levels of road resistance within the urban road network. By setting various road nodes as starting points, it calculates the shortest paths or the shortest travel times to other nodes, thus quantifying the traffic accessibility of the region [64].
In this study, all road nodes within the scope of the historic urban area will be used as both origins and destinations. By calculating the traffic cost between these nodes, the traffic accessibility of the historic urban area will be comprehensively evaluated. Based on the analysis results, interpolation methods will be applied to generate a traffic accessibility distribution map of the historic urban area, illustrating the accessibility levels of different regions within the transportation network.

3.6.3. Service Area Method

The service area method is a spatial analysis technique used to evaluate the accessibility and impact range of facilities. It defines a service area by calculating the facilities that residents can reach within a specified time or distance. Service areas are typically centered around a facility, and their shape and size can vary depending on the distance measurement method used.
In this study, two methods are employed within the service area analysis: the buffer zone method and the network-based service area method. The buffer zone method generates a fixed-radius area around a point, line, or polygon to determine the facility’s service range, without considering the complexity of the road network. This method is used in this study to assess the impact range and NIMBY area of public toilets. The network-based service area method, on the other hand, utilizes the urban road network to evaluate facility accessibility by calculating the shortest path or actual travel time, resulting in a more accurate service area. This method is applied in this study to assess the accessibility of public parks, including large parks (with a service radius of 500 m) and small parks (with a service radius of 80 m), specifically reflecting the park’s service area for walking.

3.6.4. Kernel Density Estimation

Kernel Density Estimation (KDE) is a non-parametric statistical method used to estimate the probability density function of a dataset, and it is widely applied in the spatial analysis of point features. This method does not assume any specific distribution of the data. Instead, it generates an estimated probability density function by applying a kernel function to each data point and computing a weighted average. The result is a continuous spatial distribution that visually represents the relative concentration of point features in space, helping to identify areas of high or low density [65]. In this study, the kernel density method is applied to analyze the spatial patterns of different types of public facilities. By generating a spatial density analysis of the facilities, the accessibility indicator data for each sample are obtained, reflecting the distribution and concentration of various public amenities in the study area.

3.6.5. Geographical Detector

The Geographical Detector (Geo-Detector) is a statistical analysis tool used to detect spatial differentiation and its driving factors, and it is widely applied in fields such as land use, public health, and regional economics [66,67]. The core assumption of the Geo-Detector is that if a particular independent variable significantly influences the dependent variable, then the spatial distribution of both should exhibit similarity [68]. The Geo-Detector is composed of four modules: the Factor Detector, the Risk Area Detector, the Ecological Detector, and the Interaction Detector.
In this study, the Factor Detector and Interaction Detector functions of the Geographical Detector are primarily applied to analyze the explanatory power of planning factors influencing residents’ SWB. This includes the relative explanatory power ranking of single factors, as well as the ranking of relative explanatory power with the enhancing effects of dual factors. Additionally, since the Geographical Detector can only assess relative explanatory power (i.e., driving force, q × 100%) and cannot determine the direction of impact (positive or negative) of independent variables on the dependent variable, this study incorporates the traditional multiple regression model to help assess the positive or negative influence of planning factors on residents’ SWB.

4. Results

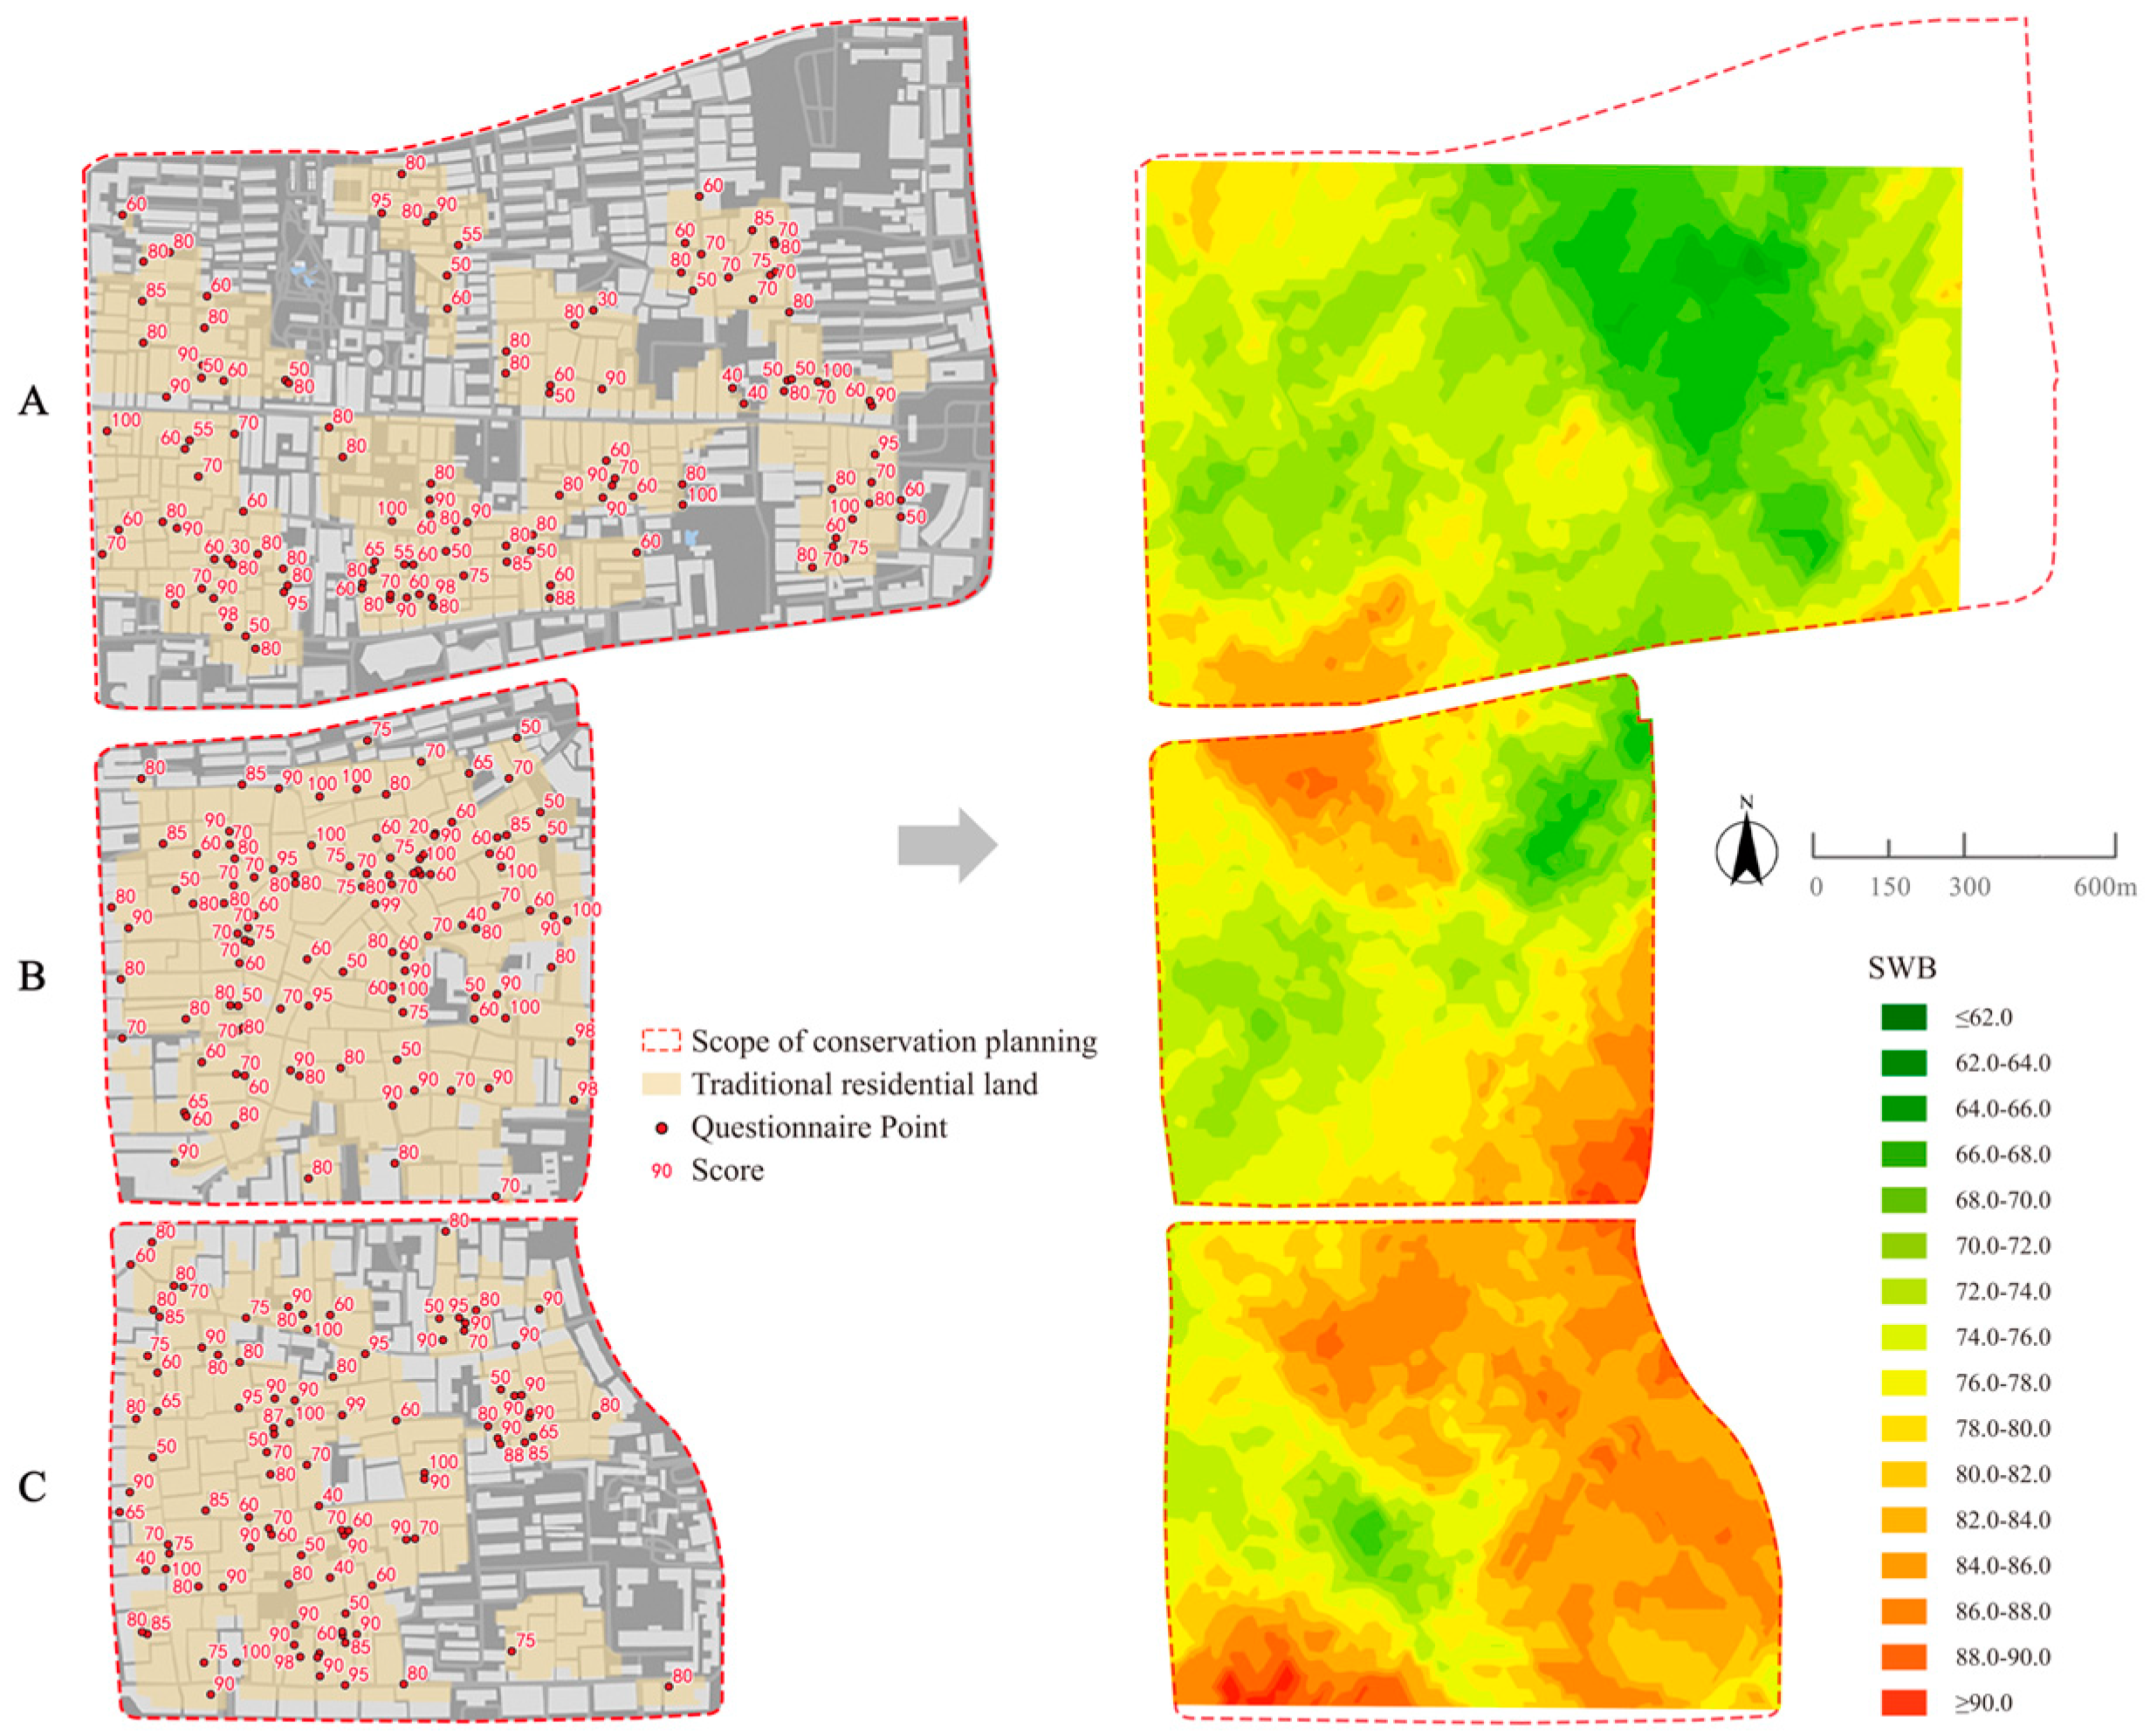
4.1. Spatial Differentiation of Residents’ SWB

First, simple arithmetic mean statistics were performed, yielding an overall average of 75.1 for all samples. The SWB rankings of the three districts are as follows: District A (mean = 72.6) < District B (mean = 74.8) < District C (mean = 78.5).
Next, Kriging interpolation analysis in ArcGIS was applied to spatialize the SWB data of residents in the three districts, aiming to describe the spatial pattern of residents’ SWB. The results show (Figure 2):
In District A, residents near the surrounding urban roads generally have higher SWB compared to those in the internal blocks. Specifically, the northwest, southwest, and southeast sections on the south side exhibit the highest SWB in the entire district;
In District B, residents in the northwest and southeast corners have the highest SWB, while residents along the main street, “Wanzi Street”, which connects the northeast corner to the southwest corner, report the lowest SWB;
In District C, residents near the urban roads on the southwest side have the highest SWB, while the entire eastern and northern parts also show relatively high SWB. In contrast, residents near the urban roads on the west side, as well as those in the southwestern-central blocks, have the lowest SWB.

4.2. Spatial Pattern of Planning Measures

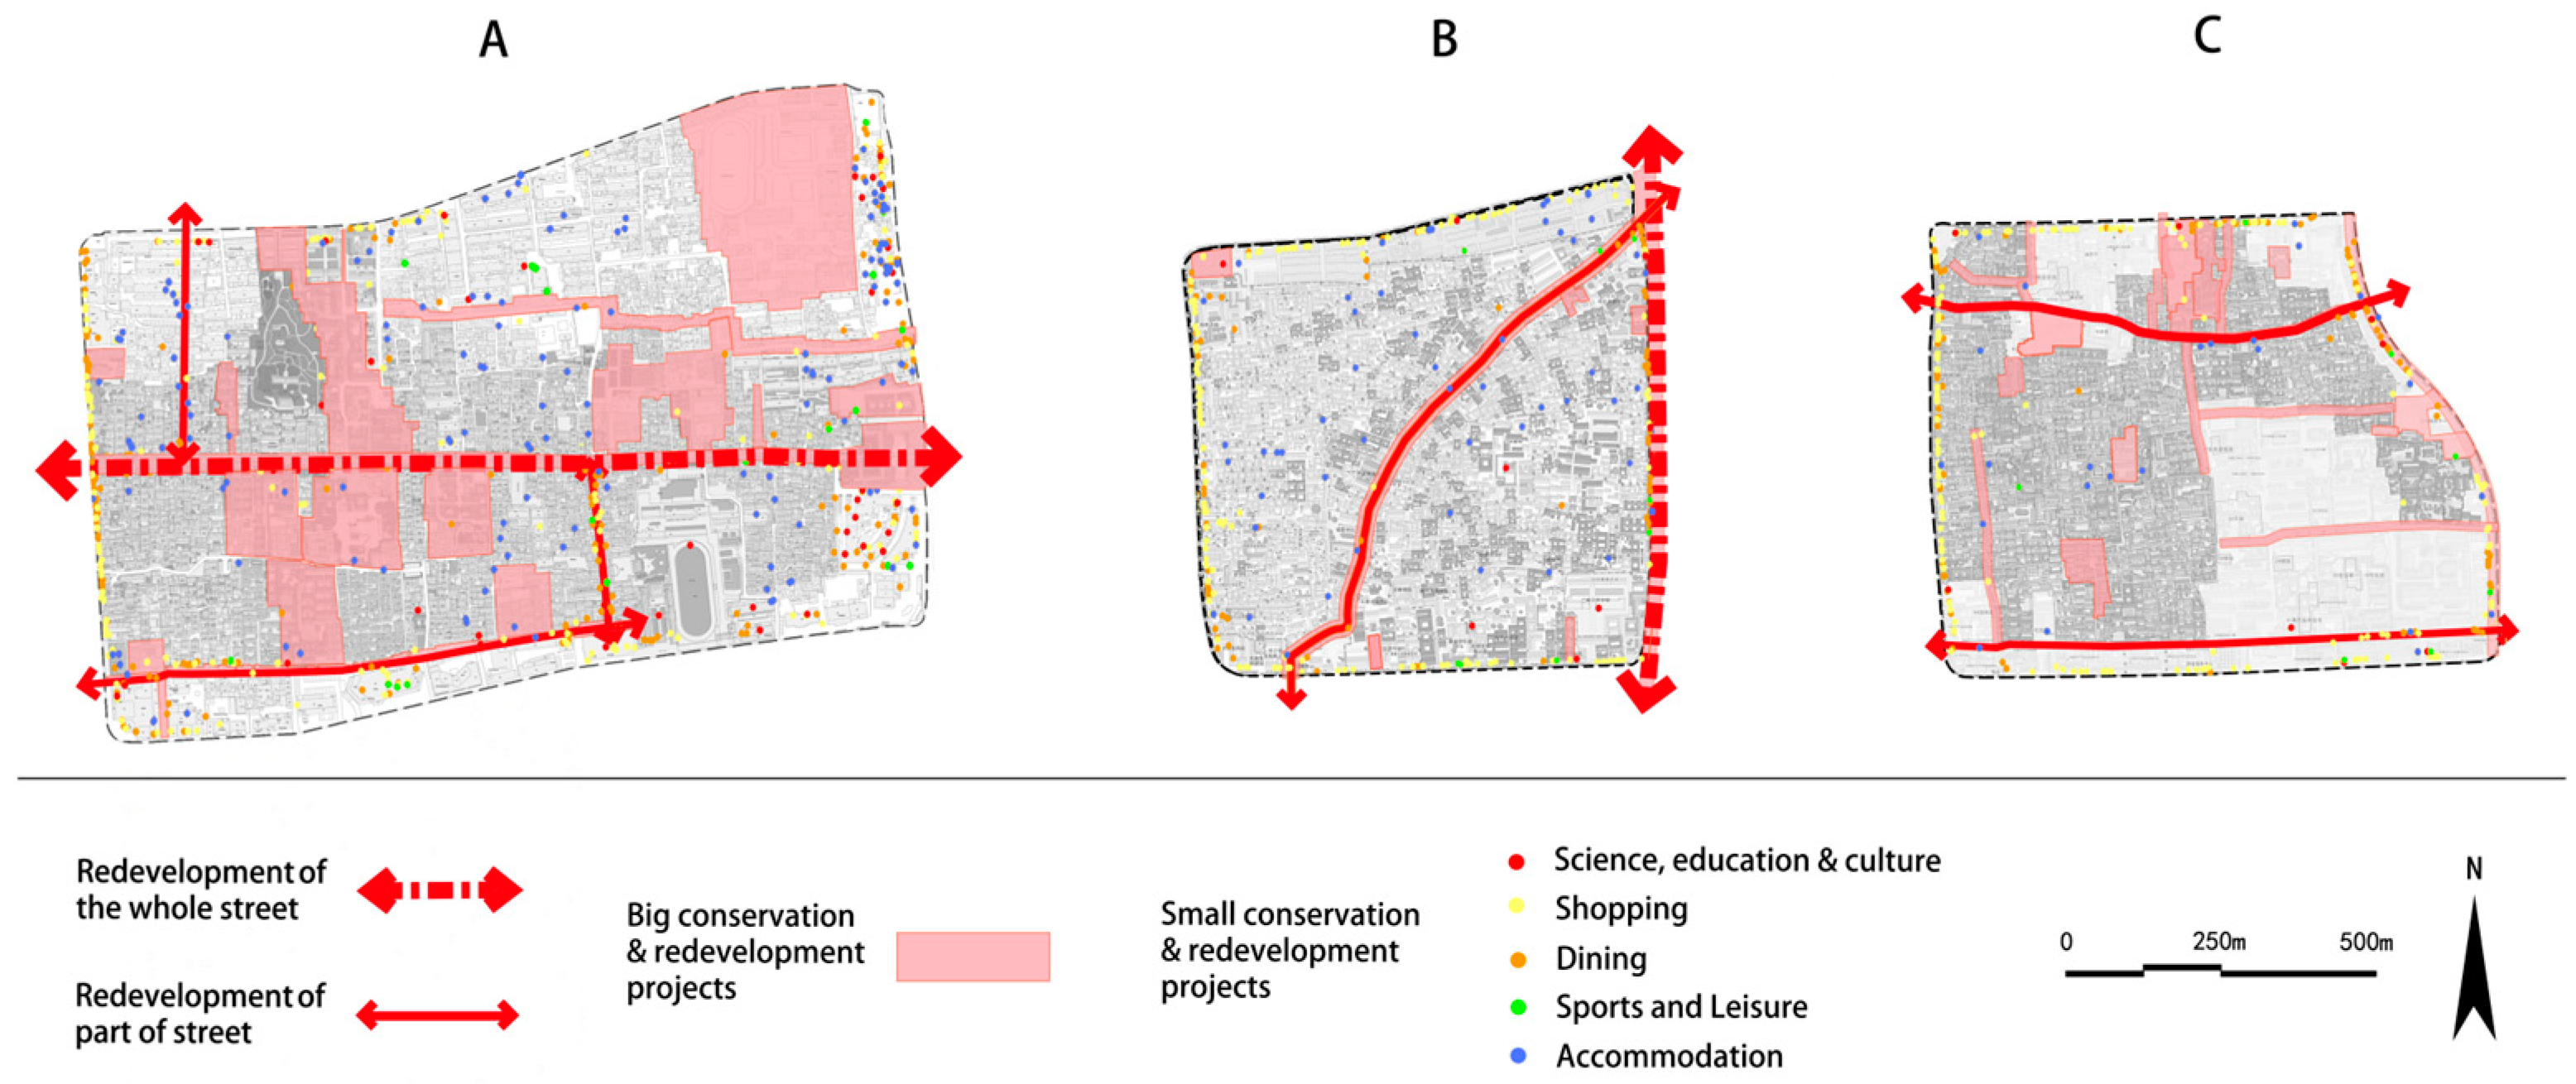
4.2.1. Overview of Planning Implementation

Based on the analysis of the conservation planning documents and relevant policy files, it is concluded that the three districts differ in several aspects, including the implementation period of the planning, functional positioning, degree of commercialization, pressure on cultural heritage conservation (mainly referring to the funding gap), as well as the scale, type, and spatial distribution of the conservation and (re)development projects (Figure 3):
District A has the longest duration of conservation planning, with implementation starting in 2007 and continuing for 17 years to date. Historically known as a prominent commercial street, its functional positioning is primarily centered around tourism and commerce. Currently, it has the highest degree of commercialization among the three districts, and the pressure for cultural heritage conservation is relatively low. In terms of the scope of implemented projects, both large and small-scale projects are numerous and distributed throughout the entire district.
District B has the shortest duration of conservation planning, with implementation beginning in 2016, making it only 8 years old. Historically a residential area for ordinary citizens, its functional positioning is primarily focused on traditional residential use. Currently, the degree of commercialization is the lowest, and the pressure for cultural heritage conservation is moderate. In terms of the scale of implemented projects, small-scale initiatives, mainly funded by residents and small businesses, dominate. The spatial distribution of these projects is concentrated along one side of the urban roads and the main street alleys of the district.
District C has a medium-length conservation planning duration, starting in 2010, and has been implemented for 14 years, falling between the other two districts. Historically a wealthy residential area, its functional positioning emphasizes traditional residential and cultural functions. Currently, the degree of commercialization is moderate compared to the other districts. Due to the abundance of cultural resources and low commercial income, the pressure for cultural heritage conservation is the highest. In terms of the scale of implemented projects, large-scale government-funded cultural projects dominate. These projects are primarily concentrated near the surrounding urban roads, with fewer projects within the district itself.

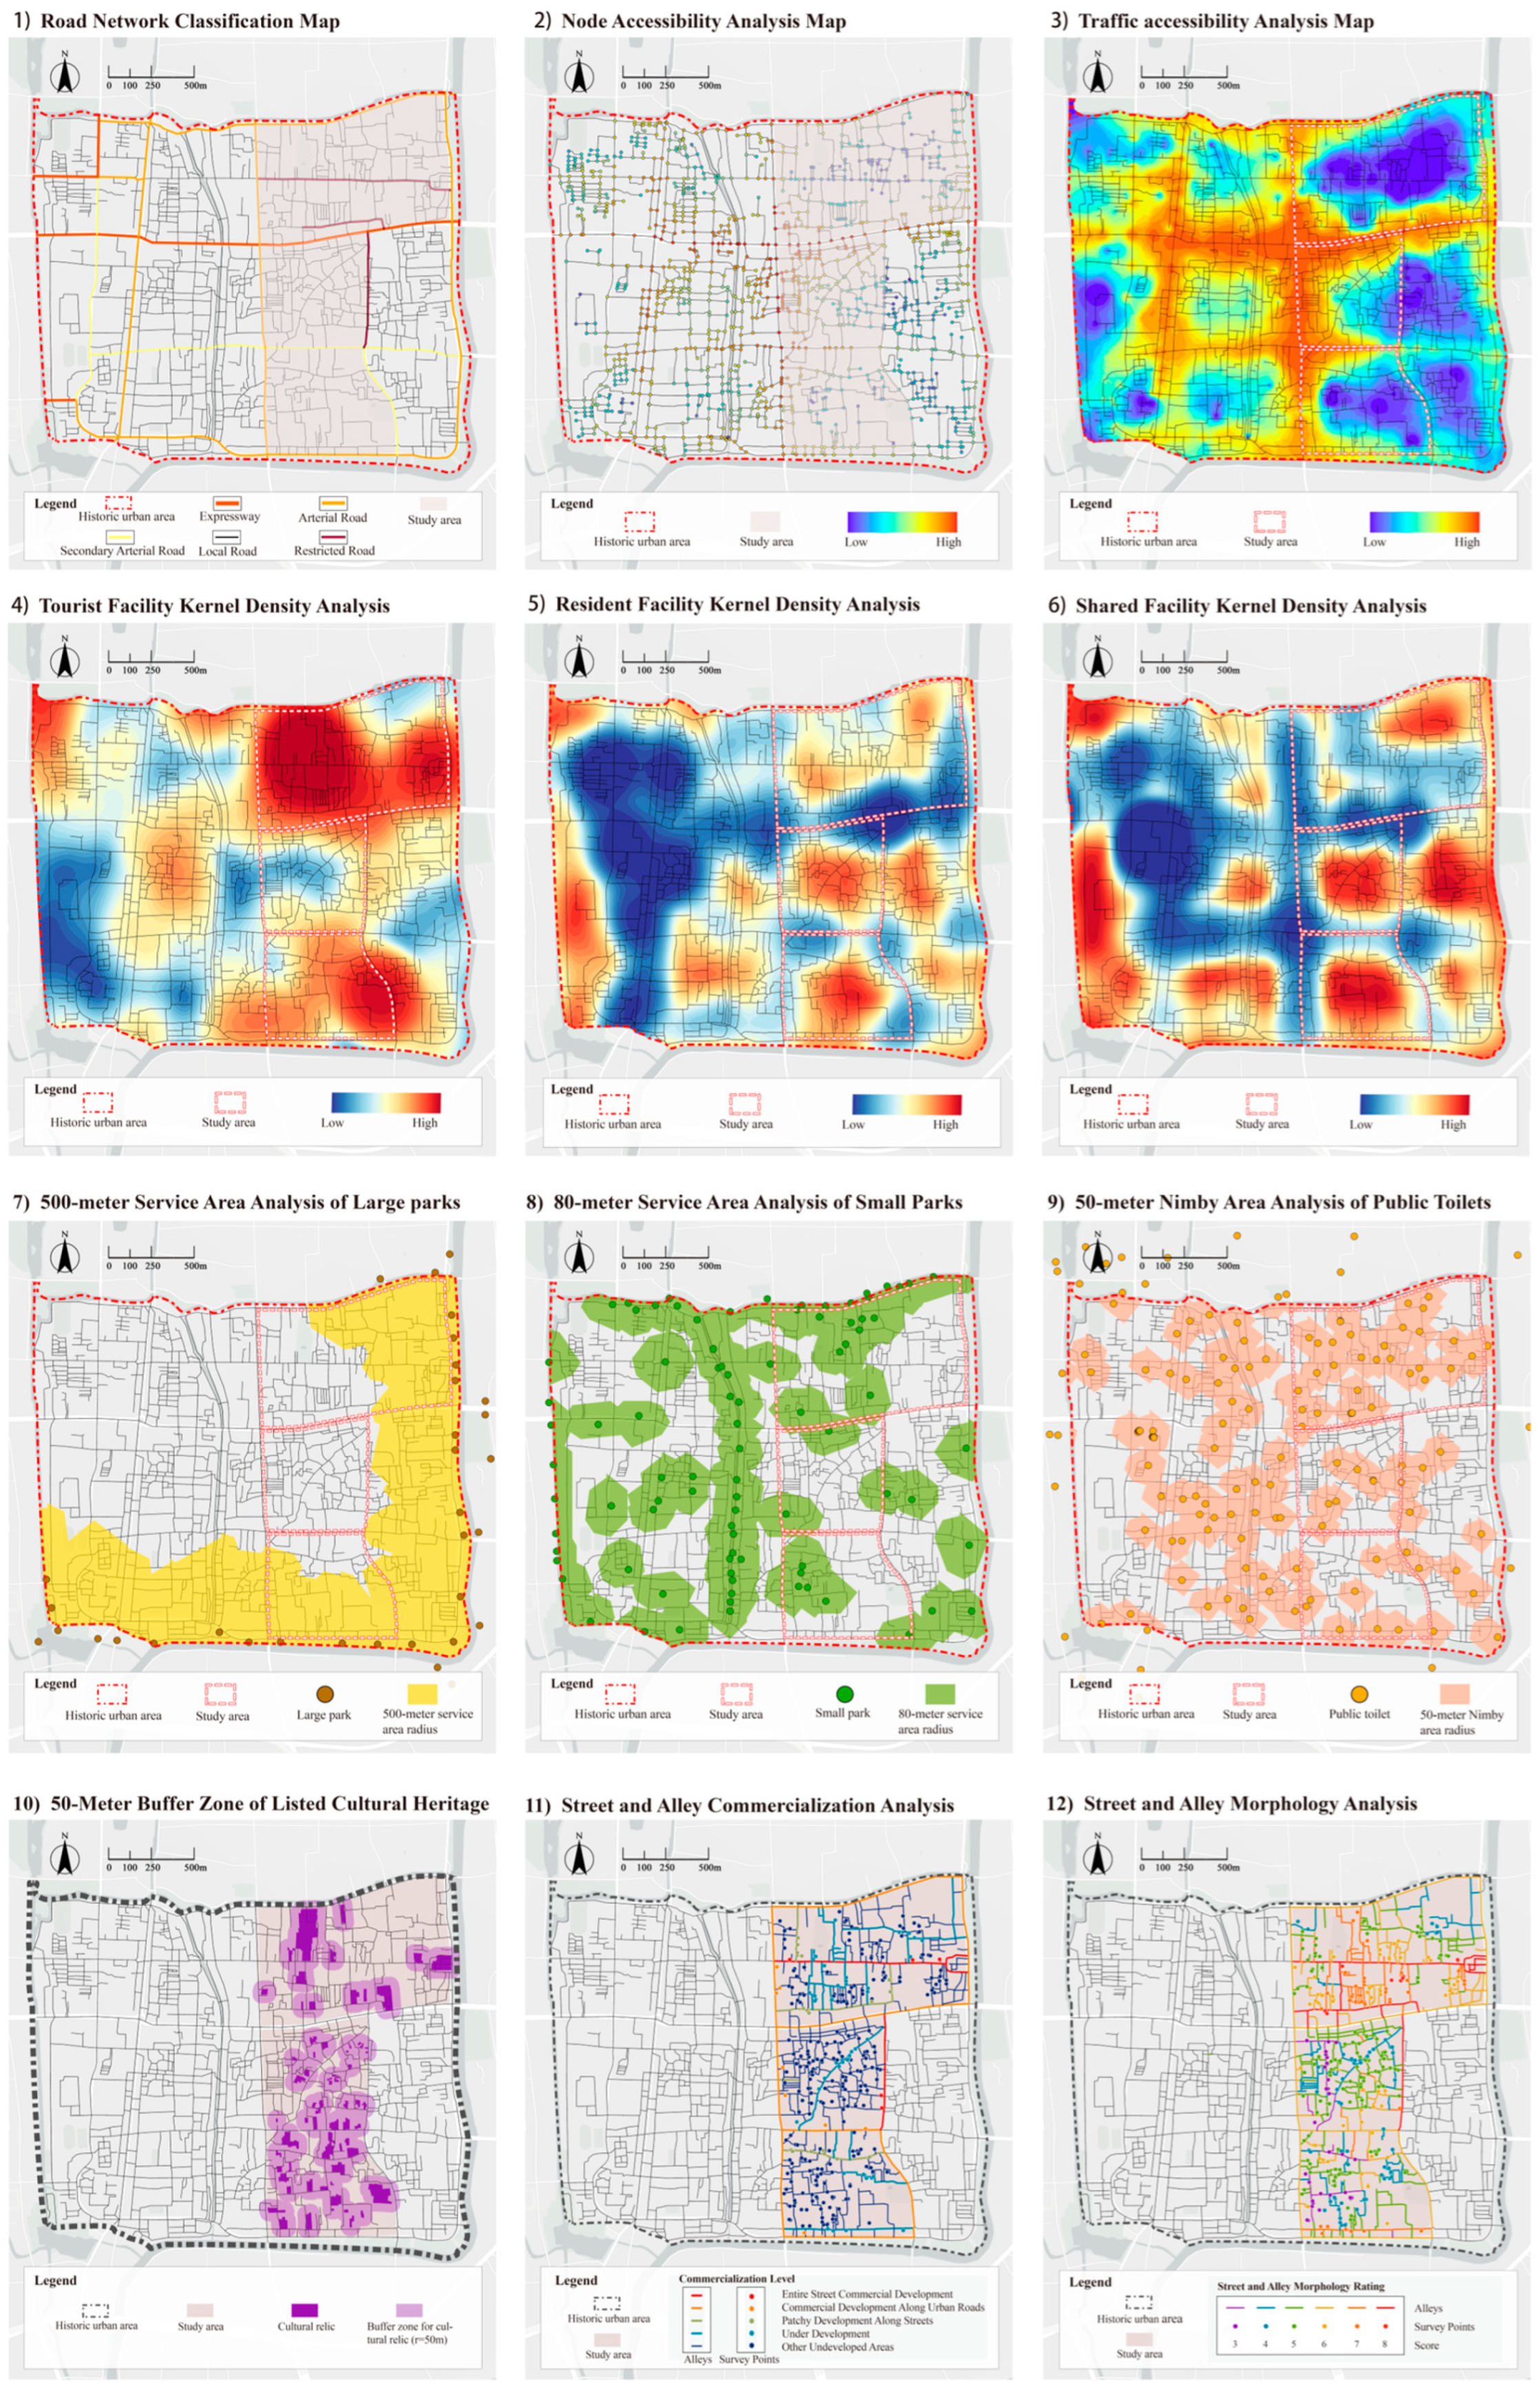
4.2.2. Physical Planning Measures on the City Scale

In terms of transportation planning, the local government has implemented speed limits on major roads within the historic urban area. Furthermore, traffic control measures have been introduced to pedestrianize tourist streets (Figure 4-1). These changes have affected the traffic accessibility for residents living near these roads (Figure 4-2; Figure 4-3).
In terms of public facility planning, the facilities are categorized into tourist, resident, and shared facilities (Figure 4-4, Figure 4-5, Figure 4-6). (1) In District A: Tourist facilities dominate in terms of quantity. Spatially, they are distributed almost throughout the entire district, except for the northeastern corner. Resident facilities are concentrated within the district, while shared facilities are concentrated in the northeastern corner of the district. (2) In District B: Shared facilities are the most numerous. Resident facilities come next in quantity. Both of them are concentrated within the district. Tourist facilities are mainly located along the urban roads on the outer edges of the district, with few within the district. (3) In District C: Resident facilities are the most numerous. Shared and tourist facilities are similar in number. Resident and Shared facilities are located within the district, while tourist facilities are concentrated on the eastern side of the district.
In terms of park planning, large-scale urban parks are mainly located along the moat of the historic urban area. Based on a 500 m service radius, the eastern area of District A and the southern area of District C are significantly impacted, while District B is less affected (Figure 4-7). As for small parks, District A has the most small parks, concentrated mainly in the central, western, and northern parts. District B has the fewest small parks, with important ones located in the western and northern parts of the district. District C has a moderate number of small parks, mainly concentrated in the western and central parts (Figure 4-8).
In terms of public toilet planning, District A, due to its high tourist traffic, has a denser distribution of public toilets, most of which are located near the main tourist streets. In contrast, District B and District C have a lower density of public toilets. In District B, the public toilets are mainly located along the major streets and lanes, while in District C, the public toilets are primarily situated near the entrances and exits of the district (Figure 4-9).

4.2.3. Physical Planning Measures on the Community Scale

In terms of cultural heritage preservation (Figure 4-10), although District A has relatively fewer cultural heritage resources, its larger land area results in a greater impact after revitalization. District B has a moderate number of cultural heritage resources, but they are smaller in scale. Finally, District C not only has a large number of cultural heritage resources but also large-scale ones, which place significant pressure on local finances.
In terms of tourism commercial street development (Figure 4-11), the main street “Dongguan Street” in District A has been fully developed into a pedestrian street. Additionally, several secondary streets have been partially developed into tourism commercial streets with mixed pedestrian and vehicle traffic. In District B, the city road on the eastern side has been developed into a pedestrian street, while the internal streets have a relatively low degree of commercialization. District C has not yet planned any pedestrian streets, and the internal streets also exhibit a low level of commercialization.
In terms of street physical upgrading (Figure 4-12), District A has made the fastest progress, with nearly all streets undergoing aesthetic improvements and municipal infrastructure updates. District B has made the slowest progress, while District C falls somewhere in between.

4.2.4. Physical Planning Measures on the Household Scale

At the household scale, physical planning measures include housing maintenance and the installation of flush toilets. Based on the spatial analysis results, these two measures do not exhibit significant spatial characteristics, and therefore, no spatial visualization analysis is presented.

4.3. Spatial Heterogeneous Effects of Planning Measures

4.3.1. Geo-Detector of Key Planning Influencing Factors

First, we compared the overall effects of various dimensional planning measures on residents’ SWB. The results of single-factor detection showed: (1) Non-physical planning measures, including community planning services and community participation, have a significantly greater impact on SWB compared to physical planning measures; (2) At the household scale, physical planning measures have a more substantial effect than at the community scale, while urban-scale planning measures exhibit the least influence.
Second, focusing on physical planning measures only, the q-values of planning factors revealed (Figure 5): (1) The similarity across three cases is that the “housing maintenance” factor has the highest influence on residents’ SWB in all cases, followed by the “physical upgrading of access street” and “commercialization of access street” factors. However, the “buffer zone of cultural relic” factor has almost negligible influence in all cases. (2) The differences across the three districts lie in the varying explanatory power of other physical planning measures on the spatial pattern of residents’ SWB, aside from the three key factors mentioned above. This is particularly evident in the following aspects: traffic accessibility, accessibility of tourist facility, accessibility of resident facility, accessibility of shared facility, service area of large park, service area of small park, and NIMBY area of public toilet.
Secondly, based on the Interaction Detector, paired factors with an enhancing dual-factor effect were identified, and their q-values were ranked. The table below presents only the top five planning dual factors (Table 4).
In District A, the “installation of flush toilet” paired with the other five planning factors generated the highest dual-factor enhancement effect on residents’ SWB. These pairings, ranked from highest to lowest, are as follows: Installation of flush toilet and housing maintenance, Installation of flush toilet and traffic accessibility, Installation of flush toilet and accessibility of resident facility, Installation of flush toilet and NIMBY area of public toilet, Installation of flush toilet and buffer zone of cultural relic.
In District B, “housing maintenance” paired with the other four planning factors produced the highest dual-factor enhancement effect on residents’ SWB. Ranked from high to low, these pairings are: Housing maintenance and commercialization of access street, Housing maintenance and service area of small park, Housing maintenance and accessibility of resident facility, Housing maintenance and service area of large park. Finally, traffic accessibility paired with physical upgrading of access street also had a strong dual-factor enhancement effect on residents’ SWB.
In District C, “housing maintenance” paired with the other three planning factors generated the highest dual-factor enhancement effect on residents’ SWB. Ranked from high to low, these pairings are: Housing maintenance and NIMBY area of public toilet, Housing maintenance and commercialization of access street, Housing maintenance and buffer zone of cultural relic. Additionally, accessibility of resident facility paired with NIMBY area of public toilet, and service area of large park paired with NIMBY area of public toilet, also had a strong dual-factor enhancement effect on residents’ SWB.

4.3.2. Impact Direction of Multi-Dimensional Planning Measures

The direction of the positive and negative impacts of planning measures on residents’ SWB is determined. Using residents’ SWB as the dependent variable, with resident attributes, social support factors, and inherent living environment factors as control variables, planning measures at the “city-community-household” scales are used as independent variables. The data of independent variables were standardized using the z-score method. Three multiple regression models are constructed with data from the three districts. The results show that all three models passed the ANOVA fit test (Table 5). Among them, the regression model for District B excluded the large park service area as an influencing factor.
X1: In all cases, higher traffic accessibility is associated with lower SWB;
X2: In District A, higher accessibility to tourist facilities is associated with higher SWB. However, in District B and District C, higher accessibility to tourist facilities is associated with lower SWB;
X3: In District A and District B, higher accessibility to resident facilities is associated with higher SWB. In District C, higher accessibility to resident facilities is associated with lower SWB;
X4: In District A, higher accessibility to public facilities is associated with lower SWB. In District B and District C, higher accessibility to public facilities is associated with higher SWB;
X5: In all districts, residents living closer to large parks have lower SWB compared to those living farther away from large parks;
X6: In District A and District C, residents living closer to small parks have lower SWB compared to those living farther away. However, in District B, residents living closer to small parks have higher SWB compared to those living farther away;
X7: In District A, residents living closer to public toilets have lower SWB compared to those living farther away. However, in District B and District C, residents living closer to public toilets have higher SWB compared to those living farther away;
X8: In all districts, residents living closer to cultural heritage sites have lower SWB compared to those living farther away from these sites;
X9: In District A and District C, higher commercialization of access streets is associated with higher SWB. However, in District B, lower commercialization of access streets is associated with higher SWB;
X10: In District A and District C, higher levels of physical upgrading of access streets are associated with lower SWB. However, in District B, higher levels of physical upgrading are associated with higher SWB;
X11: In all districts, the higher the quality of government-subsidized housing repair projects, the higher the residents’ SWB;
X12: In all districts, the completion of government-subsidized flush toilet installation projects significantly improves residents’ SWB.

5. Discussion

5.1. Summary of Findings

5.1.1. Tourism Development: The Paramount Determinant of Residents’ SWB

From an overall perspective, economic-led planning measures, mainly referring to tourism development, have exerted the most substantial influence on residents’ SWB in heritage sites, significantly surpassing social-led initiatives such as housing maintenance, as well as cultural-led preservation and adaptive reuse of historic buildings. Specifically, the correlation between tourism development and residents’ SWB across the three cases exhibits an “inverted U-shaped” curve. In District A, where the level of tourism development is highest, residents report the lowest levels of SWB. In District B, which has the lowest level of tourism development, residents experience moderate levels of SWB. While District C, characterized by a moderate level of tourism development, reports the highest levels of resident SWB.
The above findings indicate that there exists a threshold for the social carrying capacity of tourism in heritage sites. And this is generally consistent with results from studies conducted in other countries and urban areas. For instance, a large survey study conducted across 63 EU cities demonstrated that [35] below the threshold of over-tourism, leveraging urban cultural assets to attract tourists can generate positive externalities on residents’ satisfaction with urban cultural life. Exceeding this threshold, however, any further increase in tourist numbers correlates with a decline in residents’ life satisfaction. Another research conducted in Berlin [69] empirically assessed the tourism social carrying capacity of different urban areas and theoretically examined the inverted U-pattern hypothesis between tourism development and residents’ life satisfaction. Two empirical studies conducted in Changsha, China also reveal that the quality of life for historic area inhabitants exhibits a predictable inverted U-shaped curve throughout the life cycle of tourism destinations [70].
Compared to the existing literature, this paper will further elucidate the sequence and direction of spatial effects that sub-planning measures exert on residents’ SWB. The aim is to provide a more detailed understanding of the interaction mechanism among tourism development, cultural heritage preservation, and residents’ well-being.

5.1.2. Common Planning Determinants of Residents’ SWB with Similar Social Impacts

The three case studies exhibit similarities in demonstrating that enhancing the government’s subsidies for housing maintenance, elevating the standards of community planning service, and fostering community participation can significantly improve residents’ SWB. This finding aligns with existing research conclusions [71,72,73,74]. Furthermore, this paper explores the intrinsic relationship between the physical measures of housing maintenance and non-physical planning interventions.
First, the housing conditions in the studied area are suboptimal compared to the other neighborhoods within the old town. Allocating public resources to housing improvement projects in these deteriorated neighborhoods yields direct and significant positive social impacts. However, interviews with residents reveal that due to the complex property rights associated with traditional houses, there is an intertwined mix of public and private residences, leading to unclear accountability for housing repair. This issue is a historical legacy common to historic districts in urban China [75]. As a result, tenants of public rental housing are often reluctant to contribute financially, while a considerable number of private house owners seek to benefit from government-led renovation projects.
In this paper, it is proved that enhancing the quality of community planning service and the extent of community participation, can not only improve residents’ SWB but also increase their willingness to invest in housing maintenance. Specifically, residents from District C reported the highest satisfaction with community planning services and participation. The rate of self-funded housing improvements was also notably higher than in the other two cases. The initiatives undertaken by the grassroots government in community governance ensure that residents have a comprehensive understanding of the planning policies and information related to historic districts, as well as their rights and responsibilities concerning housing maintenance. As a result, these efforts foster greater willingness among residents to contribute to and participate in government-subsidized housing renovation projects. This conclusion is consistent with existing research [76,77].

5.1.3. Common Planning Determinants of Residents’ SWB with Different Spatial Effects

Based on the single-factor detection results, it was found that the commercialization degree of access streets, the physical upgrading degree of access streets, and the accessibility of three types of public facilities had strong explanatory power for the spatial differentiation of residents’ SWB.
First, in Districts A and C, which have a higher degree of tourism development than District B, the higher the degree of commercialization of access streets, the higher the housing value or rent income for the respondents. This largely offsets the negative impact of tourism activities on daily life, thereby increasing the SWB of residents. However, in District B, the urban roads and commercial facilities in the vicinity not only fail to enhance the economic value of traditional dwellings but also create additional disturbances to residents’ daily lives, thereby reducing their subjective well-being (SWB). These findings are largely consistent with the conclusions drawn from existing studies [27,78]. However, it is necessary to consider the particular socioeconomic backgrounds and environmental characteristics of each heritage site [79].
Second, in Districts A and C with a high degree of tourism development and faster progress of infrastructure renewal, the higher the degree of physical upgrading of access streets, the more strict the image management of streets by local governments or tourism operating companies. This restricts nearby residents from carrying out daily activities such as drying clothes, parking vehicles, and washing vegetables in front of their homes. Conversely in District B, where infrastructure is updated slowly, the higher the degree of physical renewal of streets and lanes, the more likely it is that neighboring residents will introduce modern facilities. Although existing studies have found that the influence of the convenience of life and housing price on residents’ subjective well-being is greater than the spatial quality of streets [80]. In the case of District B, the positive impact of upgrading access streets and introducing modern facilities on residents’ SWB is significantly greater than the economic benefits derived from tourism.
Finally, the accessibility of public facilities in the three cases exhibits moderate explanatory power regarding residents’ SWB. But there are significant differences in the specific types of public facilities. In District A, nearby residential facilities demonstrate the strongest spatial explanatory power for enhancing SWB. This is because the thriving tourism industry has displaced community businesses that serve residents, thereby impacting the daily lives of residents in District A. In contrast, in Districts C and B, the shared facilities used by both residents and visitors exhibit the strongest explanatory power for increasing SWB. This is primarily because the economic benefits derived from tourism development are not substantial, but the establishment of tourism-oriented public facilities indirectly benefits local residents. This finding aligns with existing studies [40,42]. Market forces have intervened to compensate for the lack of government funding for public services in decaying neighborhoods.

5.1.4. Distinctive Planning Influencing Factors of Residents’ SWB

The difference between the three cases is that the three types of planning impact factors, namely traffic accessibility, park accessibility, and the NIMBY area of public toilet, have either significant or insignificant spatial effects on resident SWB.
First of all, the higher the degree of tourism development, the more significant the impact of traffic accessibility on residents’ SWB. In District A, the pedestrianization of community streets for tourism development has imposed a considerable negative influence on the daily lives of residents. Conversely, in Districts C and B, where tourism development is moderate and low, the impact of traffic accessibility on SWB is much less pronounced. These findings align with previous research [81], indicating that residents’ attitudes and evaluations evolve with varying degrees of tourism development.
Secondly, although Districts A and C are adjacent to large parks, these parks are crowded with tourists and do not significantly improve residents’ well-being. In contrast, District B is located away from large parks, but the recent addition of small parks can significantly increase the SWB of residents. Existing studies hold that the combined layout and enhanced accessibility of urban public leisure space and other tourist attractions can effectively improve the shared use of public space [82]. However, the study of this paper proves that intensive tourism activities make large parks ineffective in serving local residents.
Finally, the construction of public toilet exhibits significant spatial heterogeneity in its impact on residents’ SWB across the three cases. In District A, proximity to public toilets notably diminished residents’ SWB. This is because in District A, most households were already equipped with flush toilets, and the high density of public toilets leads to odor dispersion which negatively affects the daily lives of nearby residents. Conversely, in Districts B and C, where a considerable proportion of households lack flush toilets, the proximity to public toilets became a positive influence on residents’ SWB. These findings align with existing research indicating that public health investments have a more pronounced effect on the well-being of low-income urban residents [83].

5.2. Planning Suggestions

The general recommendations for the three historic districts to improve residents’ SWB: (1) While promoting cultural industry development, it is crucial to avoid over-tourism; (2) There should be an increase in socially oriented heritage reuse initiatives, ensuring that residents derive greater economic, cultural, and emotional benefits from these heritage conservation and reuse projects; (3) It is important to coordinate the interests of multiple stakeholders while enhancing participatory planning processes and improving planning services. Special attention will be given to protecting the rights and interests of vulnerable groups, with priority placed on meeting residents’ basic needs concerning housing safety, access to basic infrastructure, and public service facilities.
Based on the functional positioning, heritage conservation objectives, distinctive environmental attributes, and historical evolution of the three case studies, we have formulated differentiated sub-planning strategies:
(1) For District A, which primarily functions as a tourist destination with secondary residential use and medium-level cultural heritage protection requirements, it is essential to implement dynamic zoning planning. Specifically, this involves land-use planning and public facility planning to separate tourism activities from daily life while controlling the scale and spatial layout of commercial areas. In terms of transportation, tourism route planning, and traffic control measures should confine tourist activities to the vicinity of Dongguan Street, thereby minimizing tourist interference in residential blocks. During the renovation and revitalization of historical buildings, smaller historical buildings and gardens near residential blocks should be repurposed into community service facilities and small recreational spaces for residents.
(2) For District B, which mainly functions as a residential area, supplemented by tourism and the light task of cultural heritage protection, infrastructure renewal and housing improvement projects should be focused on. The limited public resources should be given priority to meet the urgent needs of low-income groups in terms of the strengthening of dilapidated houses and the installation of flush toilets. The number of public toilets should be appropriately increased. In addition, the government can also encourage market forces to build shared facilities between tourists and residents through preferential policies and the binding of land transfer conditions. In particular, both sides of the diagonal main street “Wan-zi-jie” with the highest accessibility should focus on increasing community public facilities and activity space along the street. In addition, through urban design, the inclusiveness of space can be improved, so that residents can benefit indirectly from the development of cultural industries.
(3) For District C, which has the most important task of cultural heritage protection and A mixture of residential functions and tourism functions, it is necessary to control the commercial development of tourism in a forethought way to avoid the problem of over-tourism in District A. In addition, similar to Block B, it is proposed to introduce market forces to increase public facilities and public spaces shared by residents and visitors on the middle and west sides of the block. Finally, through a multi-participation and benefit-sharing mechanism, the government forces, market forces, and local social forces should be jointly included in the comprehensive protection and sustainable development of heritage sites.

5.3. Limitations and Prospects

Although most common planning measures were incorporated into the research model through the literature review and analysis of planning documents, this study did not consider the special measures implemented in each case and their impact on residents’ SWB. Additionally, while individual attributes, social support factors, and inherent living environment factors were included as control variables, the mediating or moderating effects of these factors on the influence of heritage conservation planning on residents’ SWB were not addressed. Future studies should consider relatively unique planning measures and their spatial heterogeneous effects on residents’ SWB in historic districts. Furthermore, it would be beneficial to incorporate the social and demographic characteristics of historic districts into the theoretical framework of public policy performance in heritage conservation planning. Additionally, expanding the number of empirical cases and comparing the performance of conservation planning implementation across different cities and regional contexts would provide more robust insights.

6. Conclusions

Based on three empirical cases, this study examines the spatial heterogeneous effects of diverse planning measures on residents’ SWB under different heritage conservation and development models for historic districts. The findings are as follows:
(1)
The degree of commercialization in historic districts follows an inverted U-shaped relationship with residents’ SWB (SWB). On one hand, excessive commercialization can lead to disruptions in residents’ daily lives due to tourism activities, thereby offsetting the positive social impacts of housing repairs and other social welfare projects. On the other hand, the lack of government guidance and public financial support, with community development entirely driven by residents, makes it difficult to complete infrastructure upgrades in historic districts, leaving residents living in deteriorating housing and outdated facilities. Therefore, maintaining a delicate balance between cultural heritage conservation and reuse, and the improvement of residents’ quality of life, is key to maximizing local residents’ well-being.
(2)
Non-physical planning measures, such as community participation and community planning service, may have a greater impact on residents’ SWB than physical measures. This is partly because, within the current cultural heritage conservation system in China, governments, and experts dominate the “elite heritage discourse”. In contrast, the “local heritage discourse” of the vulnerable original residents is weaker. As a result, cultural heritage planning tends to adopt culturally- and economically-driven revitalization strategies, often neglecting the sustainable development of the heritage areas and their surrounding communities. Furthermore, due to the complex ownership of housing in historic districts, projects like housing maintenance require residents and the government to build trust and co-invest.
Under different frameworks of heritage conservation and (re)development, the impact of planning measures on residents’ SWB exhibits significant spatial heterogeneity. In this study, this is mainly reflected in how the degree of tourism development in different districts affects the key planning factors that improve residents’ SWB. Based on the findings of this research, it is recommended that in tourism-oriented historic districts, stronger control over tourism traffic should be implemented to protect public facilities and spaces that serve local residents. In residential historic districts, limited public resources should be allocated to infrastructure upgrades and housing security projects. Additionally, the design of public facility layouts and public spaces should enhance inclusivity, encouraging shared use of public cultural facilities and spaces by both residents and tourists.
In conclusion, as a public policy aimed at achieving comprehensive and sustainable development of historic districts, heritage conservation planning should strive to balance the three major objectives of cultural heritage preservation, local economic revitalization, and the enhancement of residents’ quality of life. To achieve this goal, it is necessary to explore the varying impacts of different planning measures on residents’ well-being, analyzing their cumulative effects and ranking their influence. By doing so, the social benefits of heritage conservation planning can be fully understood at both the overall and elemental levels. Ultimately, by establishing more balanced, dynamic, and context-specific planning measures and public participation mechanisms, the sustainable development of heritage sites’ cultural, economic, and social dimensions can be supported for local residents.

Author Contributions

Conceptualization, Y.C.; methodology, Y.C. and Y.S.; validation, C.W.; writing, Y.C.; project administration, Y.C. and C.W.; funding acquisition, Y.C. and C.W. All authors have read and agreed to the published version of the manuscript.

Funding

This research was funded by the “National Natural Science Foundation of China, grant number 52108058”, “National Natural Science Foundation of China, grant number 52208078”.

Data Availability Statement

The data that support the findings of this study are available from the corresponding author upon reasonable request.

Conflicts of Interest

The authors declare no conflicts of interest.

Appendix A. Sample Overview

Control VariablesIndex ValueFrequencyRation%
C1Gendermale14444.7
female17855.3
C2Age<44194.7
45~599734.8
≥6020664.0
C3Hukoulocal30093.2
Non-local226.8
C4Income level<2500113.4
2500~5000247.5
5000~10,00023974.2
>10,0003611.2
C5Education levelilliterate309.3
Compulsory school4614.3
High school11134.5
Collage and above9328.9
C6Family structureindividual6419.9
Conjugal family10332
Core family7322.7
Other family structure278.4
C8Length of residence<3 years134.0
3~10 years206.2
10~40 years9429.2
>40 years19560.6
C9Housing property rightsPrivate17153.1
Public rental13040.4
Ordinary rental216.5
C10Housing area<30 m23611.2
30~60 m211034.2
60~90 m28827.3
90~120 m26118.9
>120 m2278.4

References

  1. Zhao, Z.; Lan, W. Formation and Evolution of the Concepts of Historic and Cultural City Protection System. City Plan. Rev. 2022, 46, 20–26. (In Chinese) [Google Scholar]
  2. Li, S.; Aoki, N.; Wang, R.; Xu, S. Development of Cultural Heritage Conservation Planning in China. Plan. Perspect. 2024, 39, 925–943. [Google Scholar] [CrossRef]
  3. Zhang, H.; Wang, F.; Guo, F.; Cai, J.; Dong, J. Urban Built Heritage Protection and Realistic Dilemmas: The Development Process, Protection System, and Critical Thinking of Historic Districts in Dalian. Built Herit. 2023, 7, 25. [Google Scholar] [CrossRef]
  4. Wang, S.; Shi, N.; Zhang, S.; Li, J.; Huo, X.; Ren, Y.; Yang, Y.; Wang, J.; Zhang, G.; Duan, D.; et al. Urban-Rural Planning and Construction and Cultural Inheritance. City Plan. Rev. 2020, 44, 105–111. (In Chinese) [Google Scholar]
  5. Pennington, A.; Corcoran, R. The Impact of Historic Places and Assets on Community Wellbeing—A Scoping Review. Technical Report. 2019. Available online: https://livrepository.liverpool.ac.uk/id/eprint/3034624 (accessed on 24 November 2024).
  6. Sheng, G.; Liao, L.; Xiong, L.; Zhu, B.; Cheung, S.M. Revitalization and Development Strategies of Fostering Urban Cultural Heritage Villages: A Quantitative Analysis Integrating Expert and Local Resident Opinions. Systems 2022, 10, 202. [Google Scholar] [CrossRef]
  7. Zhang, X.; Edelenbos, J.; Gianoli, A. Balancing Urban Conservation and (Re)Development: Tracing Policy Layering in the Mainland of China (1906–2023). Policy Stud. 2024, 45, 1–21. [Google Scholar] [CrossRef]
  8. Thompson, J.; Wijesuriya, G. From ‘Sustaining Heritage’ to ‘Heritage Sustaining Broader Societal Wellbeing and Benefits’: An ICCROM Perspective. In World Heritage and Sustainable Development, 1st ed.; Routledge: London, UK, 2018; pp. 180–195. [Google Scholar]
  9. Li, J.; Krishnamurthy, S.; Roders, A.P.; Wesemael, P.V. Community Participation in Cultural Heritage Management: A Systematic Literature Review Comparing Chinese and International Practices. Cities 2020, 96, 102476. [Google Scholar] [CrossRef]
  10. Cocozza, S.; Sacco, P.L.; Matarese, G.; Maffulli, G.D.; Maffulli, N.; Tramontano, D. Participation to Leisure Activities and Well-Being in a Group of Residents of Naples, Italy: The Role of Resilience. Int. J. Environ. Res. Public Health 2020, 17, 1895. [Google Scholar] [CrossRef] [PubMed]
  11. Li, J.; Guo, B.; Li, Y.; Hu, X.; Ma, L.; Qi, R. The Impact of Social Network Embeddedness, TPB, and Danwei System on Residents’ Participation Intention in Old Neighborhood Regeneration. Sci. Rep. 2024, 14, 18920. [Google Scholar] [CrossRef] [PubMed]
  12. Li, J.; Pan, L.; Hu, Y. Cultural Involvement and Attitudes Toward Tourism: Examining Serial Mediation Effects of Residents’ Spiritual Wellbeing and Place Attachment. J. Destin. Mark. Manag. 2021, 20, 100601. [Google Scholar] [CrossRef]
  13. Cheng, L.; Xu, J. Benefit-Sharing and Residents’ Subjective Well-Being in Rural Tourism: An Asymmetric Approach. J. Destin. Mark. Manag. 2021, 21, 100631. [Google Scholar] [CrossRef]
  14. Chen, Y.; Cottam, E.; Lin, Z. The Effect of Resident-Tourist Value Co-Creation on Residents’ Well-Being. J. Hosp. Tour. Manag. 2020, 44, 30–37. [Google Scholar] [CrossRef]
  15. Hu, Y.; Morales, E. The Unintended Consequences of a Culture-Led Regeneration Project in Beijing, China. J. Am. Plan. Assoc. 2016, 82, 148–151. [Google Scholar] [CrossRef]
  16. Brooks, C.; Waterton, E.; Saul, H.; Renzaho, A. Exploring the Relationships Between Heritage Tourism, Sustainable Community Development, and Host Communities’ Health and Wellbeing: A Systematic Review. PLoS ONE 2023, 18, e0282319. [Google Scholar] [CrossRef] [PubMed]
  17. Fotiadis, A.; Nuryyev, G.; Achyldurdyyeva, J.; Spyridou, A. The Impact of EU Sponsorship, Size, and Geographic Characteristics on Rural Tourism Development. Sustainability 2019, 11, 2375. [Google Scholar] [CrossRef]
  18. Hua, W.; Weifeng, S. Tourism-Driven Rural Gentrification: Case Study of Two Villages in Danxia Mount. Tourism Trib. 2021, 36, 69–80. (In Chinese) [Google Scholar]
  19. Bin, L.; Chun, W. Social Assessment on Performance of Urban Design in Sustainable Urban Regeneration of Historic District: Practicing Open-Style Urban Design in Nanluoguxiang Area of Beijing. City Plan. Rev. 2013, 37, 31–38. (In Chinese) [Google Scholar]
  20. Yung, E.H.K.; Zhang, Q.; Chan, E.H. Underlying Social Factors for Evaluating Heritage Conservation in Urban Renewal Districts. Habitat Int. 2017, 66, 135–148. [Google Scholar] [CrossRef]
  21. Fisher, J.; Allen, S.; Yetman, G.; Pistolesi, L. Assessing the Influence of Landscape Conservation and Protected Areas on Social Wellbeing Using Random Forest Machine Learning. Sci. Rep. 2024, 14, 11357. [Google Scholar] [CrossRef] [PubMed]
  22. Huang, W.; Su, S.; Sun, X. Social Cognition, Socioeconomic Status and Subjective Well-Being of Chinese Migrant Workers. Sci. Rep. 2024, 14, 6550. [Google Scholar] [CrossRef] [PubMed]
  23. Das, K.V.; Jones-Harrell, C.; Fan, Y.; Ramaswami, A.; Orlove, B.; Botchwey, N. Understanding Subjective Well-Being: Perspectives from Psychology and Public Health. Public Health Rev. 2020, 41, 25. [Google Scholar] [CrossRef] [PubMed]
  24. Hoogerbrugge, M.; Burger, M. Selective Migration and Urban–Rural Differences in Subjective Well-Being: Evidence from the United Kingdom. Urban Stud. 2021, 59, 2092–2109. [Google Scholar] [CrossRef]
  25. Phelps, C.; Harris, M.N.; Rowley, S.; Viforj, R.O.; Wood, G.A. Geographic Reference Income and the Subjective Wellbeing of Australians. J. Happiness Stud. 2023, 24, 2855–2880. [Google Scholar] [CrossRef]
  26. Eibich, P.; Krekel, C.; Demuth, I.; Wagner, G.G. Associations Between Neighborhood Characteristics, Well-Being and Health Vary Over the Life Course. Gerontology 2016, 62, 362–370. [Google Scholar] [CrossRef] [PubMed]
  27. Chi, C.G.; Cai, R.; Li, Y. Factors Influencing Residents’ Subjective Well-Being at World Heritage Sites. Tourism Manag. 2017, 63, 209–222. [Google Scholar] [CrossRef]
  28. Mao, Y.; Chen, J.; Liu, X.; Dang, J.; Schiöth, H.B. Social Support Predicted Subsequent Subjective Well-Being During the COVID-19 Pandemic: A Prospective Study. BMC Public Health 2024, 24, 943. [Google Scholar] [CrossRef] [PubMed]
  29. Mouratidis, K. Built Environment and Social Well-Being: How Does Urban Form Affect Social Life and Personal Relationships? Cities 2018, 74, 7–20. [Google Scholar] [CrossRef]
  30. Mouratidis, K. Urban Planning and Quality of Life: A Review of Pathways Linking the Built Environment to Subjective Well-Being. Cities 2021, 115, 103229. [Google Scholar] [CrossRef]
  31. Viforj, R.O.; Suenaga, H.; Brierty, R. Homeownership and Subjective Well-Being: Are the Links Heterogeneous Across Location, Age and Income? Urban Stud. 2023, 61, 859–877. [Google Scholar] [CrossRef]
  32. Conigliaro, P. Subjective Well-Being in Italian Regions. Soc. Indic. Res. 2020, 161, 751–781. [Google Scholar] [CrossRef]
  33. Li, X.; Xu, L.; Tian, S.; Yang, J.; Liu, M.; Liu, H. Human Settlements in China Based on the Geographical Scale. Sci. Geogr. Sin. 2022, 42, 951–962. (In Chinese) [Google Scholar]
  34. Perucca, G. Residents’ Satisfaction with Cultural City Life: Evidence from EU Cities. Appl. Res. Qual. Life 2019, 14, 461–478. [Google Scholar] [CrossRef]
  35. Ahn, Y.J. Do Informal Social Ties and Local Festival Participation Relate to Subjective Well-Being? Int. J. Environ. Res. Public Health 2020, 18, 16. [Google Scholar] [CrossRef] [PubMed]
  36. Lindberg, K.; Wolsko, C. Assessing Well-Being Factors in a Growing Community: A Multi-Attribute Vignette Approach. Soc. Indic. Res. 2018, 144, 315–335. [Google Scholar] [CrossRef]
  37. Li, L.; Shi, L. Economic Growth and Subjective Well-Being: Analyzing the Formative Mechanism of Easterlin Paradox. J. Chin. Sociol. 2019, 6, 1. [Google Scholar] [CrossRef]
  38. Li, Y.; Zhu, D.; Wang, H. Choice of New Public Service-Oriented Development Mode of Urban Historic Districts: An Empirical Study of Residents’ Satisfaction in Shanghai City. City Plan. Rev. 2016, 40, 51–60. (In Chinese) [Google Scholar]
  39. Qin, L. Research on Comprehensive Layout Optimization of Municipal Pipelines in a Narrow Space. City Plan. Rev. 2018, 42, 105–110. (In Chinese) [Google Scholar]
  40. Liang, Z.; Hui, T. Residents’ Quality of Life and Attitudes Toward Tourism Development in China. Tourism Manag. 2016, 57, 56–67. [Google Scholar] [CrossRef]
  41. Liu, Y.; Shen, L.; Ren, Y.; Zhou, T. Regeneration Towards Suitability: A Decision-Making Framework for Determining Urban Regeneration Mode and Strategies. Habitat Int. 2023, 138, 102870. [Google Scholar] [CrossRef]
  42. He, S.; Min, Q. Conservation-Compatible Livelihoods in Protected Areas: Concept and the Implementation Approach. J. Nat. Resour. 2023, 38, 862–873. [Google Scholar] [CrossRef]
  43. Bonfantini, G.B.; Xie, S. Not Only for Tourists: The Historic Urban Landscape as Infrastructure for Livable Contemporary Cities. Urban Plan. Int. 2016, 31, 61–65. (In Chinese) [Google Scholar]
  44. Jennings, V.; Larson, L.; Yun, J. Advancing Sustainability through Urban Green Space: Cultural Ecosystem Services, Equity, and Social Determinants of Health. Int. J. Environ. Res. Public Health 2016, 13, 196. [Google Scholar] [CrossRef]
  45. Foroughi, M.; Andrade, B.D.; Roders, A.P.; Wang, T. Public Participation and Consensus-Building in Urban Planning from the Lens of Heritage Planning: A Systematic Literature Review. Cities 2023, 135, 104235. [Google Scholar] [CrossRef]
  46. Yung, E.H.K.; Sun, Y. Power Relationships and Coalitions in Urban Renewal and Heritage Conservation: The Nga Tsin Wai Village in Hong Kong. Land Use Policy 2020, 99, 104811. [Google Scholar] [CrossRef]
  47. Gu, Z.; Tian, D. Public Participation in the Conservation and Management of Canal Cultural Heritage Worldwide: A Case Study of the Rideau Canal and Erie Canal. Human. Soc. Sci. Commun. 2024, 11, 1005. [Google Scholar] [CrossRef]
  48. Harrison, R. Heritage: Critical Approaches, 1st ed.; Routledge: London, UK, 2013. [Google Scholar]
  49. Qi, R.; Zhou, T.; Dong, W.; Pan, Y.; Qin, Y. A Review on the Research of Public Participation in Urban and Rural Heritage Protection in China in Recent 20 Years. City Plan. Rev. 2021, 45, 105–118. (In Chinese) [Google Scholar]
  50. Janochka, M.; Sequeira, J. Gentrification in Latin America: Addressing the Politics and Geographies of Displacement. Urban Geogr. 2016, 37, 1175–1194. [Google Scholar] [CrossRef]
  51. Zhao, Y.; Ponzini, D.; Zhang, R. The Policy Networks of Heritage-Led Development in Chinese Historic Cities: The Case of Xi’an’s Big Wild Goose Pagoda Area. Habitat Int. 2020, 96, 102106. [Google Scholar] [CrossRef]
  52. Zhao, P.; Ali, Z.M.; Hashim, N.H.N.; Ahmad, Y.; Wang, H. Evaluating Social Sustainability of Urban Regeneration in Historic Urban Areas in China: The Case of Xi’an. J. Environ. Manag. 2024, 370, 122520. [Google Scholar] [CrossRef]
  53. Li, Y.; Ye, Y.; Xiao, L.; Xu, W.A.; Law, A.M.; Wang, D. Classifying Community Space at a Historic Site through Cognitive Mapping and GPS Tracking: The Case of Gulangyu, China. Urban Des. Int. 2017, 22, 127–149. [Google Scholar] [CrossRef]
  54. Jiang, Y.; Chen, L.; Xie, Y.; Li, Y.; Li, T. Subjective Well-Being of Historical Neighborhood Residents in Beijing: The Impact on the Residential Environment. Sustainability 2023, 15, 1847. [Google Scholar] [CrossRef]
  55. Zukin, S.; Kasinitz, P.; Chen, X.M. Global Cities, Local Streets: Everyday Diversity from New York to Shanghai, 1st ed.; Routledge: London, UK, 2016. [Google Scholar] [CrossRef]
  56. Pinheiro, F. Redesigning Historic Cities Facing Rapid Tourism Growth: The Case of Macao’s World Heritage Centre and San Ma Lou Avenue. Worldw. Hosp. Tour. Themes 2017, 9, 274–288. [Google Scholar] [CrossRef]
  57. Wu, Y.; Chen, J.; Bian, Z.; Wang, H.; Wang, Z. Housing, Housing Stratification, and Chinese Urban Residents’ Social Satisfaction: Evidence from a National Household Survey. Soc. Indic. Res. 2020, 152, 653–671. [Google Scholar] [CrossRef]
  58. Su, M.M.; Wall, G.; Xu, K. Tourism-Induced Livelihood Changes at Mount Sanqingshan World Heritage Site, China. Environ. Manag. 2016, 57, 1024–1040. [Google Scholar] [CrossRef] [PubMed]
  59. Li, L.; Tang, Y. Towards the Contemporary Conservation of Cultural Heritages: An Overview of Their Conservation History. Heritage 2023, 7, 175–192. [Google Scholar] [CrossRef]
  60. Tweed, C.; Sutherland, M. Built Cultural Heritage and Sustainable Urban Development. Landsc. Urban Plan. 2007, 83, 62–69. [Google Scholar] [CrossRef]
  61. Tu, X.Y.; Huang, G.L.; Wu, J.G. Review of the Relationship Between Urban Greenspace Accessibility and Human Well-Being. Acta Ecol. Sinica 2019, 39, 421–431. [Google Scholar] [CrossRef]
  62. Wang, Z. Geostatistics and Its Applications in Ecology, 1st ed.; Science Press: Beijing, China, 1999; pp. 102–110. (In Chinese) [Google Scholar]
  63. Wu, Y.; Wu, C. Study on Urban Benchmark Land Price Evaluation Based on Kriging Technology. Econ. Geogr. 2001, 21, 584–588. (In Chinese) [Google Scholar]
  64. Esri. OD Cost Matrix Analysis Layer. ArcGIS Pro Documentation. Available online: https://pro.arcgis.com/en/pro-app/latest/help/analysis/networks/od-cost-matrix-analysis-layer.htm (accessed on 24 November 2024).
  65. Seaman, D.E.; Powell, R.A. An Evaluation of the Accuracy of Kernel Density Estimators for Home Range Analysis. Ecology 1996, 77, 2075–2085. [Google Scholar] [CrossRef]
  66. Ouyang, D.; Zhu, X.; Liu, X.; He, R.; Wan, Q. Spatial Differentiation and Driving Factor Analysis of Urban Construction Land Change in County-Level City of Guangxi, China. Land 2021, 10, 691. [Google Scholar] [CrossRef]
  67. Huang, H.; Zhou, Y.; Qian, M.; Zeng, Z. Land Use Transition and Driving Forces in Chinese Loess Plateau: A Case Study from Pu County, Shanxi Province. Land 2021, 10, 67. [Google Scholar] [CrossRef]
  68. Wang, J.; Xu, C. Geographical Detector: Principles and Prospects. Acta Geogr. Sin. 2017, 72, 116–134. (In Chinese) [Google Scholar]
  69. Tokarchuk, O.; Gabriele, R.; Maurer, O. Estimating Tourism Social Carrying Capacity. Ann. Tour. Res. 2021, 86, 102971. [Google Scholar] [CrossRef]
  70. Su, L.; Yang, X.; Swanson, S.R. The Impact of Spatial-Temporal Variation on Tourist Destination Resident Quality of Life. Tourism Manag. 2022, 93, 104572. [Google Scholar] [CrossRef]
  71. Xie, Y.; Chen, L.; Jiang, Y.; Zhang, W.; Dou, C. Disparities of Residents’ Subjective Well-Being in the Old City of Beijing: A Comparative Study Between Historic Districts and Non-Historic Districts. Areal Res. Dev. 2022, 41, 70–76. (In Chinese) [Google Scholar]
  72. Thuc, L.D.; Nguyen, M.V.; Duy, K.H.; Van, D.N. Prioritizing Barriers to the Conservation of Cultural Heritage Buildings in Adaptation to Urbanization and Climate Change. J. Clean. Prod. 2024, 473, 143529. [Google Scholar] [CrossRef]
  73. Abbott, P.A.; Brooker, R.; Reath, J. Managing the Hope and Worry of Housing Renewal—Supporting Well-Being in the Emerging Community. Health Promot. J. Aust. 2018, 30, 344–349. [Google Scholar] [CrossRef] [PubMed]
  74. Yu, Y.; Zhang, Y. Satisfaction with Community Public Services, Social Support, and Subjective Well-Being in China. Soc. Behav. Personal. 2023, 51, 11. [Google Scholar] [CrossRef]
  75. Dong, Y.; Han, D. Types, Processes, and Key Issues of Residential Area Regeneration: A Case Study of Nanjing. City Plan. Rev. 2024, 48, 34–42. (In Chinese) [Google Scholar]
  76. Ma, Y.; Ma, B.; Yu, L.; Ma, M.; Dong, Y. Perceived Social Fairness and Trust in Government Serially Mediate the Effect of Governance Quality on Subjective Well-Being. Sci. Rep. 2024, 14, 15905. [Google Scholar] [CrossRef]
  77. Chen, J.; Wang, S.; Wan, L. Does Government Environmental Governance Information Disclosure Improve Residents’ Subjective Well-Being? Evidence from China. J. Environ. Plan. Manag. 2022, 66, 1720–1742. [Google Scholar] [CrossRef]
  78. Andereck, K.L.; Valentine, K.M.; Knopf, R.C.; Vogt, C.A. Residents’ Perceptions of Community Tourism Impacts. Ann. Tour. Res. 2005, 32, 1056–1064. [Google Scholar] [CrossRef]
  79. Kang, W.; Guo, H. What Influences the Community Well-Being of Chinese Living in Metropolitan Areas? A Scale Validation and Invariance Test Across Gender, Age, and Hukou. BMC Public Health 2024, 24, 20979. [Google Scholar] [CrossRef] [PubMed]
  80. Ma, S.; Wang, B.; Liu, W.; Zhou, H.; Wang, Y.; Li, S. Assessment of Street Space Quality and Subjective Well-Being Mismatch and Its Impact, Using Multi-Source Big Data. Cities 2024, 147, 104797. [Google Scholar] [CrossRef]
  81. Lee, T.H.; Jan, F.H. Can Community-Based Tourism Contribute to Sustainable Development? Evidence from Residents’ Perceptions of the Sustainability. Tourism Manag. 2019, 70, 368–380. [Google Scholar] [CrossRef]
  82. Li, L.; Gan, Y.; Xie, S. Investigating Resident–Tourist Sharing of Urban Public Recreation Space and Its Influencing Factors. ISPRS Int. J. Geo-Inf. 2024, 13, 305. [Google Scholar] [CrossRef]
  83. Yang, Y.; Zhao, L.; Cui, F. How Does Public Health Investment Affect Subjective Well-Being? Empirical Evidence from China. Int. J. Environ. Res. Public Health 2022, 19, 5035. [Google Scholar] [CrossRef]
Figure 1. Locations of studied area and sampling data. Source: It is made by the authors.
Land 14 00029 g001
Figure 2. Spatial differentiation pattern of residents’ SWB. Source: It is made by the authors.
Land 14 00029 g002
Figure 3. The implementation of Historic District Conservation Planning. Source: It is made by the authors.
Land 14 00029 g003
Figure 4. Planning measures on “city-community-household” scale. Source: It is made by the authors.
Land 14 00029 g004
Figure 5. Geo-detector results of single planning factors. Source: It is made by the authors.
Land 14 00029 g005
Table 1. Influencing factors of SWB.
CategoriesSub-CategoriesVariablesSource
Individual AttributeDemographic informationGender, age, education level, marital status, income level, number of children;[22]
Health and Personality TraitsPhysical and mental health conditions, personality traits;[23]
Work and BeliefsWork status, religious beliefs, political orientation;[22]
AspirationsPersonal aspirations;[24]
Social SupportMaterial supportProvided by family members, friends, neighbors, and other affiliated groups;[23,25,26,27,28]
Emotional support
Living EnvironmentPhysical EnvironmentHousing conditions, supporting facilities, infrastructure, public facilities, public space, broader ecological conditions, residential location, traffic convenience, accessibility of public facilities and public spaces[29,30,31,32,33]
Non-physical EnvironmentSocial and cultural environment, community service, community participation, community governance, demographic composition, neighborhood effects;[5,10,13,24,26,34,35]
Macro BackgroundWith significant InfluenceEconomic development level, cultural environment, employment conditions, national governance, socioeconomic development policies, social welfare; material needs evolving towards enjoyment-oriented demands, social inequality;[25,36]
With non-significant Influence--[37]
Table 2. Two-sided effects of multi-dimensional planning measures on residents’ well-being.
Planning MeasuresPositive EffectsNegative Effects
Social-ledPhysical upgrading; traffic control; increase community service and facilities; improve housing conditions; promote public participation;Improve community reputation and image; improve living environment and housing conditions; other physical and emotional benefits;Increase the cost of cultural heritage preservation; Reduce economic efficiency;
Economic-ledTourism development; real estate development; commercialization;Increase residents’ property values, rent income, job opportunities; increase public income and in turn, increase social investment; increase market-led public service;Compulsory population relocation; social inequality; traffic congestion; noise disturbance; insecurity; waste pollution; higher living cost; lower living quality;
Cultural-ledPreservation of cultural heritage; construction control; reuse of historic buildings, historic gardens, and historic environment elements;Providing more public facilities and public spaces; enhance community reputation and image; increase residents’ sense of place and cultural identity;Reduce residents’ investment in housing improvement; reduce locally-based social and economic vitality;
Table 3. Indexes of physical planning measures.
Physical Planning MeasuresIndexQuantitative MethodData Source
City scaleTransportation planningX1Traffic accessibilityOrigin-Destination Cost MatrixOfficial data
Public facility planningX2Accessibility of tourist facilityKernel density analysisOpen-source big data of POI
X3Accessibility of resident facility
X4Accessibility of shared facility
Public space planningX5Service area of large parkService area analysis
(0 = out; 1 = in)
Official data
X6Service area of small park
Sanitation facility planningX7Nimby area of public toiletService area analysis
(0 = out; 1 = in)
Open-source big data of POI
Community scaleHeritage conservationX8Buffer zone of cultural relicService area analysis
(0 = out; 1 = in)
Official data
Economic developmentX9Commercialization of access streetLikert scale
(coding:1~5)
Official data and expert scoring
Image and infrastructureX10Physical upgrading of access streetLikert scale
(coding:1~9)
Official data and expert scoring
Household scaleHousing improvementX11Housing maintenanceLikert scale
(coding:1~5)
Questionnaire survey
Housing securityX12Installation of flush toiletCategorical scale
(0 = no; 1 = yes)
Questionnaire survey
Table 4. Results of two-factor enhancement (top 5).
District ADistrict BDistrict C
Two-Factor EnhancementqTwo-Factor EnhancementqTwo-Factor Enhancementq
X11 ∩ X120.231X9 ∩ X110.182X7 ∩ X110.128
X1 ∩ X120.165X6 ∩ X110.167X9 ∩ X110.118
X3 ∩ X120.125X3 ∩ X110.162X8 ∩ X110.094
X7 ∩ X120.109X5 ∩ X110.144X3 ∩ X70.069
X8 ∩ X120.106X1 ∩ X100.106X5 ∩ X70.064
Table 5. Results of Multiple Regression Models.
VariablesDistrict A
N = 124
District B
N = 103
District C
N = 95
Control variables
Individual attributeC1Gender−0.1050.0230.050
C2Age−0.046−0.1580.089
C3Hukou−0.180 *−0.1050.150
C4Income level0.188 *0.0290.228 *
C5Education level−0.203 *−0.278 *0.047
Social supportC6Family structure0.0180.0100.023
C7Neighborly relations0.0670.201 *0.165
C8Length of residence−0.1480.038−0.123
Inherent living environmentC9Housing property rights0.227 *0.062−0.198
C10Housing area0.349 **0.035−0.106
Non-physical planning measures
Community developmentW1Community planning service0.306 ***0.1400.243 *
W2Community participation0.268 ***0.361 ***0.361 ***
Physical planning measures
City levelX1Traffic accessibility−0.166−0.213−0.323
X2Accessibility of tourist facility0.119−0.340−0.262
X3Accessibility of resident facility0.351 **0.197−0.005
X4Accessibility of shared facility−0.1240.1750.233
X5Service area of large park−0.208 *--−0.027
X6Service area of small park−0.172 *0.057−0.036
X7Nimby area of public toilet−0.1110.0520.227 *
Community levelX8Buffer zone of cultural relic−0.065−0.045−0.058
X9Commercialization of access street0.070−0.0030.030
X10Physical upgrading of access street−0.1030.102−0.142
Household levelX11Housing maintenance0.181 *0.1450.163
X12Installation of flush toilet0.178 *0.1190.177 *
*** p < 0.001; ** 0.001 < p < 0.01; * 0.01 < p < 0.1.
Disclaimer/Publisher’s Note: The statements, opinions and data contained in all publications are solely those of the individual author(s) and contributor(s) and not of MDPI and/or the editor(s). MDPI and/or the editor(s) disclaim responsibility for any injury to people or property resulting from any ideas, methods, instructions or products referred to in the content.

