Article

Effects of a Multifunctional Cover Crop (LivinGro®) on Soil Quality Indicators in Zaragoza, Spain

by
Javier González-Pérez
1,*,
José Antonio Sillero-Medina
1,
Paloma Hueso-González
1,
José Damián Ruiz-Sinoga
1,
Francisco Javier Peris-Felipo
2 and
Ana Lia Gayán-Quijano
2
1
Institute of Habitat, Territory and Digitalisation, University of Malaga, 29071 Málaga, Spain
2
Syngenta Crop Protection, 4058 Basel, Switzerland
*
Author to whom correspondence should be addressed.
Land 2025, 14(1), 27; https://doi.org/10.3390/land14010027
Submission received: 20 November 2024 / Revised: 22 December 2024 / Accepted: 25 December 2024 / Published: 26 December 2024
(This article belongs to the Section Land, Soil and Water)

Abstract

:
Soil degradation is a significant threat to agricultural systems and contemporary societies worldwide, especially in the context of climate change. Proper management of agricultural systems is a priority for maintaining food security and achieving sustainable development. It is therefore important to assess the efficacy of different interventions that are designed to improve the quality of agricultural soils. Measurements of physical, chemical, and biological indicators of soil quality can be used to examine the efficacy of strategies or methods that were designed to prevent soil degradation. We measured seven physicochemical indicators of soil quality at a representative experimental plot of nectarines in the province of Zaragoza (Spain) over three years (2020–2023) and compared the effect of a multifunctional cover crop (LivinGro® MCC, Basel, Switzerland) with conventional treatment (control) on soil quality. Soil samples were collected every two months from the treelines and inter-rows (paths for farming vehicles). In general, the MCC zones in the treelines and inter-rows had better soil health, especially in key indicators such as basal soil respiration, organic matter, nitrogen, and porosity. Climatic variability, especially seasonal differences in rainfall, also affected multiple soil indicators. During many sample periods, the MCC zones of the treelines and inter-rows had significantly increased soil organic matter, basal respiration, total nitrogen, nitrate, total porosity, and available water content, but the MCC and control zones had no significant differences in bulk density. The differences between the MCC zones and control zones, especially in basal soil respiration, were greater during the wet seasons. Our results indicate that the LivinGro® MCC prevented degradation of agricultural soils in a region with a continental Mediterranean climate.

1. Introduction

Soil is a natural resource that is fundamental to food security and mitigation of climate change because it supports plant growth, harbors diverse beneficial microorganisms, and is a major reservoir of organic carbon [1]. However, the increasing world population and inappropriate soil management practices have threatened soils worldwide because they have led to degradation of the physical, chemical, biological, and ecological activities of soils [2]. Sustainable management of agricultural systems and soils are significant challenges, especially because of climate change and agricultural intensification [3]. Thus, there is increasing interest in using cover crops to improve soil health and increase the resilience of agricultural systems [4].
Specifically, several studies that investigated the effect of introducing cover crops between the rows of different crop plants found that they mitigated various agronomic and environmental problems [5]. In addition, cover crops that are planted between the main crop cycles throughout the agricultural season can improve soil quality and health [6]. Among the many advantages of cover crops, one of the major benefits is that they reduce soil erosion [7]. A benefit provided by multifunctional cover crops (MCC), such as the LivinGro® MCC developed by Syngenta, is that it can increase the fertility and amount of organic matter in soils [8,9]. A third benefit is that cover crops can act as physical barriers that prevent or limit the spread of weeds [10]. Fourth, cover crops can increase microbial biodiversity in the soil [11]. Finally, cover crops can improve soil structure, water balance, and nutrient retention, all of which are fundamental for the long-term sustainability of agricultural systems [6,7,12].
Despite the many benefits of cover crops, agricultural regions have not yet fully adopted the use of cover crops [13]. This is largely due to a lack of understanding of the scientific studies that documented their long-term benefits, and the limited knowledge of how various factors, such as local soil and climatic conditions, affect these benefits [14]. Thus, it is necessary to further examine changes of the main indicators of soil quality after the establishment of cover crops on agricultural plots [15]. Many indicators are used to evaluate soil quality. For example, soil organic matter (SOM) is a key determinant of soil fertility, and it also promotes microbial activity and acts as a source of essential plant nutrients [16]. Basal soil respiration (BSR) is another important indicator that determines microbial activity based on CO2 release and is a key process in nutrient mineralization and decomposition of SOM [17]. Total nitrogen (TN) is a key indicator of soil fertility [18], and nitrate (NO3) is the form of nitrogen most readily taken up by plants and is therefore a key indicator of crop growth and development [19]. Total porosity (TP) provides fundamental information about air and water circulation in the soil [20]. Bulk density (BD) provides information on the degree of soil compaction, a property that is associated with water infiltration and root growth [21]. Finally, the available water content (AWC) summarizes the water retention capacity of soil and indicates the accessibility of this water to vegetation [22].
The main objective of this paper is to examine the effect of the LivinGro® MCC on soil quality indicators and properties in a specific agricultural region of Spain that has a continental Mediterranean climate. We therefore performed a detailed analysis of changes in the properties of soil over time to assess the benefits of a cover crop over conventional techniques. Although many previous studies have examined the effects of cover crops, the present study goes a step further by analyzing the effect of a MCC in the inter-rows (paths for farming vehicles) between rows of nectarine trees. Another important aim was to provide detailed descriptions of the changes in soil indicators over time, including variations at the seasonal level and annual level, a key element of soil dynamics in the Mediterranean region.

2. Materials and Methods

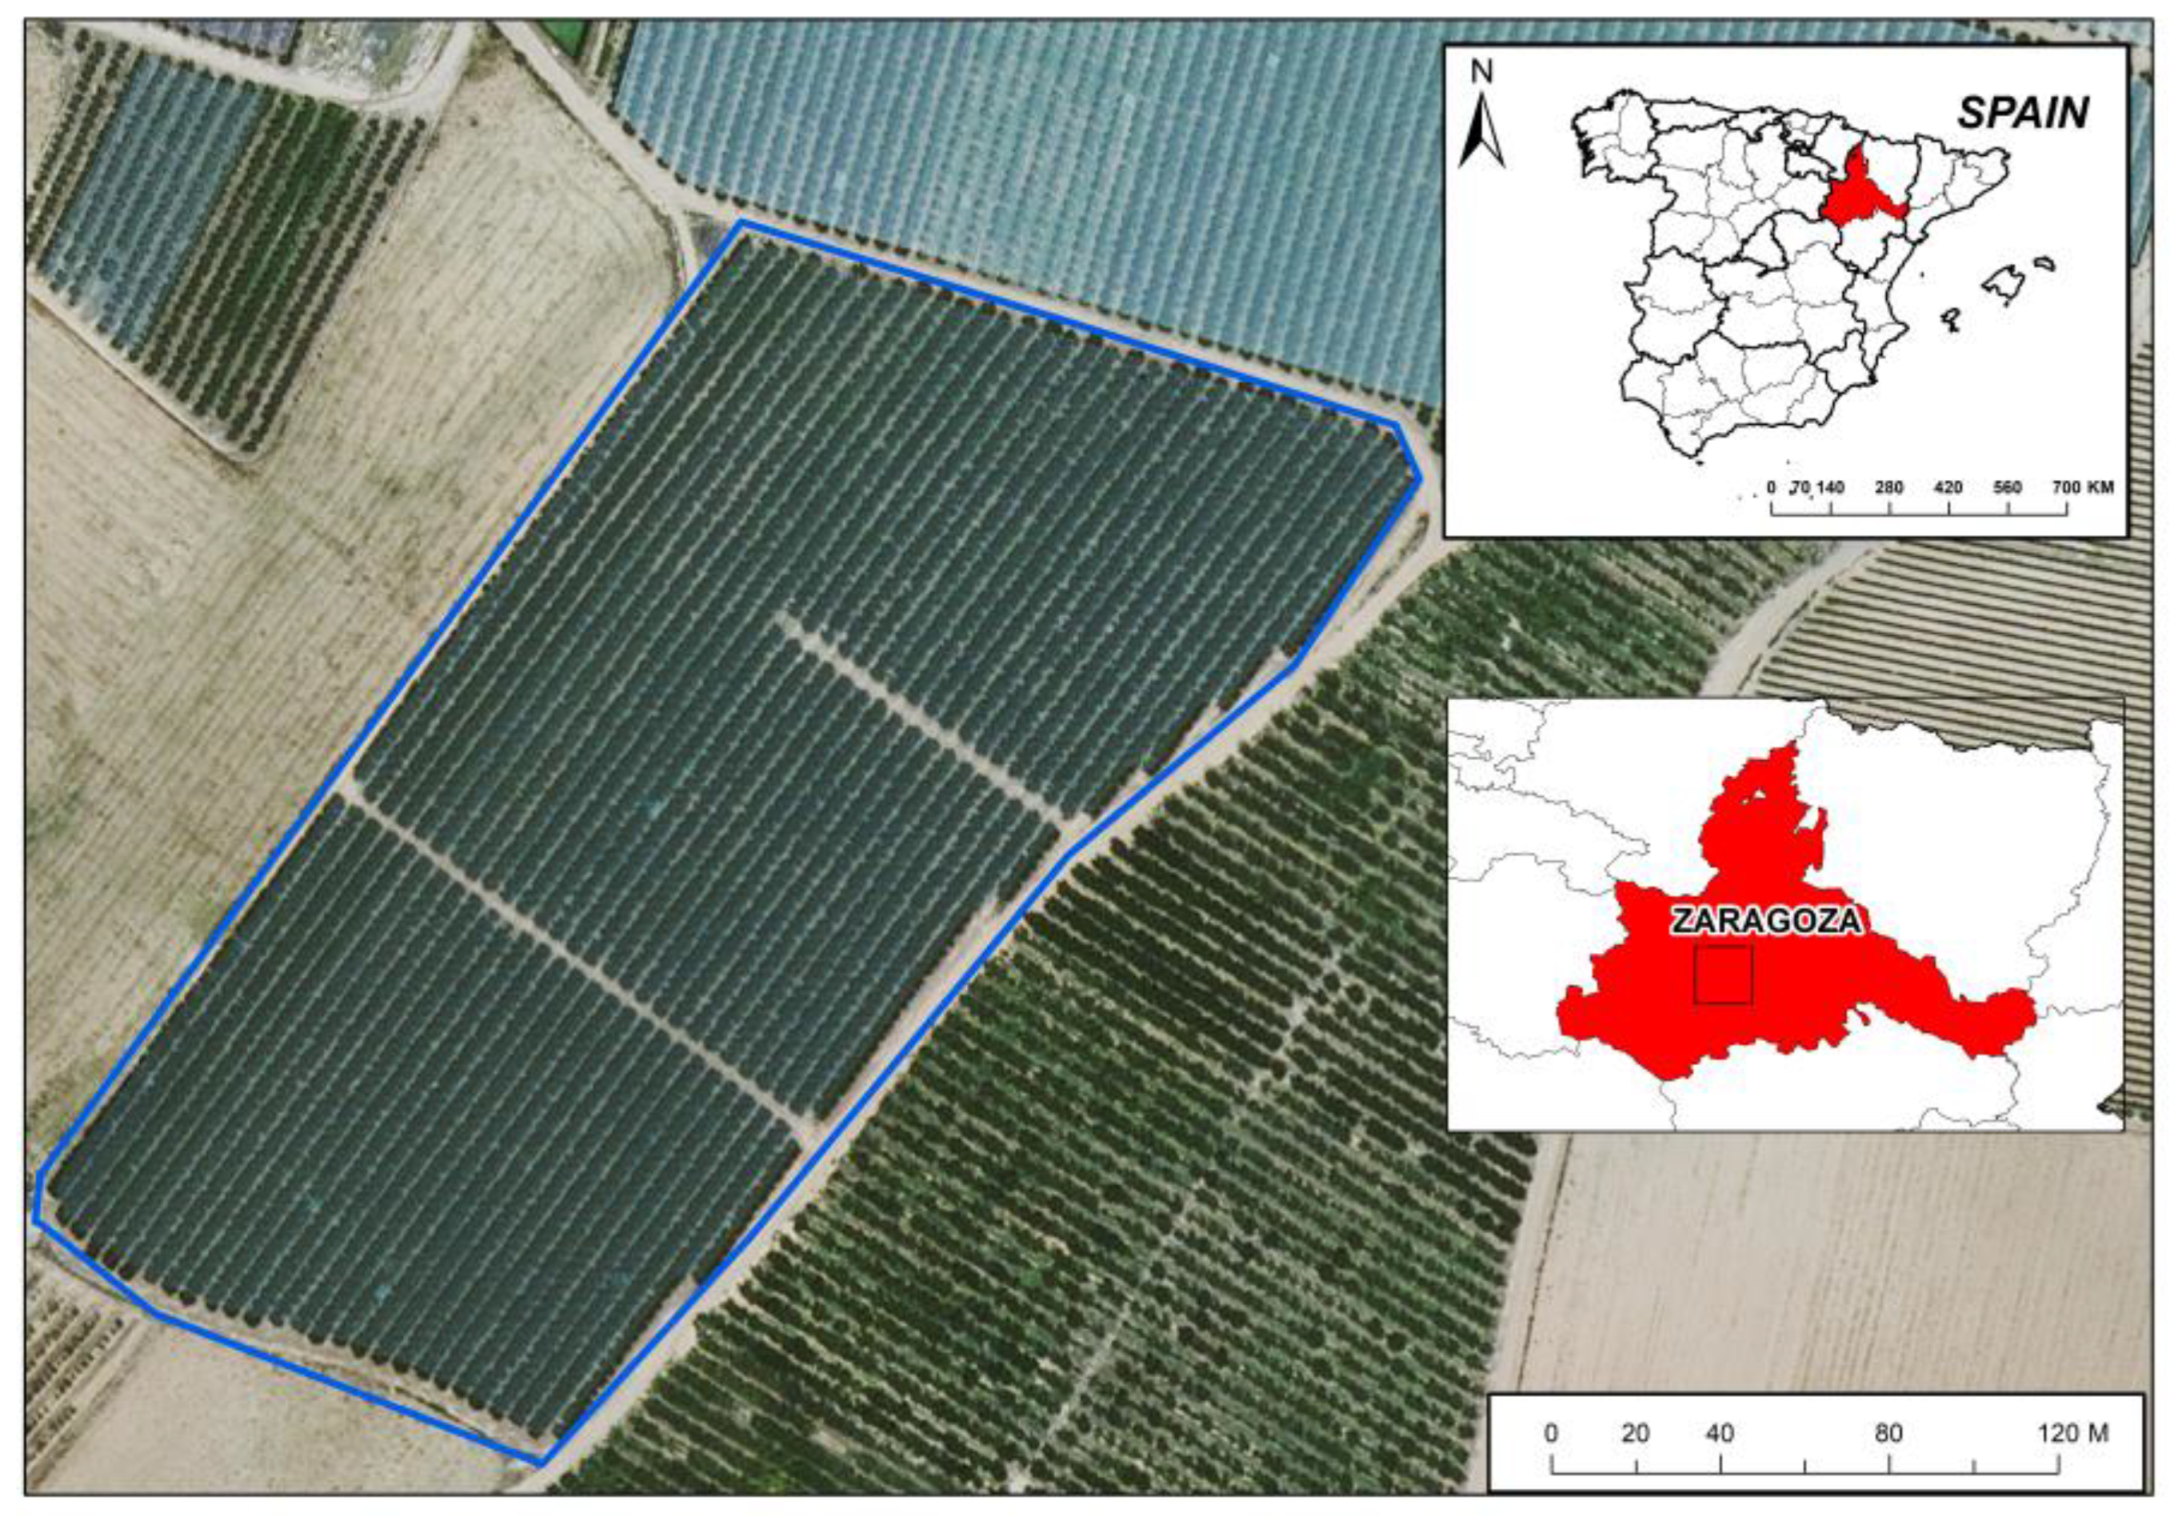
2.1. Experimental Area

All experiments were performed in the municipality of ‘Almunia de Doña Godina’ (southwest of the city of Zaragoza), which is located at 389 m a.s.l. in the Ebro River Valley and in the autonomous community of Aragón (Figure 1), 41°29′48.35′ N, 1°16′59.21′ W. This region is located in a transition area between the Ebro Depression and the foothills of the Sistema Ibérico and is characterized by a gentle topography, with an average gradient of 4%. It has soil-sedimentary formations of limestone crusts, with a silty loam texture (sands: 28%; silts: 62%; clays: 10%). The plot is cultivated with nectarines, a fruit of great agricultural importance in this region due to its high commercial demand and the favorable conditions for cultivation in this type of soil and climate.
According to the Köppen climate classification, the climate in this area is defined as continental Mediterranean (Ds) and is characterized by hot and dry summers with cold and relatively wet winters. The mean annual precipitation during the 4-year study period was 378.95 mm, and the mean annual temperature was 16.1 °C. Both had considerable seasonal variability (Figure 2).
This region has a clear seasonal pattern of temperature. Temperatures are high during the summer (June–August), with the average summer temperature near 25 °C, and are low during the winter (December–February), with the average winter temperature below 10 °C. Precipitation has greater intra- and inter-annual variability. There are typically significant maxima during the winter and spring months, but no significant decreases during the summer.

2.2. Experimental Design

The study was performed from 2020 to 2023 in an experimental plot with a total area of 4.6 ha, cultivated with adult nectarines (Prunus persica var. nectarina). Two distinct zones were established within this plot: in the MCC LivinGro® zone, an herbaceous mixture was plated between the rows of trees; in the control zone (C), there was no addition of the MCC and no spontaneous vegetation (Figure 3).
The MCC LivinGro® product consisted of a mixture of seeds of Chrysanthemum ssp. (3%), Coriandrum sativum L. (10%), Eruca vesicaria (L.) Cav. (5%), Melilotus officinalis (L.) Pall. (8%), Onobrychis viciaefolia Scop. (22%), Salvia pratensis L. (10%), Trifolium vesiculosum Savi (4%), and Vicia sativa L. (30%). This mixture was sown manually (15 kg/ha) and using an electric seed drill with air distribution after soil preparation using a flail mower, and the seeds were subsequently covered using a drag harrow. The three rows planted with the MCC were mowed and replanted each year during the autumn. The three rows that received the conventional (control) treatment were kept free of cover crops and weeds using standard agricultural practices (residual herbicide at the beginning of the season and mechanical weed maintenance during the season to remove spontaneous vegetation).

2.3. Sampling and Analysis of Soil Properties

Soil samples from the MCC zone and control zone were collected every 2 months from September 2020 to September 2023 (36 months). On each of the 16 sampling dates, 12 samples (1 kg each) were taken from the 6 inter-rows (3 MCC and 3 control), and 12 (100 cm3 cylinders) were taken from the 6 treelines (3 MCC and 3 control) to a depth of 20 cm, for a total of 192 samples.
For analysis, the data from the 16 sampling dates were pooled into 6 different periods defined by wet seasons (October–April) and dry seasons (May–September): Period 1, October 2020–April 2021; Period 2, May 2021–September 2021; Period 3, October 2021–April 2022; Period 4, May 2022–September 2022; Period 5, October 2022–April 2023; and Period 6, May 2023–September 2023.
After collection, seven soil indicators were analyzed in the laboratory: (i) SOM, using the Walkley-Black method of oxidation with dichromate and subsequent titration [23,24]; (ii) BSR, using incubation in a portable gas analyzer (PBI Dansensor Check Mate 3) [25]; (iii) NO3 content according to ISO/TS 14256-1 (2003); (iv) TP percentage, using an air pycnometer (Eijkelkamp 08. 60); (v) TN, using the Dumas method with a TruSpec macro CHNS Elemental Analyzer (Leco); (vi) BD, from the ratio of dry soil mass (solid phase and pores) to soil volume; and (vii) AWC, from water holding capacity using pressure pots with PF Richards extractor plates.

2.4. Statistical Analysis

ANOVA was used to compare the significance of differences in soil quality indicators from independent samples of the two groups, and Levene’s test was used to determine the equality of variances. Based on a post hoc test (Tukey’s test or Games-Howell test), a p-value ≤ 0.05 was considered significant, and a p-value ≤ 0.01 was considered highly significant. Statistical analysis was carried out using the IBM SPSS Statistics software version 28.0 package (IBM Corp., Armonk, NY, USA, 2017) with corporate license of the University of Malaga for Windows

3. Results

We examined seven indicators of soil quality to compare the effects of an MCC treatment with conventional (control) treatment from 2020 to 2023. The seasonal changes in many of these indicators can be attributed to the seasonal variability of precipitation and temperature in this Mediterranean region.
In general, the MCC zone had greater levels of SOM in the treelines and inter-rows (Figure 4). In the treelines, these differences were significant during Period 1 (6.23 ± 0.13% vs. 3.81 ± 0.66%), Period 3 (5.27 ± 0.50% vs. 3.67 ± 0.59%), Period 4 (3.45 ± 0.10% vs. 2.18 ± 0.09%), and Period 6 (5.61 ± 0.69% vs. 2.88 ± 0.29%). In the inter-rows, these differences were significant during Period 1 (5.81 ± 0.90% vs. 3.93 ± 0.74%), Period 3 (5.67 ± 0.65% vs. 2.93 ± 0.44%), Period 4 (5.06 ± 0.71% vs. 4.2 ± 0.02%), and Period 5 (6.12 ± 0.97% vs. 3.92 ± 0.97%).
Our measurements of BSR (Figure 5) also showed that the MCC zone generally had greater microbial activity in the treelines and inter-rows. In the treelines, these differences were significant during Period 4 (32.16 ± 9.21 vs. 15.14 ± 4.77 mg CO2/kg soil) and Period 6 (134.00 ± 12.13 vs. 42.45 ± 7.45 mg CO2/kg soil). Although the differences during other periods were not significant, all the values were greater in the MCC zone. In the inter-rows, these differences were significant during Period 1 (101.48 ± 5.88 vs. 44.37 ± 2.85 mg CO2/kg soil), Period 2 (58.84 ± 12.48 vs. 33.94 ± 7.56 mg CO2/kg soil), Period 3 (48.52 ± 1.35 vs. 25.02 ± 5.88 mg CO2/kg soil), and Period 5 (73.41 ± 9.69 vs. 49.06 ± 7.81 mg CO2/kg soil).
The TN content was also generally greater in the MCC zone of the treelines and inter-rows (Figure 6). Specifically, in the treelines, the TN was significantly greater during Period 4 (0.19 ± 0.06% vs. 0.09 ± 0.02%), Period 5 (0.43 ± 0.02% vs. 0.20 ± 0.02%), and Period 6 (0.54 ± 0.05% vs. 0.20 ± 0.03%). Interestingly, the differences were smaller and not significantly different during the first three periods. In the inter-rows, the TN was significantly greater during Period 1 (0.25 ± 0.03% vs. 0.12 ± 0.06%), Period 2 (0.18 ± 0.01% vs. 0.08 ± 0.01%), Period 3 (0.29 ± 0.07% vs. 0.14 ± 0.04%), Period 4 (0.23 ± 0.06% vs. 0.11 ± 0.01%), and Period 6 (0.37 ± 0.03% vs. 0.11 ± 0.01%). Importantly, the differences between the MCC zone and control zone were larger in the treelines than in the inter-rows during Periods 5 and 6.
Our measurements of NO3 (Figure 7) also showed generally greater levels in the MCC zone of the treelines and inter-rows. In the treelines, these differences were significant during Period 2 (189.12 ± 35.23 vs. 23.58 ± 4.80 mg NO3/kg soil) and Period 3 (64.77 ± 19.80 vs. 8.61 ± 2.36 mg NO3/kg soil). In the inter-rows, the difference was only significant during Period 6 (330.82 ± 16.60 vs. 273.78 ± 31.72 mg NO3/kg soil). These results indicate that the seasonal changes in NO3 were similar in the treelines and inter-rows. Moreover, the MCC zone and control zone had greater differences in TN than in NO3.
Our measurements of the TP (Figure 8) showed that this indicator was significantly greater in the MCC zone of treelines during Period 1 (39.75 ± 3.28% vs. 32.16 ± 2.56%), Period 2 (48.44 ± 1.81% vs. 44.67 ± 2.18%), and Period 5 (45.87 ± 2.85 vs. 40.71 ± 1.25%). The TP was also significantly greater in the MCC zone of the inter-rows during the same three periods (Period 1: 38.77 ± 2.77% vs. 34.00 ± 1.09%; Period 2 (50.00 ± 1.22% vs. 43.57 ± 2.43%; Period 5: 48.22 ± 3.77% vs. 48.11 ± 2.20%). Notably, the TP also increased over time (from Period 1 to Period 6) in the treelines and inter-rows, given that the initial values were about 40% and the final values in the MCC zone were over 50% (treelines: 53.75 ± 2.87%; inter-rows: 51.8 ± 2.16%). There was also a tendency for a higher average TP in the MCC zone of the treelines during Periods 1, 3, and 5 compared to Periods 2, 4, and 6, indicating a seasonal effect. On the other hand, in inter-rows, there were greater increasing tendencies between the MCC and the control with slight statistical differences with respect to the treeline, therefore showing a greater impact in this location.
We also measured changes in BD from October 2020 to September 2023 (Figure 9). The results indicated no significant differences in any of the pairwise comparisons of the MCC zone and control zone. However, in the treelines, the MCC zone had slightly lower BD values during Periods 1, 2, 3, 4, and 5. In the inter-rows, the MCC zone had lower BD values during Periods 1, 2, 3, 4, and 6. These results suggest that the application of the MCC decreased soil compaction more in the inter-rows than in the treelines.
We measured AWC over two years, from October 2021 to September 2023 (Figure 10). For the treelines, there were significantly greater AWC values in the MCC zone during Period 3 (17.47 ± 0.36% vs. 14.20 ± 0.82%) and Period 5 (24.39 ± 0.06% vs. 13.95 ± 2.50%). For the inter-rows, there was a significant increase in the MCC zone only during Period 6 (21.64 ± 2.65% vs. 12.57 ± 1.27%). In addition, although all measurements of AWC were greater in the MCC zone, the differences were greater during wet months in the treelines, but were greater during the dry months in the inter-rows. This suggests that the effect of the MCC depends on the season and location.

4. Discussion

This study was a spatiotemporal evaluation of the effect of a specific MCC (LivinGro®) on various physicochemical, hydrological, and microbiological indicators relevant to assess soil quality in an agricultural region that has a continental Mediterranean climate. This evaluation is essential for understanding the impact of agricultural practice on soil, a topic widely recognized within the scientific community [26,27]. In this case, a conventional (control) treatment was compared with the MCC treatment based on seven different key indicators of soil quality in the treelines and inter-rows of a nectarine orchard. First, the results obtained showed that relative to the control treatment, the MCC increased SOM by 2.01% in the treelines and 2.46% in the inter-rows. This increase was also affected by seasonal rainfall in the study area, although the effect of season on SOM was less pronounced in the treelines [28]. SOM is considered one of the main indicators of soil quality, and a higher value corresponds to multiple benefits related to increased nutrient availability [29,30]. Our findings regarding this indicator align with those of Hao et al. [9], who concluded that application of a cover crop increased the average level of organic matter among all their study plots by 10.7%. Similarly, Demir and Işık [31] and Haruna et al. [32] reported that a cover crop led to a 0.73% annual increase of SOM relative to the conventional method. Several additional studies also found that SOM increased after the introduction of cover crops [33,34,35]. De Torres et al. [36] showed that the residue from a MCC helped to maintain or increase soil fertility in a Mediterranean olive grove in Córdoba, Spain. Amaral et al. [37] also studied the effects of a cover crop on organic carbon and microbial biomass compared to a conventional treatment in which herbicides were used to control plant growth in the control regions (as in the present study). They concluded that the cover crop led to better soil quality than the control.
The BSR is considered an essential indicator of microbial activity as well as soil health and quality, as it reflects the metabolic activity of soil microorganisms. An increase in this indicator reflects higher microbial activity and a biologically more active soil [38,39]. Additionally, TN plays a fundamental role in soil function because nitrogen is an essential nutrient for plant growth and development [40]. Nitrogen is an essential component of chlorophyll and amino acids, and it also increases the availability of other essential nutrients in the soil [41]. Our results confirmed that the MCC led to increases in BSR and TN, and that these two indicators had similar dynamics throughout the study period, indicating a relationship between microbial activity and TN in the soil. This relationship was particularly notable during the wet seasons, such as Period 1 (MCC: 101.48 ± 5.88 mg CO2; control: 44.37 ± 2.85 mg CO2). However, the MCC also had a large effect on BSR during Period 6, and this was likely due to the significant precipitation of June 2023. Moisture and temperature are key factors that regulate microbial activity (BSR) throughout the year. Specifically, greater water availability in the soil creates better conditions for microorganisms and increases their access to nutrients [42,43]. Our results align with the results of Mbutia et al. [44] and highlight the value of incorporating a MCC to increase microbial activity and the storage of carbon and TN in the soil. Demir [45] asserted that MCC-based treatments improved the chemical properties of the soil, especially BSR. These effects were most evident in the upper 20 cm of soil, a region with a significant improvement of BSR in the MCC zone (41.5 mg CO2/kg soil) compared to the control zone (12.5 mg CO2/kg soil). These changes in BSR occurred in parallel with changes in TN. However, this previous study emphasized the variability in results due to the use of different plant species. Based on these results, it can be concluded that the implementation of MCC has led to a significant increase in this key microbiological soil indicator [46]. This increase indicates that MCC contributes to the input of organic residues into the soil, which promotes an acceleration of the decomposition of SOM [47]. Furthermore, it enhances nutrient cycling and increases the availability of TN in the soil for the main crop [48]. It is associated with a higher active microbial biomass, reinforcing its role in enhancing soil quality and functionality [49].
TP is another key indicator of soil quality due to its relationship with various vital processes that are related to soil structure, microbial activity, and the water cycle [50,51]. We found that introduction of a MCC increased the TP by 3.89% in the inter-row area and 3.49% in the treelines, compared to the control. This increase is presumably related to improvements in soil structure, water retention, and soil fertility [32]. A MCC can promote root development and serve as a protective medium for the prevention of soil erosion [52]. Similarly, BD is a key indicator of soil compaction [53]. Although there were no significant differences in our pairwise comparisons of the MCC zone and control zone, the BD was consistently lower in the MCC zone than in the control zone (0.11 g/cm3 lower in the treelines and 0.19 g/cm3 lower in the inter-rows). This indicates that the MCC decreased soil compaction and improved soil structure. These results are consistent with the studies of Pott et al. [54] demonstrating that the implementation of MCC improved the soil’s physical properties. Specifically, they observed a reduction in BD of more than 5% and an increase in soil air-filled porosity at −100 hPa (0.0–0.2 m) of up to 27%. Similarly, Klopp et al. [55] determined winter rye cover crop reduced field BD by 5% (0 to 15 cm depth).
On the other hand, we found that the effects of the MCC on AWC were similar to its effects on TP and BD [56]. The average AWC the MCC zone was 2.71% greater in the treelines and 3.65% greater in the inter-rows, relative to the control zone. A higher AWC indicates greater water availability and improved growth and development of plants. Our results are consistent with multiple previous studies. For example, Hao et al. [9] concluded that the application of a MCC improved TP by an average of 2.6% among 153 agricultural plots and increased useful water content in the soil by an average of 12.2% in 59 plots. Demir and Işık [28] and Haruna et al. [29] reported that a MCC increased the TP and led to greater structural stability and water storage capacity of soils. Therefore, the increase in TP, coupled with the decrease in BD and the increase in AWC in the soil, results in enhanced aeration capacity [54,57] as well as improved water infiltration and retention [58]. This result creates better conditions for increased microbial activity, as indicated by a higher BSR [59]. On the other hand, Chen et al. [60] argued that an additional benefit of cover crops may be that they promote biodiversity.

5. Conclusions

The results of this study demonstrated that the introduction of a MCC was an effective method for improving soil quality in a nectarine orchard located in a region with a continental Mediterranean climate. More specifically, the MCC led to significant increases in soil organic matter of 2.01% in treelines and 2.46% in inter-rows. It also led to increases in basal respiration, total nitrogen, total porosity, and available water content compared to the control (conventional) treatment. The MCC also led to a decreased BD, reflecting decreased soil compaction.
A main result of our study is that the introduction of a MCC in the inter-row area between nectarine trees in our agricultural plot led to multiple benefits for the agricultural soils. These benefits include enhanced soil fertility, as indicated by the increases in SOM, TN, and NO3. We also observed an increase in microbial activity, suggesting greater microbial biodiversity in the surface layer of the soil. The MCC also improved soil structure, manifesting as an increase of TP and a decrease of BD. This improvement in soil structure also led to greater availability of water (AWC). A second important finding of our study is that the benefits of the MCC depended on the season. There were larger increases in the BSR and SOM during the wet season (October–April) than the dry season (May–September). Finally, we conclude that the MCC enhances soil quality indicators, with a positive impact on both inter-rows and treelines. Greater improvements were observed in the inter-rows, as this is the area where the MCC cultivation was directly applied. Furthermore, these improvements in the physicochemical indicators of the soil have resulted in greater nutrient availability, promoting increased microbial activity in the soil, as evidenced by basal respiration as a key microbiological indicator.

Author Contributions

Conceptualization, J.G.-P., J.A.S.-M. and J.D.R.-S.; methodology, J.G.-P., P.H.-G., F.J.P.-F. and A.L.G.-Q.; software, J.G.-P. and P.H.-G.; validation, J.A.S.-M. and F.J.P.-F.; formal analysis, J.A.S.-M. and J.D.R.-S.; investigation, J.G.-P. and J.A.S.-M.; resources, J.D.R.-S., F.J.P.-F. and A.L.G.-Q.; data curation, J.G.-P. and P.H.-G.; writing—original draft preparation, J.G.-P. and J.A.S.-M.; writing—review and editing, J.A.S.-M., J.D.R.-S., F.J.P.-F. and A.L.G.-Q.; visualization, J.G.-P., J.A.S.-M., P.H.-G., J.D.R.-S., F.J.P.-F. and A.L.G.-Q.; supervision, J.D.R.-S. and F.J.P.-F.; project administration, J.D.R.-S. and F.J.P.-F. All authors have read and agreed to the published version of the manuscript.

Funding

This work is part of the research contracts “Analysis for soil biodiversity in agricultural pilot sites in Spain” (8.06/6.31.6286) and “Analysis for soil biodiversity in agricultural pilot sites in Spain” (8.06/6.17.5576 and 8.06/6.17.5576-1) funded by the project LivinGro® (Syngenta Crop Protection). Additionally, part of this research was made possible thanks to funding from the University of Malaga, through the I Plan Propio de Investigación, Transferencia y Divulgación Científica.

Informed Consent Statement

Informed consent was obtained from all subjects involved in the study.

Data Availability Statement

The data presented in this study are available upon request from the corresponding author.

Acknowledgments

We express our sincere gratitude to Oscar Luis Aguado, Rodrigo Aguado, and Dario García for their kindness and hard work during the sampling period. We also thank Alberto Díez from the company Frutas Díez Soria for graciously permitting us to carry out this study at his farm. Additionally, our heartfelt thanks go to Luis Miranda for his invaluable contributions in making this project possible.

Conflicts of Interest

Authors Peris-Felipo, F.J. and Gayán-Quijano, A.L. were employed by the Syngenta Crop Protection AG. The remaining authors declare that the research was conducted in the absence of any commercial or financial relationships that could be construed as a potential conflict of interest. Syngenta Crop Protection AG partially financed the project. The funders had no role in the design of the study; in the collection, analyses, or interpretation of data; in the writing of the manuscript, or in the decision to publish the results.

References

  1. Georgiou, K.; Jackson, R.B.; Vindušková, O.; Abramoff, R.Z.; Ahlström, A.; Feng, W.; Harden, J.W.; Pellegrini, A.F.A.; Polley, H.W.; Soong, J.L.; et al. Global Stocks and Capacity of Mineral-Associated Soil Organic Carbon. Nat. Commun. 2022, 13, 3797. [Google Scholar] [CrossRef]
  2. Lal, R. Restoring Soil Quality to Mitigate Soil Degradation. Sustainability 2015, 7, 5875–5895. [Google Scholar] [CrossRef]
  3. Robles, E.O.L.; Silva, I.C.; Pulido, S.J.B. Efectos Del Cambio Climático En La Gestión Sostenible Del Recurso Suelo. Tecnociencia Chihuah. 2022, 16, e1097. [Google Scholar] [CrossRef]
  4. Andi, S.A.R. Estrategias Para La Conservación de La Salud Del Suelo: Una Revisión Sistemática. Available online: https://repositorio.ucv.edu.pe/handle/20.500.12692/102623 (accessed on 25 September 2024).
  5. Plastina, A.; Liu, F.; Miguez, F.; Carlson, S. Cover Crops Use in Midwestern US Agriculture: Perceived Benefits and Net Returns. Renew. Agric. Food Syst. 2018, 35, 38–48. [Google Scholar] [CrossRef]
  6. Koudahe, K.; Allen, S.C.; Djaman, K. Critical Review of the Impact of Cover Crops on Soil Properties. Int. Soil Water Conserv. Res. 2022, 10, 343–354. [Google Scholar] [CrossRef]
  7. Ruiz-Colmenero, M.; Bienes, R.; Eldridge, D.J.; Marques, M.J. Vegetation Cover Reduces Erosion and Enhances Soil Organic Carbon in a Vineyard in the Central Spain. Catena 2012, 104, 153–160. [Google Scholar] [CrossRef]
  8. Blanco-Canqui, H.; Ruis, S.J. Cover Crop Impacts on Soil Physical Properties: A Review. Soil Sci. Soc. Am. J. 2020, 84, 1527–1576. [Google Scholar] [CrossRef]
  9. Hao, X.; Najm, M.A.; Steenwerth, K.L.; Nocco, M.A.; Basset, C.; Daccache, A. Are There Universal Soil Responses to Cover Cropping? A Systematic Review. Sci. Total Environ. 2022, 861, 160600. [Google Scholar] [CrossRef]
  10. Rivière, C.; Béthinger, A.; Bergez, J.-E. The Effects of Cover Crops on Multiple Environmental Sustainability Indicators—A Review. Agronomy 2022, 12, 2011. [Google Scholar] [CrossRef]
  11. De Pedro, L.; Perera-Fernández, L.G.; López-Gallego, E.; Pérez-Marcos, M.; Sanchez, J.A. The Effect of Cover Crops on the Biodiversity and Abundance of Ground-Dwelling Arthropods in a Mediterranean Pear Orchard. Agronomy 2020, 10, 580. [Google Scholar] [CrossRef]
  12. Ogilvie, C.M.; Ashiq, W.; Vasava, H.B.; Biswas, A. Quantifying Root-Soil Interactions in Cover Crop Systems: A Review. Agriculture 2021, 11, 218. [Google Scholar] [CrossRef]
  13. Kathage, J.; Smit, B.; Janssens, B.; Haagsma, W.; Adrados, J.L. How Much Is Policy Driving the Adoption of Cover Crops? Evidence from Four EU Regions. Land Use Policy 2022, 116, 106016. [Google Scholar] [CrossRef] [PubMed]
  14. Popovici, R.; Ranjan, P.; Bernard, M.; Usher, E.M.; Johnson, K.; Prokopy, L.S. The Social Factors Influencing Cover Crop Adoption in the Midwest: A Controlled Comparison. Environ. Manag. 2023, 72, 614–629. [Google Scholar] [CrossRef]
  15. Novara, A.; Cerda, A.; Barone, E.; Gristina, L. Cover Crop Management and Water Conservation in Vineyard and Olive Orchards. Soil Tillage Res. 2020, 208, 104896. [Google Scholar] [CrossRef]
  16. Gerke, J. The Central Role of Soil Organic Matter in Soil Fertility and Carbon Storage. Soil Syst. 2022, 6, 33. [Google Scholar] [CrossRef]
  17. Teslya, A.V.; Gurina, E.V.; Poshvina, D.V.; Stepanov, A.A.; Iashnikov, A.V.; Vasilchenko, A.S. Fungal Secondary Metabolite Gliotoxin Enhances Enzymatic Activity in Soils by Reshaping Their Microbiome. Rhizosphere 2024, 32, 100960. [Google Scholar] [CrossRef]
  18. Wang, Q.; He, J. Complete Nitrogen Removal via Simultaneous Nitrification and Denitrification by a Novel Phosphate Accumulating Thauera Sp. Strain SND5. Water Res. 2020, 185, 116300. [Google Scholar] [CrossRef] [PubMed]
  19. Van Gelderen, K.; Kang, C.; Li, P.; Pierik, R. Regulation of Lateral Root Development by Shoot-Sensed Far-Red Light via HY5 Is Nitrate-Dependent and Involves the NRT2.1 Nitrate Transporter. Front. Plant Sci. 2021, 12, 660870. [Google Scholar] [CrossRef] [PubMed]
  20. Toková, L.; Igaz, D.; Horák, J.; Aydin, E. Effect of Biochar Application and Re-Application on Soil Bulk Density, Porosity, Saturated Hydraulic Conductivity, Water Content and Soil Water Availability in a Silty Loam Haplic Luvisol. Agronomy 2020, 10, 1005. [Google Scholar] [CrossRef]
  21. Maurya, S.; Abraham, J.S.; Somasundaram, S.; Toteja, R.; Gupta, R.; Makhija, S. Indicators for Assessment of Soil Quality: A Mini-Review. Environ. Monit. Assess. 2020, 192, 604. [Google Scholar] [CrossRef]
  22. Amorim, H.C.S.; Ashworth, A.J.; Moore, P.A.; Wienhold, B.J.; Savin, M.C.; Owens, P.R.; Jagadamma, S.; Carvalho, T.S.; Xu, S. Soil Quality Indices Following Long-Term Conservation Pasture Management Practices. Agric. Ecosyst. Environ. 2020, 301, 107060. [Google Scholar] [CrossRef]
  23. Walkley, A.J.; Black, I.A. Estimation of soil organic carbon by the chromic acid titration method. Soil Sci. 1934, 37, 29–38. [Google Scholar] [CrossRef]
  24. FAO. World Reference Base for Soil Resource. In A Framework for International Classification, Correlation, and Communication; FAO: Roma, Italy, 2006; p. 145. [Google Scholar]
  25. García, I.C.; Gil, F.; Hernández, T.; Muñoz, M. Técnicas de Análisis de Parámetros Bioquímicos en Suelos: Medida de Actividades Enzimáticas y Biomasa Microbiana; García, I.C., Gil, F., Hernández, T., Trasar, C., Eds.; Ediciones Mundi-Prensa: Barcelona, España, 2003; pp. 328–329. [Google Scholar]
  26. Hughes, H.M.; Koolen, S.; Kuhnert, M.; Baggs, E.M.; Maund, S.; Mullier, G.W.; Hillier, J. Towards a Farmer-Feasible Soil Health Assessment That Is Globally Applicable. J. Environ. Manag. 2023, 345, 118582. [Google Scholar] [CrossRef]
  27. Zheng, X.; Wei, L.; Lv, W.; Zhang, H.; Zhang, Y.; Zhang, H.; Zhang, H.; Zhu, Z.; Ge, T.; Zhang, W. Long-Term Bioorganic and Organic Fertilization Improved Soil Quality and Multifunctionality under Continuous Cropping in Watermelon. Agric. Ecosyst. Environ. 2023, 359, 108721. [Google Scholar] [CrossRef]
  28. Thapa, V.R.; Ghimire, R.; VanLeeuwen, D.; Acosta-Martínez, V.; Shukla, M. Response of Soil Organic Matter to Cover Cropping in Water-Limited Environments. Geoderma 2021, 406, 115497. [Google Scholar] [CrossRef]
  29. Adetunji, A.T.; Ncube, B.; Mulidzi, R.; Lewu, F.B. Management Impact and Benefit of Cover Crops on Soil Quality: A Review. Soil Tillage Res. 2020, 204, 10471. [Google Scholar] [CrossRef]
  30. Demir, Z.; Işık, D. Effects of Cover Crops on Soil Hydraulic Properties and Yield in a Persimmon Orchard. Bragantia 2019, 78, 596–605. [Google Scholar] [CrossRef]
  31. Haruna, S.I.; Anderson, S.H.; Udawatta, R.P.; Gantzer, C.J.; Phillips, N.C.; Cui, S.; Gao, Y. Improving soil physical properties through the use of cover crops: A review. Agrosyst. Geosci. Environ. 2020, 3, e20105. [Google Scholar] [CrossRef]
  32. Wan, R.; Luo, D.; Liu, J.; Zhang, Y.; Xiang, Y.; Yan, W.; Xie, Y.; Mi, J.; Zhang, F.; Wan, X.; et al. Superior Improvement on Soil Quality by Pennisetum Sinese Vegetation Restoration in the Dry-Hot Valley Region, SW China. Sci. Total Environ. 2023, 878, 163185. [Google Scholar] [CrossRef]
  33. Sharma, V.; Irmak, S.; Padhi, J. Effects of Cover Crops on Soil Quality: Part I. Soil Chemical Properties—Organic Carbon, Total Nitrogen, pH, Electrical Conductivity, Organic Matter Content, Nitrate-Nitrogen, and Phosphorus. J. Soil Water Conserv. 2018, 73, 637–651. [Google Scholar] [CrossRef]
  34. Steenwerth, K.; Belina, K.M. Cover Crops Enhance Soil Organic Matter, Carbon Dynamics and Microbiological Function in a Vineyard Agroecosystem. Appl. Soil Ecol. 2008, 40, 359–369. [Google Scholar] [CrossRef]
  35. Van Hall, R.L.; Cammeraat, L.H.; Keesstra, S.D.; Zorn, M. Impact of Secondary Vegetation Succession on Soil Quality in a Humid Mediterranean Landscape. Catena 2016, 149, 836–843. [Google Scholar] [CrossRef]
  36. De Torres, M.A.R.; Carbonell-Bojollo, R.M.; Moreno-García, M.; Ordóñez-Fernández, R.; Rodríguez-Lizana, A. Soil organic matter and nutrient improvement through cover crops in a Mediterranean olive orchard. Soil Tillage Res. 2021, 210, 104977. [Google Scholar] [CrossRef]
  37. Amaral, H.F.; Sena, J.A.; Schwan-Estrada, K.R.F.; Balota, E.L.; Andrade, D.S. Alterações nas propriedades químicas e microbianas de solos cultivados com videiras sob manejo orgânico e convencional no sul do Brasil. Rev. Bras. De Ciência Do Solo 2011, 35, 1517–1526. [Google Scholar] [CrossRef]
  38. De Brito Ferreira, E.P.; Santos, H.P.D.; Costa, J.R.; De-Polli, H.; Rumjanek, N.G. Microbial soil quality indicators under different crop rotations and tillage management. Ciênc. Agron. 2010, 41, 177–183. [Google Scholar] [CrossRef]
  39. Da Silva Aragão, O.O.; De Oliveira-Longatti, S.M.; Souza, A.A.; Da Conceição Jesus, E.; Merlo, M.N.; De Oliveira, E.P.; De Souza Moreira, F.M. The Effectiveness of a Microbiological Attribute as a Soil Quality Indicator Depends on the Storage Time of the Sample. J. Soil Sci. Plant Nutr. 2020, 20, 2525–2535. [Google Scholar] [CrossRef]
  40. Dubey, R.S.; Srivastava, R.K.; Pessarakli, M. Physiological Mechanisms of Nitrogen Absorption and Assimilation in Plants Under Stressful Conditions; En CRC Press eBooks: Boca Raton, FL, USA, 2021; pp. 579–616. [Google Scholar] [CrossRef]
  41. Carlos, F.S.; De Sousa, R.O.; Nunes, R.; De Campos Carmona, F.; Cereza, T.; Weinert, C.; Pasa, E.H.; Bayer, C.; De Oliveira Camargo, F.A. Long-Term Cover Crops and No-Tillage in Entisol Increase Enzyme Activity and Carbon Stock and Enable the System Fertilization in Southern Brazil. Geoderma Reg. 2023, 34, e00700. [Google Scholar] [CrossRef]
  42. Lacroix, E.M.; Rossi, R.J.; Bossio, D.; Fendorf, S. Effects of Moisture and Physical Disturbance on Pore-Scale Oxygen Content and Anaerobic Metabolisms in Upland Soils. Sci. Total Environ. 2021, 780, 146572. [Google Scholar] [CrossRef]
  43. Sierra, C.A.; Malghani, S.; Loescher, H.W. Interactions among Temperature, Moisture, and Oxygen Concentrations in Controlling Decomposition Rates in a Boreal Forest Soil. Biogeosciences 2017, 14, 703–710. [Google Scholar] [CrossRef]
  44. Mbuthia, L.W.; Acosta-Martínez, V.; DeBruyn, J.; Schaeffer, S.; Tyler, D.; Odoi, E.; Mpheshea, M.; Walker, F.; Eash, N. Long Term Tillage, Cover Crop, and Fertilization Effects on Microbial Community Structure, Activity: Implications for Soil Quality. Soil Biol. Biochem. 2015, 89, 24–34. [Google Scholar] [CrossRef]
  45. Demir, Z. The evaluation of basal respiration and some chemical properties of soils under cover crop treatments in a cherry orchard. Eur. J. Soil Sci. 2020, 9, 151–164. [Google Scholar] [CrossRef]
  46. Cazzaniga, S.G.; Braat, L.; Van Den Elsen, S.; Lombaers, C.; Visser, J.; Obinu, L.; Maciá-Vicente, J.G.; Postma, J.; Mommer, L.; Helder, J. Pinpointing the Distinctive Impacts of Ten Cover Crop Species on the Resident and Active Fractions of the Soil Microbiome. Appl. Soil Ecol. 2023, 190, 105012. [Google Scholar] [CrossRef]
  47. Hu, Q.; Zhang, Y.; Cao, W.; Yang, Y.; Hu, Y.; He, T.; Li, Z.; Wang, P.; Chen, X.; Chen, J.; et al. Legume Cover Crops Sequester More Soil Organic Carbon than Non-Legume Cover Crops by Stimulating Microbial Transformations. Geoderma 2024, 450, 117024. [Google Scholar] [CrossRef]
  48. Constantin, J.; Minette, S.; Vericel, G.; Jordan-Meille, L.; Justes, E. MERCI: A Simple Method and Decision-Support Tool to Estimate Availability of Nitrogen from a Wide Range of Cover Crops to the next Cash Crop. Plant Soil 2023, 494, 333–351. [Google Scholar] [CrossRef]
  49. Wang, F.; Li, W.; Chen, H.; Weil, R.R.; Zhu, L.; Nan, X. Forage Radish Cover Crops Improve Soil Quality and Fruit Yield of Lycium barbarum L. in an Arid Area of Northwest China. Agronomy 2023, 13, 1634. [Google Scholar] [CrossRef]
  50. Li, P.; Zhang, H.; Deng, J.; Fu, L.; Chen, H.; Li, C.; Xu, L.; Jiao, J.; Zhang, S.; Wang, J.; et al. Cover Crop by Irrigation and Fertilization Improves Soil Health and Maize Yield: Establishing a Soil Health Index. Appl. Soil Ecol. 2022, 182, 104727. [Google Scholar] [CrossRef]
  51. Zhang, Y.; Tan, C.; Wang, R.; Li, J.; Wang, X. Conservation tillage rotation enhanced soil structure and soil nutrients in long-term dryland agriculture. Eur. J. Agron. 2021, 131, 126379. [Google Scholar] [CrossRef]
  52. Du, X.; Jian, J.; Du, C.; Stewart, R.D. Conservation management decreases surface runoff and soil erosion. Int. Soil Water Conserv. Res. 2022, 10, 188–196. [Google Scholar] [CrossRef]
  53. Montgomery, D.R.; Biklé, A. Soil Health and Nutrient Density: Beyond Organic vs. Conventional Farming. Front. Sustain. Food Syst. 2021, 5, 699147. [Google Scholar] [CrossRef]
  54. Pott, C.A.; Conrado, P.M.; Rampim, L.; Umburanas, R.C.; Conrado, A.M.C.; Outeiro, V.H.; Müller, M.M.L. Mixture of Winter Cover Crops Improves Soil Physical Properties under No-Tillage System in a Subtropical Environment. Soil Tillage Res. 2023, 234, 105854. [Google Scholar] [CrossRef]
  55. Klopp, H.W.; Blanco-Canqui, H.; Sindelar, M.; Jin, V.L.; Schmer, M.R.; Ferguson, R.B. Did Cover Crop or Animal Manure Ameliorate Corn Residue Removal Effects on Soil Mechanical Properties after 10 Years? J. Agric. Food Res. 2023, 14, 100802. [Google Scholar] [CrossRef]
  56. Amsili, J.P.; Van Es, H.M.; Schindelbeck, R.R. Pedotransfer Functions for Field Capacity, Permanent Wilting Point, and Available Water Capacity Based on Random Forest Models for Routine Soil Health Analysis. Commun. Soil Sci. Plant Anal. 2024, 55, 1967–1984. [Google Scholar] [CrossRef]
  57. Rasa, K.; Tähtikarhu, M.; Miettinen, A.; Kähärä, T.; Uusitalo, R.; Mikkola, J.; Hyväluoma, J. A Large One-Time Addition of Organic Soil Amendments Increased Soil Macroporosity but Did Not Affect Intra-Aggregate Porosity of a Clay Soil. Soil Tillage Res. 2024, 242, 106139. [Google Scholar] [CrossRef]
  58. Basset, C.; Najm, M.A.; Ghezzehei, T.; Hao, X.; Daccache, A. How Does Soil Structure Affect Water Infiltration? A Meta-Data Systematic Review. Soil Tillage Res. 2022, 226, 105577. [Google Scholar] [CrossRef]
  59. Hu, J.; Miles, D.M.; Adeli, A.; Brooks, J.P.; Podrebarac, F.A.; Smith, R.; Lei, F.; Li, X.; Jenkins, J.N.; Moorhead, R.J. Effects of Cover Crops and Soil Amendments on Soil CO2 Flux in a Mississippi Corn Cropping System on Upland Soil. Environments 2023, 10, 19. [Google Scholar] [CrossRef]
  60. Chen, L.; Pozsgai, G.; Li, X.; Li, L.; Reddy, G.V.; You, M. Effects of cover crops on beetle assemblages in tea plantations. Crop Prot. 2021, 149, 105783. [Google Scholar] [CrossRef]
Figure 1. Location of the experimental farm in ‘Almunia de Doña Godina’.
Land 14 00027 g001
Figure 2. Mean monthly temperature and precipitation in the study plot from 2020 to 2023. Source: Agroclimatic Information System for Irrigation (RED SAIR).
Land 14 00027 g002
Figure 3. Experimental design. Control: bare soil with removal of spontaneous vegetation; MCC: multifunctional cover crop; A: treeline; B: inter-row (paths for farm vehicles).
Land 14 00027 g003
Figure 4. Changes in SOM in the MCC and control zone in the treelines (A) and inter-rows (B) from 2020 to 2023. P1: Period 1, October 2020–April 2021; P2: Period 2, May 2021–September 2021; P3: Period 3, October 2021–April 2022; P4: Period 4, May 2022–September 2022; P5: Period 5, October 2022–April 2023; P6: Period 6, May 2023–September 2023. b *, p ≤0.05; b **, p ≤ 0.01; a, no significant difference.
Land 14 00027 g004
Figure 5. Changes in BSR in the MCC and control zone in the treelines (A) and inter-rows (B) from 2020 to 2023. P1: Period 1, October 2020–April 2021; P2: Period 2, May 2021–September 2021; P3: Period 3, October 2021–April 2022; P4: Period 4, May 2022–September 2022; P5: Period 5, October 2022–April 2023; P6: Period 6, May 2023–September 2023. b *, p ≤ 0.05; b **, p ≤ 0.01; a, no significant difference.
Land 14 00027 g005
Figure 6. Changes in TN in the MCC and control zone in the treelines (A) and inter-rows (B) from 2020 to 2023. P1: Period 1, October 2020–April 2021; P2: Period 2, May 2021–September 2021; P3: Period 3, October 2021–April 2022; P4: Period 4, May 2022–September 2022; P5: Period 5, October 2022–April 2023; P6: Period 6, May 2023–September 2023. b *, p ≤ 0.05; b **, p ≤ 0.01; a, no significant difference.
Land 14 00027 g006
Figure 7. Changes in NO3 in the MCC and control zone in the treelines (A) and inter-rows (B) from 2020 to 2023. P1: Period 1, October 2020–April 2021; P2: Period 2, May 2021–September 2021; P3: Period 3, October 2021–April 2022; P4: Period 4, May 2022–September 2022; P5: Period 5, October 2022–April 2023; P6: Period 6, May 2023–September 2023. b *, p ≤ 0.05; b **, p ≤ 0.01; a, no significant difference.
Land 14 00027 g007
Figure 8. Changes in TP in the MCC and control zone in the treelines (A) and inter-rows (B) from 2020 to 2023. P1: Period 1, October 2020–April 2021; P2: Period 2, May 2021–September 2021; P3: Period 3, October 2021–April 2022; P4: Period 4, May 2022–September 2022; P5: Period 5, October 2022–April 2023; P6: Period 6, May 2023–September 2023. b *, p ≤ 0.05; b **, p ≤ 0.01; a, no significant difference.
Land 14 00027 g008
Figure 9. Changes in BD in the MCC and control zone in the treelines (A) and inter-rows (B) from 2020 to 2023. P1: Period 1, October 2020–April 2021; P2: Period 2, May 2021–September 2021; P3: Period 3, October 2021–April 2022; P4: Period 4, May 2022–September 2022; P5: Period 5, October 2022–April 2023; P6: Period 6, May 2023–September 2023. b *, p ≤ 0.05; a, no significant difference.
Land 14 00027 g009
Figure 10. Changes in AWC in the MCC and control zone in the treelines (A) and inter-rows (B) from 2021 to 2023. P3: Period 3, October 2021–April 2022; P4: Period 4, May 2022–September 2022; P5: Period 5, October 2022–April 2023; P6: Period 6, May 2023–September 2023. b **, p ≤ 0.01; a, no significant difference.
Land 14 00027 g010
Disclaimer/Publisher’s Note: The statements, opinions and data contained in all publications are solely those of the individual author(s) and contributor(s) and not of MDPI and/or the editor(s). MDPI and/or the editor(s) disclaim responsibility for any injury to people or property resulting from any ideas, methods, instructions or products referred to in the content.

