Article

Responses of Typical Riparian Vegetation to Annual Variation of River Flow in a Semi-Arid Climate Region: Case Study of China’s Xiliao River

State Key Laboratory of Water Environment Simulation, School of Environment, Beijing Normal University, Beijing 100875, China
*
Author to whom correspondence should be addressed.
Land 2025, 14(1), 198; https://doi.org/10.3390/land14010198
Submission received: 16 November 2024 / Revised: 12 January 2025 / Accepted: 16 January 2025 / Published: 19 January 2025

Abstract

:
In semi-arid basins, riparian vegetation is an important part of the river ecosystem. However, with the decrease in river runoff caused by human activities and the continuous changes in climate, riparian vegetation has gradually degraded. To identify the main influencing factors of riparian vegetation changes, we extracted the river flow indicators, climate indicators, and riparian vegetation indicators of a Xiliao River typical section from 1985 to 2020 in spring and summer, and established a random forest model to screen the key driving factors of riparian vegetation. Then, we simulated the response characteristics of riparian vegetation to the key driving factors in spring and summer based on nonlinear equations. The results showed that the contribution of river flow factors to riparian vegetation was higher than that of climate factors. In spring, the key driving factors of riparian vegetation were the average flow in May and the average flow from March to May; in summer, the key driving factors were the average flow in May, the maximum 90-day average flow, and the average flow from March to August. Among them, the average flow in May contributed more than 50% to the indicators of riparian vegetation in both spring and summer. The final conclusion is that in the optimal growth range of plants, increasing the base flow and pulse flow of rivers will promote seed germination and plant growth, but when the river flow exceeds this threshold, vegetation growth will stagnate. The research results improve the existing knowledge of the influencing factors of riparian vegetation in semi-arid basins, and provide a reference for improving the natural growth of riparian vegetation and guiding the ecological protection and restoration of rivers in semi-arid areas.

1. Introduction

As important terrestrial ecological zones, riparian vegetation zones are significantly affected by regional climatic factors [1,2] and river hydrological conditions [3,4]. While in semi-arid areas, water is a key restrictive resource [5,6], the water required for riparian vegetation mainly comes from a mixture of snowmelt, precipitation, and river runoff. Lan and Yu [7] argued that in semi-arid areas, the restoration of riparian grassland vegetation is largely dependent on the restoration of river runoff. Sims and Colloff [8] noted that in addition to floods, many environmental factors such as precipitation, temperature, and seasonality also affect the growth of flood plain plants. Therefore, to protect or restore riparian vegetation, it is necessary to identify the key drivers of vegetation and analyze the response characteristics of vegetation to these factors.
Obviously, patterns of riparian vegetation change in semi-arid areas reflect both hydrological and climatic conditions [9,10]. Climatic conditions are often the driving force on a larger scale, whereas hydrological conditions are the dominant factor on a fine scale [11,12]. River hydrological condition affect riparian vegetation by maintaining or altering soil moisture [13,14], transporting and fixing soil sediments [15,16], and other means. In semi-arid regions, due to water resource constraints, research has primarily focused on the impact of interannual river hydrological conditions on riparian vegetation [17]. The species composition and community structure of riparian plants [18,19], vegetation cover [20,21], NDVI and productivity [22,23], the establishment of suitable habitats [24,25], and other vegetation attributes all depend on the annual runoff patterns.
The influence of climate conditions on riparian vegetation is important at all scales [26], as precipitation [27,28], temperature [29,30], and solar radiation [31] affect vegetation physiological processes at different scales through various mechanisms [32,33], such as respiration, transpiration, and photosynthesis [34,35,36,37], in addition to vegetation features such as NDVI [38,39,40].
In conclusion, the above claims have been well supported by evidence, but the research on the response of riparian vegetation to river flow changes in different seasons and months during the year is still insufficient. In semi-arid regions, the relationship between riparian vegetation phenology and seasonal variation patterns of river flow is very important [41]. For example, the flow upswing period usually coincides with the seed release and diffusion period [41]. In riparian plant communities in semi-arid regions, the seed dispersal and germination of some pioneer plants roughly coincide with the end of snowmelt runoff each spring [42]. Thus, the release and dispersal of plant propagules must coincide with the period during which riparian soils are suitable for settlement in order to maximize the success of reproduction [43]. In addition, in some semi-arid climate regions of the Eurasian continent, the response between riparian vegetation and river flow mainly occurs in spring and summer, because spring and summer are the main stages of plant life activities [39]. Upon entering autumn and winter, the growth of plants will be restricted by climatic conditions, especially herbs, which basically stop growing in autumn and winter and enter the wilting period [44]. And at this time, the river runoff volume also begins to decline and gradually freezes, losing the ability to act on riparian vegetation. Therefore, under different environmental backgrounds, whether the key driving factors affecting riparian vegetation growth are river runoff or climate factors such as precipitation and temperature, and how riparian vegetation responds to key driving factors, still needs to be further explored. In order to further enrich and improve the deficiencies of the corresponding research, we designed this study, aiming to comprehensively consider the impact characteristics of river flow and climate factors on typical riparian vegetation in semi-arid areas.
The typical riparian zone of the Xiliao River was selected as the research area, and the corresponding indicators were extracted using the hydrological, climatic, and vegetation data from 1985 to 2020 to explore the climatic or hydrological driving factors that have an important impact on vegetation, and to reveal the response characteristics of vegetation to key driving factors.

2. Materials and Methods
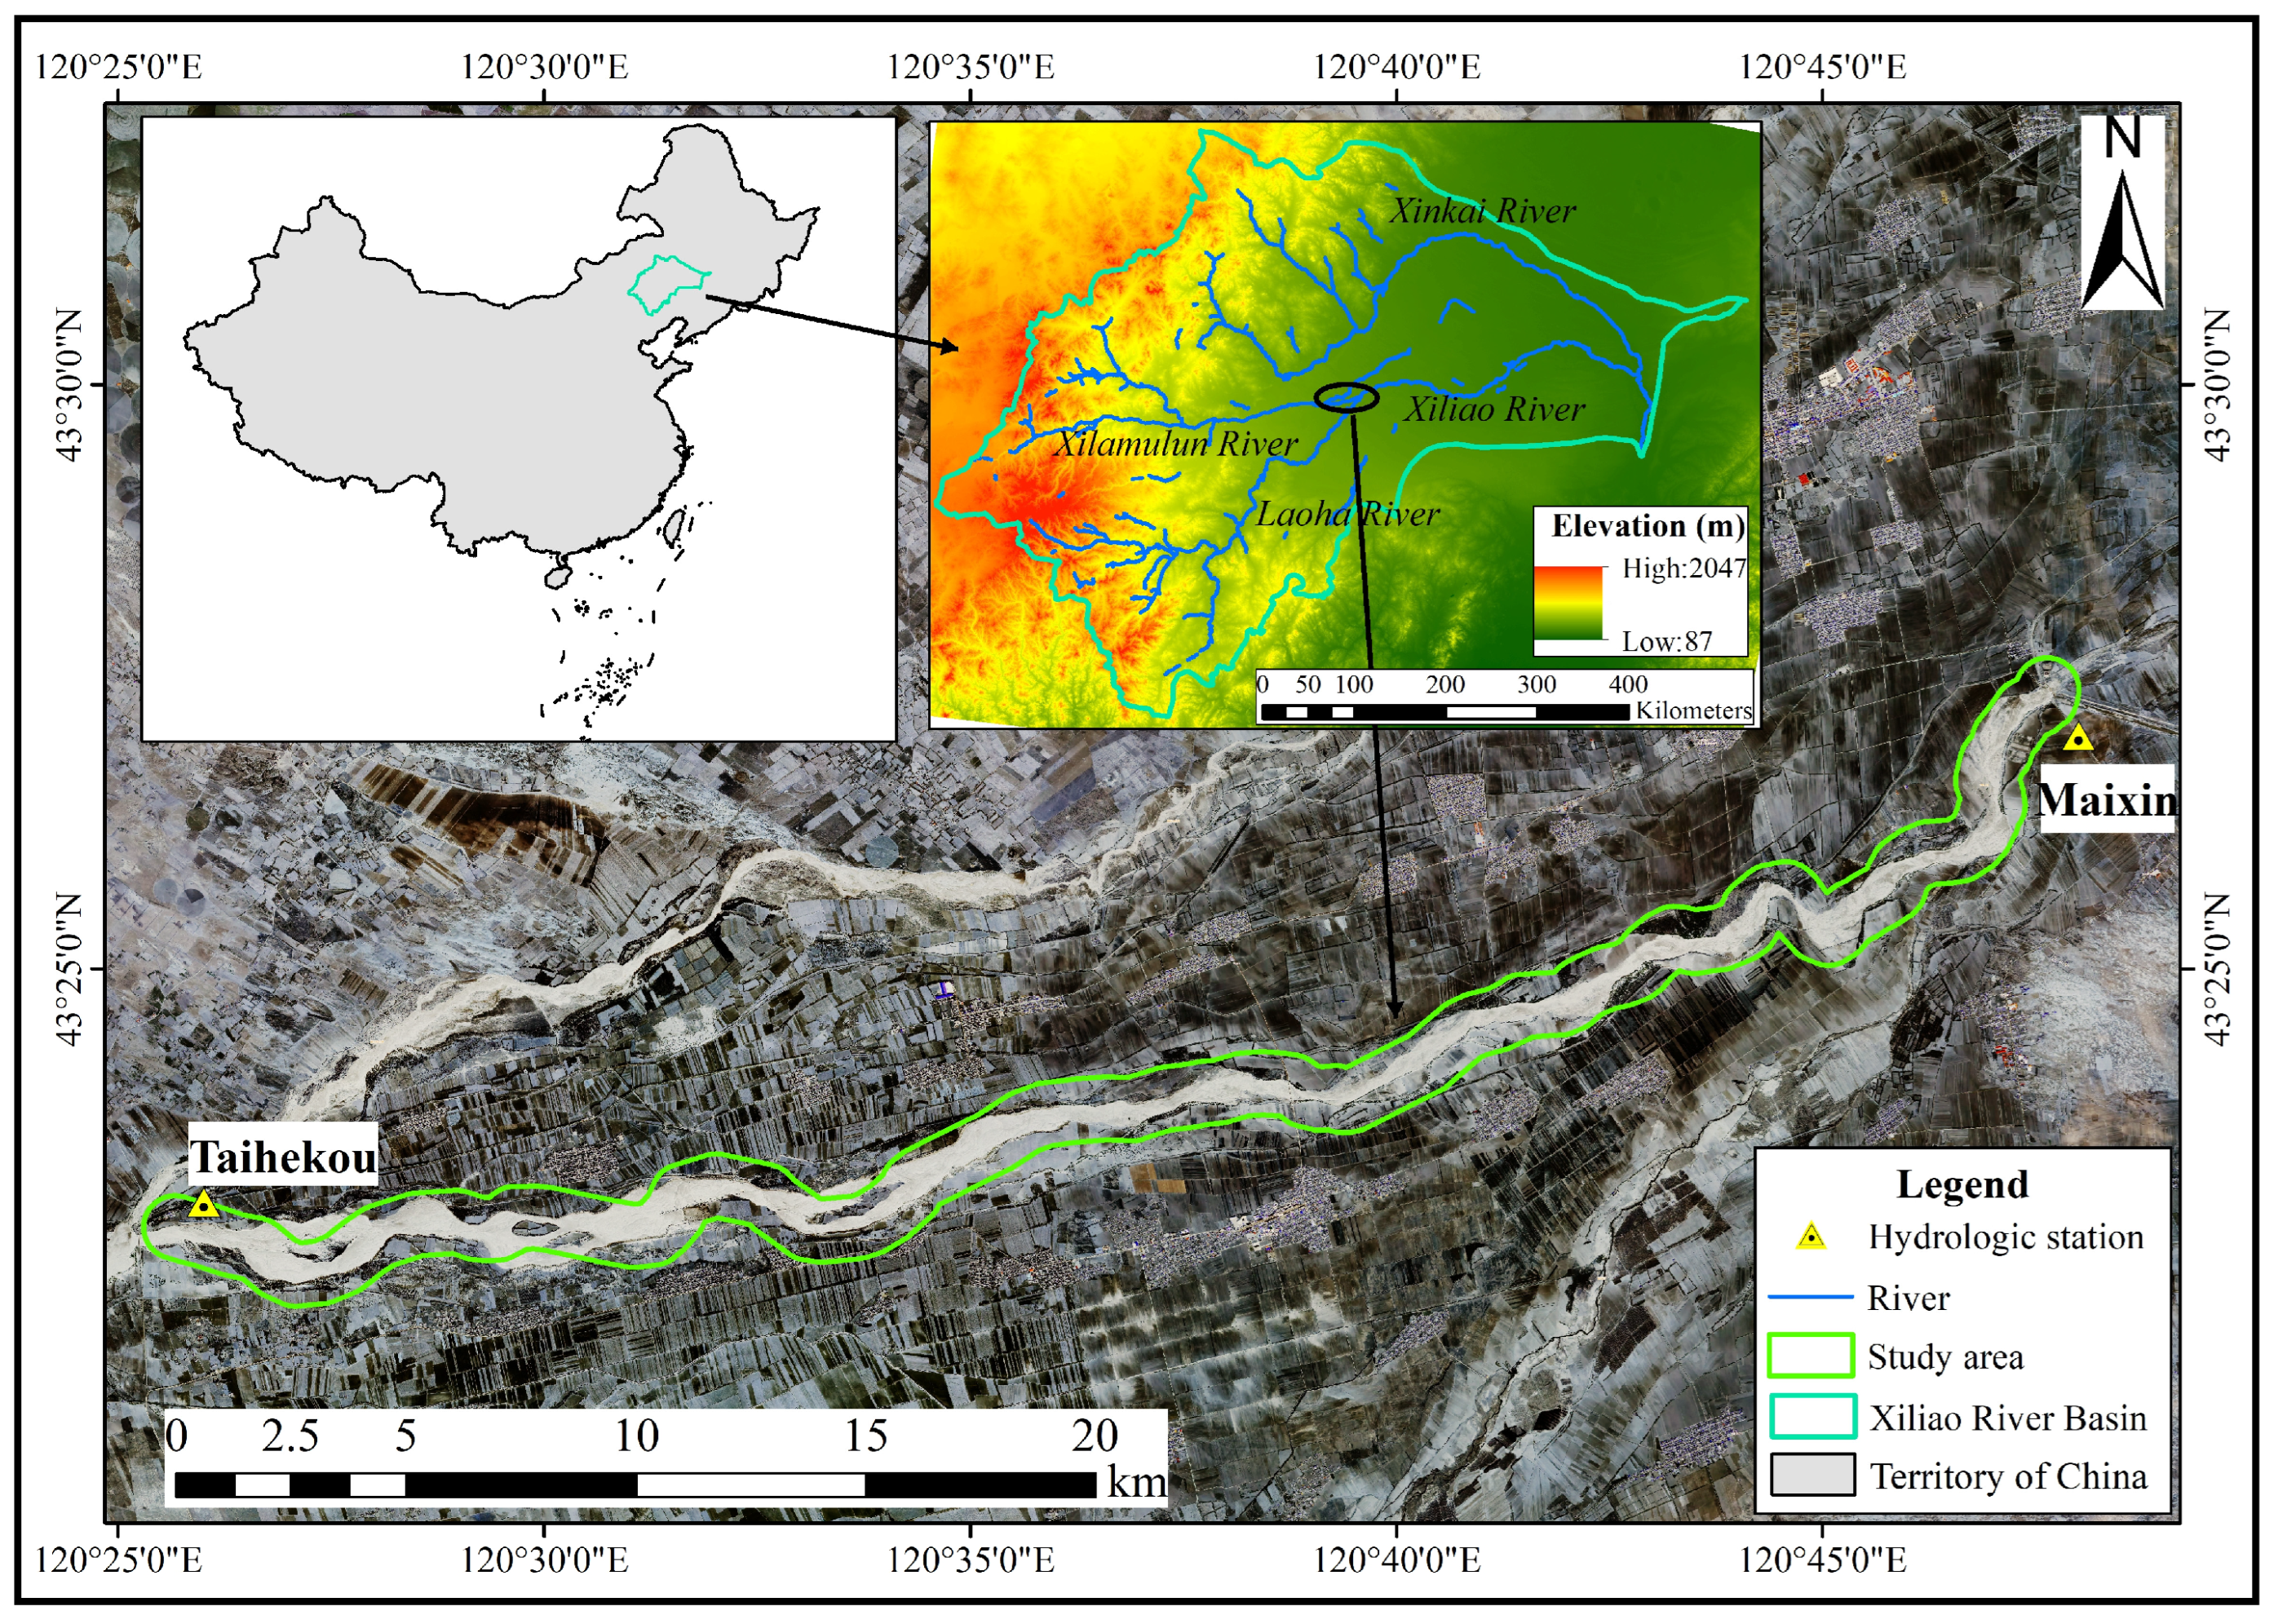
2.1. Study Area

The Xiliao River Basin is located in the southwestern part of the Songliao Plain, with geographical coordinates of 42°18′ to 44°30′ north latitude and 119°14′ to 123°42′ east longitude, covering an area of about 138,000 square kilometers. The region has a semi-arid temperate monsoon climate, characterized by dry and windy springs, humid and hot summers, cool autumns, and cold and snowy winters. The average annual temperature is 5.0 °C~6.5 °C, the average annual sunshine hours are 800~3100 h, and the relative humidity is 45%~58%. The average wind speed over the years is 2.7~4.0 m/s. The precipitation in the Xiliao River Basin is unevenly distributed in terms of time and space. It increases from northwest to southeast in space, and 85% of the precipitation is concentrated from June to September. The amount of precipitation in autumn and winter is very small, with an average annual precipitation of 338.8 mm and an average annual evaporation of about 1057 mm.
The surface water system includes the main stream of the Xiliao River and tributaries such as the Xilamulun River, the Laoha River, and the Xinkai River. Due to the uneven distribution of precipitation during the year, the main water inflow periods of the main stream and tributaries of the Xiliao River are concentrated in spring and summer, and the runoff volume of the river channel is less in autumn and winter, which is close to drying up. We selected a typical reach in the study area that lay along the main channel of the Xiliao River, between the lower reaches of the Xilamulun River (a major tributary of the Xiliao River) and the Maixin Hydrological Station (Figure 1). In the river basin, precipitation is decreasing due to a combination of climate change and a surge in industrial and agricultural water consumption. As a result, the runoff of the main water systems of the Xiliao River Basin has decreased year by year since 2000 [45]. The average annual runoff of the Xilamulun River, where our study area is located, decreased by 47.5% from 2001 to 2021 compared with the value from 1956 to 1979 and by 46.3% compared with the value from 1980 to 2000.

2.2. Data Sources

We used monthly-scale hydrology, vegetation, and climate data from 1985 to 2020 in our analyses. The hydrological data were derived from the monthly measured runoff at the Taihekou Hydrological Station (120°26′0″ E, 43°23′0″ N; Figure 1). We derived the kNDVI and FVC data from the USGS Earth Explorer site (https://earthexplorer.usgs.gov/, accessed on 25 May 2023), based on Landsat 5 TM, Landsat 7 ETM, and Landsat 8 OLI images. Missing pixels were filled in by means of Kriging interpolation, and cloud-covered pixels were cleaned by wavelet transform. We used the Haar wavelet as the wavelet base, with the weight of the approximate coefficient set to 0.6 and the weight of the high frequency coefficient was set to 4.
NPP data from May and August were obtained from the National NPP dataset from 1985 to 2015 created by the Institute of Geography, Chinese Academy of Sciences [46]; NPP data from 2016 to 2020 were obtained from the USGS Earth Explorer website. The vegetation data for the study area were also extracted on a monthly scale. We calculated the monthly average of the riparian vegetation indicators in May (spring) and August (summer). We obtained cumulative precipitation, solar radiation, and land surface temperature data throughout the study area from the China Meteorological Data Sharing Service system (https://data.cma.cn/, accessed on 17 May 2023). The data with different resolutions were resampled to a resolution of 30 m by version 10.5 of ArcGIS (www.esri.com, accessed on 8 May 2023) to ensure the same pixel size.

2.3. Selection of Hydrological, Riparian Vegetation, and Meteorological Indicators

River hydrological indicators characterize a river’s natural flow patterns and their significance for riparian ecosystems. More than 170 indicators have been proposed to describe river hydrological regimes [47,48]. Richter et al. [49] proposed an approach based on indicators of hydrological alteration, and this is the most widely used indicator system. Based on Richter’s approach and the current situation in our study area, we selected the average flows of each month from March to August, the average flow from March to May, the average flow from March to August, and the maximum average flow for periods of 30 and 90 days as the river flow indicators in the spring and summer (i.e., the local vegetation’s growing season). The spring river flow indicators were the average flows in each month from March to May and the average flow for the whole period from March to May, and the summer river flow indicators were the average flow in each month from March to August, the average flow for the whole period from March to August, and the maximum 30-day and 90-day average flows.
We chose three riparian vegetation indicators to characterize the activity of riparian vegetation: kNDVI, FVC, and NPP. The spring and summer vegetation indicators were for May and August, respectively. To better explain the changes of vegetation in the riparian zone, we obtained data on the cumulative precipitation (CP), cumulative solar radiation (CSR), and cumulative surface temperature (CST) as climate indicators. Table 1 summarizes the indicator details. The values of these variables from March to May were taken as spring climate indicators, and the values from March to August were taken as the summer climate indicators.
In the FVC calculation formula in Table 1, NDVImin and NDVImax represent the values of bare soil pixels (NDVIs) and pure vegetation pixels (NDVIv) in a specific confidence interval. The values of NDVImin and NDVImax vary from region to region [65]. Therefore, in the actual calculation, we relied on previous studies [66,67], and chose the gray value distribution in the images to define the 95% confidence intervals for NDVImin and NDVImax.

2.4. Trend Tests and Relationship Simulation

2.4.1. Analysis of Key Driving Factors for Riparian Vegetation

The influence of river flow and climatic conditions on riparian vegetation is complex, and the relationship between riparian vegetation and the two driving forces cannot be characterized by a simple linear model. The Random Forest (RF) model has certain advantages in dealing with the feature selection and attribution problems of high-dimension data similar to the data used in the present study. During training, Random Forest detects the impact of the relationships between features and identifies which features are most important after training. When there is a classification imbalance, Random Forest can provide an effective way to balance errors in the dataset [68]. Moreover, Random Forest models usually have better prediction ability than corresponding parametric models [69]. If many values of the features are missing, Random Forest can still maintain accuracy. These advantages indicate that the Random Forest model was suitable for our study. As a result, we chose this approach to analyze the key driving factors for riparian vegetation.
Random Forest is based on a classification and regression tree implementation [70]. Through two randomization methods (selecting training samples and selecting variables for each node of the tree), many independent trees can be generated to achieve the final decision. We used version 4.7 of the Random Forest package (https://cran.r-project.org/web/packages/randomForest/index.html, accessed on 10 June 2023) for version 4.3.2 of the R software (https://www.r-project.org/, accessed on 13 June 2023) to create the Random Forest model. To create the model, we calculated the feature importance for each river flow and climate factor to identify the most important variables. We did this by adding all the internal nodes of the classification and regression tree and improving the objective function given by the segmentation criteria for all trees in the forest [69]. We standardized the feature importance of each factor by dividing the score for each factor by the total score for all factors. Finally, we selected the variable with the highest feature importance for each vegetation indicator as the key driving factor. We then fit this factor to the vegetation indicators following the method described in the next section.

2.4.2. Fitting of the Vegetation Indicators and Key Driving Factors

The curve for the physiological processes by which riparian plants respond to changes of flow is often nonlinear [71]. Similarly, nonlinear correlation analysis is often used to analyze the relationship between vegetation change and climate factors [72]. This is necessary because linear correlation analysis alone may not be able to capture the relationships between ecological characteristics and physical factors that affect the riparian vegetation [4,73]. In comparison, nonlinear equation fitting better reflects the laws of natural vegetation ecological evolution, better reflects the changes in riparian vegetation with driving factors [23], and is more likely to determine whether there are corresponding thresholds for the dynamic changes of riparian vegetation with driving factors [65].
Therefore, we used nonlinear equation to establish the relationship between the vegetation indicators and the corresponding key driving factors identified in the previous section. By defining the key driving factors of the riparian vegetation indicators in May and August, the nonlinear equation was able to fit the relationship between these indicators and the key driving factors in May and August. This let us clarify the characteristics of the responses of riparian vegetation to the key driving factors in spring and summer.

3. Results

3.1. Analysis of Key Driving Factors for Riparian Vegetation

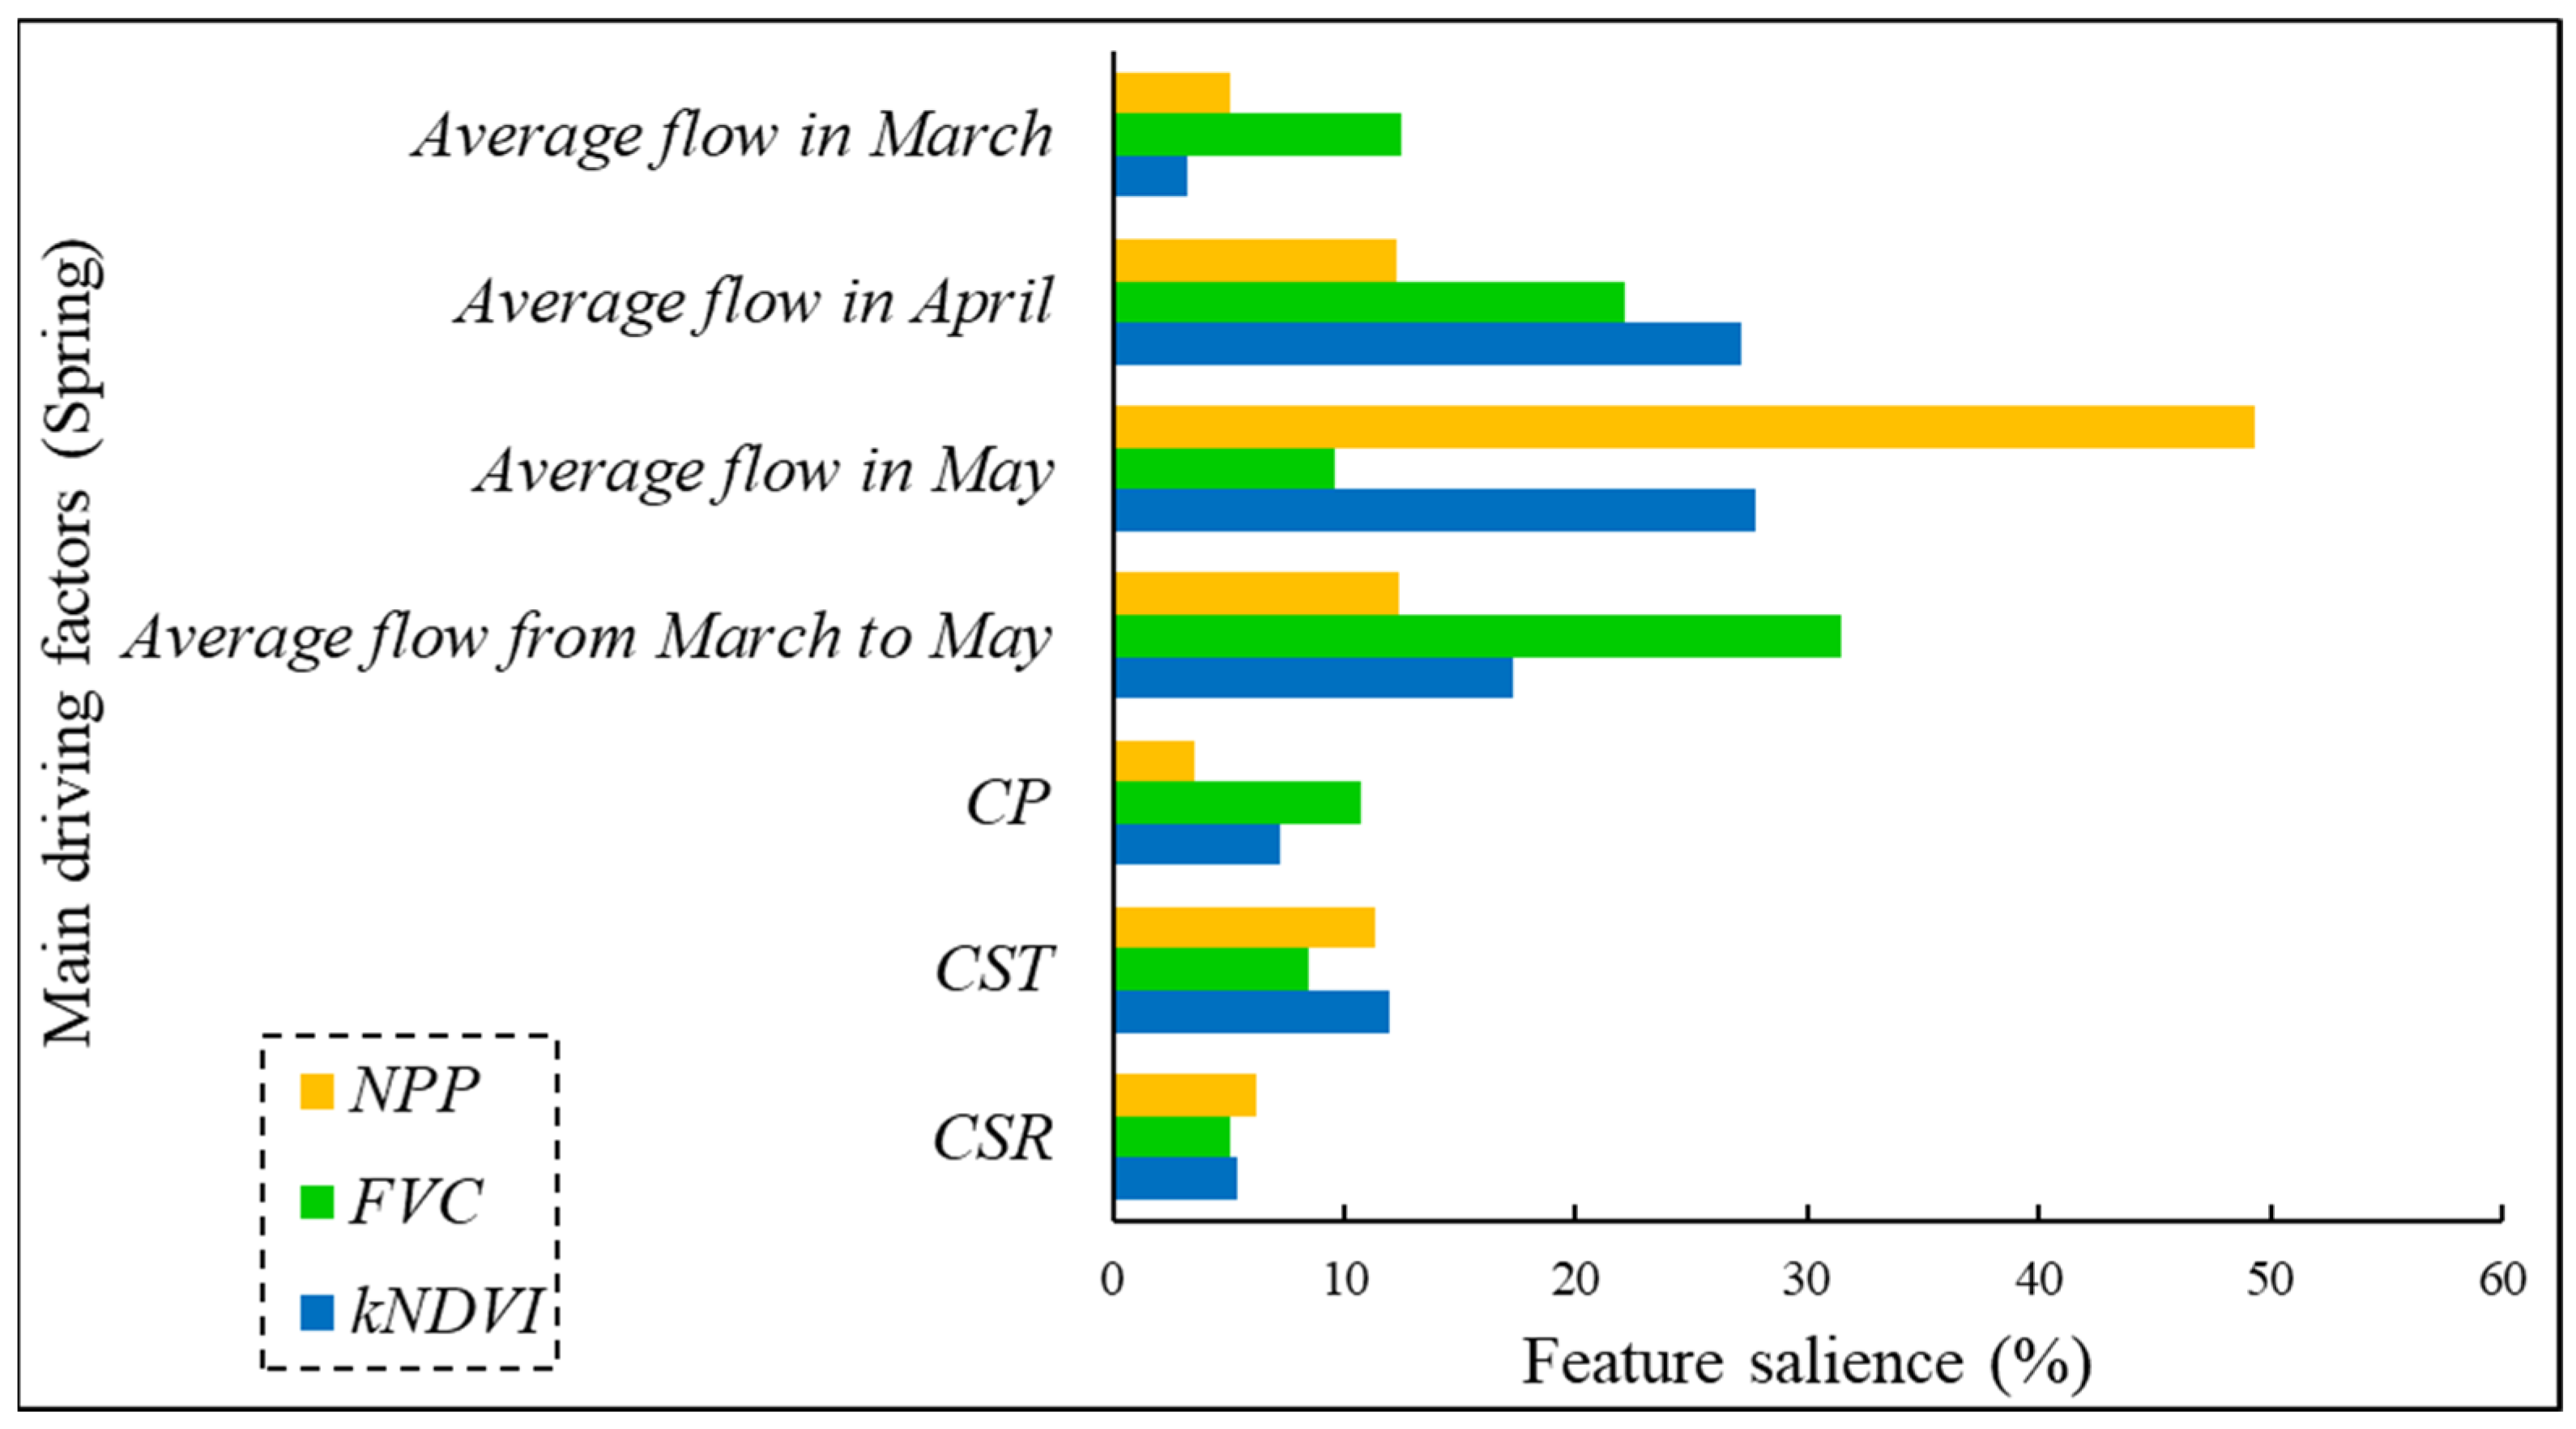
3.1.1. Analysis of Key Driving Factors for Riparian Vegetation in May

Based on the Random Forest model, we calculated the contribution of the statistically significant river flow indicators, climate indicators, and riparian vegetation indicators in May to determine the key driving factors for riparian vegetation growth in the spring. The fitting results are shown in Table 2 and Figure 2.
Figure 2 showed that the average flow in May had the greatest contribution to kNDVI and NPP, whereas the average flow from March to May had the greatest contribution to FVC. Among the driving factors for riparian zone kNDVI in May, the influence was higher for the average flows in May, in April, and from March to May, as well as for CST. In the driving factors for FVC, the average flow from March to May, in April, and in March, as well as CP, were the dominant factors. In the driving factors for NPP, average flows in May and April were the main driving factors.
According to the fitting results for the three spring vegetation indicators and the driving factors, the average flow in May and from March to May were the key driving factors leading to the spring growth of riparian vegetation. The Random Forest model also showed that when the factors affecting the spring germination and growth of riparian vegetation are more fully considered, the river flow factors played a leading role in the germination of riparian plants. Among the climatic factors, CST had a greater influence on kNDVI and NPP, and CP had a greater influence on FVC.
Table 2 also shows that the Random Forest simulation accuracy was high (R2 > 0.8) for the three vegetation indicators, with accuracy in the order NPP > kNDVI > FVC, indicating that the identification of the key driving factors for riparian vegetation identified by the Random Forest model was reliable.

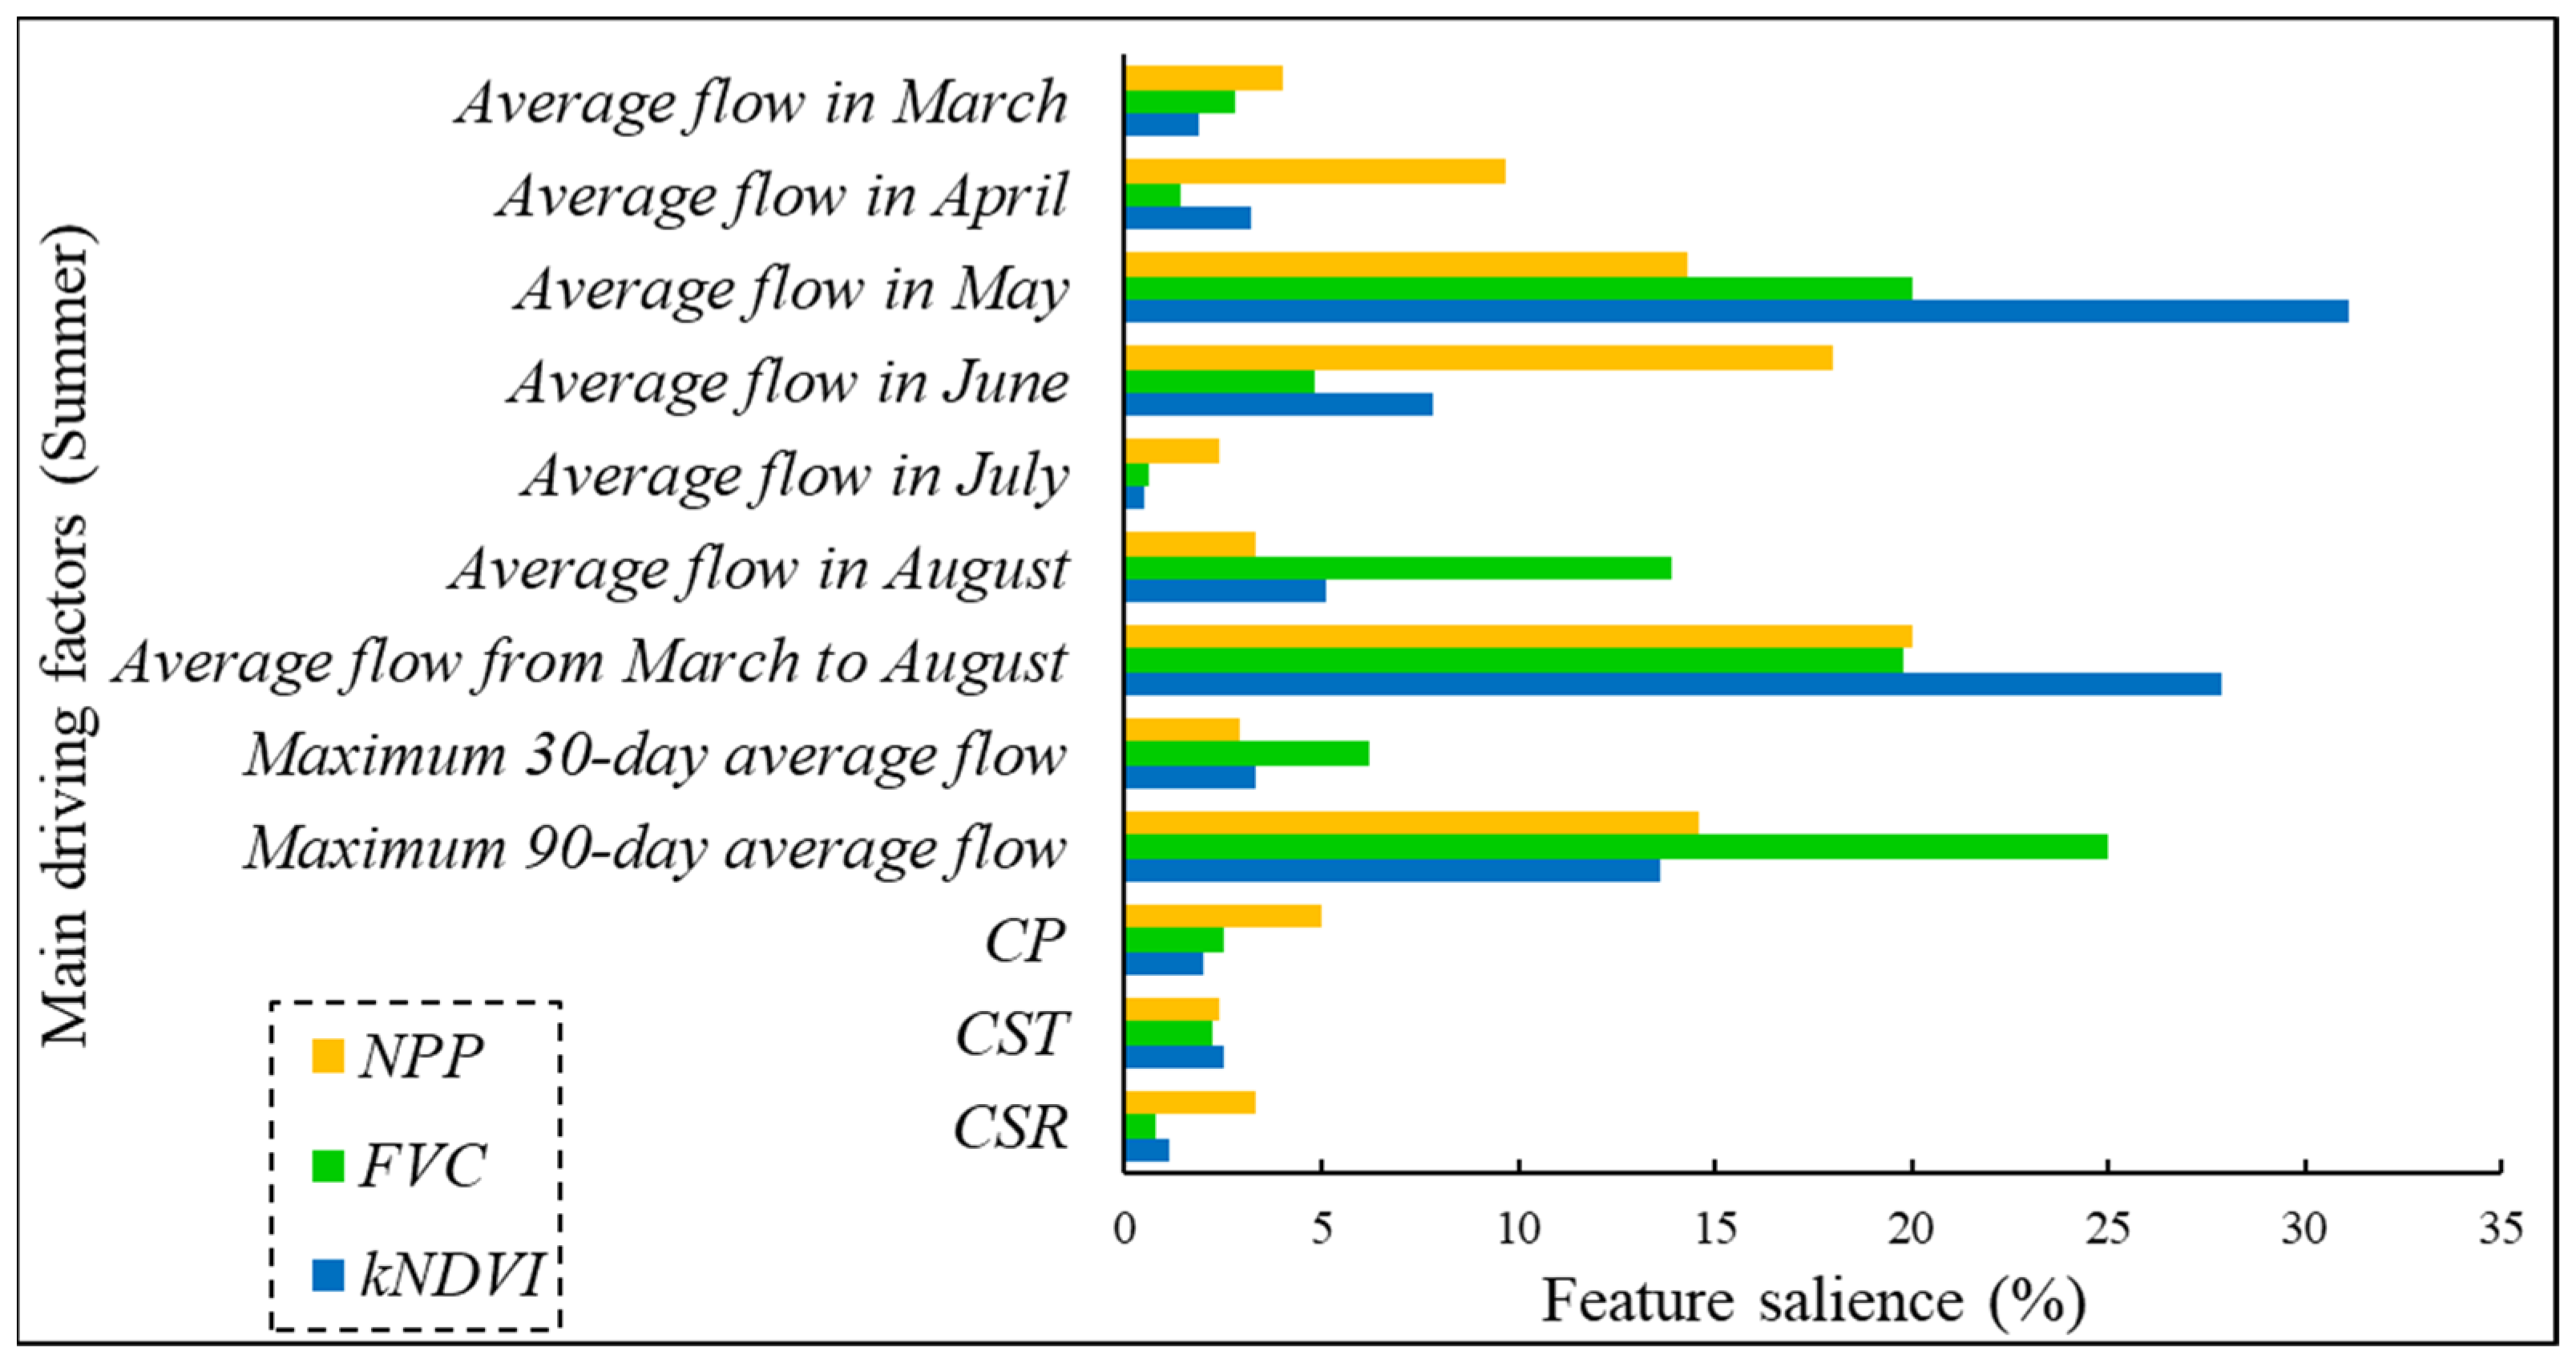
3.1.2. Analysis of Key Driving Factors for Riparian Vegetation in August

We also used a Random Forest model to analyze the contributions of the statistically significant river flow and climate indicators to the riparian vegetation indicators in August and to reveal the key driving factors for summer riparian vegetation growth. The fitting results are shown in Figure 3 and Table 3.
Figure 3 shows that the average flow in May had the highest influence on kNDVI, the maximum 90-day average flow had the highest influence on FVC, and the average flow from March to August had the highest influence on NPP. Among the driving factors for riparian vegetation, kNDVI in August, the average flow in May, the average flow from March to August, the maximum 90-day average flow, and the average flow in June were strongest. Among the driving factors for FVC, the strongest driving factors were the maximum 90-day average flow, average flow in May, average flow from March to August, and average flow in August. Among the driving factors for NPP, the strongest factors were the average flow from March to August, average flow in June, maximum 90-day average flow, and average flow in May.
In the fitting results for the three summer riparian zone vegetation indicators, the most important driving factors were the average flow in May, average flow from March to August, and maximum 90-day average flow. These all played an important role in the growth of riparian vegetation and were key driving factors. Among the climatic factors, the contributions of CP to vegetation FVC and NPP were highest, and the contribution of CST to vegetation kNDVI was highest.
Table 3 shows high simulation accuracy of the vegetation indicators (R2 > 0.85) by the Random Forest model, which indicates that the model was reliable. The strengths were in the order kNDVI > FVC > NPP.

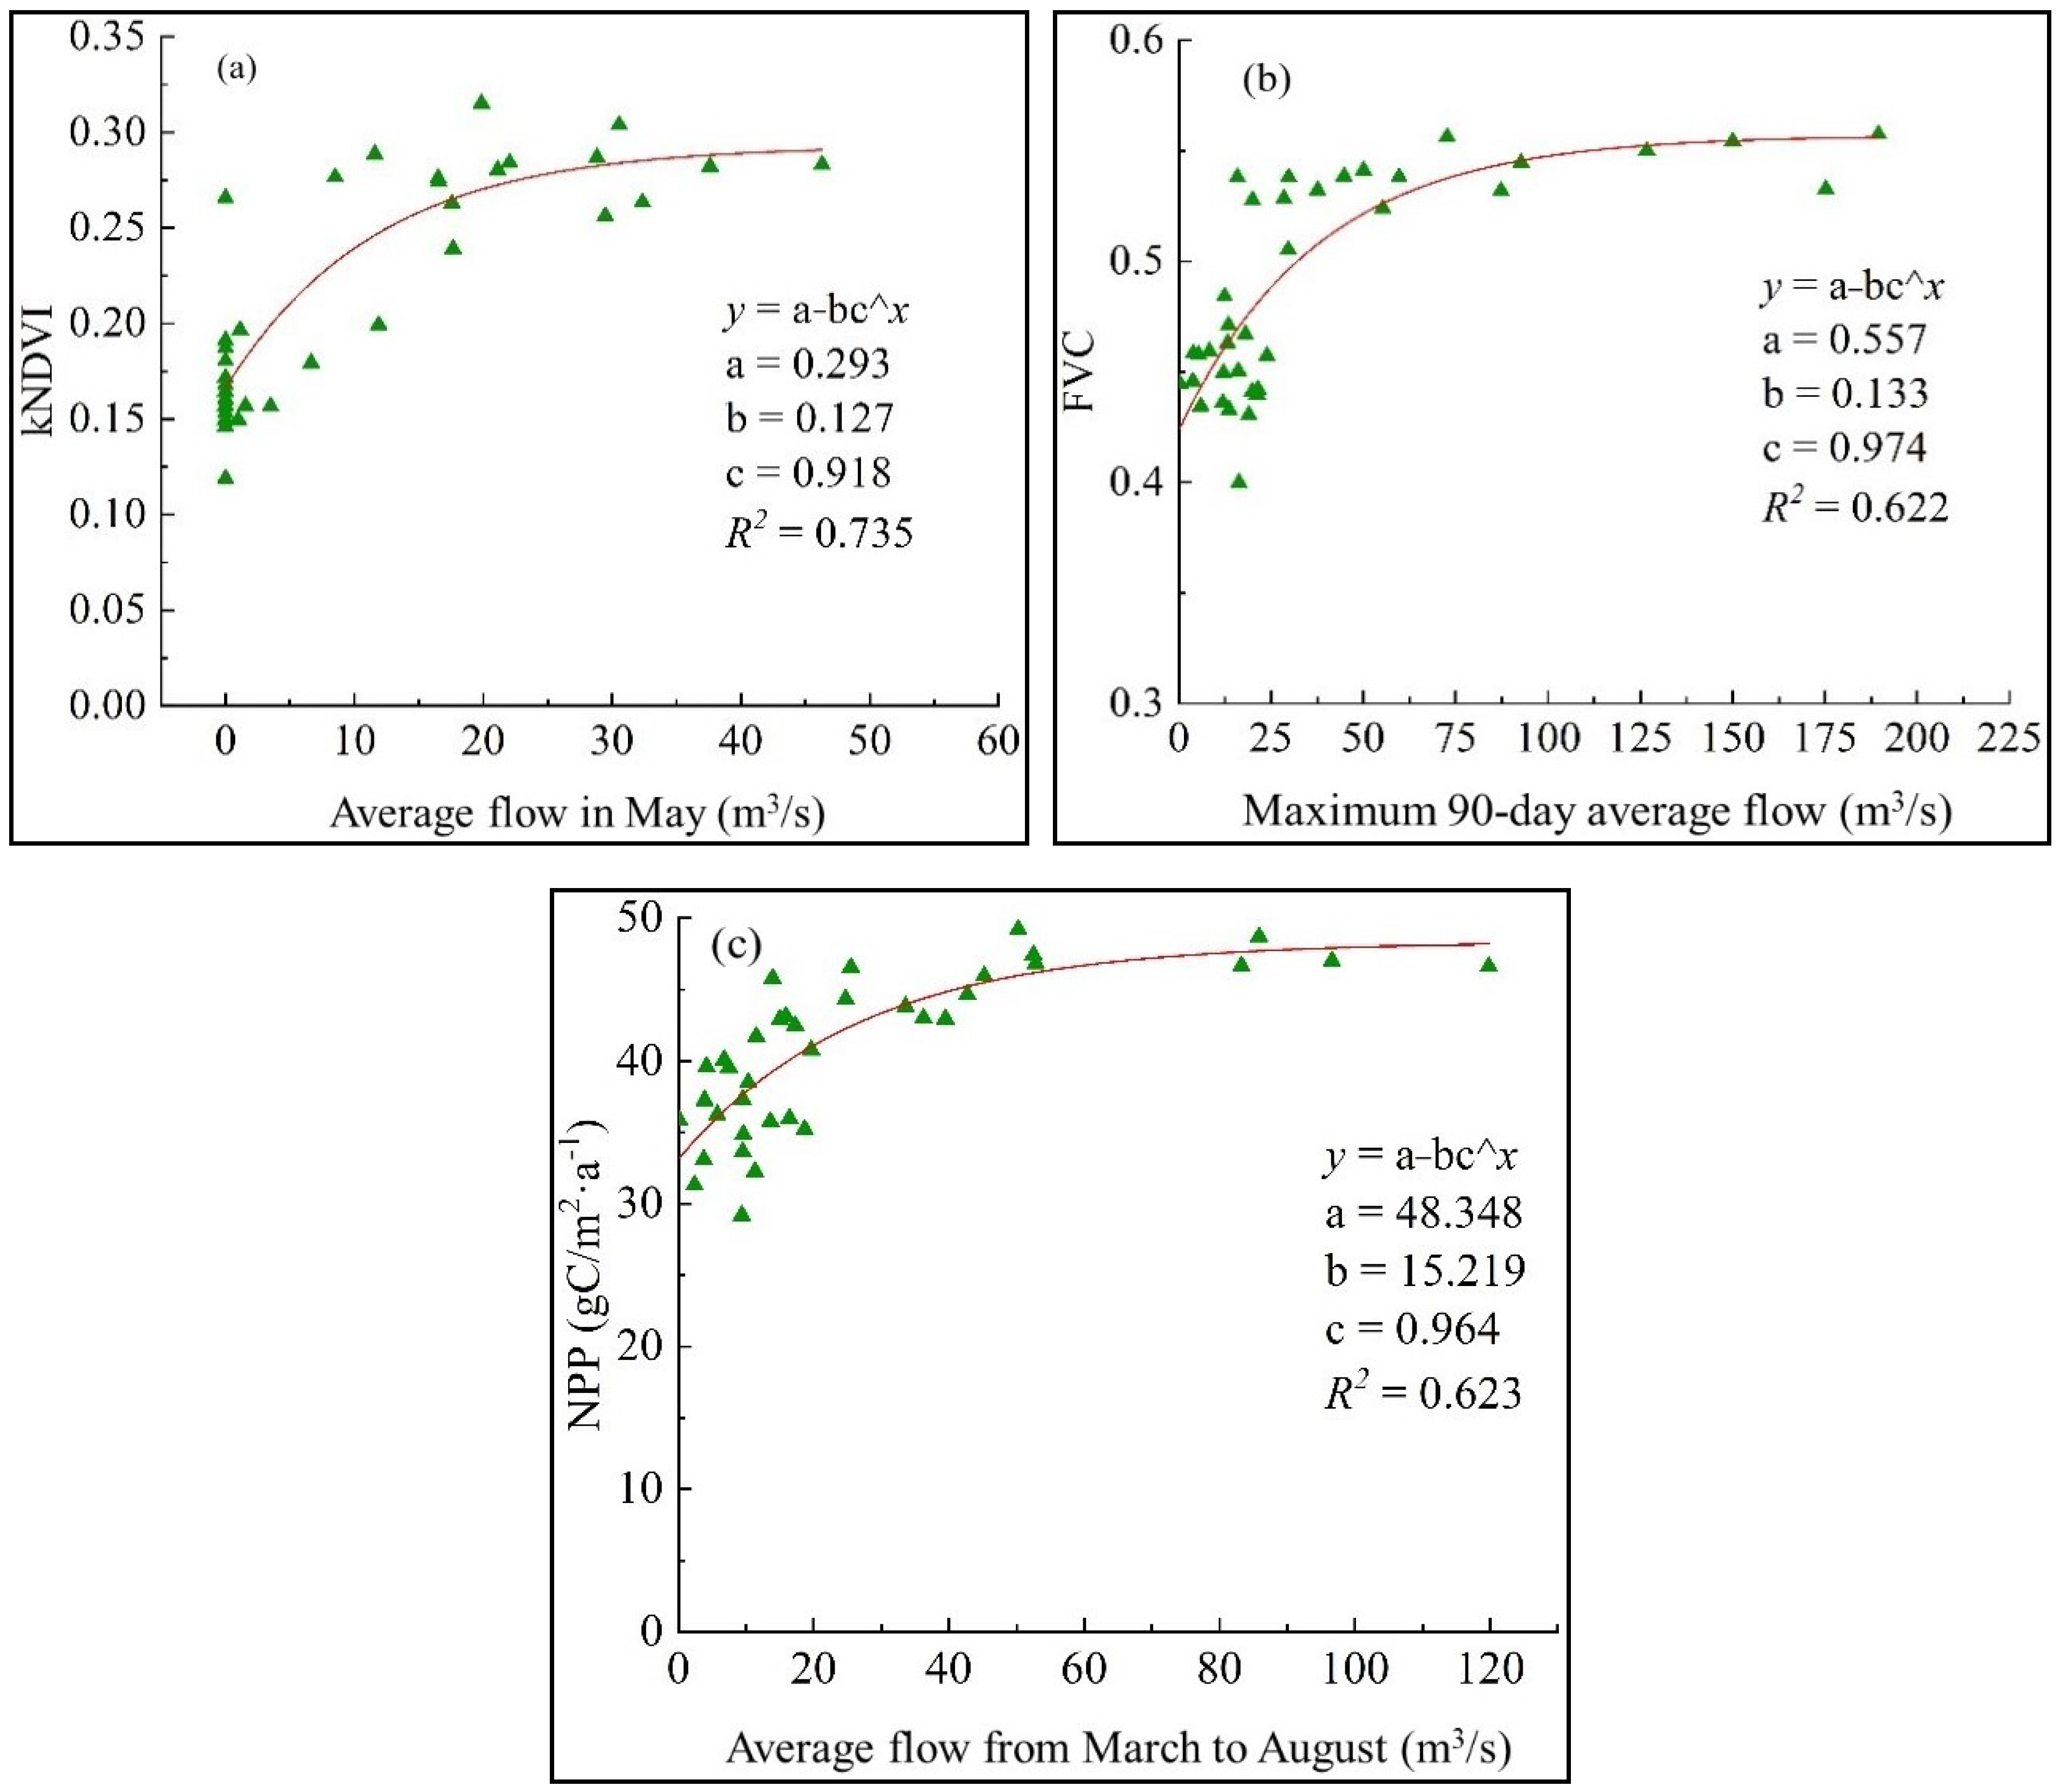
3.2. Simulation of Relationships Between Riparian Vegetation and Its Key Driving Factors

3.2.1. Relationships Between Riparian Vegetation and Its Key Driving Factors in May

We used version 2018C of the OriginPro software (https://www.originlab.com/, accessed on 18 June 2023) to simulate the nonlinear relationships between the riparian vegetation kNDVI, FVC, and NPP and their corresponding key driving factors in May based on data from 1985 to 2020. All simulation results passed the 0.05 significance level test. Figure 4 shows the simulation results.
The fitting results for the riparian vegetation indicators and the corresponding key driving factors in May were only moderately strong (R2 < 0.69), but were statistically significant and reflected the responses of riparian vegetation to key river flow indicators in the spring. The three curves initially increased rapidly, then stabilized. kNDVI of the riparian vegetation in the spring gradually increased with increasing average flow in May until it stabilized around 0.06 (Figure 4a). With increasing average flow from March to May, FVC increased initially and then stabilized at about 0.25 (Figure 4b). The continuous increase of the average flow in May led to increasing NPP, which stabilized near 16 gC/(m2·year) (Figure 4c). average flow in May

3.2.2. Relationships Between Riparian Vegetation and Its Key Driving Factors in August

We used the OriginPro software to simulate the nonlinear relationships between the riparian vegetation kNDVI, FVC, and NPP and the corresponding key driving factors in August based on data from 1985 to 2020. All simulation results passed the 0.05 significance level test. Figure 5 shows the simulation results.
Figure 5 reflects the responses of riparian vegetation to key flow factors in summer. The three relationship curves were again moderately strong (R2 < 0.74) and were similar to those in spring. The values of each vegetation indicator increased continuously with increasing flow, and then tended to stabilize. Increasing the average flow in May increased kNDVI, which gradually stabilized at about 0.255 (Figure 5a). Increasing the maximum 90-day average flow increased FVC until it stabilized near 0.55 (Figure 5b). NPP increased with increasing average flow from March to August and gradually stabilized at around 47 gC/(m2·year) (Figure 5c).

4. Discussion

4.1. Flow Factors Had More Effect on Riparian Vegetation than Climate Factors

Our modeling results for May showed that the average flow in May and the average flow from March to May play a significant role in the spring germination and growth of riparian vegetation. These indicators represent the flow conditions in spring and are key drivers of riparian vegetation in spring. For riparian vegetation in semi-arid regions, soil moisture is the most direct and important source of moisture [74]. Plant germination begins with drying seeds to absorb soil moisture, leading to radicle destruction of the seed coat and ends with hypocotyl elongation [75], followed by mobilization of major nutrient reserves required for seedling growth [76]. In our study area, snowmelt-dominated spring runoff meets the basic water needs of plant seeds and seedlings by replenishing shallow soil water in riparian zones. Spring is therefore probably the most critical window for soil moisture replenishment near rivers.
The modeling result of May also showed that the May average flow impact on riparian vegetation occurred in the short term (within the same month), while the March–May average flow revealed a lagged (because persistent) effect of river flow on riparian vegetation. These results confirm the critical timing of the release of spring flow. Most riparian plants disperse their seeds and other propagules when river flow occurs in spring, which also redistributes sediment, removes aging plants, and creates a suitable environment for new plants [77,78], and due to conditions such as soil moisture content reaching an appropriate range at this time, plant propagules begin to grow in a short period of time, which may explain why the effects of river flow on riparian vegetation in spring exhibit immediate and lagging characteristics.
In similar research both domestically and internationally, such as the Heihe River Basin in Northwest China, spring runoff is also closely related to the overall development and biomass of oasis vegetation in the lower reaches of the river [79,80]. Vegetation growth in the lower reaches of the Heihe River is affected by April–May runoff [80]. In the Yampa and Green River basins of the Southwest United States, the peak of spring snowmelt flow arrives between mid-May and early June, during which the greenness and vitality of riparian vegetation increases [16]. Similarly, spring water flow is closely related to vegetation density along the Colorado River. The overlap between the late spring pulse flow period and the stem elongation period of native vegetation increases the likelihood of germination of native species along the Colorado River [81]. Since 2000, vegetation density in the riparian corridor has declined significantly as runoff volume in the lower Colorado River has decreased [20,82]. In some lowland rivers in southeastern Australia, the timing of spring runoff release is also important [44], because river regulation changes the original seasonal characteristics, and spring flow is even more important for wetland macrophytes than summer flow [83]. This suggests the importance of spring flow conditions in restoring riparian vegetation ecology in semi-arid regions. In addition to the runoff factors mentioned above, temperature plays a key role in the life activities of riparian vegetation in spring [84], and our analysis results showed that it is a climate factor that cannot be ignored.
The August modeling results revealed that the average discharge in May, the average discharge from March to August and the maximum 90-day average discharge are the key driving factors of riparian vegetation. For riparian vegetation in August, the river runoff factors mainly show time-lag effects. This result is mainly due to the fact that in late spring or early summer, water flow affects riparian vegetation through mechanisms such as increasing the number of propagules reaching riparian [85,86], stimulating the coexistence of pioneer species and their competitors [87], and improving the suitability of shallow-water habitats [88]. All of these changes occur before the plant maturation stage, thus combining to form a lag in the impact of runoff on riparian vegetation in August. August is the transitional stage from seedling to maturity of riparian plants in this study area. The growth state of these plants must be relatively stable to ensure their vital function, which requires the river water to continuously replenish the riparian soil with basic flow. In addition, summer floods alter plant community composition by dispersing vegetation, providing a clean and moist substrate, and killing fragile plants through hydraulic disturbances [12]. More natural flood dynamics may enhance the transportation of plant propagules to suitable sites, promoting successful colonization at new sites [75]. Therefore, the increase in river flow in summer increases the availability of soil moisture, while also creating favorable growth for plants.
Other scholars have also confirmed that riparian vegetation in summer is affected by the time-lag effects of basic flow and flood pulses. In the Gwydir wetlands of Australia, vegetation NDVI is very sensitive to river runoff volume 40 days after the flood event [22]. Due to the effects of summer flooding, vegetation in the Macquarie wetlands flourishes from late spring to late summer and peaks in early summer [73]. Furthermore, river flow during 30, 90, and 180 days before the improvement in vegetation greenness is significantly associated with vegetation development in the Macquarie wetlands [89]. The above studies all involved monthly or multi-monthly flow metrics, similar to the time scales we used for May average flow, March–August average flow, and maximum 90-day average flow. All of these results suggest that river water is a major factor affecting vegetation productivity and NDVI in riparian wetlands in our study area.
In arid or semi-arid regions, herbs are sensitive to precipitation and demonstrate the ability to utilize shallow soil water [90]. Generally speaking, wetland communities are more sensitive to river flow, while terrestrial communities are more dependent on climatic factors [73]. Due to the intermittent and seasonal characteristics of runoff in this study area, most riparian areas often switch frequently between being submerged and becoming bare, which makes riparian plant communities show varying degrees of sensitivity to river flow and climatic factors. Due to the small spatial scale of this study, the climatic factors were relatively stable on the monthly time scale and did not change significantly. On the contrary, due to the influence of human activities, the river hydrological conditions in the study area have changed significantly over the years, and the influence of river hydrological conditions on riparian vegetation is more significant than that of climatic conditions. The reduction of river runoff exacerbated the degradation of vegetation in the riparian zone, led to serious riparian erosion, and severely damaged the river’s ecological functions. Therefore, the dependence of riparian vegetation on river hydrological conditions is higher than that on climatic conditions.
It can be found that the key driving factors of the three riparian vegetation indicators in spring and summer are different. This can be understood as kNDVI, FVC, and NPP indicate the attributes of different aspects of vegetation, so the environmental conditions they rely on are different. kNDVI reflects the greenness of vegetation, that is, the degree of growth health, which requires the supply quantity and timing of soil water; FVC reflects the ability of vegetation to reproduce and expand, which may depend on the continuous flow of rivers and water propagation; NPP indicates the utilization of nutrients and the accumulation capacity of organic carbon by plants, which may depend on the transport and migration of sediments and soil nutrients by water flow. Therefore, the key driving factors of these three vegetation indicators show differences.
Comparing the key drivers of riparian vegetation in spring and summer, it was found that the average flow in May had a significant impact on riparian vegetation in both spring and summer. This is because May is the transition period between spring and summer, and the middle and late part of May is the transition period for the nutritional and reproductive growth of herbaceous plants in this research area. At this time, herbs are in a critical period of root and leaf development, and stems and leaves begin to switch between vegetative and reproductive growth. Therefore, runoff in late spring can promote this alternating process and contribute to summer vegetation coverage [79]. Compared with the trees or shrubs involved in other studies, we did not consider the contribution of groundwater to the growth of riparian vegetation. This is mainly because the riparian vegetation in this study is dominated by herbs, and the root system of herbs is short. For example, shallow-rooted grasses in semi-arid grasslands in Inner Mongolia mainly use shallow (0–20 cm) soil water during the growing season [91], so groundwater is generally considered to have little effect on the growth of grassland vegetation. Therefore, only river runoff factors and main climatic factors were considered, which may be the main reason for the difference between this study and other studies.

4.2. Riparian Vegetation Needs More Appropriate Pulse Flows and Base Flows

It can be found from the fitting results of the response curves of riparian vegetation to key driving factors in spring and summer that the response of vegetation indicators to key driving factor indicators showed a pattern of first increasing and then stabilizing. The upward trend of the curve is related to the expansion of the flooded area due to the increase in river flow [92] and the increase in soil moisture [13]. However, even though the river flow continues to increase in spring, it is still early in the vegetation growth period, and the scale of plant colonization in the riparian soil is still limited. Excessive moisture beyond the needs of the plants does not necessarily promote better plant growth. Conversely, over-saturation of soil moisture along riparian vegetation can limit the use of other resources by plants, such as soil nutrients, soil air, and sufficient light energy [93], thereby restricting the growth of plants and even repressing entire types of vegetation.
By August, with the increase in base flow and the occurrence of flood events, plants reach the threshold for nutrient and reproductive growth. The increase in river runoff volume does not enhance the physiological and metabolic activities of the plants; instead, the riparian vegetation will begin to suffer from strong disturbances caused by continuous scouring or long-term flooding [94,95]. Because the plant roots are under pressure of anoxia during floods, this may inhibit the physiological processes of the plants. This explains why the values of the plant indicators stabilize at a certain level of increased flow; that is, they reach a maximum value, after which excessive river flow will not promote the improvement of the riparian vegetation indicators.
In foreign studies similar to this one, such as some related to European riparian systems, it was found that the optimal hydrological conditions for seedlings and mature herbaceous plants are similar [86]. The rapid increase in runoff and water depth caused by floods may make riparian soils almost completely saturated or submerged, leading to the growth retardation of riparian vegetation. That is, the duration of high flow in summer should not be too long, so as to reduce the risk of damage to riparian vegetation [96]. Studies in semi-arid regions of Australia have shown that riparian areas with moderate flood frequencies have higher vegetation productivity [4,23]. Regular flood fluctuations can affect seedling emergence, seedling recruitment, and interspecific competition in mature plants [97]. A similar study in the Colorado River showed that lower pulse flow and frequency can maximize riparian vegetation coverage [16]. In the lower reaches of the Colorado River, the total vegetation coverage of moderately arid plots is lower than that of lightly disturbed plots [98]. Moreover, a base flow of more than 10 m3/s can promote the establishment of native plants in the riparian soils of the Colorado River basin, and is sufficient to maintain soil moisture in all areas near the main river channel, which is conducive to the utilization of water by riparian plants [81].
These studies collectively demonstrate that only moderate base flow and floods can have a positive impact on riparian vegetation, and a continuous and stable water supply can promote the germination and growth of riparian plants [99]. However, we must recognize that although flood events can inhibit plant physiological processes, they can also promote the successful establishment of more species in riparian areas by providing additional habitat types and more ecological niches [77]. Therefore, floods are crucial for maintaining the diversity and dynamics of vegetation in floodplains. Due to differences in the data collection methods and characteristics of the study areas in previous studies, conclusions about the impact of floods are not consistent. To support management of riparian vegetation by managing river flows, it is therefore necessary to identify the impacts of a river’s unique geomorphology, climate, and hydrological conditions on the responses of the river’s unique communities of riparian vegetation.

5. Conclusions

The key driving factors of riparian vegetation kNDVI, FVC, and NPP were identified by extracting river flow indicators, main climate indicators, and riparian vegetation indicators from the riparian zone of a typical section of Xiliao River using multi-year remote sensing with runoff and climate data, and the response curves of riparian vegetation to key driving factors in spring and summer were simulated.
The average flow in May and the average flow from March to May had a strong impact on the growth and development of riparian vegetation in spring, while the average flow in May, the average flow from March to August, and the maximum 90-day average flow had the strongest effect on the growth and development of vegetation in August. The high average flow in May significantly increased the growth of riparian vegetation in spring and summer, indicating that the river runoff volume in May was a key factor in determining the growth and reproduction of riparian vegetation in the growing season. Maintaining a proper base flow and high flow in spring and summer improved vegetation vitality, thereby increasing vegetation density and plant biomass.
The research results confirmed our hypothesis that in spring and summer, the impact of river water flow conditions on riparian vegetation is more significant than that of climate conditions. Moreover, riparian vegetation in spring is affected by both immediate and delayed effects of river water flow, while riparian vegetation in summer is more affected by delayed effects. This suggests that we should control the time and frequency of river discharge in spring and summer to ensure the success of seed dispersal and the vitality of riparian vegetation. Since the flood pulse in May is particularly important for vegetation in spring and summer, one way to improve water resource management is to release flood pulses from upstream reservoirs in May. The flow of water throughout the growing season is also very important. Therefore, the ecological flow should be estimated and used to guide the discharge of water throughout the growing season.
This study has certain limitations; that is, we only considered the impact of climate factors and river flow factors on riparian vegetation, while the ecological environment of the riparian region is strongly disturbed by human activities, such as riparian grazing and agricultural reclamation and irrigation. The effects of these disturbances are complex and difficult to accurately describe, and their impact on the research results cannot be completely ruled out. In addition, although we have proven that some river flow patterns are closely related to some indicators of vegetation quality, we cannot cover other indicators more comprehensively, such as river factors in autumn and winter, snow accumulation, temperature changes, and other ecological aspects and biological interactions. If these factors are taken into account in the analysis, we may get different conclusions from the current ones. Therefore, these limitations need to be addressed in future research.

Author Contributions

X.Y.: Conceptualization, formal analysis, data curation, methodology, software, writing—original draft, visualization. W.Y.: Conceptualization, formal analysis, methodology, writing—review and editing, supervision. Y.Z.: Conceptualization, formal analysis, funding acquisition, methodology, project administration, writing—review and editing, supervision. Z.P.: Data curation, software. Q.Z.: Data curation, software. Y.C. (Yutong Chen): Data curation, software. J.C.: Formal analysis. W.X.: Data curation, software. H.C.: Formal analysis. Y.C. (Yuyang Cheng): Validation. All authors have read and agreed to the published version of the manuscript.

Funding

This study was financially supported by the National Natural Science Foundation of China (52070020).

Data Availability Statement

No new data were created or analyzed in this study. Data sharing is not applicable to this article.

Conflicts of Interest

The authors declare that the research was conducted in the absence of any commercial or financial relationships that could be construed as a potential conflict of interest.

References

  1. Perry, L.G.; Andersen, D.C.; Reynolds, L.V.; Nelson, S.M.; Shafroth, P.B. Vulnerability of riparian ecosystems to elevated CO2 and climate change in arid and semiarid western North America. Glob. Change Biol. 2012, 18, 821–842. [Google Scholar] [CrossRef]
  2. Garssen, A.G.; Verhoeven, J.T.A.; Soons, M.B. Effects of climate-induced increases in summer drought on riparian plant species: A meta-analysis. Freshw. Biol. 2014, 59, 1052–1063. [Google Scholar] [CrossRef]
  3. Poff, N.L.; Allan, J.D.; Bain, M.B.; Karr, J.R.; Prestegaard, K.L.; Richter, B.D.; Sparks, R.E.; Stromberg, J.C. The natural flow regime. Bioscience 1997, 47, 769–784. [Google Scholar] [CrossRef]
  4. Broich, M.; Tulbure, M.G.; Verbesselt, J.; Xin, Q.C.; Wearne, J. Quantifying Australia’s dryland vegetation response to flooding and drought at sub-continental scale. Remote Sens. Environ. 2018, 212, 60–78. [Google Scholar] [CrossRef]
  5. Stella, J.C.; Rodríguez-González, P.M.; Dufour, S.; Bendix, J. Riparian vegetation research in Mediterranean-climate regions: Common patterns, ecological processes, and considerations for management. Hydrobiologia 2013, 719, 291–315. [Google Scholar] [CrossRef]
  6. Diehl, R.M.; Merritt, D.M.; Wilcox, A.C.; Scott, M.L. Applying Functional Traits to Ecogeomorphic Processes in Riparian Ecosystems. Bioscience 2017, 67, 729–743. [Google Scholar] [CrossRef]
  7. Lan, D.; Yu, R.H. New grassland riparian zone delineation method for calculating ecological water demand to guide management goals. River Res. Appl. 2020, 36, 1838–1851. [Google Scholar] [CrossRef]
  8. Sims, N.C.; Colloff, M.J. Remote sensing of vegetation responses to flooding of a semi-arid floodplain: Implications for monitoring ecological effects of environmental flows. Ecol. Indic. 2012, 18, 387–391. [Google Scholar] [CrossRef]
  9. Murray-Hudson, M.; Wolski, P.; Ringrose, S. Scenarios of the impact of local and upstream changes in climate and water use on hydro-ecology in the Okavango Delta, Botswana. J. Hydrol. 2006, 331, 73–84. [Google Scholar] [CrossRef]
  10. Zhu, K.; Chiariello, N.R.; Tobeck, T.; Fukami, T.; Field, C.B. Nonlinear, interacting responses to climate limit grassland production under global change. Proc. Natl. Acad. Sci. USA 2016, 113, 10589–10594. [Google Scholar] [CrossRef]
  11. Beauchamp, V.B.; Shafroth, P.B. Floristic composition, beta diversity, and nestedness of reference sites for restoration of xeroriparian areas. Ecol. Appl. 2011, 21, 465–476. [Google Scholar] [CrossRef] [PubMed]
  12. McShane, R.R.; Auerbach, D.A.; Friedman, J.M.; Auble, G.T.; Shafroth, P.B.; Merigliano, M.F.; Scott, M.L.; Poff, N.L. Distribution of invasive and native riparian woody plants across the western USA in relation to climate, river flow, floodplain geometry and patterns of introduction. Ecography 2015, 38, 1254–1265. [Google Scholar] [CrossRef]
  13. Woodhouse, C.A.; Pederson, G.T.; Morino, K.; McAfee, S.A.; McCabe, G.J. Increasing influence of air temperature on upper Colorado River streamflow. Geophys. Res. Lett. 2016, 43, 2174–2181. [Google Scholar] [CrossRef]
  14. Milly, P.C.D.; Dunne, K.A. Colorado River flow dwindles as warming-driven loss of reflective snow energizes evaporation. Science 2020, 367, 1252–1255. [Google Scholar] [CrossRef] [PubMed]
  15. Zema, D.A.; Bombino, G.; Denisi, P.; Lucas-Borja, M.E.; Zimbone, S.M. Evaluating the effects of check dams on channel geometry, bed sediment size and riparian vegetation in Mediterranean mountain torrents. Sci. Total Environ. 2018, 642, 327–340. [Google Scholar] [CrossRef]
  16. Diehl, R.M.; Wilcox, A.C.; Stella, J.C. Evaluation of the integrated riparian ecosystem response to future flow regimes on semiarid rivers in Colorado, USA. J. Environ. Manag. 2020, 271, 111037. [Google Scholar] [CrossRef]
  17. Newman, B.D.; Wilcox, B.P.; Archer, S.R.; Breshears, D.D.; Dahm, C.N.; Duffy, C.J.; McDowell, N.G.; Phillips, F.M.; Scanlon, B.R.; Vivoni, E.R. Ecohydrology of water-limited environments: A scientific vision. Water Resour. Res. 2006, 42, W06302. [Google Scholar] [CrossRef]
  18. Merritt, D.M.; Scott, M.L.; Poff, N.L.; Auble, G.T.; Lytle, D.A. Theory, methods and tools for determining environmental flows for riparian vegetation: Riparian vegetation-flow response guilds. Freshw. Biol. 2010, 55, 206–225. [Google Scholar] [CrossRef]
  19. Diehl, R.M.; Wilcox, A.C.; Merritt, D.M.; Perkins, D.W.; Scott, J.A. Development of an eco-geomorphic modeling framework to evaluate riparian ecosystem response to flow-regime changes. Ecol. Eng. 2018, 123, 112–126. [Google Scholar] [CrossRef]
  20. Nagler, P.L.; Glenn, E.P.; Hinojosa-Huerta, O. Synthesis of ground and remote sensing data for monitoring ecosystem functions in the Colorado River Delta, Mexico. Remote Sens. Environ. 2009, 113, 1473–1485. [Google Scholar] [CrossRef]
  21. Mukherjee, K.; Pal, S. Hydrological and landscape dynamics of floodplain wetlands of the Diara region, Eastern India. Ecol. Indic. 2021, 121, 106961. [Google Scholar] [CrossRef]
  22. Powell, S.J.; Jakeman, A.; Croke, B. Can NDVI response indicate the effective flood extent in macrophyte dominated floodplain wetlands? Ecol. Indic. 2014, 45, 486–493. [Google Scholar] [CrossRef]
  23. Dzubáková, K.; Molnar, P.; Schindler, K.; Trizna, M. Monitoring of riparian vegetation response to flood disturbances using terrestrial photography. Hydrol. Earth Syst. Sci. 2015, 19, 195–208. [Google Scholar] [CrossRef]
  24. Gurnell, A.M.; Bertoldi, W.; Corenblit, D. Changing river channels: The roles of hydrological processes, plants and pioneer fluvial landforms in humid temperate, mixed load, gravel bed rivers. Earth-Sci. Rev. 2012, 111, 129–141. [Google Scholar] [CrossRef]
  25. Corenblit, D.; Baas, A.; Balke, T.; Bouma, T.; Fromard, F.; Garófano-Gómez, V.; González, E.; Gurnell, A.M.; Hortobágyi, B.; Julien, F.; et al. Engineer pioneer plants respond to and affect geomorphic constraints similarly along water-terrestrial interfaces world-wide. Global Ecol. Biogeogr. 2015, 24, 1363–1376. [Google Scholar] [CrossRef]
  26. Gonsamo, A.; Chen, J.M.; Lombardozzi, D. Global vegetation productivity response to climatic oscillations during the satellite era. Glob. Change Biol. 2016, 22, 3414–3426. [Google Scholar] [CrossRef] [PubMed]
  27. Gu, Z.J.; Duan, X.W.; Shi, Y.D.; Li, Y.; Pan, X. Spatiotemporal variation in vegetation coverage and its response to climatic factors in the Red River Basin, China. Ecol. Indic. 2018, 93, 54–64. [Google Scholar] [CrossRef]
  28. Cai, D.W.; Ge, Q.S.; Wang, X.M.; Liu, B.L.; Goudie, A.S.; Hu, S. Contributions of ecological programs to vegetation restoration in arid and semiarid China. Environ. Res. Lett. 2020, 15, 114046. [Google Scholar] [CrossRef]
  29. Piao, S.L.; Cui, M.D.; Chen, A.P.; Wang, X.H.; Ciais, P.; Liu, J.; Tang, Y.H. Altitude and temperature dependence of change in the spring vegetation green-up date from 1982 to 2006 in the Qinghai-Xizang Plateau. Agric. For. Meteorol. 2011, 151, 1599–1608. [Google Scholar] [CrossRef]
  30. Xu, L.; Myneni, R.B.; Chapin, F.S.; Callaghan, T.V.; Pinzon, J.E.; Tucker, C.J.; Zhu, Z.; Bi, J.; Ciais, P.; Tommervik, H.; et al. Temperature and vegetation seasonality diminishment over northern lands. Nat. Clim. Change 2013, 3, 581–586. [Google Scholar] [CrossRef]
  31. Ukkola, A.M.; Prentice, I.C.; Keenan, T.F.; van Dijk, A.I.J.M.; Viney, N.R.; Myneni, R.B.; Bi, J. Reduced streamflow in water-stressed climates consistent with CO effects on vegetation. Nat. Clim. Change 2016, 6, 75–78. [Google Scholar] [CrossRef]
  32. Shao, R.; Zhang, B.Q.; Su, T.X.; Biao, L.; Cheng, L.Y.; Xue, Y.Y.; Yang, W.J. Estimating the Increase in Regional Evaporative Water Consumption as a Result of Vegetation Restoration Over the Loess Plateau, China. J. Geophys. Res.-Atmos. 2019, 124, 11783–11802. [Google Scholar] [CrossRef]
  33. Kou, P.L.; Xu, Q.; Jin, Z.; Yunus, A.P.; Luo, X.B.; Liu, M.H. Complex anthropogenic interaction on vegetation greening in the Chinese Loess Plateau. Sci. Total Environ. 2021, 778, 146065. [Google Scholar] [CrossRef] [PubMed]
  34. Nemani, R.R.; Keeling, C.D.; Hashimoto, H.; Jolly, W.M.; Piper, S.C.; Tucker, C.J.; Myneni, R.B.; Running, S.W. Climate-driven increases in global terrestrial net primary production from 1982 to 1999. Science 2003, 300, 1560–1563. [Google Scholar] [CrossRef] [PubMed]
  35. Reyer, C.P.O.; Leuzinger, S.; Rammig, A.; Wolf, A.; Bartholomeus, R.P.; Bonfante, A.; de Lorenzi, F.; Dury, M.; Gloning, P.; Abou Jaoudé, R.; et al. A plant’s perspective of extremes: Terrestrial plant responses to changing climatic variability. Glob. Change Biol. 2013, 19, 75–89. [Google Scholar] [CrossRef]
  36. Gao, J.b.; Jiao, K.W.; Wu, S.H.; Ma, D.Y.; Zhao, D.S.; Yin, Y.H.; Dai, E.F. Past and future effects of climate change on spatially heterogeneous vegetation activity in China. Earths Future 2017, 5, 679–692. [Google Scholar] [CrossRef]
  37. Hou, W.J.; Gao, J.B.; Wu, S.H.; Dai, E.F. Interannual Variations in Growing-Season NDVI and Its Correlation with Climate Variables in the Southwestern Karst Region of China. Remote Sens. 2015, 7, 11105–11124. [Google Scholar] [CrossRef]
  38. Wu, D.H.; Zhao, X.; Liang, S.L.; Zhou, T.; Huang, K.C.; Tang, B.J.; Zhao, W.Q. Time-lag effects of global vegetation responses to climate change. Glob. Change Biol. 2015, 21, 3520–3531. [Google Scholar] [CrossRef] [PubMed]
  39. Xu, H.J.; Wang, X.P.; Yang, T.B. Trend shifts in satellite-derived vegetation growth in Central Eurasia, 1982–2013. Sci. Total Environ. 2017, 579, 1658–1674. [Google Scholar] [CrossRef]
  40. Chu, H.S.; Venevsky, S.; Wu, C.; Wang, M.H. NDVI-based vegetation dynamics and its response to climate changes at Amur-Heilongjiang River Basin from 1982 to 2015. Sci. Total Environ. 2019, 650, 2051–2062. [Google Scholar] [CrossRef] [PubMed]
  41. Merritt, D.M.; Wohl, E.E. Processes governing hydrochory along rivers: Hydraulics, hydrology, and dispersal phenology. Ecol. Appl. 2002, 12, 1071–1087. [Google Scholar] [CrossRef]
  42. Karrenberg, S.; Edwards, P.J.; Kollmann, J. The life history of Salicaceae living in the active zone of floodplains. Freshw. Biol. 2002, 47, 733–748. [Google Scholar] [CrossRef]
  43. Farmer, R.E.; Bonner, F.T. Germination and Initial Growth of Eastern Cottonwood as Influenced by Moisture Stress Temperature and Storage. Bot. Gaz. 1967, 128, 211–215. [Google Scholar] [CrossRef]
  44. Greet, J.; Webb, J.A.; Cousens, R.D. The importance of seasonal flow timing for riparian vegetation dynamics: A systematic review using causal criteria analysis. Freshw. Biol. 2011, 56, 1231–1247. [Google Scholar] [CrossRef]
  45. Lin, N.; Jiang, R.Z.; Liu, Q.; Yang, H.; Liu, H.L.; Yang, Q. Quantifying the Spatiotemporal Variation of Evapotranspiration of Different Land Cover Types and the Contribution of Its Associated Factors in the Xiliao River Plain. Remote Sens. 2022, 14, 252. [Google Scholar] [CrossRef]
  46. Chen, P.F. Monthly net primary productivity of China’s terrestrial ecosystems north of 18°N latitude: 1 km raster dataset (1985–2015). J. Glob. Change Data Discov. 2019, 3, 34–41. [Google Scholar]
  47. De Girolamo, A.M.; Barca, E.; Pappagallo, G.; Lo Porto, A. Simulating ecologically relevant hydrological indicators in a temporary river system. Agric. Water Manag. 2017, 180, 194–204. [Google Scholar] [CrossRef]
  48. Hao, Z.; Rallings, A.M.; Espinoza, V.; Luo, P.P.; Duan, W.L.; Peng, Q.D.; Gao, Y.; Viers, J.H. Flowing from East to West: A bibliometric analysis of recent advances in environmental flow science in China. Ecol. Indic. 2021, 125, 107358. [Google Scholar] [CrossRef]
  49. Richter, B.D.; Baumgartner, J.V.; Powell, J.; Braun, D.P. A method for assessing hydrologic alteration within ecosystems. Conserv. Biol. 1996, 10, 1163–1174. [Google Scholar] [CrossRef]
  50. Richter, B.D.; Mathews, R.; Wigington, R. Ecologically sustainable water management: Managing river flows for ecological integrity. Ecol. Appl. 2003, 13, 206–224. [Google Scholar] [CrossRef]
  51. Arthington, A.H.; Bunn, S.E.; Poff, N.L.; Naiman, R.J. The challenge of providing environmental flow rules to sustain river ecosystems. Ecol. Appl. 2006, 16, 1311–1318. [Google Scholar] [CrossRef] [PubMed]
  52. Poff, N.L.; Zimmerman, J.K.H. Ecological responses to altered flow regimes: A literature review to inform the science and management of environmental flows. Freshw. Biol. 2010, 55, 194–205. [Google Scholar] [CrossRef]
  53. Hua, X.B.; Sirguey, P.; Ohlemüller, R. Recent trends in the timing of the growing season in New Zealand’s natural and semi-natural grasslands. Gisci Remote Sens. 2021, 58, 1090–1111. [Google Scholar] [CrossRef]
  54. Chen, B.J.; Jiapaer, G.; Yu, T.; Zhang, L.C.; Tu, H.Y.; Liang, H.W.; Lina, K.X.; Ju, T.W.; Ling, Q. The role of climatic factor timing on grassland net primary productivity in Altay, Xinjiang. Ecol. Indic. 2023, 157, 111243. [Google Scholar] [CrossRef]
  55. Xu, L.L.; Zhang, X.Z.; Wang, Y.L.; Fu, Y.; Yan, H.; Qian, S.; Cheng, L. Drivers of phenology shifts and their effect on productivity in northern grassland of China during 1984–2017-evidence from long-term observational data. Int. J. Biometeorol. 2021, 65, 527–539. [Google Scholar] [CrossRef] [PubMed]
  56. Bradford, J.B.; Lauenroth, W.K.; Burke, I.C.; Paruelo, J.M. The influence of climate, soils, weather, and land use on primary production and biomass seasonality in the US Great Plains. Ecosystems 2006, 9, 934–950. [Google Scholar] [CrossRef]
  57. Dong, Y.; Yin, D.Q.; Li, X.; Huang, J.X.; Su, W.; Li, X.C.; Wang, H.S. Spatial-Temporal Evolution of Vegetation NDVI in Association with Climatic, Environmental and Anthropogenic Factors in the Loess Plateau, China during 2000–2015: Quantitative Analysis Based on Geographical Detector Model. Remote Sens. 2021, 13, 4380. [Google Scholar] [CrossRef]
  58. Feng, X.J.; Tian, J.; Wang, Y.X.; Wu, J.J.; Liu, J.; Ya, Q.; Li, Z.S. Spatio-Temporal Variation and Climatic Driving Factors of Vegetation Coverage in the Yellow River Basin from 2001 to 2020 Based on. Forests 2023, 14, 620. [Google Scholar] [CrossRef]
  59. Camps-Valls, G.; Campos-Taberner, M.; Moreno-Martínez, A.; Walther, S.; Duveiller, G.; Cescatti, A.; Mahecha, M.D.; Muñoz-Marí, J.; García-Haro, F.J.; Guanter, L.; et al. A unified vegetation index for quantifying the terrestrial biosphere. Sci. Adv. 2021, 7, eabc7447. [Google Scholar] [CrossRef]
  60. Wu, D.H.; Wu, H.; Zhao, X.; Zhou, T.; Tang, B.J.; Zhao, W.Q.; Jia, K. Evaluation of Spatiotemporal Variations of Global Fractional Vegetation Cover Based on GIMMS NDVI Data from 1982 to 2011. Remote Sens. 2014, 6, 4217–4239. [Google Scholar] [CrossRef]
  61. Tian, F.; Fensholt, R.; Verbesselt, J.; Grogan, K.; Horion, S.; Wang, Y.J. Evaluating temporal consistency of long-term global NDVI datasets for trend analysis. Remote Sens. Environ. 2015, 163, 326–340. [Google Scholar] [CrossRef]
  62. Yan, E.P.; Wang, G.X.; Lin, H.; Xia, C.Z.; Sun, H. Phenology-based classification of vegetation cover types in Northeast China using MODIS NDVI and EVI time series. Int. J. Remote Sens. 2015, 36, 489–512. [Google Scholar] [CrossRef]
  63. Gang, C.C.; Zhao, W.; Zhao, T.; Zhang, Y.; Gao, X.R.; Wen, Z.M. The impacts of land conversion and management measures on the grassland net primary productivity over the Loess Plateau, Northern China. Sci. Total Environ. 2018, 645, 827–836. [Google Scholar] [CrossRef]
  64. Bai, Z.G.; Dent, D.L.; Olsson, L.; Schaepman, M.E. Proxy global assessment of land degradation. Soil. Use Manag. 2008, 24, 223–234. [Google Scholar] [CrossRef]
  65. Liao, S.M.; Xue, L.Q.; Dong, Z.C.; Zhu, B.L.; Zhang, K.; Wei, Q.; Fu, F.B.; Wei, G.H. Cumulative ecohydrological response to hydrological processes in arid basins. Ecol. Indic. 2020, 111, 106005. [Google Scholar] [CrossRef]
  66. Zhang, Y.L.; Song, C.H.; Band, L.E.; Sun, G.; Li, J.X. Reanalysis of global terrestrial vegetation trends from MODIS products: Browning or greening? Remote Sens. Environ. 2017, 191, 145–155. [Google Scholar] [CrossRef]
  67. Dou, X.; Ma, X.F.; Huo, T.C.; Zhu, J.T.; Zhao, C.Y. Assessment of the environmental effects of ecological water conveyance over 31 years for a terminal lake in Central Asia. Catena 2022, 208, 105725. [Google Scholar] [CrossRef]
  68. Karabadji, N.E.; Korba, A.A.; Assi, A.; Seridi, H.; Aridhi, S.; Dhifli, W. Accuracy and diversity-aware multi-objective approach for random forest construction. Expert. Syst. Appl. 2023, 225, 120138. [Google Scholar] [CrossRef]
  69. Schonlau, M.; Zou, R.Y. The random forest algorithm for statistical learning. Stata J. 2020, 20, 3–29. [Google Scholar] [CrossRef]
  70. Breiman, L. Random forests. Mach. Learn. 2001, 45, 5–32. [Google Scholar] [CrossRef]
  71. Phillips, J.D. Evolutionary geomorphology: Thresholds and nonlinearity in landform response to environmental change. Hydrol. Earth Syst. Sci. 2006, 10, 731–742. [Google Scholar] [CrossRef]
  72. Liu, Y.L.; Lei, H.M. Responses of Natural Vegetation Dynamics to Climate Drivers in China from 1982 to 2011. Remote Sens. 2015, 7, 10243–10268. [Google Scholar] [CrossRef]
  73. Wen, L.; Mason, T.J.; Ryan, S.; Ling, J.E.; Saintilan, N.; Rodriguez, J. Monitoring long-term vegetation condition dynamics in persistent semi-arid wetland communities using time series of Landsat data. Sci. Total Environ. 2023, 905, 167212. [Google Scholar] [CrossRef]
  74. Guo, L.; Cheng, J.M.; Luedeling, E.; Koerner, S.E.; He, J.S.; Xu, J.C.; Gang, C.C.; Li, W.; Luo, R.M.; Peng, C.H. Critical climate periods for grassland productivity on China’s Loess Plateau. Agric. For. Meteorol. 2017, 233, 101–109. [Google Scholar] [CrossRef]
  75. Soons, M.B.; de Groot, G.A.; Ramirez, M.T.C.; Fraaije, R.G.A.; Verhoeven, J.T.A.; de Jager, M. Directed dispersal by an abiotic vector: Wetland plants disperse their seeds selectively to suitable sites along the hydrological gradient via water. Funct. Ecol. 2017, 31, 499–508. [Google Scholar] [CrossRef]
  76. Bewley, J.D. Seed germination and dormancy. Plant Cell 1997, 9, 1055–1066. [Google Scholar] [CrossRef] [PubMed]
  77. Jansson, R.; Zinko, U.; Merritt, D.M.; Nilsson, C. Hydrochory increases riparian plant species richness: A comparison between a free-flowing and a regulated river. J. Ecol. 2005, 93, 1094–1103. [Google Scholar] [CrossRef]
  78. Jäkäläniemi, A.; Tuomi, J.; Siikamäki, P.; Kilpiä, A. Colonization-extinction and patch dynamics of the perennial riparian plant. J. Ecol. 2005, 93, 670–680. [Google Scholar] [CrossRef]
  79. Zhang, S.H.; Ye, Z.X.; Chen, Y.N.; Xu, Y.F. Vegetation responses to an ecological water conveyance project in the lower reaches of the Heihe River basin. Ecohydrology 2017, 10, e1866. [Google Scholar] [CrossRef]
  80. Jia, L.; Shang, H.; Hu, G.; Menenti, M. Phenological response of vegetation to upstream river flow in the Heihe Rive basin by time series analysis of MODIS data. Hydrol. Earth Syst. Sci. 2011, 15, 1047–1064. [Google Scholar] [CrossRef]
  81. Ramírez-Hernández, J.; Rodríguez-Burgueño, J.E.; Zamora-Arroyo, F.; Carreón-Diazconti, C.; Pérez-González, D. lMimic pulse-base flows and groundwater in a regulated river in semiarid land: Riparian restoration issues. Ecol. Eng. 2015, 83, 239–248. [Google Scholar] [CrossRef]
  82. Nagler, P.L.; Hinojosa-Huerta, O.; Glenn, E.P.; Garcia-Hernandez, J.; Romo, R.; Curtis, C.; Huete, A.R.; Nelson, S.G. Regeneration of native trees in the presence of invasive saltcedar in the Colorado River delta, Mexico. Conserv. Biol. 2005, 19, 1842–1852. [Google Scholar] [CrossRef]
  83. Robertson, A.I.; Bacon, P.; Heagney, G. The responses of floodplain primary production to flood frequency and timing. J. Appl. Ecol. 2001, 38, 126–136. [Google Scholar] [CrossRef]
  84. Richardson, A.D.; Black, T.A.; Ciais, P.; Delbart, N.; Friedl, M.A.; Gobron, N.; Hollinger, D.Y.; Kutsch, W.L.; Longdoz, B.; Luyssaert, S.; et al. Influence of spring and autumn phenological transitions on forest ecosystem productivity. Philos. Trans. R. Soc. B Biol. Sci. 2010, 365, 3227–3246. [Google Scholar] [CrossRef]
  85. Nilsson, C.; Brown, R.L.; Jansson, R.; Merritt, D.M. The role of hydrochory in structuring riparian and wetland vegetation. Biol. Rev. 2010, 85, 837–858. [Google Scholar] [CrossRef] [PubMed]
  86. Fraaije, R.G.A.; ter Braak, C.J.F.; Verduyn, B.; Breeman, L.B.S.; Verhoeven, J.T.A.; Soons, M.B. Early plant recruitment stages set the template for the development of vegetation patterns along a hydrological gradient. Funct. Ecol. 2015, 29, 971–980. [Google Scholar] [CrossRef]
  87. Januschke, K.; Brunzel, S.; Haase, P.; Hering, D. Effects of stream restorations on riparian mesohabitats, vegetation and carabid beetles. Biodivers. Conserv. 2011, 20, 3147–3164. [Google Scholar] [CrossRef]
  88. Lorenz, A.W.; Korte, T.; Sundermann, A.; Januschke, K.; Haase, P. Macrophytes respond to reach-scale river restorations. J. Appl. Ecol. 2012, 49, 202–212. [Google Scholar] [CrossRef]
  89. Bino, G.; Sisson, S.A.; Kingsford, R.T.; Thomas, R.F.; Bowen, S. Developing state and transition models of floodplain vegetation dynamics as a tool for conservation decision-making: A case study of the Macquarie Marshes Ramsar wetland. J. Appl. Ecol. 2015, 52, 654–664. [Google Scholar] [CrossRef]
  90. Wu, H.W.; Zhao, G.Q.; Li, X.Y.; Wang, Y.; He, B.; Jiang, Z.Y.; Zhang, S.Y.; Sun, W. Identifying water sources used by alpine riparian plants in a restoration zone on the Qinghai-Tibet Plateau: Evidence from stable isotopes. Sci. Total Environ. 2019, 697, 134092. [Google Scholar] [CrossRef]
  91. Liu, X.; Zhuang, Q.L.; Lai, L.M.; Zhou, J.H.; Sun, Q.L.; Yi, S.G.; Liu, B.B.; Zheng, Y.R. Soil water use sources and patterns in shrub encroachment in semiarid grasslands of Inner Mongolia. Agric. For. Meteorol. 2021, 308, 108579. [Google Scholar] [CrossRef]
  92. Jarchow, C.J.; Nagler, P.L.; Glenn, E.P. Greenup and evapotranspiration following the Minute 319 pulse flow to Mexico: An analysis using Landsat 8 Normalized Difference Vegetation Index (NDVI) data. Ecol. Eng. 2017, 106, 776–783. [Google Scholar] [CrossRef]
  93. Scott, R.L.; Shuttleworth, W.J.; Goodrich, D.C.; Maddock, T. The water use of two dominant vegetation communities in a semiarid riparian ecosystem. Agric. For. Meteorol. 2000, 105, 241–256. [Google Scholar] [CrossRef]
  94. Puijalon, S.; Bouma, T.J.; Douady, C.J.; van Groenendael, J.; Anten, N.P.R.; Martel, E.; Bornette, G. Plant resistance to mechanical stress: Evidence of an avoidance-tolerance trade-off. New Phytol. 2011, 191, 1141–1149. [Google Scholar] [CrossRef] [PubMed]
  95. Grygoruk, M.; Kochanek, K.; Miroslaw-Swiatek, D. Analysis of long-term changes in inundation characteristics of near-natural temperate riparian habitats in the Lower Basin of the Biebrza Valley, Poland. J. Hydrol.-Reg. Stud. 2021, 36, 100844. [Google Scholar] [CrossRef]
  96. Main, A.C.; Greet, J.; Vivian, L.M.; Jones, C.S. Warmer water temperatures exacerbate the negative impacts of inundation on herbaceous riparian plants. Freshw. Biol. 2022, 67, 1162–1173. [Google Scholar] [CrossRef]
  97. Capon, S.J.; Brock, M.A. Flooding, soil seed bank dynamics and vegetation resilience of a hydrologically variable desert floodplain. Freshw. Biol. 2006, 51, 206–223. [Google Scholar] [CrossRef]
  98. Tiegs, S.D.; O’Leary, J.F.; Pohl, M.M.; Munill, C.L. Flood disturbance and riparian species diversity on the Colorado River Delta. Biodivers. Conserv. 2005, 14, 1175–1194. [Google Scholar] [CrossRef]
  99. Ivory, S.J.; McGlue, M.M.; Spera, S.; Silva, A.; Bergier, I. Vegetation, rainfall, and pulsing hydrology in the Pantanal, the world’s largest tropical wetland. Environ. Res. Lett. 2019, 14, 124017. [Google Scholar] [CrossRef]
Figure 1. Geographical location of study area and image of surrounding terrain.
Land 14 00198 g001
Figure 2. Significance analysis for vegetation indicators and driving factors in riparian zones in May. Abbreviations: CP, cumulative precipitation; CSR, cumulative solar radiation; CST, cumulative surface temperature; FVC, fractional vegetation cover; kNDVI, kernel normalized-difference vegetation index; NPP, net primary production.
Land 14 00198 g002
Figure 3. Significance analysis for vegetation indicators and driving factors in the riparian zones in August. Abbreviations: CP, cumulative precipitation; CSR, cumulative solar radiation; CST, cumulative surface temperature; FVC, fractional vegetation cover; kNDVI, kernel normalized-difference vegetation index; NPP, net primary production.
Land 14 00198 g003
Figure 4. Fitting results for relationship between riparian vegetation indicators and key driving factors in May: (a) kernel normalized-difference vegetation index (kNDVI); (b) fractional vegetation cover (FVC); (c) net primary production (NPP). All regressions were statistically significant (p < 0.05).
Land 14 00198 g004
Figure 5. Fitting results for relationships between riparian vegetation indicators and key driving factors in August: (a) kernel normalized-difference vegetation index (kNDVI); (b) fractional vegetation cover (FVC); (c) net primary production (NPP). All regressions were statistically significant (p < 0.05).
Land 14 00198 g005
Table 1. Selected river flow, riparian vegetation, and climate indicators.
Indicator TypeIndicator NameUnitsEcological SignificanceExtraction Method
River flow indicatorsAverage flow in each month from March to August
Average flow for the whole period from March to May
Average flow for the whole period from March to August
Maximum 30-day average flow
Maximum 90-day average flow
m3/s
-
Ensure suitable habitat condition and water regime (quantity, quality, and temperature) for aquatic and terrestrial organisms [50].
-
Provide food and cover for fur-bearing mammals [50].
-
Provide adequate soil moisture and necessary minerals in the soil [51].
-
Shaping of the riverine ecosystem through biotic and abiotic factors [51,52].
Numerical statistics
Climate indicatorsCumulative precipitation from March to May and from March to Augustmm
-
Highly related to the peak season of vegetation growth. High rainfall will prolong the peak season of vegetation growth [53].
-
Provides the water needed to maintain the growth of vegetation [54].
ENVI data analyzed in ArcGIS (www.esri.com)
Cumulative solar radiation from March to May and from March to AugustW/m2
-
Provides the main energy for vegetation photosynthesis [54].
Cumulative surface temperature from March to May and from March to AugustK
-
Under the condition that water is not the limiting factor, higher temperatures lead to an early start of the plant growing season [55].
-
The increase of temperature will prolong the growing season and promote carbon assimilation by the vegetation [56].
Vegetation indicatorskNDVI in May and August
-
Reflect the change of vegetation greenness [57].
-
Compared with NDVI, it can better deal with saturation effects, complex phenological cycles, and seasonal variation, and can solve the problem of mixed pixels [58].
k N D V I = tanh N D V I 2 [59]
FVC in May and August
-
Focuses on the description of vegetation density, which directly reflects the change of vegetation cover [33,60].
F V C = N D V I N D V I m i n N D V I m a x N D V I m i n [61,62]
NPP in May and AugustgC/(m2·year)
-
Focus on the growth and quality of vegetation, that is, biomass [63].
-
It reflects the growth status of vegetation and the health status of the ecosystem [64].
ArcGIS and ENVI statistics
Table 2. Random Forest analysis accuracy for riparian vegetation indicators, river flow indicators, and climate indicators in May (spring). Abbreviations: FVC, fractional vegetation cover; kNDVI, kernel normalized-difference vegetation index; MAE, mean absolute error; NPP, net primary production; R2, regression goodness of fit; RMSE, root mean square error.
Riparian Vegetation IndicatorsAccuracy of CalibrationAccuracy of Validation
R2RMSEMAER2RMSEMAE
kNDVI0.8690.0030.0030.8370.0030.003
FVC0.8510.0120.0100.8030.0160.013
NPP0.8741.0180.8110.8860.8410.743
Table 3. Analysis of Random Forest accuracy for riparian vegetation indicators, river flow indicators, and climate indicators in August (summer). Abbreviations: FVC, fractional vegetation cover; kNDVI, kernel normalized-difference vegetation index; MAE, mean absolute error; NPP, net primary production; R2, regression goodness of fit; RMSE, root mean square error.
Riparian Vegetation IndicatorsAccuracy of CalibrationAccuracy of Validation
R2RMSEMAER2RMSEMAE
kNDVI0.9210.0170.0140.8980.0180.014
FVC0.9150.0150.0120.8580.0160.011
NPP0.8991.7151.3740.8512.0151.666
Disclaimer/Publisher’s Note: The statements, opinions and data contained in all publications are solely those of the individual author(s) and contributor(s) and not of MDPI and/or the editor(s). MDPI and/or the editor(s) disclaim responsibility for any injury to people or property resulting from any ideas, methods, instructions or products referred to in the content.

