
An Analysis of Land Use Conflicts and Strategies in the Harbin–Changchun Urban Agglomeration Based on the Production–Ecological–Living Space Theory and Patch-Generating Land Use Simulation

Abstract
1. Introduction
2. Materials and Methods
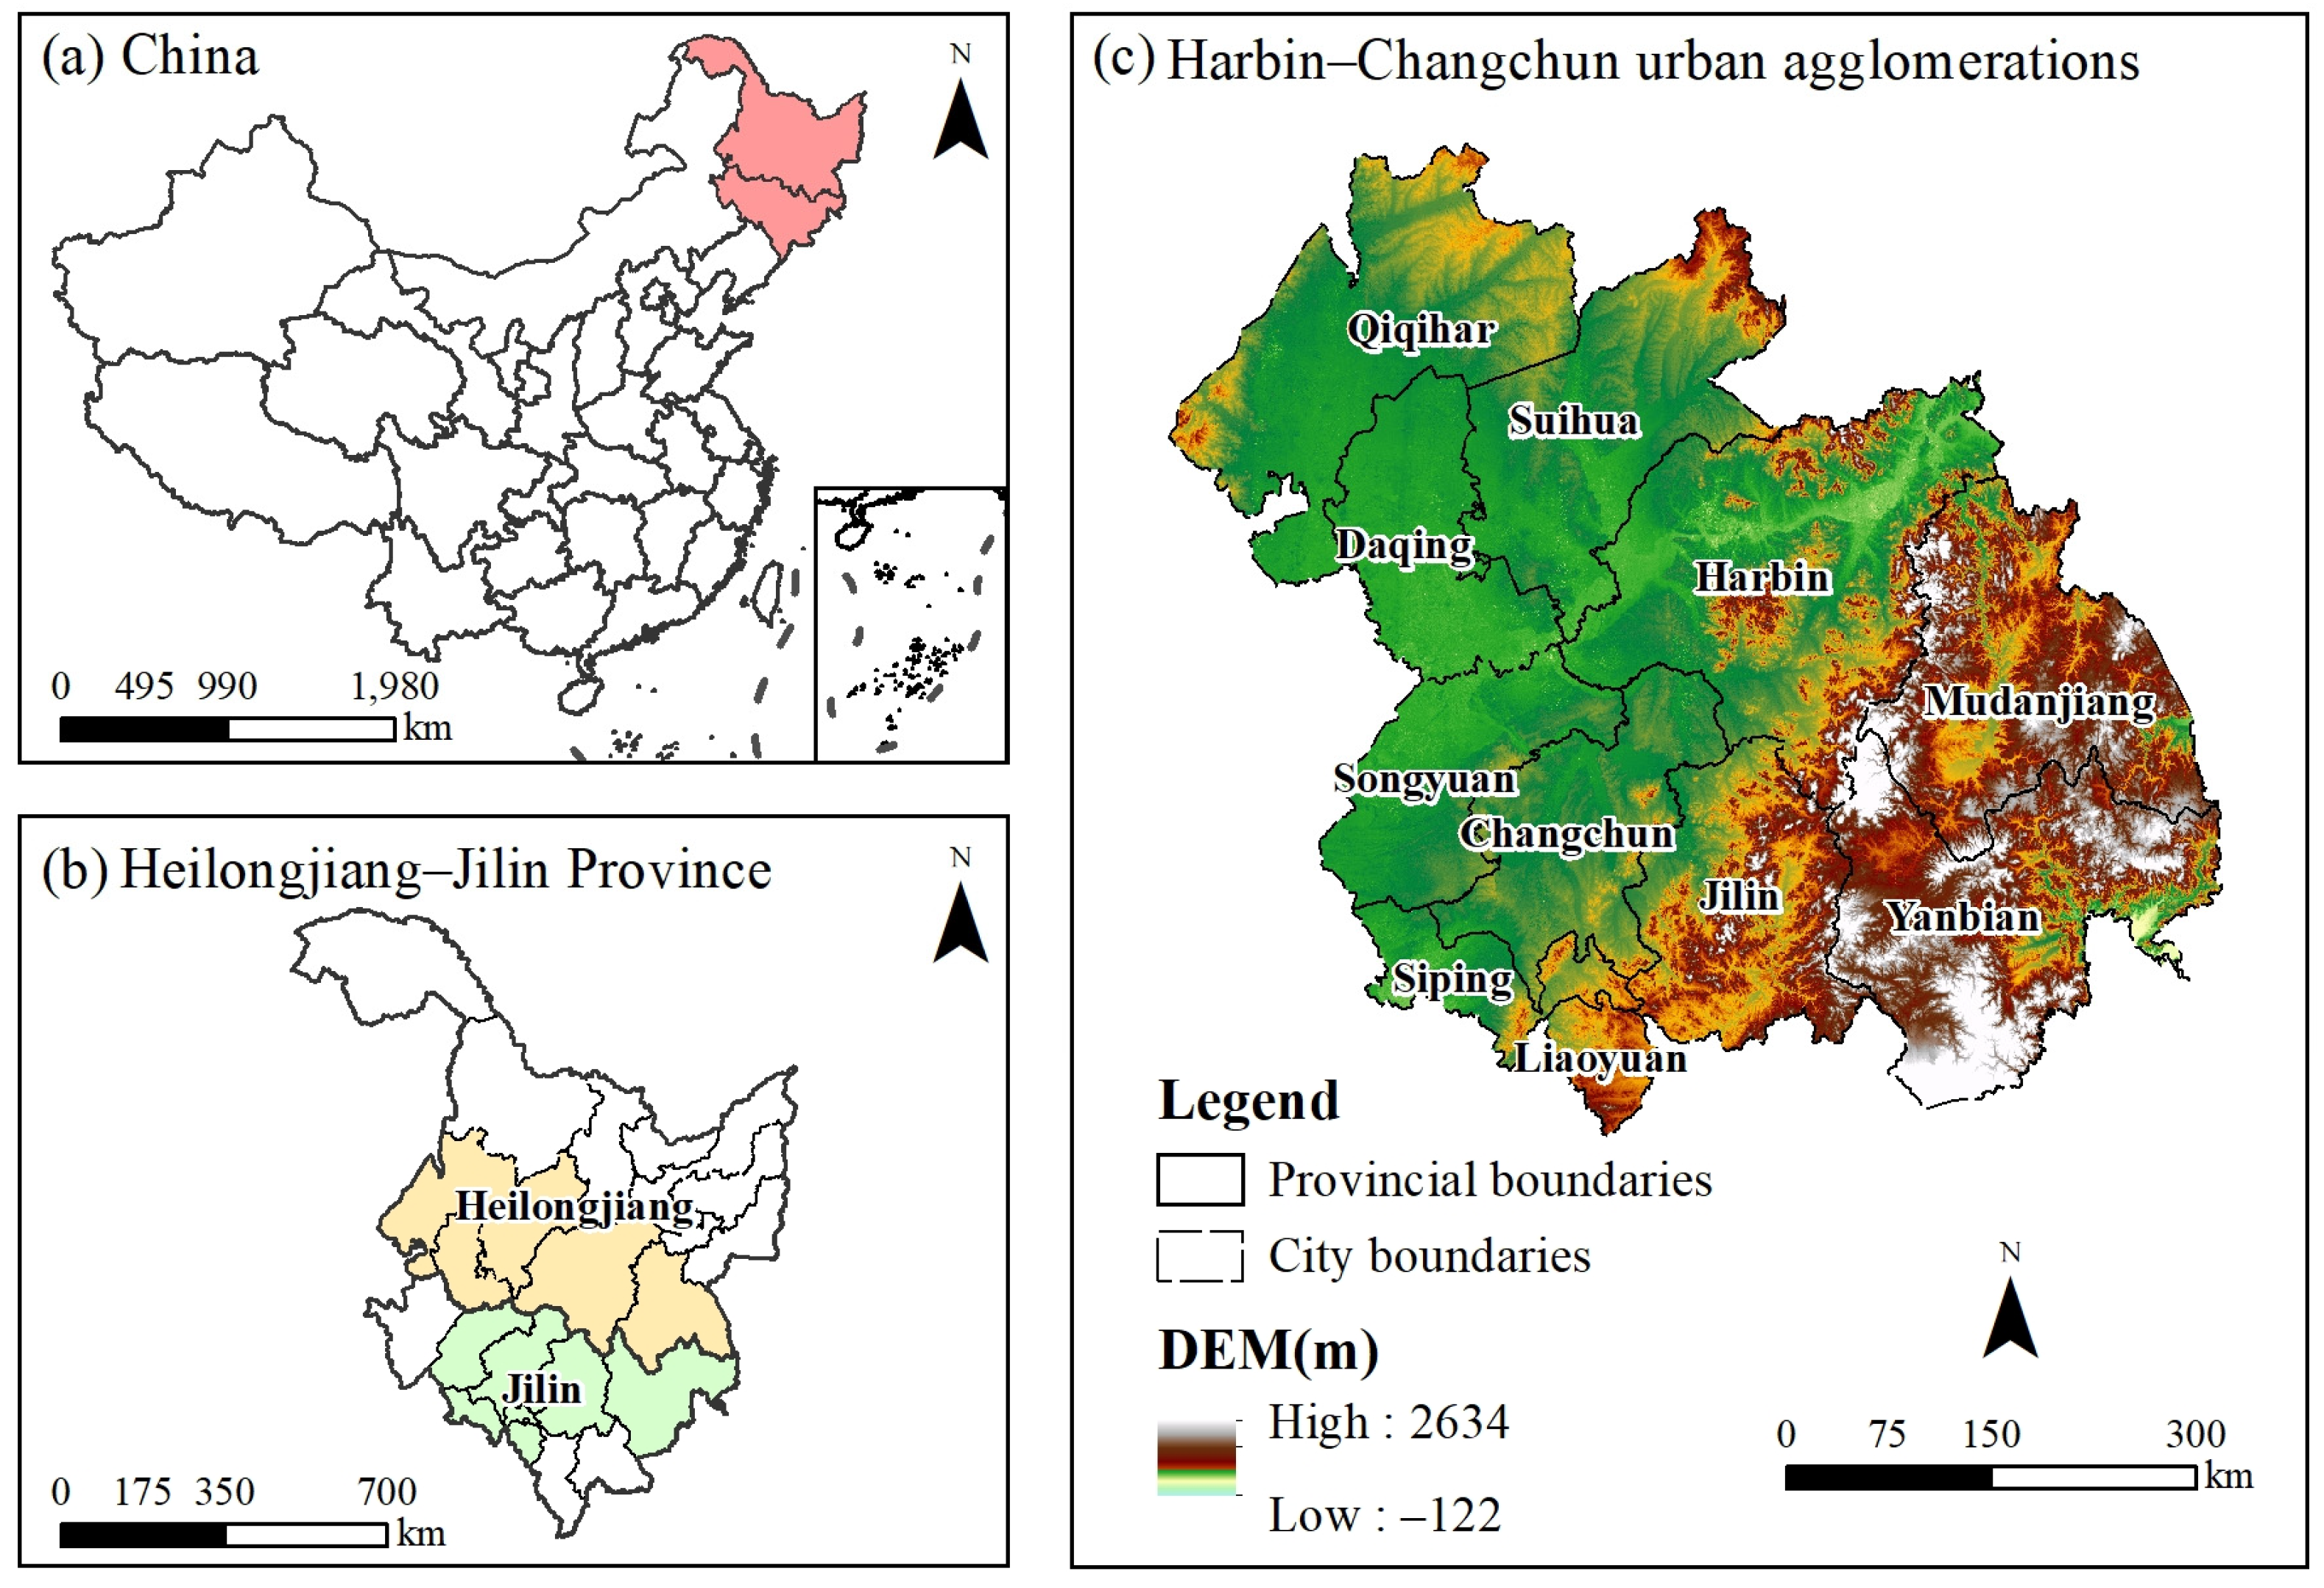
2.1. Study Areas
2.2. Data Sources
2.3. Methodology
2.3.1. The Classification of the PELS
2.3.2. PLUS Model
- 1.
- Core Algorithm of PLUS Model
- 2.
- Scenario setting
- 3.
- Determination of neighborhood weight parameters
2.3.3. Spatial Comprehensive Conflict Index (SCCI)
- Spatial comprehensive conflict index (SCCI)
- 2.
- Complex index (CI)
- 3.
- Fragility index (FI)
- 4.
- Stability index (SI)
2.3.4. Remote Sensing Ecological Index (RSEI)
- Normalized Vegetation Index (NDVI)
- 2.
- Wetness component (Wet)
- 3.
- Land Surface Temperature (LST)
- 4.
- Normalized Difference Built-up and Soil Index (NDBSI)
2.3.5. Relative Conflict Measurement Based on Remote Sensing Index
2.3.6. Center of Gravity Transfer Model
3. Results
3.1. An Analysis of the Evolutionary Characteristics of the PELS from 2000 to 2020
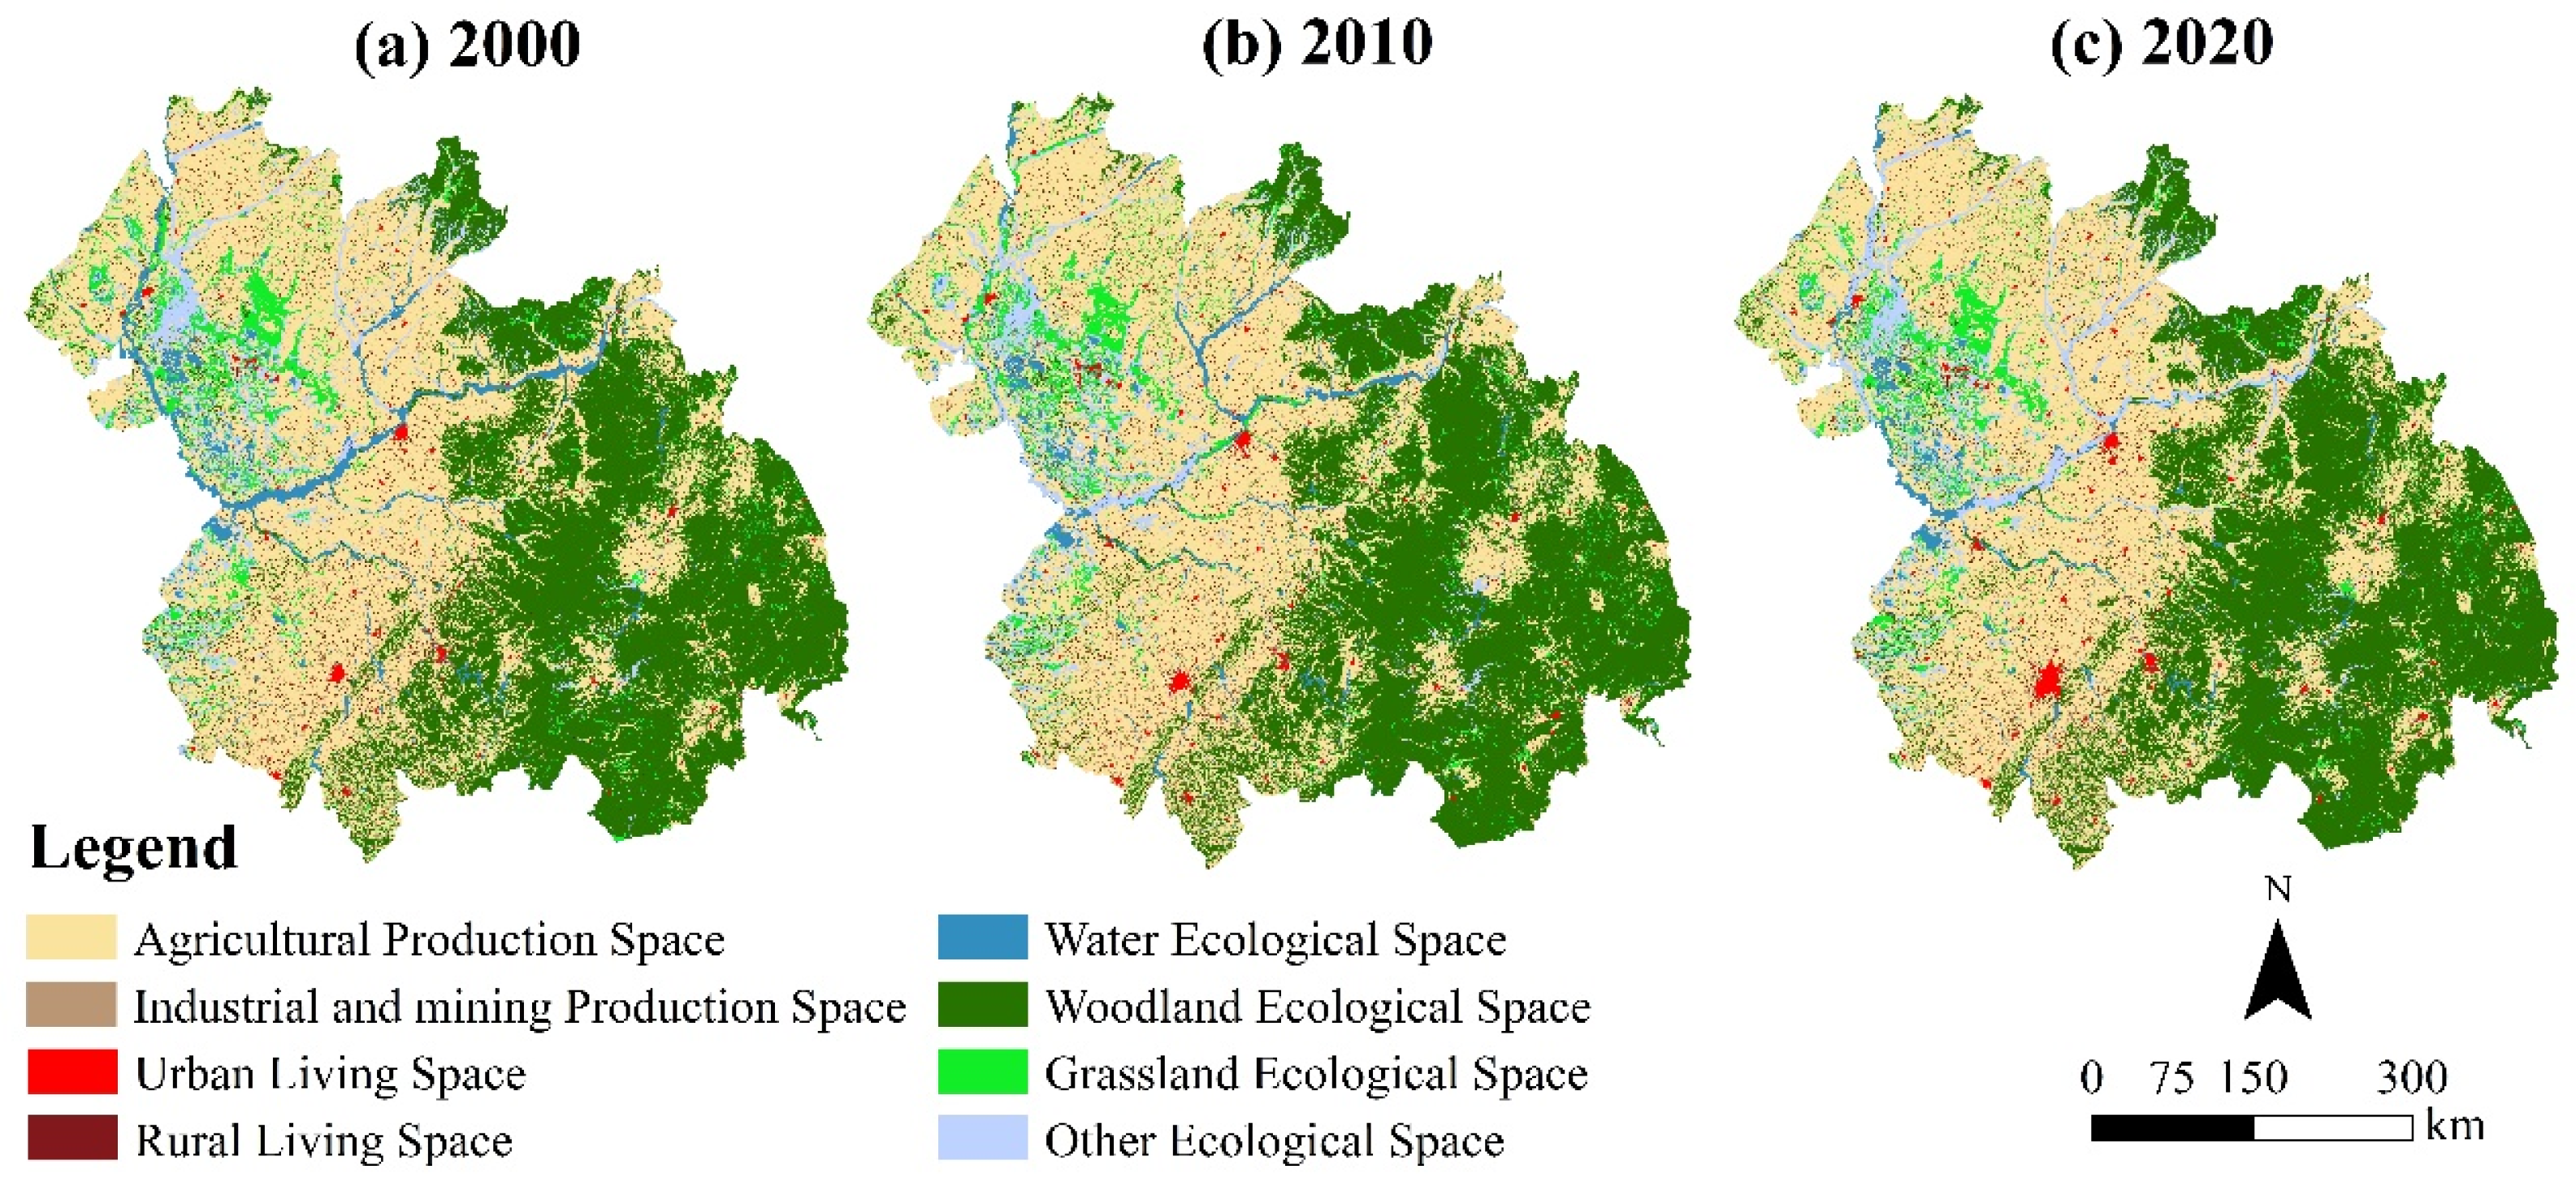
3.1.1. The Spatiotemporal Evolutionary Characteristics of the PELS
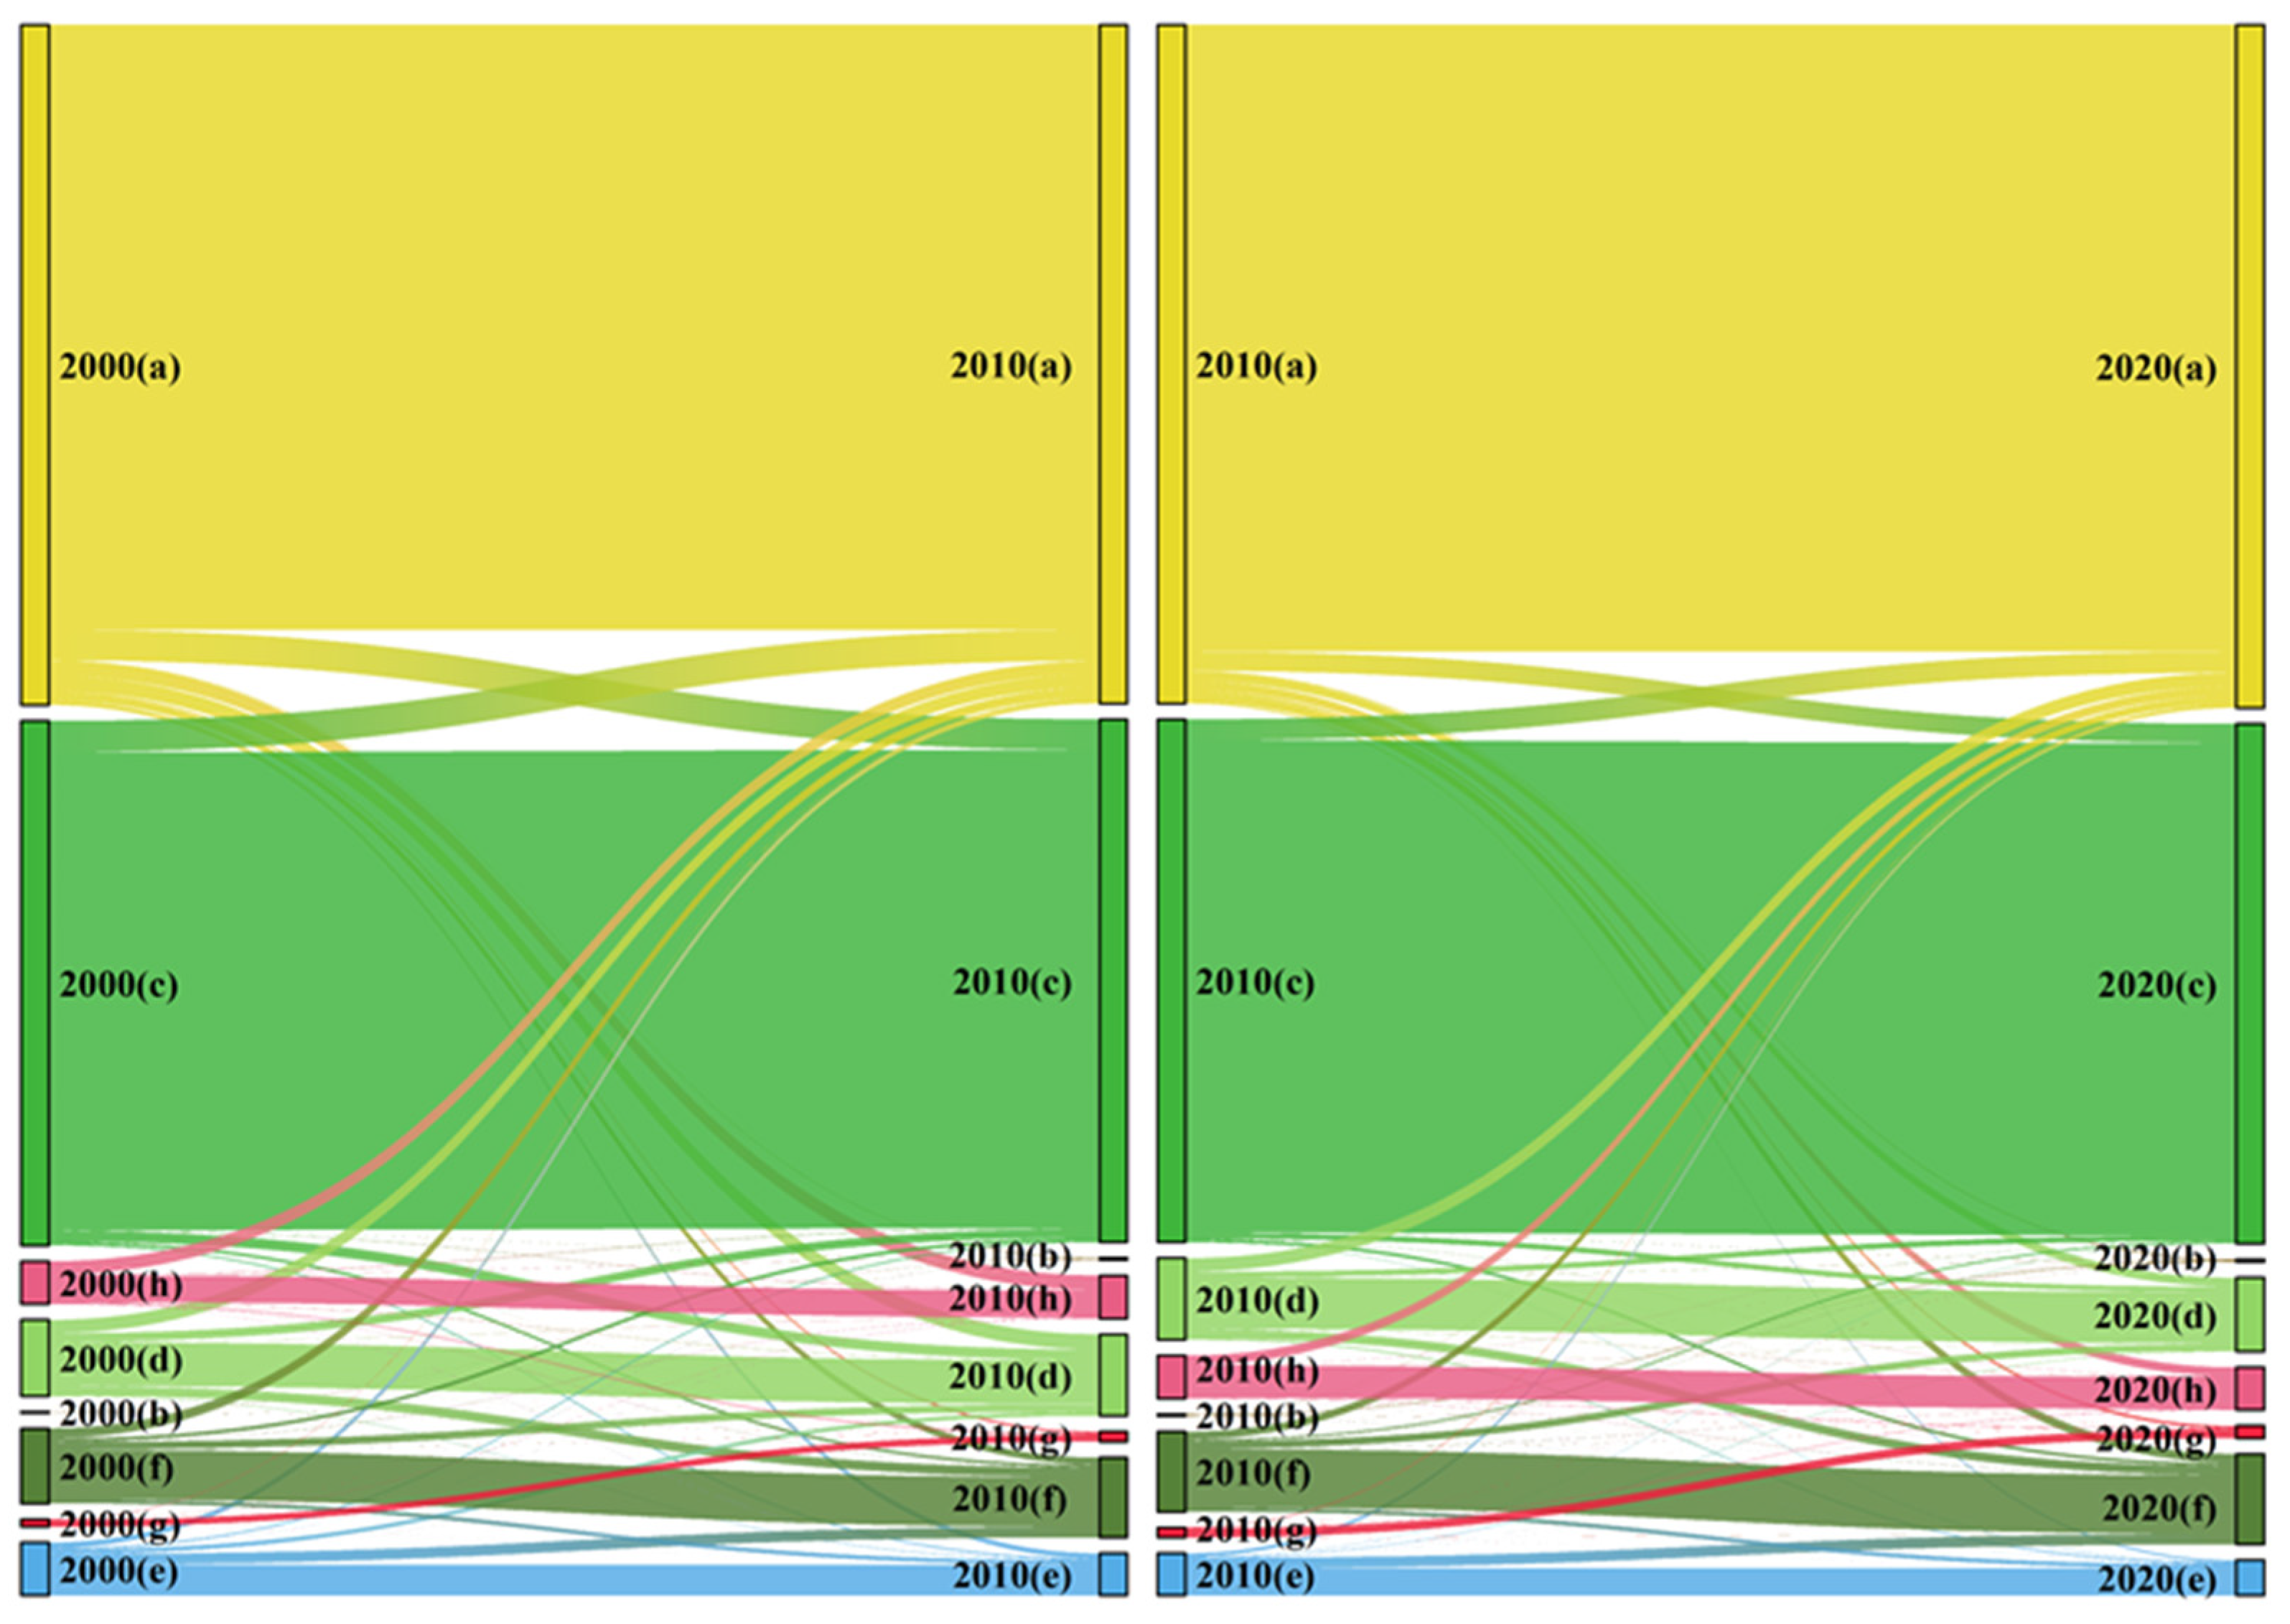
3.1.2. The Transformation Characteristics of the PELS
3.2. The Prediction Results of the PELS Based on the PLUS Model
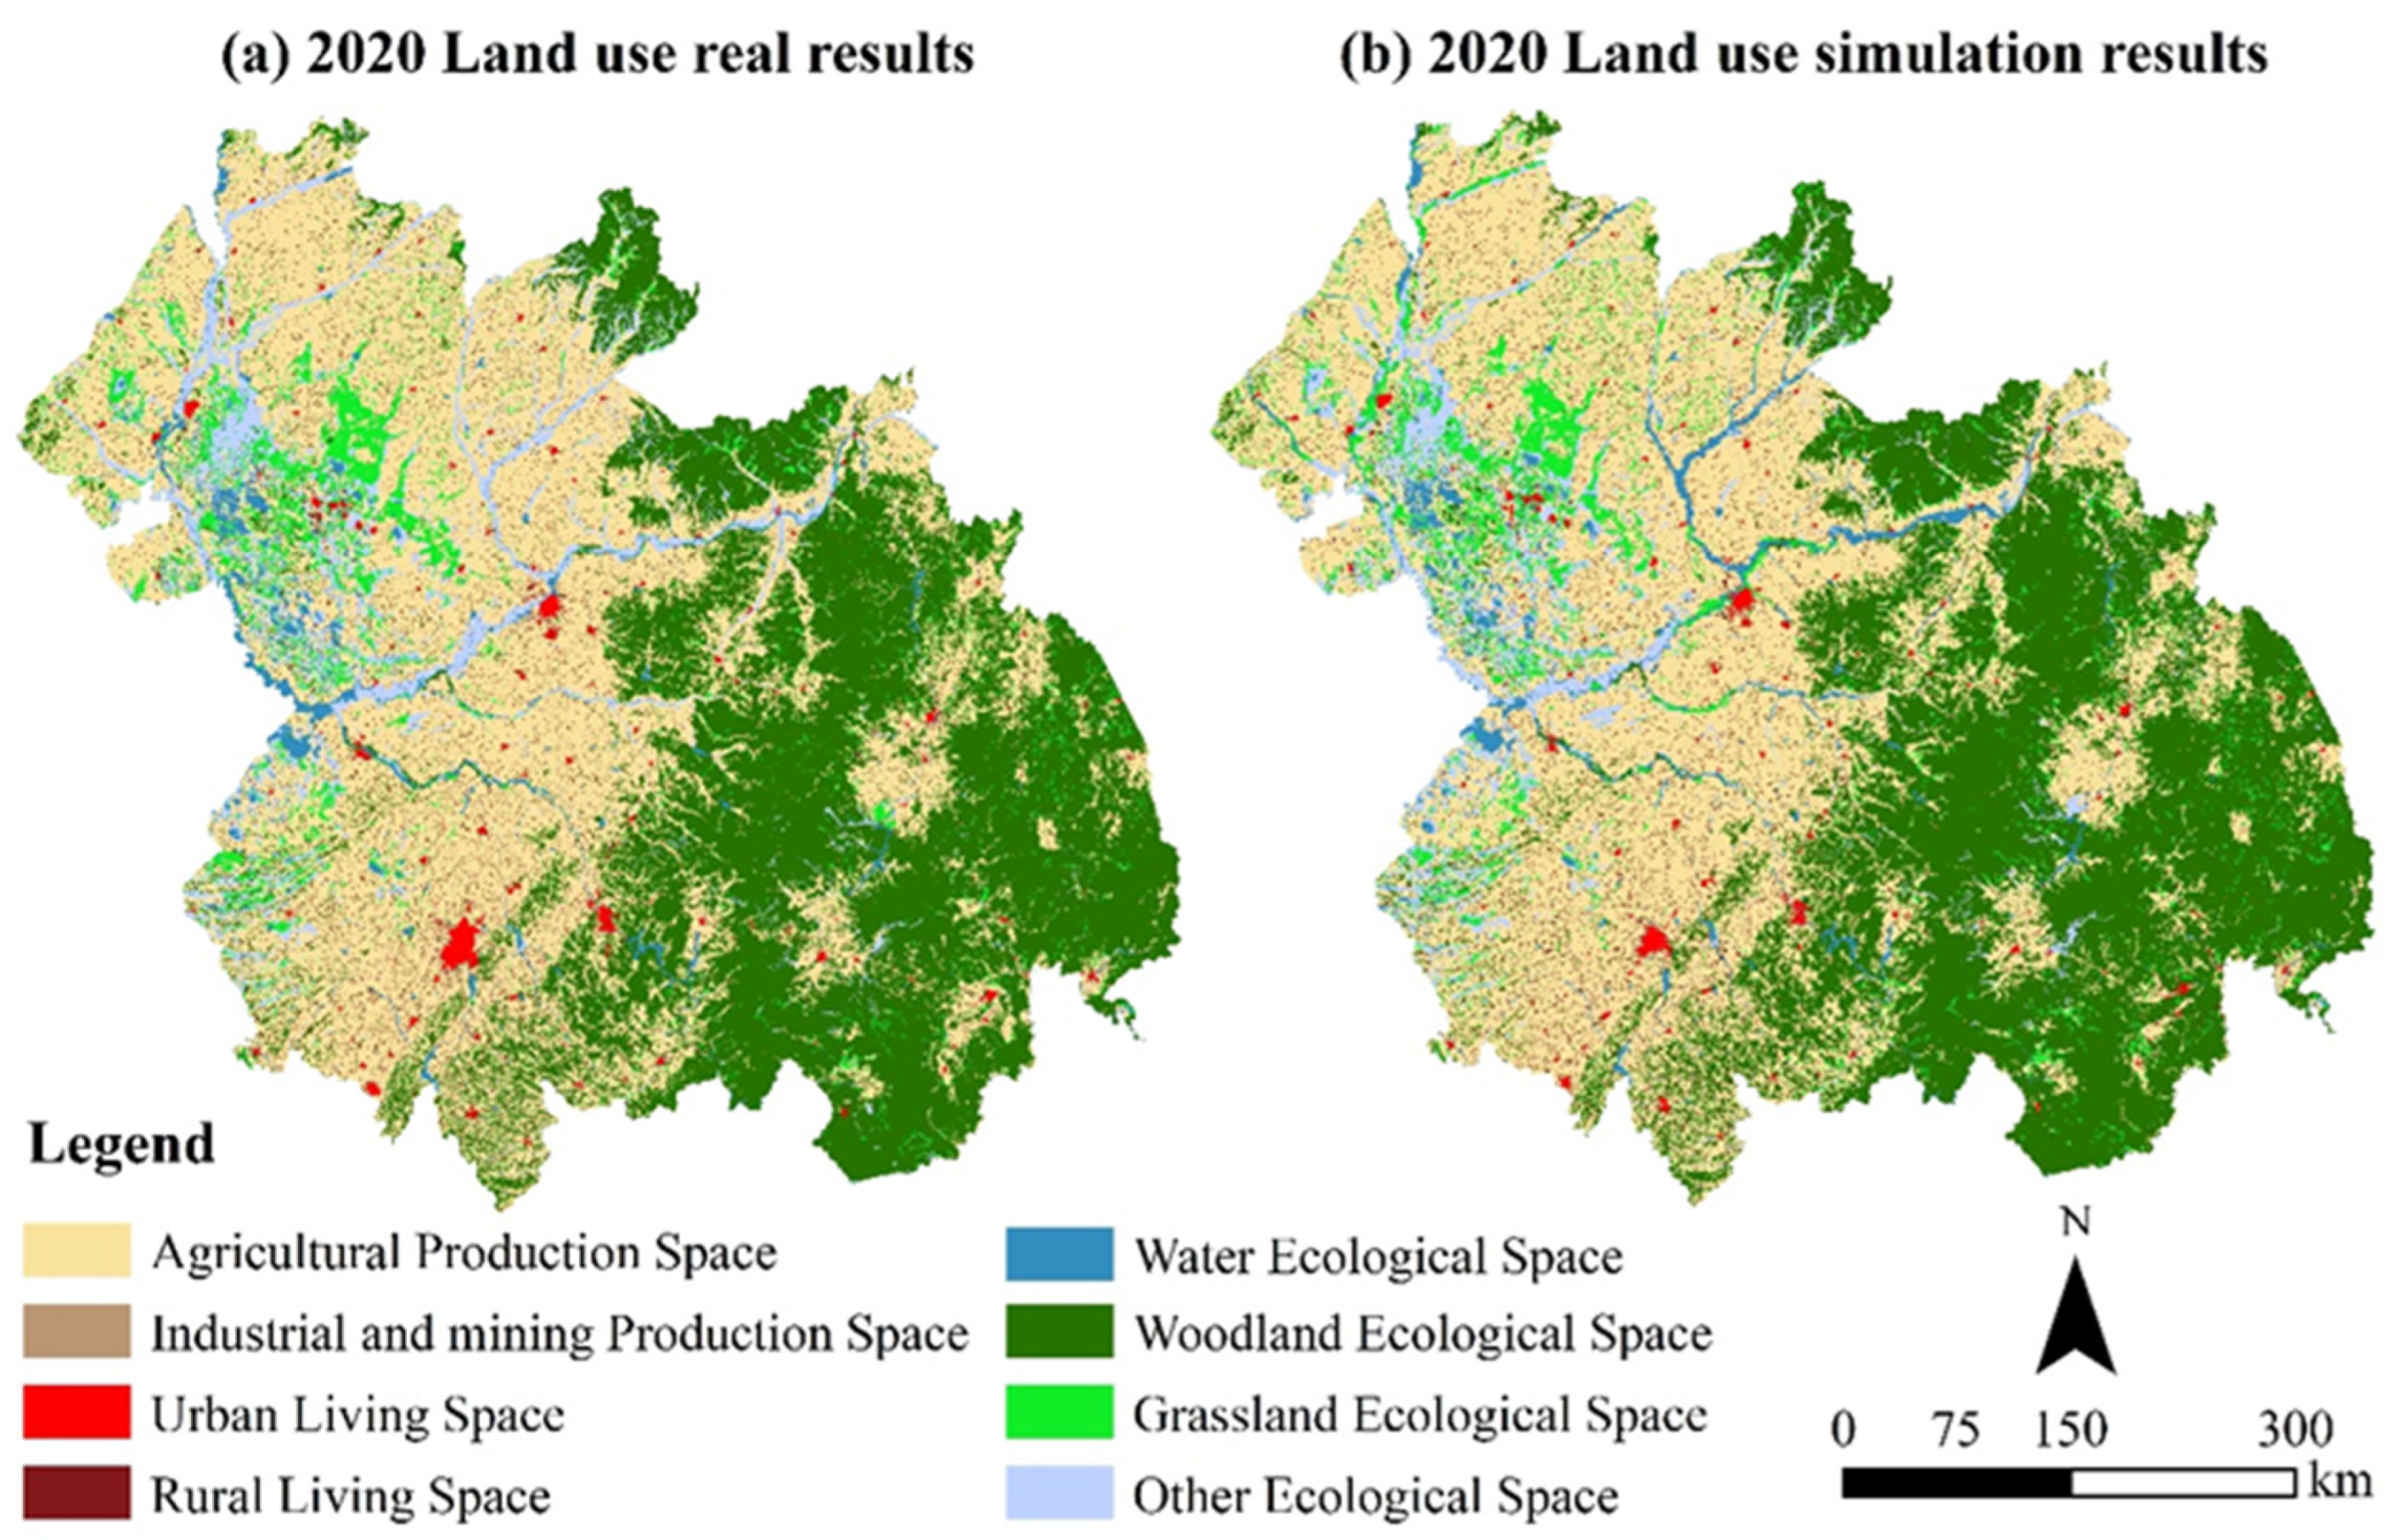
3.2.1. Accuracy Validation
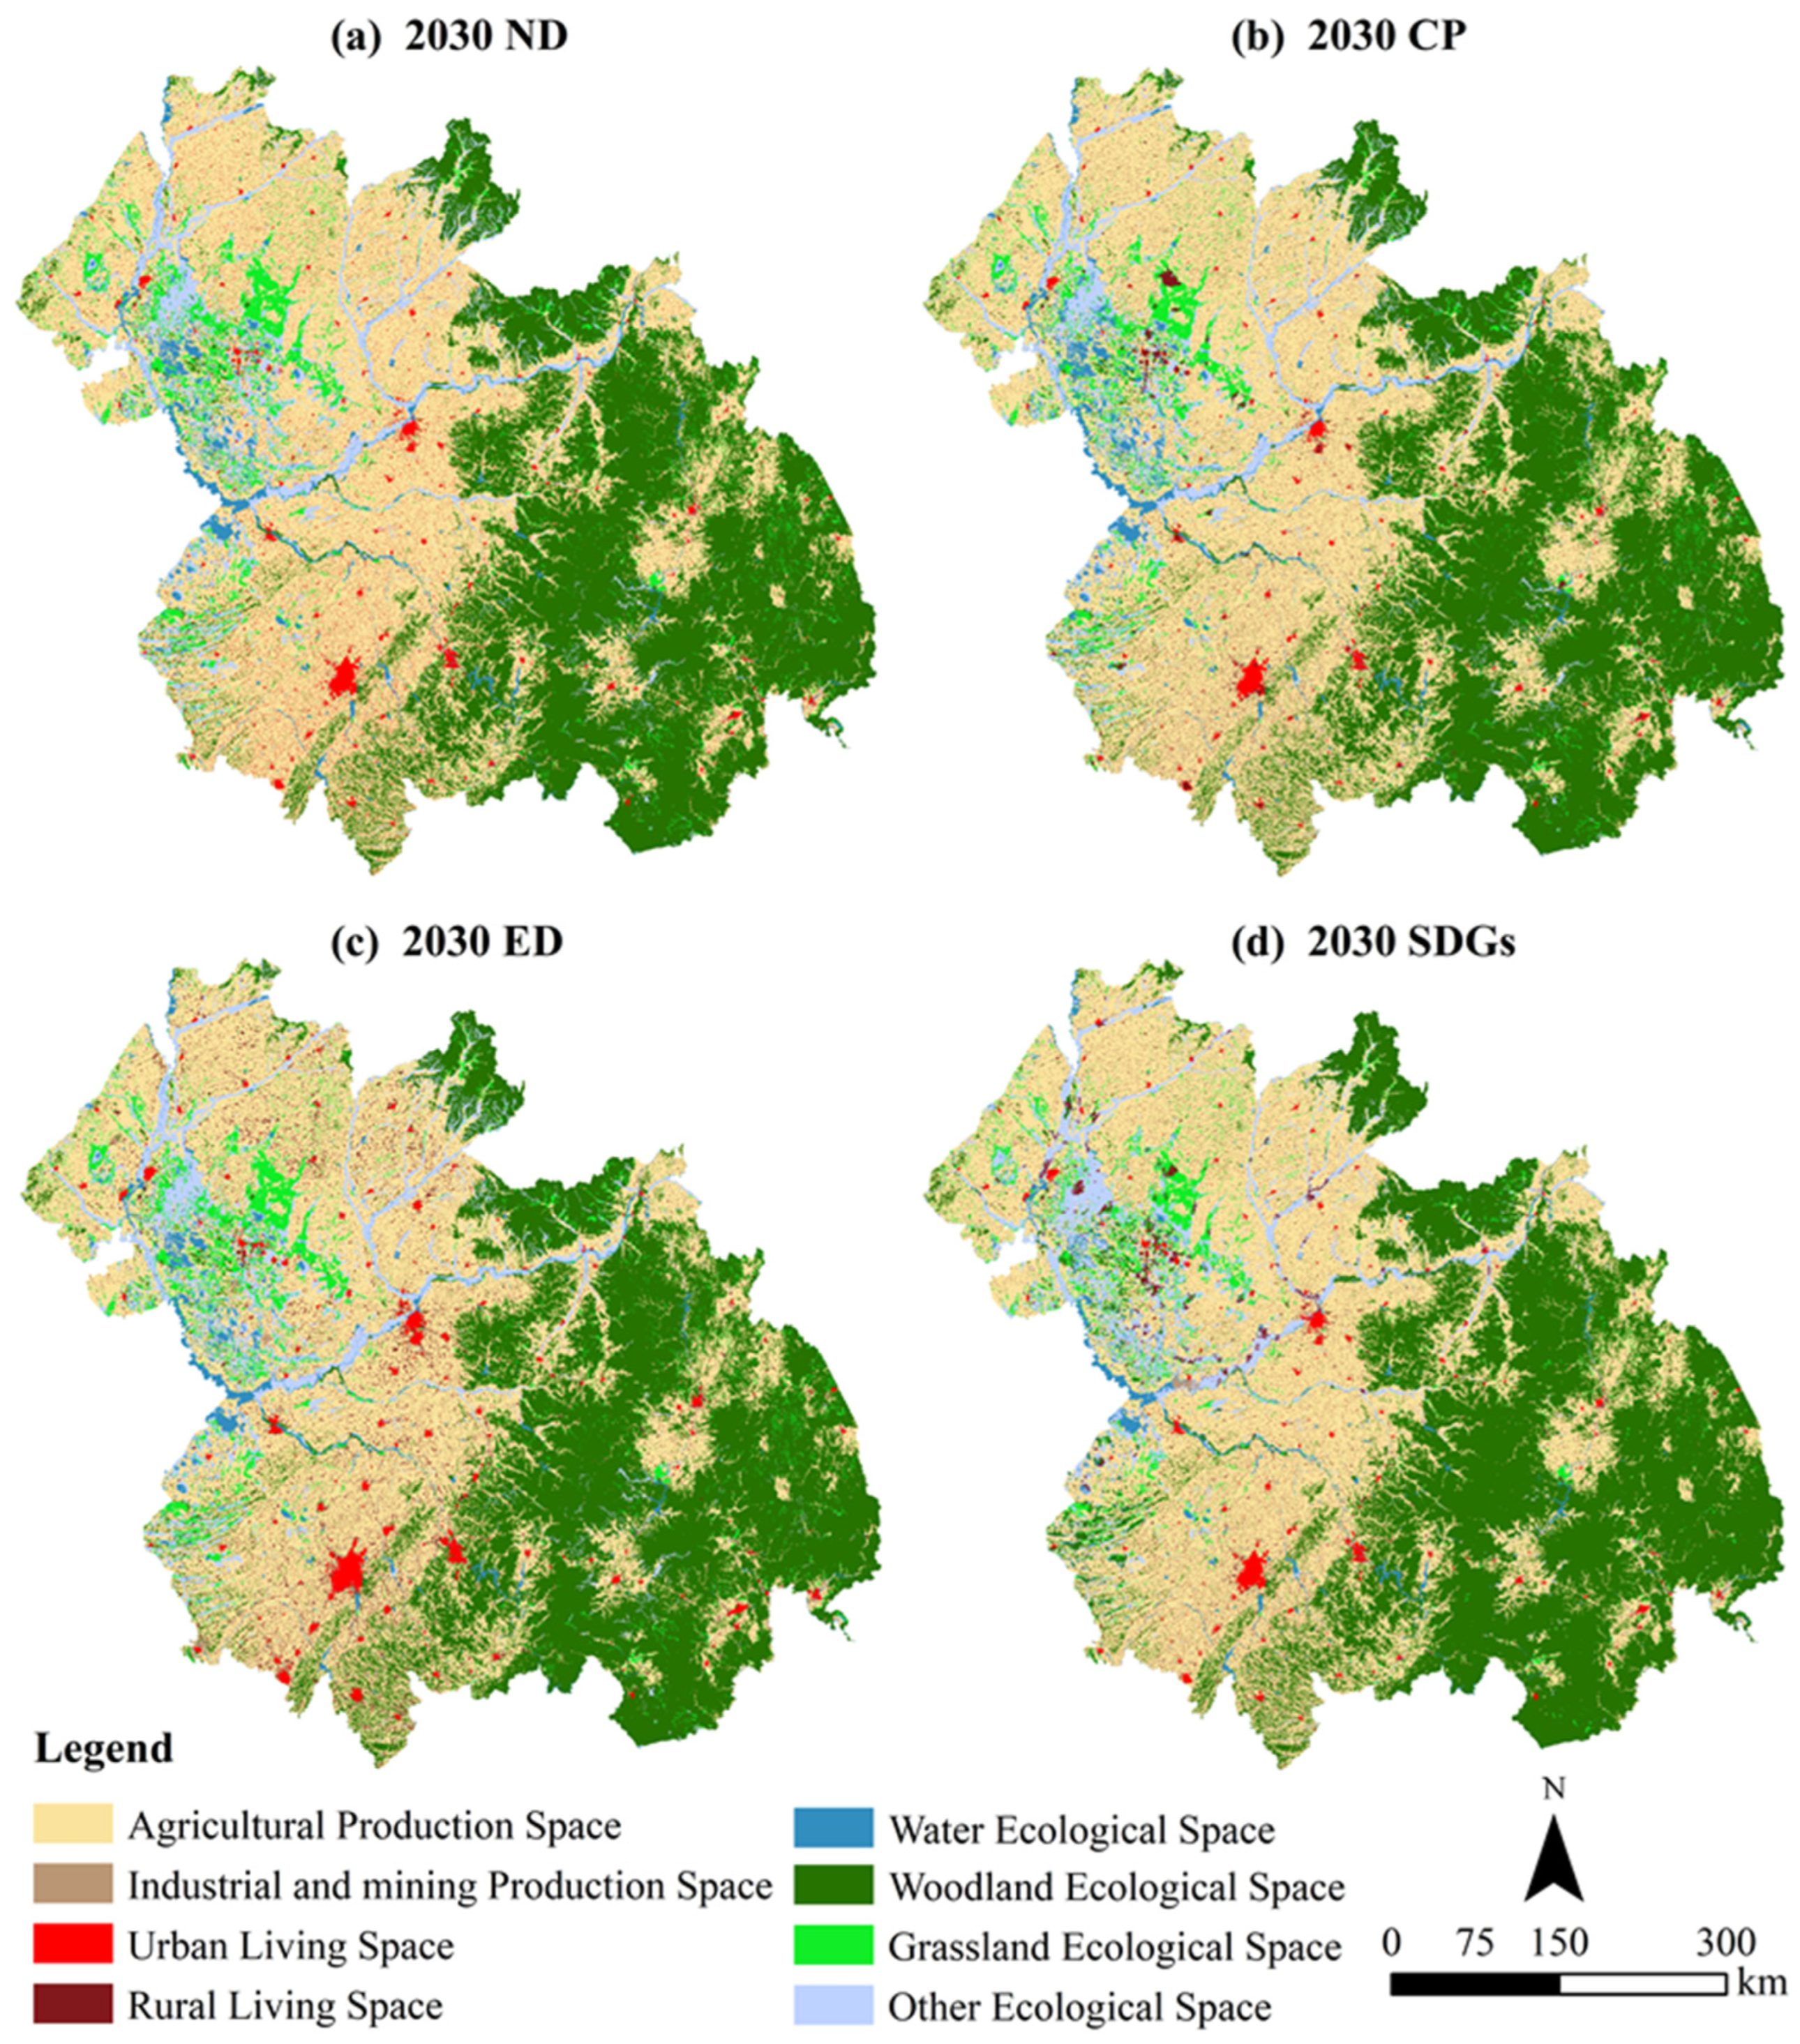
3.2.2. The Prediction Results of the PELS Under Four Scenarios
3.3. An Analysis of the Evolutionary Characteristics of the PELS Conflicts from 2000 to 2020
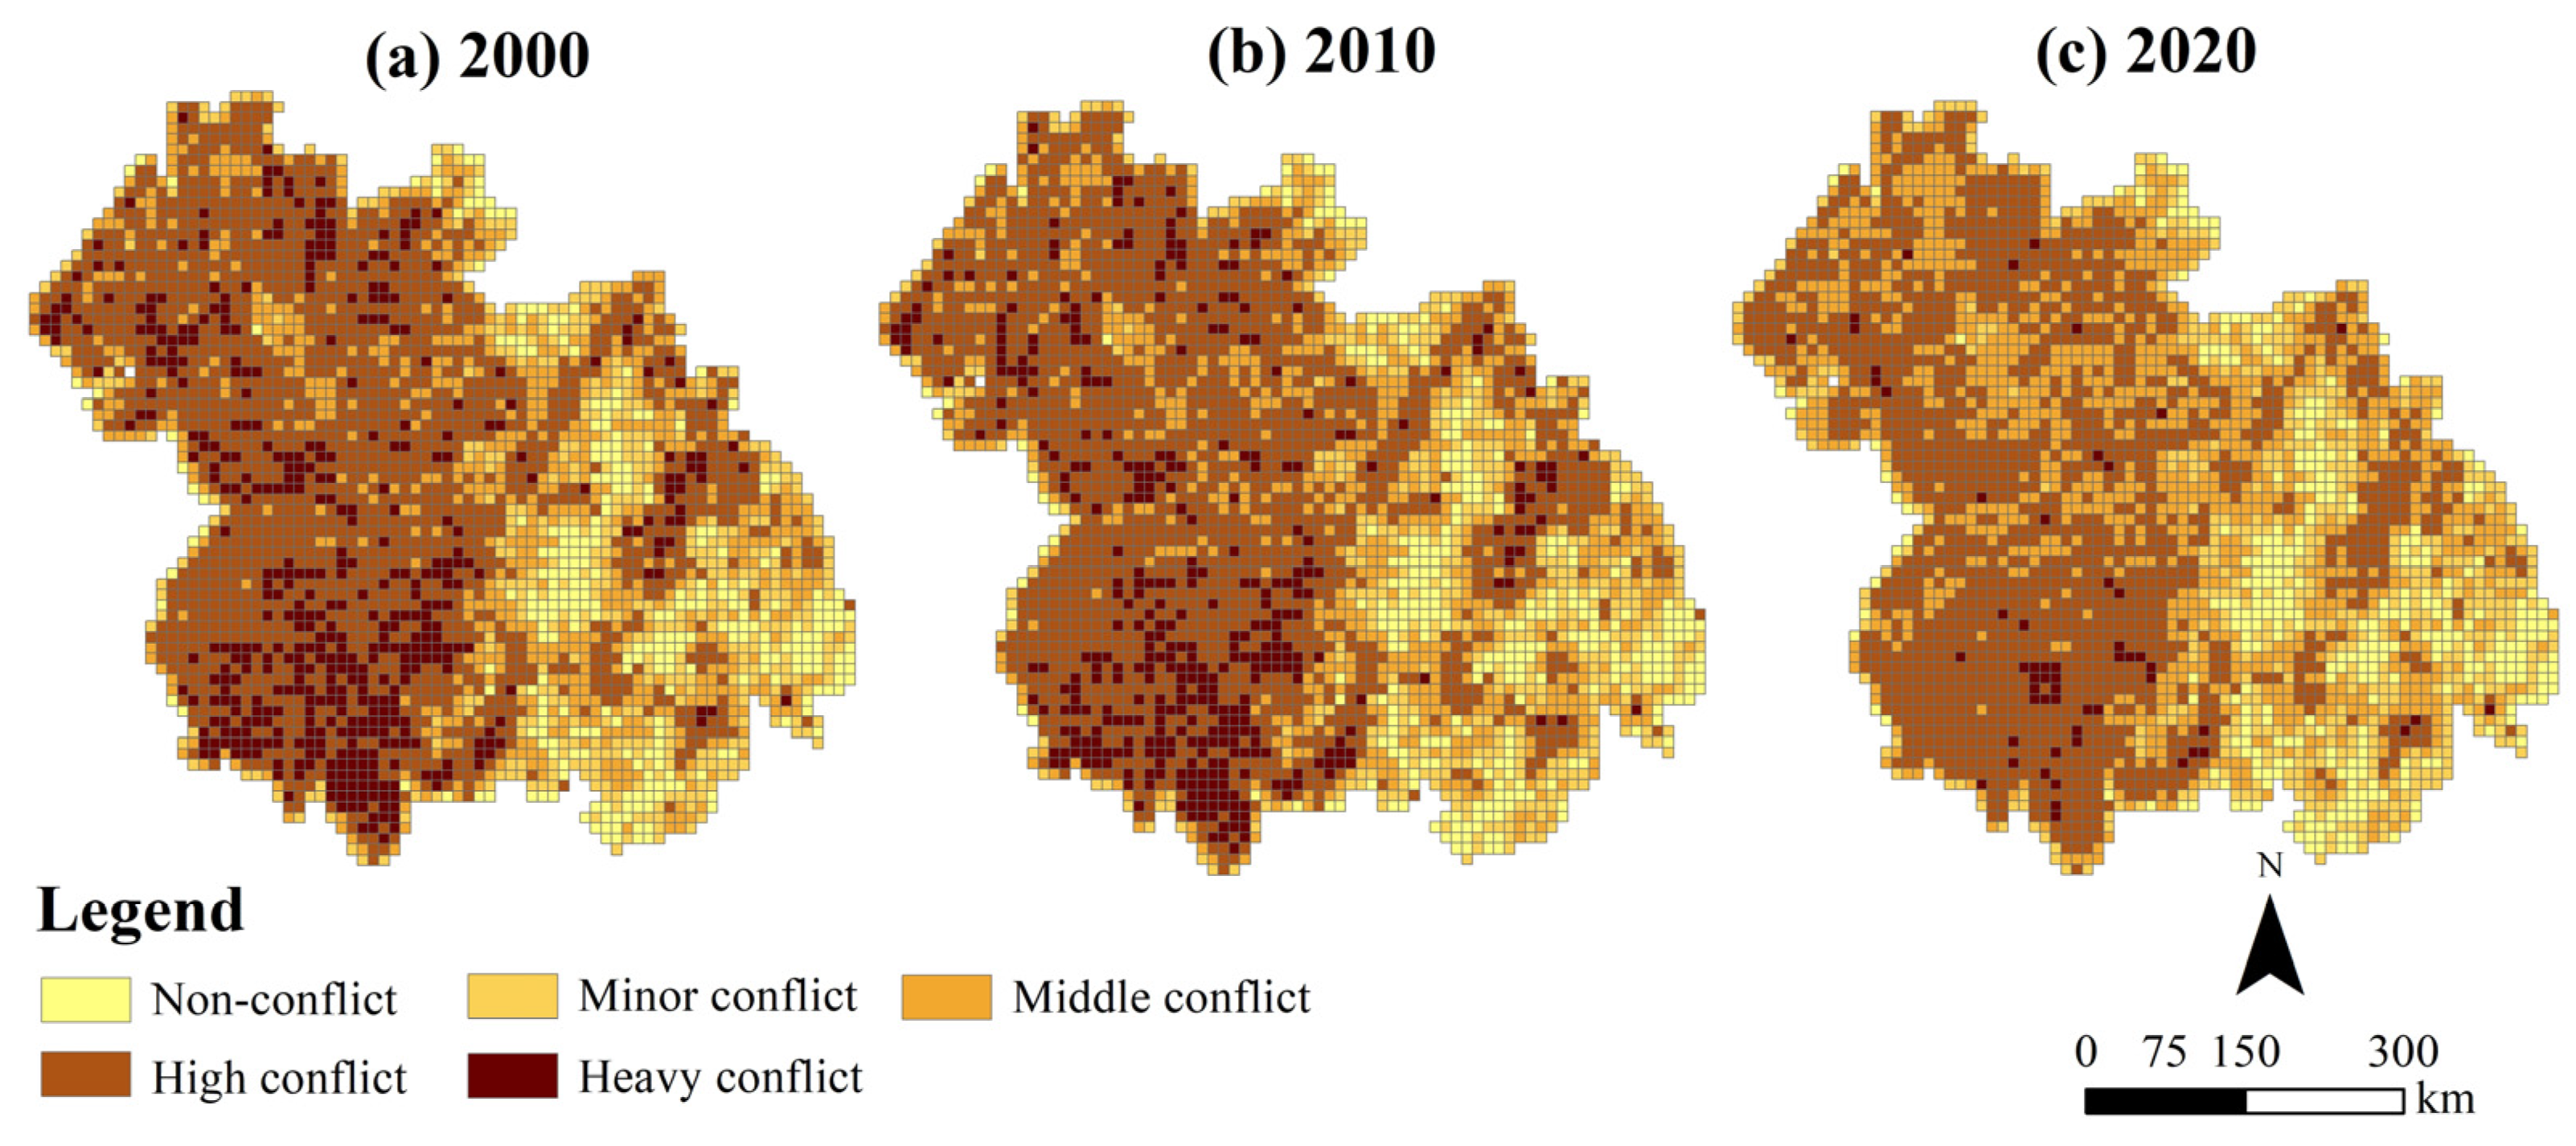
3.3.1. The Spatiotemporal Evolutionary Characteristics of the PELS Absolute Conflicts
3.3.2. The Spatiotemporal Evolutionary Characteristics of the PELS Relative Conflicts
Evolutionary Characteristics of Ecological Environment Quality
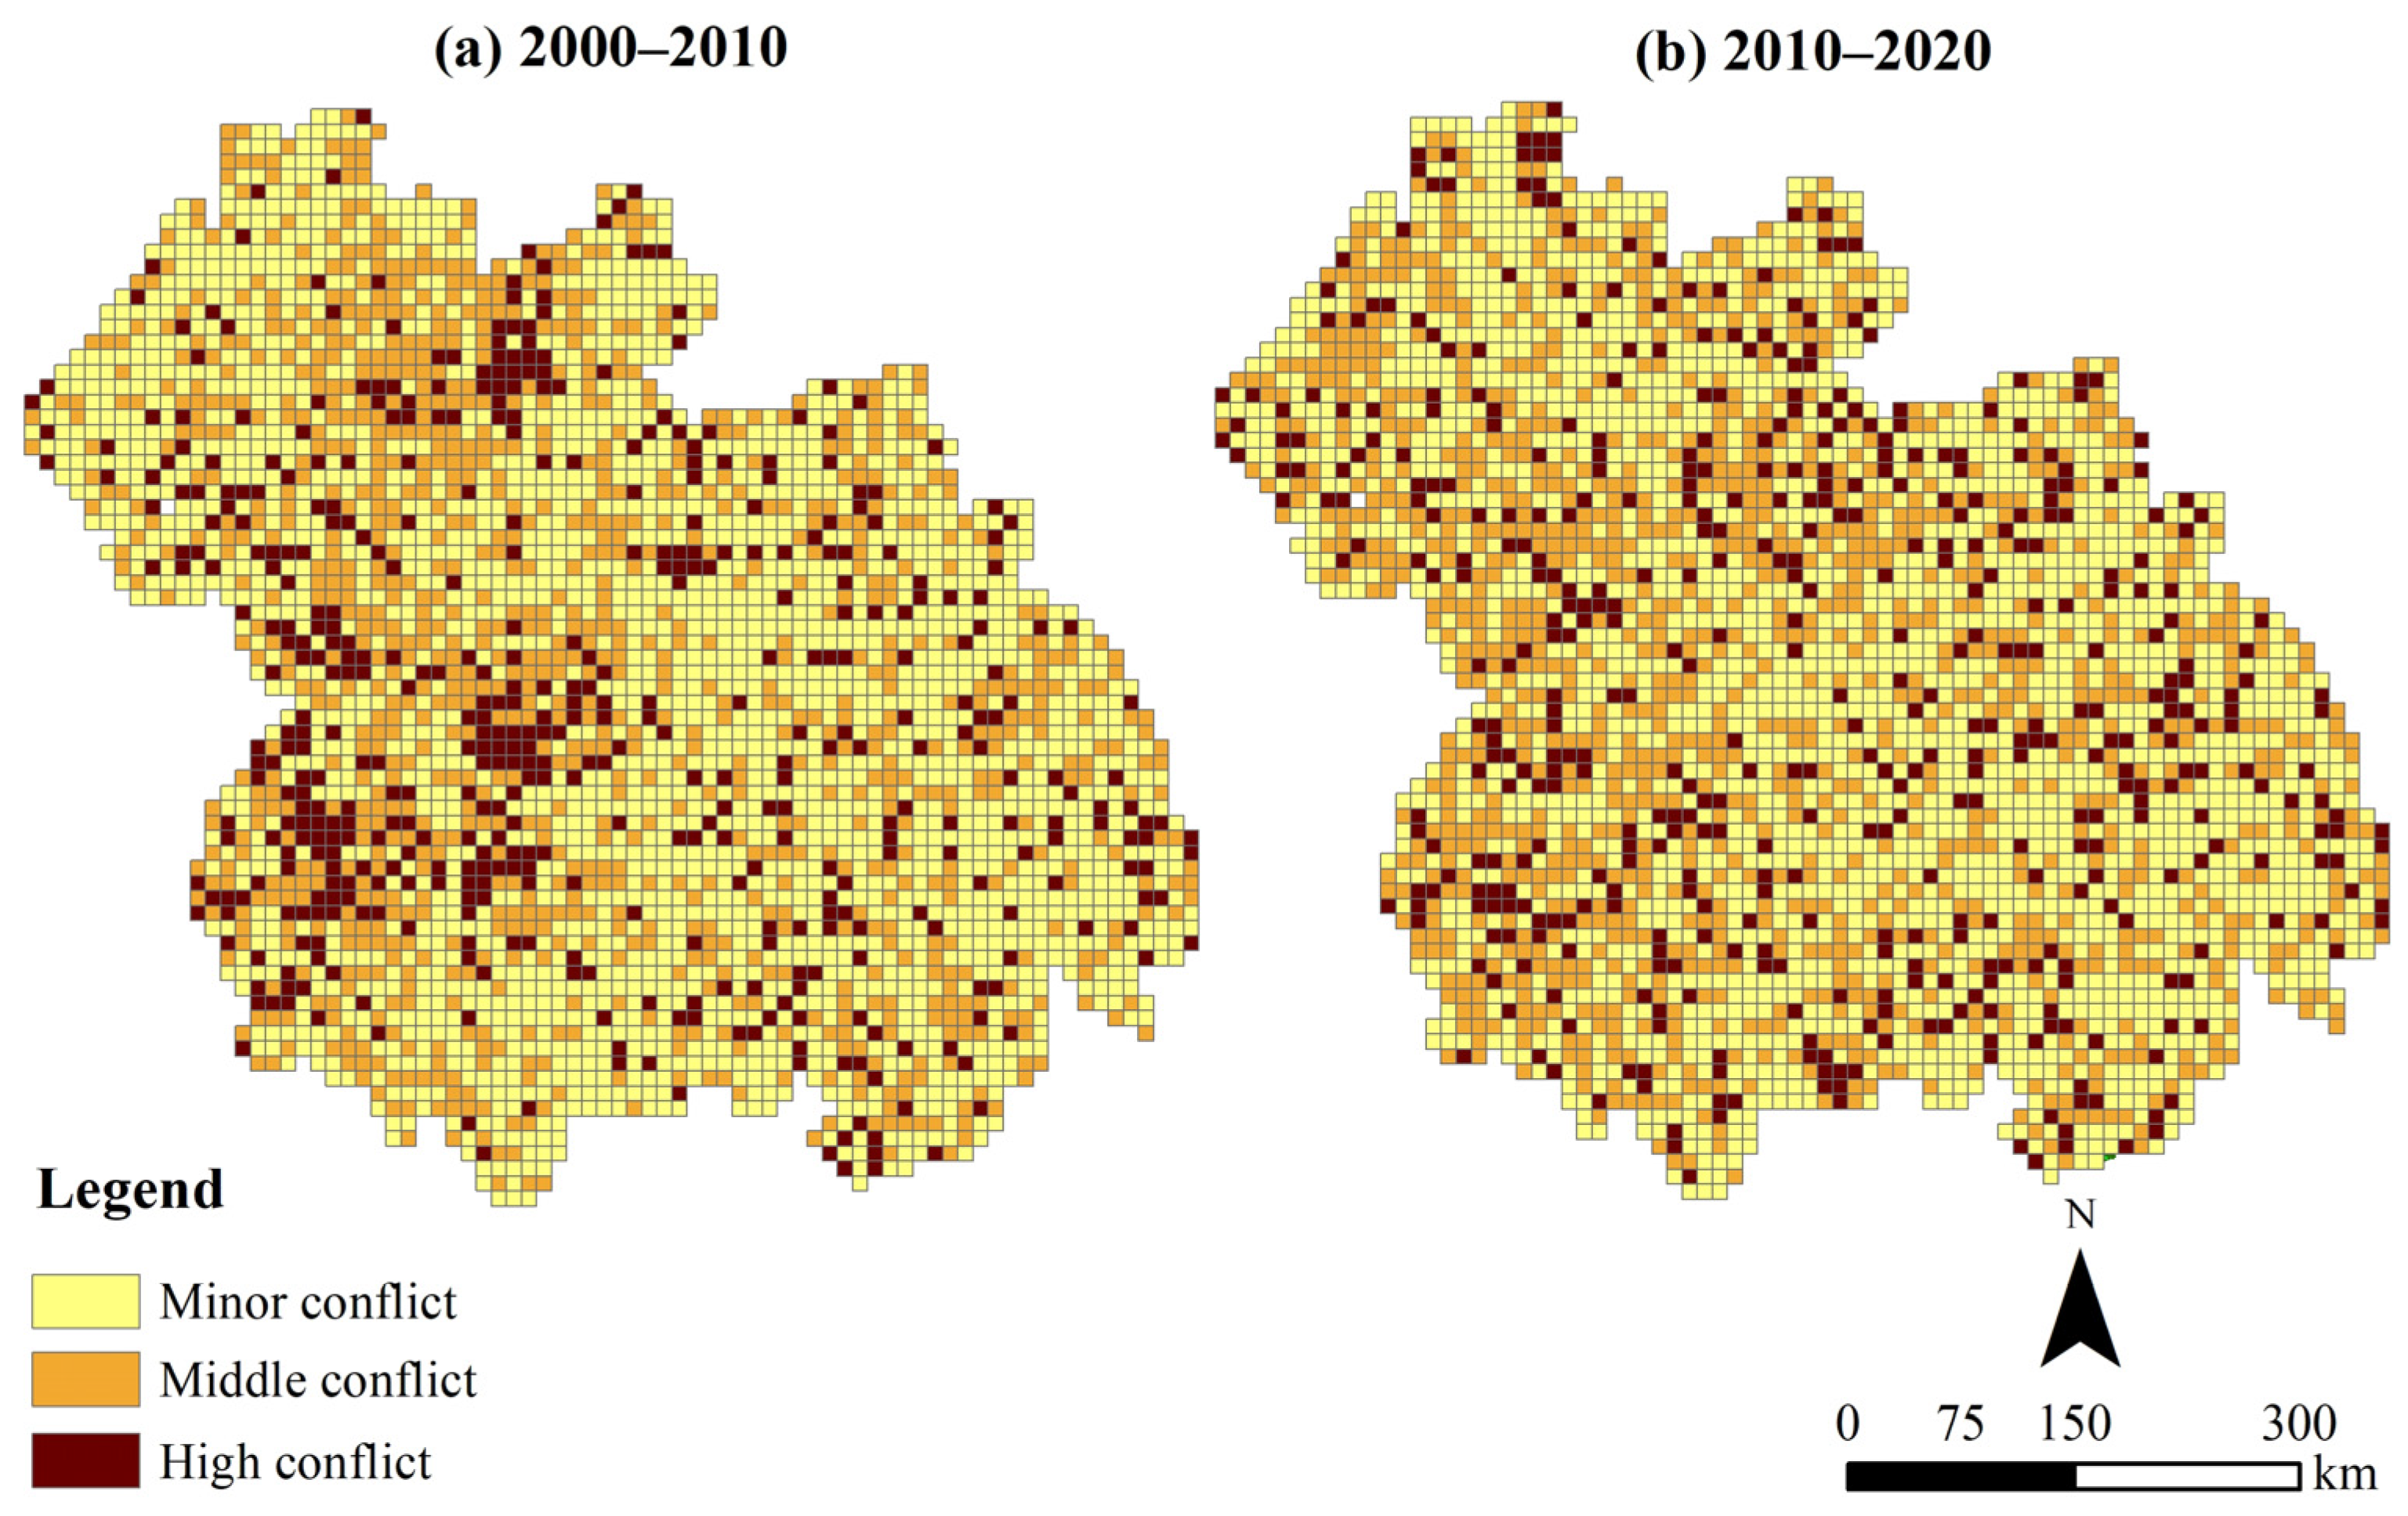
Spatiotemporal Evolutionary Characteristics of the PELS Relative Conflicts
3.4. The Prediction Results of PELS Absolute Conflicts Based on the PLUS Model
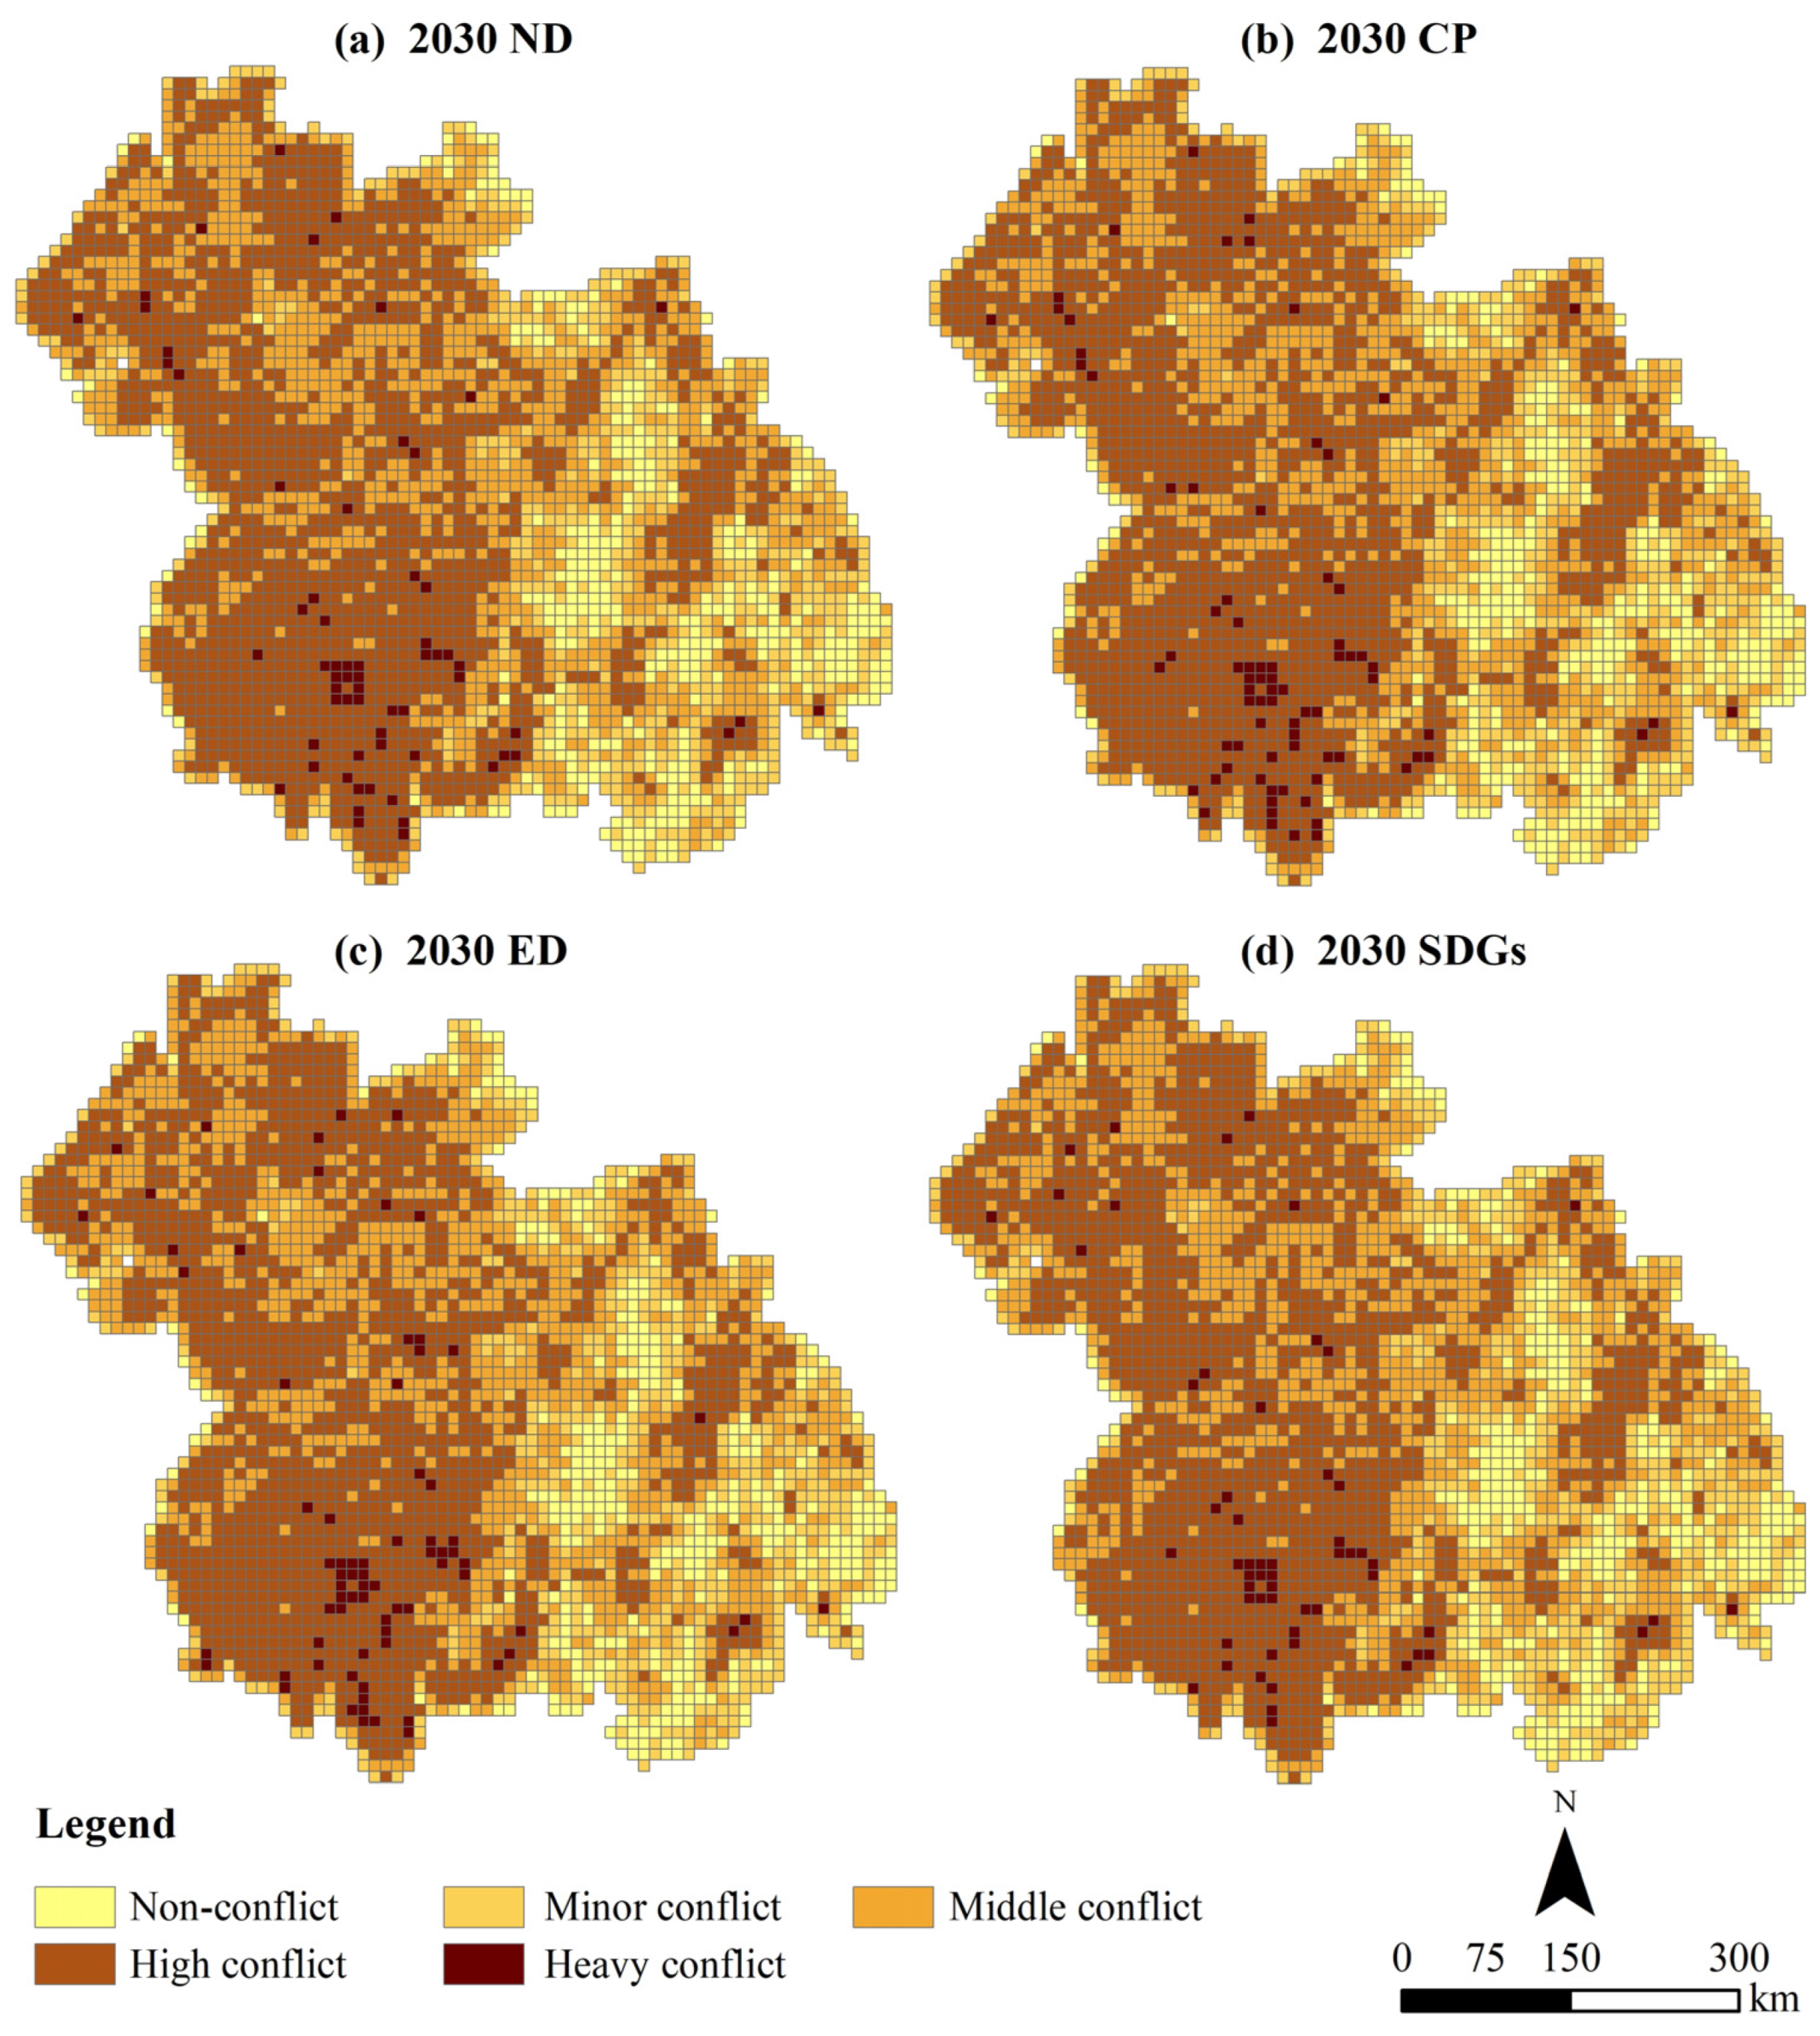
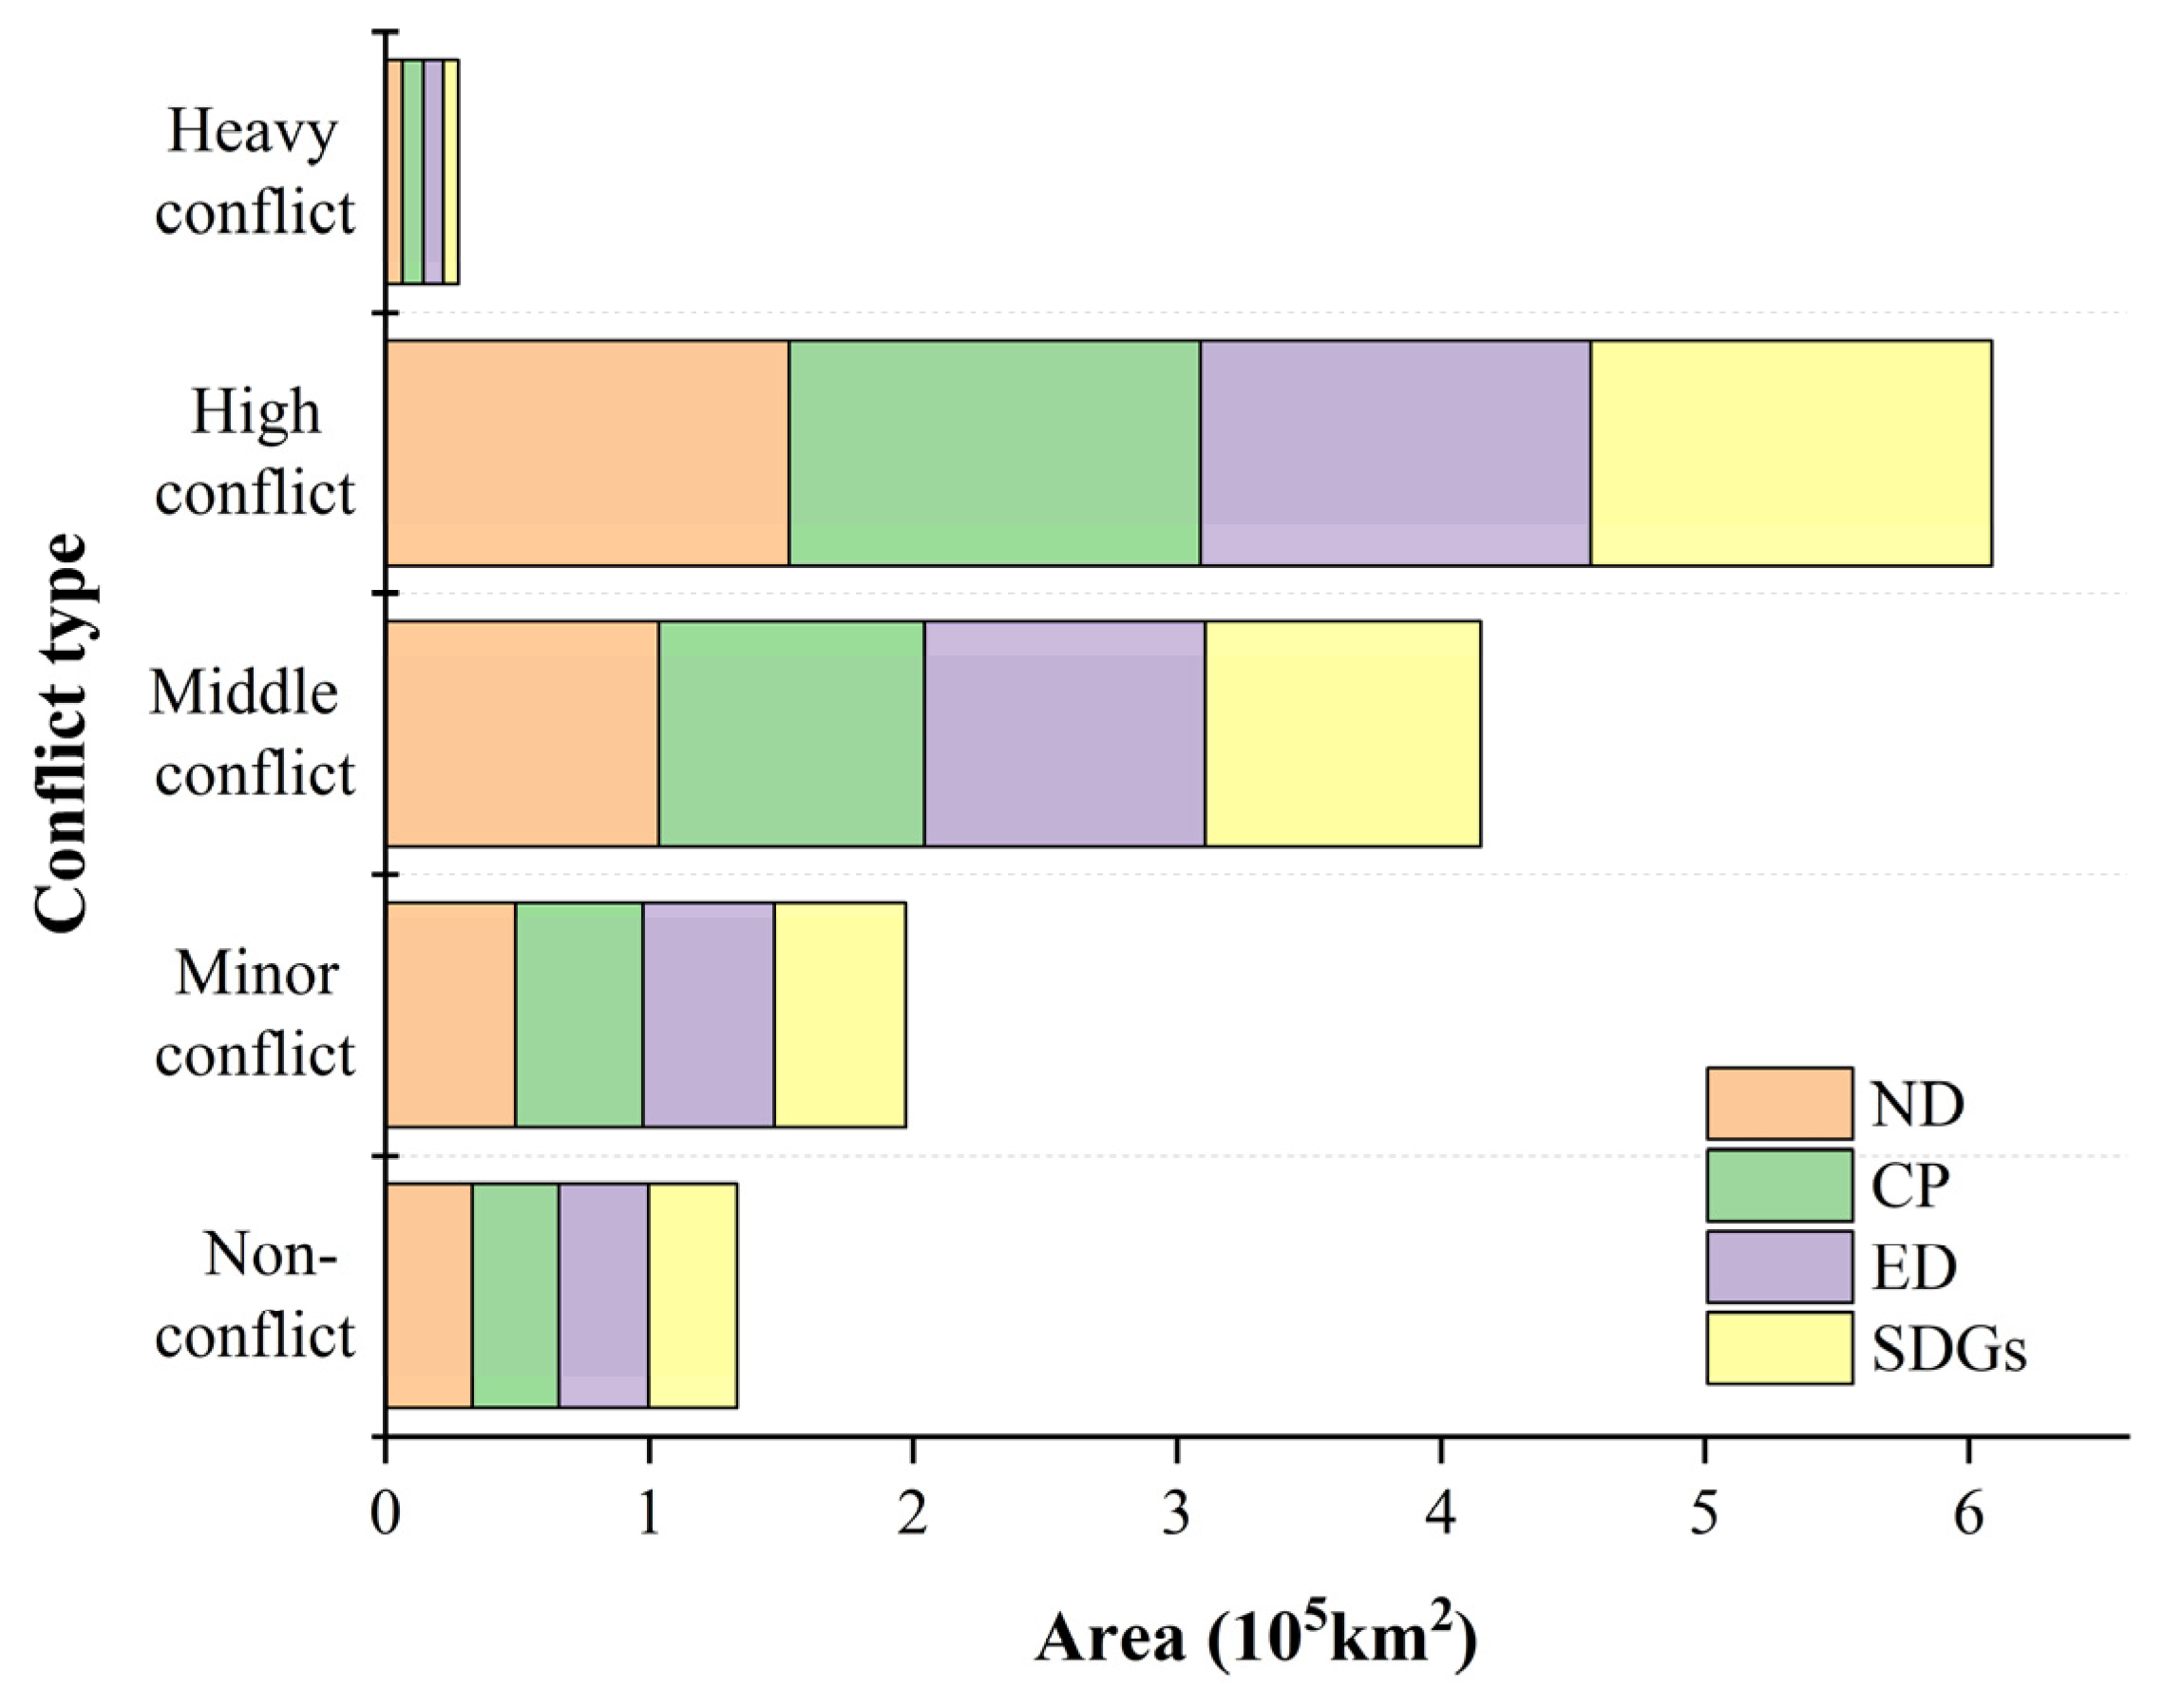
3.4.1. The Prediction Results of PELS Absolute Conflicts Under Four Scenarios
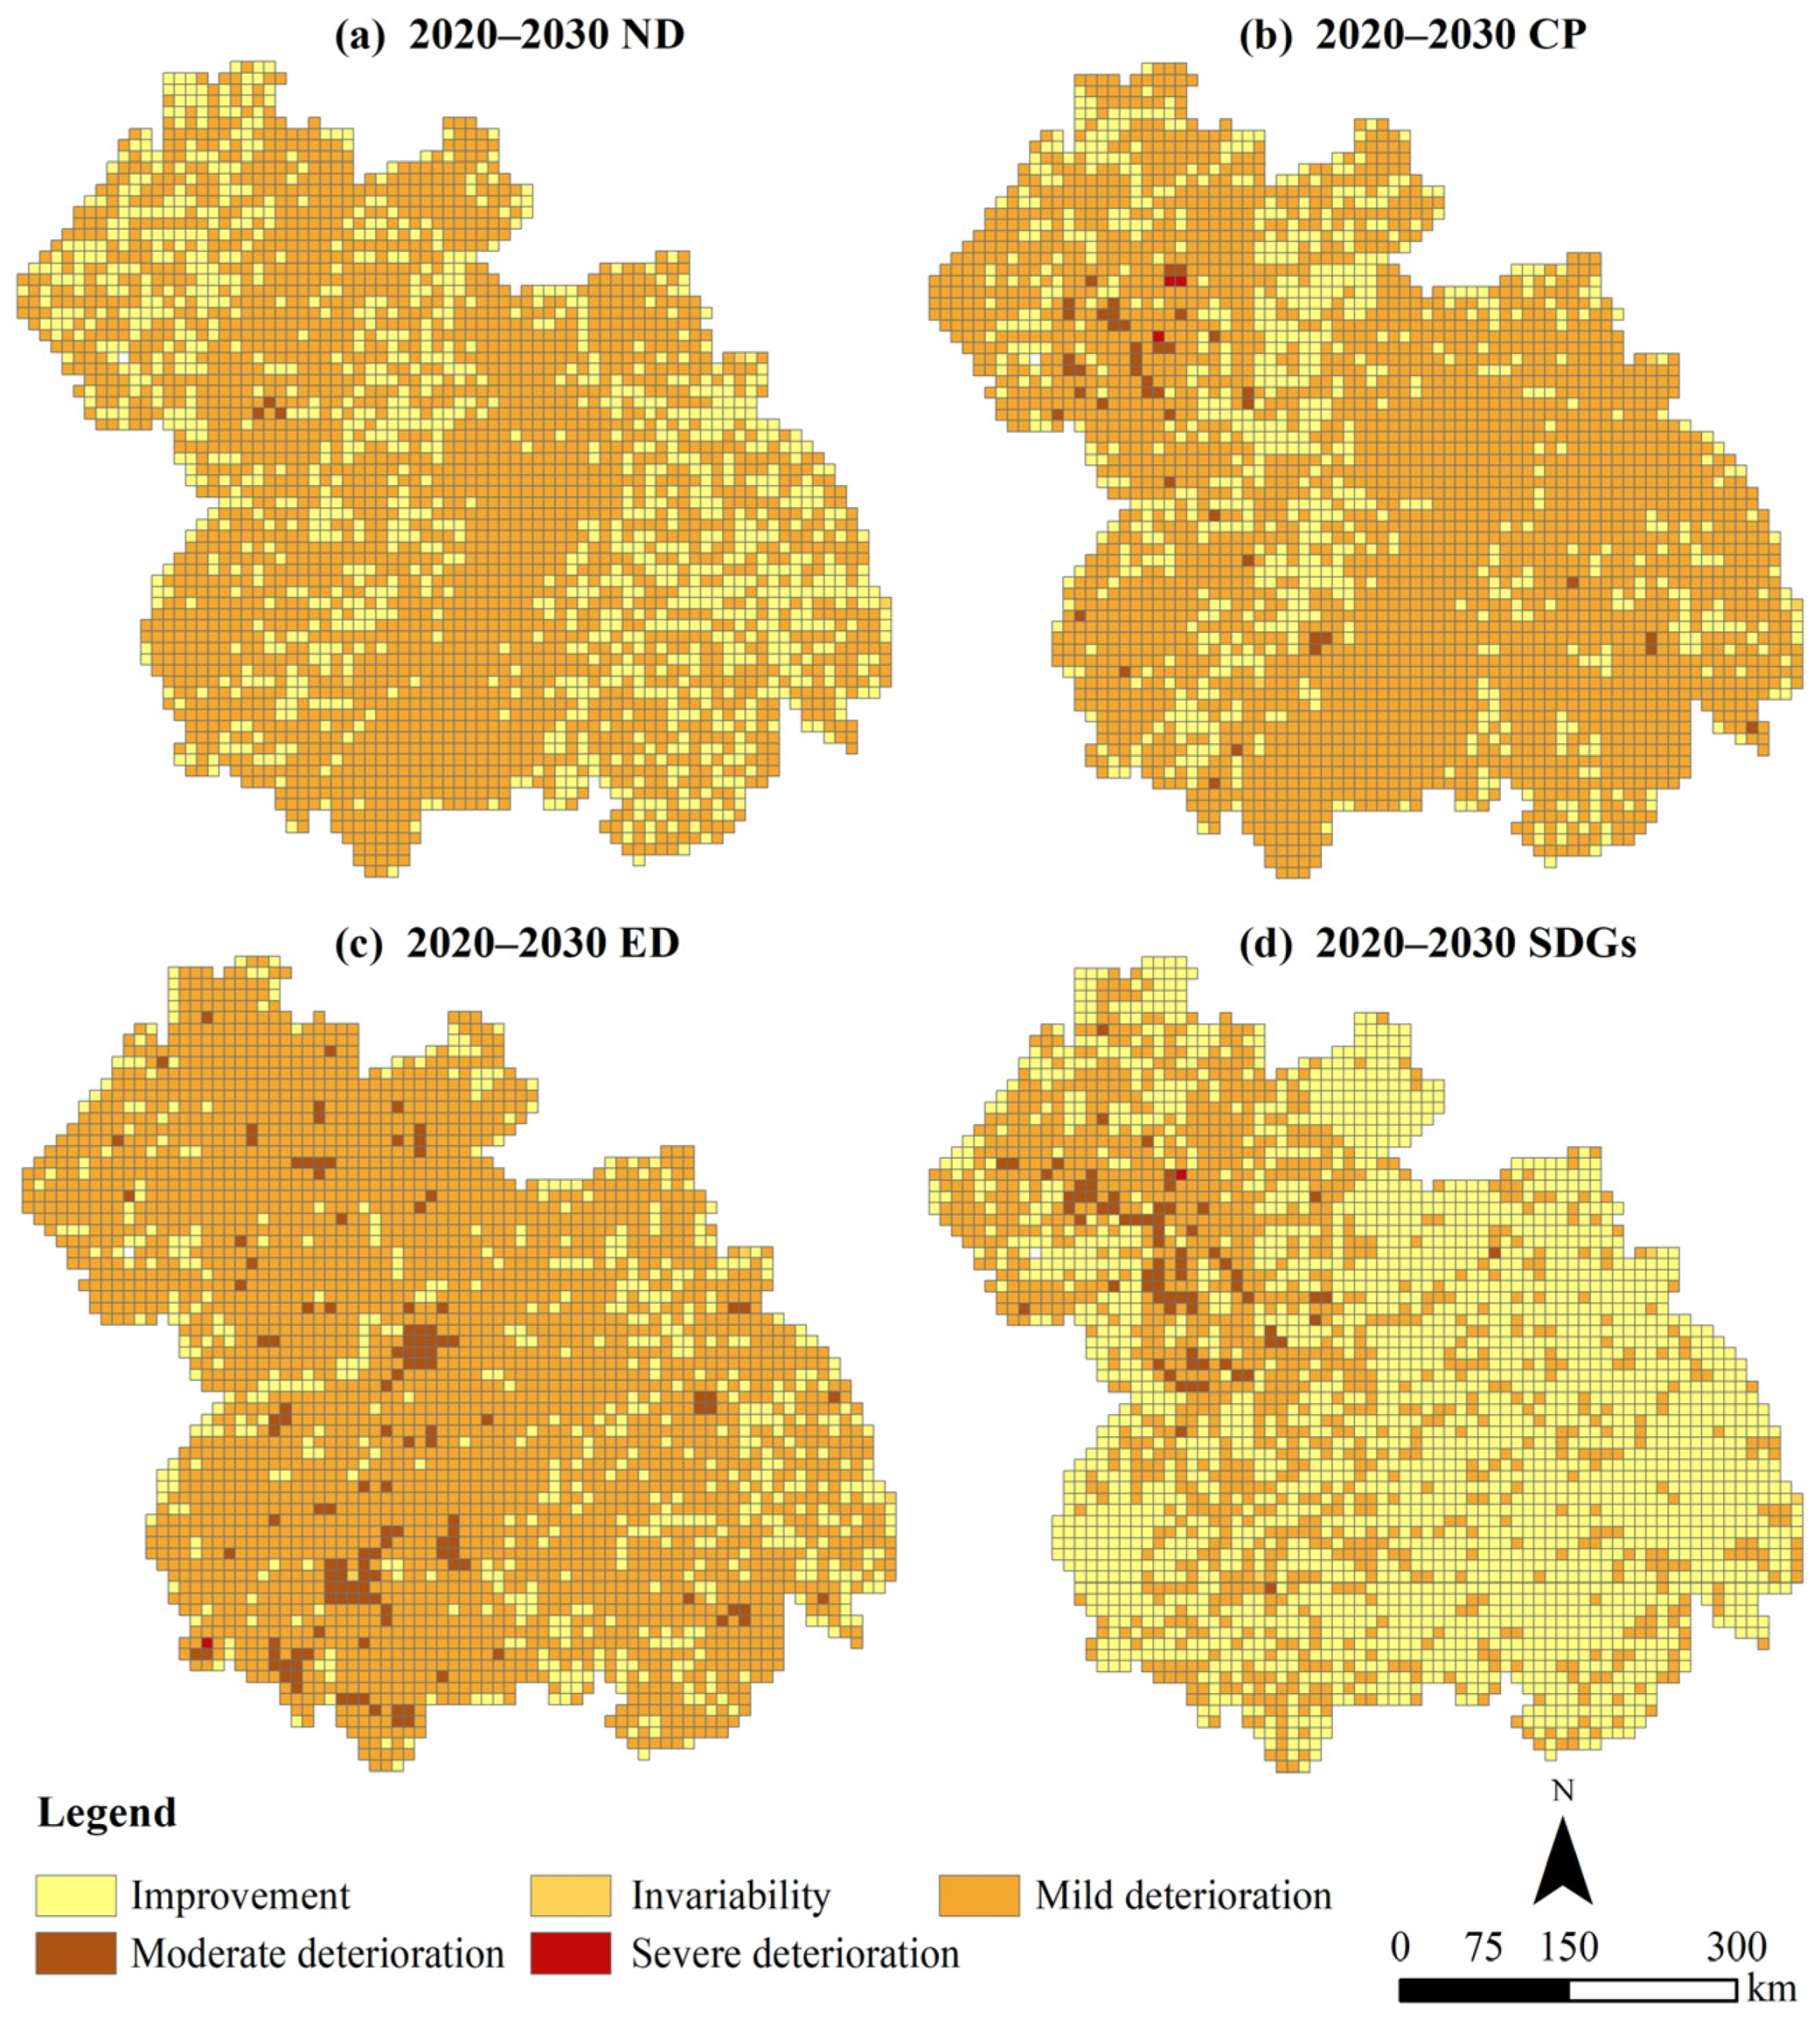
3.4.2. Change Intensity of PELS Absolute Conflicts Under Four Scenarios
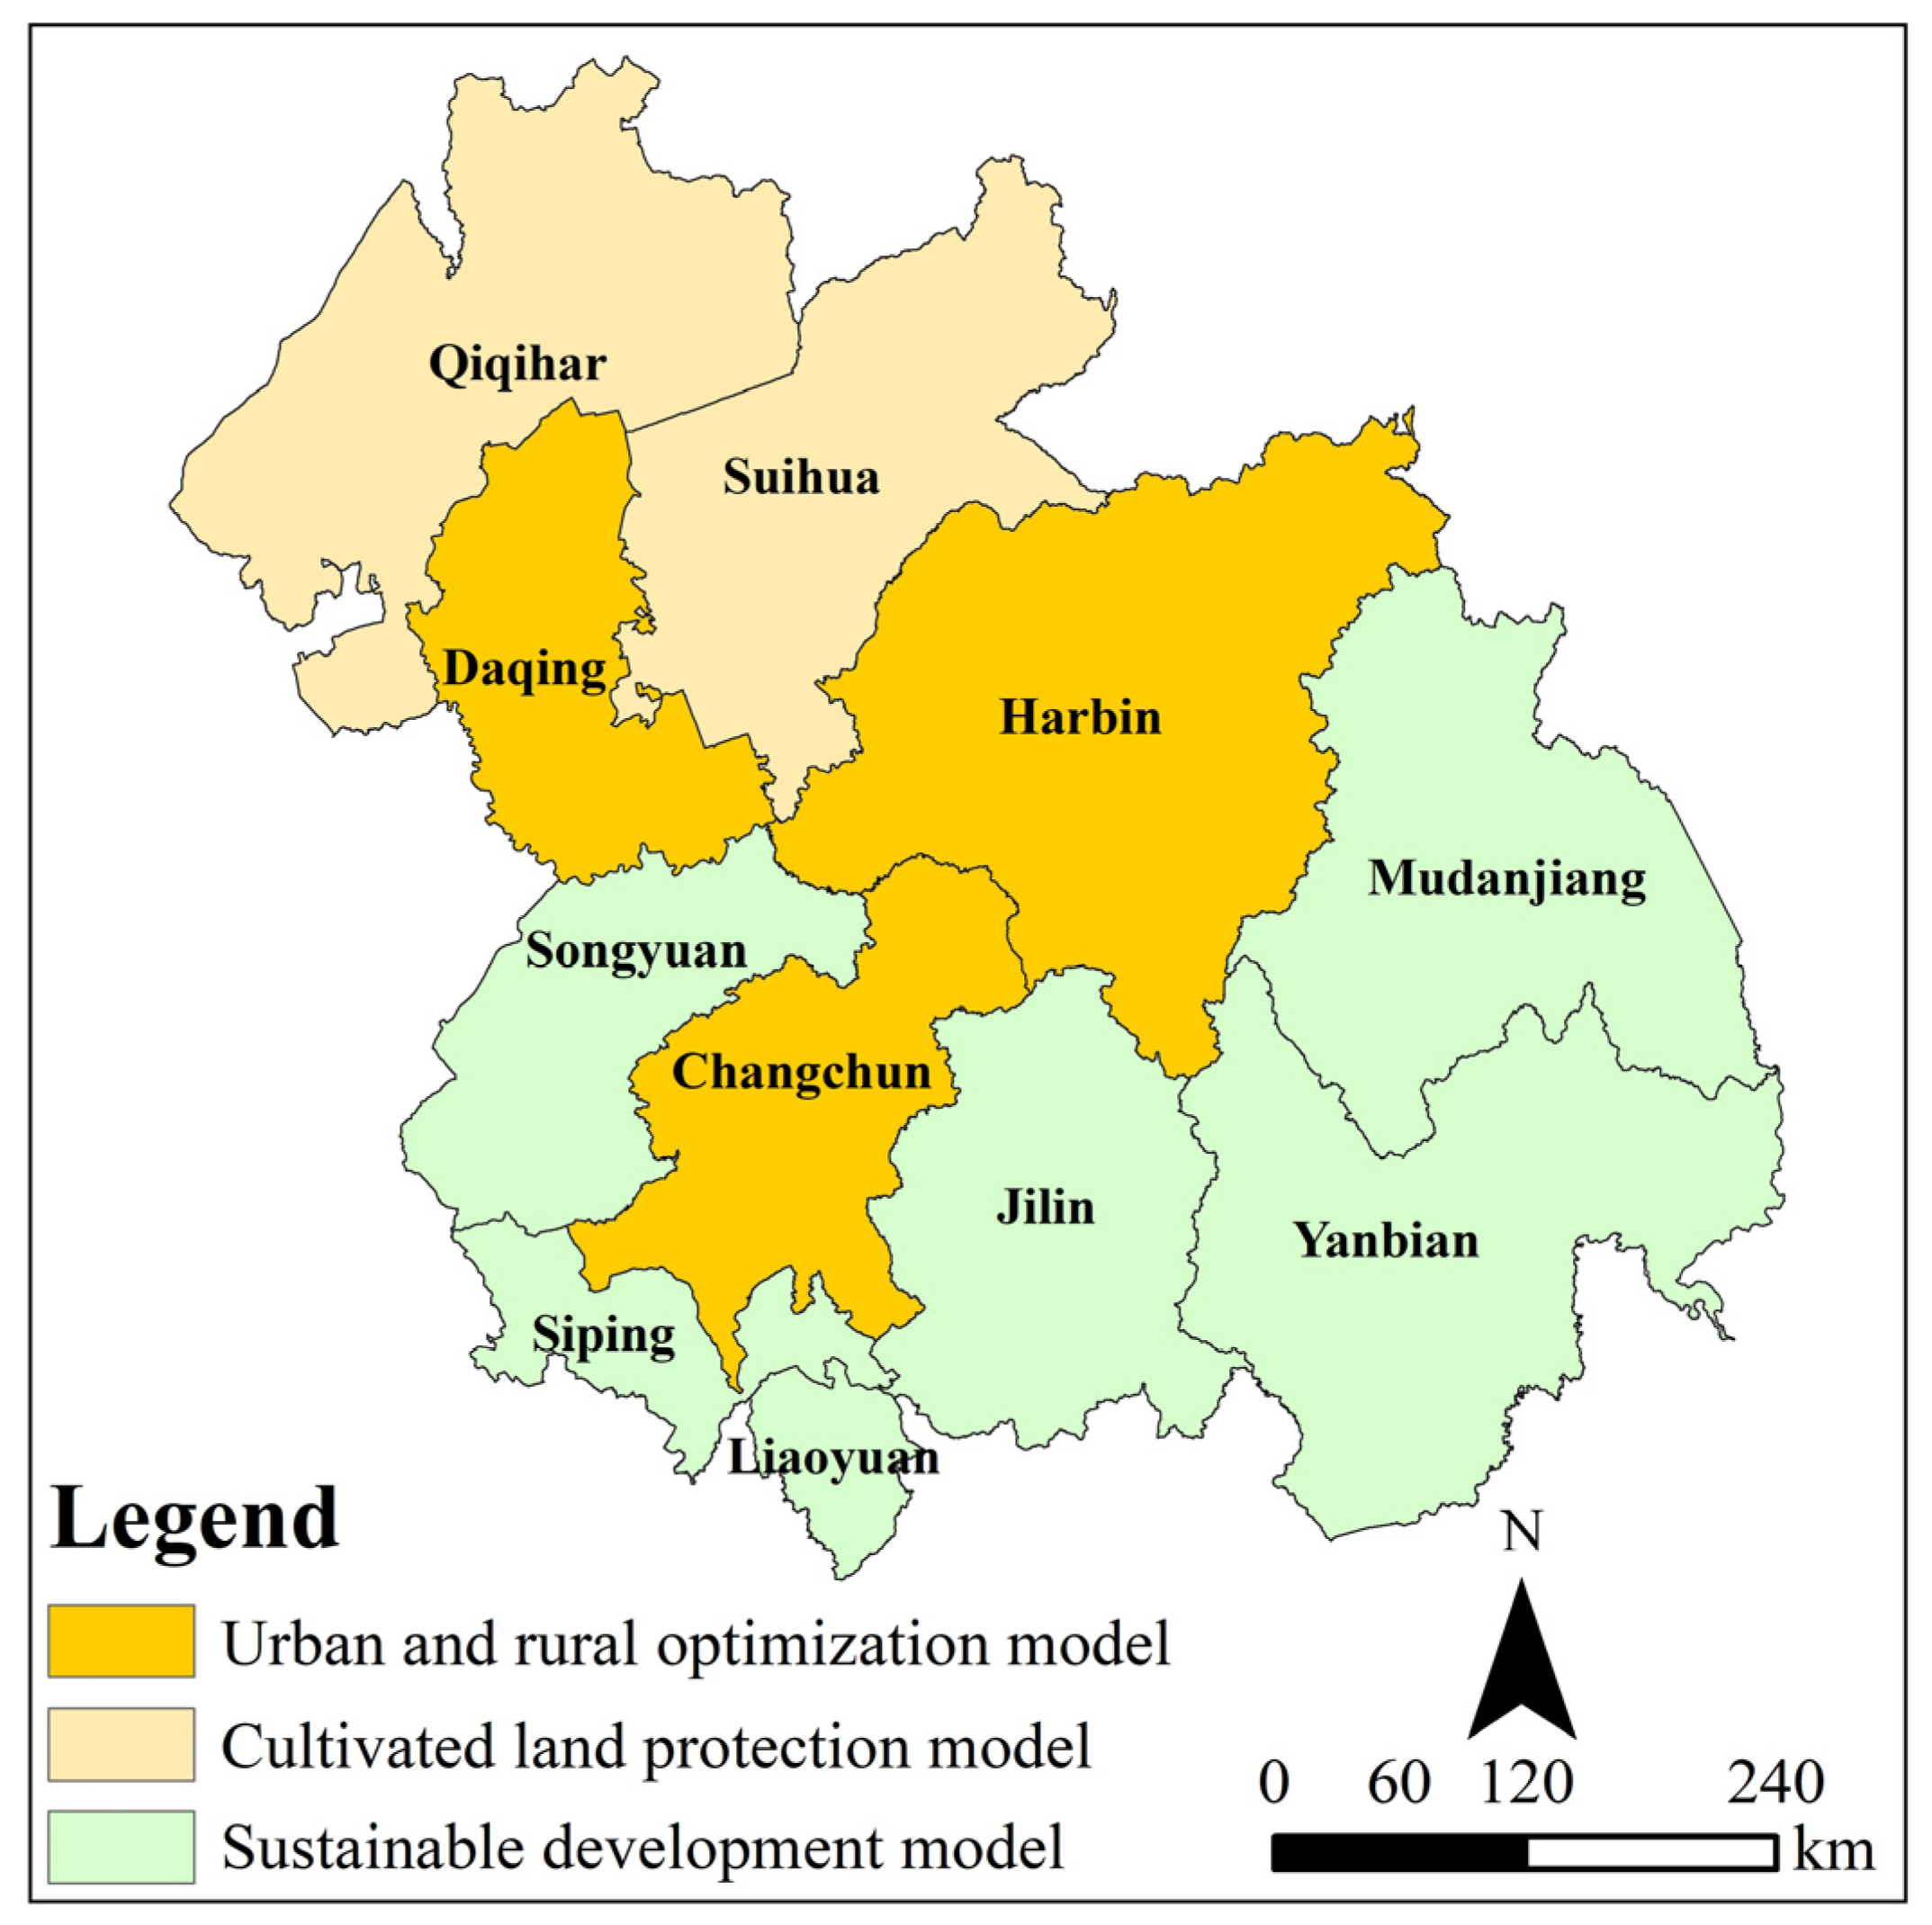
3.5. Development Strategies of HCUA Based on PELS Conflicts
- Urban and Rural Optimization Model
- 2.
- Cultivated Land Protection Model
- 3.
- Sustainable Development Model
4. Discussion
4.1. Spatiotemporal Evolutionary Characteristics of PELS Absolute Conflicts
4.2. Spatiotemporal Evolutionary Characteristics of PELS Relative Conflicts
4.3. The Applicability of the PLUS Model
5. Conclusions
Author Contributions
Funding
Data Availability Statement
Conflicts of Interest
References
- Hu, Y.; An, R.; Yang, J. Measurement and Driving Mechanism of Land Use Conflict Based on Landscape Pattern: A Case Study of Wuhan Metropolitan Area. Res. Soil Water Conserv. 2024, 31, 354–364. [Google Scholar]
- Zong, S.; Xu, S.; Jiang, X.; Song, C. Identification and Dynamic Evolution of Land Use Conflict Potentials in China, 2000–2020. Ecol. Indic. 2024, 166, 112340. [Google Scholar] [CrossRef]
- Zou, Y.; Meng, J.; Zhu, L.; Han, Z.; Ma, Y. Characterizing Land Use Transition in China by Accounting for the Conflicts Underlying Land Use Structure and Function. J. Environ. Manag. 2024, 349, 119311. [Google Scholar] [CrossRef] [PubMed]
- Zou, L.; Liu, Y.; Wang, J.; Yang, Y. An Analysis of Land Use Conflict Potentials Based on Ecological-Production-Living Function in the Southeast Coastal Area of China. Ecol. Indic. 2021, 122, 107297. [Google Scholar] [CrossRef]
- Nantel, P.; Bouchard, A.; Brouillet, L.; Hay, S. Selection of Areas for Protecting Rare Plants with Integration of Land Use Conflicts: A Case Study for the West Coast of Newfoundland, Canada. Biol. Conserv. 1998, 84, 223–234. [Google Scholar] [CrossRef]
- Yang, L.; Fang, C.; Chen, W.; Zeng, J. Urban-Rural Land Structural Conflicts in China: A Land Use Transition Perspective. Habitat Int. 2023, 138, 102877. [Google Scholar] [CrossRef]
- Pacheco, F.A.L.; Sanches Fernandes, L.F. Environmental Land Use Conflicts in Catchments: A Major Cause of Amplified Nitrate in River Water. Sci. Total Environ. 2016, 548–549, 173–188. [Google Scholar] [CrossRef]
- Meimei, W.; Zizhen, J.; Tengbiao, L.; Yongchun, Y.; Zhuo, J. Analysis on Absolute Conflict and Relative Conflict of Land Use in Xining Metropolitan Area under Different Scenarios in 2030 by PLUS and PFCI. Cities 2023, 137, 104314. [Google Scholar] [CrossRef]
- Iojă, C.I.; Niţă, M.R.; Vânău, G.O.; Onose, D.A.; Gavrilidis, A.A. Using Multi-Criteria Analysis for the Identification of Spatial Land-Use Conflicts in the Bucharest Metropolitan Area. Ecol. Indic. 2014, 42, 112–121. [Google Scholar] [CrossRef]
- Milczarek-Andrzejewska, D.; Zawalińska, K.; Czarnecki, A. Land-Use Conflicts and the Common Agricultural Policy: Evidence from Poland. Land Use Policy 2018, 73, 423–433. [Google Scholar] [CrossRef]
- Karimi, A.; Brown, G. Assessing Multiple Approaches for Modelling Land-Use Conflict Potential from Participatory Mapping Data. Land Use Policy 2017, 67, 253–267. [Google Scholar] [CrossRef]
- Zou, L.; Liu, Y.; Wang, J.; Yang, Y.; Wang, Y. Land Use Conflict Identification and Sustainable Development Scenario Simulation on China’s Southeast Coast. J. Clean. Prod. 2019, 238, 117899. [Google Scholar] [CrossRef]
- Liu, J.; Liu, Y.; Li, Y. Classification evaluation and spatial-temporal analysis of “production-living-ecological” spaces in China. Acta Geogr. Sin. 2017, 72, 1290–1304. [Google Scholar]
- Yang, Q.; Duan, X.; Wang, L.; Jin, Z. Land Use Transformation Based on Ecological-production-living Spaces and Associated Eco-environment Effects: A Case Study in the Yangtze River Delta. Sci. Geogr. Sin. 2018, 38, 97–106. [Google Scholar]
- Kalabamu, F.T. Land Tenure Reforms and Persistence of Land Conflicts in Sub-Saharan Africa—The Case of Botswana. Land Use Policy 2019, 81, 337–345. [Google Scholar] [CrossRef]
- Brown, G.; Raymond, C.M. Methods for Identifying Land Use Conflict Potential Using Participatory Mapping. Landsc. Urban Plan. 2014, 122, 196–208. [Google Scholar] [CrossRef]
- Jiang, S.; Meng, J.; Zhu, L.; Cheng, H. Spatial-Temporal Pattern of Land Use Conflict in China and Its Multilevel Driving Mechanisms. Sci. Total Environ. 2021, 801, 149697. [Google Scholar] [CrossRef]
- Long, H. Theorizing Land Use Transitions: A Human Geography Perspective. Habitat Int. 2022, 128, 102669. [Google Scholar] [CrossRef]
- Zhang, Z.; Wang, X.; Wen, Q.; Zhao, X.; Liu, F.; Zuo, L.; Hu, S.; Xu, J.; Yi, L.; Liu, B. 2016. Research progress of remote sensing application in land resources. J. Remote Sens. 2016, 20, 1243–1258. [Google Scholar]
- Journal of Geoinformation Science Editorial Department. “Spatial and Temporal characteristics of Land use/Cover Change in China in the New Era and its ecological and environmental Effects” column introduction. J. Geo Inf. Sci. 2017, 19, 1. [Google Scholar]
- Zhang, L.; Zhao, J.; Chen, G.; Lin, Y.; Liu, F.; Peng, S. Impact of land use change on the value of ecosystem services based on SDG 15.3.1. J. Soil Water Conserv. 2024, 38, 268–277. [Google Scholar]
- Kelly-Fair, M.; Gopal, S.; Koch, M.; Pancasakti Kusumaningrum, H.; Helmi, M.; Khairunnisa, D.; Kaufman, L. Analysis of Land Use and Land Cover Changes through the Lens of SDGs in Semarang, Indonesia. Sustainability 2022, 14, 7592. [Google Scholar] [CrossRef]
- Dong, L. China’s Renewed Perception of Global Environmental Governance. Chin. J. Popul. Resour. Environ. 2020, 18, 319–323. [Google Scholar] [CrossRef]
- Calvert, K.; Mabee, W. More Solar Farms or More Bioenergy Crops? Mapping and Assessing Potential Land-Use Conflicts among Renewable Energy Technologies in Eastern Ontario, Canada. Appl. Geogr. 2015, 56, 209–221. [Google Scholar] [CrossRef]
- Chen, Y.; Su, X.; Wang, X. Spatial Transformation Characteristics and Conflict Measurement of Production-Living-Ecology: Evidence from Urban Agglomeration of China. Int. J. Environ. Res. Public Health 2022, 19, 1458. [Google Scholar] [CrossRef]
- Kim, I.; Arnhold, S. Mapping Environmental Land Use Conflict Potentials and Ecosystem Services in Agricultural Watersheds. Sci. Total Environ. 2018, 630, 827–838. [Google Scholar] [CrossRef]
- Liao, L.; Dai, W.; Chen, J.; Huang, W.; Jiang, F.; Hu, Q. Spatial conflict between ecological-production-living spaces on Pingtan Island during rapid urbanization. Resour. Sci. 2017, 39, 1823–1833. [Google Scholar]
- Niu, H.; Wang, J.; Jing, Z.; Liu, B. Identification and Management of Land Use Conflicts in Mining Cities: A Case Study of Shuozhou in China. Resour. Policy 2023, 81, 103301. [Google Scholar] [CrossRef]
- Pan, F.; Wan, Q.; Zeng, J.; Wang, H.; Huang, Q. Evolution Characteristics and Influence Factors of Spatial Conflicts Between Production-Living-Ecological Space in the Rapid Urbanization Process of Hubei Province, China. Econ. Geogr. 2023, 43, 80–92. [Google Scholar]
- Min, J.; Wang, R.; Liu, C. Spatiotemporal evolution of production-living-ecological spaces in the Aksu region. J. Agric. Resour. Environ. 2024, 13, 1319. [Google Scholar]
- Zheng, W.; Guo, B.; Su, H.; Liu, Z. Study on Multi-Scenarios Regulating Strategy of Land Use Conflict in Urban Agglomerations under the Perspective of “Three-Zone Space”: A Case Study of Harbin-Changchun Urban Agglomerations, China. Front. Environ. Sci. 2024, 11, 1288933. [Google Scholar] [CrossRef]
- Wang, Z.; Zhang, J.; Li, H.; Su, W. Multi-scale spatio-temporal evolution and multi-scenario simulation of land use conflict in Chongqing. Acta Ecol. Sin. 2024, 44, 1024–1039. [Google Scholar]
- Feng, Y.; Bi, R.; Wang, J.; Lv, C.; Zhang, Q. Spatial Conflict of Land Use Caused by Mining Exploitation and Optimal Allocation Scheme of Land Resources in River Basin. China Land Sci. 2016, 30, 32–40+2. [Google Scholar]
- Wang, Y.; Li, P.; Li, W.; Zeng, X.; Xue, B. Mitigation Mechanism of Land Use Conflicts Based on Evolutionary Game: A Case Study of Shenfu New Area. China Land Sci. 2021, 35, 87–97. [Google Scholar]
- Bao, W.; Yang, Y.; Zou, L. How to Reconcile Land Use Conflicts in Mega Urban Agglomeration? A Scenario-Based Study in the Beijing-Tianjin-Hebei Region, China. J. Environ. Manag. 2021, 296, 113168. [Google Scholar] [CrossRef]
- Chen, L.; Zhang, A. Identification of Land Use Conflicts and Dynamic Response Analysis of Natural-Social Factors in Rapidly Urbanizing Areas—A Case Study of Urban Agglomeration in the Middle Reaches of Yangtze River. Ecol. Indic. 2024, 161, 112009. [Google Scholar] [CrossRef]
- Sun, P. Temporal and Spatial Evolution of Land Use Conflicts in the Poverty Belt around Beijing and Tianjin from the Perspective of Ecological Security. Doctoral Thesis, China Agricultural University, Beijing, China, 2017. [Google Scholar]
- Wang, C.; Wang, H.; Wu, J.; He, X.; Luo, K.; Yi, S. Identifying and Warning against Spatial Conflicts of Land Use from an Ecological Environment Perspective: A Case Study of the Ili River Valley, China. J. Environ. Manag. 2024, 351, 119757. [Google Scholar] [CrossRef]
- Gao, Z.; Ye, J. Eco-environmental effects and differentiation mechanism of land use transition in Manas River Basin: A perspective based on the dominant function of “production-living-ecological” spaces. Arid. Land Geogr. 2024, 47, 1947–1956. [Google Scholar]
- Liu, X.; Li, X.; Zhang, Y.; Wang, Y.; Chen, J.; Geng, Y. Spatiotemporal Evolution and Relationship between Construction Land Expansion and Territorial Space Conflicts at the County Level in Jiangsu Province. Ecol. Indic. 2023, 154, 110662. [Google Scholar] [CrossRef]
- Wan, J.; Liu, Y.; Zhang, X. Conflict in Informal Rural Construction Land Transfer Practices in China: A Case of Hubei. Land Use Policy 2021, 109, 105573. [Google Scholar]
- Zhou, D.; Zhao, X.; Li, P.; Jin, F.; Li, S.; Li, H.; Wang, J. Assessing Territorial Space Conflicts in the Coastal Zone of Wenzhou, China: A Land-Sea Interaction Perspective. Sci. Total Environ. 2024, 926, 171826. [Google Scholar] [CrossRef] [PubMed]
- Wang, D.; Huang, L.; Chen, Z. Evolution of productional-living-ecological space and land use relative conflict at Nanchang County of Nanchang City from 2000 to 2020. Bull. Soil Water Conserv. 2024, 44, 426–436+445. [Google Scholar]
- Hui, E.C.M.; Bao, H. The Logic behind Conflicts in Land Acquisitions in Contemporary China: A Framework Based upon Game Theory. Land Use Policy 2013, 30, 373–380. [Google Scholar] [CrossRef]
- Pacheco, F.a.L.; Varandas, S.G.P.; Sanches Fernandes, L.F.; Valle Junior, R.F. Soil Losses in Rural Watersheds with Environmental Land Use Conflicts. Sci. Total Environ. 2014, 485, 110–120. [Google Scholar] [CrossRef] [PubMed]
- Tao, Q. Measurement and Simulation Prediction of Conflict Level of “Three Living Things” in Typical Karst Mountain Watersheds of Guizhou Province. Master’s Thesis, Guizhou Normal University, Guiyang, China, 2024. [Google Scholar]
- Lu, Q.; Sun, J.; Xiao, Y.; Zhu, S.; Zhu, G.; Liu, J.; Li, X.; Liu, H. The Progression Traits of Spatial Conflicts within the Production–Living–Ecological Space among Varying Geomorphological Types of Mountain–Basin Areas in Karst Regions, China. Ecol. Indic. 2024, 166, 112324. [Google Scholar] [CrossRef]
- Zuo, Q.; Zhou, Y.; Wang, L.; Li, Q.; Liu, J. Impacts of Future Land Use Changes on Land Use Conflicts Based on Multiple Scenarios in the Central Mountain Region, China. Ecol. Indic. 2022, 137, 108743. [Google Scholar] [CrossRef]
- Fang, C.; Liu, H. The Spatial Privation and the Corresponding Controlling Paths in China’s Urbanization Process. Acta Geogr. Sin. 2007, 62, 849–860. [Google Scholar]
- Wang, J.; Liu, X. Recognizing and measuring spatial conflict of land use via “risk-effect”. Trans. Chin. Soc. Agric. Eng. 2022, 38, 291–300. [Google Scholar]
- Liang, X.; Guan, Q.; Clarke, K.C.; Liu, S.; Wang, B.; Yao, Y. Understanding the Drivers of Sustainable Land Expansion Using a Patch-Generating Land Use Simulation (PLUS) Model: A Case Study in Wuhan, China. Comput. Environ. Urban Syst. 2021, 85, 101569. [Google Scholar] [CrossRef]
- Liang, X.; Liu, X.; Li, D.; Zhao, H.; Chen, G. Urban Growth Simulation by Incorporating Planning Policies into a CA-Based Future Land-Use Simulation Model. Int. J. Geogr. Inf. Sci. 2018, 32, 2294–2316. [Google Scholar] [CrossRef]
- Hu, F.; Zhang, Y.; Guo, Y.; Zhang, P.; Lv, S.; Zhang, C. Spatial and temporal changes in land use and habitat quality in the Weihe River Basin based on the PLUS and InVEST models and predictions. Arid. Land Geogr. 2022, 45, 1125–1136. [Google Scholar]
- Lin, Z.; Peng, S. Comparison of Multimodel Simulations of Land Use and Land Cover Change Considering Integrated Constraints- a Case Study of the Fuxian Lake Basin. Ecol. Indic. 2022, 142, 109254. [Google Scholar] [CrossRef]
- Wang, B. Spatial-Temporal Pattern Evolution and Multi-Scenario Simulation of Land Use Conflict in Poyang Lake Area Based on PLUS Model. Master’s Thesis, Jiangxi Normal University, Nanchang, China, 2023. [Google Scholar]
- Zhang, X.; Gu, R. Spatio-temporal pattern and multi-scenario simulation of land use conflict: A case study of the Yangtze River Delta urban agglomeration. Geogr. Res. 2022, 41, 1311–1326. [Google Scholar]
- Wang, B.; Shu, X.; Liao, F.; Li, Y.; Wan, Z. Spatitemporal of Land Use Conflicts and Multi-Scenario Simulationin Poyang Lake Area Based on Optimal Landscape Scale. Res. Soil Water Conserv. 2024, 31, 336–347. [Google Scholar]
- Dong, G.; Ge, Y.; Jia, H.; Sun, C.; Pan, S. Land Use Multi-Suitability, Land Resource Scarcity and Diversity of Human Needs: A New Framework for Land Use Conflict Identification. Land 2021, 10, 1003. [Google Scholar] [CrossRef]
- Yan, Z.; Li, W.; Wang, D. Outward Expansion or Networked Growth? Comparing Farmland Loss in Evolving Urban Agglomerations across Mollisol Regions in the Northern Hemisphere. Cities 2023, 133, 104106. [Google Scholar] [CrossRef]
- Zhang, Y.; Li, J.; Pan, B. Evaluation and multi-scenario prediction of ecosystem services in the Yellow River Basin based on PLUS model: A case study of Shaanxi section. Arid. Land Geogr. 2024, 47, 1935–1946. [Google Scholar]
- Li, W.; Yang, J.; Fu, B.; Zhao, Q.; Tan, Z.; Guan, X. Spatial-temporal changes and prediction of carbon storage in Greater Khingan Mountains based on PLUS-InVEST model. J. Environ. Eng. Technol. 2024, 14, 1892–1904. [Google Scholar]
- Wang, D.; Zhang, C.; Wang, B.; Li, B.; Wang, Q.; Liu, D.; Wang, H.; Zhou, Y.; Shi, L.; Lan, F.; et al. Optimized CRISPR Guide RNA Design for Two High-Fidelity Cas9 Variants by Deep Learning. Nat. Commun. 2019, 10, 4284. [Google Scholar] [CrossRef]
- Xie, H. Regional eco-risk analysis of based on landscape structure and spatial statistics. Acta Ecol. Sin. 2008, 28, 5020–5026. [Google Scholar]
- Peng, Y.; Wang, J.; Wang, S.; Tian, L.; Liu, J.; Wu, Z. Spatiotemporal pattern evolution of land use conflict in Urumqi City from the perspective of ecological security. Arid. Land Geogr. 2024, 47, 81–92. [Google Scholar]
- Zhou, Z.; Zhu, C. Recent Progress of Studies on the Regional Spatial Integration and Its Prospects in China. Areal. Res. Dev. 2009, 28, 1–5. [Google Scholar]
- Mo, W.; Wang, Y.; Zhang, Y.; Zhuang, D. Impacts of Road Network Expansion on Landscape Ecological Risk in a Megacity, China: A Case Study of Beijing. Sci. Total Environ. 2017, 574, 1000–1011. [Google Scholar] [CrossRef] [PubMed]
- Liu, B.; Guo, X.; Zhu, Y. Analysis of soil heavy metal sources in Jinzhong basin based on random forest model. Arid. L. Resour. Environ. 2019, 33, 106–111. [Google Scholar]
- Xu, H. A remote sensing urban ecological index and its application. Acta Ecol. Sin. 2013, 33, 7853–7862. [Google Scholar]
- Cai, L.; Tang, X. Multi-scenario Simulation of Production-Living-Ecological Space and Carbon Storage Assessment in Ecological Transition Zone: A Case Study of Gansu Province. Chin. J. Environ. Sci. 2024, 1–19. [Google Scholar] [CrossRef]


| Data | Sub-Data | Year | Spatial Resolution | Source of Data |
|---|---|---|---|---|
| Remote sensing image dataset | Remote sensing image | 2000 2010 2020 | 30 m | https://www.gscloud.cn/ |
| Land dataset | Land use | 2000 2010 2020 | 30 m | https://www.resdc.cn/ |
| Socio-economic dataset | Population | 2020 | 1 km | https://www.resdc.cn/ |
| GDP | 2020 | 1 km | https://www.resdc.cn/ | |
| Primary roads | 2021 | Vector data | https://www.webmap.cn/ | |
| Secondary roads | 2021 | Vector data | https://www.webmap.cn/ | |
| Tertiary roads | 2021 | Vector data | https://www.webmap.cn/ | |
| Seat of county government | 2021 | Vector data | https://www.webmap.cn/ | |
| Natural condition dataset | Temperature | 2020 | 1 km | https://www.resdc.cn/ |
| Precipitation | 2020 | 1 km | https://www.resdc.cn/ | |
| Elevation | 2020 | 30 m | https://www.gscloud.cn/ | |
| Slope | 2020 | 30 m | https://www.gscloud.cn/ | |
| Soil types | 1995 | 1 km | https://www.resdc.cn/ | |
| Constrained dataset | Ecological protection area | 2018 | Vector data | https://www.resdc.cn/ |
| River system | 2021 | Vector data | https://www.webmap.cn/ |
| Primary Classification | Second Classification | Secondary Classification of Land Use |
|---|---|---|
| Production space (P) | Agricultural production space (P1) | Paddy field and dryland |
| Industrial and mining production space (P2) | Other construction land | |
| Ecological space (E) | Forestry ecological space (E1) | Woodland, shrubland, dredged woodland, other woodland |
| Grassland ecological space (E2) | High-cover grassland, medium-cover grassland, low-cover grassland | |
| Water ecological space (E3) | Canals, lakes, reservoirs, permanent glaciers and snow, tidal flats | |
| Other ecological space (E4) | Sandy land, saline–alkali land, marshland, bare land, bare rock stony land | |
| Living space (L) | Urban living space (L1) | Urban land |
| Rural living space (L2) | Rural residential areas |
| — | Scenario A (ND) | Scenario B (CP) | Scenario C (ED) | Scenario D (SDGs) | |||||||||||||||||||||||||||||||
|---|---|---|---|---|---|---|---|---|---|---|---|---|---|---|---|---|---|---|---|---|---|---|---|---|---|---|---|---|---|---|---|---|---|---|---|
| a | b | c | d | e | f | g | h | a | b | c | d | e | f | g | h | a | b | c | d | e | f | g | h | a | b | c | d | e | f | g | h | ||||
| a | 1 | 1 | 1 | 1 | 1 | 1 | 1 | 1 | 1 | 0 | 0 | 0 | 0 | 0 | 0 | 0 | 1 | 1 | 1 | 1 | 1 | 0 | 1 | 1 | 1 | 1 | 1 | 1 | 0 | 0 | 1 | 1 | |||
| b | 1 | 1 | 1 | 1 | 1 | 1 | 1 | 1 | 1 | 1 | 1 | 1 | 1 | 1 | 1 | 1 | 0 | 1 | 0 | 0 | 0 | 0 | 0 | 1 | 1 | 1 | 1 | 1 | 1 | 1 | 1 | 1 | |||
| c | 1 | 1 | 1 | 1 | 1 | 1 | 1 | 1 | 1 | 1 | 1 | 1 | 1 | 1 | 1 | 1 | 1 | 1 | 1 | 1 | 1 | 1 | 1 | 1 | 1 | 1 | 1 | 1 | 0 | 1 | 1 | 1 | |||
| d | 1 | 1 | 1 | 1 | 1 | 1 | 1 | 1 | 1 | 1 | 1 | 1 | 1 | 1 | 1 | 1 | 1 | 1 | 1 | 1 | 1 | 1 | 1 | 1 | 1 | 1 | 1 | 1 | 1 | 1 | 1 | 1 | |||
| e | 0 | 0 | 0 | 0 | 1 | 0 | 0 | 0 | 1 | 0 | 0 | 0 | 1 | 0 | 0 | 0 | 1 | 1 | 1 | 1 | 1 | 1 | 1 | 1 | 1 | 1 | 0 | 1 | 1 | 1 | 1 | 1 | |||
| f | 1 | 1 | 1 | 1 | 1 | 1 | 1 | 1 | 1 | 1 | 1 | 1 | 1 | 1 | 1 | 1 | 1 | 1 | 1 | 1 | 1 | 1 | 1 | 1 | 1 | 1 | 1 | 1 | 1 | 1 | 1 | 1 | |||
| g | 1 | 1 | 1 | 1 | 1 | 1 | 1 | 1 | 1 | 1 | 0 | 1 | 0 | 0 | 1 | 1 | 0 | 0 | 0 | 0 | 0 | 0 | 1 | 0 | 0 | 0 | 0 | 1 | 1 | 0 | 1 | 0 | |||
| h | 1 | 1 | 1 | 1 | 1 | 1 | 1 | 1 | 1 | 1 | 1 | 1 | 1 | 0 | 1 | 1 | 0 | 0 | 0 | 0 | 0 | 0 | 1 | 1 | 1 | 1 | 1 | 1 | 1 | 0 | 1 | 1 | |||
| Variety | a | b | c | d | e | f | g | h |
|---|---|---|---|---|---|---|---|---|
| TA | 3754 | 985 | −2713 | −6860 | −6145 | 9350 | 1780 | −151 |
| Weight | 0.65 | 0.48 | 0.26 | 0 * | 0.04 | 1 * | 0.53 | 0.41 |
| - | Gaussian Model | Exponential Model | Spherical Model | ||||||
|---|---|---|---|---|---|---|---|---|---|
| Scale | N | S | N/S | N | S | N/S | N | S | N/S |
| 10,000 | 0.001 | 0.005 | 0.260 | 0.001 | 0.008 | 0.089 | 0.001 | 0.005 | 0.163 |
| 15,000 | 0.012 | 0.031 | 0.368 | 0.007 | 0.042 | 0.172 | 0.009 | 0.033 | 0.265 |
| 20,000 | 0.011 | 0.033 | 0.338 | 0.007 | 0.049 | 0.141 | 0.008 | 0.036 | 0.230 |
| 25,000 | 0.010 | 0.029 | 0.349 | 0.006 | 0.038 | 0.159 | 0.007 | 0.030 | 0.250 |
| Year/Period | Production Space (%) | Ecological Space (%) | Living Space (%) | |||||
|---|---|---|---|---|---|---|---|---|
| P1 | P2 | E1 | E2 | E3 | E4 | L1 | L2 | |
| 2000 | 46.58 | 0.03 | 35.92 | 5.24 | 3.62 | 5.14 | 0.53 | 2.94 |
| 2010 | 46.47 | 0.11 | 35.81 | 5.59 | 2.89 | 5.48 | 0.70 | 2.95 |
| 2020 | 46.78 | 0.19 | 35.58 | 5.06 | 2.41 | 6.20 | 0.84 | 2.94 |
| 2000–2010 | −0.11 | 0.07 | −0.10 | 0.35 | −0.73 | 0.33 | 0.17 | 0.01 |
| 2010–2020 | 0.31 | 0.08 | −0.23 | −0.53 | −0.48 | 0.73 | 0.14 | −0.01 |
| 2000–2020 | 0.20 | 0.15 | −0.33 | −0.17 | −1.21 | 1.06 | 0.31 | 0.00 |
| 2000 | P1 | P2 | E1 | E2 | E3 | E4 | L1 | L2 | |
|---|---|---|---|---|---|---|---|---|---|
| 2010 | |||||||||
| P1 | - | 17.43 | 6872.15 | 2957.13 | 1192.64 | 2196.83 | 112.38 | 2917.97 | |
| P2 | 155.38 | - | 26.98 | 12.20 | 37.00 | 8.12 | 7.27 | 44.77 | |
| E1 | 6758.08 | 6.12 | - | 1915.65 | 305.38 | 740.69 | 15.41 | 162.34 | |
| E2 | 3379.34 | 7.24 | 2281.75 | - | 908.59 | 1696.33 | 5.68 | 121.67 | |
| E3 | 1081.97 | 0.98 | 322.88 | 158.38 | - | 887.75 | 7.77 | 44.15 | |
| E4 | 1552.69 | 2.76 | 594.55 | 2113.31 | 2368.84 | - | 4.73 | 61.50 | |
| L1 | 452.74 | 15.45 | 21.39 | 16.07 | 20.61 | 20.17 | - | 209.78 | |
| L2 | 3235.77 | 7.44 | 118.73 | 87.86 | 33.12 | 76.32 | 45.53 | - | |
| 2010 | P1 | P2 | E1 | E2 | E3 | E4 | L1 | L2 | |
|---|---|---|---|---|---|---|---|---|---|
| 2020 | |||||||||
| P1 | - | 65.61 | 4672.81 | 2996.41 | 719.92 | 1719.09 | 171.96 | 2100.49 | |
| P2 | 258.88 | - | 34.45 | 52.21 | 4.37 | 42.49 | 26.36 | 5.55 | |
| E1 | 4251.52 | 4.98 | - | 1261.68 | 76.77 | 380.81 | 11.01 | 54.00 | |
| E2 | 1985.39 | 6.85 | 1191.06 | - | 154.16 | 1617.17 | 10.48 | 67.34 | |
| E3 | 421.84 | 32.76 | 108.42 | 324.51 | - | 907.77 | 10.05 | 11.34 | |
| E4 | 1983.76 | 7.30 | 674.35 | 1978.86 | 2355.27 | - | 17.35 | 72.30 | |
| L1 | 599.50 | 20.22 | 29.71 | 17.75 | 12.25 | 20.03 | - | 117.57 | |
| L2 | 1961.67 | 35.29 | 74.95 | 103.68 | 23.02 | 59.59 | 120.97 | - | |
| Year | Index | PC1 | PC2 | PC3 | PC4 |
|---|---|---|---|---|---|
| 2000 | WET | 0.2152 | −0.1485 | −0.2700 | 0.9267 |
| NDVI | 0.6223 | −0.6102 | 0.4795 | −0.1026 | |
| NDBSI | −0.3639 | 0.2201 | 0.8297 | 0.3615 | |
| LST | −0.6588 | −0.7464 | −0.0936 | 0.0061 | |
| Eigenvalue | 0.0326 | 0.0058 | 0.0029 | 0.0009 | |
| Eigenvalue contribution rate/% | 77.2000 | 13.6400 | 6.9600 | 2.2000 | |
| 2010 | WET | 0.2589 | −0.1241 | −0.4493 | 0.8460 |
| NDVI | 0.5721 | −0.5249 | 0.6251 | 0.0800 | |
| NDBSI | −0.4149 | 0.3862 | 0.6372 | 0.5221 | |
| LST | −0.6585 | −0.7482 | −0.0351 | 0.0731 | |
| Eigenvalue | 0.0202 | 0.0045 | 0.0015 | 0.0008 | |
| Eigenvalue contribution rate/% | 74.8400 | 16.5300 | 5.5800 | 3.0500 | |
| 2020 | WET | 0.0618 | 0.0711 | 0.5157 | −0.8516 |
| NDVI | 0.7956 | −0.4136 | −0.3885 | −0.2121 | |
| NDBSI | −0.4634 | 0.0527 | −0.7434 | −0.4794 | |
| LST | −0.3853 | −0.9061 | 0.1745 | 0.0021 | |
| Eigenvalue | 0.0196 | 0.0070 | 0.0019 | 0.0002 | |
| Eigenvalue contribution rate/% | 68.0400 | 24.4900 | 6.7100 | 0.7600 |
| Year | Value | WET | NDVI | NDBSI | LST | RSEI |
|---|---|---|---|---|---|---|
| 2000 | Minimum | −0.8961 | −0.3157 | −0.4309 | 7.1311 | 0.0000 |
| Maximum | 0.4673 | 0.5590 | 0.3022 | 27.8914 | 1.0000 | |
| Mean | −0.1209 | 0.2455 | −0.0827 | 21.3125 | 0.6159 | |
| Std Dev | 0.0841 | 0.1194 | 0.0621 | 2.7205 | 0.1494 | |
| 2010 | Minimum | −1.0398 | −0.5737 | −0.4342 | 6.2582 | 0.0000 |
| Maximum | 0.4509 | 0.6999 | 0.5282 | 26.4335 | 1.0000 | |
| Mean | −0.0931 | 0.2393 | −0.0752 | 19.7757 | 0.6196 | |
| Std Dev | 0.0839 | 0.1268 | 0.0695 | 2.1417 | 0.1208 | |
| 2020 | Minimum | −0.6936 | −0.4717 | −0.4205 | 6.2932 | 0.0000 |
| Maximum | 0.5268 | 0.5920 | 0.3855 | 28.6475 | 1.0000 | |
| Mean | −0.0453 | 0.2863 | −0.1118 | 20.1751 | 0.7025 | |
| Std Dev | 0.0490 | 0.1613 | 0.0652 | 2.0872 | 0.1359 |
| Year | SCCI | RSEI | ||
|---|---|---|---|---|
| Mean | Std Dev | Mean | Std Dev | |
| 2000 | 0.5860 | 0.2210 | 0.6159 | 0.1494 |
| 2010 | 0.5778 | 0.2179 | 0.6196 | 0.1208 |
| 2020 | 0.5272 | 0.1992 | 0.7025 | 0.1359 |
| Conflict Level | 2020 | |||||
|---|---|---|---|---|---|---|
| Minor Conflict | Middle Conflict | High Conflict | Total | Proportion | ||
| 2000 | Minor conflict | 126,100 | 58,300 | 9600 | 194,000 | 56.17 |
| Middle conflict | 45,100 | 39,000 | 18,000 | 102,100 | 29.56 | |
| High conflict | 12,000 | 15,400 | 21,900 | 49,300 | 14.27 | |
| Total | 183,200 | 112,700 | 49,500 | 345,400 | 100.00 | |
| Proportion | 53.04 | 32.63 | 14.33 | 100.00 | —— | |
| Conflict Degree | A | B | C | D |
|---|---|---|---|---|
| Improvement | 1067 | 750 | 556 | 2204 |
| Invariability | 3 | 3 | 3 | 3 |
| Mild deterioration | 2382 | 2656 | 2764 | 1175 |
| Moderate deterioration | 3 | 43 | 131 | 72 |
| Severe deterioration | 0 | 3 | 1 | 1 |
Disclaimer/Publisher’s Note: The statements, opinions and data contained in all publications are solely those of the individual author(s) and contributor(s) and not of MDPI and/or the editor(s). MDPI and/or the editor(s) disclaim responsibility for any injury to people or property resulting from any ideas, methods, instructions or products referred to in the content. |
© 2025 by the authors. Licensee MDPI, Basel, Switzerland. This article is an open access article distributed under the terms and conditions of the Creative Commons Attribution (CC BY) license (https://creativecommons.org/licenses/by/4.0/).
Share and Cite
Wang, X.; Zhang, Y.; Li, X.; Cao, S. An Analysis of Land Use Conflicts and Strategies in the Harbin–Changchun Urban Agglomeration Based on the Production–Ecological–Living Space Theory and Patch-Generating Land Use Simulation. Land 2025, 14, 111. https://doi.org/10.3390/land14010111
Wang X, Zhang Y, Li X, Cao S. An Analysis of Land Use Conflicts and Strategies in the Harbin–Changchun Urban Agglomeration Based on the Production–Ecological–Living Space Theory and Patch-Generating Land Use Simulation. Land. 2025; 14(1):111. https://doi.org/10.3390/land14010111
Chicago/Turabian StyleWang, Xiaomeng, Yanjun Zhang, Xiaoyan Li, and Shuwen Cao. 2025. "An Analysis of Land Use Conflicts and Strategies in the Harbin–Changchun Urban Agglomeration Based on the Production–Ecological–Living Space Theory and Patch-Generating Land Use Simulation" Land 14, no. 1: 111. https://doi.org/10.3390/land14010111
APA StyleWang, X., Zhang, Y., Li, X., & Cao, S. (2025). An Analysis of Land Use Conflicts and Strategies in the Harbin–Changchun Urban Agglomeration Based on the Production–Ecological–Living Space Theory and Patch-Generating Land Use Simulation. Land, 14(1), 111. https://doi.org/10.3390/land14010111