Article

A Comprehensive Accounting of Carbon Emissions and Carbon Sinks of China’s Agricultural Sector

1
Business School, Beijing Normal University, Beijing 100875, China
2
School of Economics, Beijing Technology and Business University, Beijing 100048, China
*
Author to whom correspondence should be addressed.
Land 2024, 13(9), 1452; https://doi.org/10.3390/land13091452
Submission received: 1 August 2024 / Revised: 25 August 2024 / Accepted: 2 September 2024 / Published: 6 September 2024

Abstract

:
Comprehensive accounting of carbon emissions and carbon sinks in the agricultural sector is crucial for China to achieve its carbon neutrality goal as early as possible. This paper develops a comprehensive and scientific accounting system to recalculate China’s agriculture sector’s carbon emissions and sinks from 1995 to 2020, taking into account both resource inputs and productive activities. Subsequently, the STIRPAT model is employed to predict alterations in carbon emissions and sinks across different scenarios. The results show that energy consumption, chemical inputs, and farmland soil management have surpassed livestock and poultry breeding as the main contributors to agricultural carbon emissions. Furthermore, this paper classifies 31 provinces in China into five distinct types based on the variations in agricultural carbon emissions and carbon sinks. These types include carbon sink-dominated regions, paddy planting-dominated regions, livestock farming-dominated regions, resource inputs-dominated regions, and composite factor-dominated regions. In addition, the extent of agricultural technology and the magnitude of agricultural development are the key factors impacting China’s agricultural carbon emissions and carbon sinks, respectively. Prior to 2045, agricultural carbon emissions must be directly reduced as much as possible, and their source must be controlled; following that year, the role of carbon sequestration will become more prominent, and the active development of agricultural carbon sinks will be more beneficial in achieving agricultural carbon neutrality.

1. Introduction

The agriculture sector has a significant impact on global climate change since it serves as both a source and a sink for carbon. Firstly, it is important to note that agriculture heavily contributes to the release of greenhouse gases [1]. According to the sixth assessment report of the United Nations Intergovernmental Panel on Climate Change (IPCC), human activities have caused an important rise in the average global temperature by 1.1 °C. This increase has had serious impacts on both human populations and ecosystems. The agricultural food system is responsible for approximately one third of worldwide anthropogenic greenhouse gas emissions [2]. Agriculture is accountable for approximately 40% of methane (CH4) emissions and around 60% of nitrous oxide (N2O) emissions on a global scale [3,4]. However, it is worth noting that agro-ecosystems possess a substantial capacity of capturing carbon. The sixth assessment report of the IPCC emphasizes that agriculture, forestry, and land use have the potential to provide 20–30% of the global capacity for carbon sequestration by 2050 [5]. Through the process of photosynthesis, crops have the ability to assimilate carbon dioxide, so aid in the reduction of the greenhouse effect. Nevertheless, agriculture also has a vital role in ensuring food supply, although its ability to absorb carbon dioxide is typically disregarded [6].
In order for China to accomplish its climate targets, it is imperative to optimize the potential for carbon emissions reduction and carbon sink expansion within the agricultural system. Agriculture in China is a major contributor to greenhouse gas emissions, with carbon emissions from the overall agricultural system accounting for around 20% of the country’s total emissions [7]. This share is greater than the global average. China’s agricultural production remains reliant on a high input and high emission approach, in contrast to industrialized countries. This approach leads to problems such as excessive input and inefficient use of resources [8]. It is imperative to promptly establish regulations, guidelines, and implementation strategies to decrease greenhouse gas emissions and enhance carbon sinks in agriculture [9,10]. Furthermore, it is crucial to enhance the monitoring indicators, key parameters, and accounting methodologies for carbon emissions and carbon sinks in the agricultural sector of China.
Accounting for agricultural carbon emissions and carbon sinks is an essential step for the agricultural sector. Several methods are commonly used for this purpose, including life cycle assessment (LCA) [11,12,13], the emission coefficient method [14,15], the MIDAS steady-state optimized farm model [16], and the computable general equilibrium (CGE) model [17,18]. Additionally, various measurement technologies, such as agricultural point source measurement [19] and optical remote sensing [20], are applied to evaluate agricultural emissions. Among these methods, the emission coefficient method is widely used due to its simplicity and universality. The predominant method used in research on agricultural carbon emission accounting in China is the emission coefficient method. Nevertheless, this approach encounters other challenges such as the absence of a well-defined framework, restricted range, imprecise coefficients, and a very small number of estimates for agricultural carbon sinks. Currently, China has not yet developed a comprehensive and scientifically based accounting system for measuring agricultural carbon emissions and carbon sinks. The extent of accounting for carbon sources is inconsistent and can typically be addressed from two perspectives. One aspect focuses on resource input, encompassing chemical fertilizers, pesticides, agricultural films, diesel oil, plowing, and agricultural irrigation [21,22,23]. This approach primarily emphasizes carbon emissions generated by different resource inputs in agricultural production. However, the majority of the emission coefficients are derived from foreign research and do not possess adequate localization. The other perspective focuses on production activities, encompassing rice field cultivation, farmland soil management, animal intestinal fermentation, and animal manure management [24]. The IPCC and the National Development and Reform Commission (NDRC) provide detailed and scientific calculation methods and emission coefficients applicable to various regions in China for this classification [25,26]. Zhang et al. used this approach to calculate methane emissions and nitrous oxide emissions in the agricultural sector [27]. However, this approach fails to consider the inclusion of pesticides, agricultural films, and other chemicals, along with carbon emissions resulting from agricultural energy usage, potentially resulting in an underestimation. In order to gain a complete understanding of the present level of carbon emissions in the agricultural industry, it is vital to thoroughly examine both the resources utilized and the production activities undertaken. Additionally, it is essential to employ localized accounting methods and coefficients to their fullest extent [28].
In summary, this paper will reassess China’s agricultural carbon emissions and carbon sinks by fully utilizing the methodologies provided by the IPCC and NDRC. We will analyze the structural characteristics and spatiotemporal trends of agricultural carbon emissions across China from 1995 to 2020, and simulate the future potential for emission reduction and carbon sinks increase in the Chinese agriculture sector under different scenarios. The main contributions of this paper might be as follows: Firstly, we will develop a comprehensive and systematic accounting framework for agricultural carbon emissions and carbon sinks. This framework considers both resource inputs and production activities, including emissions from rice cultivation, farmland soil management, livestock breeding, and the use of agricultural energy and chemicals. It also evaluates the carbon sink potential of major crops in China, aiming to provide a comprehensive reassessment of carbon sources and sinks in the agricultural system, addressing gaps in existing research. Secondly, we will analyze the exact agricultural emission status of carbon sources and sinks by combining historical data, summarizing the temporal structural changes and regional heterogeneity of agricultural carbon emissions. Thirdly, the paper aims to model different scenarios to simulate the carbon emissions and carbon sink trajectories of China’s agricultural sector from 2021 to 2050. It also analyzes the key factors that influence these trajectories to gain insights into the potential of agricultural systems to reduce emissions and increase carbon sinks. Furthermore, this study presents a methodology that may be utilized by other nations globally to quantify and forecast carbon emissions within the agriculture industry. In light of the accounting system and calculation methodology outlined in this paper, it is possible for other nations to derive historical carbon emission data for their respective agricultural sectors by integrating localized emission factors and data. Subsequently, various policy scenarios can be devised to forecast the evolving trajectory of carbon emissions through the utilization of the STIRPAT model. This approach proves valuable in comprehending the carbon emission status of their respective agricultural sectors and facilitating the achievement of low-carbon agricultural development.
The structure of this paper is arranged as follows: Section 2 outlines the process of establishing the accounting system for carbon emissions and carbon sinks in China’s agricultural sector. It also describes the research methods used for scenario simulation and provides details about the data sources and processing procedures. Section 3 provides an analysis of the results, which includes an examination of the current state of carbon emissions and carbon sinks in agriculture. It also presents a prediction of the potential for reducing emissions and increasing carbon sinks in the agricultural sector. Section 4 serves as the discussion section, by which the study findings are presented and the limitations and potential areas for further investigation are explored. Section 5 presents a summary of the conclusions reached in this paper and offers additional policy recommendations.

2. Materials and Methods

2.1. Agricultural Carbon Emissions and Carbon Sink Accounting System

2.1.1. Accounting for Agricultural Carbon Emissions

(1)
Paddy field planting
Rice fields are a major human-caused contributor to methane emissions. The process of methane release in rice fields is connected to three interconnected stages: methane production in the soil, reoxidation, and transmission of emissions. The emissions’ magnitude is affected by seasonal variations, annual fluctuations, and spatial heterogeneity [29]. Based on the methodological framework and foundational approaches suggested by IPCC, the calculation of methane emissions from rice fields is performed using the following equation. This equation involves multiplying the area of each type of rice field by their respective emission factors.
E M r i c e   f i e l d = i ( S i × F r i c e   f i e l d , i )
E M r i c e   f i e l d represents the aggregate amount of methane emissions from paddy fields. According to the planting season and growing period, paddy fields are divided into single season rice, double season early rice, and double season late rice. S i represents the measurement of various categories of rice paddy regions, F r i c e   f i e l d , i denotes diverse methane emission factors associated with rice field ecosystems. According to NDRC [26], the emission factor values refer to the average methane emission factors during different growing seasons across rice in different provinces, as shown in Table 1.
(2)
Farmland soil management
There are both direct and indirect emissions of nitrous oxide from agricultural land in the planting sector. Nitrogen inputs to agricultural land, such as chemical fertilizers, manure, and the return of straw to the field, are responsible for direct emissions. Nevertheless, in the context of agricultural production, the quantity of chemical fertilizer utilized surpasses that of manure. In addition, gathering data on manure application is challenging. Thus, only the emissions of N2O directly originating from agricultural land due to the use of nitrogen-containing fertilizers and the return of straw are taken into account. The calculation formula is as follows:
E N a g r i c u l t u r a l   l a n d , d i r e c t = N f e r t i l i z e r + N s t r a w × F a g r i c u l t u r a l   l a n d , d i r e c t
N f e r t i l i z e r = N n i t r o g e n o u s   f e r t i l i z e r + N C o m p o u n d   f e r t i l i z e r
N s t r a w = i C i e c i C i × s r r i × n c r i + C i e c i × r s r i × n c r i
E N a g r i c u l t u r a l   l a n d , d i r e c t indicates the direct emission of nitrous oxide from agricultural areas. N f e r t i l i z e r represents the input quantity of agricultural fertilizers, which includes the amount of nitrogen fertilizer and compound fertilizer applied. N s t r a w denotes the nitrogen returned to the field from straw, encompassing both above-ground straw nitrogen and below-ground root nitrogen. i represents the crop type, C i indicates the grain yield of different crops, e c i represents the economic coefficient of the crops, s r r i represents the straw return rate of different crops, n c r i represents the nitrogen content of the straw, and r s r i represents the root-to-shoot ratio. F a g r i c u l t u r a l   l a n d , d i r e c t   represents the direct emission factor for nitrous oxide from agricultural areas. The specific values of the relevant calculation parameters are referenced from the methods provided by Zhang et al. [30], IPCC and NDRC, as shown in Table 2 and Table 3.
Indirect emissions refer to nitrous oxide emissions caused by atmospheric nitrogen deposition from the volatilization of nitrogen oxides and ammonia in fertilized soils and livestock manure, as well as from nitrous oxide emissions due to nitrogen leaching or runoff losses entering water bodies. The calculation formula is as follows:
E N a g r i c u l t u r a l   l a n d , i n d i r e c t = E N a g r i c u l t u r a l   l a n d , i n d i r e c t , s e d i m e n t a t i o n + E N a g r i c u l t u r a l   l a n d , i n d i r e c t , l e a c h i n g
E N a g r i c u l t u r a l   l a n d , i n d i r e c t , s e d i m e n t a t i o n = N f e r t i l i z e r + N s t r a w × 10 % + N l i v e s t o c k × 20 % × F a g r i c u l t u r a l   l a n d , i n d i r e c t , s e d i m e n t a t i o n
N l i v e s t o c k = i S i × e x c i × n c i
E N a g r i c u l t u r a l   l a n d , i n d i r e c t , l e a c h i n g = N f e r t i l i z e r + N s t r a w × 20 % × F a g r i c u l t u r a l   l a n d , i n d i r e c t , l e a c h i n g
E N a g r i c u l t u r a l   l a n d ,   i n d i r e c t denotes the indirect emission of nitrous oxide from agricultural land, which mainly derives from atmospheric nitrogen deposition and leaching. N l i v e s t o c k represents nitrogen input from livestock and poultry manure. i denotes the animal type. In this paper, the nitrogen resources in livestock manure are represented by the product of the number of different animal types S i and the unit excretion amount e x c i along with their nitrogen content n c i . The data for different types of excretion and nitrogen content are sourced from Liu et al. [31], as shown in Table 4. When calculating the emissions caused by atmospheric nitrogen deposition, we applied a volatilization rate of 10% for nitrogen inputs from both fertilizer and straw applications, and an identical rate of 10% for nitrogen inputs from livestock and poultry manure. The emission factor   F a g r i c u l t u r a l   l a n d , i n d i r e c t , s e d i m e n t a t i o n adopted a default value of 0.01, as recommended by IPCC. The indirect nitrous oxide emissions from nitrogen leaching and runoff in farmland are denoted as E N a g r i c u l t u r a l   l a n d , i n d i r e c t , l e a c h i n g . The amount of nitrogen leaching and runoff is estimated to be 20% of the total nitrogen input to agricultural land. The emission factor F a g r i c u l t u r a l   l a n d , i n d i r e c t , l e a c h i n g is taken from the default value by IPCC, which is 0.0075.
(3)
Livestock and poultry breeding
① Methane emission from animal intestinal fermentation
Animal enteric fermentation results in the production of methane as a byproduct of the normal metabolic process. This occurs when microorganisms in the animal’s digestive tract ferment the feed that is present within the digestive tract. Enteric fermentation methane emissions specifically refer to the methane released through the animal’s mouth, nose, and rectum, while excluding methane emissions from manure. To calculate the methane emissions from enteric fermentation in different animals, one must multiply the number of animals by the corresponding emission factor. The total emissions can be obtained by summing the emissions from all types of animals. The calculation formula is as follows:
E M i n t e s t i n a l   f e r m e n t a t i o n   i n   a n i m a l s = i ( S i × F i n t e s t i n a l   f e r m e n t a t i o n   i n   a n i m a l s , i )
E M i n t e s t i n a l   f e r m e n t a t i o n   i n   a n i m a l s stands for methane emissions resulting from the intestinal fermentation of animals. The variable i represents diverse animal species. By integrating statistical data with the current state of animal husbandry in China, the sources of methane emissions from intestinal fermentation have been identified to include dairy cows, non-dairy cows, buffalo, Mianyang breeds of sheep, goats, pigs, horses, donkeys, mules, and camels, among others. According to NDRC [26], the corresponding factors influencing methane emissions from intestinal fermentation F i n t e s t i n a l   f e r m e n t a t i o n   i n   a n i m a l s , i are presented in Table 5.
② Methane and Nitrous Oxide Emissions from Animal Manure Management
The emissions of methane and nitrous oxide from animal manure management pertain to the release of these gases during the storage and treatment of animal manure prior to its application to the soil. To calculate the emissions from various methods of managing animal manure, multiply the number of animals by the corresponding emission factors. Then, add up the emissions from all types of animals to determine the total emissions. The calculation formula is as follows:
E M a n i m a l   m a n u r e   m a n a g e m e n t = i ( S i × F a n i m a l   m a n u r e   m a n a g e m e n t , C H 4 , i )
E N a n i m a l   m a n u r e   m a n a g e m e n t = i ( S i × F a n i m a l   m a n u r e   m a n a g e m e n t , N 2 O , i )
E M a n i m a l   m a n u r e   m a n a g e m e n t represents methane emissions caused by animal manure management, and E N a n i m a l   m a n u r e   m a n a g e m e n t represents nitrous oxide emissions caused by animal manure management, according to the livestock and poultry breeding situation in each province and the availability of statistical data. The sources of greenhouse gas emissions from animal manure management are identified as dairy cows, non-dairy cows, buffalo, sheep, goats, pigs, horses, donkeys, mules, camels, poultry, etc. The corresponding fecal management methane and nitrous oxide emission factors are F a n i m a l   m a n u r e   m a n a g e m e n t , C H 4 , i and F a n i m a l   m a n u r e   m a n a g e m e n t , N 2 O , i , as shown in Table 6.
(4)
Input of agricultural energy and chemicals
The energy employed in agricultural production activities is a significant source of agricultural greenhouse gas emissions [32], primarily consisting of diesel, coal, and electricity. Among these, electricity can be determined by converting its consumption into an equivalent amount of coal usage based on the proportion of thermal power generation. Following the IPCC methodology, CO2 emissions from fossil energy sources in agriculture are calculated using the following formula:
E C a g r i c u l t u r a l   f o s s i l   f u e l s = i A C i × c f i × c c e i × 10 3 N C C i × c o f i × 44 12
E C a g r i c u l t u r a l   f o s s i l   f u e l s denotes the carbon dioxide emissions caused by the use of fossil energy in agricultural activities. The variable i represents the types of fossil energy, which are respectively diesel, raw coal, and coal for thermal power. A C i refers to the apparent consumption of various types of energy. The apparent consumption of diesel and raw coal can be directly inferred from the final consumption in the agricultural sector. However, the apparent consumption of coal specifically for thermal power generation requires a more detailed calculation, which takes into account the electricity consumption in agriculture A E C , the proportion of thermal power generation in the energy mix p t g , and the coal consumption associated with power production c c p . The proportion of thermal power generation across different provinces is sourced from the China Energy Statistical Yearbook, while the coal consumption for power supply is obtained from the national power industry statistics released by the National Energy Administration. The calculation formula is as follows:
A C c o a l   f o r   t h e r m a l   p o w e r = A E C × p t g × c c p × 10 2
c f i indicates the conversion factor, which converts the apparent consumption of energy to energy units based on net calorific value. c c e i represents the carbon content per unit calorific value of energy, indicating the carbon content per unit of energy consumed. N C C i stands for non-combustion carbon, referring to carbon used for raw materials and non-energy purposes, which is not relevant in the context of agricultural production. c o f i indicates the carbon oxidation factor, representing the proportion of carbon that is oxidized. According to IPCC [25], NDRC [26], and the General Principles for Calculation of Comprehensive Energy Consumption of China (GB/T 2589-2020), the values for the various coefficients required for the calculations are listed in Table 7.
Additionally, apart from fertilizers, agricultural production activities also involve the use of other chemical products such as pesticides and agricultural films. Therefore, the resulting carbon dioxide emissions must also be included in the sources of agricultural greenhouse gas emissions. The calculation formula is as follows:
E C c h e m i c a l   i n p u t s = i C I i × F c h e m i c a l   i n p u t , i × 44 12
E C c h e m i c a l   i n p u t s represents the carbon dioxide emissions resulting from the input of chemicals. CI i indicates the amount of chemical input, including the usage of pesticides and agricultural films. F c h e m i c a l   i n p u t , i refers to the emission factor for chemical inputs, where the emission factor for pesticides is 4.934 kg/kg, as provided by the Oak Ridge National Laboratory (Oak Ridge, TN, USA) [33]. The emission factor for agricultural films is 5.18 kg/kg, as provided by the Institute of Agricultural Resources and Environment, Nanjing Agricultural University [34].

2.1.2. Accounting for Agricultural Carbon Sinks

This paper specifically examines the carbon absorption that occurs during the entire lifecycle of crop growth, known as agricultural carbon sinks. It excludes the carbon sinks related to forestland, grassland, and forestry products, as these are influenced by land use changes and have minimal connection to agricultural production activities. Agricultural carbon sinks refer to the net primary production that is formed through photosynthesis during the crop growth period. Net primary production refers to the difference between the total organic matter produced by photosynthesis of autotrophic organisms and respiration [35]. Drawing on the research by Tian and Zhang [36], the calculation formula for agricultural carbon sinks is as follows:
S C c r o p p e r = i c a r i × E O i × 1 w c i e c i
S C c r o p p e r represents the carbon absorption of crops, E O i refers to the economic yield of crops, and i indicates the crop type, which is consistent with the scope used for calculating straw return nitrogen. The focus remains on crops such as rice, wheat, corn, sorghum, soybeans, oil crops, hemp, tubers, vegetables, and tobacco. c a r i denotes the carbon absorption rate, w c i represents the moisture content of the crops, with values referenced from the studies by Wang [37] and Han et al. [38], as shown in Table 8. e c i indicates the economic coefficient of various crops, with values available in Table 3.

2.2. Agricultural Carbon Emissions and Carbon Sinks Scenario Prediction Model

The STIRPAT model can be used to reveal the effects of various factors such as population, socio-economics, and technology on carbon emissions [39,40,41], and it can serve as a predictive tool for carbon emissions to further analyze the potential for emission reduction and carbon sink increase [42,43,44,45]. The basic model of STIRPAT is
I = a P b A C T d ε
Take logarithms on both sides of the equation to obtain the following linear model:
l n I = a + b l n P + c l n A + d l n T + ε
In the model, I , P , A , and T represent environmental impact, population, economic development, and technological progress indicators, respectively; b , c , and d are the coefficients for the driving factors of population, economy, and technology, while a is the constant term, and ε is the error term. According to Jiang et al. and Zhang et al. [27,46], to study the influencing factors of emissions and carbon sinks in China’s agricultural sector, this paper extended model (2) by introducing the levels of urbanization and industrial structure, resulting in the following model:
l n I E C = a + b l n P + c l n A + d l n T + e l n R P + f l n A O + ε
l n I S C = a + b l n P + c l n A + d l n T + e l n R P + f l n A O + ε
In this study, I E C specifically refers to the carbon emission of the agricultural sector (Mt CO2 e), and I SC refers to the carbon sink of the agricultural sector (Mt CO2 e), which reflects the environmental situation. The driving factors of the model include P , A , T , R P , and A O , where P represents the total population (10,000 people) and reflects the population size. A stands for per capita GDP (yuan/person), reflecting the level of economic development. T stands for agricultural carbon emission intensity (t CO2 e/10,000 yuan), reflecting the agricultural technology level; R P is the rural population (10,000 people), reflecting the level of urbanization; A O is the gross output value of agriculture, forestry, animal husbandry, and fishery (CNY 100 million), indicating the scale of agricultural development.
This paper analyses the changing trend of China’s total population and rural population based on the forecast value provided by the World Bank. It also establishes three levels of growth (low, medium, and high) for per capita GDP, agricultural carbon emission intensity, and total output value of agriculture, forestry, animal husbandry, and fishery from 2021 to 2050, using historical data. Refer to Table 9 for the growth level configuration of various factors. The STIRPAT model was applied to analyze the data from 2000 to 2020, and the resulting fitting outcomes were employed as the reference model to forecast the carbon emissions and carbon sinks of the agricultural sectors in China from 2021 to 2050.

2.3. Data Source and Processing

The data about the cultivation area of single-season rice, early double-season rice, and late double-season rice were obtained from the China Agricultural Yearbook and the China Agricultural Statistics. The China Rural Statistical Yearbook provided data on crop yields, nitrogen fertilizer application, compound fertilizers, pesticide use, and agricultural film usage. The livestock inventory data were obtained from the China Animal Husbandry and Veterinary Yearbook. The energy consumption figures for diesel, raw coal, and coal used in agricultural thermal power generation were obtained from the China Energy Statistical Yearbook. The China Statistical Yearbook provided statistics on the total population, total production value of agriculture, forestry, animal husbandry, and fishing, as well as per capita GDP. The China Rural Statistical Yearbook was used to acquire rural population data from 1996 to 2021. The data covers the period from 1995 to 2020. However, there is no separate accounting data available for Chongqing for the years 1995–1996, as it only became an independent administrative region in 1997.
To facilitate analysis and comparison, it is essential to convert all greenhouse gas emissions, including methane, nitrous oxide, and carbon dioxide, into carbon dioxide equivalents. The conversion procedure is as outlined below:
C O 2   e = i G E i × G W P i
C O 2   e refers to the converted carbon dioxide equivalent emissions, G E i refers to the emissions of various greenhouse gases, and G W P i represents the global warming potential. For the agricultural system, the types of greenhouse gases emitted include methane, nitrous oxide, and carbon dioxide. According to the IPCC [47], the global warming potential of methane is 25, that of nitrous oxide is 298, and that of carbon dioxide is 1.

3. Results Analysis

3.1. Analysis of the Current Status of Agricultural Carbon Emissions and Carbon Sinks

3.1.1. Analysis of Temporal Characteristics

Changes in carbon emissions, carbon sinks, and total net emissions in China’s agricultural sector from 1995 to 2020 are presented in Table 10 and Figure 1. Overall, carbon emissions in China’s agricultural sector have remained relatively stable, following an “M” pattern with two peaks: one in 2006 at 1081.7 Mt CO2 e and another in 2015 at 1055.2 Mt CO2 e, representing increases of 16.4% and 13.6% from 929.2 Mt CO2 e in 1995, respectively. In 2007, avian influenza significantly impacted livestock production, causing a drop in agricultural carbon emissions. However, emissions resumed their upward trend from 2008 to 2015. In 2016, the government introduced several ecological protection policies for the agricultural environment, such as the zero growth policy for chemical fertilizers and pesticides, and subsidies for farmland protection and quality improvement, which led to a secondary decline in agricultural carbon emissions. Despite a slight increase to 970.9 Mt CO2 e in 2020 due to the pandemic, emissions were still 8.0% lower than in 2015.
In contrast, agricultural carbon sinks showed a fluctuating but overall increasing trend, rising from 414.5 Mt CO2 e in 1995 to 654.7 Mt CO2 e in 2020, a 57.9% increase. The net carbon emissions of China’s agricultural sector, influenced by both carbon sources and sinks, followed an “inverted V-shaped” pattern and can be divided into two phases: from 1995 to 2006, net carbon emissions increased with agricultural carbon sinks growing at a slightly slower rate than carbon sources; from 2007 to 2020, net carbon emissions decreased, with carbon sinks surpassing half of the carbon emissions during this period. By 2020, agricultural carbon sinks accounted for 67.4% of carbon sources.
Figure 2 illustrates the types and structural changes in greenhouse gas emissions from China’s agricultural sector between 1995 and 2020. Methane has consistently been a significant greenhouse gas emitted by this sector, although its share has declined from 62.6% in 1995 to 50.3% in 2020. Conversely, the proportion of carbon dioxide emissions has increased from 15.2% in 1995 to 24.0% in 2020. The share of nitrous oxide emissions has remained relatively stable, accounting for about a quarter of the total agricultural carbon emissions over the years.
Among different types of carbon sources, livestock and poultry farming has been the largest contributor to agricultural greenhouse gases. However, its share has decreased from 53.7% in 1995 to 41.8% in 2020, with some fluctuations over the years. Additionally, the share of emissions from rice planting has also decreased by 2020 compared to the base period. In contrast, the share of emissions from agricultural land and the use of agricultural energy and chemicals has risen from 12.9% and 15.2% to 17.8% and 24.0%, respectively. Notably, after 2006, increased agricultural productivity and grain output led to a continuous rise in related carbon emissions. By 2016, emissions from farmland soil management and agricultural energy and chemical inputs had surpassed those from livestock and poultry farming, becoming the leading sources of agricultural carbon emissions.

3.1.2. Analysis of Regional Heterogeneity

The regional differences in agricultural carbon emissions and carbon sinks are pronounced, with the structure of carbon emission sources in each region closely linked to local development characteristics. Table 11 presents the cumulative carbon emissions and carbon sinks of China’s agricultural sectors from 1995 to 2020. Regionally, central and south China have the highest cumulative carbon emissions, followed by east China. These two areas also lead in cumulative carbon sinks, whereas northwest China ranks lowest in both emissions and sinks.
Provincially, the top ten provinces for cumulative carbon emissions from 1995 to 2020 are Henan, Hunan, Shandong, Sichuan, Hubei, Guangxi, Guangdong, Anhui, Jiangsu, and Hebei, each exceeding 1000 Mt CO2 e. Shanghai has the smallest cumulative carbon emissions. The top ten provinces for cumulative carbon sequestration are Henan, Shandong, Heilongjiang, Hebei, Jiangsu, Anhui, Sichuan, Jilin, Hunan, and Hubei, with Tibet having the smallest cumulative carbon sequestration. Notably, Liaoning, Hebei, Shandong, Jilin, Inner Mongolia, Jiangxi, Hunan, Sichuan, Henan, Hubei, Jiangsu, Anhui, and Heilongjiang are all major grain-producing areas with leading grain output levels. Consequently, these provinces have higher carbon emissions due to agricultural production activities. However, due to the carbon sequestration by crops, they also have substantial accumulated agricultural carbon sinks, offsetting some of the emissions. Guangdong and Guangxi have high cumulative agricultural carbon emissions, driven by rice planting and livestock breeding, but their carbon sink functions are limited. Recent efforts to prevent pollution from animal husbandry and reduce rice planting areas have led to a downward trend in carbon emissions in these provinces. Beijing, Tianjin, Shanghai, Ningxia, Hainan, Qinghai, and Tibet have low cumulative agricultural carbon emissions and carbon sinks. As municipalities directly under the central government, Beijing, Tianjin, and Shanghai have a relatively small proportion of agricultural output. In Ningxia, Hainan, Qinghai, and Tibet, land resource constraints limit agricultural development, resulting in lower agricultural carbon emissions and sequestration.
Based on the differences in carbon emissions and carbon sinks, China’s 31 provinces can be categorized into five types (see Table 12). Carbon sink-dominated regions, where accumulated carbon sinks account for more than 60% of accumulated carbon emissions, include Hebei, Shanxi, Liaoning, Jilin, Heilongjiang, Jiangsu, Anhui, Shandong, Henan, and Shaanxi, all of which have significant carbon sinks. Paddy planting-dominated regions, with cumulative carbon sinks less than 60% of carbon emissions and paddy planting accounting for more than 40% of total agricultural carbon emissions, are represented solely by Jiangxi Province. Livestock farming-dominated regions, where cumulative carbon sinks are less than 60% of carbon emissions and livestock and poultry breeding account for more than 40% of total agricultural carbon emissions, include Inner Mongolia, Guangxi, Chongqing, Sichuan, Guizhou, Yunnan, Tibet, Gansu, Qinghai, Ningxia, and Xinjiang. Resource inputs-dominated regions, with cumulative carbon sinks less than 60% of carbon emissions and agricultural energy and chemical inputs accounting for more than 40% of total agricultural carbon emissions, include Beijing, Tianjin, Shanghai, and Zhejiang, where high inputs of energy, pesticides, agricultural films, and other chemicals lead to increased carbon emissions. Composite factor-dominated regions, with cumulative carbon sinks less than 60% of carbon emissions and no single type of carbon source accounting for more than 40% of total agricultural carbon emissions, include Fujian, Hubei, Hunan, Guangdong, and Hainan. In these regions, emissions from rice planting, farmland soil management, livestock and poultry breeding, and agricultural energy and chemical inputs are relatively balanced, reflecting a balanced development of various agricultural activities.

3.2. Prediction of Emission Reduction and Carbon Sink Increase Potential in the Agricultural Sector

To further analyze the emission reduction and carbon sink increase potential in China’s agricultural sector, this paper employs the STIRPAT model to decompose carbon emissions and carbon sinks. The study integrates panel data from 1995 to 2020, encompassing agricultural carbon emissions and carbon sinks, total population, per capita GDP, agricultural carbon intensity, rural population, and the total output value of agriculture, forestry, animal husbandry, and fishery across various provinces and cities in China. These comprehensive data are used to assess the impact of variables such as population, economy, and technology on carbon emissions and carbon sinks in the agricultural sector.
To eliminate the multicollinearity effect in the model, the study references Zhu et al. [48] and employs ridge regression to estimate models (3) and (4), selecting an appropriate k value. The results are presented in Table 13. Population factors have a significant positive impact on agricultural carbon emissions but no significant impact on carbon sinks. Per capita GDP has a clear inhibitory effect on agricultural carbon sinks but little effect on carbon emissions. The impact of carbon intensity on agricultural carbon emissions is opposite to its impact on carbon sinks; reducing carbon intensity significantly lowers carbon emissions and increases carbon sinks. The scale of the agricultural population and the total output value of agriculture, forestry, animal husbandry, and fishery positively affect both carbon emissions and carbon sinks. Among these, the scale of the agricultural population has a greater positive impact on carbon sinks, while the total output value of agriculture, forestry, animal husbandry, and fishery has a more substantial positive impact on carbon emissions.
The influencing factors of agricultural carbon emissions vary slightly across different types of regions, as detailed in Table 14. In regions dominated by carbon sinks, livestock farming, resource inputs, and composite factors, an increase in total population and rural population scale significantly raises agricultural carbon emissions. However, such increases have no significant impact on regions dominated by rice planting. The level of GDP per capita exerts a significant influence only on livestock farming-dominated regions and resource inputs-dominated regions, with opposite effects; it stimulates emissions in livestock farming-dominated regions but inhibits emissions in resource inputs-dominated regions. Additionally, the intensity of agricultural carbon emissions and the total output value of agriculture, forestry, animal husbandry, and fishery significantly contribute to agricultural carbon emissions across all regions. Therefore, actively developing emission reduction technologies and reducing the intensity of agricultural carbon emissions are crucial steps to accelerate the decoupling of agricultural economy from carbon emissions.
Based on the above regression results, predictions are made for the future carbon emissions and carbon sinks of China’s agricultural sectors. Considering the varying directions and degrees of influence from different factors, growth levels are set according to the model’s influencing factors, resulting in three scenarios: baseline, carbon emission reduction-oriented scenario, and carbon sink increase-oriented scenario. Specific settings are detailed in Table 15. Under the baseline scenario, it is assumed that economic development, agricultural technology, and agricultural development maintain moderate average growth levels. Per capita GDP, agricultural carbon intensity, and the total output value of agriculture, forestry, animal husbandry, and fishery have negative, positive, and positive impacts on agricultural carbon emissions, and negative, negative, and positive impacts on agricultural carbon sinks, respectively. Therefore, to reduce agricultural emissions and increase agricultural carbon sinks as much as possible, the carbon emission reduction-oriented scenario sets economic development at a high growth level, agricultural technology at a high growth level, and agricultural development at a low growth level. Conversely, the carbon sink increase-oriented scenario sets economic development, agricultural technology, and agricultural development at low, high, and high growth levels, respectively.
The forecast results for carbon emissions and carbon sinks in China’s agricultural sector from 2021 to 2050 are shown in Figure 3 and Figure 4. Under the baseline scenario, the carbon emission reduction-oriented scenario, and the carbon sink increase-oriented scenario, agricultural carbon emissions in China are all projected to decline by 4.5%, 21.3%, and 7.1%, respectively, compared to the initial levels in 2020. In the baseline scenario, agricultural carbon sinks first decrease and then increase, showing a slight decline of about 1.2% by 2050. In the carbon emission reduction-oriented scenario, agricultural carbon sinks in China will decrease by 14.5% by 2050. Only in the carbon sink increase-oriented scenario will agricultural carbon sinks increase significantly, rising by 18.9% compared to the initial levels. Compared with the baseline scenario, the carbon emission reduction potential of the carbon emission reduction-oriented scenario will increase by 17.6%, while its carbon sink increase potential will decrease by 13.5%. Meanwhile, the carbon emission reduction potential under the carbon sink increase-oriented scenario will increase by 7.1%, and its carbon sink increase potential will rise by 18.9%.
Overall, Table 16 presents the carbon emissions, carbon sinks, and net carbon emissions of China’s agricultural sectors for the years 2025, 2030, 2035, 2040, 2045, and 2050. Using the baseline scenario as a reference, both the carbon emission reduction-oriented scenario and the carbon sink increase-oriented scenario exhibit higher potential for emission reduction and carbon sink increase than the baseline scenario. Notably, the net emissions under the emission reduction-oriented scenario are significantly lower than those of the baseline and carbon sink increase-oriented scenarios before 2045, indicating substantial emission reduction potential. After 2045, the carbon sink increase-oriented scenario shows a greater effect, resulting in the lowest net carbon emissions in the agricultural sector.
Comparing the two scenarios, it becomes evident that maintaining a high growth level in agricultural technology is crucial for reducing carbon emissions and promoting carbon neutrality in China’s agricultural sector. To fully harness the potential for emission reduction before 2045, it is essential to control the expansion speed of agricultural development while fostering economic growth. Post-2045, emphasis should shift to actively developing agricultural carbon sinks.
Therefore, to realize the full potential of emission reduction and carbon sink increase in agriculture, continuous innovation in various agricultural technologies is necessary. This involves reducing agricultural carbon intensity, optimizing industrial structures, and ensuring agriculture can sustain a timely growth rate that aligns with the requirements of the new economic normal and high-quality development.

4. Discussion

Research on the accounting of agricultural carbon emissions in China has been conducted in the past, but the majority of these studies have flaws, including inadequate uniformity of emission coefficients, unscientific accounting methods, and an incomplete accounting scope, which cause significant variations in accounting outcomes. For instance, Zhang et al. account for the carbon emissions of China’s agricultural sector in 2019 based on the use of chemical fertilizers, pesticides, agricultural films, diesel oil, ploughing, and irrigation. Only factor inputs are taken into account; greenhouse gas emissions resulting from agricultural production processes are not taken into consideration. According to accounting data, the agriculture sector’s carbon emissions in 2019 amounted to 79.90 million tons. After being converted into standard carbon dioxide, the result was 292.96 Mt CO2 e [49]. Yu and Mao conducted an analysis of agricultural carbon sources, focusing on three separate perspectives: carbon emissions derived from paddy fields, carbon emissions pertaining to agricultural land use, and carbon emissions associated with livestock and poultry husbandry. Nevertheless, the authors failed to take into account the emissions that may be causally linked to soil management practices in agricultural fields. The method they used for calculating was based on emission coefficients obtained from existing literature, without taking into account the accounting methodologies and emission factors provided by the IPCC and the NDRC. The results of the study indicate that in 2019, China’s agriculture sector contributed to a total of 308.38 million tons of carbon emissions, leading to a subsequent estimate of 1130.74 Mt CO2 e [50]. Tian and Yin conducted a comprehensive analysis of carbon emissions from four distinct perspectives: agricultural energy use, agricultural inputs, rice cultivation, and livestock and poultry farming. The accounting approach employed in their study was relatively simplified, as it did not fully incorporate the methodologies recommended by the IPCC and the NDRC. The findings of their accounting analysis revealed that the carbon emissions originating from the agricultural sector in 2019 amounted to 940.67 Mt CO2 e [51]. This paper presents an analysis of carbon sources, specifically focusing on rice cultivation carbon emissions, farmland soil management carbon emissions, livestock and poultry farming carbon emissions, and agricultural energy and chemical inputs carbon emissions. The accounting employed in this paper incorporates the methodologies of the IPCC and the NDRC. The findings of the accounting indicate that the carbon emissions from the agricultural sector in 2019 amounted to 938.6 Mt CO2 e, aligning with the values reported in the study conducted by Tian and Yin [51].
This paper presents the development of a comprehensive accounting system for carbon emissions and sinks in China’s agricultural sector from 1995 to 2020. The system takes into account both production activities and factor inputs, employing a systematic and scientific approach. The STIRPAT model is employed to generate a plausible forecast of emissions spanning the period from 2021 to 2050. The empirical findings indicate that carbon emissions originating from China’s agriculture sector exhibited variability throughout the duration of the study spanning from 1995 to 2020. Subsequently, there was a reduction in emissions after 2006, aligning with the conclusions drawn by Zhang et al. [27] and Tian and Chen [52]. Furthermore, a further decrease was observed subsequent to 2015, hence corroborating the findings of Yang et al. [53] regarding the trajectory of carbon emissions in the agriculture sector. Upon conducting a comprehensive analysis of the factors that influence carbon emissions in the agricultural sector, this study reveals that enhancing the level of agricultural technology can effectively mitigate carbon emissions in this sector. This finding aligns with the conclusions drawn by Yang [54] and Ma et al. [55]. Furthermore, this study also posits that the agricultural sector’s capacity to serve as a carbon sink will progressively exhibit significant promise beyond the year 2045. This suggests that greater emphasis should be placed on the collection and safeguarding of carbon sinks during the subsequent phases of agricultural advancement. This perspective aligns with the outlook presented by Tian and Cai [56].
This study serves as a significant scholarly resource for comprehending the current state of carbon emissions originating from the agricultural sector across different regions in China. Additionally, it offers insights into the agricultural sector’s capacity to mitigate emissions and enhance carbon sinks in the forthcoming years. Nevertheless, it is important to acknowledge that there remains potential for enhancement in this scholarly article. One limitation arises from the restricted availability of data, which hinders the acquisition of comprehensive emission coefficients or activity data. This includes the emission coefficients associated with various fertilizers, the utilization of diverse pesticide treatments, and other relevant factors. Conversely, the STIRPAT model employed in this study exhibits various constraints and difficulties in forecasting carbon emissions originating from the agriculture industry, despite its capacity to completely consider variables such as demography, economy, and technological advancements. The STIRPAT model operates under the assumption of a linear or logarithmic association among the factors. However, it is important to acknowledge that the determinants of agricultural carbon emissions in real-world scenarios may exhibit greater complexity, encompassing nonlinear interactions and delayed dynamics. Consequently, these factors may introduce certain biases into the ultimate prediction outcomes. Future research endeavors may take into account the acquisition of more comprehensive emission components and activity data utilizing other methodologies such as field experiments or field research, as well as the exploration and utilization of different prediction models to enhance the scientific rigor and precision of agricultural carbon emission predictions.

5. Conclusions and Enlightenments

This paper recalculated the carbon emissions and carbon sinks of China’s agricultural sector from 1995 to 2020, and then used the STIRPAT model to reveal the impacts of factors such as population, economy, and technology on agricultural carbon emissions and sinks. It also conducted different scenario predictions for agricultural carbon emissions and sinks from 2021 to 2050 by designing various scenario combinations. The main conclusions are as follows:
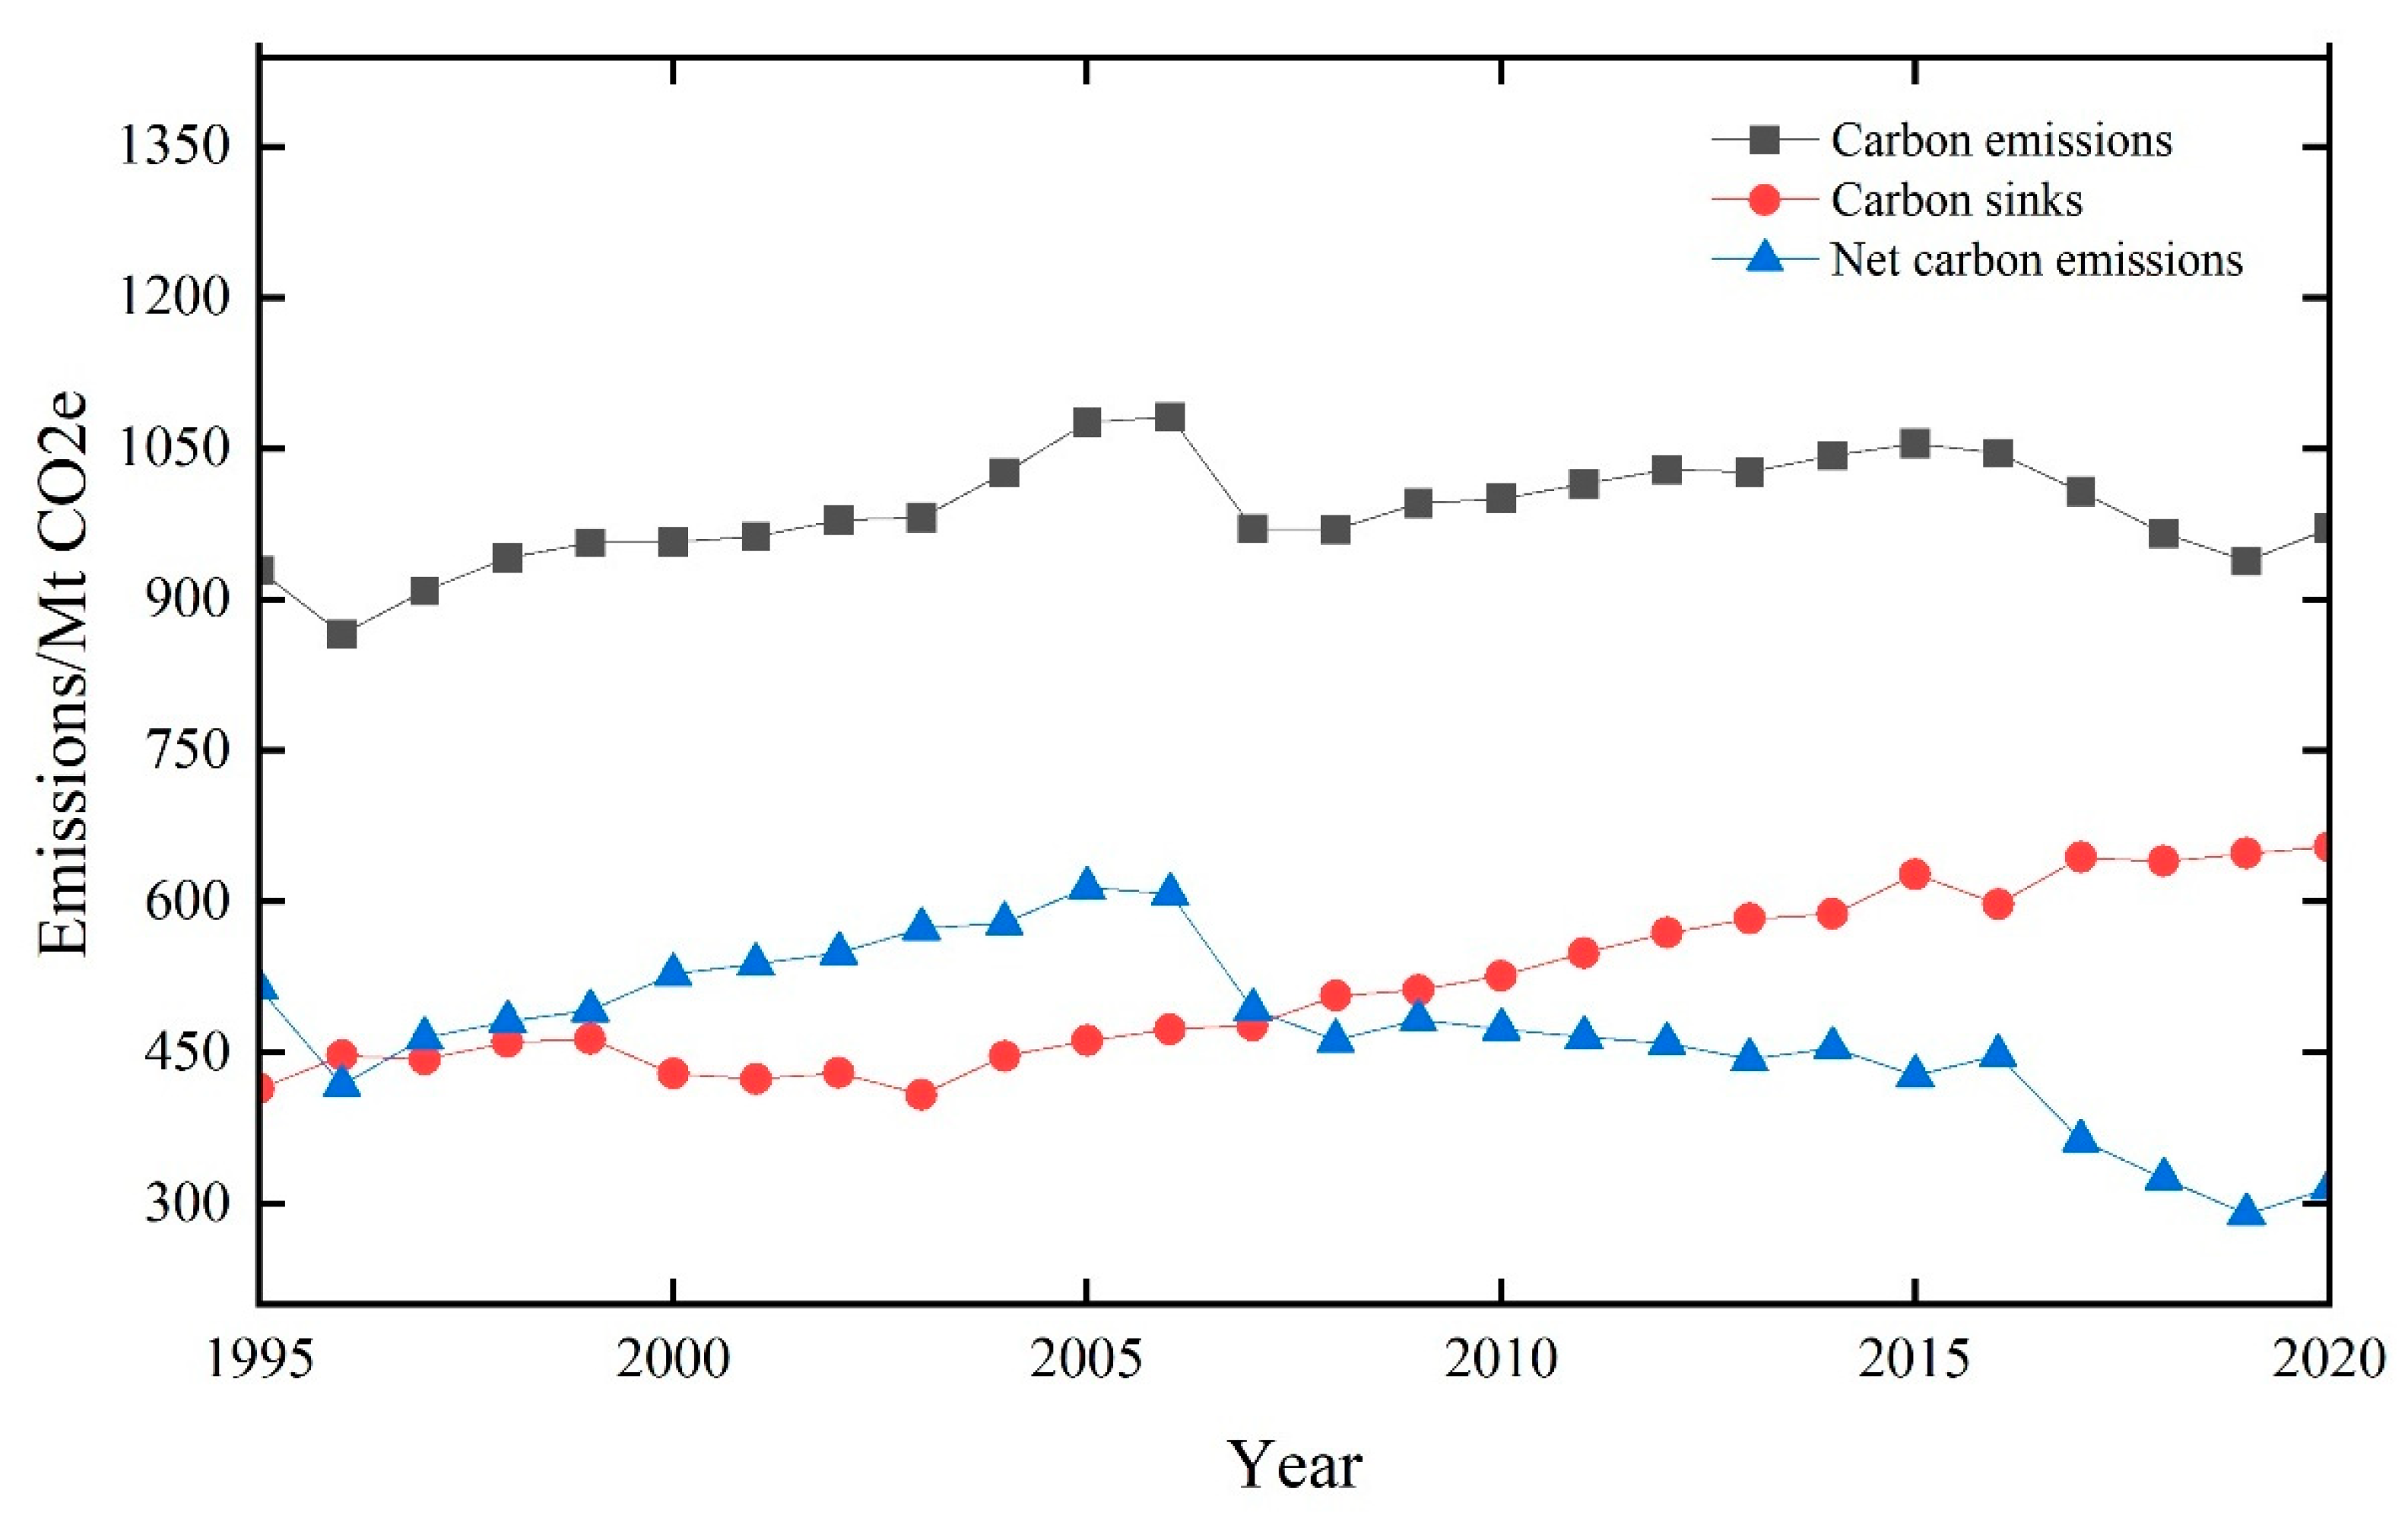
  • From 1995 to 2020, carbon emissions in China’s agricultural sector exhibited an “M”-shaped trend, with two peaks in 2006 and 2015, reaching 1081.7 Mt CO2 e and 1055.2 Mt CO2 e, respectively. Meanwhile, agricultural carbon sinks showed a fluctuating but overall increasing trend, rising from 414.5 Mt CO2 e in 1995 to 654.7 Mt CO2 e in 2020.
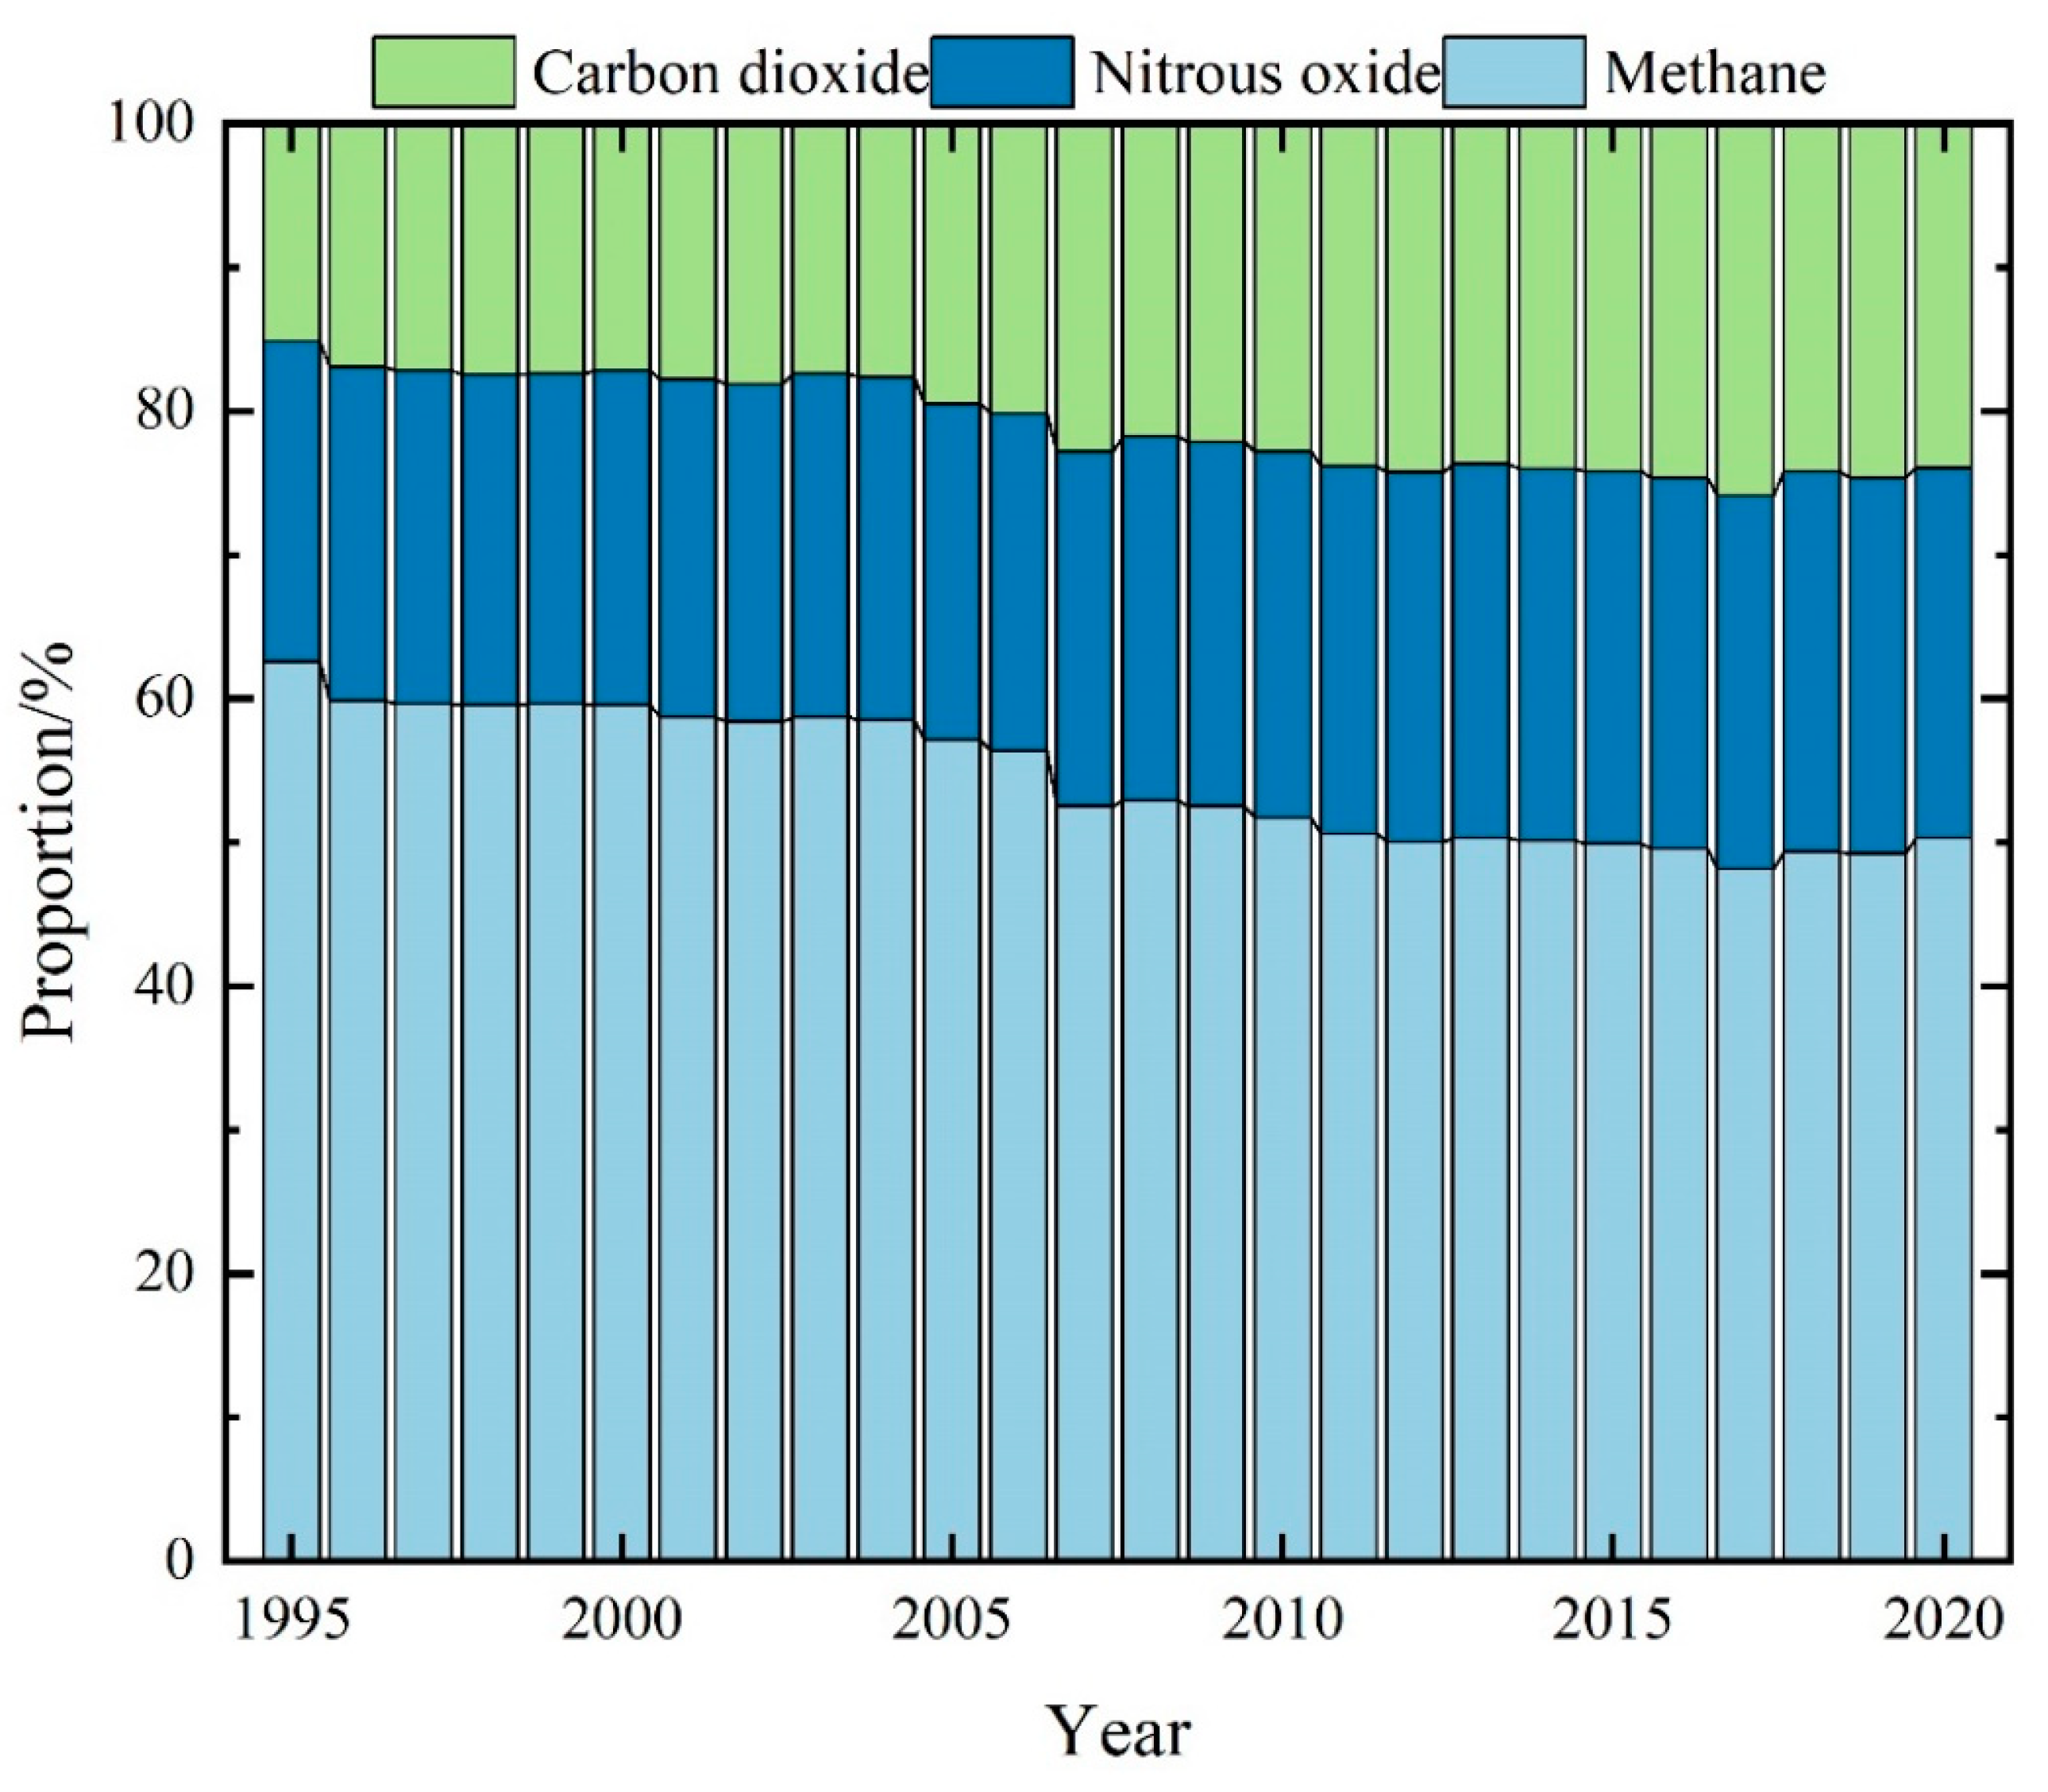
  • Livestock farming was the largest source of agricultural carbon emissions, although its share has been decreasing. Conversely, the share of emissions from agricultural energy, chemical inputs, and farmland soil management has been increasing, surpassing livestock farming as the dominant agricultural carbon source after 2016.
  • There are significant regional differences in the structure of agricultural carbon emissions and sinks across China. Based on these distinctions, China’s 31 provinces can be classified into five types: carbon sink-dominated regions, rice planting-dominated regions, livestock farming-dominated regions, resource inputs-dominated regions, and regions dominated by a combination of factors.
  • The level of agricultural technology and the scale of agricultural development are the main factors affecting agricultural carbon emissions and sinks in China. A 1% decrease in agricultural carbon intensity could result in a 0.72% reduction in agricultural carbon emissions, while a 1% increase in the total output value of agriculture, forestry, animal husbandry, and fisheries leads to 0.51% increase in agricultural carbon sinks.
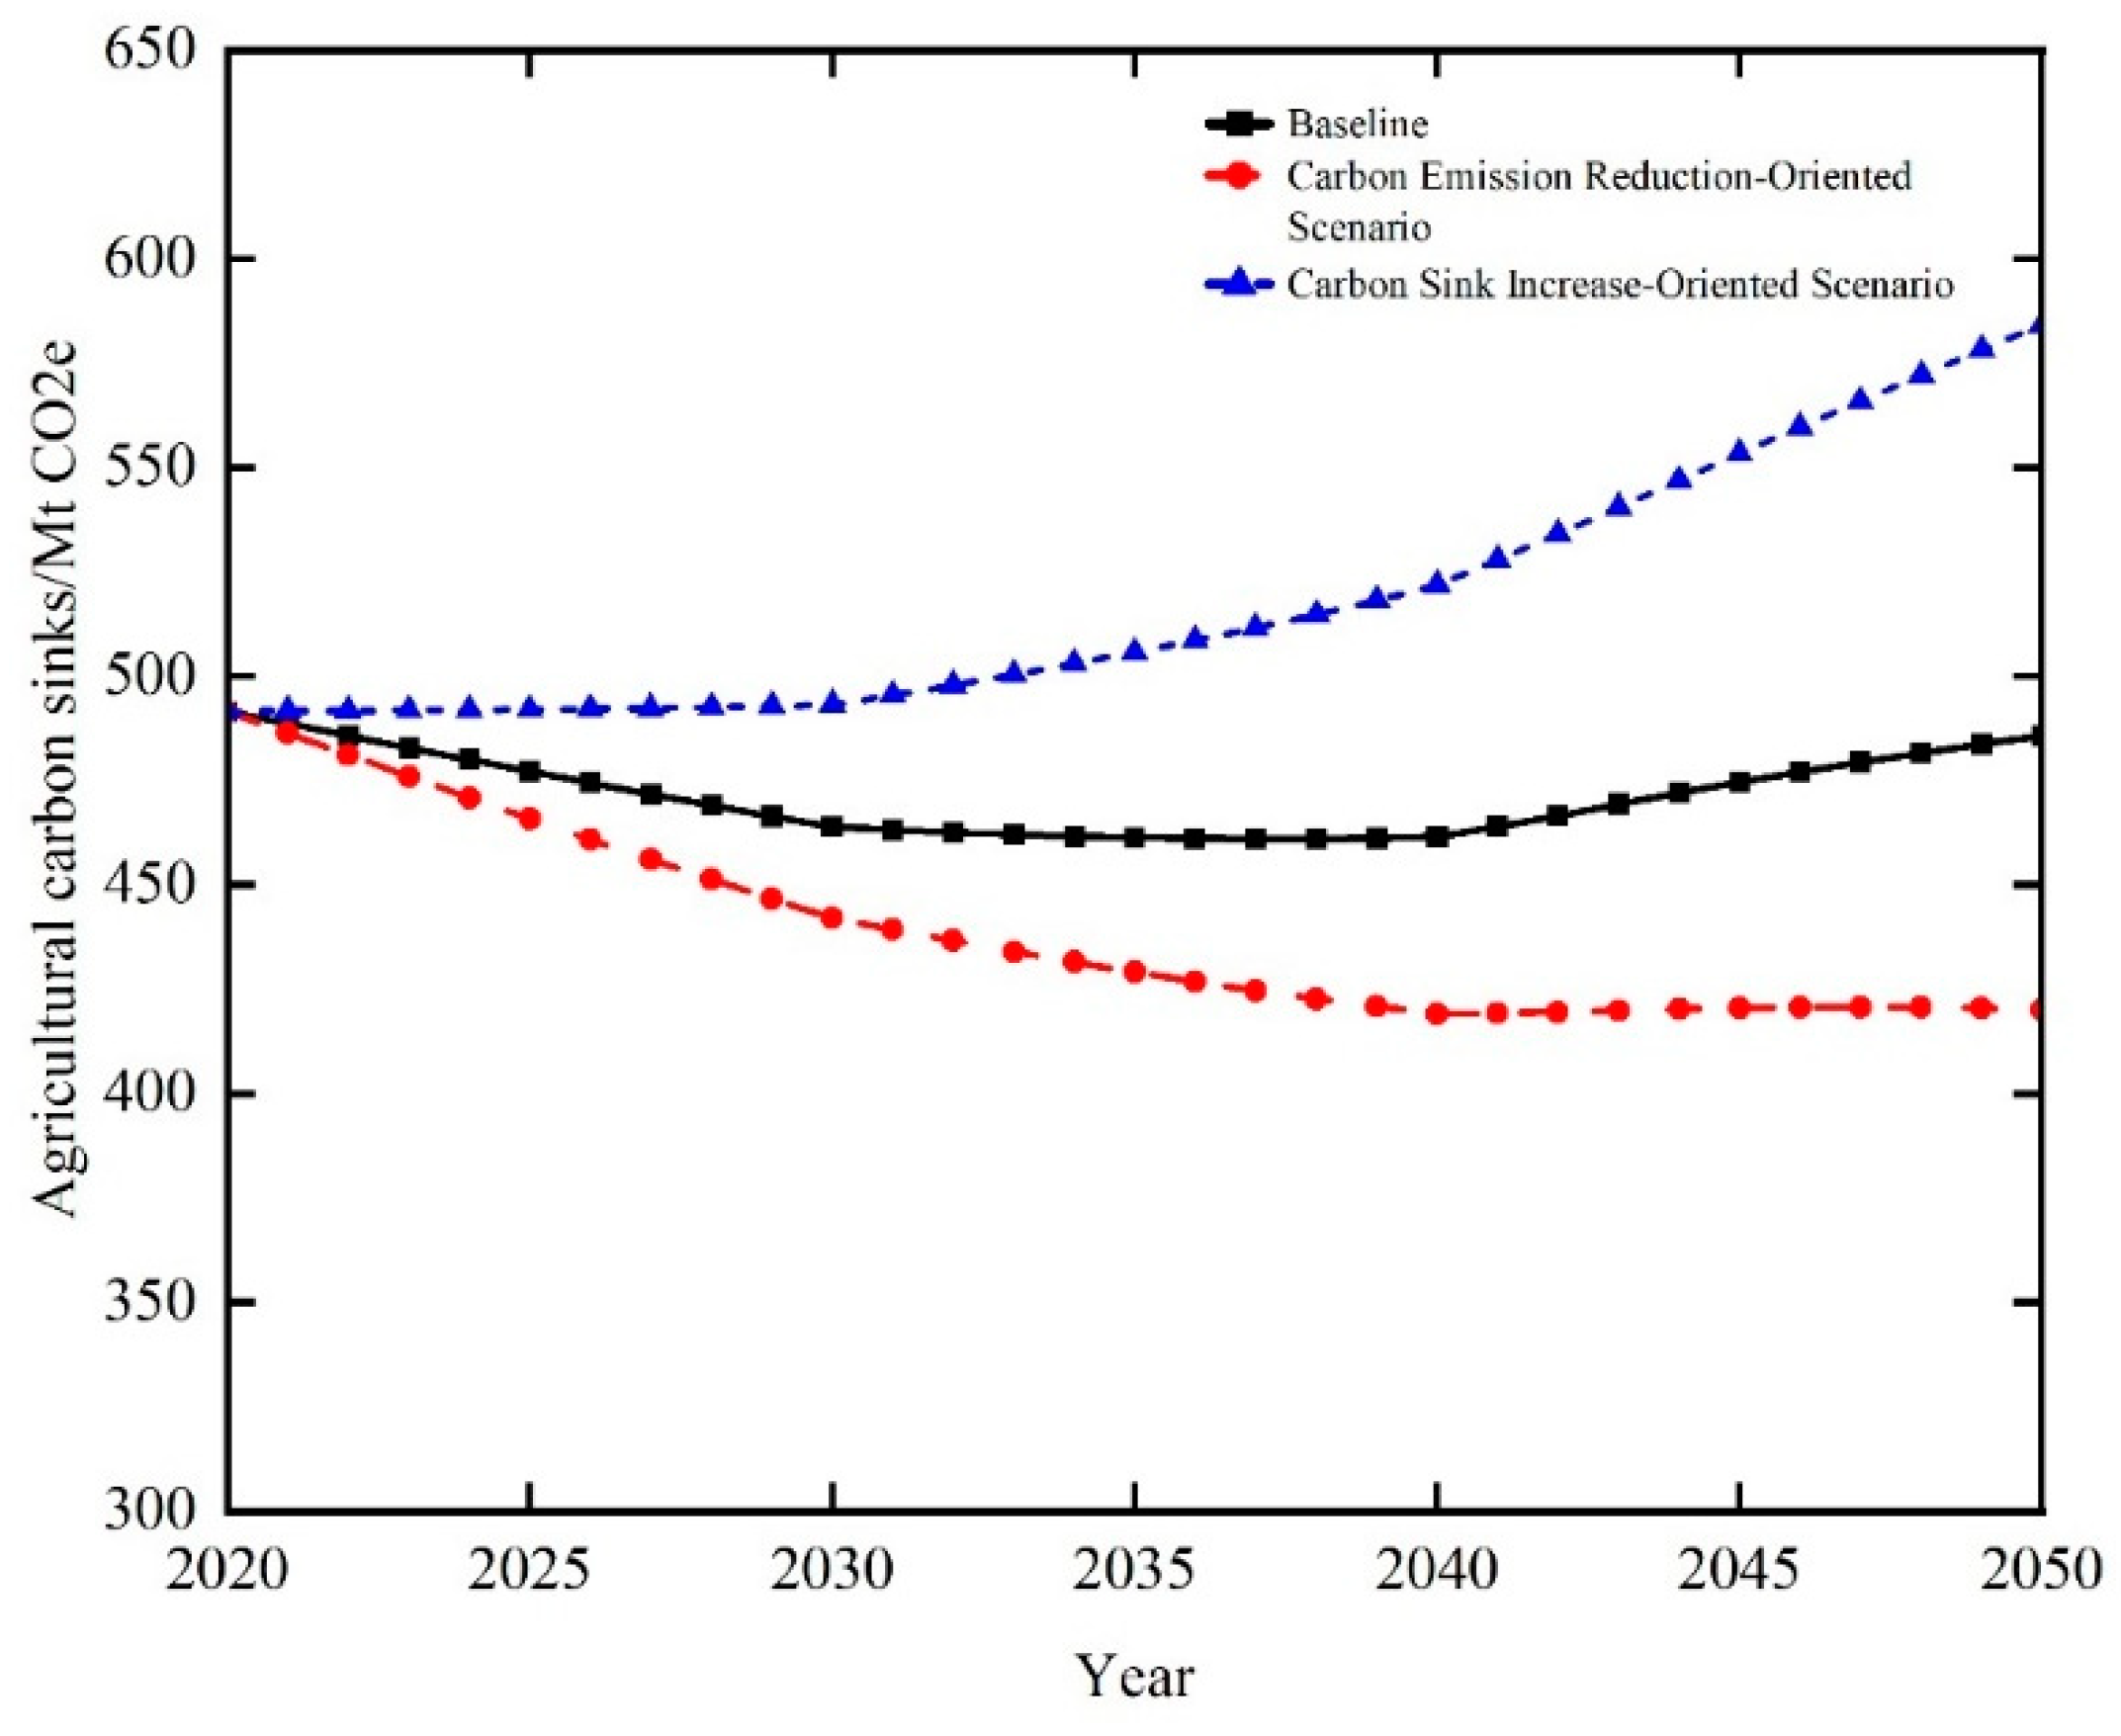
  • Compared to the baseline value in 2020, the emission reduction potential by 2050 under the baseline scenario, reducing emissions-oriented scenario, and increasing carbon sinks-oriented scenario are 4.5%, 21.3%, and 7.1%, respectively, while the carbon sink increase potential will be −1.2%, −14.5%, and 18.9%. After taking into account carbon emissions, carbon sinks, and net carbon emissions, this paper argues that the effect of emission reduction before 2045 is more obvious than that of increasing carbon sinks. Therefore, emission reduction potential should be fully harnessed. While after 2045, as carbon sinks accumulate, the effect of carbon sink becomes more significant. So, efforts should be made to actively develop agricultural carbon sinks after this time.
Based on the above findings, China urgently needs to accelerate the establishment of a standardized accounting system for agricultural carbon emissions and carbon sinks, and refine the emission coefficients and calculation methods for various carbon sources and sinks. Taking a multi-dimensional approach, based on the realities of agricultural production in China and international standards such as the IPCC national greenhouse gas emission inventory, all types of carbon sources and sinks should be comprehensively incorporated into the accounting system to obtain more accurate data on agricultural carbon emissions and carbon sinks in China. Additionally, tailored agricultural production policies are necessary. Given the significant differences in carbon emission and carbon sink structures across different types of regions, it is imperative to actively create favorable conditions, leverage regional resource endowments, promote win–win cooperation, and guide inter-provincial emission reduction interactions. Furthermore, efforts should be made to enhance agricultural technology levels and optimize agricultural industrial structures. Continuous innovation in various agricultural technologies, especially green agricultural technologies, is essential to decouple agricultural production from carbon emissions, reduce agricultural carbon intensity, formulate multi-period agricultural development plans, and judiciously control the scale of agricultural development. Additionally, timely advancement of agricultural emission reductions and carbon sink increase efforts is crucial, with a focus on the carbon sequestration role of agricultural carbon sinks. In the early stages of development, measures should be taken to actively promote emission reduction plans. However, with the accumulation of carbon sinks in later stages, the role of agricultural carbon sinks will surpass that of emission reductions, necessitating the consideration of developing agricultural carbon sinks to facilitate the realization of agricultural carbon neutrality goals.

Author Contributions

Conceptualization, Y.W. and X.L.; methodology, Y.W. and S.L.; software, Y.W.; validation, Y.W. and Y.L.; formal analysis, Y.W. and Y.L.; resources, S.L.; data curation, Y.L.; writing—original draft preparation, Y.W. and Y.L.; writing—review and editing, Y.W and S.L.; supervision, X.L.; funding acquisition, X.L. All authors have read and agreed to the published version of the manuscript.

Funding

This research is supported by the earmarked fund for China Agriculture Research System under project No. CARS-17.

Data Availability Statement

The data presented in this study can be obtained by contacting the corresponding author upon request.

Conflicts of Interest

The authors declare no conflicts of interest.

References

  1. Liu, Y.; Tang, H.; Muhammad, A.; Huang, G. Emission Mechanism and Reduction Countermeasures of Agricultural Greenhouse Gases—A Review. Greenh. Gases Sci. Technol. 2019, 9, 160–174. [Google Scholar] [CrossRef]
  2. Crippa, M.; Solazzo, E.; Guizzardi, D.; Monforti-Ferrario, F.; Tubiello, F.N.; Leip, A. Food Systems Are Responsible for a Third of Global Anthropogenic GHG Emissions. Nat. Food 2021, 2, 198–209. [Google Scholar] [CrossRef]
  3. Frank, S.; Havlík, P.; Stehfest, E.; van Meijl, H.; Witzke, P.; Pérez-Domínguez, I.; van Dijk, M.; Doelman, J.C.; Fellmann, T.; Koopman, J.F.L.; et al. Agricultural Non-CO2 Emission Reduction Potential in the Context of the 1.5 °C Target. Nature Clim. Change 2019, 9, 66–72. [Google Scholar] [CrossRef]
  4. van Beek, C.L.; Meerburg, B.G.; Schils, R.L.M.; Verhagen, J.; Kuikman, P.J. Feeding the World’s Increasing Population While Limiting Climate Change Impacts: Linking N2O and CH4 Emissions from Agriculture to Population Growth. Environ. Sci. Policy 2010, 13, 89–96. [Google Scholar] [CrossRef]
  5. IPCC; Core Writing Team. Sections. In Climate Change 2023: Synthesis Report; Lee, H., Romero, J., Eds.; IPCC: Geneva, Switzerland, 2023; pp. 35–115. [Google Scholar]
  6. Xia, Q. Based on the Carbon Sink of Agricultural Development Mode Transition Study. Ecol. Econ. 2010, 10, 106–109. [Google Scholar]
  7. Xiong, C.; Yang, D.; Xia, F.; Huo, J. Changes in Agricultural Carbon Emissions and Factors That Influence Agricultural Carbon Emissions Based on Different Stages in Xinjiang, China. Sci. Rep. 2016, 6, 36912. [Google Scholar] [CrossRef]
  8. Song, S.; Zhao, S.; Zhang, Y.; Ma, Y. Carbon Emissions from Agricultural Inputs in China over the Past Three Decades. Agriculture 2023, 13, 919. [Google Scholar] [CrossRef]
  9. Jin, S.; Lin, Y.; Niu, K. Driving Green Transformation of Agriculture with Low Carbon: Characteristics of Agricultural Carbon Emissions and Its Emission Reduction Path in China. Reform 2021, 5, 29–37. [Google Scholar]
  10. Ye, X.; Cheng, Y.; Zhang, Y.; Wu, Z.; Li, Q.; Liu, C. Scenario Simulation, Main Paths and Policy Measures of Greenhouse Gas Emission Reduction of Agricultural Activities in China. Issues Agric. Econ 2022, 2, 4–16. [Google Scholar]
  11. Goglio, P.; Smith, W.N.; Grant, B.B.; Desjardins, R.L.; Gao, X.; Hanis, K.; Tenuta, M.; Campbell, C.A.; McConkey, B.G.; Nemecek, T.; et al. A Comparison of Methods to Quantify Greenhouse Gas Emissions of Cropping Systems in LCA. J. Clean. Prod. 2018, 172, 4010–4017. [Google Scholar] [CrossRef]
  12. O’Brien, D.; Shalloo, L.; Crosson, P.; Donnellan, T.; Farrelly, N.; Finnan, J.; Hanrahan, K.; Lalor, S.; Lanigan, G.; Thorne, F.; et al. An Evaluation of the Effect of Greenhouse Gas Accounting Methods on a Marginal Abatement Cost Curve for Irish Agricultural Greenhouse Gas Emissions. Environ. Sci. Policy 2014, 39, 107–118. [Google Scholar] [CrossRef]
  13. Yue, Q.; Xu, X.; Hillier, J.; Cheng, K.; Pan, G. Mitigating Greenhouse Gas Emissions in Agriculture: From Farm Production to Food Consumption. J. Clean. Prod. 2017, 149, 1011–1019. [Google Scholar] [CrossRef]
  14. Bennetzen, E.H.; Smith, P.; Porter, J.R. Agricultural Production and Greenhouse Gas Emissions from World Regions—The Major Trends over 40 Years. Glob. Environ. Change 2016, 37, 43–55. [Google Scholar] [CrossRef]
  15. Tubiello, F.N.; Salvatore, M.; Rossi, S.; Ferrara, A.; Fitton, N.; Smith, P. The FAOSTAT Database of Greenhouse Gas Emissions from Agriculture. Environ. Res. Lett. 2013, 8, 015009. [Google Scholar] [CrossRef]
  16. Thamo, T.; Kingwell, R.S.; Pannell, D.J. Measurement of Greenhouse Gas Emissions from Agriculture: Economic Implications for Policy and Agricultural Producers. Aust. J. Agric. Resour. Econ. 2013, 57, 234–252. [Google Scholar] [CrossRef]
  17. Jones, C.A.; Sands, R.D. Impact of Agricultural Productivity Gains on Greenhouse Gas Emissions: A Global Analysis. Am. J. Agric. Econ. 2013, 95, 1309–1316. [Google Scholar] [CrossRef]
  18. Laborde, D.; Mamun, A.; Martin, W.; Piñeiro, V.; Vos, R. Agricultural Subsidies and Global Greenhouse Gas Emissions. Nat. Commun. 2021, 12, 2601. [Google Scholar] [CrossRef]
  19. McGinn, S.M. Measuring Greenhouse Gas Emissions from Point Sources in Agriculture. Can. J. Soil. Sci. 2006, 86, 355–371. [Google Scholar] [CrossRef]
  20. Ro, K.S.; Johnson, M.H.; Varma, R.M.; Hashmonay, R.A.; Hunt, P. Measurement of Greenhouse Gas Emissions from Agricultural Sites Using Open-Path Optical Remote Sensing Method. J. Environ. Sci. Health A Tox. Hazard Subst. Environ. Eng. 2009, 44, 1011–1018. [Google Scholar] [CrossRef]
  21. Chen, Y.E.; Chen, W. A study on the relationship among agricultural mechanization, industrial upgrading and agricultural carbon emission—The empirical research based on dynamic panel data model. J. Agrotech. Econ. 2018, 5, 122–133. [Google Scholar]
  22. Li, B.; Zhang, J.; Li, H. Research on Spatial-Temporal Characteristics and Affecting Factors Decomposition of Agricultural Carbon Emission in China. China Popul. Resour. Environ. 2011, 21, 80–86. [Google Scholar]
  23. Tian, Y.; Zhang, J.B.; Li, B. Research on Spatial-Temporal Characteristics and Factor Decomposition of Agricultural Carbon Emission Based on Input Angle-Taking Hubei Province for Example. Res. Agric. Mod. 2011, 6, 752–755. [Google Scholar]
  24. Li, Y.; Lin, E.; Zhen, X. Advances in Methods of Agricultural Greenhouse Gas Inventories. Adv. Earth Sci. 2007, 22, 1076. [Google Scholar]
  25. IPCC. 2006 IPCC Guidelines for National Greenhouse Gas Inventories; Eggleston, H.S., Buendia, L., Miwa, K., Ngara, T., Tanabe, K., Eds.; Institute for Global Environmental Strategies: Hayama, Japan, 2006. [Google Scholar]
  26. National Development and Reform Commission. Guidelines for Provincial Greenhouse Gas Inventory Compilation (Trial); National Development and Reform Commission: Beijing, China, 2010.
  27. Zhang, F.; Xuan, X.; Jin, G.; Wu, F. Agricultural Non-CO2 Greenhouse Gases Emissions and Scenario Simulation Analysis. Acta Geogr. Sin. 2023, 78, 35–53. [Google Scholar]
  28. Yonghao, H.U.; Kunyang, Z.; Nanyan, H.U.; Laping, W.U. Review on Measurement of Agricultural Carbon Emission in China. Chin. J. Eco-Agric. 2023, 31, 163–176. [Google Scholar] [CrossRef]
  29. Wang, M.; Li, J.; Zheng, X. Methane Emission and Mechanisms of Methane Production, Oxidation, Transportation in the Rice Fields. Sci. Atmos. Sin. 1998, 22, 610–621. [Google Scholar]
  30. Zhang, X.; Wang, J.; Zhang, T.; Li, B.; Yan, L. Assessment of Nitrous Oxide Emissions from Chinese Agricultural System and Low-Carbon Measures. Jiangsu J. Agric. Sci. 2021, 37, 1215–1233. [Google Scholar]
  31. Liu, X.; Xu, J.; Wang, F.; Zhang, F.; Ma, W. The Resource and Distribution of Nitrogen Nutrient in Animal Excretion in China. J. Agric. Univ. Hebei 2005, 28, 27–32. [Google Scholar]
  32. Chen, J.; Cheng, S.; Song, M. Changes in Energy-Related Carbon Dioxide Emissions of the Agricultural Sector in China from 2005 to 2013. Renew. Sustain. Energy Rev. 2018, 94, 748–761. [Google Scholar] [CrossRef]
  33. West, T.O.; Marland, G. A Synthesis of Carbon Sequestration, Carbon Emissions, and Net Carbon Flux in Agriculture: Comparing Tillage Practices in the United States. Agric. Ecosyst. Environ. 2002, 91, 217–232. [Google Scholar] [CrossRef]
  34. Cheng, K.; Pan, G.; Smith, P.; Luo, T.; Li, L.; Zheng, J.; Zhang, X.; Han, X.; Yan, M. Carbon Footprint of China’s Crop Production—An Estimation Using Agro-Statistics Data over 1993–2007. Agric. Ecosyst. Environ. 2011, 142, 231–237. [Google Scholar] [CrossRef]
  35. Díaz, S. Ecosystem Function Measurement, Terrestrial Communities. In Encyclopedia of Biodiversity, 2nd ed.; Elsevier: Amsterdam, The Netherlands, 2013; pp. 72–89. [Google Scholar] [CrossRef]
  36. Tian, Y.; Zhang, J. Regional Differentiation Research on Net Carbon Effect of Agricultural Production in China. J. Nat. Resour. 2013, 28, 1298–1309. [Google Scholar] [CrossRef]
  37. Wang, X.L. Carbon Dioxide, Climate Change, and Agriculture; China Meteorological Press: Beijing, China, 1996. [Google Scholar]
  38. Han, Z.-Y.; Meng, Y.-L.; Xu, J.; Wu, Y.; Zhou, Z.-G. Temporal and Spatial Difference in Carbon Footprint of Regional Farmland Ecosystem—Taking Jiangsu Province as a Case. J. Agro-Environ. Sci. 2012, 31, 1034–1041. [Google Scholar]
  39. Aziz, S.; Chowdhury, S.A. Analysis of agricultural greenhouse gas emissions using the STIRPAT model: A case study of Bangladesh. Environ. Dev. Sustain. 2023, 25, 3945–3965. [Google Scholar] [CrossRef]
  40. Dietz, T.; Rosa, E.A. Rethinking the Environmental Impacts of Population, Affluence and Technology. Hum. Ecol. Rev. 1994, 1, 277–300. [Google Scholar]
  41. York, R.; Rosa, E.A.; Dietz, T. STIRPAT, IPAT and ImPACT: Analytic Tools for Unpacking the Driving Forces of Environmental Impacts. Ecol. Econ. 2003, 46, 351–365. [Google Scholar] [CrossRef]
  42. Li, L.; Lei, Y.; He, C.; Wu, S.; Chen, J. Prediction on the Peak of the CO2 Emissions in China Using the STIRPAT Model. Adv. Meteorol. 2016, 2016, 5213623. [Google Scholar] [CrossRef]
  43. Qu, S.; Guo, C. Forecast of China’s Carbon Emissions Based on STIRPAT Model. China Popul. Resour. Environ. 2010, 20, 10–15. [Google Scholar]
  44. Su, K.; Lee, C.-M. When Will China Achieve Its Carbon Emission Peak? A Scenario Analysis Based on Optimal Control and the STIRPAT Model. Ecol. Indic. 2020, 112, 106138. [Google Scholar] [CrossRef]
  45. Zhao, L.; Zhao, T.; Yuan, R. Scenario Simulations for the Peak of Provincial Household CO2 Emissions in China Based on the STIRPAT Model. Sci. Total Environ. 2022, 809, 151098. [Google Scholar] [CrossRef]
  46. Jiang, J.; Zhao, T.; Wang, J. Decoupling Analysis and Scenario Prediction of Agricultural CO2 Emissions: An Empirical Analysis of 30 Provinces in China. J. Clean. Prod. 2021, 320, 128798. [Google Scholar] [CrossRef]
  47. IPCC; Core Writing Team. Climate Change 2007: Synthesis Report; Pachauri, R.K., Reisinger, A., Eds.; IPCC: Geneva, Switzerland, 2007; 104p. [Google Scholar]
  48. Zhu, Q.; Peng, X.; Lu, Z.; Yu, J. Analysis Model and Empirical Study of Impacts from Population and Consumption on Carbon Emissions. China Popul. Resour. Environ. 2010, 20, 98–102. [Google Scholar]
  49. Zhang, Y.; Li, H.; Zhao, Z.H. Effects of Grain Crop Planting Changes on Agricultural Carbon Emissions between Provinces in China. Chin. J. Agric. Resour. Reg. Plan. 2023, 44, 29–38. [Google Scholar]
  50. Yu, Z.H.; Mao, S.P. Analysis of the decoupling of China’s agricultural net carbon emissions from its economic growth. China Popul. Resour. Environ. 2022, 32, 30. [Google Scholar]
  51. Tian, Y.; Yin, M.H. Re-evaluation of China’s agricultural carbon emissions: Basic status, dynamic evolution and spatial spillover effects. Chin. Rural Econ. 2022, 3, 104–127. [Google Scholar]
  52. Tian, C.S.; Chen, Y. China’s provincial agricultural carbon emissions measurement and low carbonization level evaluation: Based on the application of derivative indicators and TOPSIS. J. Nat. Resour. 2021, 36, 395–410. [Google Scholar] [CrossRef]
  53. Yang, H.; Wang, X.; Bin, P. Agriculture carbon-emission reduction and changing factors behind agricultural eco-efficiency growth in China. J. Clean. Prod. 2022, 334, 130193. [Google Scholar] [CrossRef]
  54. Yang, J. The Effects of Technological Advances on Agricultural Carbon Emission-Evidence from Chinese Provincial Data. Soft Sci. 2013, 27, 116. [Google Scholar]
  55. Ma, S.; Li, J.; Wei, W. The carbon emission reduction effect of digital agriculture in China. In Environmental Science and Pollution Research; Springer: Berlin/Heidelberg, Germany, 2022; pp. 1–18. [Google Scholar] [CrossRef]
  56. Tian, Y.; Cai, Y.R. Research progress and future prospects of agricultural carbon issues under “Dual carbon” goal. J. Huazhong Agric. Univ. 2024, 43, 75–88. [Google Scholar]
Figure 1. Trends of carbon emissions, carbon sinks, and total net carbon emissions in China from 1995 to 2020.
Land 13 01452 g001
Figure 2. Types and structural change trends of agricultural greenhouse gases in China from 1995 to 2020.
Land 13 01452 g002
Figure 3. Agricultural carbon emissions in China from 2021 to 2050 under different scenarios.
Land 13 01452 g003
Figure 4. Agricultural carbon sinks in China from 2021 to 2050 under different scenarios.
Land 13 01452 g004
Table 1. Methane emission factors from rice fields (Unit: kg/ha).
AreaSingle Cropping RiceDouble Season Early RiceDouble Season Late Rice
North ChinaBeijing234--
Tianjin234--
Hebei234--
Shanxi234--
Inner Mongolia234--
Northeast ChinaLiaoning168--
Jilin168--
Heilongjiang168--
East ChinaShanghai215.5211.4224
Jiangsu215.5211.4224
Zhejiang215.5211.4224
Anhui215.5211.4224
Fujian215.5211.4224
Jiangxi215.5211.4224
Shandong215.5211.4224
Central and Southern ChinaHenan236.7241273.2
Hubei236.7241273.2
Hunan236.7241273.2
Guangdong236.7241273.2
Guangxi236.7241273.2
Hainan236.7241273.2
Southwest ChinaChongqing156.2156.2171.7
Sichuan156.2156.2171.7
Guizhou156.2156.2171.7
Yunnan156.2156.2171.7
Xizang156.2156.2171.7
Northwest ChinaShaanxi231.2--
Gansu231.2--
Qinghai231.2--
Ningxia231.2--
Xinjiang231.2--
Table 2. Direct nitrous oxide emission factors from agricultural land (Unit: kg N2O-N/kg N).
AreaDirect Nitrous Oxide Emission Factors ( F a g r i c u l t u r a l   l a n d , d i r e c t )
Beijing0.0057
Tianjin0.0057
Hebei0.0057
Shanxi0.0056
Inner Mongolia0.0056
Liaoning0.0114
Jilin0.0114
Heilongjiang0.0114
Shanghai0.0109
Jiangsu0.0109
Zhejiang0.0109
Anhui0.0109
Fujian0.0178
Jiangxi0.0109
Shandong0.0057
Henan0.0057
Hubei0.0109
Hunan0.0109
Guangdong0.0178
Guangxi0.0178
Hainan0.0178
Chongqing0.0109
Sichuan0.0109
Guizhou0.0106
Yunnan0.0106
Xizang0.0056
Shannxi0.0056
Gansu0.0056
Qinghai0.0056
Ningxia0.0056
Xinjiang0.0056
Table 3. Parameters of various major crops.
Crop TypeNitrogen Content of the GrainNitrogen Content of the StrawEconomic CoefficientRoot/Shoot RatioStraw Returning Rate
Rice0.010.007530.4890.12532.3
Wheat0.0140.005160.4340.16676.5
Corn0.0170.00580.4380.179.3
Sorghum0.0170.00730.3930.1854
Soybean0.060.01810.4250.139.3
Oilseed0.00550.00550.2710.1561.85
Hemp0.01310.01310.830.29.3
Potato0.0040.0110.6670.0539.92
Vegetables0.0080.0080.830.2561.85
Tobacco0.0410.01440.830.261.85
Table 4. Unit excretion and nitrogen content of different species of animals.
Animal SpeciesExcretion per Unit (kg/Head)Nitrogen Content (%)
Cattle155000.438
Sheep6320.898
Horse52370.52
Donkey30920.5
Mule30920.5
Camel52370.52
Pig34190.238
Poultry39.830.8285
Rabbit500.297
Table 5. Intestinal fermentation methane emission factors of animals (Unit: kg/head/year).
Type of AnimalScale BreedingFree-Range FarmingGrazing FeedingMean
Cows88.189.399.392.23
Non-cow52.967.985.368.7
Buffalo70.587.7-79.1
Sheep8.28.77.58.13
Goat8.99.46.78.33
Pig1111
Horse18181818
Donkey10101010
Mule10101010
Camel46464646
Table 6. Methane emission factors from animal manure management (Unit: kg/head/year).
Type of AnimalManure Management Methane Emission FactorsManure Management Nitrous Oxide Emission Factors
North ChinaNortheast ChinaEast ChinaCentral South ChinaSouthwest ChinaNorthwest ChinaNorth ChinaNortheast ChinaEast ChinaCentral South ChinaSouthwest ChinaNorthwest China
Cows7.462.238.338.456.515.931.8461.0962.0651.711.8841.447
Non-cow2.821.023.314.723.211.860.7940.9130.8460.8050.6910.545
Buffalo--5.558.241.53---0.8750.861.197-
Sheep0.150.150.260.340.480.280.0930.0570.1130.1060.0640.074
Goat0.170.160.280.310.530.320.0930.0570.1130.1060.0640.074
Pig3.121.125.085.854.181.380.2270.2660.1750.1570.1590.195
Horse1.091.091.641.641.641.090.330.330.330.330.330.33
Donkey0.60.60.90.90.90.60.1880.1880.1880.1880.1880.188
Mule0.60.60.90.90.90.60.1880.1880.1880.1880.1880.188
Camel1.281.281.921.921.921.280.330.330.330.330.330.33
Poultry0.010.010.020.020.020.010.0070.0070.0070.0070.0070.007
Note: The regional division of North China, Northeast China, East China, South Central China, Southwest China, and Northwest China is the same as when calculating methane emissions from rice fields.
Table 7. Various coefficient values of agricultural energy carbon emission calculation.
EnergyConversion Factor
(MJ/kg)
Carbon Content per Unit Calorific Value (kg/GJ)Non-Combustible Carbon
(10,000 tons)
Carbon Oxidation Factor
Diesel fuel42.70520.200.98
Coal20.93426.3700.94
Table 8. Correlation coefficients for calculating carbon uptake of crops.
Crop TypeCarbon Absorption RateAverage Moisture Content %
Rice0.41412
Wheat0.48512
Corn0.47113
Sorghum0.41412
Soybean0.4513
Oil seed0.4510
Hemp0.4512
Potato0.42370
Vegetables0.4590
Tobacco0.4585
Table 9. Setting of rate of change for each factor (Unit: %).
VariablesGrowth LevelTime Period
2021–20302031–20402041–2050
Level of economic development—GDP(A per capita (A))Low3.52.51.5
Medium5.04.03.0
High6.55.54.5
Agricultural Technology Level—Agricultural Carbon Emission Intensity (T)Low−1.5−2.0−2.5
Medium−2.5−3.0−3.5
High−3.0−3.5−4.0
Agricultural Development Scale—Gross Output Value of Agriculture, Forestry, Animal Husbandry, and Fishery (AO)Low2.93.13.3
Medium3.33.53.7
High3.73.94.1
Table 10. Total Agricultural Carbon Emissions, Carbon Sinks, and Net Carbon Emissions in China from 1995 to 2020.
YearPaddy Field PlantingFarmland Soil ManagementLivestock and Poultry BreedingInput of Agricultural Energy and ChemicalsCarbon Emissions (Mt CO2 e)Carbon Sinks
(Mt CO2 e)
Net Carbon Emissions
(Mt CO2 e)
Emissions
(Mt CO2 e)
Proportion
(%)
Emissions
(Mt CO2 e)
Proportion
(%)
Emissions
(Mt CO2 e)
Proportion
(%)
Emissions
(Mt CO2 e)
Proportion (%)
1995169.418.2 119.5 12.9 499.4 53.7 140.8 15.2929.2 414.5 514.6
1996172.719.9 125.5 14.5 421.0 48.6 146.7 16.9865.9 447.5 418.4
1997174.419.2 130.3 14.3 447.8 49.3 156.3 17.2908.8 443.8 464.9
1998170.718.1 133.3 14.1 473.8 50.3 164.3 17.4942.2 460.8 481.4
1999170.917.9 133.7 14.0 485.0 50.7 166.7 17.4956.3 464.0 492.3
2000162.817.0 134.7 14.1 495.4 51.7 164.7 17.2957.5 429.5 528.1
2001156.116.2 137.5 14.3 498.0 51.7 171.3 17.8962.9 424.4 538.5
2002152.415.6 140.0 14.3 509.4 52.0 177.7 18.1979.5 430.2 549.3
2003143.514.6 142.1 14.5 525.4 53.5 170.9 17.4981.9 408.5 573.4
2004153.414.9 149.3 14.6 542.1 52.8 181.2 17.71026.0 447.1 578.9
2005155.914.5 153.2 14.2 557.3 51.8 210.0 19.51076.4 462.1 614.3
2006157.814.6 156.9 14.5 548.6 50.7 218.3 20.21081.7 473.7 608.0
2007155.316.0 160.4 16.5 433.2 44.6 221.6 22.8970.5 477.5 493.0
2008156.816.2 165.2 17.0 436.8 45.0 210.8 21.7969.6 506.9 462.7
2009159.016.0 170.1 17.1 446.3 44.8 220.4 22.1995.8 512.7 483.1
2010159.916.0 174.0 17.4 438.3 43.8 228.3 22.81000.6 526.8 473.8
2011160.715.8 179.0 17.6 433.3 42.7 242.1 23.81015.0 549.3 465.7
2012161.015.6 183.1 17.8 435.4 42.3 249.7 24.31029.1 569.4 459.7
2013161.515.7 185.5 18.1 436.7 42.5 243.3 23.71026.9 583.2 443.7
2014161.815.5 187.9 18.0 442.9 42.5 250.5 24.01043.1 587.9 455.2
2015161.315.3 190.9 18.1 447.9 42.5 255.0 24.21055.2 627.6 427.6
2016160.915.4 188.6 18.0 438.2 41.9 257.9 24.71045.6 597.9 447.7
2017163.316.2 186.0 18.5 397.4 39.4 261.1 25.91007.8 644.4 363.5
2018160.216.6 181.2 18.8 390.5 40.4 233.9 24.2965.8 640.5 325.3
2019157.116.7 175.3 18.7 375.1 40.0 231.1 24.6938.6 648.2 290.4
2020159.416.4 172.7 17.8 405.8 41.8 232.9 24.0970.9 654.7 316.2
Table 11. Cumulative carbon emissions and carbon sinks of agricultural sectors in China from 1995 to 2020.
RegionPaddy Field PlantingFarmland Soil ManagementLivestock and Poultry BreedingInput of Agricultural Energy and ChemicalsCarbon EmissionsCarbon Sinks
Emissions (Mt CO2 e)Proportion (%)Emissions (Mt CO2 e)Proportion (%)Emissions (Mt CO2 e)Proportion (%)Emissions (Mt CO2 e)Proportion (%)Emissions (Mt CO2 e)RankEmissions (Mt CO2 e)Rank
Beijing0.80.99.510.027.729.157.160.095.23032.929
Tianjin4.34.512.212.732.033.547.249.395.72947.326
Hebei15.01.3180.816.2598.153.5324.829.01118.710825.34
Shanxi0.40.155.613.0190.544.4182.242.5428.723262.219
Inner Mongolia15.31.588.28.5722.469.5213.920.61039.813528.511
Liaoning61.18.8137.719.9303.743.9189.427.4691.818453.612
Jinlin71.610.3181.726.1330.747.4113.416.3697.417681.08
Heilongjiang259.423.3161.214.5407.836.6284.825.61113.2111019.33
Shanghai18.319.914.916.216.117.542.746.492.03133.328
Jiangsu311.027.8308.927.6190.817.0309.927.71120.69800.95
Zhejiang161.528.587.015.389.315.8229.040.4566.820206.923
Anhui313.628.0269.224.0354.731.6184.116.41121.68778.46
Fujian135.726.1138.226.5127.924.6119.122.9520.921150.124
Jiangxi448.045.2108.811.0310.831.3124.312.5991.914415.713
Shandong18.71.2270.616.7802.849.6526.632.51618.831267.12
Henan87.04.7311.616.81108.059.9343.718.61850.211474.01
Hubei341.427.3255.720.4404.532.3249.019.91250.65632.910
Hunan647.037.4194.211.2576.933.4310.318.01728.32638.79
Guangdong357.029.2273.122.3335.427.4256.821.01222.37333.116
Guangxi359.829.0246.919.9544.343.987.97.11239.06340.114
Hainan54.021.151.520.196.537.754.221.1256.22740.427
Chongqing66.915.873.617.4169.740.1112.826.7422.924207.122
Sichuan213.613.5226.114.3969.661.4170.710.81580.04774.27
Guizhou71.89.284.010.7488.262.4138.217.7782.216249.020
Yunnan102.99.3148.913.4702.163.2156.714.11110.512336.515
Xizang0.10.09.92.0485.097.80.80.2495.9229.531
Shaanxi19.74.798.223.3203.648.2100.723.9422.225287.218
Gansu0.80.146.67.9385.565.3157.726.7590.619208.021
Qinghai0.00.010.92.7382.295.28.22.1401.32627.530
Ningxia11.07.220.113.190.459.131.520.6153.12876.825
Xinjiang10.61.280.19.1514.158.1279.931.6884.615295.317
North China35.91.3346.212.51570.856.5825.229.72778.041696.24
Northeast China392.015.7480.619.21042.241.6587.623.52502.452153.93
East China1406.823.31197.719.91892.431.41535.725.56032.523652.51
Central south China1846.224.51333.017.73065.540.61301.917.37546.713459.12
Southwest China455.210.4542.512.42814.664.1579.213.24391.531576.45
Northwest China42.11.7255.810.41575.864.3578.123.62451.86894.96
Table 12. Carbon Emission Types of Agricultural Sector in 31 Provinces of China.
TypeProvinces
Carbon sink-dominated regionsHebei, Shanxi, Liaoning, Jilin, Heilongjiang, Jiangsu, Anhui, Shandong, Henan, Shaanxi
Paddy planting-dominated regionsJiangxi
Livestock farming-dominated regionsInner Mongolia, Guangxi, Chongqing, Sichuan, Guizhou, Yunnan, Xizang, Gansu, Qinghai, Ningxia, Xinjiang
Resource inputs-dominated regionsBeijing, Tianjin, Shanghai, Zhejiang
Composite factor-dominated regionsFujian, Hubei, Hunan, Guangdong, Hainan
Table 13. Estimation Results of Ridge Regression.
VariablesModel(3)Model(4)
lnIEClnISC
lnP0.0879 *** (8.88)0.0076 (0.34)
lnA−0.0029 (−0.44)−0.2451 *** (−15.04)
lnT0.7151 *** (77.65)−0.1221 *** (−5.61)
lnRP0.1447 *** (17.02)0.4783 *** (28.04)
lnAO0.7046 *** (93.74)0.5066 *** (31.59)
Constant−4.0693 *** (−51.20)−2.3933 *** (−10.54)
R20.97120.8307
K0.050.15
Note: The values in parentheses represent t-statistics, *** denote significance levels at 1%.
Table 14. Ridge Regression Estimates for Different Types of Regions.
VariableslnIEC
Carbon Sink-Dominated RegionsPaddy Planting-Dominated RegionsLivestock Farming-Dominated RegionsResource Inputs-Dominated RegionsComposite Factor-Dominated Regions
lnP0.2037 *** (7.48)0.3295 (0.70)0.1335 *** (8.14)0.1398 *** (4.45)0.2109 *** (13.02)
lnA0.0014 (0.10)0.0075 (0.79)0.0398 *** (3.77)−0.0651 *** (−3.11)−0.0032 (−0.21)
lnT0.6114 *** (31.32)0.0431 ** (2.52)0.6263 *** (35.89)0.5271 *** (14.94)0.4149 *** (18.53)
lnRP0.0788 *** (3.86)0.0140(0.16)0.1026 *** (6.83)0.2481 *** (14.19)0.2212 *** (14.77)
lnAO0.6437 *** (41.96)0.0485 *** (3.10)0.6244 *** (41.89)0.5744 *** (29.32)0.4161 *** (22.04)
Constant−4.0661 *** (−19.90)0.3041 (0.07)−3.8202 *** (−31.34)−3.8217 *** (−12.65)−3.3292 *** (22.04)
R20.94560.27330.94720.98430.9509
K0.050.050.050.050.10
Note: The values in parentheses represent t-statistics, ***, ** denote significance levels at 1% and 5%, respectively.
Table 15. Setting of Change Rate of Influencing Factors in Different Scenarios.
ScenarioEconomic Development Level—per Capita GDPAgricultural Technology Level—Agricultural Carbon IntensityAgricultural Development Scale—Total Output Value of Agriculture, Forestry, Animal Husbandry, and Fishery
BaselineMediumMediumMedium
Carbon Emission Reduction-Oriented ScenarioHighHighLow
Carbon Sink Increase-Oriented ScenarioLowHighHigh
Table 16. Predicted values of carbon emissions, carbon sinks, and net carbon emissions of agricultural sectors in China (unit: Mt CO2 e).
Scheme 2025202520302035204020452050
Carbon EmissionsBaseline1073.31076.01066.91059.41041.91022.4
Carbon Emission Reduction-Oriented Scenario1039.21008.7968.4931.0886.5842.1
Carbon Sink Increase-Oriented Scenario1068.41066.21052.31040.01017.9994.1
Carbon SinksBaseline477.2463.9461.3461.6474.6485.8
Carbon Emission Reduction-Oriented Scenario465.9442.1429.1419.1420.6420.1
Carbon Sink Increase-Oriented Scenario492.1493.1505.7521.8553.3584.1
Net Carbon EmissionsBaseline596.0612.1605.5597.8567.3536.6
Carbon Emission Reduction-Oriented Scenario573.3566.7539.3511.9465.9422.0
Carbon Sink Increase-Oriented Scenario576.3573.1546.5518.2464.6410.0
Disclaimer/Publisher’s Note: The statements, opinions and data contained in all publications are solely those of the individual author(s) and contributor(s) and not of MDPI and/or the editor(s). MDPI and/or the editor(s) disclaim responsibility for any injury to people or property resulting from any ideas, methods, instructions or products referred to in the content.

