

Methods for the Performance Evaluation and Design Optimization of Metro Transit-Oriented Development Sites Based on Urban Big Data


Abstract
1. Introduction
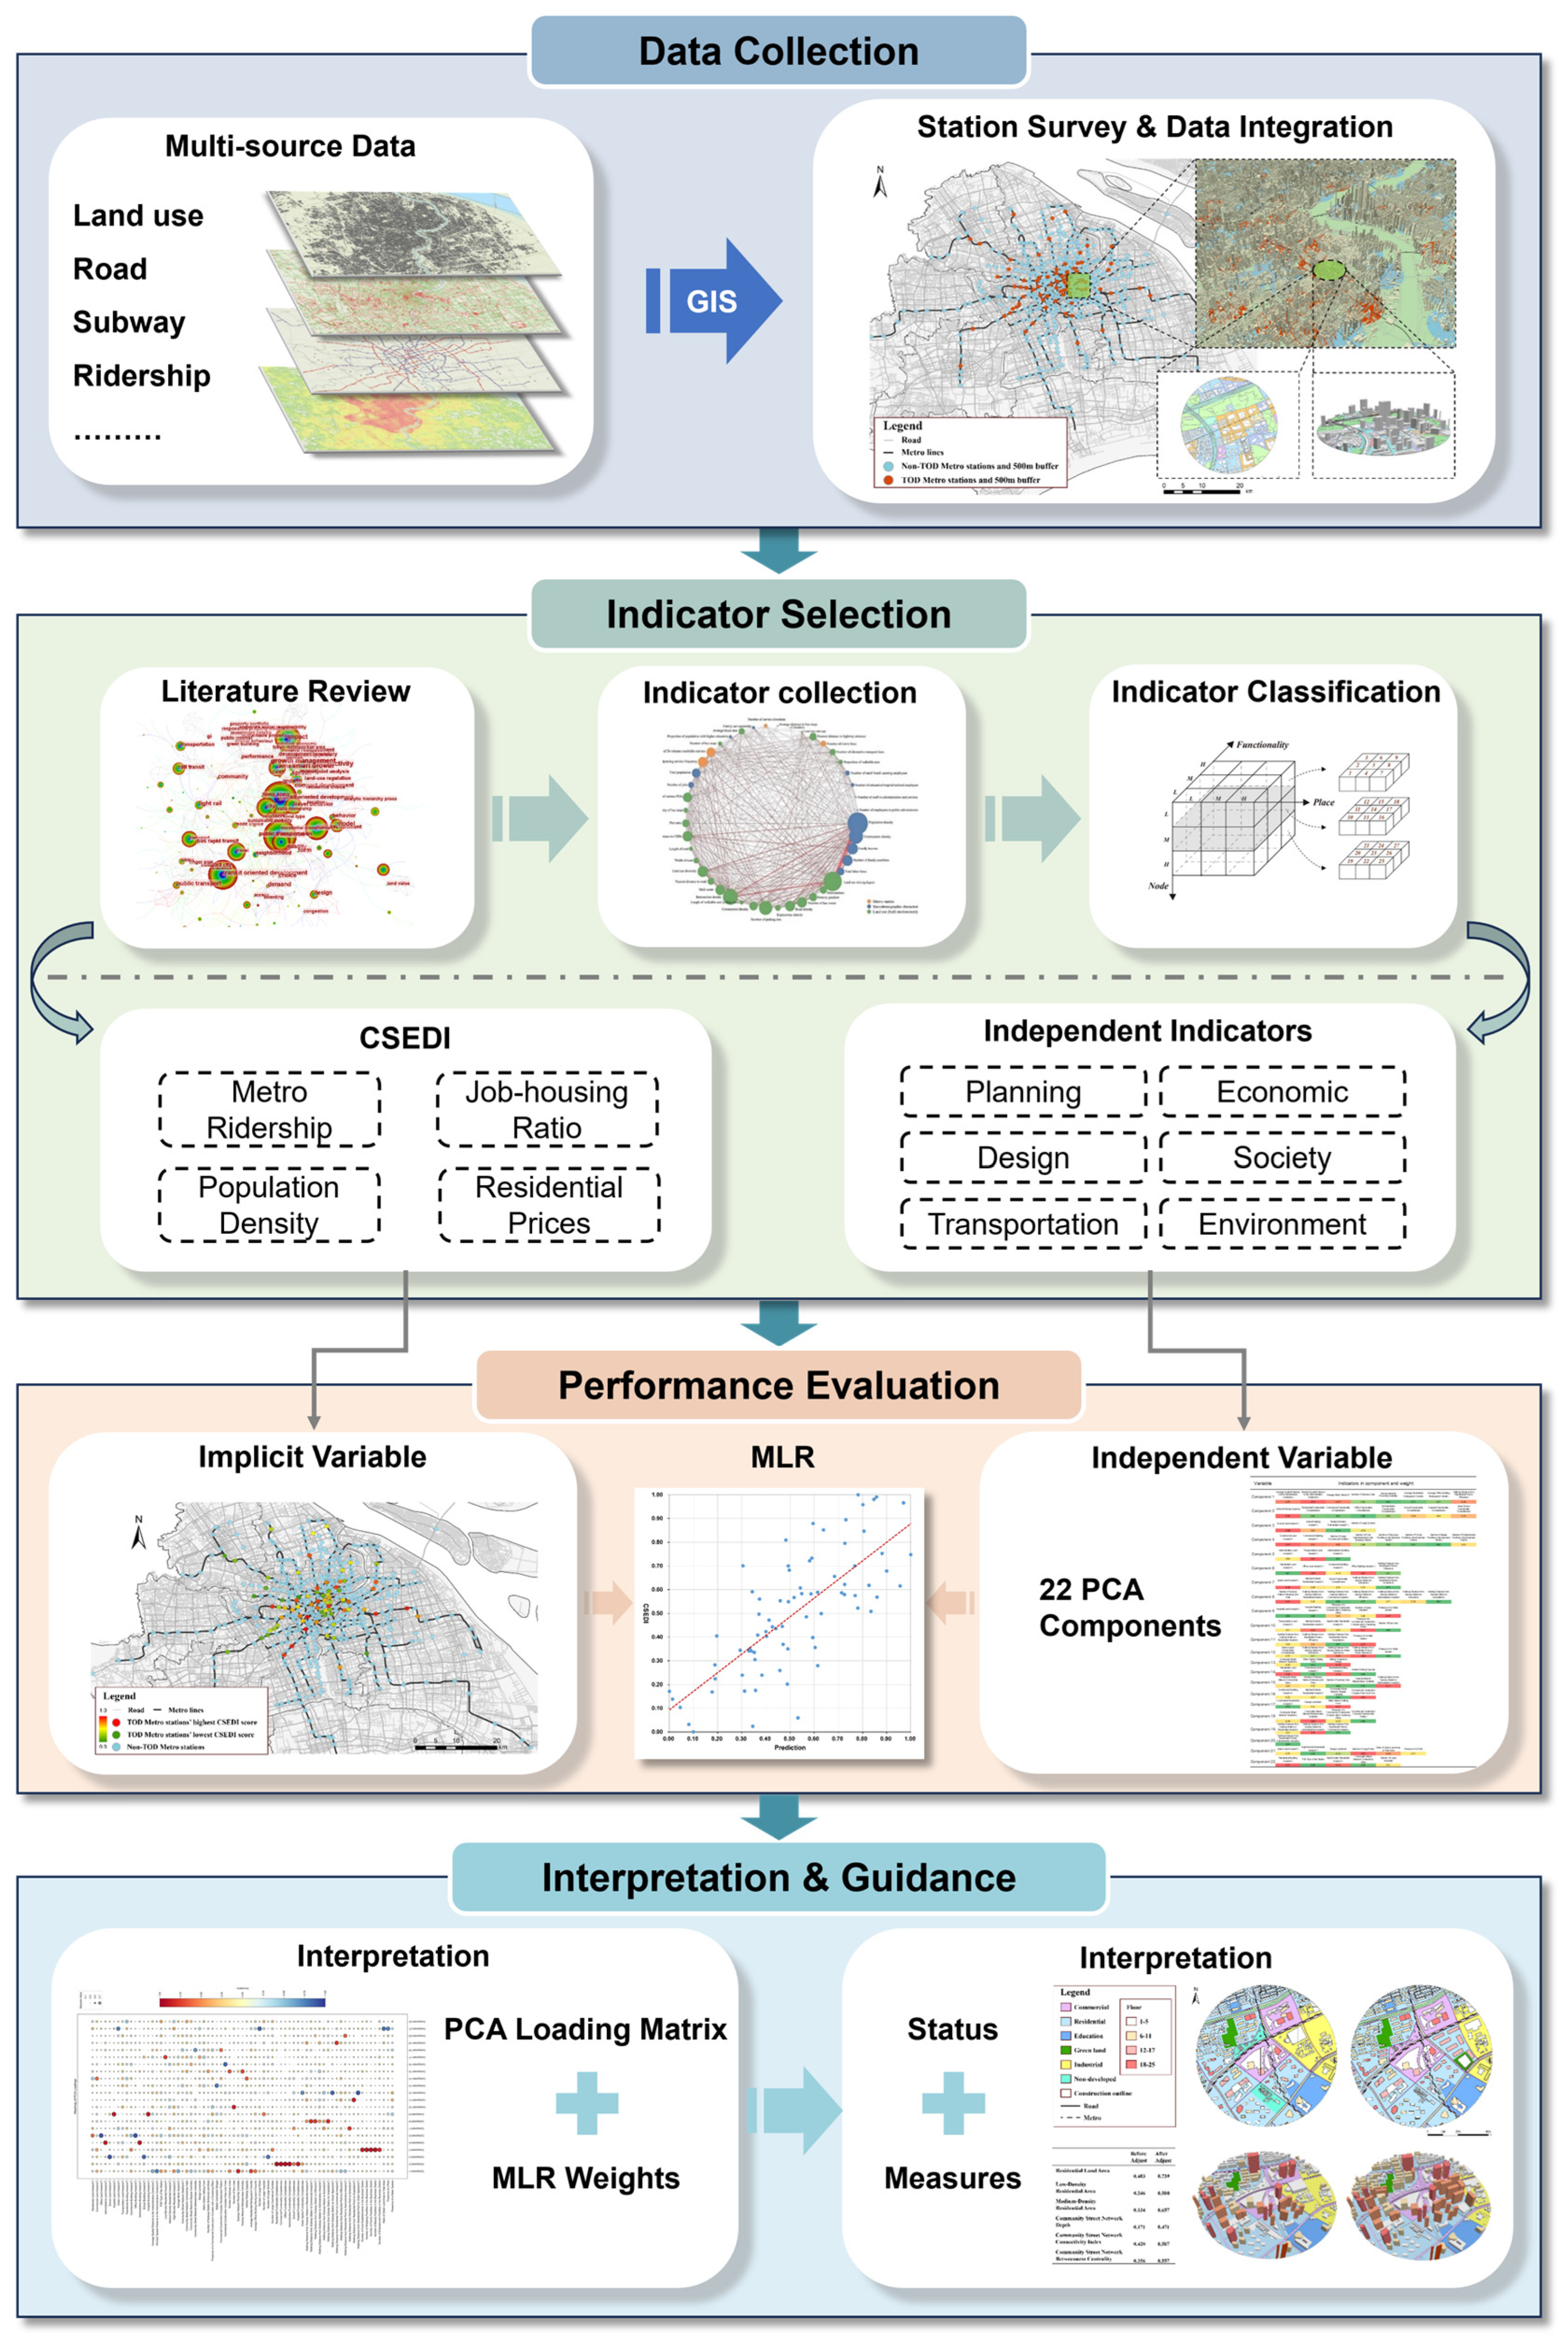
2. Materials and Methods
2.1. Previous Literature
2.2. Method for Evaluating Shanghai’s Rail Transit Network
2.2.1. Study Area
2.2.2. Data Source
- Three-dimensional road network generation: utilizing spatial data on road fold lines and intersections, we constructed a comprehensive model of Shanghai’s road network, including underground passages, ground-level roads, and elevated flyovers, alongside pedestrian crossings and station access points.
- Data integration: we harmonized the POI data with real estate transactions, which were further linked to building outlines. This integrated dataset was then connected to the road network, incorporating details from building entrances and exits.
2.2.3. Indicator Selection
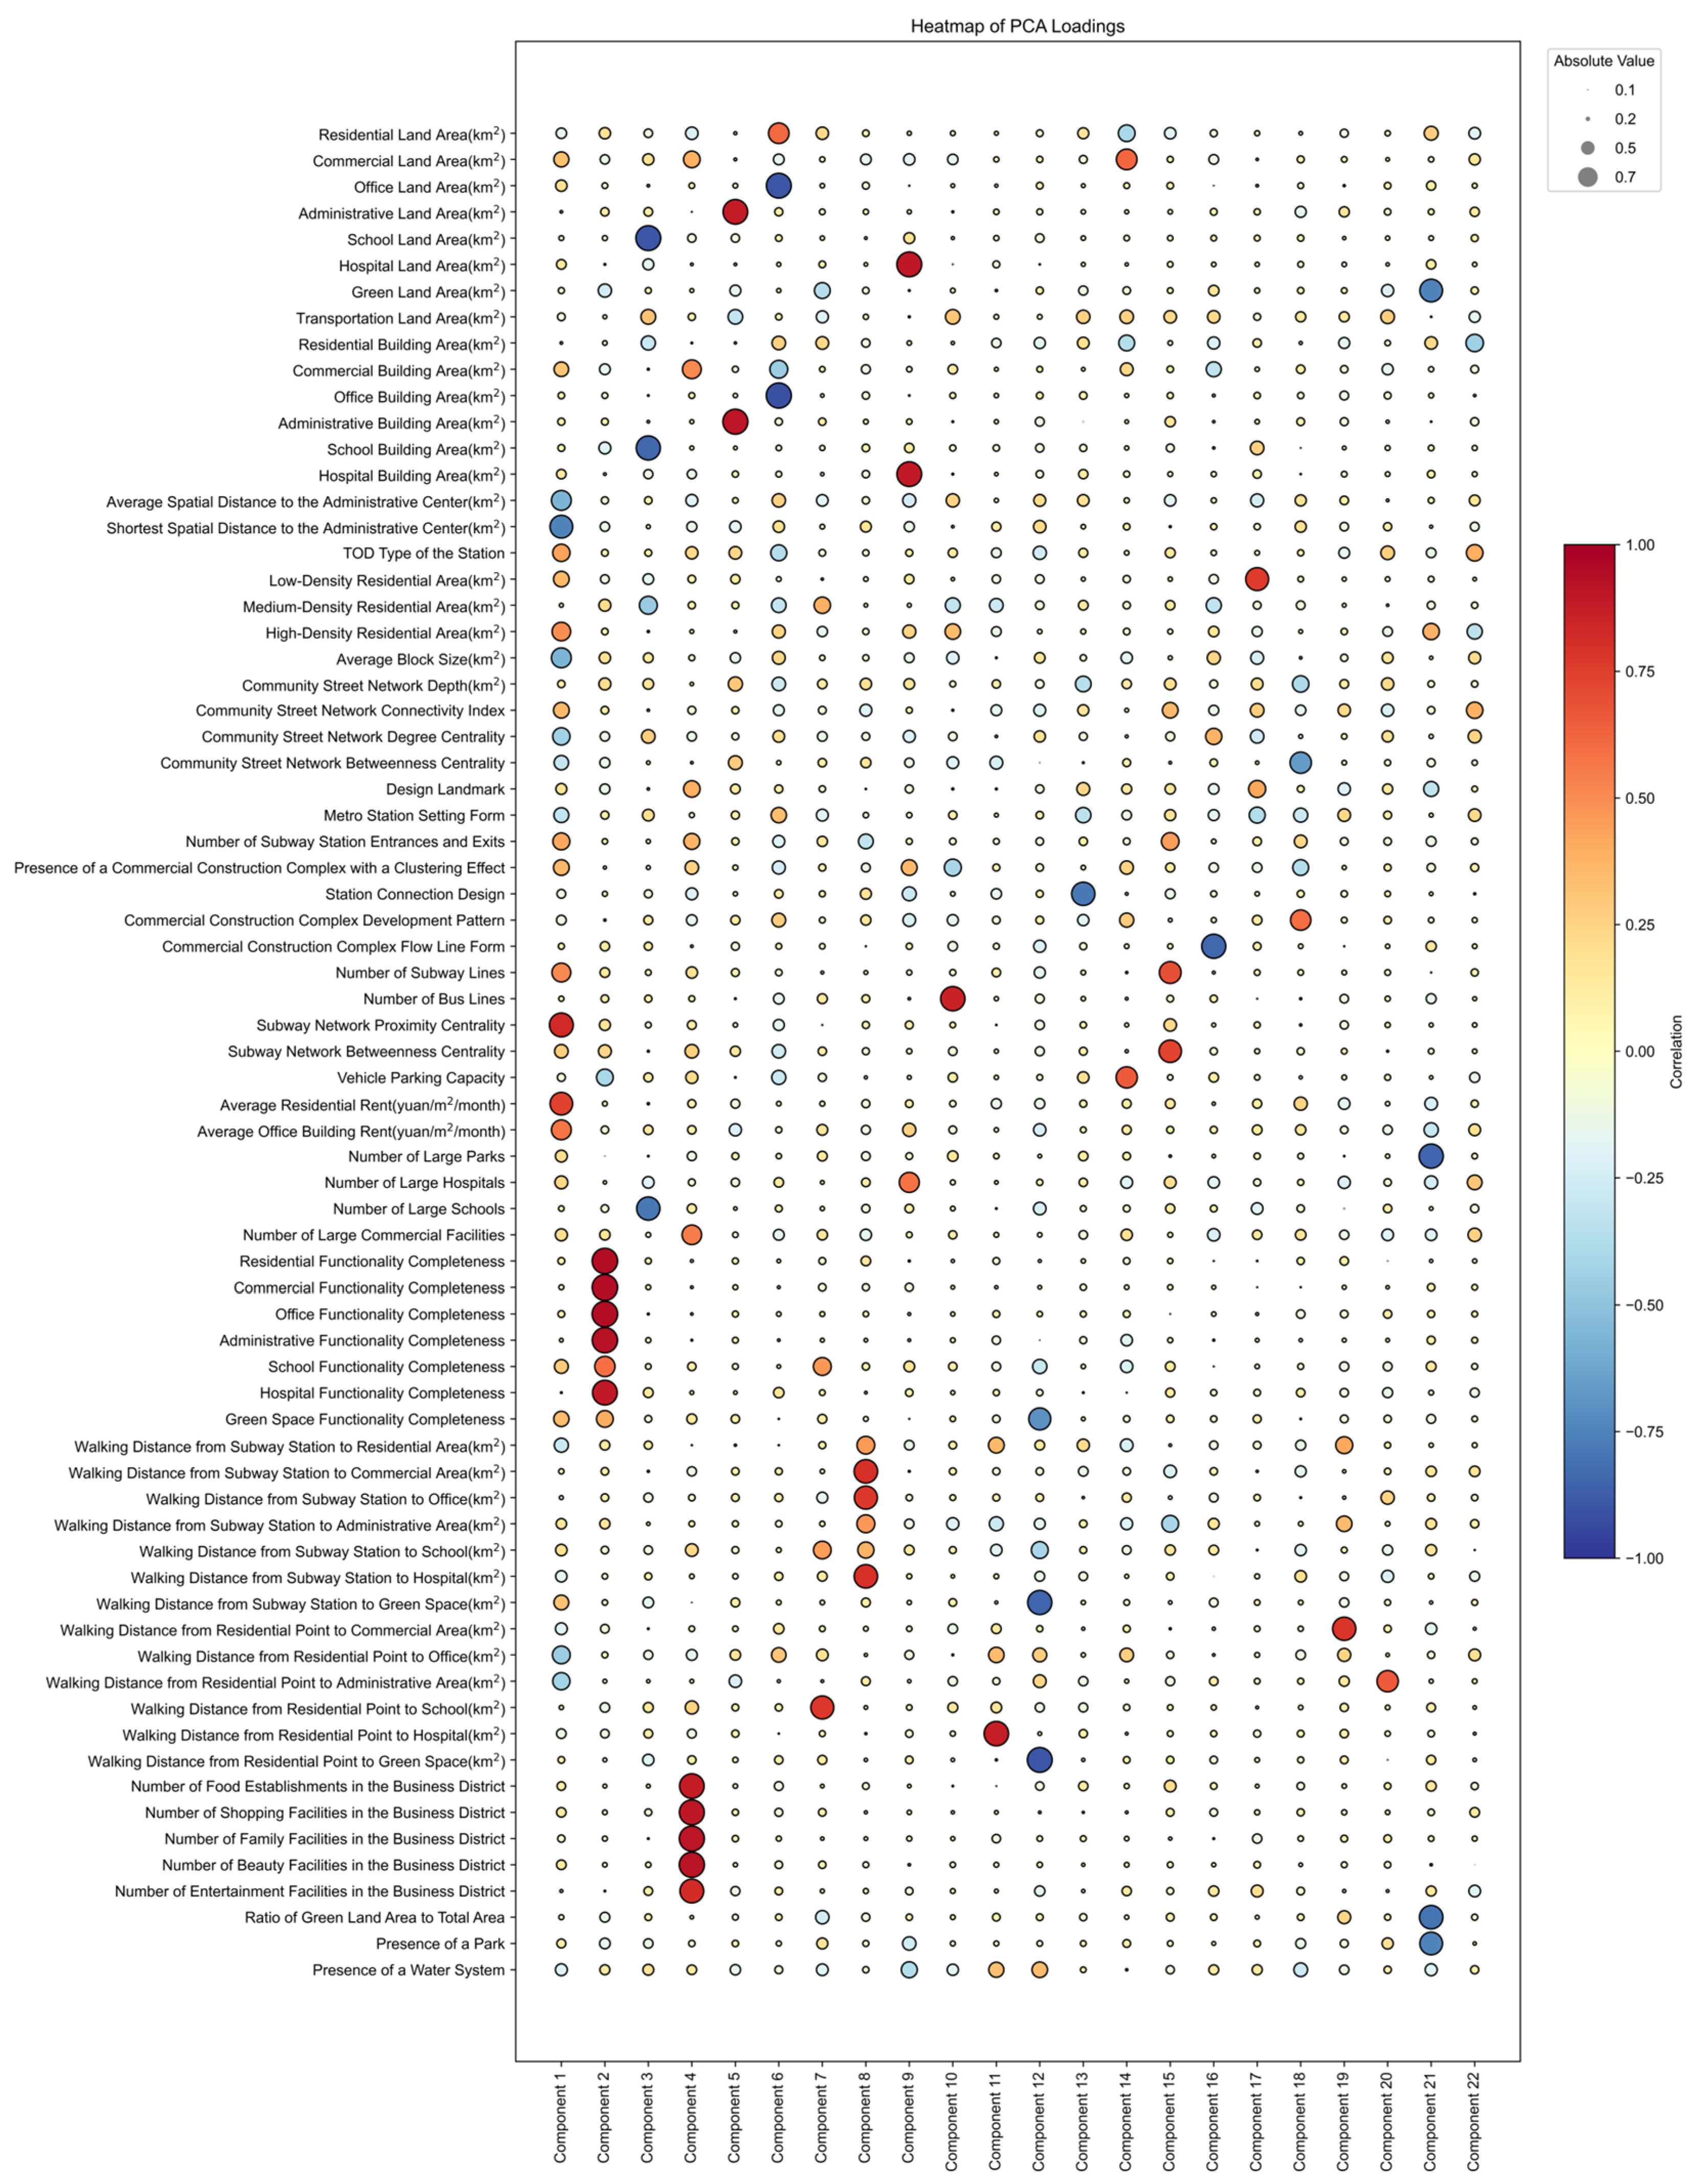
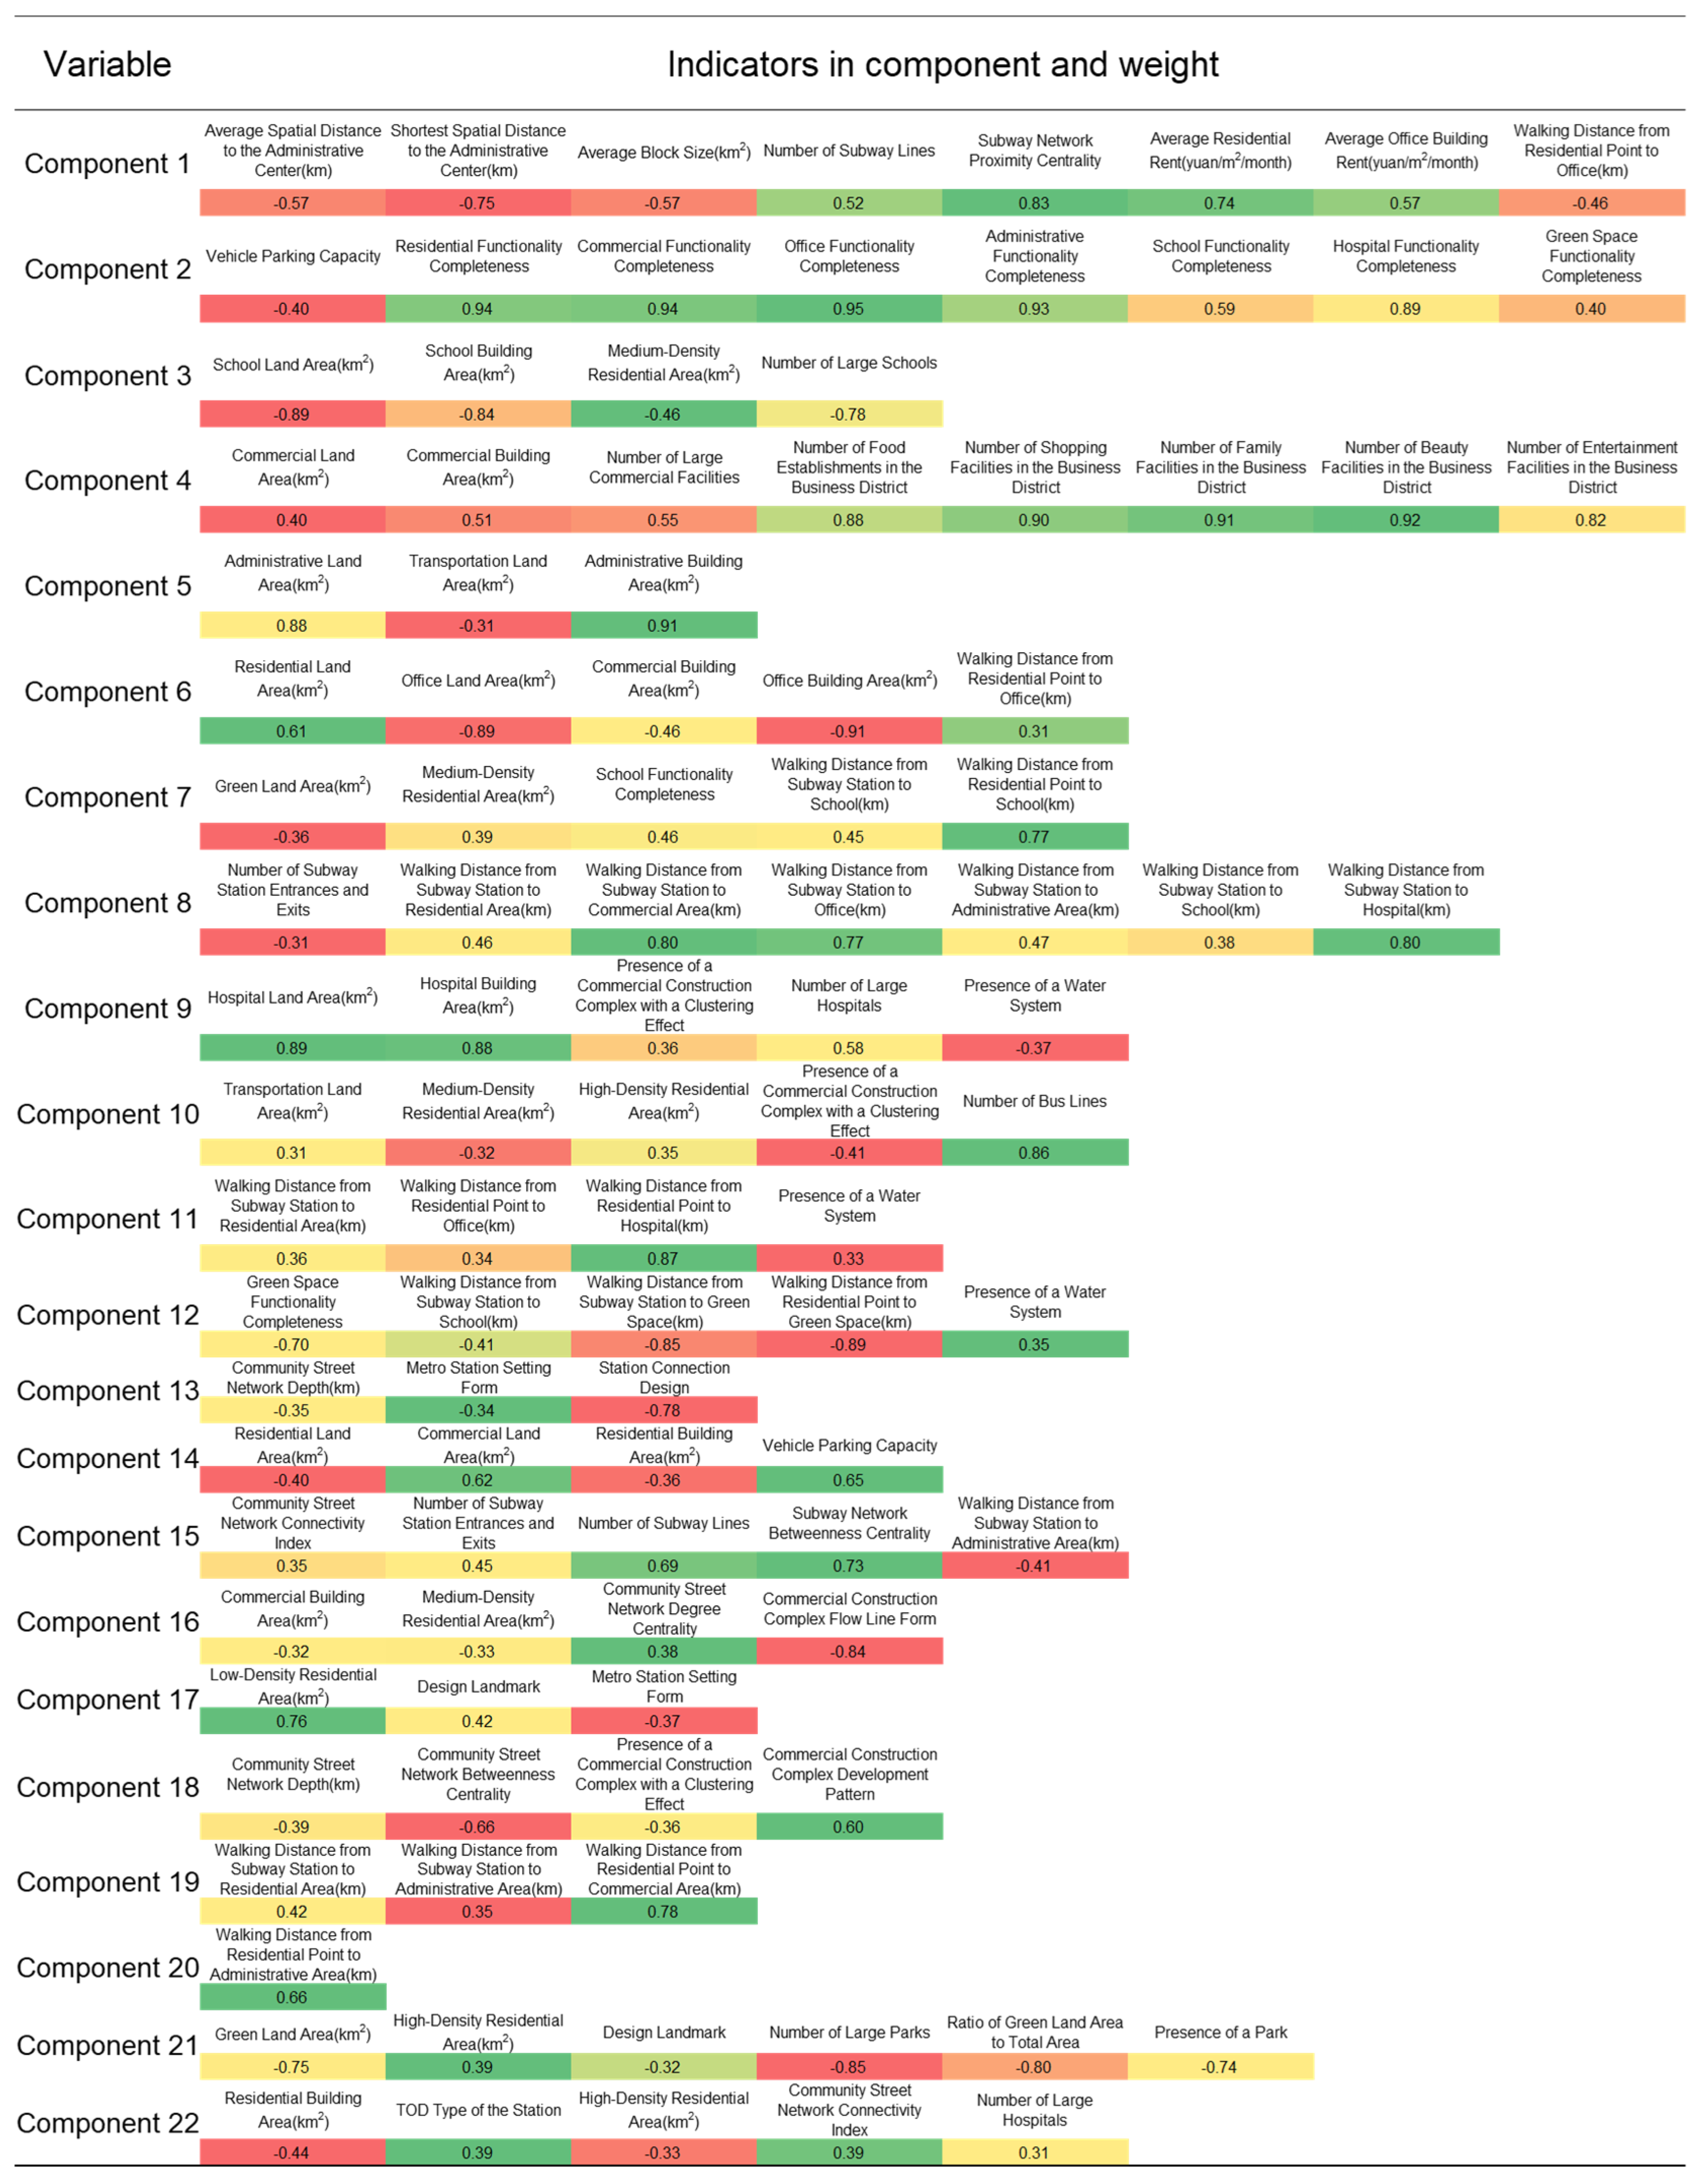
2.2.4. Principal Component Analysis and Regression Analysis
3. Results
3.1. Interpretation of the Principal Component Analysis Results
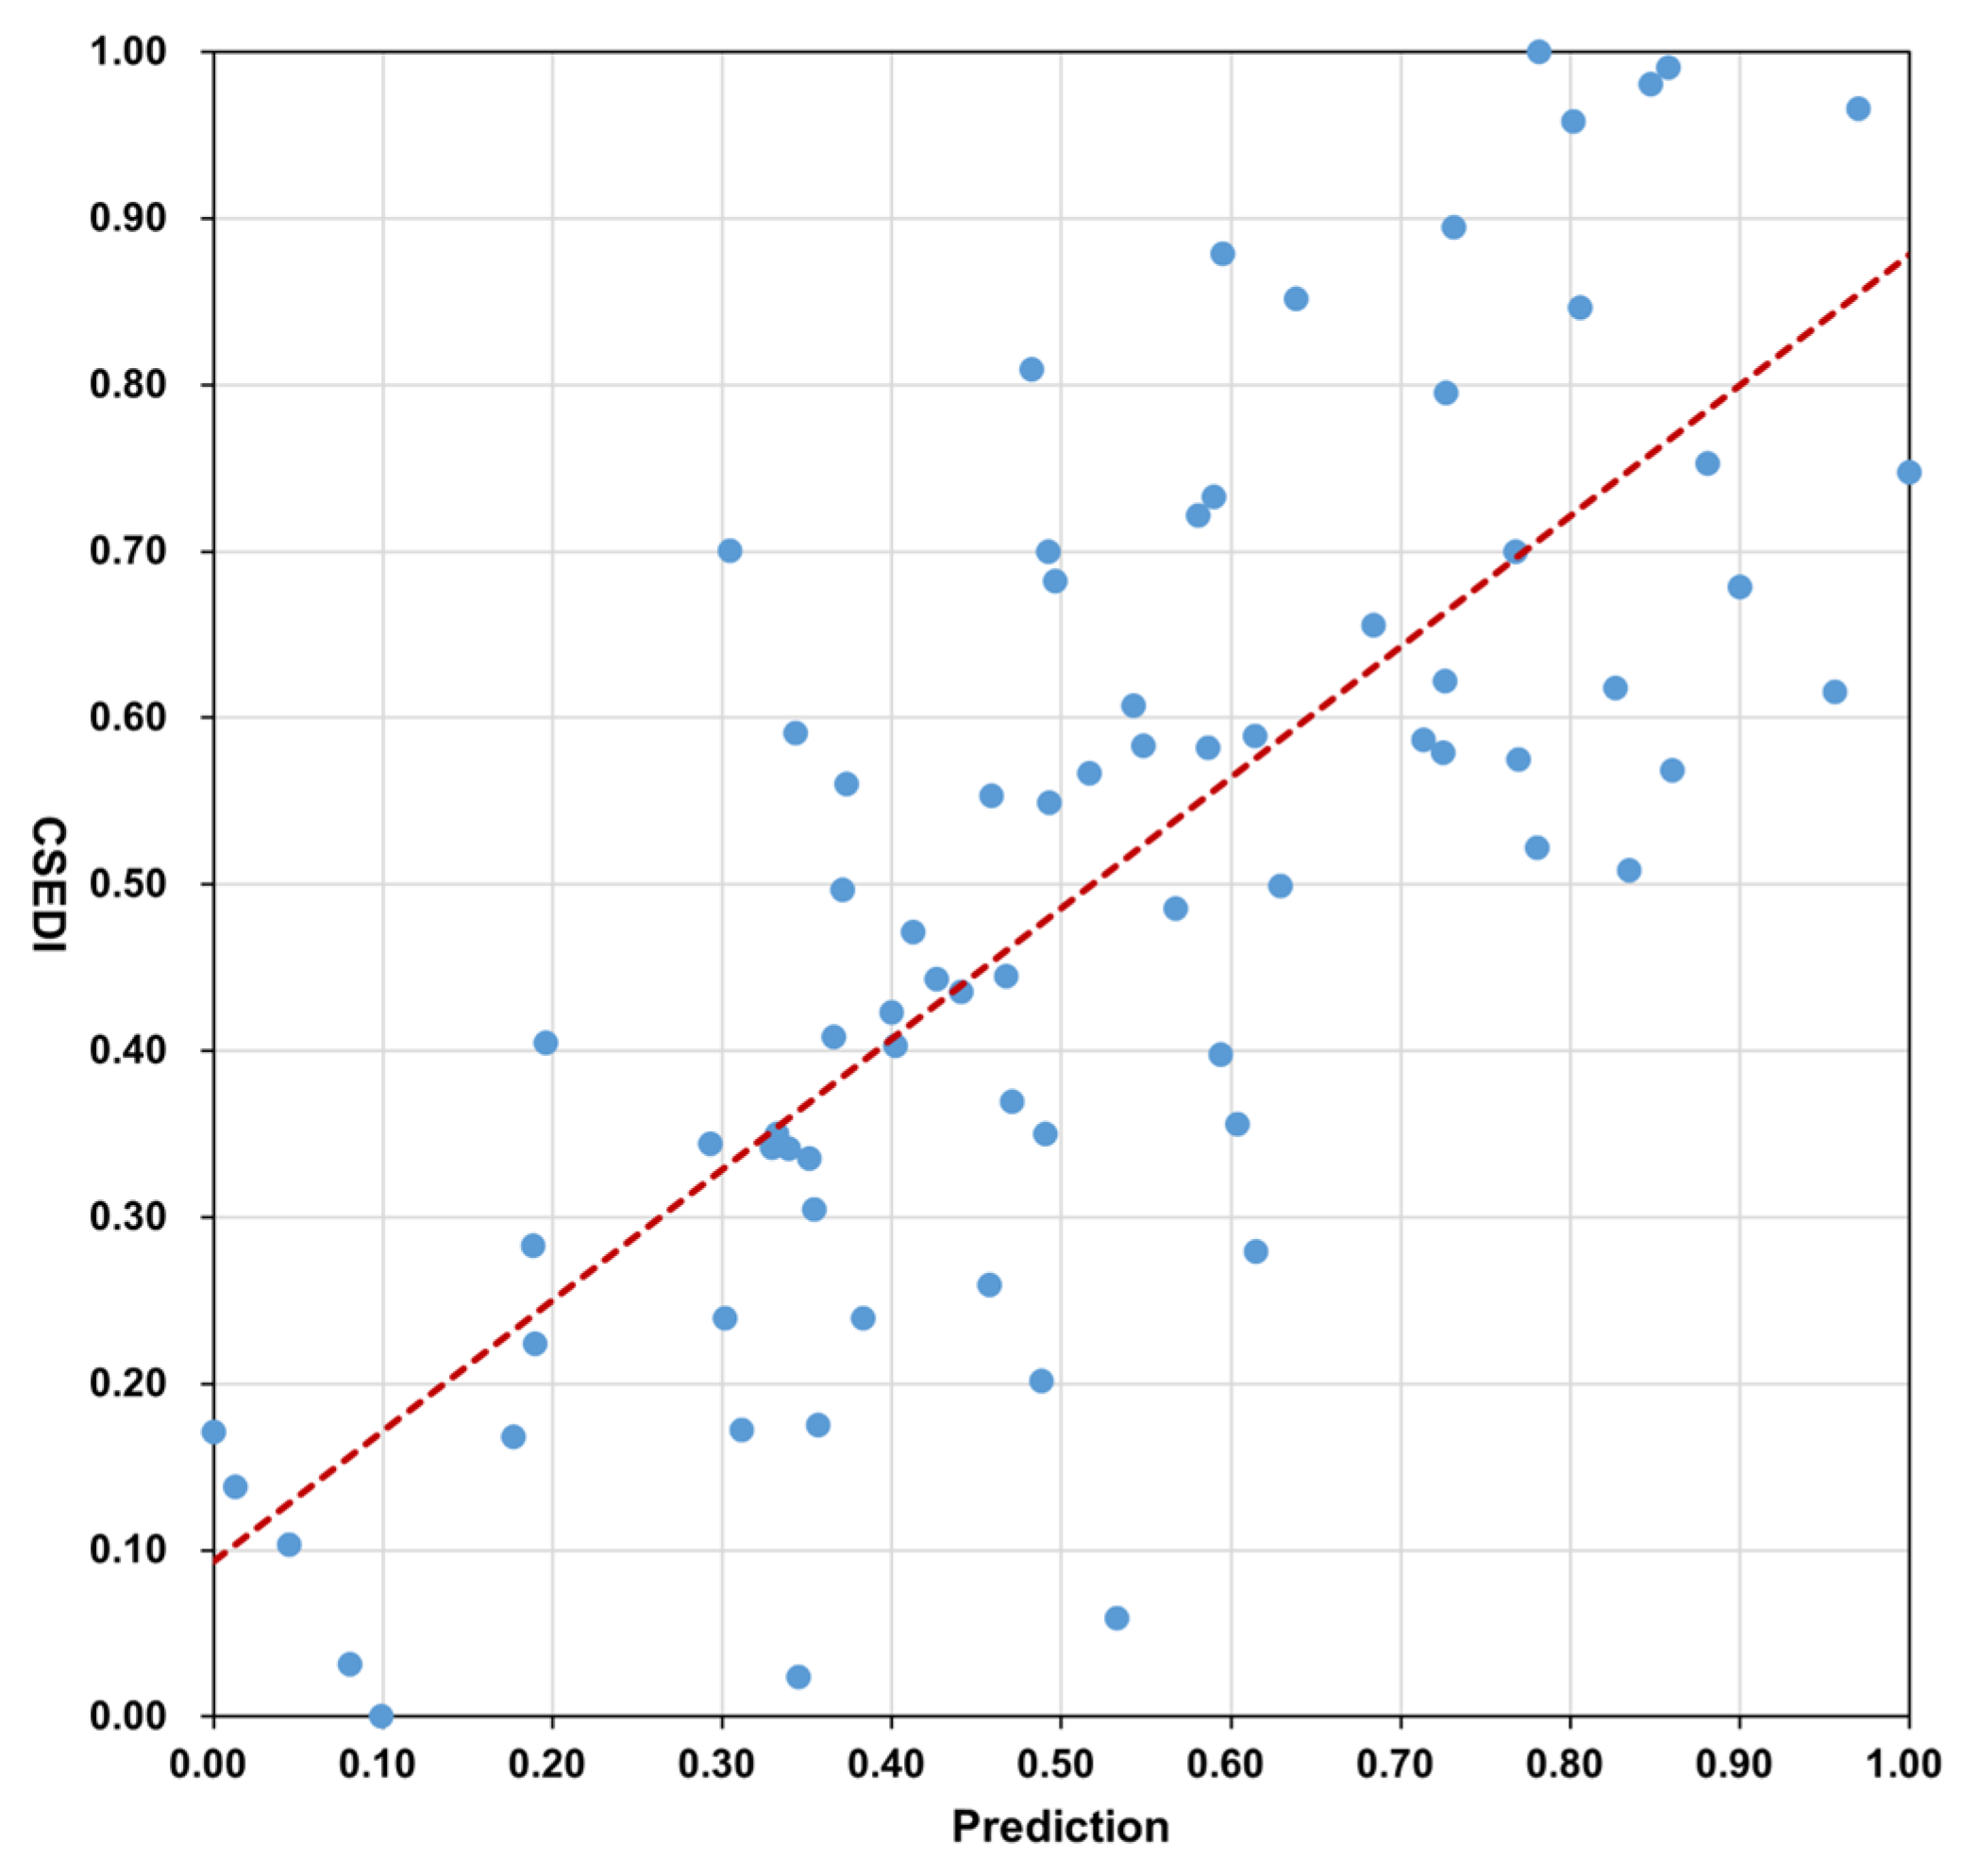
3.2. Interpretation of the Regression Model Results
4. Discussion
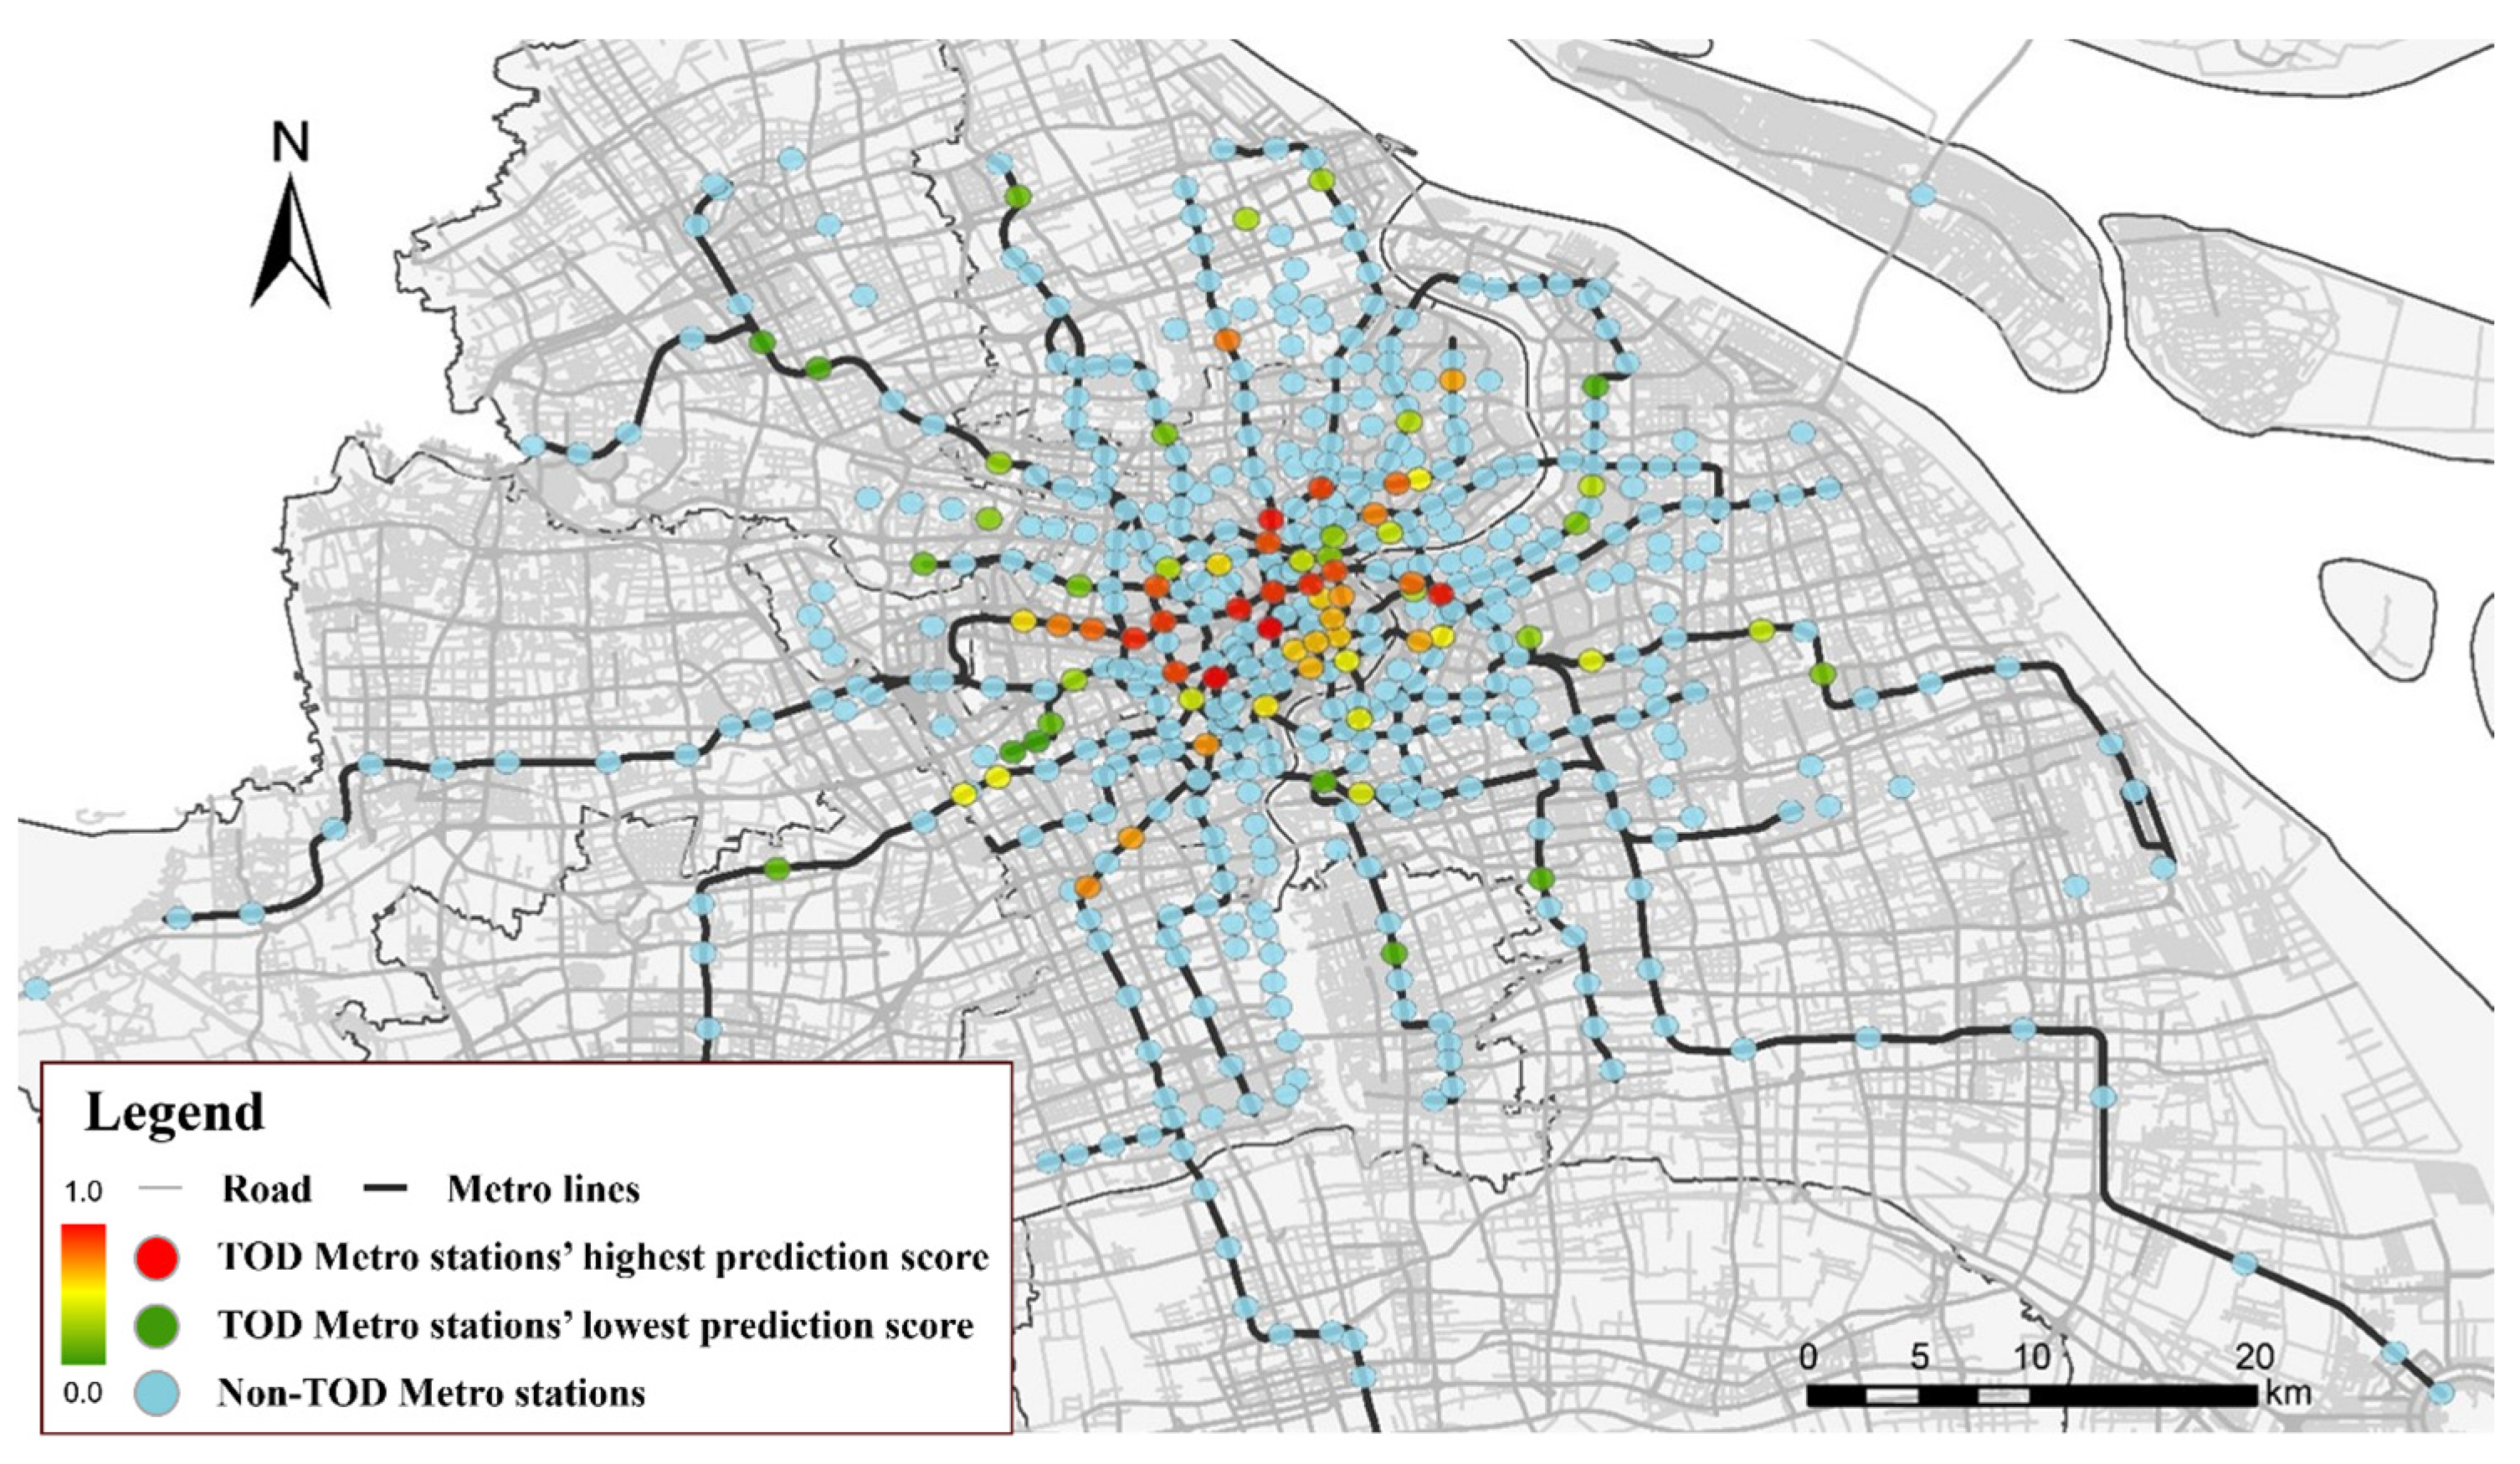
4.1. Spatial Analysis of TOD Performance
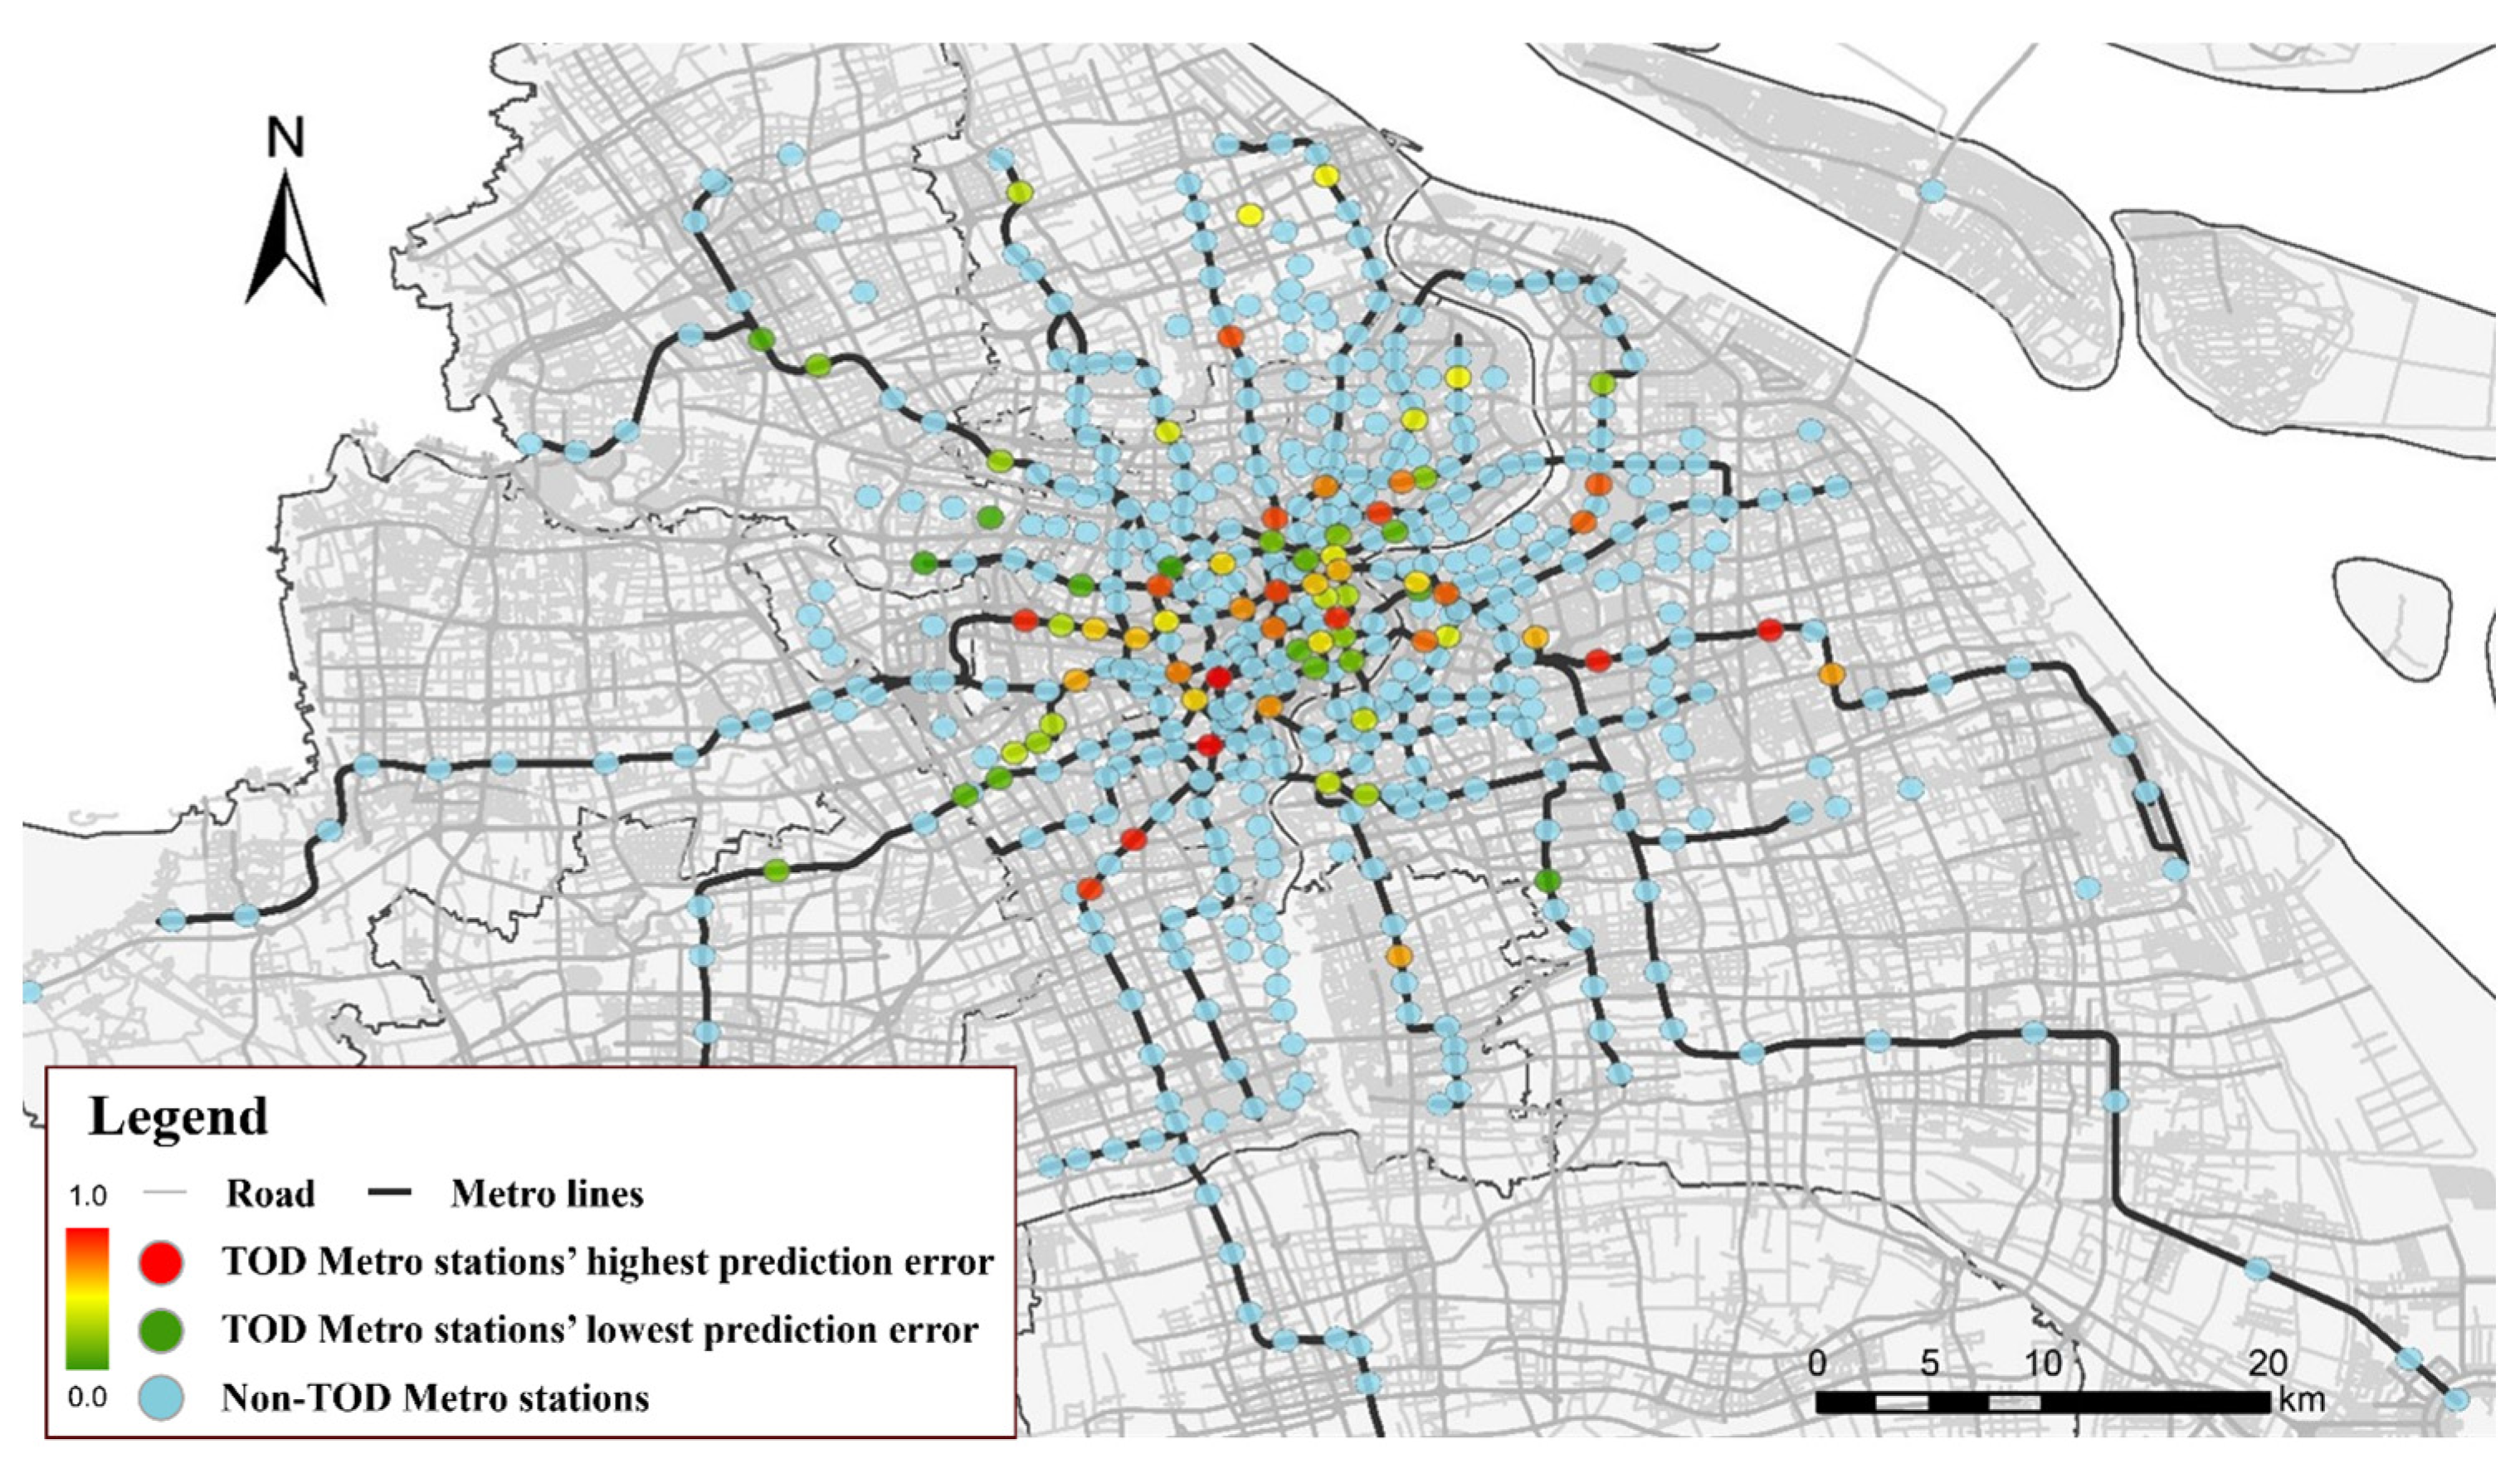
4.2. Discrepancies in the Model Predictions and CSEDI Scores
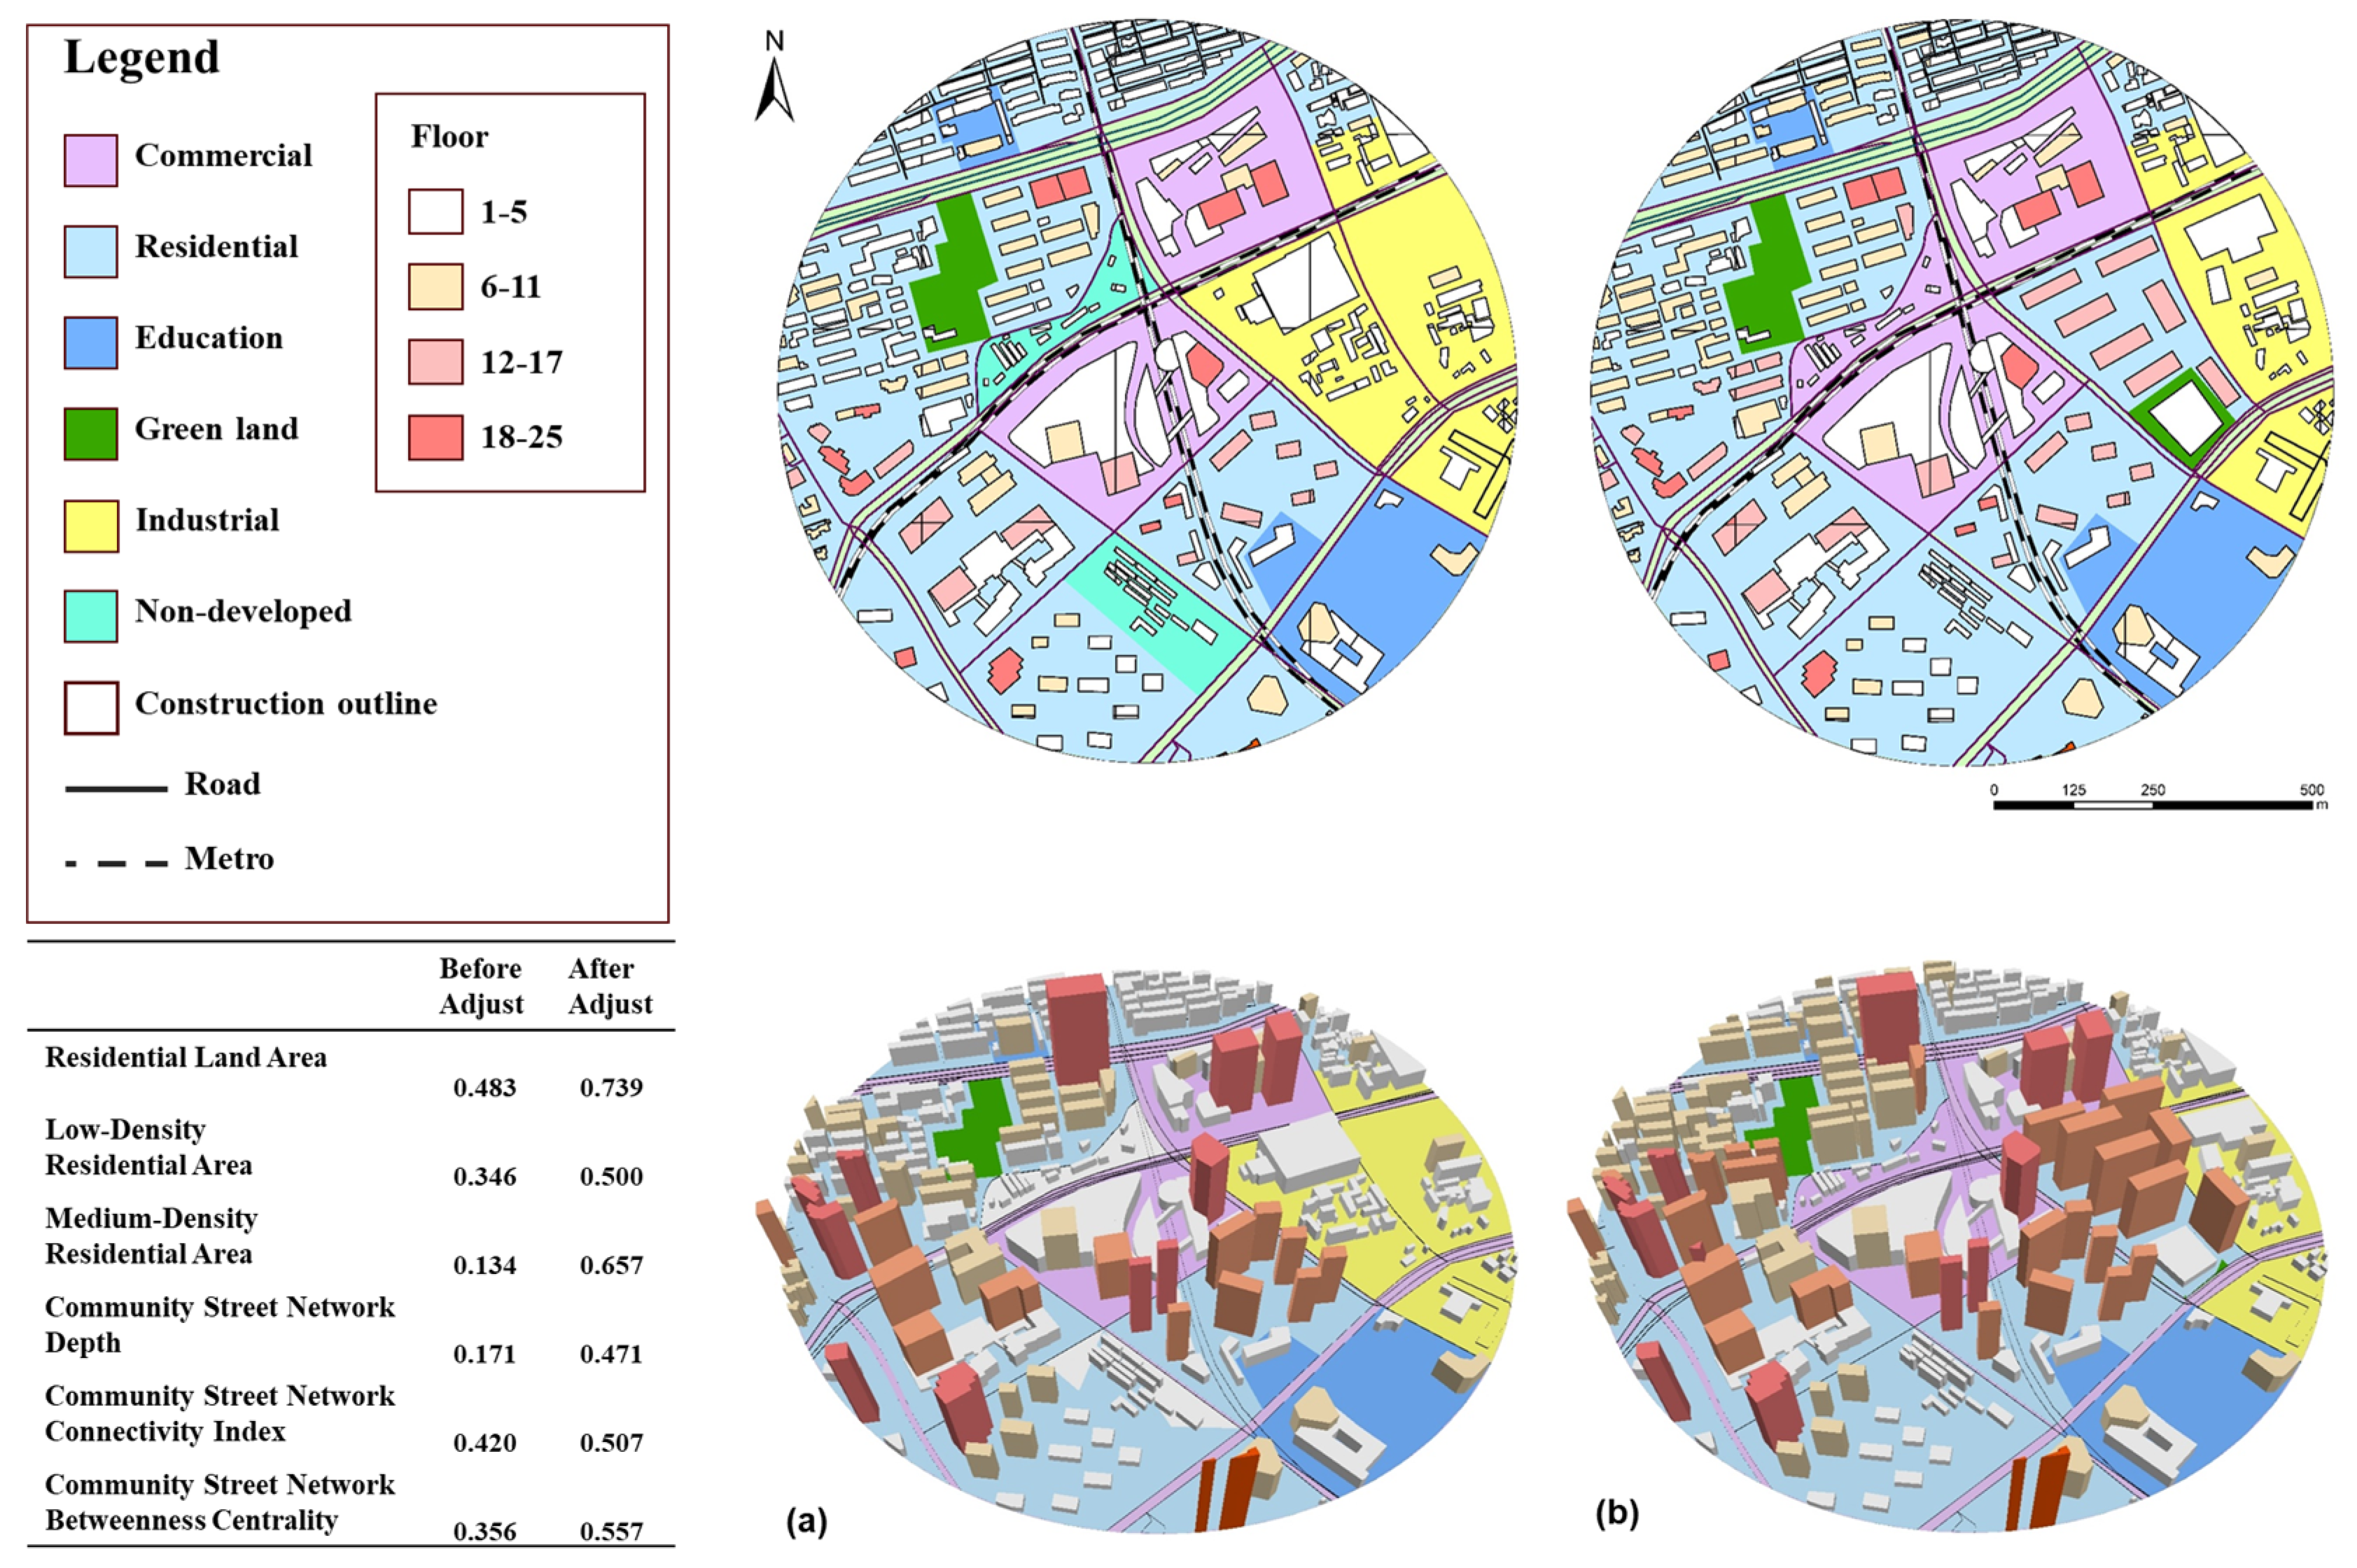
4.3. Optimizing Transit-Oriented Development through Strategic Planning and Design
5. Conclusions
6. Possible Directions for Future Studies
Author Contributions
Funding
Data Availability Statement
Acknowledgments
Conflicts of Interest
References
- Han, B.; Yang, Z.; Yu, Y.; Qian, L.; Chen, J.; Ran, J.; Sun, Y.; Xi, Z.; Lu, F. Statistical analysis of urban rail transit operation in the world in 2020: A review. Urban Rapid. Rail. Transit. 2021, 34, 5–11. [Google Scholar]
- Gao, W.; Sun, X.L.; Zhao, M.; Gao, Y.; Ding, H.R. Evaluate Human Perception of the Built Environment in the Metro Station Area. Land 2024, 13, 90. [Google Scholar] [CrossRef]
- Bai, L.; Xie, L.; Li, C.; Yuan, S.; Niu, D.; Wang, T.; Yang, Z.; Zhang, Y. The Conceptual Framework of Smart TOD: An Integration of Smart City and TOD. Land 2023, 12, 664. [Google Scholar] [CrossRef]
- Cervero, R.; Rood, T.; Appleyard, B. Tracking accessibility: Employment and housing opportunities in the San Francisco Bay Area. Environ. Plan. A 1999, 31, 1259–1278. [Google Scholar] [CrossRef]
- Vale, D.S. Transit-oriented development, integration of land use and transport, and pedestrian accessibility: Combining node-place model with pedestrian shed ratio to evaluate and classify station areas in Lisbon. J. Transp. Geogr. 2015, 45, 70–80. [Google Scholar] [CrossRef]
- Knowles, R.D.; Ferbrache, F.; Nikitas, A. Transport’s historical, contemporary and future role in shaping urban development: Re-evaluating transit oriented development. Cities 2020, 99, 102607. [Google Scholar] [CrossRef]
- Caset, F.; Derudder, B.; Witlox, F.; Teixeira, F.M.; Boussauw, K. Planning for nodes, places, and people in Flanders and Brussels: An empirical railway station assessment tool for strategic decision-making. J. Transp. Land Use 2019, 12, 811–837. [Google Scholar] [CrossRef]
- Li, Z.; Han, Z.; Xin, J.; Luo, X.; Su, S.; Weng, M. Transit oriented development among metro station areas in Shanghai, China: Variations, typology, optimization and implications for land use planning. Land Use Policy 2019, 82, 269–282. [Google Scholar] [CrossRef]
- Thomas, R.; Pojani, D.; Lenferink, S.; Bertolini, L.; Stead, D.; van der Krabben, E. Is transit-oriented development (TOD) an internationally transferable policy concept? Reg. Stud. 2018, 52, 1201–1213. [Google Scholar] [CrossRef]
- Wu, W.; Divigalpitiya, P. Assessment of Accessibility and Activity Intensity to Identify Future Development Priority TODs in Hefei City. Land 2022, 11, 1590. [Google Scholar] [CrossRef]
- Ibraeva, A.; de Almeida Correia, G.H.; Silva, C.; Antunes, A.P. Transit-oriented development: A review of research achievements and challenges. Transp. Res. Part A Policy Pract. 2020, 132, 110–130. [Google Scholar] [CrossRef]
- Calthorpe, P. The Next American Metropolis: Ecology, Community, and the American Dream; Princeton Architectural Press: New York, NY, USA, 1993. [Google Scholar]
- Cervero, R.; Kockelman, K. Travel demand and the 3Ds: Density, diversity, and design. Transp. Res. Part D Transp. Environ. 1997, 2, 199–219. [Google Scholar] [CrossRef]
- Wey, W.-M.; Zhang, H.; Chang, Y.-J. Alternative transit-oriented development evaluation in sustainable built environment planning. Habitat. Int. 2016, 55, 109–123. [Google Scholar] [CrossRef]
- Thomas, R.; Bertolini, L. Defining critical success factors in TOD implementation using rough set analysis. J. Transp. Land Use 2017, 10, 139–154. [Google Scholar] [CrossRef]
- Bertolini, L. Nodes and places: Complexities of railway station redevelopment. Eur. Plan. Stud. 1996, 4, 331–345. [Google Scholar] [CrossRef]
- Cervero, R. Transit-Oriented Development in the United States: Experiences, Challenges, and Prospects; The National Academies Press: Washington, DC, USA, 2004. [Google Scholar]
- Lyu, G.; Bertolini, L.; Pfeffer, K. Developing a TOD typology for Beijing metro station areas. J. Transp. Geogr. 2016, 55, 40–50. [Google Scholar] [CrossRef]
- Jamme, H.-T.; Rodriguez, J.; Bahl, D.; Banerjee, T. A twenty-five-year biography of the TOD concept: From design to policy, planning, and implementation. J. Plan. Educ. Res. 2019, 39, 409–428. [Google Scholar] [CrossRef]
- Rodríguez, D.A.; Kang, C.D. A typology of the built environment around rail stops in the global transit-oriented city of Seoul, Korea. Cities 2020, 100, 102663. [Google Scholar] [CrossRef]
- Huang, R.; Grigolon, A.; Madureira, M.; Brussel, M. Measuring transit-oriented development (TOD) network complementarity based on TOD node typology. J. Transp. Land Use 2018, 11, 305–324. [Google Scholar] [CrossRef]
- Zhang, L.Z.; Hou, P.; Qiang, D. Transit-Oriented Development in New Towns: Identifying Its Association with Urban Function in Shanghai, China. Buildings 2022, 12, 1394. [Google Scholar] [CrossRef]
- Amini Pishro, A.; L’Hostis, A.; Chen, D.; Amini Pishro, M.; Zhang, Z.; Li, J.; Zhao, Y.; Zhang, L. The Integrated ANN-NPRT-HUB Algorithm for Rail-Transit Networks of Smart Cities: A TOD Case Study in Chengdu. Buildings 2023, 13, 1944. [Google Scholar] [CrossRef]
- Amini Pishro, A.; Yang, Q.; Zhang, S.; Amini Pishro, M.; Zhang, Z.; Zhao, Y.; Postel, V.; Huang, D.; Li, W. Node, place, ridership, and time model for rail-transit stations: A case study. Sci. Rep. 2022, 12, 16120. [Google Scholar] [CrossRef] [PubMed]
- Shi, D.H.; Fu, M.C. How Does Rail Transit Affect the Spatial Differentiation of Urban Residential Prices? A Case Study of Beijing Subway. Land 2022, 11, 1729. [Google Scholar] [CrossRef]
- Singh, Y.; Zuidgeest, M.; Flacke, J.; van Maarseveen, M. A design framework for measuring transit oriented development. WIT Trans. Built Environ. 2012, 128, 719–730. [Google Scholar]
- Seong, E.Y.; Lee, N.H.; Choi, C.G. Relationship between Land Use Mix and Walking Choice in High-Density Cities: A Review of Walking in Seoul, South Korea. Sustainability 2021, 13, 810. [Google Scholar] [CrossRef]
- Pan, H.J.; Huang, Y. TOD typology and station area vibrancy: An interpretable machine learning approach. Transp. Res. Part A Policy Pract. 2024, 186, 104150. [Google Scholar] [CrossRef]
- Shuai, C.; Shan, J.; Bai, J.; Lee, J.; He, M.; Ouyang, X. Relationship analysis of short-term origin–destination prediction performance and spatiotemporal characteristics in urban rail transit. Transp. Res. Part A Policy Pract. 2022, 164, 206–223. [Google Scholar] [CrossRef]
- Singh, Y.J.; Lukman, A.; Flacke, J.; Zuidgeest, M.; Van Maarseveen, M. Measuring TOD around transit nodes-Towards TOD policy. Transp. Policy 2017, 56, 96–111. [Google Scholar] [CrossRef]
- Singh, Y.J.; He, P.; Flacke, J.; Maarseveen, M. Measuring TOD over a region using GIS based multiple criteria assessment tools. Space 2015, 19, 1–22. [Google Scholar]
- Higgins, C.; Kanaroglou, P. Rapid transit, transit-oriented development, and the contextual sensitivity of land value uplift in Toronto. Urban Stud. 2018, 55, 2197–2225. [Google Scholar] [CrossRef]
- Yi, Z.; Zhang, Z.H.; Wang, H.M. Measuring metro station area’s TODness: An exploratory study of Shenyang based on multi-source urban data. Trans. GIS 2024, 28, 623–653. [Google Scholar] [CrossRef]
- Lin, J.-J.; Lin, T.-Y.; Kadali, B.R.; Subbarao, S.S. Zone-based TOD evaluation considering interdependences among criteria and zones. Transp. Policy 2023, 133, 108–119. [Google Scholar] [CrossRef]
- Li, S.; Chen, L.; Zhao, P. The impact of metro services on housing prices: A case study from Beijing. Transportation 2019, 46, 1291–1317. [Google Scholar] [CrossRef]
- Nelson, A.C.; Eskic, D.; Hamidi, S.; Petheram, S.J.; Ewing, R.; Liu, J.H. Office rent premiums with respect to light rail transit stations: Case study of Dallas, Texas, with implications for planning of transit-oriented development. Transp. Res. Rec. 2015, 2500, 110–115. [Google Scholar] [CrossRef]
- Qiang, D.; Zhang, L.; Huang, X. Quantitative evaluation of TOD performance based on multi-source data: A case study of Shanghai. Front. Public Health 2022, 10, 820694. [Google Scholar] [CrossRef] [PubMed]
- Sung, H.; Oh, J.-T. Transit-oriented development in a high-density city: Identifying its association with transit ridership in Seoul, Korea. Cities 2011, 28, 70–82. [Google Scholar] [CrossRef]
- Cucuzzella, C.; Owen, J.; Goubran, S.; Walker, T. A TOD index integrating development potential, economic vibrancy, and socio-economic factors for encouraging polycentric cities. Cities 2022, 131, 103980. [Google Scholar] [CrossRef]
- Zhang, T.; Yan, Y.B.; Chen, Q.; Liu, Z. Evaluation Method of Composite Development Bus Terminal Using Multi-Source Data Processing. Land 2022, 11, 1757. [Google Scholar] [CrossRef]
- Zhao, Y.R.; Hu, S.H.; Zhang, M. Evaluating equitable Transit-Oriented development (TOD) via the Node-Place-People model. Transp. Res. Part A-Policy Pract. 2024, 185, 104116. [Google Scholar] [CrossRef]
- Huang, J.; Chen, S.; Xu, Q.; Chen, Y.; Hu, J. Relationship between built environment characteristics of TOD and subway ridership: A causal inference and regression analysis of the Beijing subway. J. Rail Transp. Plan. Manag. 2022, 24, 100341. [Google Scholar] [CrossRef]
- An, D.D.; Tong, X.; Liu, K.; Chan, E.H.W. Understanding the impact of built environment on metro ridership using open source in Shanghai. Cities 2019, 93, 177–187. [Google Scholar] [CrossRef]
- Shanghai Municipal Transportation Commission. 2023 Shanghai Urban Rail Transit Service Quality Evaluation Results. 2023. Available online: https://jtw.sh.gov.cn/zxzfxx/20240208/b00cc25787c84ab08c415eb49e38b2de.html (accessed on 8 February 2024).
- Dittmar, H.; Ohland, G. The New Transit Town: Best Practices in Transit-Oriented Development; Island Press: Washington, DC, USA, 2012. [Google Scholar]
- Cervero, R.; Murakami, J. Rail and property development in Hong Kong: Experiences and extensions. Urban Stud. 2009, 46, 2019–2043. [Google Scholar] [CrossRef]
- Bertolini, L. Spatial development patterns and public transport: The application of an analytical model in the Netherlands. Plan. Pract. Res. 1999, 14, 199–210. [Google Scholar] [CrossRef]
- Su, S.L.; Wang, Z.L.; Li, B.Z.; Kang, M.J. Deciphering the influence of TOD on metro ridership: An integrated approach of extended node-place model and interpretable machine learning with planning implications. J. Transp. Geogr. 2022, 104, 103455. [Google Scholar] [CrossRef]
- Su, S.L.; Zhang, H.; Wang, M.; Weng, M.; Kang, M.J. Transit-oriented development (TOD) typologies around metro station areas in urban China: A comparative analysis of five typical megacities for planning implications. J. Transp. Geogr. 2021, 90, 102939. [Google Scholar] [CrossRef]
- Salat, S.; Ollivier, G. Transforming the Urban Space through Transit-Oriented Development: The 3V Approach; World Bank: Washington, DC, USA, 2017. [Google Scholar]
- Suzuki, H.; Cervero, R.; Iuchi, K. Transforming Cities with Transit: Transit and Land-Use Integration for Sustainable Urban Development; World Bank Publications: Washington, DC, USA, 2013. [Google Scholar]
- Kaiser, H.F. The application of electronic computers to factor analysis. Educ. Psychol. Meas. 1960, 20, 141–151. [Google Scholar] [CrossRef]
- Zhou, J.; Yang, Y.; Gu, P.; Yin, L.; Zhang, F.; Zhang, F.; Li, D. Can TODness improve (expected) performances of TODs? An exploration facilitated by non-traditional data. Transp. Res. Part D Transp. Environ. 2019, 74, 28–47. [Google Scholar] [CrossRef]


| Data Type | Source | Details | Number of Entries |
|---|---|---|---|
| Street Data | OpenStreetMap, Baidu Maps API | Street folds across Shanghai | 686,187 |
| Building Outlines | Baidu Maps API | Detailed building structural layouts | 533,207 |
| Point of Interest (POI) | Gaode Maps API | Detailed local amenities and facilities information | 3,108,959 |
| Population Density | Worldpop.org | High-resolution demographic distribution | 100 m × 100 m raster data |
| Real Estate Transactions | Lianjia.com | Transaction records reflecting real estate market dynamics | 3,178,828 |
| Subway Map Data | Shanghai Metro | Detailed public transportation network layouts | 201,969 |
| Parking Data | Shanghai Parking APP | Operational data for car parks | >5000 parks |
| Land Use Data | EU-LUC-China, OpenStreetMap, Gaode Maps API | Land use classifications | 89,376 |
| Shop Data | Meituan APP | Shops and their functional classifications | 79,813 |
| Dimension | Indicator | Explanation |
|---|---|---|
| Planning | Residential Land Area (km2) | Residential land area within the station’s buffer |
| Commercial Land Area (km2) | Commercial land area within the station’s buffer | |
| Office Land Area (km2) | Office land area within the station’s buffer | |
| Administrative Land Area (km2) | Administrative land area within the station’s buffer | |
| School Land Area (km2) | School land area within the station’s buffer | |
| Hospital Land Area (km2) | Hospital land area within the station’s buffer | |
| Green Land Area (km2) | Green land area within the station’s buffer | |
| Transportation Land Area (km2) | Transportation land area within the station’s buffer | |
| Residential Building Area (km2) | Residential building area within the station’s buffer | |
| Commercial Building Area (km2) | Commercial building area within the station’s buffer | |
| Office Building Area (km2) | Office building area within the station’s buffer | |
| Administrative Building Area (km2) | Administrative building area within the station’s buffer | |
| School Building Area (km2) | School building area within the station’s buffer | |
| Hospital Building Area (km2) | Hospital building area within the station’s buffer | |
| Average Spatial Distance to the Administrative Center (km) | Average of the spatial straight-line distances to the district’s governments | |
| Shortest Spatial Distance to the Administrative Center (km) | Minimum spatial straight-line distance to the district’s governments | |
| Design | TOD Type of the Station | The value is 1: city-level hub sites; the value is 2: general sites in urban areas; the value is 3: sites in urban areas with a primary function of residence; the value is 4: general sites in suburban areas; the value is 5: sites in suburban areas with a primary function of residence. |
| Low-Density Residential Area (km2) | Building area of buildings on the site with fewer than 3 floors | |
| Medium-Density Residential Area (km2) | Building area of buildings on the site with more than 3 floors but fewer than 7 floors | |
| High-Density Residential Area (km2) | Building area of buildings on the site with more than 7 floors | |
| Average Block Size (km2) | Average area of blocks within the site bounded by roads | |
| Community Street Network Depth (km) | Maximum value of the shortest path of the network formed by roads and facilities within the station buffer | |
| Community Street Network Connectivity Index | The ratio of the number of arcs to the number of nodes in the road network within the community | |
| Community Street Network Degree Centrality | A node in the network is denoted as , and the number of roads connected to node is denoted as . The degree of node is as follows: | |
| Community Street Network Betweenness Centrality | Where is the number of shortest paths between nodes and , and is the number of shortest paths between nodes and through node . | |
| Design Landmark | Is it designed to be a notable landmark building or feature? The value is 0: significant; the value is 1: strong; the value is 2: normal. | |
| Metro Station Setting Form | Layout and design form of stations. The value is 0: underground; the value is 1: ground; the value is 2: elevated. | |
| Number of Subway Station Entrances and Exits | Number of subway station entrances and exits | |
| Presence of a Commercial Construction Complex with a Clustering Effect | The value is 1: there are multiple dense shopping malls; the value is 0: there are single shopping malls. | |
| Station Connection Design | The mode of connection between stations and buildings. The value is 0: no connection; the value is 1: point connection; the value is 2: line connection; the value is 3: three-dimensional connection. | |
| Commercial Construction Complex Development Pattern | Layouts of commercial buildings. The value is 0: open; the value is 1: closed; the value is 2: semi-open. | |
| Commercial Construction Complex Flow Line Form | Flow design for commercial buildings. The value is 0: lines; the value is 1: grids; the value is 2: rings; the value is 3: bifurcations. | |
| Transportation | Number of Subway Lines | Number of subway lines that pass through or terminate at TOD stations |
| Number of Bus Lines | Number of bus routes serving TOD sites | |
| Subway Network Proximity Centrality | of the station within the rail network | |
| Subway Network Betweenness Centrality | of the station within the rail network | |
| Vehicle Parking Capacity | Number of berths on site | |
| Economy | Average Residential Rent (yuan/m2/month) | Average price of residential rents |
| Average Office Building Rent (yuan/m2/month) | Average price of office rents | |
| Society | Number of Large Parks | Number of large parks |
| Number of Large Hospitals | Number of large hospitals | |
| Number of Large Schools | Number of large schools | |
| Number of Large Commercial Facilities | Number of large commercial facilities | |
| Residential Functionality Completeness | If the site has the capacity to provide residential services | |
| Commercial Functionality Completeness | If the site has the capacity to provide commercial services | |
| Office Functionality Completeness | If the site has the capacity to provide office services | |
| Administrative Functionality Completeness | If the site has the capacity to provide administrative services | |
| School Functionality Completeness | If the site has the capacity to provide school services | |
| Hospital Functionality Completeness | If the site has the capacity to provide hospital services | |
| Green Space Functionality Completeness | If the site has the capacity to provide green space services | |
| Walking Distance from Subway Station to Residential Area (km) | Mean value of the distance of the optimal path from the subway station to the residential area on foot | |
| Walking Distance from Subway Station to Commercial Area (km) | Mean value of the distance of the optimal path from the subway station to the commercial area on foot | |
| Walking Distance from Subway Station to Office (km) | Mean value of the distance of the optimal path from the subway station to the office on foot | |
| Walking Distance from Subway Station to Administrative Area (km) | Mean value of the distance of the optimal path from the subway station to the administrative area on foot | |
| Walking Distance from Subway Station to School (km) | Mean value of the distance of the optimal path from the subway station to the school on foot | |
| Walking Distance from Subway Station to Hospital (km) | Mean value of the distance of the optimal path from the subway station to the hospital on foot | |
| Walking Distance from Subway Station to Green Space (km) | Mean value of the distance of the optimal path from the subway station to the green space on foot | |
| Walking Distance from Residential Point to Commercial Area (km) | Mean value of the distance of the optimal path from the residential point to the commercial area on foot | |
| Walking Distance from Residential Point to Office (km) | Mean value of the distance of the optimal path from the residential point to the office on foot | |
| Walking Distance from Residential Point to Administrative Area (km) | Mean value of the distance of the optimal path from the residential point to the administrative area on foot | |
| Walking Distance from Residential Point to School (km) | Mean value of the distance of the optimal path from the residential point to the school on foot | |
| Walking Distance from Residential Point to Hospital (km) | Mean value of the distance of the optimal path from the residential point to the hospital on foot | |
| Walking Distance from Residential Point to Green Space (km) | Mean value of the distance of the optimal path from the residential point to the green space on foot | |
| Number of Food Establishments in the Business District | Number of food establishments in the business district | |
| Number of Shopping Facilities in the Business District | Number of shopping facilities in the business district | |
| Number of Family Facilities in the Business District | Number of family facilities in the business district | |
| Number of Beauty Facilities in the Business District | Number of beauty facilities in the business district | |
| Number of Entertainment Facilities in the Business District | Number of entertainment facilities in the business district | |
| Environment | Ratio of Green Land Area to Total Area | |
| Presence of a Park | The value is 1: a park exists in the station buffer; the value is 0: no park exists in the station buffer. | |
| Presence of a Water System | The value is 1: a river exists in the station buffer; the value is 0: no river exists in the station buffer. |
| Variable Name | Coefficient | Standard Deviation | t | Significance | VIF |
|---|---|---|---|---|---|
| Constant | 0.122 | 0.084 | 1.452 | 0.152 | |
| Component 1 | 0.010 | 0.043 | 0.236 | 0.814 | 1.564 |
| Component 2 | 0.004 | 0.012 | 2.122 ** | 0.038 | 2.151 |
| Component 3 | −0.050 | 0.034 | −1.809 * | 0.076 | 1.467 |
| Component 4 | 0.027 | 0.022 | 1.441 | 0.155 | 1.219 |
| Component 5 | −0.069 | 0.048 | −1.670 | 0.101 | 1.521 |
| Component 6 | 0.017 | 0.036 | 0.480 | 0.633 | 1.437 |
| Component 7 | 0.019 | 0.041 | 0.458 | 0.649 | 1.378 |
| Component 8 | −0.007 | 0.037 | −2.399 ** | 0.020 | 1.509 |
| Component 9 | −0.039 | 0.039 | −0.795 | 0.430 | 1.515 |
| Component 10 | −0.012 | 0.046 | −0.257 | 0.798 | 1.299 |
| Component 11 | −0.117 | 0.055 | −2.105 ** | 0.040 | 1.303 |
| Component 12 | 0.007 | 0.037 | 0.184 | 0.855 | 1.366 |
| Component 13 | −0.003 | 0.038 | −0.074 | 0.941 | 1.322 |
| Component 14 | 0.001 | 0.056 | 0.016 | 0.987 | 1.820 |
| Component 15 | 0.105 | 0.049 | 2.168 ** | 0.035 | 1.443 |
| Component 16 | −0.064 | 0.048 | −1.342 | 0.185 | 1.313 |
| Component 17 | 0.081 | 0.057 | 1.426 | 0.160 | 1.786 |
| Component 18 | −0.079 | 0.042 | −1.878 * | 0.066 | 1.495 |
| Component 19 | 0.064 | 0.067 | 0.956 | 0.343 | 1.612 |
| Component 20 | 0.191 | 0.071 | 2.693 *** | 0.009 | 1.361 |
| Component 21 | 0.001 | 0.036 | 0.030 | 0.977 | 1.541 |
| Component 22 | −0.017 | 0.074 | −0.231 | 0.818 | 1.653 |
Disclaimer/Publisher’s Note: The statements, opinions and data contained in all publications are solely those of the individual author(s) and contributor(s) and not of MDPI and/or the editor(s). MDPI and/or the editor(s) disclaim responsibility for any injury to people or property resulting from any ideas, methods, instructions or products referred to in the content. |
© 2024 by the authors. Licensee MDPI, Basel, Switzerland. This article is an open access article distributed under the terms and conditions of the Creative Commons Attribution (CC BY) license (https://creativecommons.org/licenses/by/4.0/).
Share and Cite
Chen, H.; Zhao, K.; Zhang, Z.; Zhang, H.; Lu, L. Methods for the Performance Evaluation and Design Optimization of Metro Transit-Oriented Development Sites Based on Urban Big Data. Land 2024, 13, 1233. https://doi.org/10.3390/land13081233
Chen H, Zhao K, Zhang Z, Zhang H, Lu L. Methods for the Performance Evaluation and Design Optimization of Metro Transit-Oriented Development Sites Based on Urban Big Data. Land. 2024; 13(8):1233. https://doi.org/10.3390/land13081233
Chicago/Turabian StyleChen, Huadong, Kai Zhao, Zhan Zhang, Haodong Zhang, and Linjun Lu. 2024. "Methods for the Performance Evaluation and Design Optimization of Metro Transit-Oriented Development Sites Based on Urban Big Data" Land 13, no. 8: 1233. https://doi.org/10.3390/land13081233
APA StyleChen, H., Zhao, K., Zhang, Z., Zhang, H., & Lu, L. (2024). Methods for the Performance Evaluation and Design Optimization of Metro Transit-Oriented Development Sites Based on Urban Big Data. Land, 13(8), 1233. https://doi.org/10.3390/land13081233