
Construction Land Transfer Scale and Carbon Emission Intensity: Empirical Evidence Based on County-Level Land Transactions in Jiangsu Province, China

Abstract
1. Introduction
1.1. Research Background
1.2. Literature Review
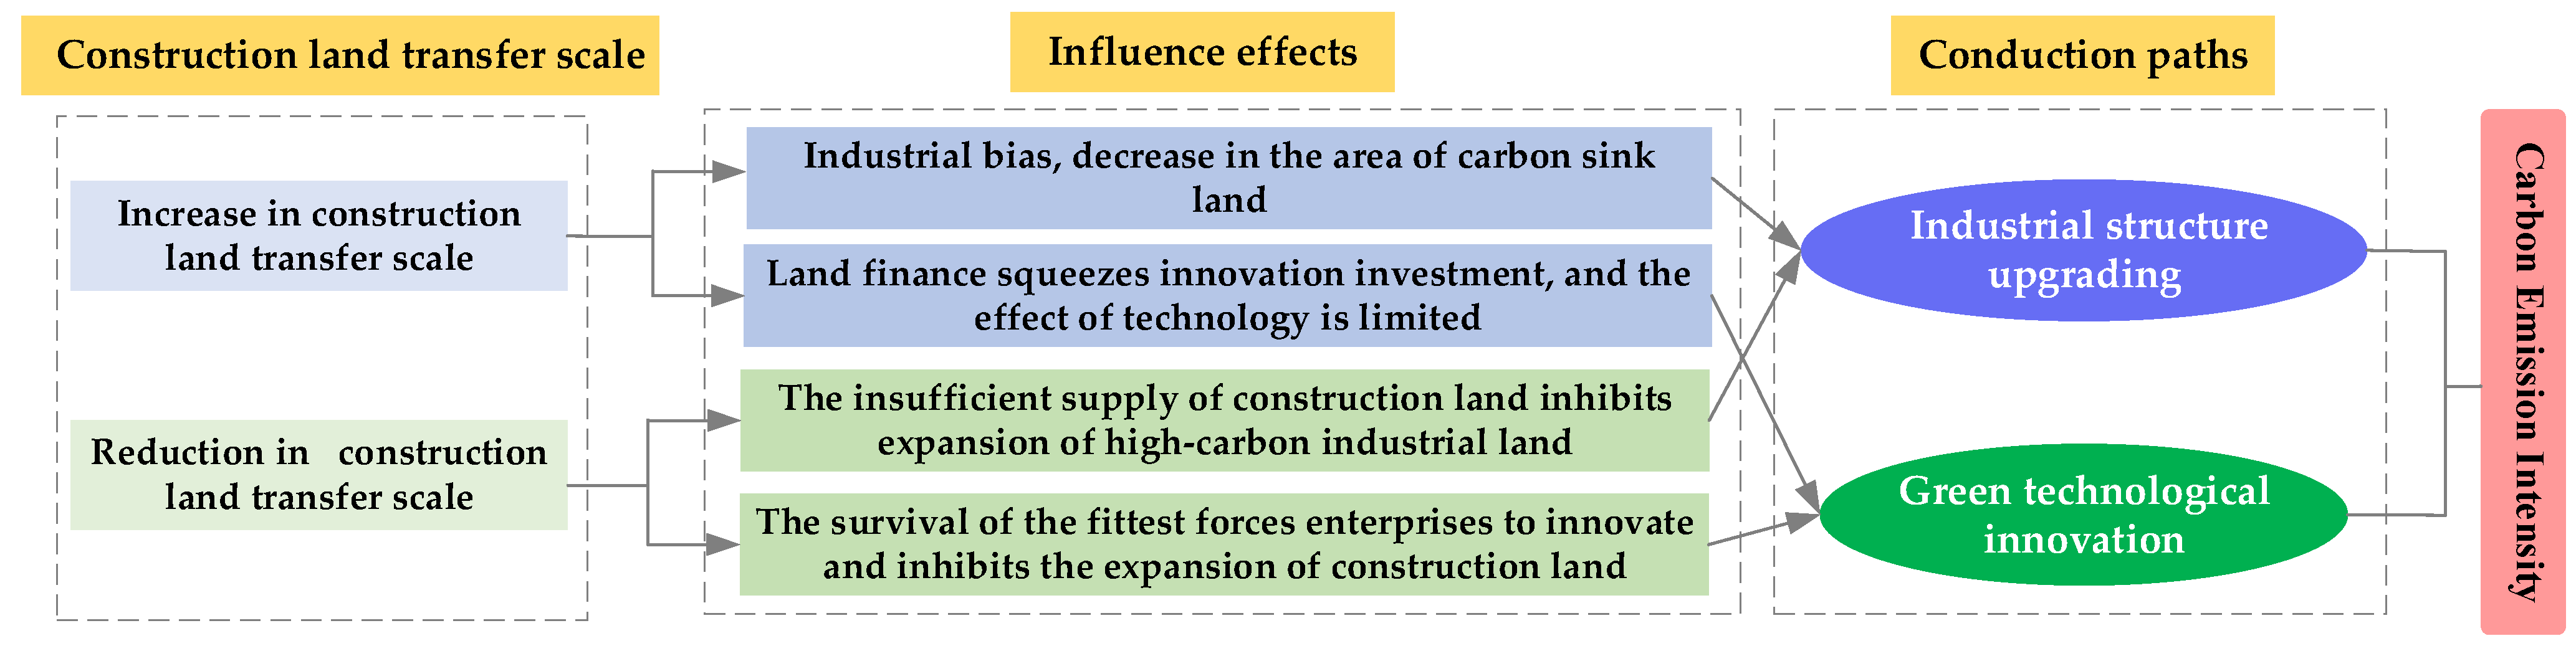
2. Research Hypotheses
2.1. Construction Land Transfer Scale and Carbon Emission Intensity
2.2. Construction Land Transfer Scale, Green Technology Innovation, and Carbon Emission Intensity
2.3. Construction Land Transfer Scale, Industrial Structure Upgrading, and Carbon Emission Intensity
3. Materials and Methods
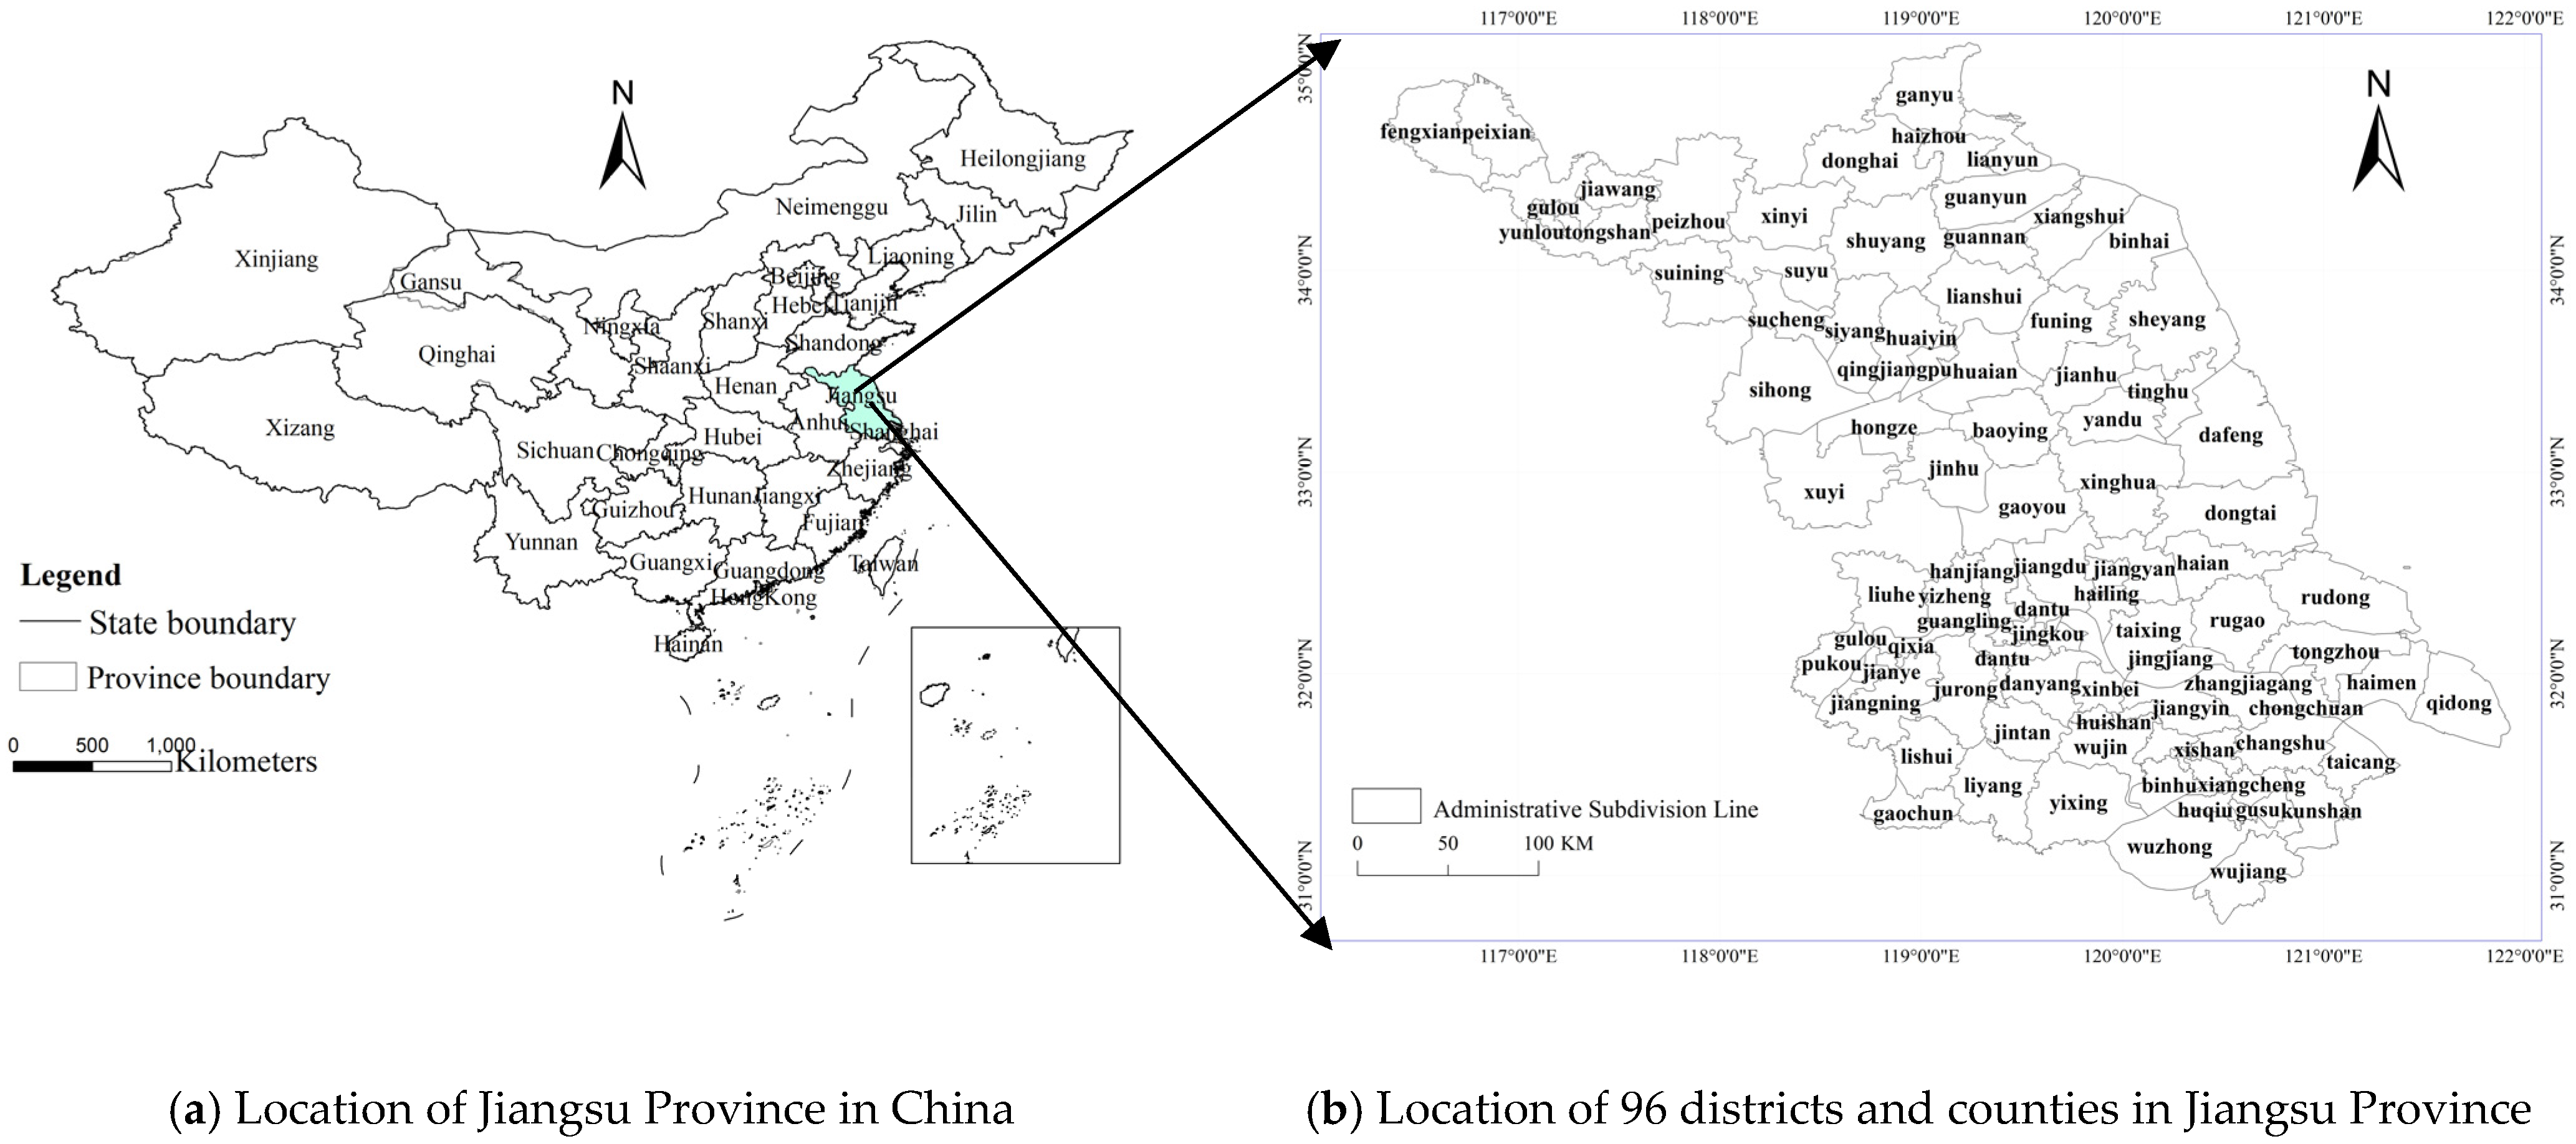
3.1. Study Area
3.2. Research Methodology
3.2.1. Static Panel Model
3.2.2. Mechanism Testing Mode
3.3. The Selection and Source of Variables
3.3.1. The Selection and Source of the Dependent Variable
3.3.2. The Selection and Source of Explanatory Variables
3.3.3. Selection and Source of Control Variables
4. Empirical Process and Results Analysis
4.1. Spatiotemporal Characteristics of Carbon Emission Intensity in Jiangsu Province
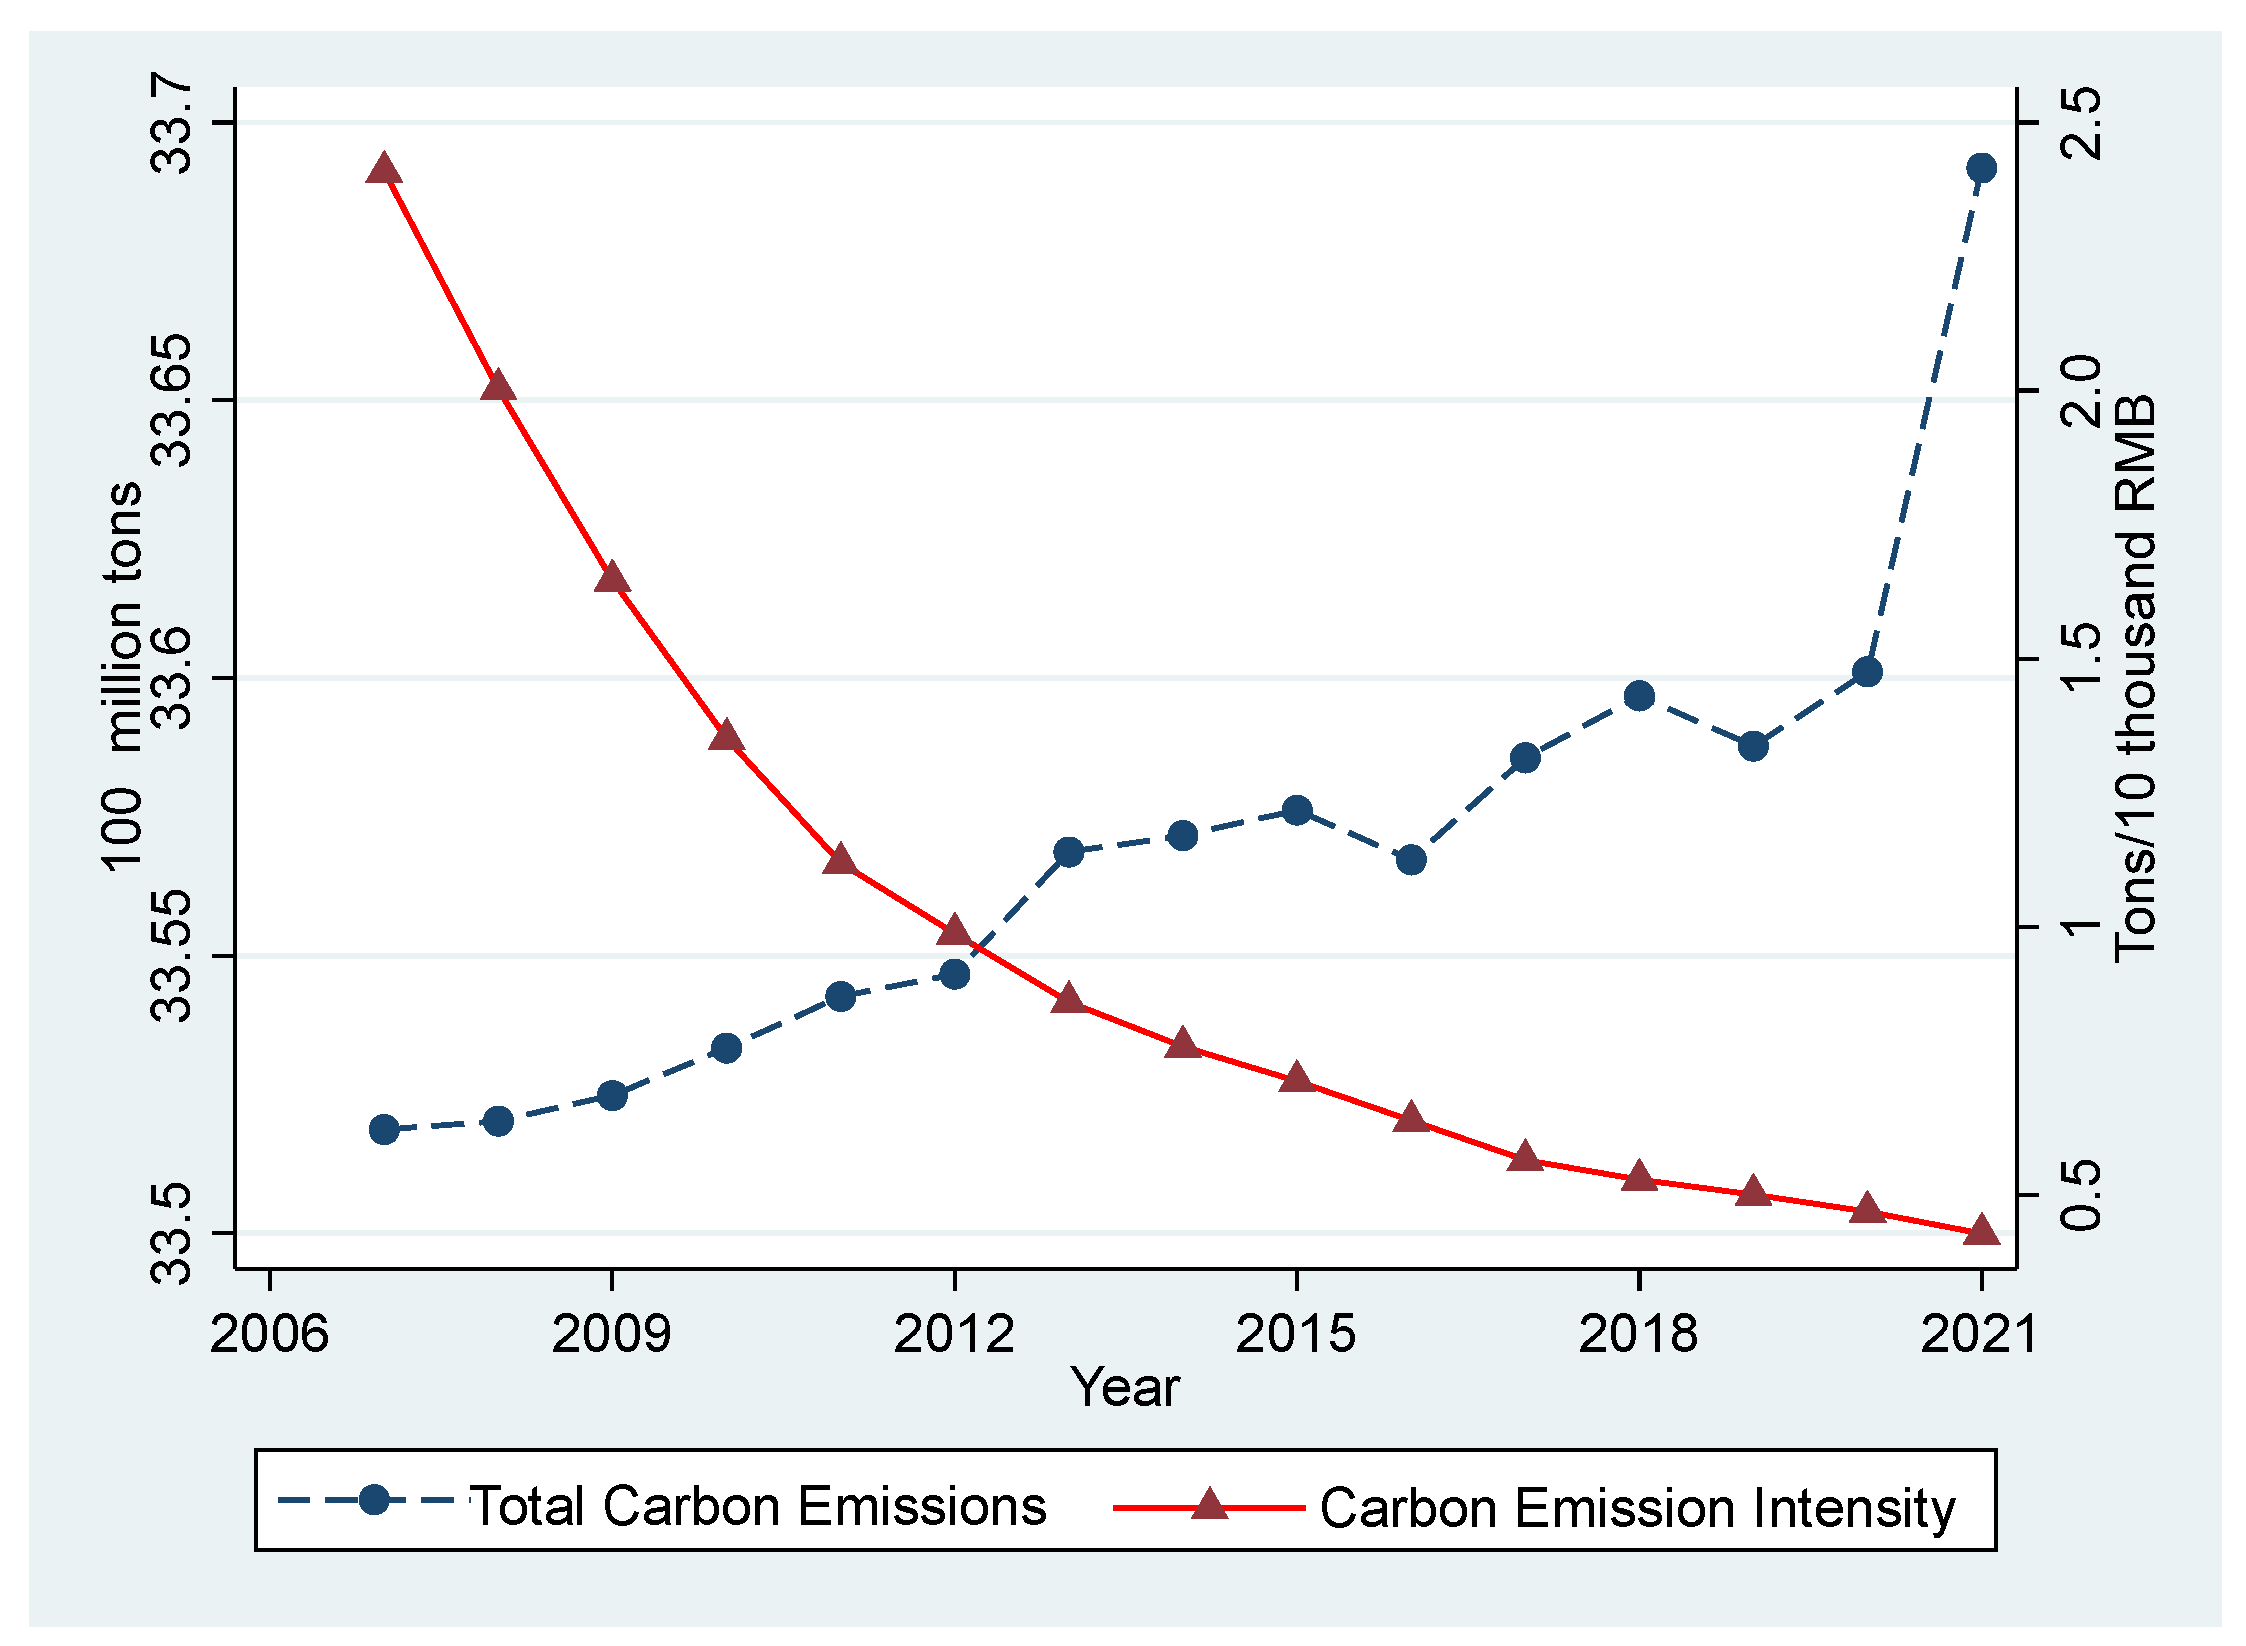
4.1.1. Time Evolution Trend of Carbon Emission Intensity in Jiangsu Province
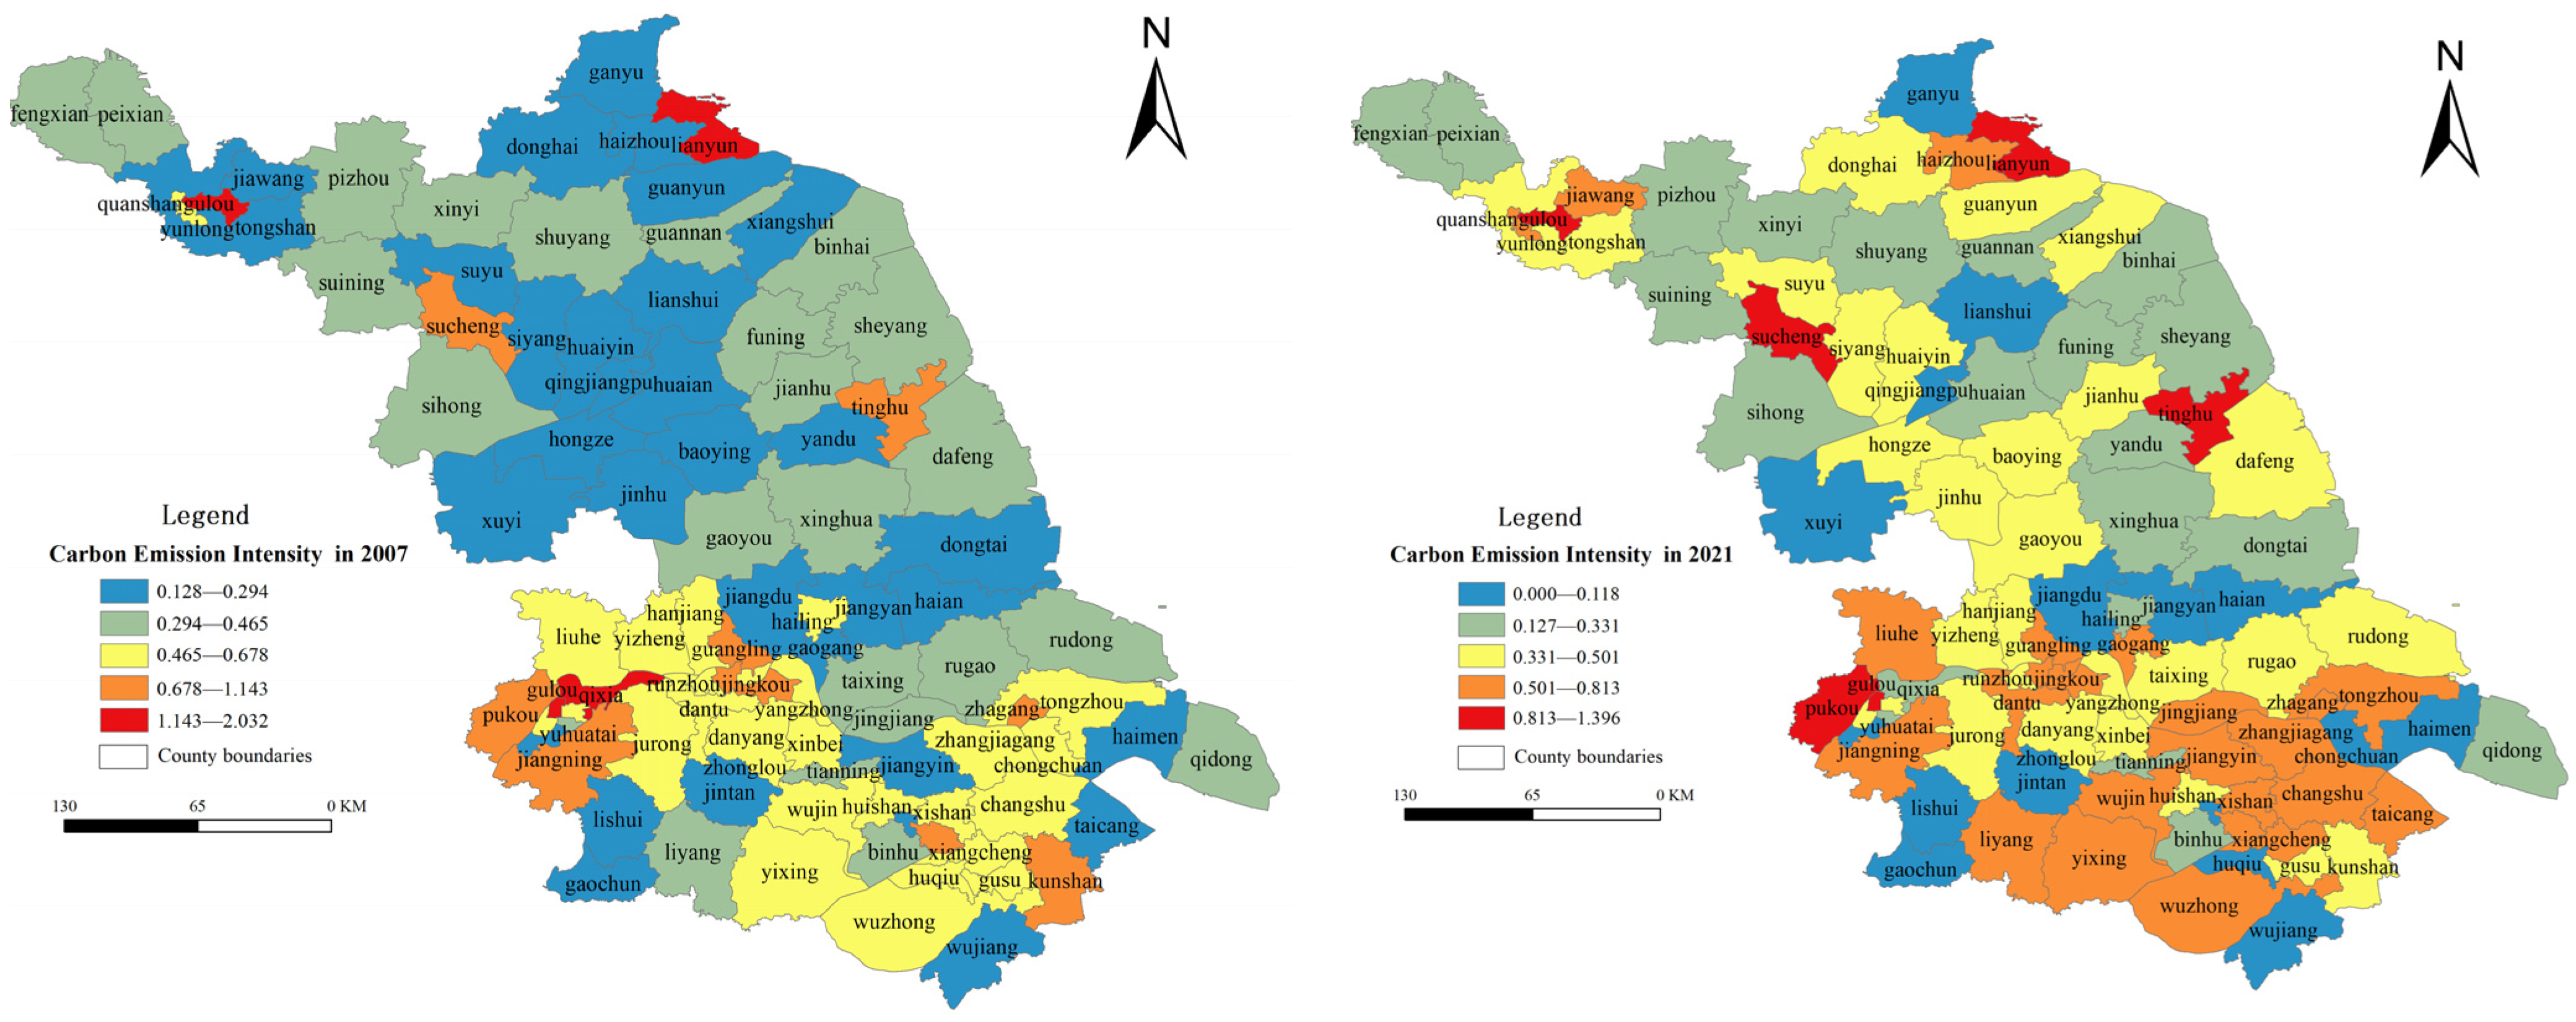
4.1.2. Spatial Distribution Characteristics of Carbon Emission Intensity in Jiangsu Province
4.2. Test of Construction Land Transfer Scale on Carbon Emission Intensity
4.2.1. Regression Results of the Benchmark Model
4.2.2. Regression Results of Instrumental Variables
4.2.3. Robustness Tests
- (1)
- The lagging effect of construction land transfer scale on carbon emission intensity
- (2)
- Shortening the sample period
- (3)
- Constructing dummy variables for low-carbon policies
4.2.4. Mediating Mechanism Tests
- (1)
- The effect of green technology innovation
- (2)
- The effect of industrial structure upgrading
5. Heterogeneity Analysis
5.1. Heterogeneity Test of Construction Land from Different Sources
5.2. Heterogeneity Test of Construction Land with Different Supply Methods
5.3. Heterogeneity Test of Construction Land Transfer Scale for Different Types
5.4. Heterogeneity Test of Construction Land Transfer Scale for County Economic Strength
6. Conclusions and Discussion
6.1. Conclusions
- (1)
- The total carbon emissions at the county level in Jiangsu Province from 2007 to 2021 show a fluctuating upward trend, this is helped by the carbon emission intensity showing a continuous downward trend. Carbon emission intensity at the county level in Jiangsu Province generally exhibits a spatial distribution characterized by a gradual decrease from the southern counties to the central and northern counties, and there is a clustering phenomenon in the “top 100 counties”.
- (2)
- The results of the benchmark regression indicate a significant positive relation between construction land transfer scale and carbon emission intensity. For every 1% reduction in the construction land transfer scale, the carbon emission intensity decreases by an average of 1.9%. Furthermore, the green technology innovation and industrial structure upgrading effects play a partially mediating role in the process of the construction land transfer scale affecting carbon emission intensity. The study results remain valid even after a series of robustness tests. Moreover, the urbanization level and the environmental regulation intensity have a significant negative effect on carbon emission intensity. However, an inverse effect exists among population density and capital investment.
- (3)
- Heterogeneity is observed in the impact of different construction land sources, construction land supply methods, and construction land types on carbon emission intensity. From the perspective of different sources of construction land, the impact of stock construction land on carbon emission intensity is more pronounced than that of incremental construction land. In terms of the methods of acquiring construction land, the impact of allocated land on carbon emission intensity is more pronounced than that of transferred land. In terms of different types of construction land, industrial land contributes the most to carbon intensity, while residential land contributes the least. Green land serves as a vital carbon sink, representing the primary source of the urban carbon sink. Finally, from the perspective of the economic strength of counties, the reduction in the construction land transfer scale is more pronounced in the reduction of carbon emission intensity when the county’s economic strength is greater.
6.2. Discussion
6.2.1. Characteristics of Spatial and Temporal Distribution of Carbon Emission Intensity
6.2.2. Construction Land Transfer Scale and Carbon Emission Intensity
6.2.3. Policy Recommendations
- (1)
- Considering the heterogeneity among counties and municipal districts in Jiangsu, targeted action plans should be formulated. In light of the conclusions proposed by Liu et al. (2023) and Zhang et al. (2021) [62,65], counties should transform their industrial structure as soon as possible to reduce the cost of carbon emissions of high-emission enterprises, especially secondary industry. At the same time, more enterprises in carbon-emission-intensive industries need to be included in the construction of the carbon market so as to further control counties’ high carbon emissions [62,64]. Given that municipal districts always have higher land development, they should focus more on improving green vegetation cover so as to achieve more carbon sequestration by forests, especially the project of “returning farmland to forest” and planting trees in built-up areas [12,16].
- (2)
- Upgrading and optimizing the industrial structure, as well as promoting coordination between industries by adjusting the construction land scale, can help save energy and reduce carbon emissions. Facing unprecedented changes, the transfer of a considerable amount of industrial land presents substantial opportunities for the comprehensive upgrading and transformation of industries in Jiangsu Province. This shift opens up possibilities for enhancing industrial and energy structure optimization. Further refining the industrial structure, fostering low-energy consumption and low-pollution industries, and attracting high-quality labor resources is crucial to achieve carbon neutrality. In particular, government should increase R&D investments and set up R&D platforms for both high-emission and cleaner advanced energy technologies [32,51,59].
- (3)
- Advancing toward a green and low-carbon economy is crucial while carefully monitoring the effects of alterations in construction land on carbon emissions. Accordingly, we should enhance the land use structure by considering stock construction land and incremental construction land, focusing on improving the latter and optimizing the former. This involves reallocating land for industries with varying carbon footprints within construction areas, guiding industrial growth toward green and low-carbon practices, and promoting the decoupling of construction land from carbon emissions [2,14].
Author Contributions
Funding
Data Availability Statement
Conflicts of Interest
References
- Dale, V.H. The relationship between land-use change and climate change. Ecol. Appl. 1997, 7, 753–769. [Google Scholar] [CrossRef]
- Zhang, C.; Zhao, L.; Zhang, H.; Chen, M.; Fang, R.; Yao, Y.; Zhang, Q.; Wang, Q. Spatial-temporal characteristics of carbon emissions from land use change in Yellow River Delta region, China. Ecol. Indic. 2022, 136, 108623. [Google Scholar] [CrossRef]
- Xiao, Y.; Huang, H.; Qian, X.M.; Zhang, L.; An, B. Can new-type urbanization reduce urban building carbon emissions? New evidence from China. Sustain. Cities Soc. 2023, 90, 104410. [Google Scholar] [CrossRef]
- West, P.C.; Gibbs, H.K.; Monfreda, C.; Wagner, J.; Barford, C.C.; Carpenter, S.R.; Foley, J.A. Trading carbon for food: Global comparison of carbon stocks vs. crop yields on agricultural land. Proc. Natl. Acad. Sci. USA 2010, 107, 19645–19648. [Google Scholar] [CrossRef] [PubMed]
- National Development and Reform Commission. Overall Plan for Pilot Comprehensive Reform of Market-Based Allocation of Factors of Production 2021. Available online: https://www.ndrc.gov.cn/fzggw/jgsj/zys/sjdt/202201/t20220121_1312719.html (accessed on 3 January 2023).
- Andrade, J.C.S.; Dameno, A.; Pérez, J.; Almeida, J.M.; Lumbreras, J. Implementing city-level carbon accounting: A comparison between Madrid and London. J. Clean. Prod. 2018, 172, 795–804. [Google Scholar] [CrossRef]
- Mishra, A.; Humpenöder, F.; Churkina, G.; Reyer, C.P.O.; Beier, F.; Bodirsky, B.L.; Schellnhuber, H.J.; Lotze-Campen, H.; Popp, A. Land use change and carbon emissions of a transformation to timber cities. Nat. Commun. 2022, 13, 4889. [Google Scholar] [CrossRef] [PubMed]
- Houghton, R.A.; House, J.I.; Pongratz, J.; Vander, G.R.; DeFries, R.S.; Hansen, M.C.; Quéré, C.L.; Ramankutty, N. Carbon emissions from land use and land-cover change. Biogeosciences 2012, 9, 5125–5142. [Google Scholar] [CrossRef]
- Zuo, W.; Gu, B.; Zou, X.; Peng, K.; Shan, Y.; Yi, S.; Bai, Y. Soil organic carbon sequestration in croplands can make remarkable contributions to China’s carbon neutrality. J. Clean. Prod. 2023, 382, 135268. [Google Scholar] [CrossRef]
- Peng, Y.; Zhou, C.; Jin, Q.; Ji, M.; Wang, F.; Lai, Q.; Shi, R.; Xu, X.; Chen, L.; Wang, G. Tidal variation and litter decomposition co-affect carbon emissions in estuarine wetlands. Sci. Total Environ. 2022, 839, 156357. [Google Scholar] [CrossRef]
- Dalcin Martins, P.; Hoyt, D.W.; Bansal, S.; Mills, C.T.; Tfaily, M.; Tangen, B.A.; Finocchiaro, R.G.; Johnston, M.D.; McAdams, B.C.; Solensky, M.J.; et al. Abundant carbon substrates drive extremely high sulfate reduction rates and methane fluxes in Prairie Pothole Wetlands. Glob. Change Biol. 2017, 23, 3107–3120. [Google Scholar] [CrossRef]
- Corona, N.R.O.; Campo, J.E. Climate and socioeconomic drivers of biomass burning and carbon emissions from fires in tropical dry forests: A Pantropical analysis. Glob. Change Biol. 2023, 29, 1062–1079. [Google Scholar] [CrossRef] [PubMed]
- Zhang, L.; Weng, D.; Xu, Y.; Hong, B.; Wang, S.; Hu, X.; Wang, Z. Spatio-temporal evolution characteristics of carbon emissions from road transportation in the mainland of China from 2006 to 2021. Sci. Total Environ. 2024, 917, 170430. [Google Scholar] [CrossRef] [PubMed]
- Henders, S.; Persson, U.M.; Kastner, T. Trading forests: Land-use change and carbon emissions embodied in production and exports of forest-risk commodities. Environ. Res. Lett. 2015, 10, 125012. [Google Scholar] [CrossRef]
- Wang, Q.; Yang, C.; Wang, M.L.; Zhao, L.; Zhao, Y.C.; Zhang, Q.P.; Zhang, C.Y. Decoupling analysis to assess the impact of land use patterns on carbon emissions: A case study in the Yellow River Delta efficient eco-economic zone, China. J. Clean. Prod. 2023, 412, 137415. [Google Scholar] [CrossRef]
- Li, W.; Chen, Z.; Li, M.; Zhang, H.; Li, M.; Qiu, X.; Zhou, C. Carbon emission and economic development trade-offs for optimizing land-use allocation in the Yangtze River Delta, China. Ecol. Indic. 2023, 147, 109960. [Google Scholar] [CrossRef]
- Huang, J.B.; Liu, Q.; Cai, X.C.; Hao, Y.; Lei, H. The effect of technological factors on China’s carbon intensity: New evidence from a panel threshold model. Energy Policy 2018, 115, 3–42. [Google Scholar] [CrossRef]
- Ou, Y.; Bao, Z.; Ng, S.T.; Ng, S.T.; Song, W.; Chen, K. Land-use carbon emissions and built environment characteristics: A city-level quantitative analysis in emerging economies. Land Use Policy 2024, 137, 107019. [Google Scholar] [CrossRef]
- Cambou, A.; Shaw, R.K.; Huot, H.; Vidal-Beaudet, L.; Hunault, G.; Cannavo, P.; Nold, F.; Schwartz, C. Estimation of soil organic carbon stocks of two cities, New York City and Paris. Sci. Total Environ. 2018, 644, 452–464. [Google Scholar] [CrossRef] [PubMed]
- Wang, M.; Wang, Y.; Wu, Y.; Yue, X.; Wang, M.; Hu, P. Identifying the spatial heterogeneity in the effects of the construction land scale on carbon emissions: Case study of the Yangtze River Economic Belt, China. Environ. Res. 2022, 212, 113397. [Google Scholar] [CrossRef]
- Shi, K.; Shen, J.; Wu, Y.; Liu, S.; Li, L. Carbon dioxide (CO2) emissions from the service industry, traffic, and secondary industry as revealed by the remotely sensed nighttime light data. Int. J. Digit. Earth 2021, 14, 1514–1527. [Google Scholar] [CrossRef]
- Zhang, Y.; Yu, P.; Tian, Y.; Chen, H.; Chen, Y. Exploring the impact of integrated spatial function zones on land use dynamics and ecosystem services tradeoffs based on a future land use simulation (FLUS) model. Ecol. Indic. 2023, 150, 110246. [Google Scholar] [CrossRef]
- Lin, G.; Jiang, D.; Yin, Y.; Fu, J. A carbon-neutral scenario simulation of an urban land–energy–water coupling system: A case study of Shenzhen, China. J. Clean. Prod. 2023, 383, 135534. [Google Scholar] [CrossRef]
- Timmons, D.; Zirogiannis, N.; Lutz, M. Location matters: Population density and carbon emissions from residential building energy use in the United States. Energy Res. Soc. Sci. 2016, 22, 137–146. [Google Scholar] [CrossRef]
- Moomaw, W.R. Industrial emissions of greenhouse gases. Energy Policy 1996, 24, 961–968. [Google Scholar] [CrossRef]
- Yuan, K.; Gan, C.; Yang, H.; Liu, Y.; Chen, Y.R.; Zhu, Q.Y. Validation of the EKC and characteristics decomposition between construction land expansion and carbon emission: A case study of Wuhan city. China Land Sci. 2019, 33, 56–64. (In Chinese) [Google Scholar]
- Zhang, G.; Ge, R.; Lin, T.; Ye, H.; Li, X.; Huang, N. Spatial apportionment of urban greenhouse gas emission inventory and its implications for urban planning: A case study of Xiamen, China. Ecol. Indic. 2018, 85, 644–656. [Google Scholar] [CrossRef]
- Wu, S.; Hu, S.; Frazier, A.E. Spatiotemporal variation and driving factors of carbon emissions in three industrial land spaces in China from 1997 to 2016. Technol. Forecast. Soc. Change 2021, 169, 120837. [Google Scholar] [CrossRef]
- Pontarollo, N.; Muñoz, R.M. Land consumption and income in Ecuador: A case of an inverted environmental Kuznets curve. Ecol. Indic. 2020, 108, 105699. [Google Scholar] [CrossRef] [PubMed]
- Zhao, R.; Liu, Y.; Tian, M.; Ding, M.; Cao, L.; Zhang, Z.; Yao, L. Impacts of water and land resources exploitation on agricultural carbon emissions: The water-land-energy-carbon nexus. Land Use Policy 2018, 72, 480–492. [Google Scholar] [CrossRef]
- Xiang, Y.; Cui, H.; Bi, Y. The impact and channel effects of banking competition and government intervention on carbon emissions: Evidence from China. Energy Policy 2023, 175, 113476. [Google Scholar] [CrossRef]
- Su, K.; Wei, D.; Lin, W. Influencing factors and spatial patterns of energy-related carbon emissions at the city-scale in Fujian province, Southeastern China. J. Clean. Prod. 2020, 244, 118840. [Google Scholar] [CrossRef]
- Pan, Y.; Chen, H.Q.; Zhang, Z.W. Urban Interaction: Spatial Interaction Effects and Driving Factors of High-quality Use of Urban Land in the Yangtze River Delta. Resour Environ. Yangtze Basin 2023, 32, 1885–1897. (In Chinese) [Google Scholar]
- Kato, N. Analysis of structure of energy consumption and dynamics of emission of atmospheric species related to the global environmental change (SOx, NOx, and CO2) in Asia. Atmos. Environ. 1996, 30, 757–785. [Google Scholar] [CrossRef]
- Xu, W.; Jin, J.; Jin, X.; Ao, Y.; Ren, J.; Liu, J.; Zhou, Y. Analysis of changes and potential characteristics of cultivated land productivity based on MODIS EVI: A case study of Jiangsu Province, China. Remote Sens. 2019, 11, 2041. [Google Scholar] [CrossRef]
- Peng, S.; Wang, L.; Xu, L. Impact of the Marketization of Industrial Land Transfer on Regional Carbon Emission Intensity: Evidence from China. Land 2023, 12, 984. [Google Scholar] [CrossRef]
- Feng, Y.; Chen, S.; Tong, X.; Lei, Z.; Gao, C.; Wang, J. Modeling changes in China’s 2000–2030 carbon stock caused by land use change. J. Clean. Prod. 2020, 252, 119659. [Google Scholar] [CrossRef]
- Chaplot, V.; Smith, P. Cover crops do not increase soil organic carbon stocks as much as has been claimed: What is the way forward? Glob. Change Biol. 2023, 29, 6163–6169. [Google Scholar] [CrossRef] [PubMed]
- Zhou, K.; Wang, Q.; Fan, J. Impact of economic agglomeration on regional water pollutant emissions and its spillover effects. J. Nat. Resour. 2019, 34, 1483–1496. (In Chinese) [Google Scholar]
- Zhong, J.; Wei, Y.J. Spatial effects of industrial agglomeration and open economy on pollution abatement. China Popul. Resour. Environ. 2019, 29, 98–107. (In Chinese) [Google Scholar]
- Escobar, N.; Haddad, S.; Börner, J.; Britz, W. Land use mediated GHG emissions and spillovers from increased consumption of bioplastics. Environ. Res. Lett. 2018, 13, 125005. [Google Scholar] [CrossRef]
- Nawaz, K.; Lahiani, A.; Roubaud, D. Do natural resources determine energy consumption in Pakistan? The importance of quantile asymmetries. Q. Rev. Econ. Financ. 2023, 87, 200–211. [Google Scholar] [CrossRef]
- Ampah, J.D.; Jin, C.; Liu, H.; Afrane, S.; Adun, H.; Morrow, D.; Ho, D.T. Prioritizing Non-Carbon Dioxide Removal Mitigation Strategies Could Reduce the Negative Impacts Associated with Large-Scale Reliance on Negative Emissions. Environ. Sci. Technol. 2024, 58, 3755–3765. [Google Scholar] [CrossRef] [PubMed]
- Liu, J.; Jin, X.; Xu, W.; Afrane, S.; Adun, H.; Morrow, D.; Ho, D.T. Evolution of cultivated land fragmentation and its driving mechanism in rural development: A case study of Jiangsu Province. J. Rural Stud. 2022, 91, 58–72. [Google Scholar] [CrossRef]
- Liang, X.; Jin, X.; Sun, R.; Han, B.; Liu, J.; Zhou, Y. A typical phenomenon of cultivated land use in China’s economically developed areas: Anti-intensification in Jiangsu Province. Land Use Policy 2021, 102, 105223. [Google Scholar] [CrossRef]
- Weng, Q.; Lu, D.; Schubring, J. Estimation of land surface temperature–vegetation abundance relationship for urban heat island studies. Remote Sens. Environ. 2004, 89, 467–483. [Google Scholar] [CrossRef]
- Dai, S.; Qian, Y.; He, W.; Wang, C.; Shi, T. The spatial spillover effect of China’s carbon emissions trading policy on industrial carbon intensity: Evidence from a spatial difference-in-difference method. Stru. Change Econ. Dyn. 2022, 63, 139–149. [Google Scholar] [CrossRef]
- Chen, Z.Q.; Yu, B.L.; Yang, C.S.; Zhou, Y.; Qian, X.; Wang, C.; Wu, J. An extended time series (2000–2018) of global NPP-VIIRS-like nighttime light data from a cross-sensor calibration. Earth Syst. Sci. Data 2021, 13, 889–906. [Google Scholar] [CrossRef]
- Chen, Y.; Li, L. Differential game model of carbon emission reduction decisions with two types of government contracts: Green funding and green technology. J. Clean. Prod. 2023, 389, 135847. [Google Scholar] [CrossRef]
- Acheampong, A.O.; Opoku, E.E.O. Environmental degradation and economic growth: Investigating linkages and potential pathways. Energy Econ. 2023, 123, 106734. [Google Scholar] [CrossRef]
- Yan, Z.; Zhou, Z.; Du, K. How does environmental regulatory stringency affect energy consumption? Evidence from Chinese firms. Energy Econ. 2023, 118, 106503. [Google Scholar] [CrossRef]
- Tian, L.; Zhai, Y.; Zhang, Y.; Tan, Y.; Feng, S. Pollution emission reduction effect of the coordinated development of inward and outward FDI in China. J. Clean. Prod. 2023, 391, 136233. [Google Scholar] [CrossRef]
- Yi, X.; Jue, W.; Huan, H. Does economic development bring more livability? Evidence from Jiangsu Province, China. J. Clean. Prod. 2021, 293, 126187. [Google Scholar] [CrossRef]
- Ivus, O.; Boland, M. The employment and wage impact of broadband deployment in Canada. Can. J. Econ. 2015, 48, 1803–1830. [Google Scholar] [CrossRef]
- Zhang, S.; Yu, Y. Land lease, resource misallocation and total factor productivity. J. Financ. Econ. 2019, 45, 73–85. (In Chinese) [Google Scholar]
- Youngbae, S. Influence of new town development on the urban heat island-the case of the Bundan area. J. Environ. Manag. 2005, 17, 641–645. [Google Scholar]
- Ramankutty, N.; Gibbs, H.K.; Achard, F.; Defries, R.; Foley, J.A.; Houghton, R.A. Challenges to estimating carbon emissions from tropical deforestation. Glob. Change Biol. 2007, 13, 51–66. [Google Scholar] [CrossRef]
- Zhao, S.X.B.; Zhan, H.; Jiang, Y.; Pan, W. How big is China’s real estate bubble and why hasn’t it burst yet? Land Use Policy 2017, 64, 153–162. [Google Scholar] [CrossRef]
- Xu, J.; Cui, J.B. Low-Carbon Cities and Firms’ Green Technological Innovation. China Ind. Econ. 2020, 12, 178–196. (In Chinese) [Google Scholar]
- Li, J.; Jiao, L.; Li, R.; Zhu, J.; Zhang, P.; Guo, Y.; Lu, X. How does market-oriented allocation of industrial land affect carbon emissions? Evidence from China. J. Environ. Manag. 2023, 342, 118288. [Google Scholar] [CrossRef]
- Ahmed, N.; Hamid, Z.; Rehman, K.U.; Senkus, O.P.; Ahmed, N.K.; Wysokińska, A.S.; Hadryjańska, B. Environmental regulation, fiscal decentralization, and agricultural carbon intensity: A challenge to ecological sustainability policies in the United States. Sustainability 2023, 15, 5145. [Google Scholar] [CrossRef]
- Liu, X.; Jin, X.; Luo, X.; Zhou, Y. Quantifying the spatiotemporal dynamics and impact factors of China’s county-level car-bon emissions using ESTDA and spatial econometric models. J. Clean. Prod. 2023, 410, 137203. [Google Scholar] [CrossRef]
- Duncanson, L.; Liang, M.; Leitold, V.; Armston, J.; Krishna Moorthy, S.M.; Dubayah, R.; Costedoat, S.; Enquist, B.J.; Fatoyinbo, L.; Goetz, S.J.; et al. The effectiveness of global protected areas for climate change mitigation. Nat. Commun. 2023, 14, 2908. [Google Scholar] [CrossRef] [PubMed]
- Ch, R.; Martin, D.A.; Vargas, J.F. Measuring the size and growth of cities using nighttime light. J. Urban Econ. 2021, 125, 103254. [Google Scholar] [CrossRef]
- Zhang, H.; Wang, R.; Yu, D.Y.; Jian, Q.M.; Peng, J.Y.; Zhang, J.X. Methods of Low-carbon Territorial Spatial Planning for County-level Jurisdictions Based on Differentiated CO2 Emission Control. Urban Plan. Forum 2021, 5, 58–65. (In Chinese) [Google Scholar]
- Xiong, J.; Lu, K.; Jiang, Z.; Zhang, C.; Fu, Q.; Jin, Y. Study and thoughts on territorial spatial planning under the goal of “carbon emissions peak and carbon neutrality”. Urban Plan. Forum 2021, 4, 74–80. (In Chinese) [Google Scholar]
- Muhammad, S.; Pan, Y.; Agha, M.H.; Umar, M.; Chen, S.Y. Industrial structure, energy intensity and environmental efficiency across developed and developing economies: The intermediary role of primary, secondary and tertiary industry. Energy 2022, 247, 123576. [Google Scholar] [CrossRef]

| Obs | N | Std. Dev. | Min | Max | Mean | Measurement Units |
|---|---|---|---|---|---|---|
| lnCEI | 1382 | 0.566 | 0.000 | 2.491 | 0.580 | Tons/RMB 10 thousand |
| lnCLTS | 1382 | 1.472 | 0.128 | 19.517 | 8.360 | 100 km2 |
| UR | 1306 | 0.508 | 36.9 | 89.6 | 64.1 | % |
| lnPGDP | 1382 | 0.757 | 1.753 | 33.311 | 12.714 | RMB 10,000/person |
| lnPD | 1382 | 0.225 | 0.021 | 1.783 | 0.147 | 100 person/km2 |
| lnER | 1382 | 0.225 | 0.016 | 1.012 | 0.370 | - |
| lnCI | 1382 | 0.256 | 0.210 | 1.480 | 0.794 | % |
| Variable | (1) | (2) |
|---|---|---|
| lnCEI | lnCEI | |
| lnCLTS | 0.088 *** | 0.019 *** |
| (0.002) | (0.004) | |
| UR | −0.157 *** | |
| (0.078) | ||
| lnPGDP | −0.017 ** | |
| (0.007) | ||
| lnPD | 0.019 *** | |
| (0.005) | ||
| lnER | −0.028 *** | |
| (0.004) | ||
| lnCI | 3.440 *** | |
| (0.487) | ||
| Constant | 0.220 *** | 0.825 *** |
| (0.021) | (0.117) | |
| Year FE | Yes | Yes |
| Individual FE | Yes | Yes |
| Observations | 1382 | 1381 |
| R2 | 0.840 | 0.962 |
| Variable | (1) First Stage (lnCLTS) | (2) Second Stage (lnCEI) | (3) First Stage (lnCLTS) | (4) Second Stage (lnCEI) |
|---|---|---|---|---|
| lnCLTS | 0.056 *** | 0.399 *** | ||
| (0.021) | (0.067) | |||
| lnLP | 0.189 *** | |||
| (0.027) | ||||
| Slope × lnGDP | 0.272 *** | |||
| (0.042) | ||||
| The first-stage F statistics | 50.90 *** | 42.19 *** | ||
| Cragg–Donald Wald F statistics | 50.04 *** | 42.25 *** | ||
| Anderson LM chi-square statistics | 50.97 *** | 41.62 *** | ||
| Control variables | Yes | Yes | ||
| Year FE | Yes | Yes | ||
| Individual FE | Yes | Yes | ||
| N | 1382 | 1382 | ||
| R2 | 0.492 | 0.752 | ||
| Variable | (1) Lagging Effect lnCEI | (2) 2009–2019 lnCEI | (3) Low-Carbon Policies lnCEI |
|---|---|---|---|
| lnCLTS | 0.062 *** | 0.026 *** | 0.003 *** |
| (0.025) | (0.005) | (0.001) | |
| Control variables | Yes | Yes | Yes |
| Individual FE | Yes | Yes | Yes |
| Year FE | Yes | Yes | Yes |
| N | 1209 | 981 | 1306 |
| R2 | 0.891 | 0.204 | 0.960 |
| Variable | (1) lnCEI | (2) lnGTI | (3) lnCEI |
|---|---|---|---|
| lnCLTS | 0.019 *** | −0.047 ** | 0.017 *** |
| (0.004) | (0.019) | (0.004) | |
| lnGTI | −0.035 *** | ||
| (0.006) | |||
| Control variables | Yes | Yes | Yes |
| Individual FE | Yes | Yes | Yes |
| Year FE | Yes | Yes | Yes |
| N | 1305 | 1305 | 1305 |
| R2 | 0.204 | 0.389 | 0.228 |
| Sobel test Z-value | |Z| = 2.341 ** (0.001) | ||
| Bootstrap mediating effects | 54.20% | ||
| Variable | (1) lnCEI | (2) ISU | (3) lnCEI |
|---|---|---|---|
| lnCLTS | 0.012 *** | −0.885 ** | 0.008 *** |
| (1.690) | (5.980) | (1.780) | |
| ISU | −0.047 *** | ||
| (4.342) | |||
| Control variables | Yes | Yes | Yes |
| Individual FE | Yes | Yes | Yes |
| Year FE | Yes | Yes | Yes |
| N | 1306 | 1306 | 1306 |
| R2 | 0.414 | 0.858 | 0.462 |
| Sobel test | |Z| = 2.430 ** (0.015) | ||
| Bootstrap mediating effects | 10.10% | ||
| Pane A | |||||
| Variable | ICL | SCL | ACL | TCL | |
| lnCEI | lnCEI | lnCEI | lnCEI | ||
| lnCLTS | 0.009 ** | 0.014 ** | 0.009 ** | 0.012 *** | |
| (0.006) | (0.004) | (0.006) | (0.005) | ||
| Constants | 0.200 *** | 0.242 *** | 0.213 *** | 0.268 *** | |
| (0.029) | (0.032) | (0.023) | (0.047) | ||
| Control variables | Yes | Yes | Yes | Yes | |
| Individual FE | Yes | Yes | Yes | Yes | |
| Time FE | Yes | Yes | Yes | Yes | |
| N | 849 | 533 | 400 | 982 | |
| R2 | 0.372 | 0.109 | 0.240 | 0.877 | |
| Between-group coefficient test p-value | 0.007 | 0.005 | |||
| Pane B | |||||
| Variable | (1) Gland | (2) Pland | (3) Rland | (4) Iland | (5) Oland |
| lnCEI | lnCEI | lnCEI | lnCEI | lnCEI | |
| lnCLTS | −0.005 | 0.014 ** | 0.013 ** | 0.078 *** | 0.023 * |
| (0.007) | (0.006) | (0.082) | (0.004) | (0.059) | |
| Constants | 0.721 *** | 0.300 *** | 0.302 *** | 0.215 *** | 0.208 *** |
| (0.031) | (0.058) | (0.085) | (0.029) | (0.040) | |
| Control variables | Yes | Yes | Yes | Yes | Yes |
| Individual FE | Yes | Yes | Yes | Yes | Yes |
| Time FE | Yes | Yes | Yes | Yes | Yes |
| N | 55 | 320 | 254 | 458 | 296 |
| R2 | 0.994 | 0.792 | 0.779 | 0.869 | 0.911 |
| Pane C | |||||
| Variable | Top 100 Counties | Non-Top 100 Counties | |||
| lnCEI | lnCEI | ||||
| lnCLTS | 0.015 ** | 0.007 *** | |||
| (0.004) | (0.003) | ||||
| Constants | 0.182 *** | 0.327 *** | |||
| (0.019) | (0.024) | ||||
| Control variables | Yes | Yes | |||
| Individual FE | Yes | Yes | |||
| Time FE | Yes | Yes | |||
| N | 325 | 1057 | |||
| R2 | 0.275 | 0.502 | |||
| Between-group coefficient test p-value | 0.009 | ||||
Disclaimer/Publisher’s Note: The statements, opinions and data contained in all publications are solely those of the individual author(s) and contributor(s) and not of MDPI and/or the editor(s). MDPI and/or the editor(s) disclaim responsibility for any injury to people or property resulting from any ideas, methods, instructions or products referred to in the content. |
© 2024 by the authors. Licensee MDPI, Basel, Switzerland. This article is an open access article distributed under the terms and conditions of the Creative Commons Attribution (CC BY) license (https://creativecommons.org/licenses/by/4.0/).
Share and Cite
Li, W.; Wang, K.; Liu, H.; Zhang, Y.; Zhu, X. Construction Land Transfer Scale and Carbon Emission Intensity: Empirical Evidence Based on County-Level Land Transactions in Jiangsu Province, China. Land 2024, 13, 917. https://doi.org/10.3390/land13070917
Li W, Wang K, Liu H, Zhang Y, Zhu X. Construction Land Transfer Scale and Carbon Emission Intensity: Empirical Evidence Based on County-Level Land Transactions in Jiangsu Province, China. Land. 2024; 13(7):917. https://doi.org/10.3390/land13070917
Chicago/Turabian StyleLi, Wenying, Keqiang Wang, Hongmei Liu, Yixuan Zhang, and Xiaodan Zhu. 2024. "Construction Land Transfer Scale and Carbon Emission Intensity: Empirical Evidence Based on County-Level Land Transactions in Jiangsu Province, China" Land 13, no. 7: 917. https://doi.org/10.3390/land13070917
APA StyleLi, W., Wang, K., Liu, H., Zhang, Y., & Zhu, X. (2024). Construction Land Transfer Scale and Carbon Emission Intensity: Empirical Evidence Based on County-Level Land Transactions in Jiangsu Province, China. Land, 13(7), 917. https://doi.org/10.3390/land13070917