Article

Research on Post-Use Evaluation of Community Green Space Rectification Based on a Multi-Dimensional Perception System: A Case Study of Jiayuan Sanli Community in Beijing

1
Faculty of Architecture, Civil and Transportation Engineering, Beijing University of Technology, Beijing 100124, China
2
Communist Youth League, Capital Medical University, Beijing 100069, China
*
Author to whom correspondence should be addressed.
Land 2024, 13(5), 698; https://doi.org/10.3390/land13050698
Submission received: 25 March 2024 / Revised: 1 May 2024 / Accepted: 10 May 2024 / Published: 16 May 2024
(This article belongs to the Special Issue Advances in Land Consolidation and Land Ecology)

Abstract

:
Community green spaces (CGSs) constitute a crucial element of urban land use, playing a pivotal role in maintaining the stability of urban ecosystems and enhancing the overall quality of the urban environment. Through the post-occupancy evaluation (POE) of green spaces, we can gain insights into residents’ actual needs and usage habits, providing scientific evidence for the planning, design, and management of green spaces. This ensures that CGSs better meet residents’ needs and improve their quality of life. The POE of CGSs relies heavily on high-precision data support. However, the current POE system for CGSs faces challenges, such as limited data collection methods, incomplete indicator systems, and excessive manual involvement. To address these limitations in data collection, this study proposes a comprehensive, dynamically monitored, objective, and sustainable POE system for CGSs. This system incorporates a multi-dimensional perception system that integrates the Internet of Things (IoT) and sensors to collect data from various sources. It establishes an evaluation framework from the perspectives of policy guidance and usage needs for CGSs, utilizing neural network systems and artificial intelligence techniques to compute the evaluation results. Using the Jiayuan Sanli Community in Beijing as a case study, this paper demonstrates the feasibility of the proposed system. A comparison between the POE results obtained using the multi-dimensional perception technique and those obtained manually reveals an 87% improvement in the accuracy of the evaluation results based on the multi-dimensional perception system. This system bridges the gap between planning perspectives and user experiences, contributing significantly to future urban land planning and land policy formulation.

1. Introduction

Enhancing the quality of the living environment stands as a pivotal goal within the United Nations’ achievable development objectives [1]. According to revised estimates from a United Nations report, it is projected that the urban population’s proportion will likely soar to 68% by 2050 [2]. This underscores the growing importance of urban ecosystems for human habitation and livelihoods. As a vital component of the urban ecosystem, CGSs play an active role in maintaining stability within the urban environment [3], providing ecosystem services [4], and improving the quality of the urban habitat [5]. In the context of increasing demands for the quality of living environments, the post-use evaluation and updating of already established CGSs is necessary [6].
At present, the post-use evaluation of CGSs mainly focuses on aspects such as the physical environment [7], attributes of green spaces [8], comfort in public spaces [9], and perceived pleasure [10]. Most studies analyze CGS indicator data from the perspective of objective data. For example, Yu et al. established a link between the scale of public landscapes and the degree of urban heat island effect mitigation [11]. Yang et al.’s research demonstrated the pattern of differences in the effects of water bodies and vegetation cover areas on urban ecology in summer and winter [12]. However, in recent years, researchers have found that CGSs are increasingly important for improving the health and mental health of residents, especially in the post-pandemic era. Pouso et al.’s research demonstrated that accessible CGSs effectively alleviated anxiety and depression symptoms caused by the lockdown situation [13]. Further, Venter et al.’s research demonstrated that in the post-pandemic era, the use of green spaces by teenagers (13 to 19 years old) is increasing at a rapid rate, while the opposite is true for middle-aged and older adults (35 to 64 years old) [14]. Therefore, a combination of objective and subjective data can better serve urban residents during the post-use evaluation of CGSs.
However, how to combine objective data with the public’s subjective experience of space use is a problem to be solved. Most of the current methods for collecting information on perceptions of use for CGSs are limited to carrying out a single questionnaire [15]. Such an evaluation system can obtain a subjective judgement of how welcoming some of the spaces [16] and facilities [17] in the CGSs are. Researchers have made various attempts to combine research data with objective spatial data. For example, Xiang et al. obtained visitor gathering points by spatializing points of interest and traffic data, and they determined the spatial and temporal distribution characteristics of the park visitation experience through a fixed-point questionnaire [18]. Peng and Maing corrected the observations of seniors’ preferences for public space use by combining them with metro and sunlight data through linear regression, demonstrating that the metro is not a major factor influencing seniors’ leisure activities [19]. All of these studies chose the most suitable method with a single objective in mind. However, there are still not enough respondents to construct a unified and universal evaluation system. With the many types of data and the need for multiple evaluation indicators, the establishment of a coupled indicator system has become almost the only option [20]. The coupled indicator system enables the introduction of a comprehensive indicator system for the effective evaluation of complex needs [21].
Further, in order to eliminate differences in competence in planning data acquisition and analysis, the construction of a multi-dimensional sensing system based on the linkage and collaboration of multiple sensing devices is inevitable [22]. An effective multi-behavior sensing system can meet the application requirements of complex business scenarios through intelligent sensing [23], intelligent recognition, and intelligent warning [24]. Meanwhile, based on the coupled indicator system, sensors can be used to perceive the user behaviors and indirectly evaluate the space-use behaviors of CGSs [25]. In order to better eliminate the subjective element in CGS assessments, the involvement of planners should be minimized. Thanks to the increasing sophistication of deep learning algorithms, evaluating data and outputting planning guidelines through AI models is a reality [26]. Introducing deep learning algorithms into a post-use evaluation system can be an effective way for planners to make subjective judgements on the output data of the coupled system [27].
Therefore, this paper constructs a complete post-use system consisting of “subjective research + passive perception data acquisition—index system coupling material spatial environment and public communication behaviors—multi-layer perceptron (MLP) to determine weights—based on OpenAI to calculate evaluation results”, which is based on the multi-perceptron system of CGSs’ evaluation process. This paper uses a typical CGS in Beijing as an example to evaluate CGSs’ function, spatial layout, and environmental quality with high accuracy. The system unifies the current imperfect post-use evaluation system and effectively improves its accuracy and objectivity; this can effectively help future urban land renewal. High-precision data support enables a more comprehensive, dynamic, objective, and sustainable post-use evaluation of community green spaces, providing a deeper understanding of the residents’ actual needs and usage habits. This serves as a scientific basis for the planning, design, and management of green spaces, ensuring they better meet the needs of residents and enhance their quality of life. In turn, this contributes significantly to future urban land planning and land policy formulation.

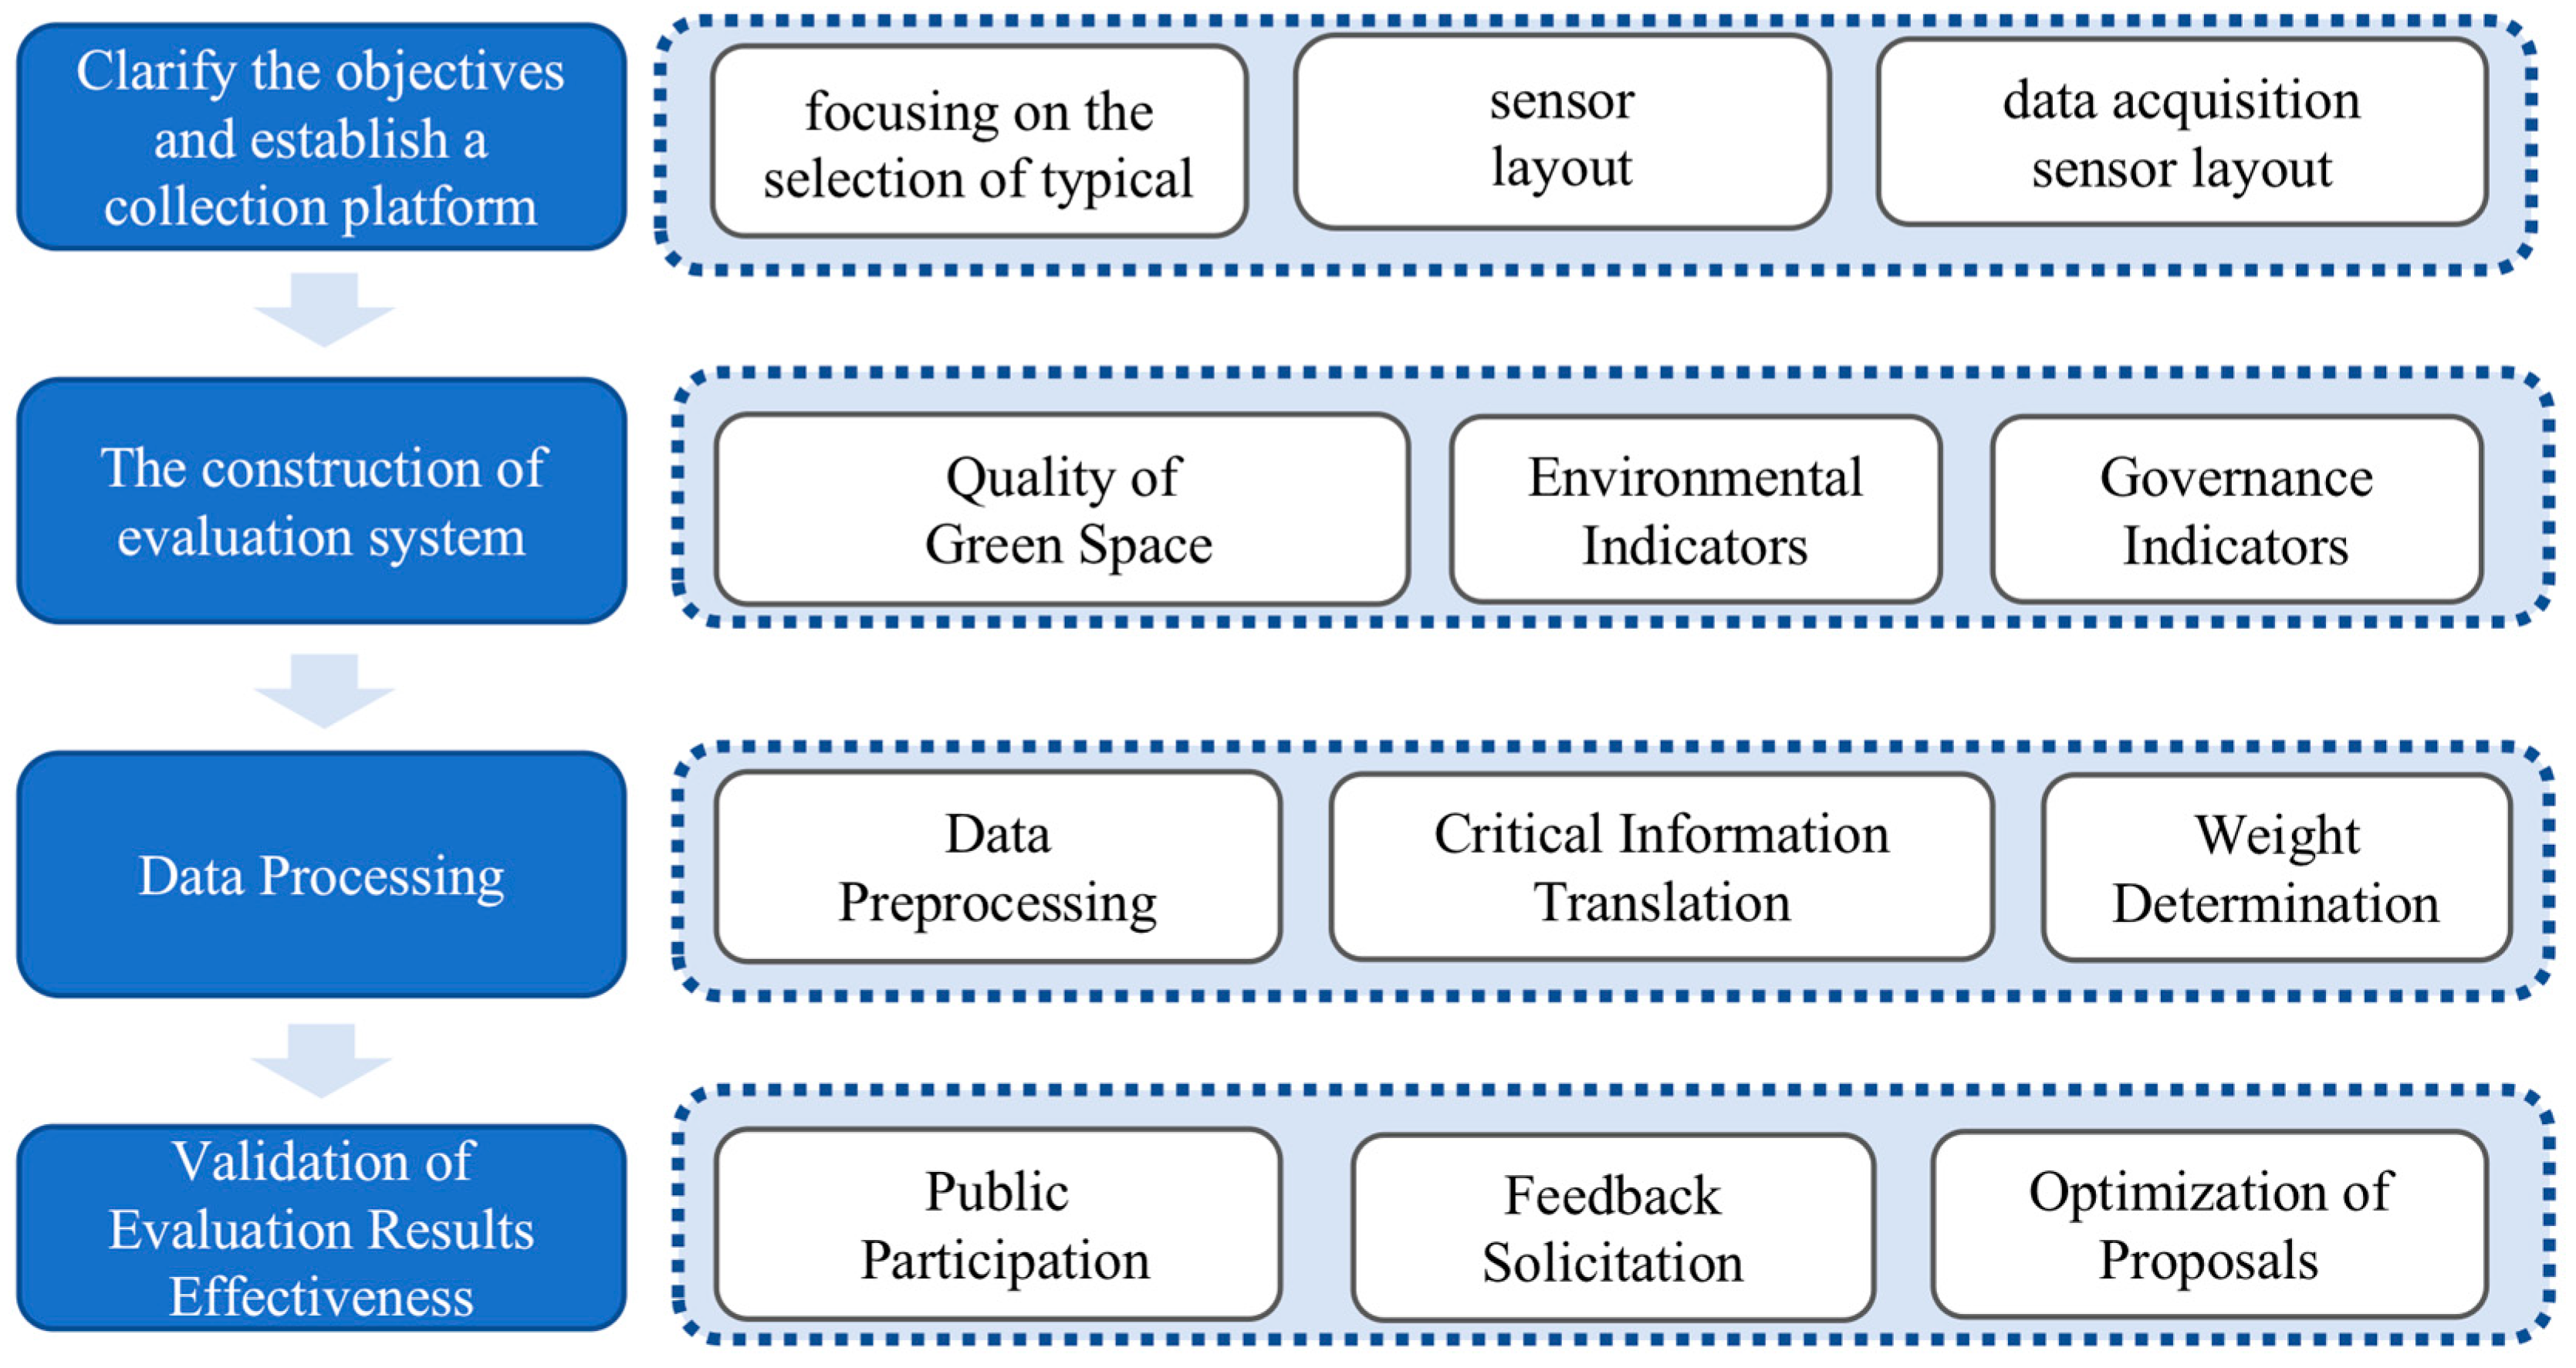
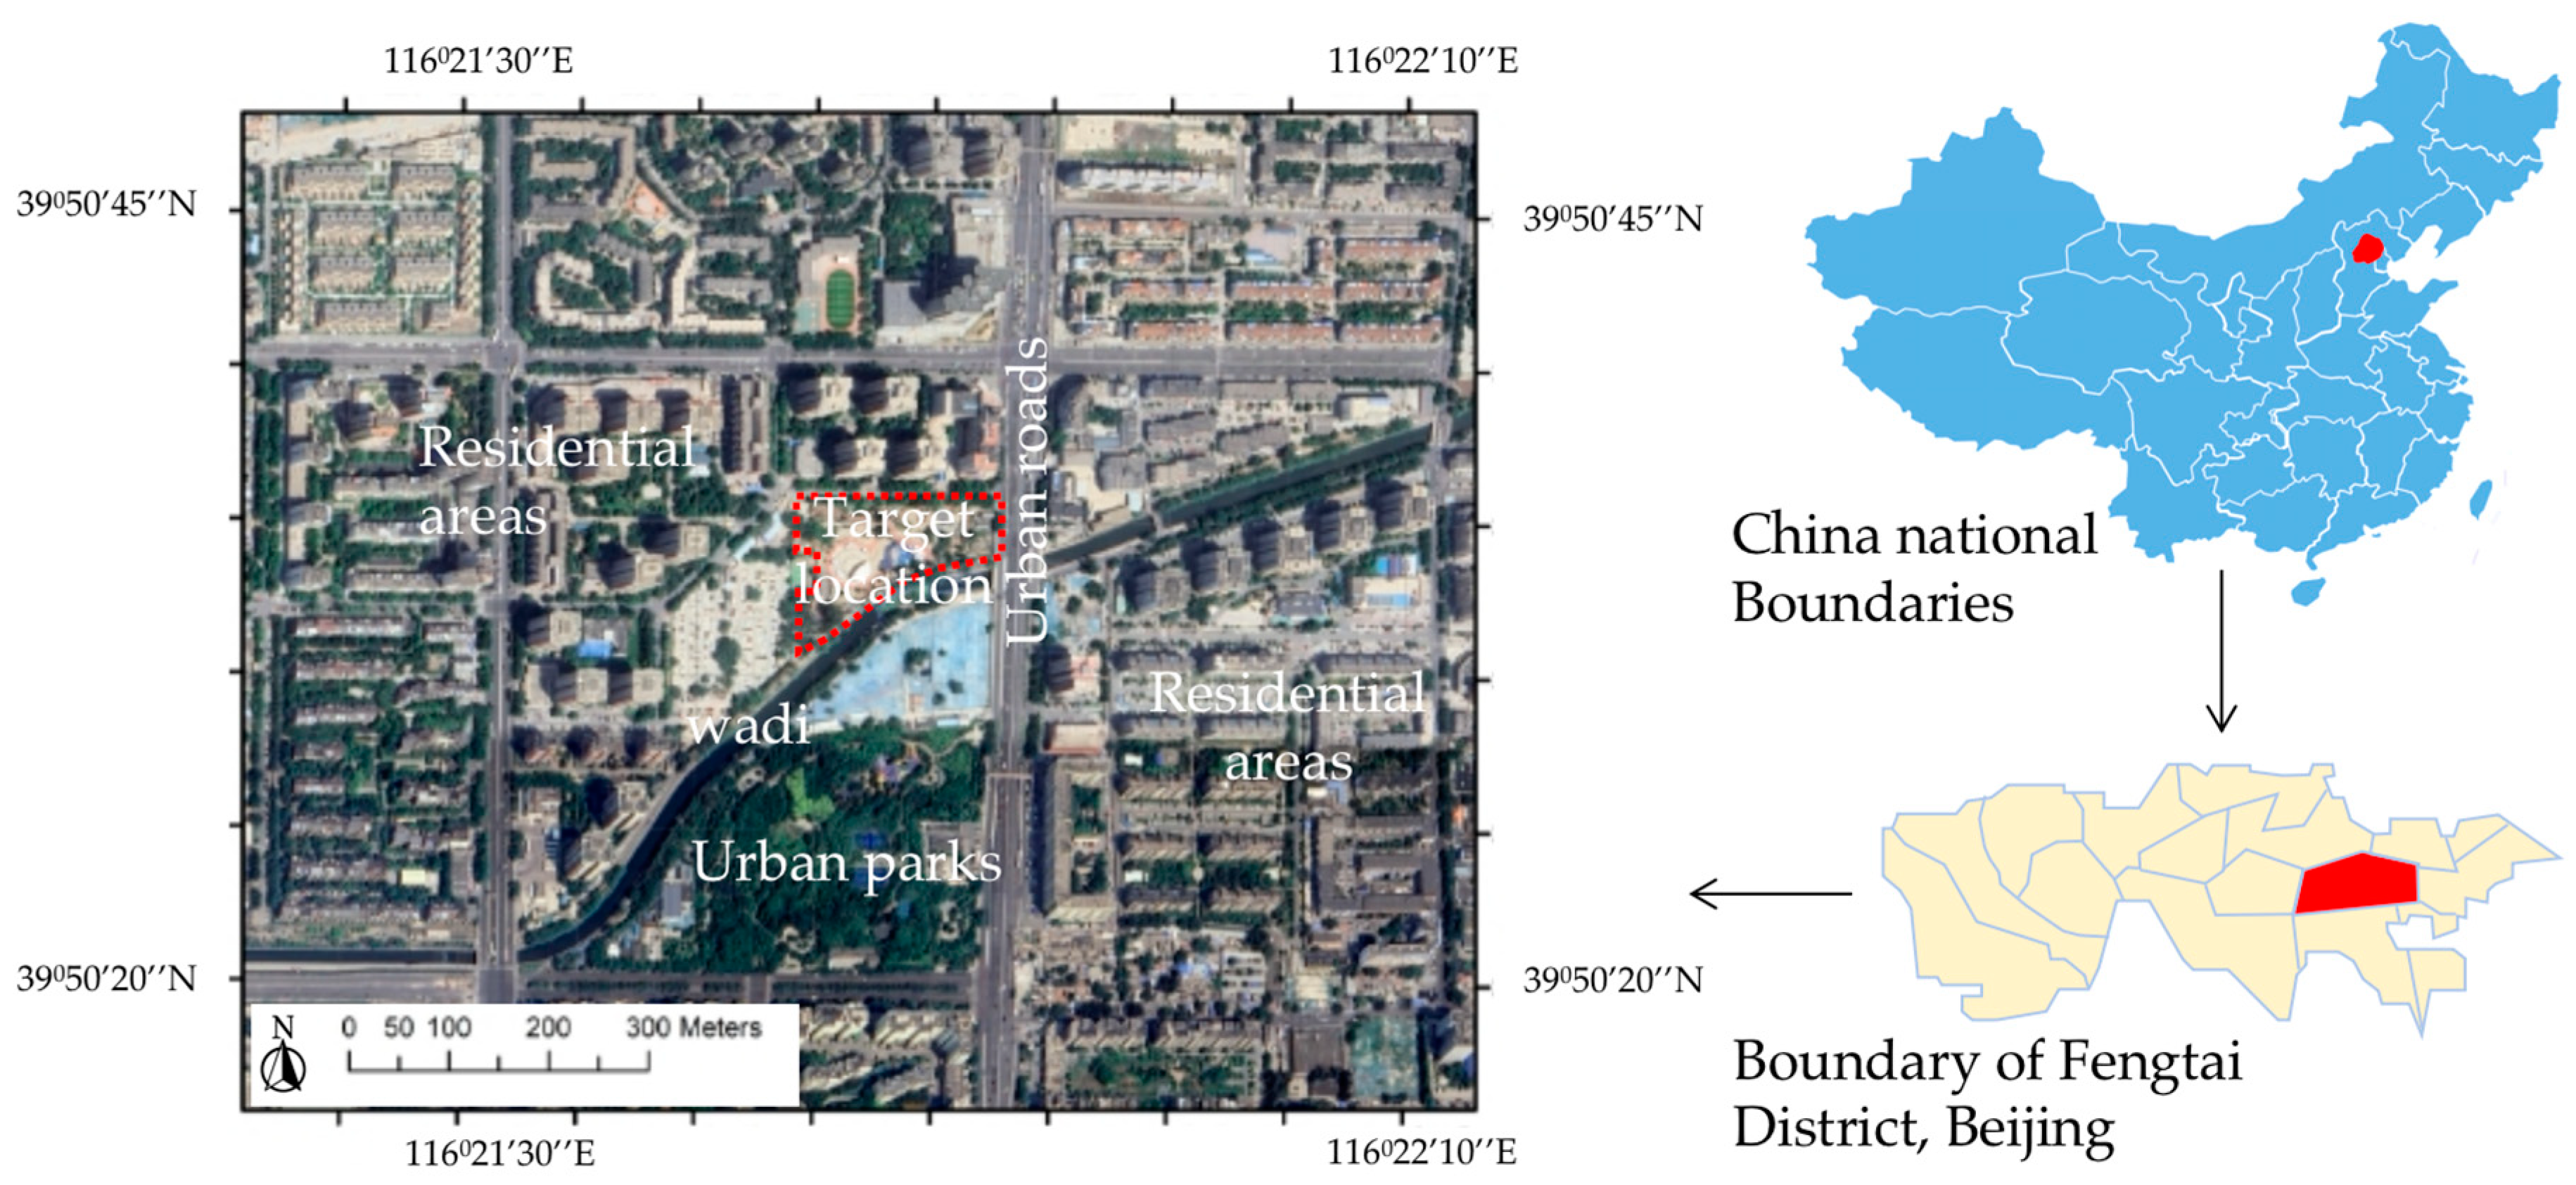
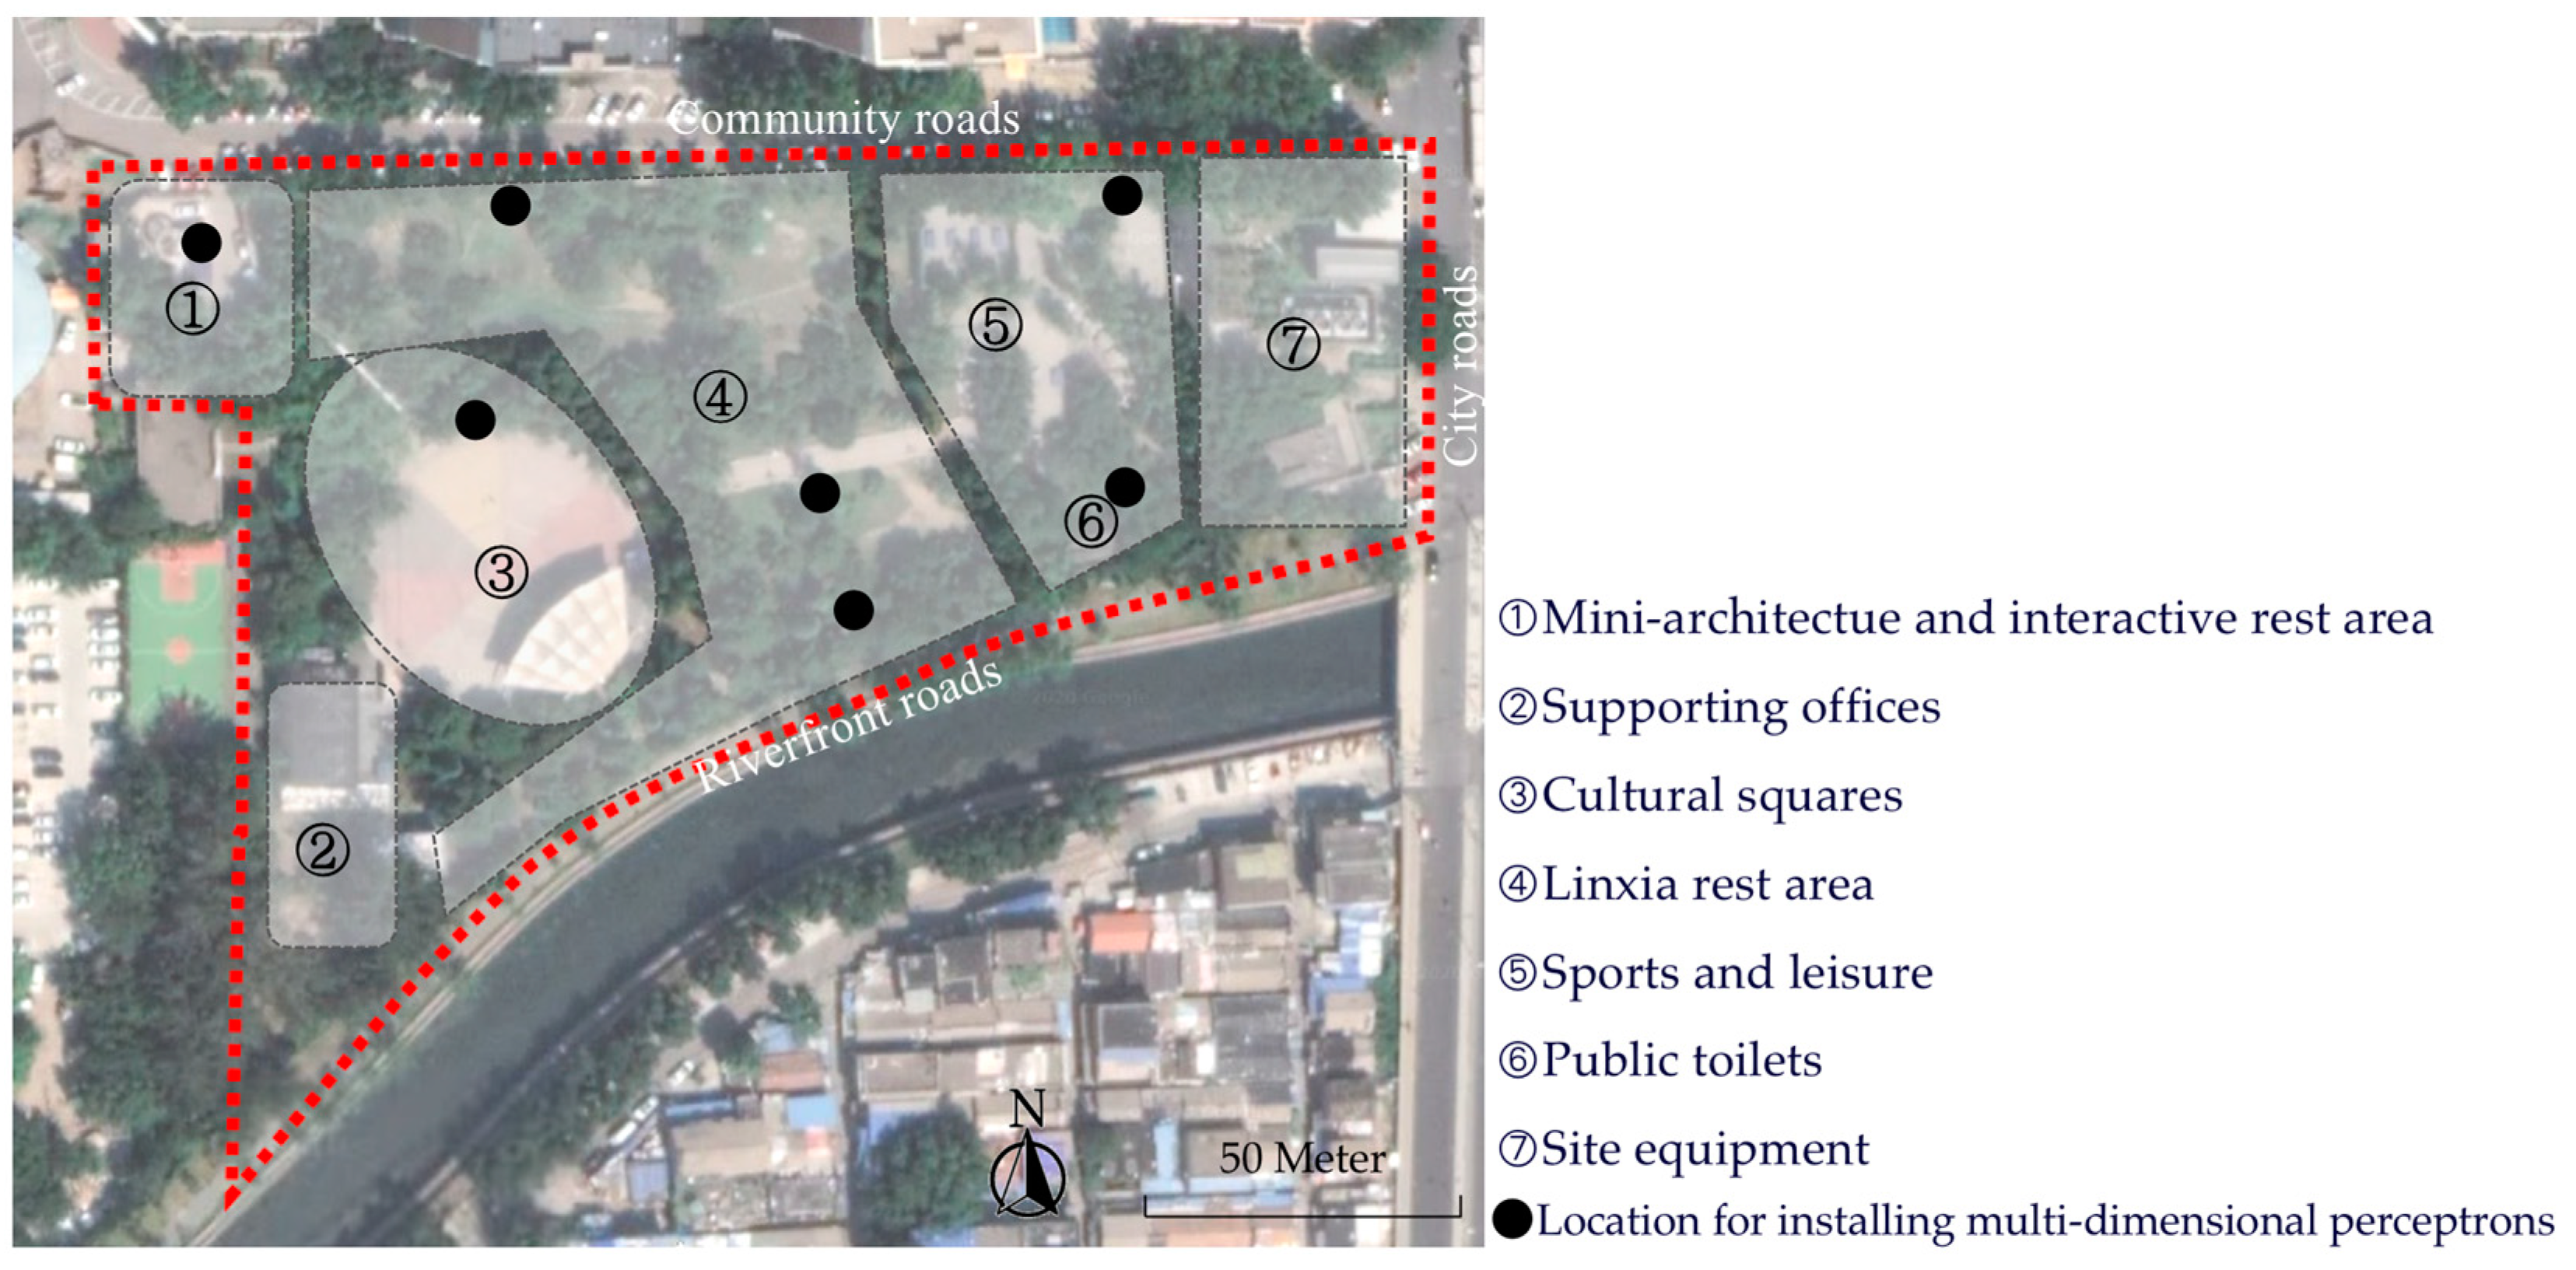
2. Materials and Methods

The establishment of a sound post-evaluation system requires that the measurement elements included in the system be sorted out. In order to minimize the subjective factors in the post-evaluation research process, the system’s priority must be its ability to directly observe and compile quantitative data. The selection criteria must consider the coupling relationship between the data collection source, the form of data processing and storage, and the data received, assisting researchers in acquiring the technical knowledge required to ensure the scientific integrity of the post-use evaluation (Figure 1).

2.1. Sensor Layout and Data Collection Sensor Layout

The Jiayuan Sanli Community is a commercial housing community built around the year 2000. Green spaces were equipped according to the needs of the residents. However, after more than 20 years of development, the green spaces can hardly meet the current demands and urgently need to be updated and renovated. The Jiayuan Sanli Community can represent the communities built in Beijing during the same period. Meanwhile, the green space in the Jiayuan Sanli Community is located in the center of the community and has a high daily usage rate. The construction scale of 16,337 square meters facilitates the placement of sensors and the collection and analysis of data. Residents are also highly motivated to participate. Therefore, the Jiayuan Sanli Community was ultimately chosen as the research subject of this study, as it possesses practical value, feasibility, generality, and reproducibility.
The Jiayuan Sanli CGSs are located in the Jiayuan Sanli Community of Majiabao, Fengtai District, Beijing. They stretch from Majiabao West Road in the east, to the Hanhe River in the south, to Jiayuan Road in the west, and to Jiahe Road in the north (Figure 2). The land area is approximately 16,337 square meters, and it belongs to a community-type green space. The green space is generally trapezoidal in shape and has a flat terrain. There are entrances and exits in the northeast, southeast, and northwest directions, making it convenient for residents to enter. It is considered that there are a certain number of trees at the S-shaped gate site near the river on the south side, and it is recommended to preserve and improve this area for environmental beautification. We selected CGSs in the Jiayuan Sanli Community, located in Majiabao, Fengtai District, Beijing. Overall, the Jiayuan Sanli Community consists of 20 residential buildings, including 2 panel-type buildings, 3 tower-type buildings, 4 commodity buildings from Xuri Jiayuan, 6 commodity buildings from Mingri Jiayuan, and 5 affordable housing units from Mingri Jiayuan. Within a 1 km radius, there are 3 bus stops and 1 subway station. The surrounding population is relatively dense, with a total of 4683 households, 12,000 residents, 2750 elderly people over 60 years old, and 1380 youths under 14 years old (Figure 3). The population is concentrated in the residential areas to the west and north of the green space. The CGSs cover an area of approximately 16,337 square meters and currently comprise 7 functional areas. These areas are mainly designed for the activities and use of the elderly and children, with adult activities and companionship playing a supporting role. This meets the expected requirements for a typical pilot CGS.
The current ecological space of the Jiayuan Sanli Community is divided into 7 partitions (Figure 4). Functional Area 1 is located in the northwest of the overall space, adjacent to the northern entrance, and comprises the small building of the Yue Lao Pavilion, frequently used for daily activities. A monitoring point was set at this location. Functional Area 2 is mainly the community office building, which is not open to the public; therefore, no sensor points were set here. Functional Area 3 is a multi-functional square, serving as both a daily activity space and a festival venue. It is a key monitoring area and has 1 monitoring point. Functional Area 4 serves as the main space for activities under the forest canopy and represents an important node connecting Functional Areas 3 and 5. Monitoring points were also set here due to the limited range of image perception caused by the existing trees. Therefore, 3 monitoring points were set here. Functional Area 5 serves as a current activity site and is adjacent to the subway station, which is prone to noise pollution. Therefore, 1 monitoring point was set here. Functional Area 6 is the current public toilet; 1 monitoring point was set here.
The evaluation of public spaces in the pilot community is carried out based on a CGS evaluation system based on a multi-sensory system. This evaluation mainly includes 3 aspects: sensor installation, data collection, and analysis and evaluation. In the 7 multi-dimensional sensing installation points in the 4 main functional areas of public spaces, spatial characteristics, coverage radius, and evaluation factors were set.
After obtaining the user behavior, usage situation, and environmental information data of the CGSs, the effective data obtained through edge computing was input into the established CGS evaluation system for evaluation using multi-layer perceptron. When applying data to a multi-layer perceptron, Chinese characters cannot be used for input and output. Therefore, indicators and data in the established CGSs’ evaluation system are numbered. Among them, a refers to multi-dimensional perception data, and b refers to subjective survey data. Then, a dataset is constructed that includes indicator numbers and corresponding values. Each datum should contain the values of all indicators. In the established CGS evaluation system, there are 45 indicators and 57 evaluation data, and each dataset contains 57 values.

2.2. The Construction of an Evaluation System Based on a Multi-Dimensional Perception System

To ensure the scientific and reasonable evaluation items in the post-construction environmental evaluation system of CGSs, this study uses the scientific construction of evaluation indicators as the starting point and establishes the construction method of the post-construction evaluation system of CGSs. This mainly includes the selection of data acquisition methods, the screening of evaluation indicators, the real-time dynamic adjustment of evaluation indicators, and the hierarchical integration of evaluation indicators, as well as data processing and calculation.
The existing evaluation indicator systems for community green spaces include the evaluation of community green space quality and the assessment of the built environment of community green spaces (Table 1). Drawing on the reference of the existing evaluation indicator systems for community green spaces, this study proposes 4 levels of evaluation elements based on the interpretation of policy orientations and the analysis of user needs across 4 aspects: the creation of space environments based on user needs, the diverse user experiences of different users, the enhancement of vitality in community green spaces, and the strengthening of public participation and attention to social impacts. This evaluation system sets up 4 first-level indicators, namely, public facilities, landscape environment, use behavior, and cultural connotation. They, respectively, target the basic functions, greening and comfort level, use situation, and local humanistic and historical presentations of public spaces. The second-, third-, and fourth-level indicators are constructed based on existing evaluation systems, combined with subjective research and multi-dimensional perception systems, aiming to comprehensively evaluate the role of public spaces in urban life (Table 2). Among them, traffic facilities, ecological facilities, cultural design, cultural inheritance, and other aspects of secondary indicators cannot be efficiently replaced by multi-dimensional perception systems; therefore, traditional subjective research methods can be used to quickly and efficiently obtain information. Other indicators can be monitored through multi-dimensional perception systems.

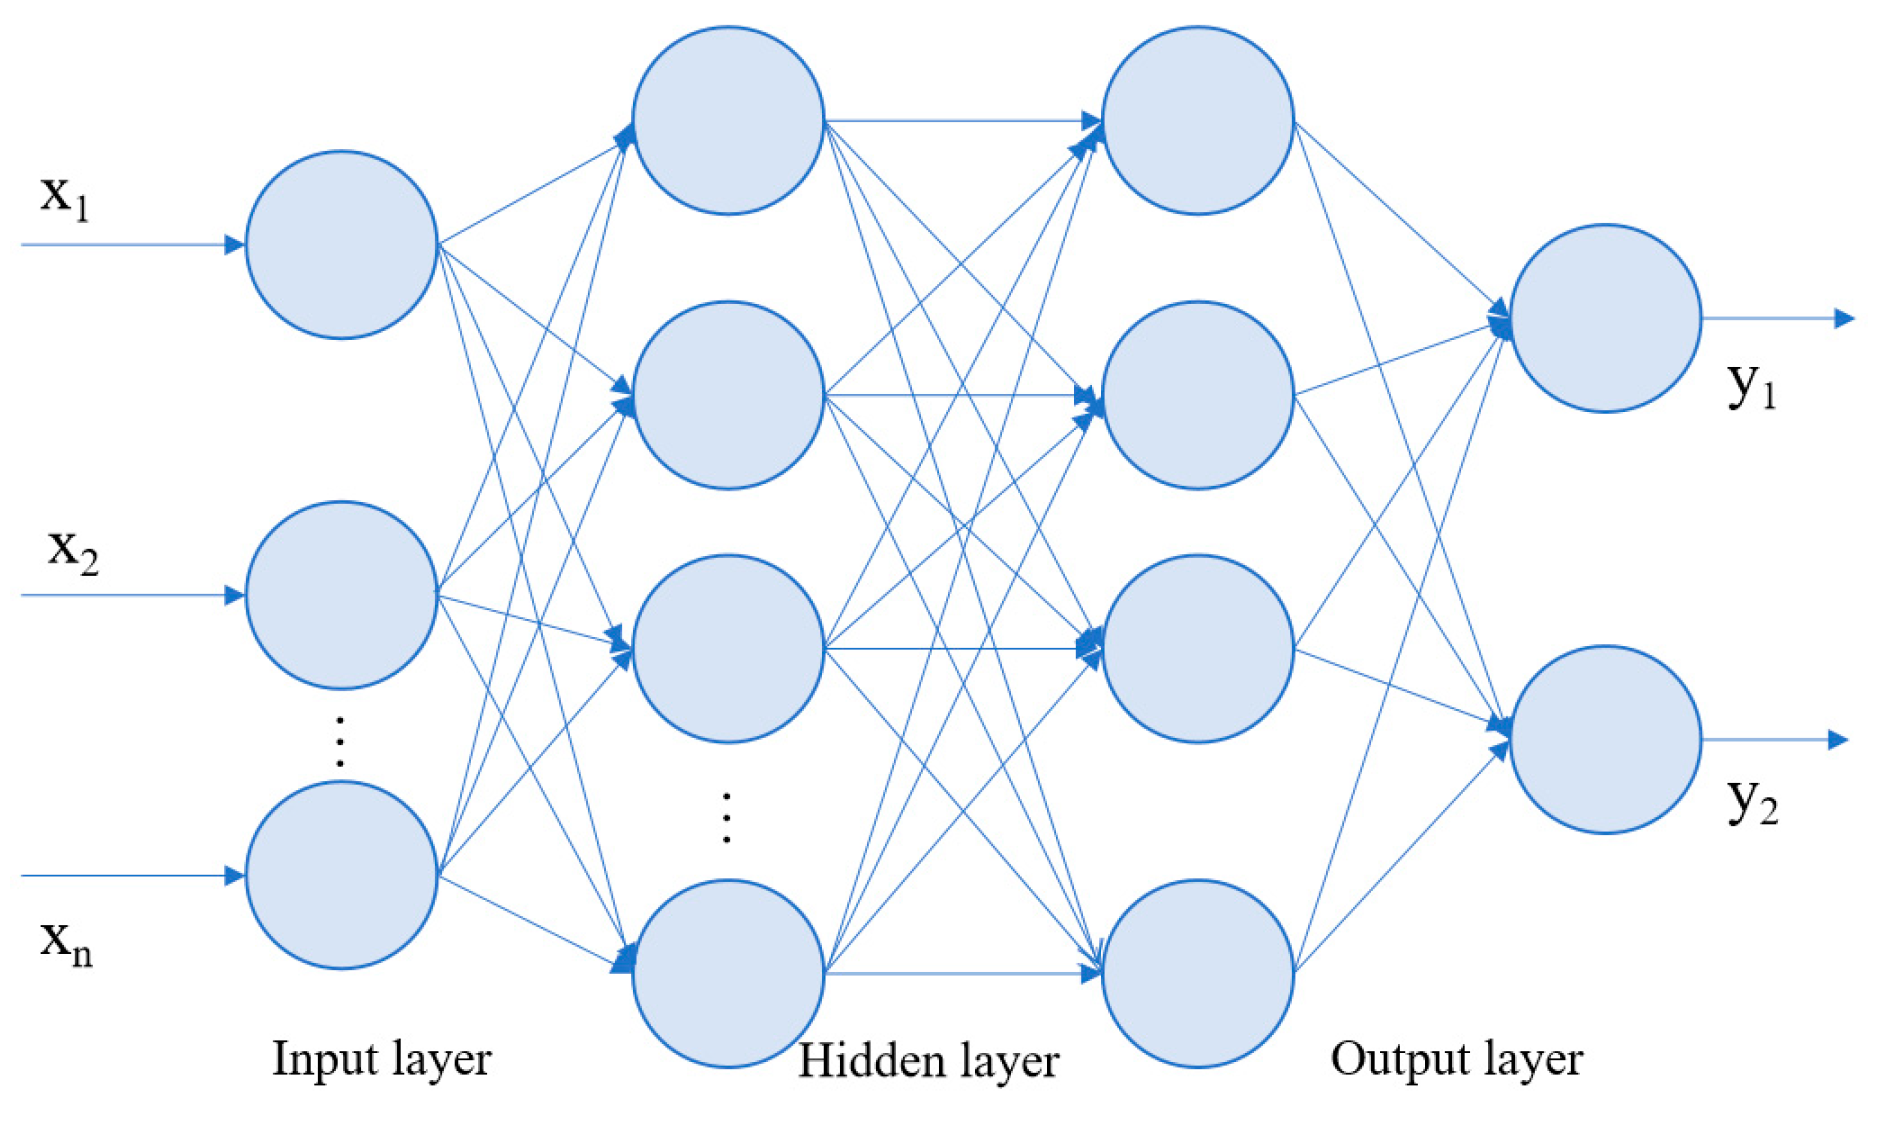
2.3. Data Processing

After obtaining the user behavior, usage situation, and environmental information data of CGSs, the effective data obtained through edge computing was input into the established CGS evaluation system for evaluation using a multi-layer perceptron (MLP). This system is a feedforward artificial neural network model that maps multiple input datasets to a single output dataset. It comprises an input layer, hidden layers, and an output layer. Each neuronal layer consists of numerous neurons, with the input layer receiving input features and the output layer delivering the final prediction results. The intermediate hidden layers are responsible for extracting features and performing nonlinear transformations. Each neuron receives the output from the previous layer, performs weighted summation and activation function operations, and generates the output for the current layer. Through continuous iterative training, the MLP can automatically learn the complex relationships among input features and predict new data accordingly. When using data in a multi-layer perceptron, Chinese characters cannot be used for input and output. Therefore, the indicators and data of the established CGS evaluation system are numbered.
With a CGS evaluation system that has been numbered, the multi-layer perceptron (MLP) network model can be trained. The information collected from public participation is not suitable for MLP and has not been numbered. It will be used as supplementary information in later stages. MLP is a neural network system with multiple hidden layers. Compared with general neural networks, MLP has more analysis parameters [36] and can analyze problems more comprehensively, analyzing the most accurate target answers from numerous data. This is the basic network logic structure of MLP. The leftmost layer is the input layer, the last layer is the output layer, and there are 2 or more hidden layers in between, with each layer connected to each other separately (Figure 5).
The linear function relationship z = ∑wixi + b is supplemented with an activation function f(z).
The use of a multi-layer perceptron (MLP) neural network involves both forward propagation and backward propagation processes. The forward propagation algorithm is a sequential process that uses the output results of the previous layer to calculate the output results of the next layer, all the way to the final output layer [37]. Forward propagation is mainly used for the application calculation of MLP. Assuming the input training data are (x1, x2), the total number of input layers is L, and all the weight matrices W correspond to the hidden layers and output layer, the offset vector is b, and the calculation of each layer’s output is al, the final output is aL, f is the activation function, and z is the output after passing through the neuron.
al = f(Wial − 1 + bl) (2 ≤ l ≤ L)
When performing forward propagation of MLP, the weight matrix W and offset vector b are all uncertain values. The MLP backward propagation algorithm is used to determine the appropriate weight matrix W and the offset vector b. The algorithm of MLP backward propagation optimizes the overall structure logic by using the loss function to determine the extreme value. The loss is measured by the mean squared error in each layer function, and the loss function for each input sample is obtained accordingly. Backpropagation is the training process of MLP.
J W , b , x , y = 1 2 a L y 2 2
After the entire algorithm outputs to the L layer, the W and b of the output layer satisfy the following function formula:
a L = f z L = f W L a L 1 + b L
For the final output layer parameters, the loss function becomes the following formula:
J W , b , x , y = 1 2 f W L a L 1 + b L y 2 2
When solving the gradient, we, respectively, use the derivative of W and b in the following formula:
δ J W , b , x , y δ W L = δ J W , b , x , y δ z L δ z L δ x = a L y a L 1 T f z
δ J W , b , x , y δ b L = δ J W , b , x , y δ z L δ z L δ x = a L y f z L
According to the MLP forward propagation algorithm, we can obtain the following:
z l = W l a l 1 + b l
Then, we can obtain the gradient of W l and b l at the L layer of the MLP system as follows:
δ J W , b , x , y δ W L = δ J W , b , x , y δ z L δ z L δ x = δ l a l 1 T
δ J W , b , x , y δ b L = δ J W , b , x , y δ z L δ z L δ x = δ l
We can obtain the recursive relationship of δ in MLP as follows:
δ l = δ l + 1 δ z l + 1 δ z l = W l + 1 T δ l + 1 σ z l
According to the recursive relationship in the MLP system, we can obtain the recursive relationship of W and b as follows:
W l = W l a i = 1 m δ i , l a i , l 1 T
b l = b l a i = 1 m δ i , l
When the changes in W and b are both less than the threshold for a layerwise iteration, we output the linear coefficient matrix W and offset vector b for each hidden layer and the final output layer. The entire neural network training is complete. It can achieve processing results that are consistent with the calibration data. That is, it can be used for multi-layer perception calculations of multi-dimensional perception system data and can score individual items according to the established evaluation system (Figure 6).
After obtaining the data, the initial processing of the data can be carried out using a multi-layer perceptron, and the evaluation scores of each evaluation index can be obtained (Table 3).
This study coupled the indicator weights obtained through the multi-layer perception machine method with the objective weights ui derived from the entropy weight method to acquire the composite weights λi of the lowest-level indicators relative to the highest-level λi:
λi = awi + (1 − a)ui   (0 ≤ a ≤ 1)
As can be seen from the formula, the composite weights change with the variation in a. When a = 0 and a = 1, the composite weights correspond to the entropy weight method and the multi-layer perception machine method, respectively. In this study, 5 experts, including Liu Ze [38], Hui Xiaoxi [39], Lv Yuan [40], Wu Yingshi [41], and Du Qingchun [42], were invited to assign weights to the multi-layer perception machine analysis and the entropy weight method. The average value of these assignments was calculated to obtain a = 0.725, based on which the composite weights λi of the fourth-level indicators (Layer D) in the comprehensive evaluation system for community green space were calculated relative to the target layer. Subsequently, the composite weight sets were calculated for Layer A relative to the target layer, for Layer B relative to Layer A, for Layer C relative to Layer B, and for Layer D relative to Layer C, based on the calculated λi values.
A = [ A 1 , A 2 , A 3 , A 4 , A 5 ] = [ i = 1 18 λ i , i = 19 31 λ i , i = 32 38 λ i , i = 39 50 λ i , i = 51 52 λ i ]
B I = [ B 1 , B 2 , B 3 ] = [ i = 1 4 λ i / A 1 , i = 5 6 λ i / A 1 , i = 7 9 λ i / A 1 ]
B XII = [ B 12 ] = [ i = 1 1 λ i / A 5 ]
C I = [ C 1 , C 2   C 9 ] = [ λ 1 / A 1 B 1 , λ 2 / A 1 B 1 λ 9 / A 1 B 1 ]
By multiplying the composite weight set of the fourth-level indicators (Layer D) relative to the third-level indicators (Layer C) by the scores of the fourth-level indicators, the comprehensive evaluation scores of the third-level indicators were calculated. Eventually, the comprehensive score of the green space in the Jiayuan Sanli Community was derived, allowing for a comparison of the green space quality among different communities using weighted results.

2.4. Validation of Evaluation Results Effectiveness

After the completion of the optimized design scheme, in order to determine whether the optimized scheme can meet the needs of users, public participation was used to evaluate the optimized scheme, and on-site discussions were carried out. Residents’ representatives of Jiayuan Sanli, as well as street and community management personnel were invited to the meeting. Among them, 47 residents’ representatives attended the meeting, including 7 teenagers, 22 young and middle-aged people, and 18 elderly people. Other management staff totaled 7 people, with a total of 54 people attending the meeting. Questionnaires were randomly distributed throughout the day around the community green space, and a total of 248 questionnaires were collected. Among the residents who participated in the survey, 9 were under 18 years old, 16 were between 18 and 24 years old, 57 were between 25 and 40 years old, 40 were between 41 and 50 years old, 43 were between 51 and 60 years old, 41 were between 61 and 70 years old, and 39 were 70 years old and above. A total of 3 staff members, 17 residents’ representatives, and 167 questionnaire respondents were very satisfied with the plan. A total of 1 staff member, 3 residents’ representatives, and 98 questionnaires focused on optimizing the signage system in Plot 6, believing that the visual guidance of Plot 6 needed to be increased. Through a review of the overall evaluation process, it was found that when using multi-dimensional perception system data for spatial evaluation, the utilization efficiency of Plot 6 was relatively low, and the number of people passing through the surrounding roads in Plot 6 was also small. Through multi-layer perceptron and OpenAI, it was judged that the main reason was the poor road accessibility. Therefore, in the optimized plan, the surrounding roads of Plot 6 were improved. At the same time, during the traditional subjective research process of the visual signage system, it was found that the visual signage system was well-equipped, and no problems, such as unclear semantic expression or logical confusion, were found. Therefore, the post-evaluation results of CGSs based on the multi-dimensional perception system can more fundamentally discover essential problems in space use, enabling the formulation of more effective spatial layout optimization strategies.

3. Results

3.1. Evaluation Results

After the installation of monitoring equipment in the Jiayuan Sanli CGSs, continuous data collection was carried out for a total of 361 days, from 14 December 2021 to 10 December 2022. After edge computing processing, a total of 49,721 valid data from seven collection points were collected. Combined with subjective survey information, the NFT data information was compiled and stored permanently on the OpenSea open platform. The data from each collection point for 361 days and subjective survey information (Table 4) were input into the multi-layer perceptron for analysis, and the evaluation score was obtained.
Using the trained OpenAI to analyze and translate the evaluation scores, the final post-use evaluation results of ecological space in the Jiayuan Sanli community were obtained. The facilities are basically well-equipped and well-maintained, but the rest facilities are slightly insufficient; the activity facilities are basically well-equipped, but spatial flexibility is low, and the sharing of facilities is insufficient; the convenience facilities are missing; some facilities operate but need improvement. The accessibility and road network density of the space need improvement; the guidance system is complete. The application of green sustainable technologies is good, but the use of ecological methods is lacking in space creation. The overall environment of the space is good, but the air quality is average. Some functional areas have a poor micro-environment due to lack of facilities and low green coverage. In terms of spatial function and activity perception, the current CGSs ignore the frequent usage by the elderly and children. The spatial environmental design of the CGs ignores the multiple needs of the elderly and children for companionship and interaction, lacks spaces for different age groups to play and relax together, and has problems such as single-function type, scattered spatial layout, and low environmental quality.

3.2. Space Layout and Management Measure Optimization

When conducting spatial evaluation using the multi-dimensional sensing system data, it was found that the utilization efficiency of Functional Area 6 was relatively low, and the number of road users around Functional Area 6 was also small. Multi-layer perceptron and OpenAI determined that the main reason for this was poor road accessibility. Therefore, in the optimization plan, the roads around Functional Area 6 were improved. At the same time, in terms of the visual guidance system, it was found that the visual guidance system was well-equipped during the traditional subjective research process, and there were no instances of unclear semantic expression or logical confusion was found. However, the fact is that the utilization efficiency of this area and its surrounding roads is low due to the defects of the visual guidance system in this area.
The specific optimization design plan includes seven aspects of specific optimization and transformation nodes (as shown in Figure 7):
The micro-topographic landscape path in the park allows users to stroll, exercise, and socialize. By utilizing terrain changes, it enhances vertical experience and provides users with multi-level spatial experiences.
A sports field retains the original trees on site, combining them with tree pits to add rest spaces under the trees and improve the spatial quality of the site. A basketball court will be added to diversify user groups and enhance park vitality.
The community garden is a shared garden full of blooming flowers. This creates a warm and harmonious community environment, promotes resident communication and integration, and provides a public space where people can perceive and experience nature.
The rest area is a resting space in the park that supplements the park’s functional gaps and enriches the activity types of nearby residents. The green space intertwines with paved ribbons, complemented by ribbon seating to enclose and define spaces, providing users with psychological safety and a pleasant and cozy space for cooling off and chatting.
The children’s activity area supplements insufficient functions, focuses on safety, and is oriented around a sandbox. It has facilities such as climbing micro-topography, a children’s trampoline, and small hanging wooden stakes for walking. There are also rest seats for parents to accompany their children, making it a fun public space for parent–child interaction and sharing between the young and the elderly.
The central square breaks up the original paved square and alleviates the centripetal force of the circular square. It enhances the square’s seating forms and qualities, adds ecological sunshade facilities, increases lighting facilities, enhances the welcoming and communicative atmosphere of the square, and serves as a core venue for citizens’ daily gatherings and large-scale activities.
The Silver-Hair Farm is a small farm consisting of micro-farms and a sports area. It is suitable for carrying out popular special sports events such as diabolo and table tennis. In addition, it cultivates demonstration crops to promote agricultural culture, making it a shared space for the young and old that enhances science education.
To establish a community green space management system that is jointly built and shared by all, it is necessary for personnel at all levels within the community to fully participate and actively cooperate. On the basis of the management and maintenance responsibilities of government functional administrators, community managers actively encourage residents to participate in the construction, conservation, and management of green spaces and adopt corresponding incentive mechanisms to fully mobilize the enthusiasm of community residents. At the same time, by inviting professional enterprises or social organizations to provide guidance, small green spaces can be integrated to improve the fragmented green space environment within the community, thereby achieving the goal of maintaining the healthy development of green spaces.

4. Discussion

4.1. A Comprehensive Post-Construction Environmental Evaluation System for CGSs

The results of this study show that the post-construction environmental evaluation system accurately represents the results of the post-use evaluation of green spaces in the Jiayuan Sanli community. This can be explained by the fact that the four-level indicator system and the 45 indicators included can characterize CGSs more objectively and comprehensively. The indicator dimensions we constructed are similar to those in the evaluation system constructed by other studies [43,44,45,46]. A widely recognized study proposed a comprehensive monitoring tool for CGSs with three first-level indicators: basic principles, defining accessibility, defining attractiveness, and the inclusion of culture and history. It also includes secondary indicators, such as facilities, a variety of qualities, functional levels, and many other secondary aspects. These classifications are similar to our own for constructing evaluation indicators [47]. A study on the potential of green spaces in Beijing’s old urban areas corroborated our indicator system, concluding that the evaluation of the potential of CGSs needs to include several key aspects, such as architectural style, environmental facilities, and cultural resources [48]. In contrast, the green space evaluation indicators established by many current studies tend to focus on specific aspects and fail to comprehensively characterize the green spaces of communities. For example, the evaluation of CGSs using soundscape/landscape indices lacks the use of objective parameters and may be subject to bias due to the subjects’ own preferences [49]. Therefore, the construction of indicators for a post-construction environmental evaluation system can represent the characteristics and assessment results of CGSs in a more comprehensive and objective way.

4.2. Adding Public Participation Sessions to Correct Evaluation Results

Through the results of this study, it was found that the current calibration training of the multi-layer perceptron or the optimization of OpenAI still cannot guarantee the complete accuracy of the data. This is because some data are indeed misjudged by the system, leading to bias in the final evaluation results [50]. Numerous studies have shown that this is a common problem in the operation of multi-dimensional perception systems [50,51,52,53]. Therefore, this study corrects the evaluation results by adding a public participation component. Starting from the perspective of discovering the root causes and focusing on public participation, we further optimize the entire post-evaluation system of community public space based on a multi-dimensional perception system. Our working method is as follows: data collection, data processing, AI analysis, evaluation of results, optimization of programmer design.
After using the multi-layer perceptron to obtain the scores of each evaluation index, based on the evaluation scores of each index and the independent public participation content, OpenAI is used to obtain the final text evaluation results. The five test set samples obtained in the previous text, their corresponding scores, and public participation information are translated into evaluation result texts using OpenAI. Five expert teams in the field of CGSs are invited to subjectively evaluate the data of the five test sample spaces using the established CGS evaluation system. The final evaluation results achieved a coverage rate of more than 87% using both the multi-layer perceptron and OpenAI. Considering the differences in language expression between subjective evaluation and OpenAI, the accuracy of the final evaluation results of OpenAI meets actual usage requirements. At the same time, the multi-dimensional perception system is used to achieve full-time, full-area, and full-user coverage of CGSs. The data collected by the perception system are open to the community residents, and their opinions and suggestions are fully considered to improve the use effect and user satisfaction of public spaces. This system can achieve more comprehensive coverage of post-evaluation personnel in CGSs, gather 24 h data, and produce evaluation results that are more authentic and effective. The combination of multi-dimensional sensing devices and CGS design can collect data consistently and monitor CGSs’ usage in the long term, avoiding the need for formalization and enabling real-time evaluation after use. This provides sustainable and effective data support for management decisions.

5. Conclusions

As a crucial component of the urban ecosystem, CGSs s play an active role in maintaining the stability of the urban ecosystem, providing ecosystem services, and enhancing the quality of the urban environment. However, the planning of urban CGSs requires more precise data support. Due to limitations in data collection methods, previous post-occupancy evaluation systems suffered from issues such as a limited range of data collection, incomplete indicator systems, and excessive manual participation, resulting in insufficient authenticity and objectivity in evaluation results. Based on a multi-dimensional perception system, this study comprehensively evaluates urban CGSs and explores methods to optimize the evaluation system, laying an important foundation for enhancing the levels of intelligence, precise planning, and organic renewal in urban communities. Technologies such as multi-dimensional perception, image recognition, and multi-layer perceptron are introduced to establish a comprehensive, objective, and sustainable post-occupancy evaluation system for CGSs’ utilization, focusing on four aspects: the material functional environment, the natural spatial environment, spatial perception and activity perception, and the emotional shaping of regional culture and community. This research found that by collecting multi-source data through the multi-dimensional perception system of the Internet of Things and sensors, and by constructing an evaluation system based on artificial neural networks and artificial intelligence technology, the accuracy of the evaluation results can be improved by 87% compared to manual evaluation. This evaluation system is more realistic and objective and eliminates the gap between the planning perspective and the user experience.
The optimization design of community green space is being conducted based on the post-occupancy evaluation results from the multi-dimensional perception system. Environmental improvements and enhancements to the atmosphere of party-building activities are being made to the original central plaza. The table tennis function is relocated to the southwestern corner of the site to facilitate the zoning of active and quiet areas. Additional leisure areas in the woods, children’s playgrounds, and community gardens are being added. Fitness facilities, rest seats, shade and rain shelters, and safety protection measures are being improved. Landscaping elements, such as water collection, irrigation, and drinking water facilities are being added. The planting configuration is being adjusted to enhance the greening and aesthetic environment. A circular park trail and track are being installed to meet residents’ daily fitness needs for running and walking in the garden. However, we would like to note the potential limitations of this study. Due to the limited number of test samples, certain deficiencies in the evaluation system and shortcomings in work methods may not have been fully apparent, resulting in inadequacies in the workflow and deviations in evaluation results in the final community public space evaluation system. In the future, we will increase the number of test samples to make up for the shortcomings of the evaluation system. As organic urban renewal continues to take place across various regions, the renovation of CGSs will also continue. In the future, it is hoped that the post-occupancy evaluation system for CGSs, based on the multi-dimensional perception system developed in this study, can be applied to more projects and continuously optimized through numerous practical applications.

Author Contributions

Conceptualization, M.L. and J.Z.; methodology, M.L.; formal analysis, M.L. and Y.W.; writing—original draft preparation, M.L.; writing—review and editing, M.L., J.Z. and Y.W.; supervision, M.L. and J.Z.; funding acquisition, J.Z. All authors have read and agreed to the published version of the manuscript.

Funding

This work was supported by grants from the National Natural Science Foundation of China (No. 52078008) and the Beijing Municipal Natural Science Foundation (No. 8202004).

Data Availability Statement

The original contributions presented in the study are included in the article, further inquiries can be directed to the corresponding author.

Conflicts of Interest

The authors declare no conflicts of interest.

References

  1. Goubran, S.; Walker, T.; Cucuzzella, C.; Schwartz, T. Green building standards and the united nations’ sustainable development goals. J. Environ. Manag. 2023, 326, 116552. [Google Scholar] [CrossRef] [PubMed]
  2. O’Sullivan, J.N. Demographic Delusions: World Population Growth Is Exceeding Most Projections and Jeopardising Scenarios for Sustainable Futures. World 2023, 4, 545–568. [Google Scholar] [CrossRef]
  3. Vargas-Hernández, J.G.; Pallagst, K.; Zdunek-Wielgołaska, J. Urban green spaces as a component of an ecosystem. In Sustainable Development and Environmental Stewardship: Global Initiatives Towards Engaged Sustainability; Springer: Berlin/Heidelberg, Germany, 2023; pp. 165–198. [Google Scholar]
  4. Enssle, F.; Kabisch, N. Urban green spaces for the social interaction, health and well-being of older people—An integrated view of urban ecosystem services and socio-environmental justice. Environ. Sci. Policy 2020, 109, 36–44. [Google Scholar] [CrossRef]
  5. Kronenberg, J.; Haase, A.; Łaszkiewicz, E.; Antal, A.; Baravikova, A.; Biernacka, M.; Dushkova, D.; Filčak, R.; Haase, D.; Ignatieva, M. Environmental justice in the context of urban green space availability, accessibility, and attractiveness in postsocialist cities. Cities 2020, 106, 102862. [Google Scholar] [CrossRef]
  6. Mouratidis, K. Urban planning and quality of life: A review of pathways linking the built environment to subjective well-being. Cities 2021, 115, 103229. [Google Scholar] [CrossRef]
  7. Semeraro, T.; Scarano, A.; Buccolieri, R.; Santino, A.; Aarrevaara, E. Planning of urban green spaces: An ecological perspective on human benefits. Land 2021, 10, 105. [Google Scholar] [CrossRef]
  8. Liu, Z.; Cheng, W.; Jim, C.Y.; Morakinyo, T.E.; Shi, Y.; Ng, E. Heat mitigation benefits of urban green and blue infrastructures: A systematic review of modeling techniques, validation and scenario simulation in ENVI-met V4. Build. Environ. 2021, 200, 107939. [Google Scholar] [CrossRef]
  9. Larkin, A.; Gu, X.; Chen, L.; Hystad, P. Predicting perceptions of the built environment using GIS, satellite and street view image approaches. Landsc. Urban Plan. 2021, 216, 104257. [Google Scholar] [CrossRef] [PubMed]
  10. Callaghan, A.; McCombe, G.; Harrold, A.; McMeel, C.; Mills, G.; Moore-Cherry, N.; Cullen, W. The impact of green spaces on mental health in urban settings: A scoping review. J. Ment. Health 2021, 30, 179–193. [Google Scholar] [CrossRef]
  11. Yu, Z.; Yang, G.; Zuo, S.; Jørgensen, G.; Koga, M.; Vejre, H. Critical review on the cooling effect of urban blue-green space: A threshold-size perspective. Urban For. Urban Green. 2020, 49, 126630. [Google Scholar] [CrossRef]
  12. Yang, G.; Yu, Z.; Jørgensen, G.; Vejre, H. How can urban blue-green space be planned for climate adaption in high-latitude cities? A seasonal perspective. Sustain. Cities Soc. 2020, 53, 101932. [Google Scholar] [CrossRef]
  13. Pouso, S.; Borja, Á.; Fleming, L.E.; Gómez-Baggethun, E.; White, M.P.; Uyarra, M.C. Contact with blue-green spaces during the COVID-19 pandemic lockdown beneficial for mental health. Sci. Total Environ. 2021, 756, 143984. [Google Scholar] [CrossRef] [PubMed]
  14. Venter, Z.S.; Barton, D.N.; Gundersen, V.; Figari, H.; Nowell, M.S. Back to nature: Norwegians sustain increased recreational use of urban green space months after the COVID-19 outbreak. Landsc. Urban Plan. 2021, 214, 104175. [Google Scholar] [CrossRef]
  15. Tang, Y.; Xie, Y.; Sun, B.; Hao, Z.; Pei, N. Greenway service supply and public demand in Guangzhou city, China. Urban For. Urban Green. 2022, 76, 127711. [Google Scholar] [CrossRef]
  16. Wang, S.; Duan, W.; Zheng, X. Post-Occupancy Evaluation of Brownfield Reuse Based on Sustainable Development: The Case of Beijing Shougang Park. Buildings 2023, 13, 2275. [Google Scholar] [CrossRef]
  17. Yang, L.; Chang, H.-T.; Li, J.; Xu, X.; Qiu, Z.; Jiang, X. A Comprehensive Evaluation of the Friendliness of Urban Facilities for the Elderly in Taipei City and New Taipei City. Sustainability 2023, 15, 13821. [Google Scholar] [CrossRef]
  18. Xiang, L.; Tian, Y.; Pan, Y. Study on landscape evaluation and optimization strategy of Central Park in Qingkou Town. Scientific Reports 2022, 12, 1978. [Google Scholar] [CrossRef] [PubMed]
  19. Peng, S.; Maing, M. Influential factors of age-friendly neighborhood open space under high-density high-rise housing context in hot weather: A case study of public housing in Hong Kong. Cities 2021, 115, 103231. [Google Scholar] [CrossRef]
  20. Cheng, X.; Long, R.; Chen, H.; Li, Q. Coupling coordination degree and spatial dynamic evolution of a regional green competitiveness system–A case study from China. Ecol. Indic. 2019, 104, 489–500. [Google Scholar] [CrossRef]
  21. Tang, Z. An integrated approach to evaluating the coupling coordination between tourism and the environment. Tour. Manag. 2015, 46, 11–19. [Google Scholar] [CrossRef]
  22. Daniels, B.; Zaunbrecher, B.S.; Paas, B.; Ottermanns, R.; Ziefle, M.; Roß-Nickoll, M. Assessment of urban green space structures and their quality from a multidimensional perspective. Sci. Total Environ. 2018, 615, 1364–1378. [Google Scholar] [CrossRef] [PubMed]
  23. Stessens, P.; Canters, F.; Huysmans, M.; Khan, A.Z. Urban green space qualities: An integrated approach towards GIS-based assessment reflecting user perception. Land Use Policy 2020, 91, 104319. [Google Scholar] [CrossRef]
  24. Bonaiuto, M.; Aiello, A.; Perugini, M.; Bonnes, M.; Ercolani, A.P. Multidimensional perception of residential environment quality and neighbourhood attachment in the urban environment. J. Environ. Psychol. 1999, 19, 331–352. [Google Scholar] [CrossRef]
  25. Yang, L.; Yang, H.; Yu, B.; Lu, Y.; Cui, J.; Lin, D. Exploring non-linear and synergistic effects of green spaces on active travel using crowdsourced data and interpretable machine learning. Travel Behav. Soc. 2024, 34, 100673. [Google Scholar] [CrossRef]
  26. Berner, C.; Brockman, G.; Chan, B.; Cheung, V.; Dębiak, P.; Dennison, C.; Farhi, D.; Fischer, Q.; Hashme, S.; Hesse, C. Dota 2 with large scale deep reinforcement learning. arXiv 2019, arXiv:1912.06680. [Google Scholar]
  27. Chen, J.; Shao, S.; Zhu, Y.; Wang, Y.; Rao, F.; Dai, X.; Lai, D. Enhanced Automatic Identification of Urban Community Green Space Based on Semantic Segmentation. Land 2022, 11, 905. [Google Scholar] [CrossRef]
  28. Wang, H.; Jiang, D.f. Research on the Evaluation System of Urban Public Space Vitality. J. Railw. Sci. Eng. 2012, 9, 56–60. [Google Scholar]
  29. Lu, L.; Li, P. Fuzzy Comprehensive Evaluation of the Quality of Urban Public Open Space. J. Chang. Univ. (Soc. Sci. Ed.) 2013, 15, 42–46. [Google Scholar]
  30. Wang, Y.R.; Zhou, Q.H.; Yang, X.D. Research on the Process Framework and Evaluation System of Urban Public Space Perception. Urban Plan. Int. 2022, 37, 80–89. [Google Scholar] [CrossRef]
  31. Allan, J. Toward an Urban Design Manifesto. J. Am. Plan. Assoc. 1987, 53, 112–120. [Google Scholar]
  32. Matthew, C. Contemporary Public Space, Part Two: Classification. J. Urban Des. 2010, 15, 157–173. [Google Scholar]
  33. Mehta, V. Evaluating Public Space. J. Urban Des. 2014, 19, 53–88. [Google Scholar] [CrossRef]
  34. Praliya, S.; Garg, P. Public space quality evaluation: Prerequisite for public space management. J. Public Space 2019, 4, 93–126. [Google Scholar] [CrossRef]
  35. Zhou, J.; Huang, J. Discussion on Evaluation Index System of Urban Public Space Quality. Architect 2003, 52–56. [Google Scholar]
  36. Park, Y.-S.; Lek, S. Artificial neural networks: Multilayer perceptron for ecological modeling. In Developments in Environmental Modelling; Elsevier: Amsterdam, The Netherlands, 2016; Volume 28, pp. 123–140. [Google Scholar]
  37. Hatzigeorgiou, A.G. Artificial neural networks based systems for recognition of genomic signals and regions: A review. Informatica 2002, 26, 389–400. [Google Scholar]
  38. Liu, Z.; Qiu, N.N. Research on Optimization of Spatial Performance Measurement Methods for Community Green Space—Based on Spatial Simulation Analysis of Supply and Demand Relationships. South. Archit. 2023, 47–58. [Google Scholar]
  39. Guo, Y.; Dai, J.; Hui, X.X. A Study on the Spatial Distribution of Public Service Facilities in Yuetan Neighborhood, Beijing. Urban Archit. Space 2024, 31, 107–111. [Google Scholar]
  40. Lv, Y.; Li, J.; Zhang, J. Strategies for Enhancing the Resilience of Community Public Spaces in Response to Public Health Emergencies. Archit. J. 2022, 195–200. [Google Scholar]
  41. Li, X.; Wu, S.; Wu, Y. Research on Renovation Strategies for Old Residential Areas in Beijing. Beijing Plan. Constr. 2021, 23–26. [Google Scholar]
  42. Zhang, J.; Du, Q. Planning and Construction of Urban Parks from the Perspective of Child-Friendly Cities: Inspiration from Barcelona for Beijing. Beijing Plan. Constr. 2020, 63–68. [Google Scholar]
  43. Kabisch, N.; Strohbach, M.; Haase, D.; Kronenberg, J. Urban green space availability in European cities. Ecol. Indic. 2016, 70, 586–596. [Google Scholar] [CrossRef]
  44. Grahn, P.; Stigsdotter, U.K. The relation between perceived sensory dimensions of urban green space and stress restoration. Landsc. Urban Plan. 2010, 94, 264–275. [Google Scholar] [CrossRef]
  45. Gidlöf-Gunnarsson, A.; Öhrström, E. Noise and well-being in urban residential environments: The potential role of perceived availability to nearby green areas. Landsc. Urban Plan. 2007, 83, 115–126. [Google Scholar] [CrossRef]
  46. De la Barrera, F.; Reyes-Paecke, S.; Banzhaf, E. Indicators for green spaces in contrasting urban settings. Ecol. Indic. 2016, 62, 212–219. [Google Scholar] [CrossRef]
  47. Van Herzele, A.; Wiedemann, T. A monitoring tool for the provision of accessible and attractive urban green spaces. Landsc. Urban Plan. 2003, 63, 109–126. [Google Scholar] [CrossRef]
  48. Wang, F.; He, P.; Yuan, C.; Wang, S. Isolated or integrated? Evaluation of ageing-friendly communities in Old Beijing City based on accessibility, social inclusion and equity. Indoor Built Environ. 2020, 29, 465–479. [Google Scholar] [CrossRef]
  49. Jo, H.I.; Jeon, J.Y. Overall environmental assessment in urban parks: Modelling audio-visual interaction with a structural equation model based on soundscape and landscape indices. Build. Environ. 2021, 204, 108166. [Google Scholar] [CrossRef]
  50. Guo, L.; Liu, W.; Wu, P. Machine learning and its application in library: Take tensorflow as an example. J. Acad. Libr. 2017, 35, 31–40. [Google Scholar]
  51. Abadi, M. TensorFlow: Learning functions at scale. In Proceedings of the 21st ACM SIGPLAN International Conference on Functional Programming, Nara, Japan, 18–24 September 2016; p. 1. [Google Scholar]
  52. Shukla, N.; Fricklas, K. Machine Learning with TensorFlow; Greenwich: Manning, SC, USA, 2018. [Google Scholar]
  53. Tian, D.; Wang, J.; Xia, C.; Zhang, J.; Zhou, J.; Tian, Z.; Zhao, J.; Li, B.; Zhou, C. The relationship between green space accessibility by multiple travel modes and housing prices: A case study of Beijing. Cities 2024, 145, 104694. [Google Scholar] [CrossRef]
Figure 1. Technical flowchart of post-use evaluation based on a multi-dimensional perception system.
Land 13 00698 g001
Figure 2. The location map of Jiayuan Sanli.
Land 13 00698 g002
Figure 3. The demographic structure of Jiayuan Sanli.
Land 13 00698 g003
Figure 4. Installation locations of multi-dimensional perception system.
Land 13 00698 g004
Figure 5. Logic structure diagram of multi-layer perceptron.
Land 13 00698 g005
Figure 6. Basic logic flow chart of multi-layer perceptron.
Land 13 00698 g006
Figure 7. Functional zoning map of Jiayuan Sanli Park.
Land 13 00698 g007
Table 1. Research on existing evaluation indicators for CGSs.
AuthorIndicator System
Wang H. (2012) [28]There are more than 60 influencing factors, including sensory vitality (such as environmental suitability, architectural facilities, and visual landscapes), social vitality (such as management and operation, accessibility), economic vitality (such as aggregation scale, marginal effect, and land use), and cultural vitality (such as cultural taste and cultural activities).
Lu L. (2013) [29]Using the ecological level, landscape, cultural level, operation and maintenance conditions, etc., as evaluation indicators.
Wang Y.R. (2020) [30]Sensory attributes, perceptual attributes, cognitive attributes, and behavioral attributes.
Jill (1987) [31]Protection, comfort, enjoyment.
Carmona (2010) [32]Social, economic, and environmental characteristics of spaces, such as attractiveness, spatial vitality, accessibility, safety, cleanliness, pollution level, etc.
Mei T. (2014) [33]Inclusiveness, meaningful activity, pleasure ability, safety, comfort.
Praliya and Garg, (2019) [34]Accessibility, maintenance, attractiveness, comfort, inclusivity, activities and usage, rationality of design, safety and security.
Zhou J. (2003) [35]The study is made up of three aspects: activities, image recognition, and operational support, which are divided into 11 second-level indicators and 60 third-level individual indicators.
Table 2. Post-use evaluation system of CGSs.
First-Level IndexSecond-Level IndexThird-Level IndexFourth-Level Index
Facility perceptionPublic service facilitiesRest facilitiesLeisure facilities for all ages
Activity facilitySports and fitness equipment
Children’s play equipment
Space use flexibility
Convenience facilityElectric charging pile
Water drinking machine
Toilet
Facility operationSecurity guarantee
Facility maintenance
Feedback on facility problems
Traffic facilitiesRoad conditionsThe density of road network
Internal accessibility
Visual guidance systemExternal range
Internal range
Ecological facilitiesGreen material applicationRecycled material application
Green technology applicationNew energy, sponge city, and other technologies
Ecological space constructionUsing ecological methods to create shading and noise-reduction functions
Perception of environment Landscape aestheticsColor matchingRational use of color matching is essential to create a visual effect that is layered and vivid
Design style and overall harmonyThe overall proportion and scale should be carefully considered to achieve harmony and unity among various elements
Operational environment monitoringSpatial overall environment perceptionTemperature
Humidity
Illumination
Wind speed
Air quality
Microenvironment perceptionIllumination
Wind speed
Noise
Air quality
Daily maintenance monitoringAfforestation maintenance monitoringSoil moisture content
Plant growth
Behavior perceptionspace function and usageFunction layoutFunctional area usage density
Whether complete or not
Spatial region preference
Functional transformation
Coverage of requirementsDiverse user groups
Time-sharing service connection
Functional preference
Cultural connotationCultural designNeighborhood atmosphere buildingLandscape sketch
Cultural displayDesign of cultural features such as fences, streetlamps, and rest seats
Landscape valueScientific value of landscapeThe potential value of landscapes lies in scientific research, education popularization, and other aspects
Ecological value of landscapeThe contribution of landscapes to the ecological environment and human health
Cultural value of landscapeThe value of landscapes lies in cultural inheritance, historical memory, leisure and entertainment, and other aspects
Cultural inheritanceCultural protectionPreservation of cultural relics
Regional culture shapingHistorical background introduction
Community green space governancePublic engagementResident participationFocusing on the level of involvement of residents in green space governance
Green space managementMaintenance and administrative standardsEmphasizing the standards and quality of upkeep and management conducted by the relevant authorities
Table 3. Evaluation scoring table of post-use evaluation of ecological space in the Jiayuan Sanli Community.
Primary Index
(A)
Secondary Index
(B)
Three-Level Index
(C)
Four-Level Index
(D)
Multi-Layer Perceptual Operation Score (10 Points for Each Item)
Material function space (1)Supporting facilities (1)Other facilities (1)Recreational facilities (1)7
Security facilities (2)8
Activity facilities (2)Exercise equipment (3)7
Play equipment for children (4)7
Flexibility of open-space usage (5)5
Facilities for convenience: Water (3)Electric charging piles (6)\
Dispensers (7)\
Toilets (8)9
Facility operations (4)Safety assurance (9)
facility
7
Maintenance (10)7
Feedback on facility issues (11)6
Transportation accessibility (2)Road conditions (5)Road network density (12)5
Internal accessibility (13)6
Signage system (6)External range (14)8
Internal range (15)8
Sustainable development (3)Environmental protection material application (7)Recycled materials applications (16)8
Green technology application (8)New energy, sponge city and other technologies (17)8
Ecological space construction (9)Use ecological methods to create shading and noise reduction functions (18)6
Natural environment perception (2) Landscape aesthetics (4)Color matching (10)Rational use of color matching is essential to create a visual effect that is layered and vivid (19)8
Design style and overall harmony (11)The overall proportion and scale should be carefully considered to achieve harmony and unity among various elements (20)8
Operational environment monitoring (5)Spatial overall environment perception (12)Temperature (21)8
Humidity (22)8
Light (23)8
Wind speed (24)8
Air quality (25)6
Microenvironment perception (13)Light (26)5
Wind speed (27)6
Noise (28)7
Air quality (29)6
Daily maintenance monitoring (6)Green maintenance monitoring (14)Soil moisture content (30)6
Plant growth (31)7
Spatial function and activity perception (3)Space use (7)Function layout (15)Functional area usage density (32)5
Function is complete (33)/
Spatial preference (34)5
Function conversion (35)6
Demand coverage (16)Multiple user groups (36)6
Time-sharing interface (37)8
Functional preferences (38)8
Cultural connotation (4)Social factor (8)Public participation (17)Requirements summary (39)8
Satisfaction survey (40)8
Summary of comments (41)8
Social influence (18)Social evaluation (42)8
Media promotion (43)8
Landscape value (9)Scientific value of landscape (19)The potential value of landscapes lies in scientific research, education popularization, and other aspects (44)8
Ecological value of landscape (20)The contribution of landscapes to the ecological environment and human health (45)7
Cultural value of landscape (21)The value of landscapes lies in cultural inheritance, historical memory, leisure and entertainment, and other aspects (46)6
Cultural connotation (10)Cultural design (22)Landscape sketches (47)6
Design of cultural features such as fences, streetlights, and rest seats (48)8
Cultural protection (23)Heritage conservation (49)8
Historical background (50)8
Community green space governance (5)Public engagement (11)Resident participation (24)Focusing on the level of involvement of residents in green space governance (51)7
Green space management (12)Maintenance and administrative standards (25)Emphasizing the standards and quality of upkeep and management conducted by the relevant authorities (52)8
Table 4. Post-use evaluation data of ecological space in the Jiayuan Sanli Community on 27 April 2022, AM.
First-Level IndexSecond-Level IndexThird-Level IndexFourth-Level IndexMulti-Dimensional Perceptual DataSubjective Survey Information
Material function spaceSupporting facilitiesOther facilitiesLeisure facilities (1)Facility 1 operating hours: 0521~0523; 0611~0619; from 0642 to 0701; 0744~0839;
the facility was used four times in one session, and the maximum use time was 55 min.
\
Security facilities (2)\Equipped with security facilities and equipment
Activity facilitySports fitness equipment (3)Facility 1 operating hours: 0711~0713; 0811~0809; from 0812 to 0821;
the facility was used three times in one session, and the maximum use time was 9 min.
Basic functional facilities are complete
Children’s play equipment
(4)
Facility 1 operating hours: 0711~0713; 0811~0809; from 0812 to 0821;
the facility was used three times in one session, and the maximum use time was 9 min.
Basic functional facilities are complete
Open-space use flexibility (5)\The space basically supports diverse activities
Convenience facilityElectric charging pile (6)\\
Water dispenser (7)\\
Toilets (8)Facility 1 entry time: 0601; 0613 0644; 0649; 0659; 0732; 0741; 0756; 0801; 0813; 0827; 0836; 0849; 0850;
the facility was used 14 times in 1 session.
Well-equipped
Facility operationSafety assurance (9)/Settings complete
Facility maintenance (10)/Settings complete
Feedback on facility issues (11)/Settings complete
Transportation accessibilityRoad conditionsRoad network density (12)/Moderate
Internal accessibility (13)/Good
Guidance systemExternal scope (14)/Settings complete
Internal scope (15)/Setup perfect b
Green and sustainableGreen material applicationRecycled materials applications (16)/Apply
Green technology applicationNew energy, sponge city, and other technologies (17)/Apply
Ecological space constructionUse ecological methods to create shading and noise-reduction functions (18)/Part of the application
Natural environment perception Landscape aestheticsColor matchingRational use of color matching is essential to create a visual effect that is layered and vivid (19) Good
Design style and overall harmonyThe overall proportion and scale should be carefully considered to achieve harmony and unity among various elements (20) Good
Operational environment monitoringSpatial overall environment perceptionTemperature (21)17 °C; 26.3 °C/
Humidity (22)45%; 52%/
Light (23)350 lx; 976 lx/
Wind speed (24)0.5 m/s;1.92 m/s/
Air quality (25)65; 71/
Spatial overall environment perceptionLight (26)300 lx; 775 lx
Wind speed (27)3–4 m/s
Noise (28)45 dB to 55 dB
Air quality (29)51; 100
Soil moisture content (30)65; 71
Daily maintenance monitoringAfforestation maintenance monitoringSoil moisture content (31)45; 46/
Plant growth situation (32)//
Spatial function and activity perceptionSpace useFunction layoutFunctional area usage density (33)1; 5/
Function complete or not (34)/Basically complete
Function conversion (35)Existence
Requirement coverageMultiple user groups (36)ExistenceBasically agree
Time-sharing interface (37)1; 5/
Functional preferences (38)8:09; 8:27; 10:26/
Social factorsPublic participationRequirements summary (39)/Collect opinions
Satisfaction survey (40)/Collect opinions
Summary of comments (41)/Collect opinions
Social influenceSocial evaluation (42)/Good/fair/bad b
Media promotion (43)/Is b involved?
Landscape valueScientific value of landscapeThe potential value of landscapes lies in scientific research, education popularization, and other aspects (44)/Good
Ecological value of landscapeThe contribution of landscapes to the ecological environment and human health (45)/Good
Cultural value of landscapeThe value of landscapes lies in cultural inheritance, historical memory, leisure and entertainment, and other aspects (46)/Good
Cultural connotationCultural designLandscape sketches (47)2Configured
Design of cultural features such as fences, streetlights, and rest seats (48)/Configured
Cultural protectionHeritage conservation (49)/Configured
Historical background (50)/Configured
Community green space governancePublic engagementResident participationfocusing on the level of involvement of residents in green space governance (51)/Configured
Green space managementMaintenance and administrative standardsEmphasizing the standards and quality of upkeep and management conducted by the relevant authorities (52)/Configured
Disclaimer/Publisher’s Note: The statements, opinions and data contained in all publications are solely those of the individual author(s) and contributor(s) and not of MDPI and/or the editor(s). MDPI and/or the editor(s) disclaim responsibility for any injury to people or property resulting from any ideas, methods, instructions or products referred to in the content.

