
Study on the Efficiency, Evolutionary Trend, and Influencing Factors of Rural–Urban Integration Development in Sichuan and Chongqing Regions under the Background of Dual Carbon

 ,
,  ,
,  , and
, and
Abstract
1. Introduction
2. The Literature Review
3. Research Objects and Methods
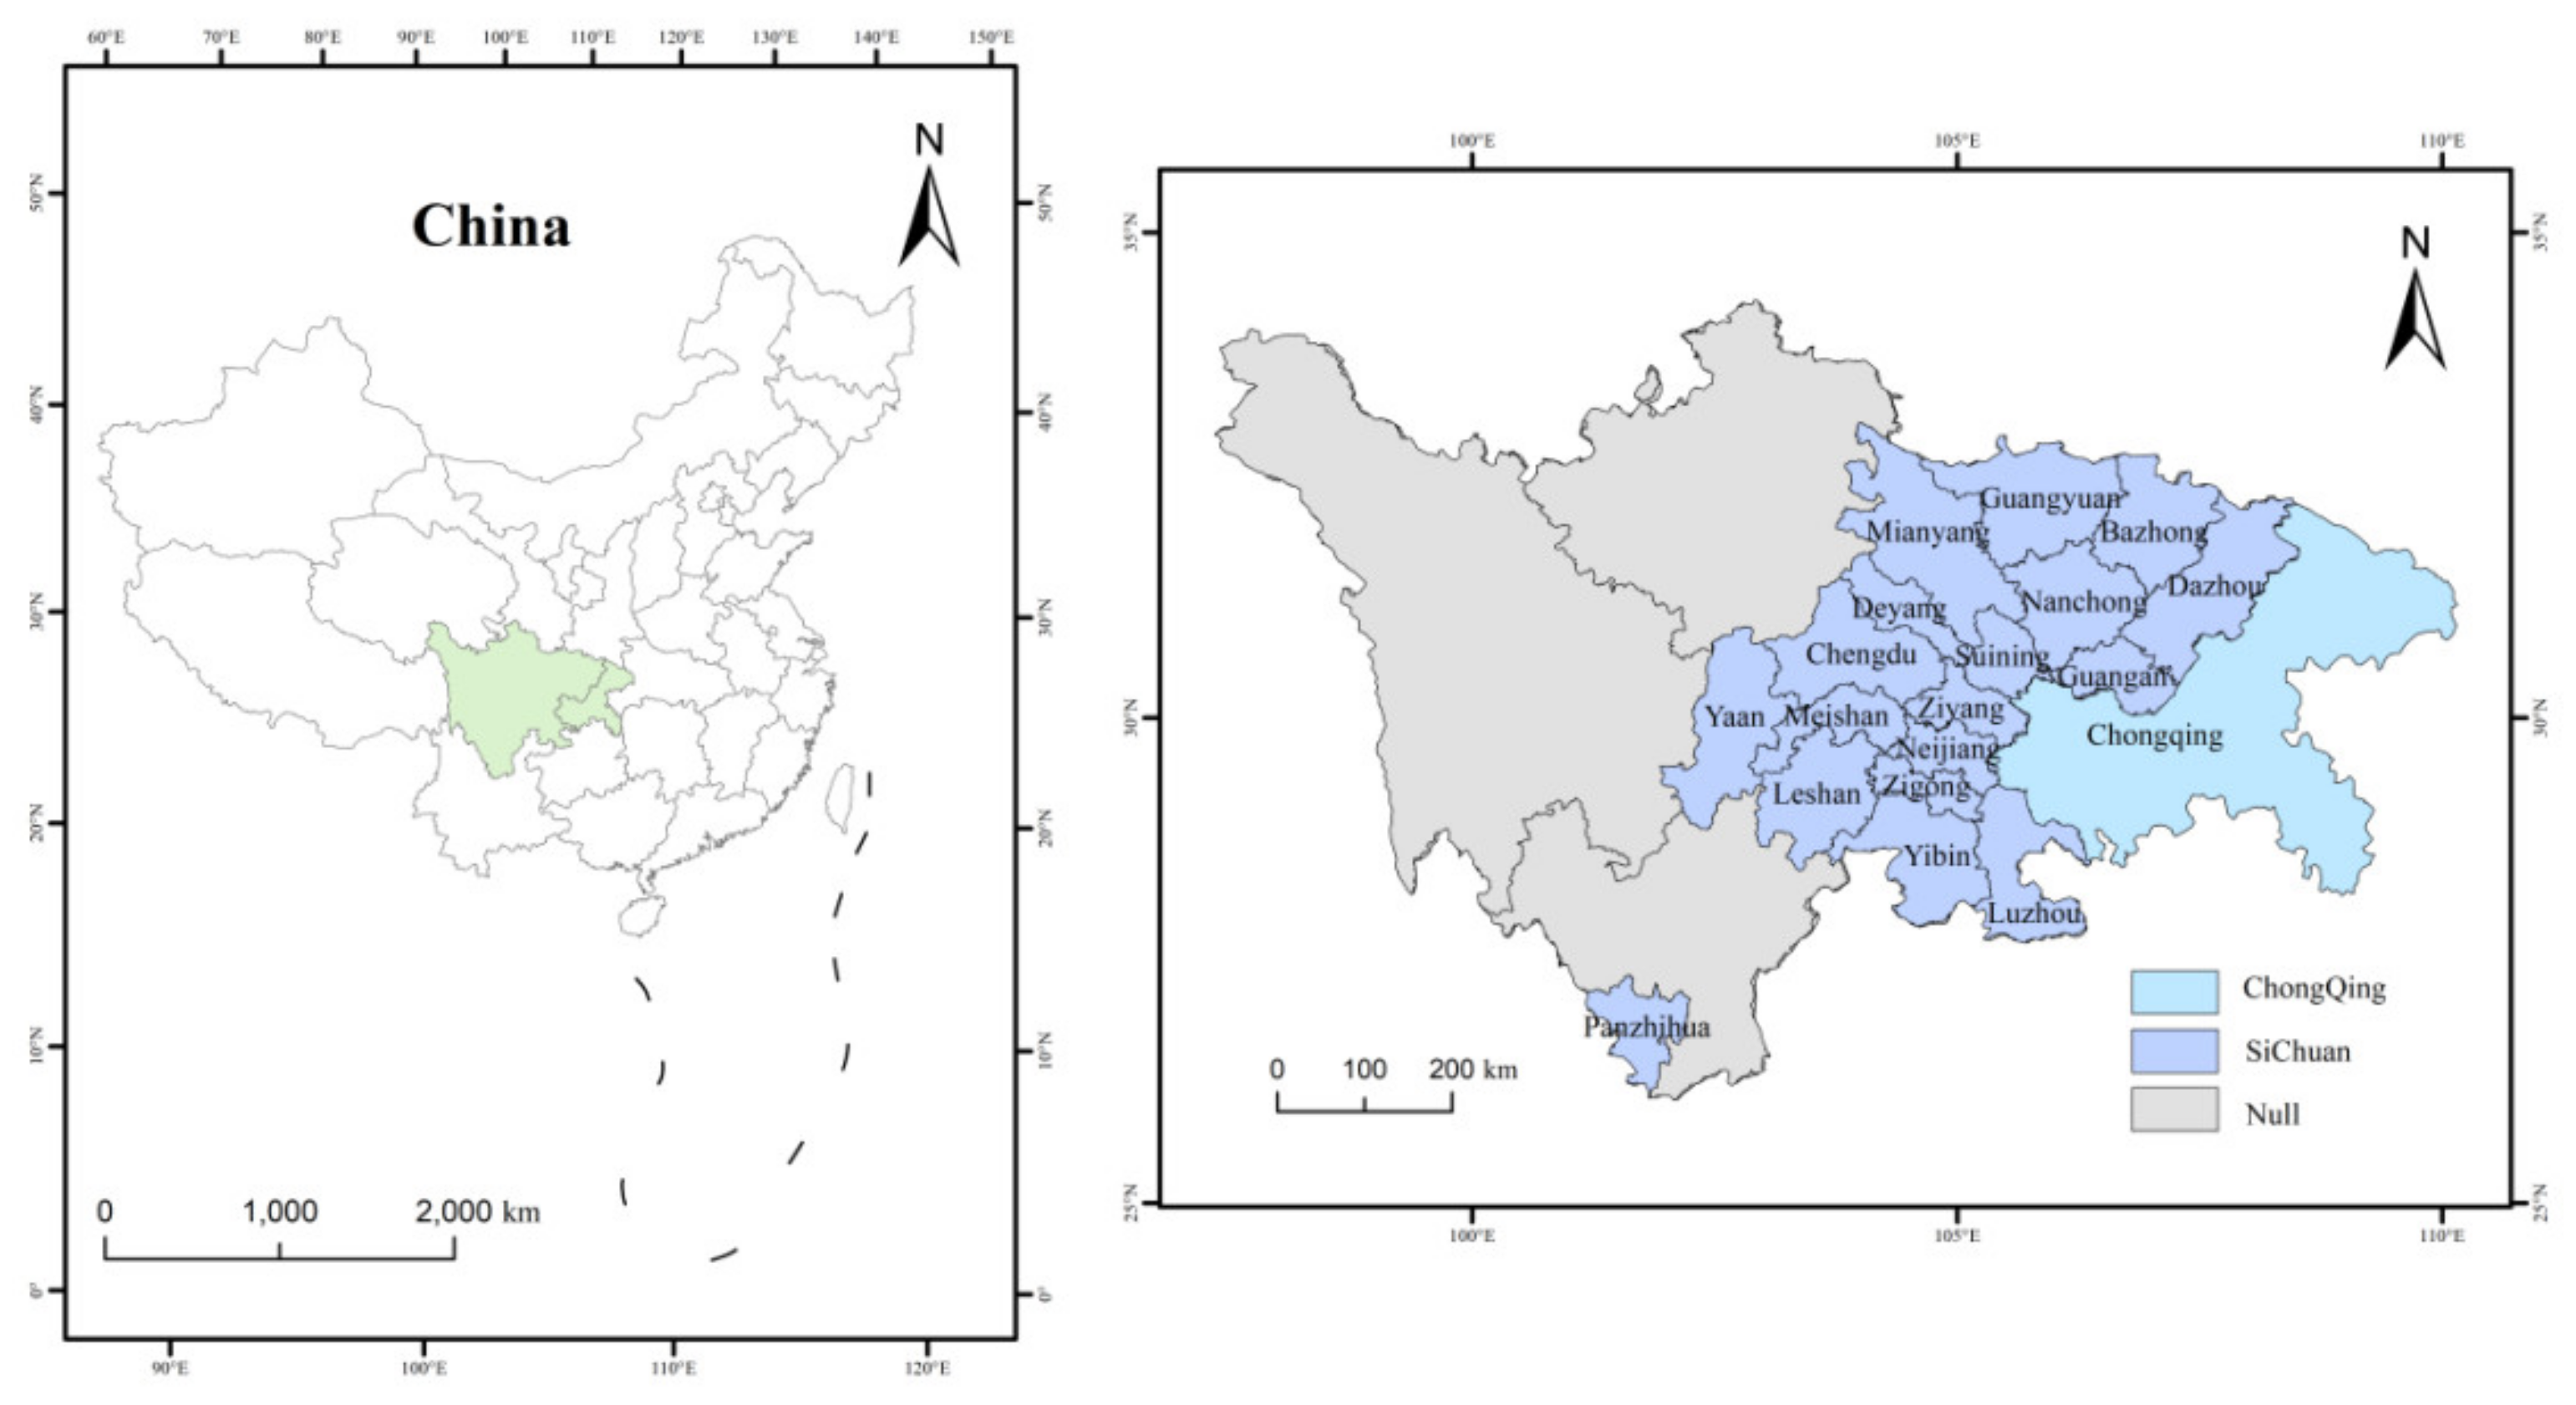
3.1. Description of the Study Area
3.2. Choosing Indicators and Data Sources
3.2.1. Selection of Indicators for the Level of Integrated Urban–Rural Development
3.2.2. Selection of Input–Output Indicators
3.2.3. Sources of Research Data
3.3. Research Methodology
3.3.1. Entropy Weighting Method
- (1)
- The following raw data matrix is created assuming the existence of assessment indicators and objects:
- (2)
- Determine the ratio of the evaluation object’s indication to the indicator in order to obtain the percentage matrix .
- (3)
- Calculate the information entropy for the j-th indicator.
- (4)
- Calculate the coefficient of variation for item j-th, .
- (5)
- Calculate the weight of the j-th indicator .
- (6)
- Calculate the level of urban–rural integration development for the i-th evaluation object:
3.3.2. Three-Stage DEA
3.3.3. Kernel Density Estimation Method
3.3.4. Spatial Durbin Model
- (1)
- Spatial weighting matrix setting
- (2)
- Spatial measurement modeling
4. Evaluation of EURI in Sichuan and Chongqing Urban Agglomerations
4.1. Phase I: Super-Efficient SBM-Global Model
4.2. Phase II: SFA Regression Analysis
- Influence of economic environment: GDP per capita is significant for all four input slack variables, with negative human slack variables for labor and capital inputs. However, the effect on the slack variable for energy inputs is positive. This is because the degree of regional economic development is partially reflected in the GDP per capita. When regional economic development is at a high level, the region can have more opportunities for planning, development, and investment using the amount of investment in fixed assets, thus facilitating the efficient use of capital and land. Additionally, the development and improvement of the economic climate can generate more employment opportunities and decrease labor waste. At present, the rate of urbanization in Sichuan and Chongqing is accelerating, and there is a certain degree of “city-building movement” in some of the cities. The immoderate increase in energy consumption caused by the continuous expansion of urban areas is not favorable to the efficient use of energy.
- Influence of institutional environment: Both labor and energy redundancy are negatively affected by institutional factors. A majority of local general financial expenditures go towards innovation in science and technology, education, and social security and employment. Spending by the government may be used to preserve the environment, reduce emissions, and save energy. At the same time, through the government’s influence and policy support, it can stimulate enterprises’ enthusiasm to reduce the emissions of skills. However, the reduction in local financial expenditures is conducive to reducing the costly waste of fixed asset investment.
- Influence of social environments: The initial stage of tertiary industry development in the cities of Sichuan and Chongqing necessitates significant labor and capital input, leading to increased slack variables and waste. Compared with other industries, the tertiary sector consumes less energy. Therefore, it is more beneficial to grow the tertiary sector itself in order to reduce energy waste. However, industrial structure upgrading does not have a significant impact on land input.
4.3. Phase III: Recalculating Efficiency
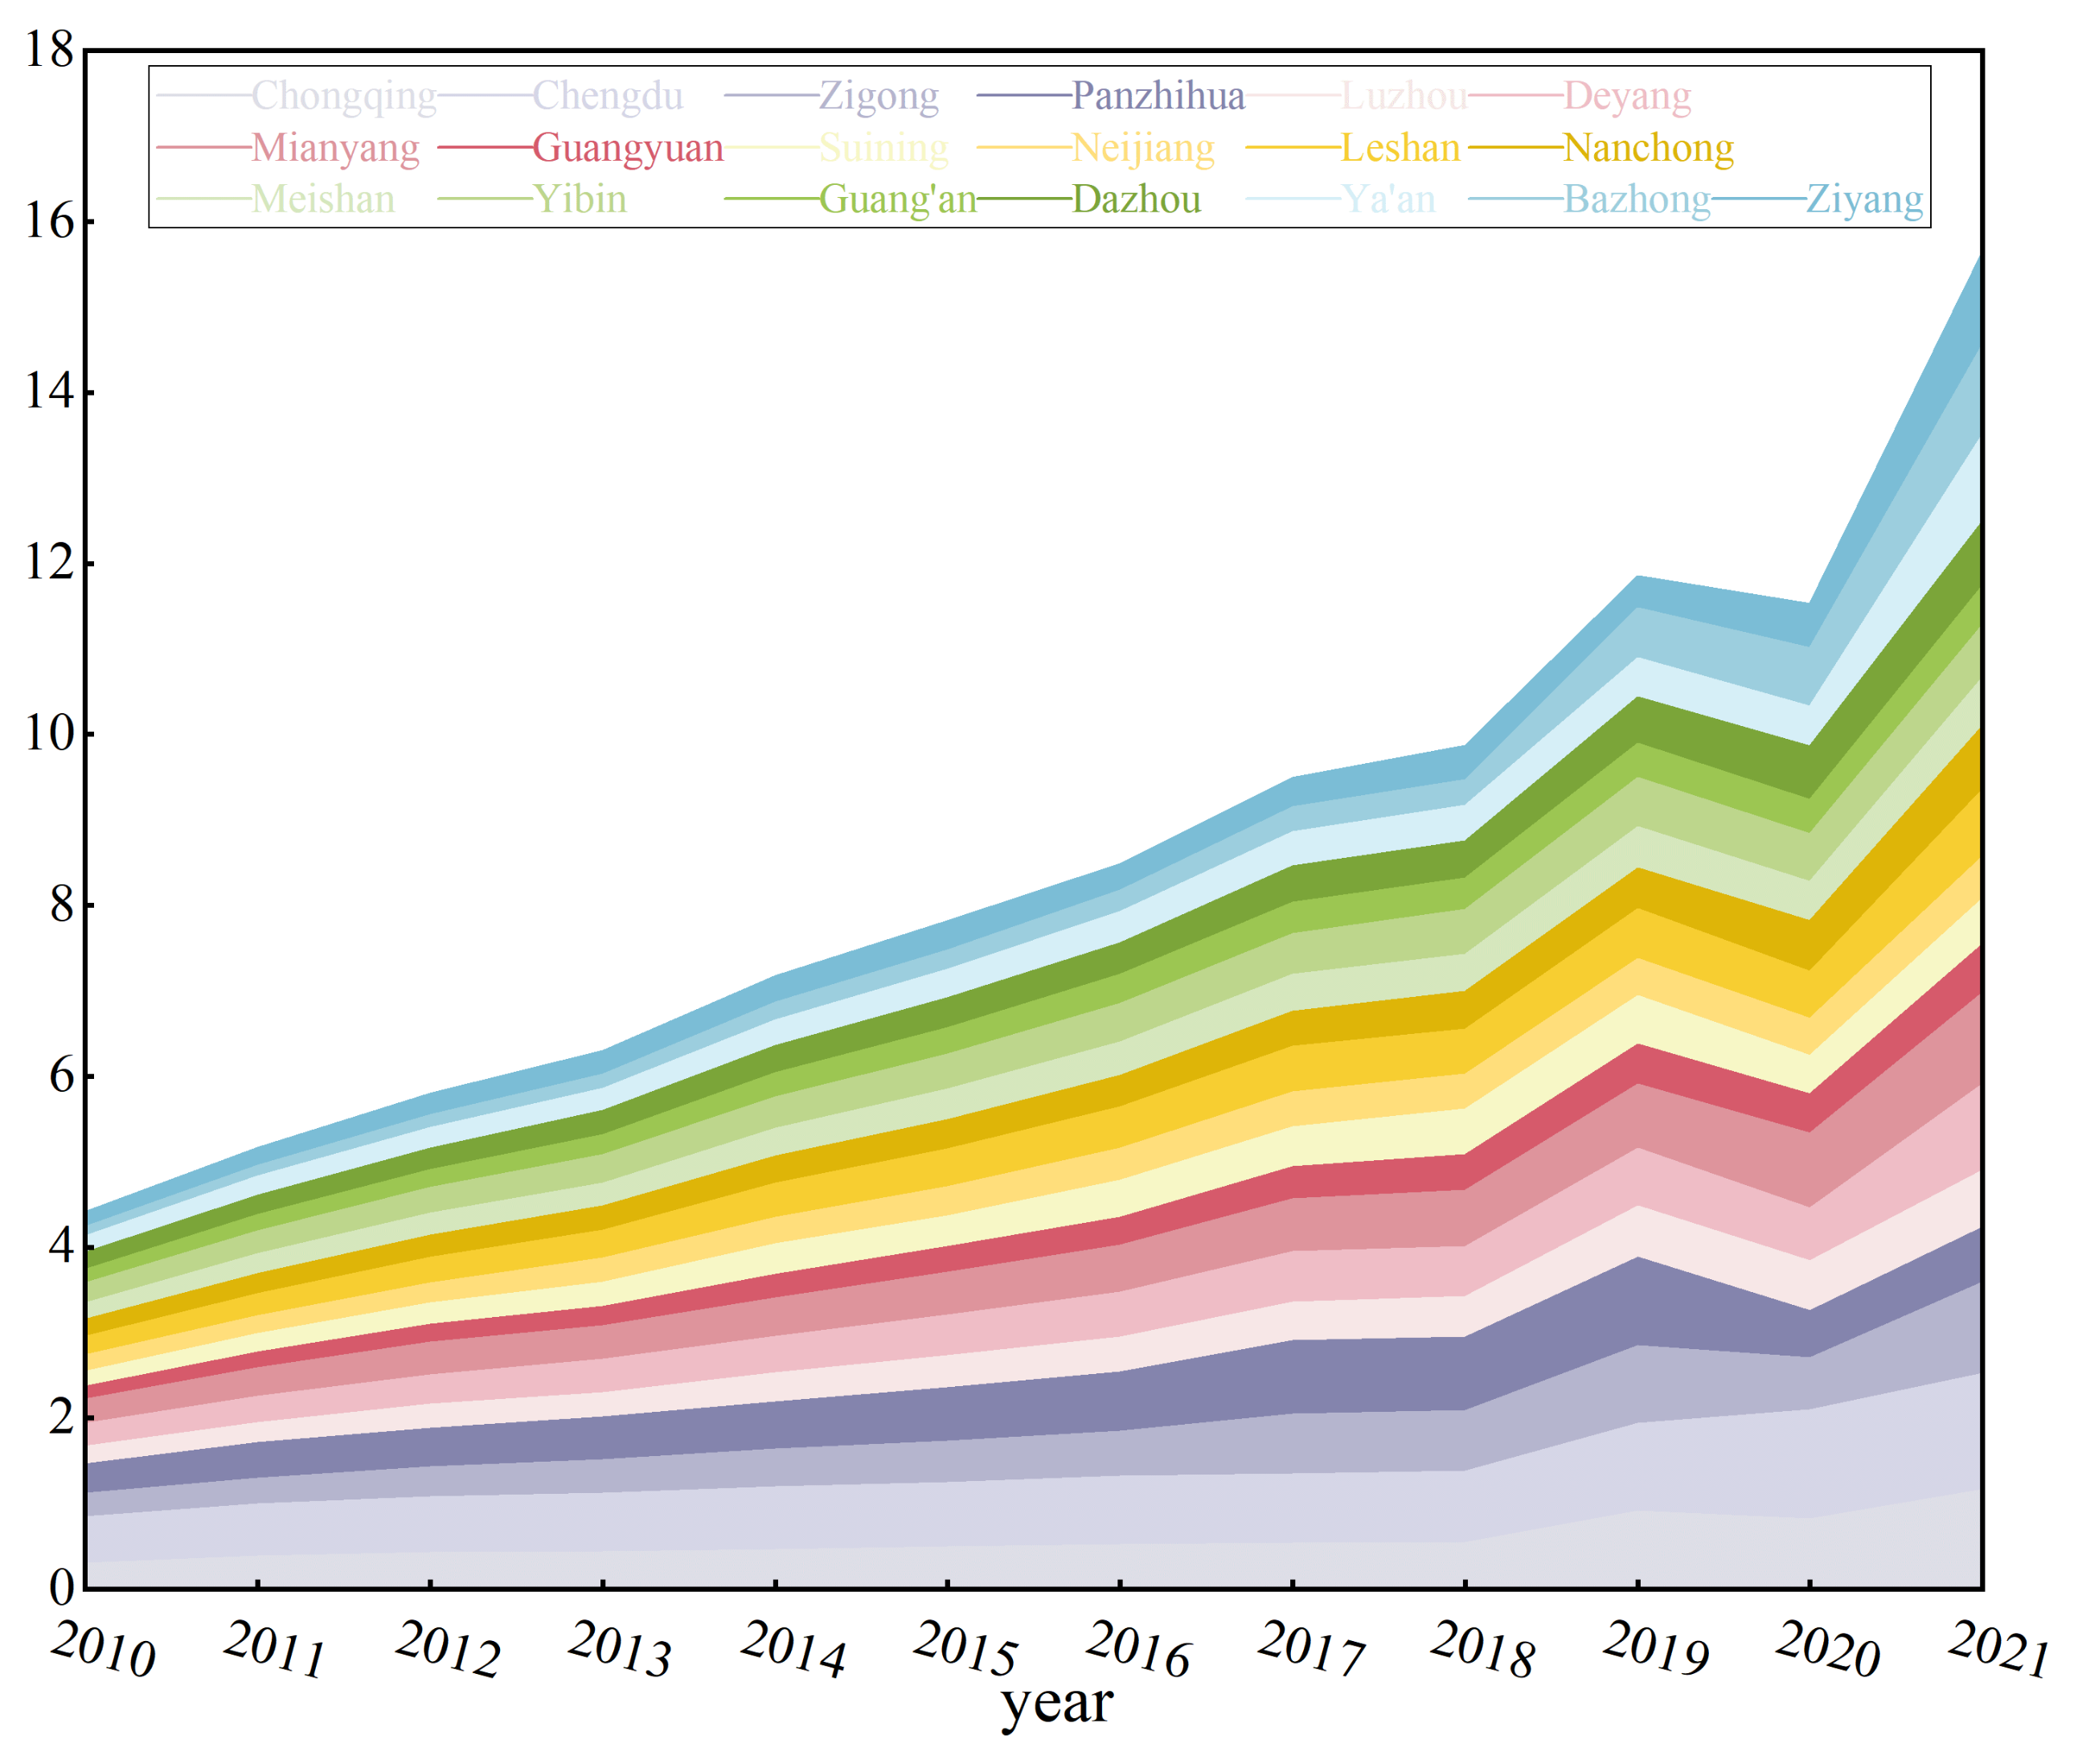
4.4. Trend Analysis of the Evolution of EURI in Sichuan and Chongqing Regions
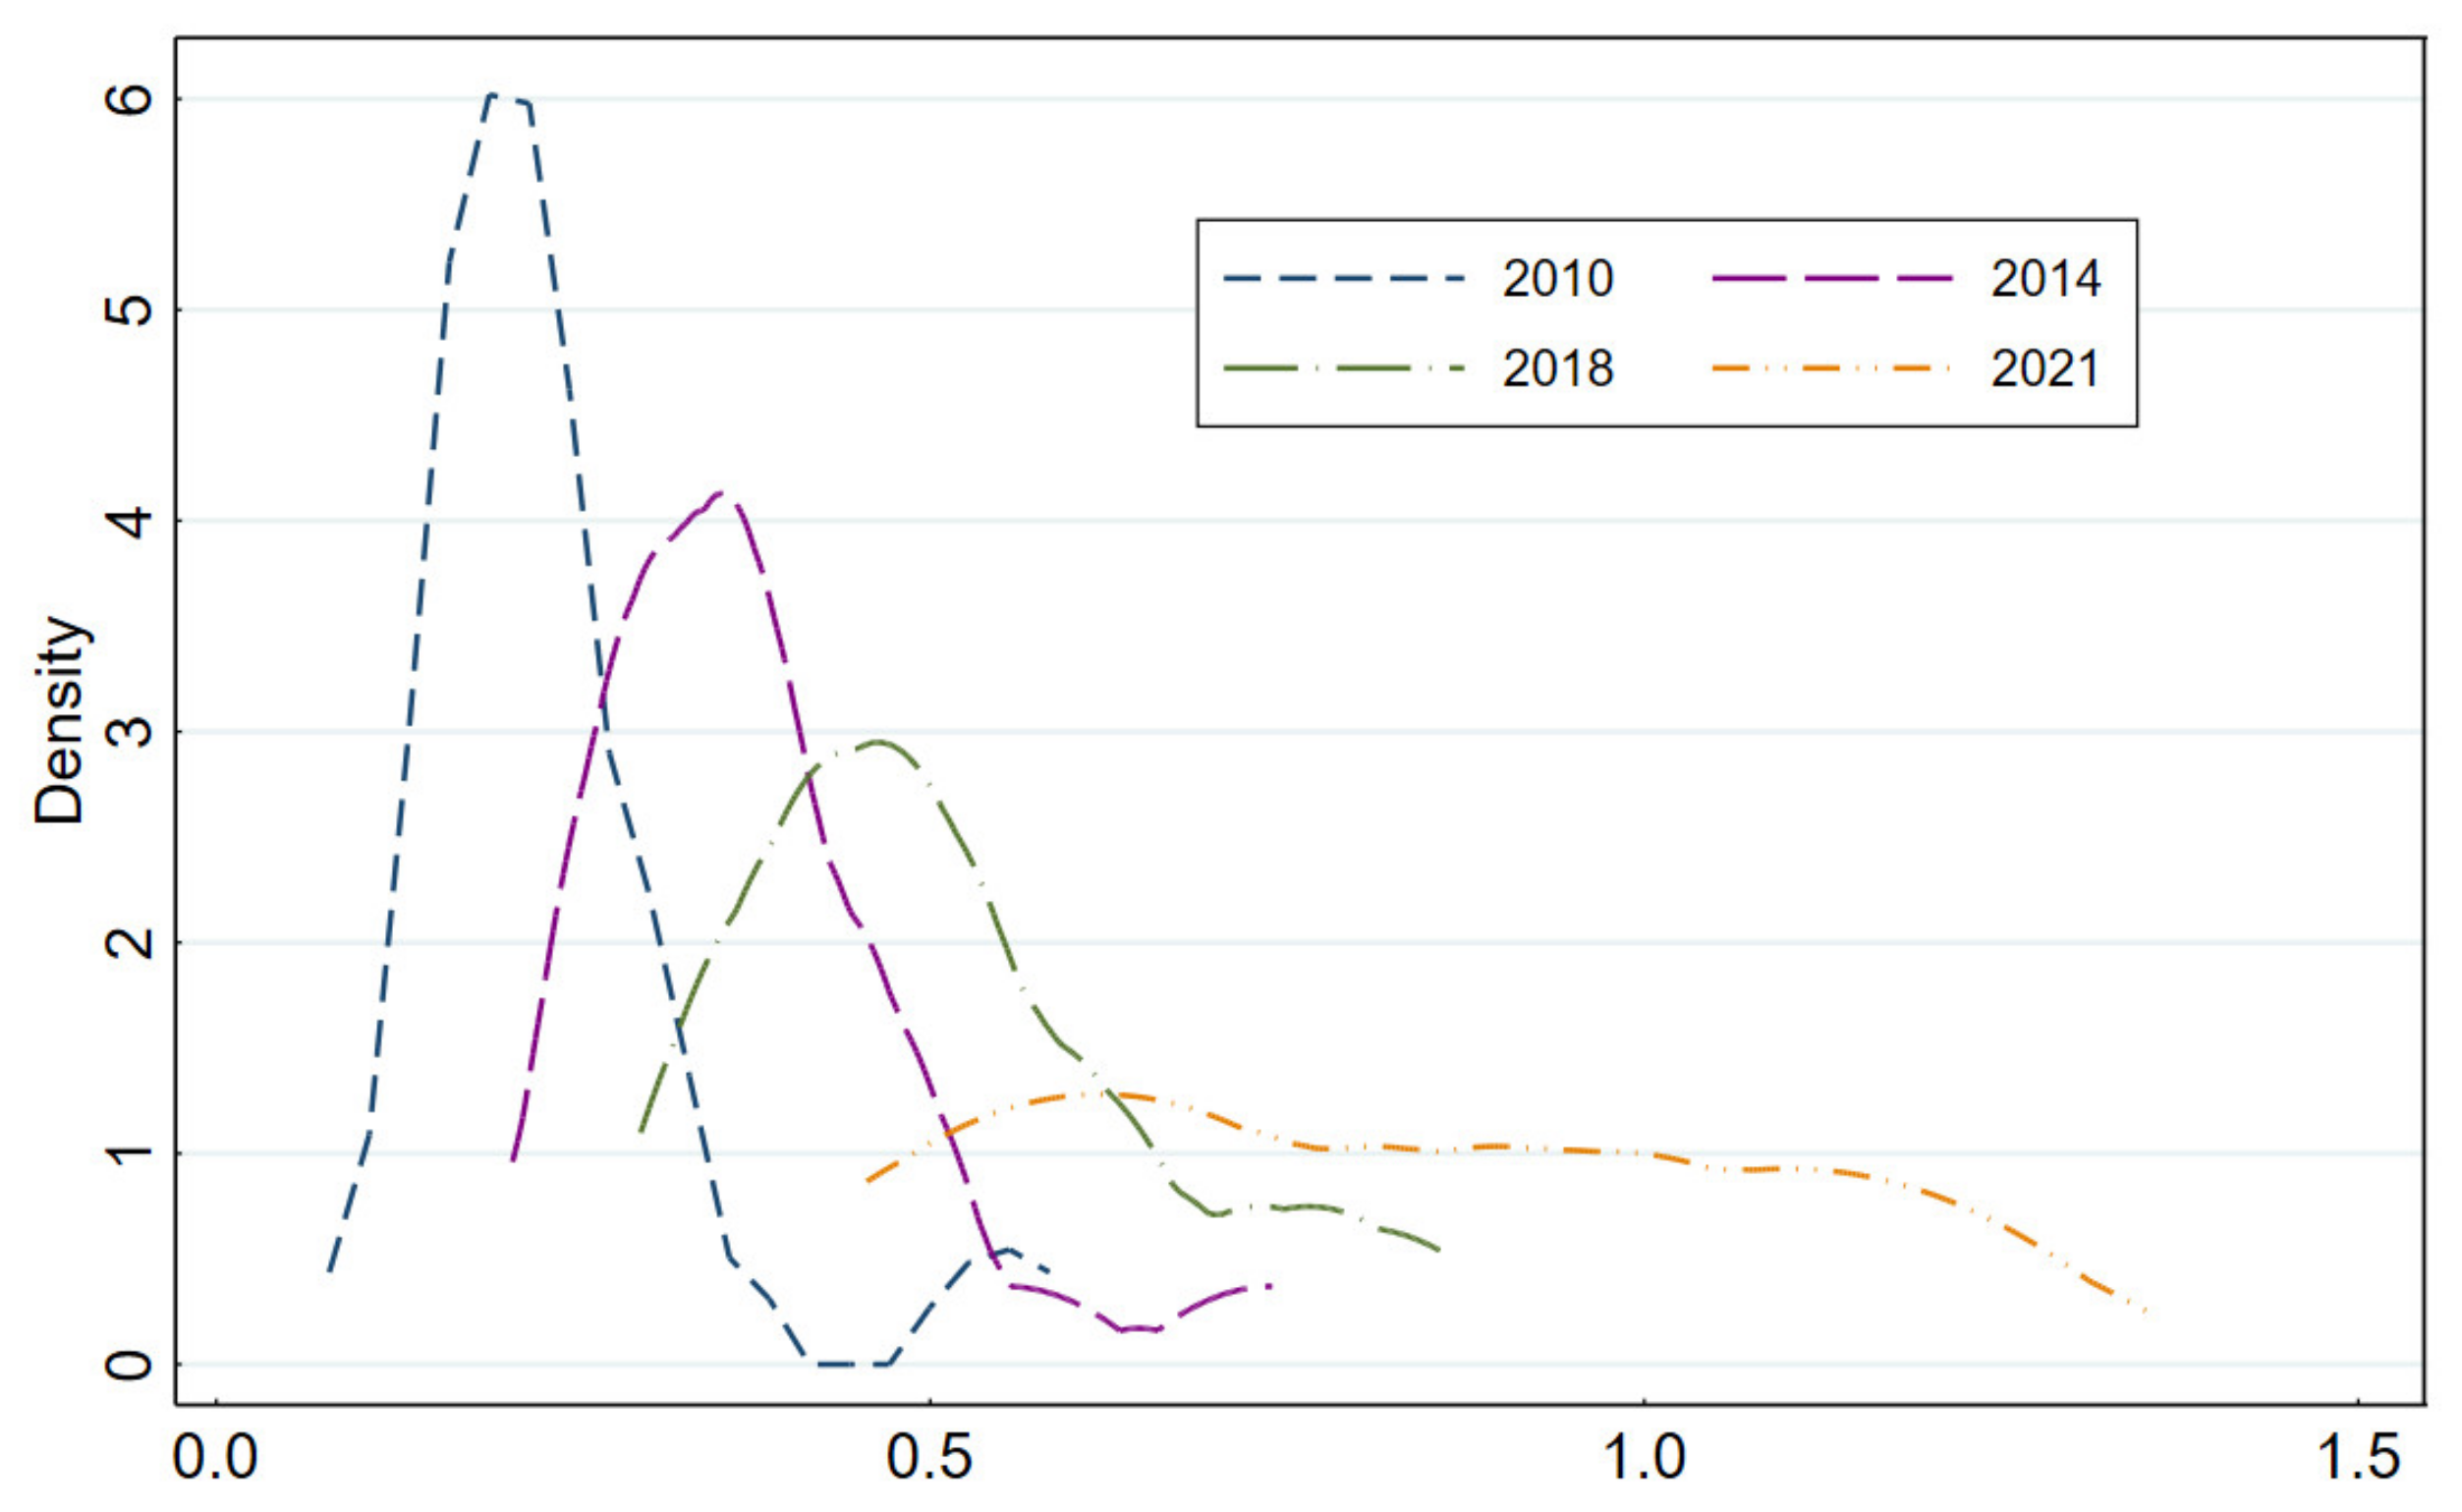
- The displacement of the center of gravity towards the right is clearly discernible in the kernel density curve’s position from 2010 to 2021. It shows that the EURI in the Sichuan and Chongqing regions during the study period is characterized by a large increase and then a small fluctuation;
- The kernel density curve indicates that the kernel density map from 2010 to 2018 exhibits a unimodal distribution, and the density curve shape basically remains unchanged, only shifting to the right over time, which indicates that the gap between the EURI of the cities within the Sichuan–Chongqing region is relatively stable and that the EURI of the cities has steadily improved. In 2021, the peak is significantly lower and flatter, demonstrating the growing disparity between the region’s growth and urban–rural integration;
- Upon examination of both sides of the trailing kernel density curve, it is evident that there is a right trailing phenomenon present in all four curves. This phenomenon gradually emerges, indicating that the disparity between the level of urban–rural integration and development in the regions of Sichuan and Chongqing is progressively widening;
- In view of the polarization phenomenon, it can be seen that a distribution curve shows a single-peak pattern without any tendency towards multipolarity or bipolarity.
5. Analysis of Factors Affecting the EURI in Sichuan and Chongqing Regions
5.1. Spatial Autocorrelation Test for the EURI in Sichuan and Chongqing Regions
5.2. Analysis of Spatial Spillover Effects on the EURI in Sichuan and Chongqing Regions
5.2.1. Selection of Impact Indicators
- Digital economy development (DE) [53]: In 2021, there were 284 million rural Internet users, and the rate of rural Internet penetration has been on the rise. This expansion provides a foundation for the development of the rural digital economy. While the Internet’s expansion in rural areas facilitates urban–rural communication and resource sharing, it also creates a “digital divide” between urban and rural areas [54] due to insufficient rural infrastructure and low education levels of rural residents. This divide hinders the integration of urban and rural areas. Hence, this paper selects the metric of Internet users per 100 individuals as a means to gauge the digital economy.
- Science and education support (SES) [55,56]: Investing in science and technology is crucial for promoting urbanization and improving the innovation capacity and level of integrated urban–rural development. Investing in education can enhance the development of skilled individuals, enhance the overall quality of the workforce, and contribute to the integration of urban and rural areas by providing support for talented individuals. This paper utilizes the ratio of science and education expenditure to fiscal expenditure as a specific indicator.
- Financial development (Fin) [57]: The expansion of financial scale can broaden the credit channel and enhance the credit support surface, and through the revitalization of the market economy and other “main channel effects” to enhance the level of human capital investment and vocational skills in rural areas, this leads to a rise in the employment of workers in lower-level positions and creates more opportunities for generating income. Thus, this paper chooses the aggregate of financial institutions’ deposits and loans as a ratio to the Gross Domestic Product (GDP) as a specific measure.
- Business environment (BE) [58]: An optimal business environment can facilitate the unrestricted movement of rural labor between urban and rural regions and entice rural inhabitants to relocate and engage in urban living and employment, so that rural residents’ incomes increase wage incomes in addition to the original purely agricultural business incomes. Therefore, this initiative fosters the growth of both urban and rural economies, enhancing the level of integration and development between urban and rural areas. The variables measuring the regional business environment in this paper are the number of private and self-employed workers in towns and cities.
- Population quality (PQ): Enhancing population quality promotes the accumulation of human capital in both urban and rural areas and, thus, this will reduce the disparity in income between urban and rural regions and facilitate the integration of urban and rural areas. However, urbanization has exacerbated the migration of rural labor, which hinders the modernization of rural areas. In this paper, the number of college students is used to measure the high human capital stock of urban agglomerations, and the high human capital stock is used to represent population quality.
- Market dynamics (MD): Investment in agriculture by enterprises can activate various production factors in rural areas, thus promoting local agricultural development and urban–rural integration. The variable measuring regional market vitality in this paper is the number of industrial enterprises.
5.2.2. Spatial Measurement Model Selection
5.2.3. Base Regression Analysis
5.2.4. Decomposition of Spatial Effects
- The direct and indirect effects of digital economy development on EURI are significant. However, the indirect and total effects are negative. This local digital economy development is detrimental to the EURI of neighboring cities. And because the positive direct effect cannot offset the negative indirect effect, it exacerbates the differences in the overall EURI in the study area. This may be because regions with a high level of digital economy development attract population, resource, and product spillovers from neighboring cities, creating a “Matthew effect”. In addition, there is an inverted “U”-shaped nonlinear relationship between the level of digital economy development and urban–rural integration, and the siphoning effect and digital divide between urban and rural areas also inhibit the improvement of EURI.
- The impact of science and education support: As far as the whole region is concerned, science and education expenditures do not show obvious spatial spillover effects, which may be because science and education expenditures are essentially investments in the future, which tend to have a delayed effect, and the effectiveness of the effect needs to be revealed after a longer time cycle. This also indicates that in Sichuan and Chongqing, the “competition effect” between urban development and the surrounding cities is greater than the “synergy effect”, and the cities mainly focus on developing their regions. It is unlikely that there will be any active spillovers of scientific and technological inputs as well as educational support.
- The level of financial development has a significantly negative impact on both indirect and total effects, while the direct effect is not significant. This suggests that increased financial development will negatively impact the process of integrating neighboring cities, with a stronger negative effect as the level of financial development rises. This may be due to the inconsistency of financial development in Sichuan and Chongqing, and the expansion of financial services to improve the rural living environment still needs to reflect production promotion. Financial institutions are more biased towards cities in allocating financial resources, and this unbalanced financial development will exacerbate the urban–rural gap, which is not conducive to urban–rural integrated development [61,62].
- The direct impact of market dynamics is strongly negative, while the indirect impact is strongly positive. However, the overall impact is not statistically significant, suggesting that market dynamics hampers the efficiency of urban–rural integration and development in this region. On the other hand, it has a positive spatial spillover effect on the surrounding areas. The surge in the number of industrial enterprises in the neighboring cities can stimulate the progress of industrialization in the region and create additional job prospects for both urban and rural inhabitants. This, in turn, can help bridge the gap between urban and rural areas and facilitate the advancement of urban–rural integration.
- None of the effects on population quality are significant. This could be attributed to the fact that Sichuan and Chongqing are situated in the western region of China, which serves as the primary source of population outflow. The mobile population of Chengdu has reached 8,459,600 in 2020. The large-scale outflow of the population hurts the overall human resource status of the rural resident population [63,64]. Furthermore, the western region has a comparatively lower level of educational achievement. This is due to the influence of employment pressure, which causes college students in Sichuan and Chongqing to relocate to neighboring regions with higher levels of economic development. Consequently, there is a more severe brain drain, resulting in the demographic factors in Sichuan and Chongqing having an insignificant impact on urban–rural integration development.
6. Discussion
6.1. Spatio-Temporal Evolution of EURI and Its Influencing Factors
6.2. Advantages and Limitations
7. Conclusions and Recommendations
- The average value of EURI in the Sichuan and Chongqing regions from 2010 to 2021 is 0.45, which is low and there is much room for improvement and optimization;
- The EURI in Sichuan and Chongqing is greatly influenced by external environmental conditions, and when the external environmental conditions are the same, the EURI decreases in most areas, which indicates that the EURI is generally overestimated. The higher EURI in less economically developed regions is mainly due to external policies such as rural revitalization and precision poverty alleviation;
- In terms of the evolution, the EURI in the Sichuan and Chongqing regions shows an upward trend, but the regional differences gradually widen;
- From the perspective of the influencing factors of the EURI, the development of the digital economy, the support of science and education, and the business environment have significant positive facilitating effects, the market dynamics has a significant negative inhibiting effect, and the financial development and the quality of the population do not have a significant effect. An analysis of the efficiency spillover effects of urban–rural integration and development shows that differences in the level of digital economy development and financial development within regions exacerbate the polarization of urban–rural integration and development. The increase in market dynamics, on the other hand, is conducive to the overall coordinated development of the region.
- To address the generally ineffective outcomes of urban–rural integrated development, the government must establish a well-planned urban–rural development strategy. This strategy should focus on enhancing the exchange of resources such as skilled individuals, financial capital, technology, and funding between urban and rural areas with the aim of reducing the disparity in development between the two.
- The government needs to optimize industrial planning and reduce excessive attention to economic benefits. Bazhong City, Ziyang City, and other cities with poor economic foundations should pay more attention to the optimization of internal management, not blindly invest funds, and grasp great protection, not to engage in great development, but to achieve the integrated development of urban and rural areas.
- The Sichuan and Chongqing regions should establish economic ties based on unique historical origins, build regional integration mechanisms, avoid the negative effects of direct vicious competition in the region, emphasize the radiation function of high-value efficiency zones, and form benign interactions between regions.
Author Contributions
Funding
Data Availability Statement
Acknowledgments
Conflicts of Interest
References
- Sen, K.; Sumner, A.; Yusuf, A. Double Dividends and Mixed Blessings: Structural Transformation, Income Inequality and Employment Dynamics. J. Dev. Stud. 2020, 56, 1638–1642. [Google Scholar] [CrossRef]
- Yin, X.; Chen, J.; Li, J. Rural Innovation System: Revitalize the Countryside for a Sustainable Development. J. Rural Stud. 2022, 93, 471–478. [Google Scholar] [CrossRef]
- Bennett, K.J.; Yuen, M.; Blanco-Silva, F. Geographic Differences in Recovery after the Great Recession. J. Rural Stud. 2018, 59, 111–117. [Google Scholar] [CrossRef]
- Ma, C.; Jiang, Y.; Qi, K. Investigating the Urban–Rural Integrated Town Development Strategy on the Basis of the Study of Rural Forms in Nantong, China. Front. Archit. Res. 2021, 10, 190–201. [Google Scholar] [CrossRef]
- Kong, X.Z.; Zhang, X.R. From Urban-Rural Integration to Rural Revitalization: The Path and Development Trend of the Evolution of China’s Urban-Rural Relationship since the 18th National People’s Congress. Teach. Res. 2018, 52, 5–14. [Google Scholar]
- Zonneveld, W.; Stead, D. European Territorial Cooperation and the Concept of Urban—Rural Relationships. Plan. Pract. Res. 2007, 22, 439–453. [Google Scholar] [CrossRef]
- Jezierska-Thöle, A.; Gwiaździńska-Goraj, M.; Dudzińska, M. Environmental, Social, and Economic Aspects of the Green Economy in Polish Rural Areas—A Spatial Analysis. Energies 2022, 15, 3332. [Google Scholar] [CrossRef]
- Zhou, D.; Qi, J.L.; Zhong, W.Y. Review of Urban-Rural Integration Evaluation Research: Connotation Identification, Theoretical Cognition and System Reconstruction. J. Nat. Resour. 2021, 36, 2634–2651. [Google Scholar]
- Wei, X.S. Research on Rural Development Path with Chinese Characteristics from Dual Structure to Urban-Rural Integration. Agric. Econ. 2019, 2, 26–28. [Google Scholar]
- He, R.W. Rural-Urban Integration and Rural Revitalization: Theoretical Discussion, Mechanism Explanation and Path of Realization. Geogr. Res. 2018, 37, 2127–2140. [Google Scholar]
- Lu, D.D.; Guo, L.X. The Research Core of Geography—Territorial System of Human-Earth Relations—On Academician Wu Chuanjun’s Geographic Thought and Academic Contributions. Acta Geogr. Sin. 1998, 53, 3–11. [Google Scholar]
- Cao, Z.; Li, Y.R.; Chen, Y.F. Exploring the Path of Rural Transformation and Sustainable Development in the Context of Urban-Rural Integration. Acta Geogr. Sin. 2019, 74, 2560–2571. [Google Scholar]
- Yan, S.H.; Bai, G.Q. New Exploration of the Connotation of Coordinated Regional Economic Development. Hubei Soc. Sci. 2009, 3, 95–98. [Google Scholar]
- Abrhám, J. Rural Development and Regional Disparities of the New EU Member States. Agric. Econ. (Zeměd. Ekon.) 2011, 57, 288–296. [Google Scholar] [CrossRef]
- Smith, N.R. Rural Perspectives on Asia’s Urban-Rural Relations—Mobilizing for Development: The Modernization of Rural East Asia. By Kristen E. Looney. Ithaca, N.Y.: Cornell University Press, 2020. Xv, 213 Pp. ISBN: 9781501748844 (Cloth).—More than Rural: Textures of Thailand’s Agrarian Transformation. By Jonathan Rigg. Honolulu: University of Hawai‘i Press, 2019. Xx, 300 Pp. ISBN: 9780824876593 (Cloth). J. Asian Stud. 2021, 80, 540–543. [Google Scholar] [CrossRef]
- Gorriz-Mifsud, E.; Secco, L.; Da Re, R.; Pisani, E.; Bonet, J.A. Structural Social Capital and Local-Level Forest Governance: Do They Inter-Relate? A Mushroom Permit Case in Catalonia. J. Environ. Manag. 2017, 188, 364–378. [Google Scholar] [CrossRef]
- Guo, D.; Jiang, K.; Xu, C.; Yang, X. Industrial Clustering, Income and Inequality in Rural China. World Dev. 2022, 154, 105878. [Google Scholar] [CrossRef]
- Ma, L.; Liu, S.; Fang, F.; Che, X.; Chen, M. Evaluation of Urban-Rural Difference and Integration Based on Quality of Life. Sustain. Cities Soc. 2020, 54, 101877. [Google Scholar] [CrossRef]
- Baier, N.; Pieper, J.; Schweikart, J.; Busse, R.; Vogt, V. Capturing Modelled and Perceived Spatial Access to Ambulatory Health Care Services in Rural and Urban Areas in Germany. Soc. Sci. Med. 2020, 265, 113328. [Google Scholar] [CrossRef] [PubMed]
- Zarifa, D.; Seward, B.; Milian, R.P. Location, Location, Location: Examining the Rural-Urban Skills Gap in Canada. J. Rural Stud. 2019, 72, 252–263. [Google Scholar] [CrossRef]
- Seale, E. Coping Strategies of Urban and Rural Welfare Organisations and the Regulation of the Poor. New Political Econ. 2013, 18, 141–170. [Google Scholar] [CrossRef]
- Wang, Y.M.; Liu, G.; Shi, J.C.; Cai, M. Provincial and Regional Differences in the Level of Urban-Rural Integration in China. China Popul. Resour. Environ. 2012, 22, 137–142. [Google Scholar]
- Xu, S.; Wu, Q.Q. Analysis of the Characteristics of Spatial and Temporal Differentiation of the Level of Urban-Rural Integration in China and the Factors Affecting It. Stat. Decis. 2023, 39, 114–119. [Google Scholar]
- Shan, B.; Liu, J.; Liu, Y.; Wang, H.; Wang, A. How Is Construction Land Transition Related to Rural Transformation? Evidence from a Plain County in China Based on the Grey Correlation Model. Land 2022, 11, 641. [Google Scholar] [CrossRef]
- Dou, H.; Ma, L.; Li, H.; Bo, J.; Fang, F. Impact Evaluation and Driving Type Identification of Human Factors on Rural Human Settlement Environment: Taking Gansu Province, China as an Example. Open Geosci. 2020, 12, 1324–1337. [Google Scholar] [CrossRef]
- Cui, S.Q.; Zhou, G.H.; Dai, L.Y.; Wu, G.H.; He, Y.H. Progress and Prospects of Research on Urban-Rural Integration Development Based on Geographic Perspectives. Econ. Geogr. 2022, 42, 104–113. [Google Scholar] [CrossRef]
- Yan, J.; Chen, H.; Xia, F. Toward Improved Land Elements for Urban–Rural Integration: A Cell Concept of an Urban–Rural Mixed Community. Habitat Int. 2018, 77, 110–120. [Google Scholar] [CrossRef]
- Brauer, R.; Dymitrow, M. Quality of Life in Rural Areas: A Topic for the Rural Development Policy? Bull. Geogr. Socio-Econ. Ser. 2014, 25, 25–54. [Google Scholar] [CrossRef]
- Yang, Y.; Bao, W.; Wang, Y.; Liu, Y. Measurement of Urban-Rural Integration Level and Its Spatial Differentiation in China in the New Century. Habitat Int. 2021, 117, 102420. [Google Scholar] [CrossRef]
- Zhang, H.P.; He, R.W.; Li, G.Q.; Wang, J. Spatio-Temporal Evolution of Coupled Coordination Degree of Rural-Urban Integration System in Metropolitan Areas and Its Influencing Factors—A Case Study of the Capital Ring Region. Econ. Geogr. 2020, 40, 56–67. [Google Scholar] [CrossRef]
- Liu, Y.; Lu, S.; Chen, Y. Spatio-Temporal Change of Urban–Rural Equalized Development Patterns in China and Its Driving Factors. J. Rural Stud. 2013, 32, 320–330. [Google Scholar] [CrossRef]
- Zhou, J.N.; Zou, W.; Qin, F.C. A Multidimensional Review of China’s Rural-Urban Integration under the Concept of Equalization and Its Influencing Factors. Geogr. Res. 2020, 39, 1836–1851. [Google Scholar]
- Gao, B.; Kong, L.C. Analysis of Regional Differences in the Integration of Urban and Rural Development in China. Hebei Acad. J. 2017, 37, 101–108. [Google Scholar]
- Wu, X.; Cui, P. A Study of the Time–Space Evolution Characteristics of Urban–Rural Integration Development in a Mountainous Area Based on ESDA-GIS: The Case of the Qinling-Daba Mountains in China. Sustainability 2016, 8, 1085. [Google Scholar] [CrossRef]
- Shi, J.; Duan, K.; Wu, G.; Li, J.; Xu, K. Efficiency of Urban-Rural Integration Development in the Yangtze River Delta Under the Background of Carbon Emission Constraint. Econ. Geogr. 2021, 41, 57–67. [Google Scholar] [CrossRef]
- Wang, D.C.; Zhao, H. Research on the Evaluation of the Efficiency of China’s Urban-Rural Integration Development and Its Influencing Factors. Res. Financ. Econ. Issues 2022, 10, 101–109. [Google Scholar] [CrossRef]
- Yin, Q.M.; Wang, X. Does the Digital Economy Promote Rural-Urban Integration in China—A Test Based on Mediated Effects Modeling and Spatial Durbin Modeling. J. Technol. Econ. 2022, 41, 114–127. [Google Scholar]
- Tang, C.L.; Ma, Y.R. Measuring the Level of Urban-Rural Integration in Chinese Provinces Based on Intuitionistic Fuzzy. Econ. Geogr. 2016, 36, 52–59. [Google Scholar] [CrossRef]
- Zhang, X.L.; Chou, F.D.; Zhu, C.G. Evolution of Urban-Rural Integration Development Level in Huaihai Economic Zone under the Perspective of Spatio-Temporal Interaction. J. Nat. Resour. 2020, 35, 1867–1880. [Google Scholar]
- Liu, M.H.; Lu, F. Rural-Urban Factor Mismatch and Rural-Urban Integrated Development: An Empirical Study Based on Chinese Provincial Panel Data. J. Agrotech. Econ. 2019, 2, 33–46. [Google Scholar] [CrossRef]
- Tian, Y.; Qian, J.; Wang, L. Village Classification in Metropolitan Suburbs from the Perspective of Urban-Rural Integration and Improvement Strategies: A Case Study of Wuhan, Central China. Land Use Policy 2021, 111, 105748. [Google Scholar] [CrossRef]
- Pan, W.; Wang, J.; Li, Y.; Chen, S.; Lu, Z. Spatial Pattern of Urban-Rural Integration in China and the Impact of Geography. Geogr. Sustain. 2023, 4, 404–413. [Google Scholar] [CrossRef]
- Zheng, Y.; Long, H. Evaluation of the Measurement of China’s Urban-Rural Integration Development and Its Spatio-Temporal Pattern. Acta Geogr. Sin. 2023, 78, 1869–1887. [Google Scholar]
- Lyu, L.; Kan, D. Measurement and analysis of the development effciency of urban-rural integration—A case study of central china. Chin. J. Agric. Resour. Reg. Plan. 2021, 42, 176–183. [Google Scholar]
- Lu, X.; Shi, P.; Deng, Z.; Li, X.; Hu, Y. Calculation of Green Production Efficiency of Tourism in the Yangtze River Economic Belt and Analysis of Its Spatial and Temporal Evolution. China Popul. Resour. Environ. 2019, 29, 19–30. [Google Scholar]
- Xiao, R.; Chen, Z.; Qian, L. China’s High-Tech Manufacturing Industries’ Innovation Efficiency: Technology Heterogeneity Perspective. J. Manag. Sci. 2018, 31, 48–68. [Google Scholar]
- Zhao, X.; Shang, Y.; Song, M. Industrial Structure Distortion and Urban Ecological Efficiency from the Perspective of Green Entrepreneurial Ecosystems. Socio-Econ. Plan. Sci. 2020, 72, 100757. [Google Scholar] [CrossRef]
- Chen, Y.; Miao, J.; Zhu, Z. Measuring Green Total Factor Productivity of China’s Agricultural Sector: A Three-Stage SBM-DEA Model with Non-Point Source Pollution and CO2 Emissions. J. Clean. Prod. 2021, 318, 128543. [Google Scholar] [CrossRef]
- Zhang, A.; Zhou, J.; Zhang, L.; Wang, Q. Measurement, Restrictive Factors and Development Path of Urban-Rural Integration Coordinated Development in Yellow River Basin. J. Stat. Inf. 2022, 37, 34–43. [Google Scholar]
- Gai, M.; Zhu, J.M.; Sun, C.Z.; Sun, K. Spatio-Temporal Evolution of Marine Economic Efficiency in China’s Coastal Areas and Analysis of Influencing Factors. Resour. Sci. 2018, 40, 1966–1979. [Google Scholar]
- Tone, K. A Slacks-Based Measure of Super-Efficiency in Data Envelopment Analysis. Eur. J. Oper. Res. 2002, 143, 32–41. [Google Scholar] [CrossRef]
- Liu, L.; Yang, Y.; Liu, S.; Gong, X.; Zhao, Y.; Jin, R.; Duan, H.; Jiang, P. A Comparative Study of Green Growth Efficiency in Yangtze River Economic Belt and Yellow River Basin between 2010 and 2020. Ecol. Indic. 2023, 150, 110214. [Google Scholar] [CrossRef]
- Wang, Y.; Peng, Q.; Jin, C.; Ren, J.; Fu, Y.; Yue, X. Whether the Digital Economy Will Successfully Encourage the Integration of Urban and Rural Development: A Case Study in China. Chin. J. Popul. Resour. Environ. 2023, 21, 13–25. [Google Scholar] [CrossRef]
- Peng, Z.; Dan, T. Digital Dividend or Digital Divide? Digital Economy and Urban-Rural Income Inequality in China. Telecommun. Policy 2023, 47, 102616. [Google Scholar] [CrossRef]
- Guo, L.X.; Liu, Y.F.; Feng, J.M.; He, S. Spatio-Temporal Patterns of New Urbanization and Integrated Urban-Rural Development in Chinese Provinces and Their Influencing Factors. J. Earth Sci. Environ. 2023, 45, 781–795. [Google Scholar] [CrossRef]
- Luo, W.L.; Wang, W.L.; Lin, Z.; Zhou, W.J. Spatio-Temporal Evolution and Driving Factors of Urban-Rural Integration in China. Prog. Geogr. 2023, 42, 629–643. [Google Scholar] [CrossRef]
- Fan, S.; Jiang, M.; Sun, D.; Zhang, S. Does Financial Development Matter the Accomplishment of Rural Revitalization? Evidence from China. Int. Rev. Econ. Financ. 2023, 88, 620–633. [Google Scholar] [CrossRef]
- Tiwasing, P.; Gorton, M.; Phillipson, J.; Maioli, S. Rural Businesses and Levelling up: A Rural-Urban Analysis of Business Innovation and Exporting in England’s North and Midlands. J. Rural Stud. 2023, 100, 103007. [Google Scholar] [CrossRef]
- Qi, H.B.; Shen, X.Y.; Long, F.; Liu, M.J.; Gao, X.W. Spatial and Temporal Patterns and Influencing Factors of Carbon Emissions in Zhejiang Province’s Counties. Resour. Environ. Yangtze Basin 2023, 32, 821–831. [Google Scholar]
- LeSage, J.; Pace, R.K. Introduction to Spatial Econometrics; Chapman and Hall/CRC: New York, NY, USA, 2009; ISBN 978-0-429-13808-9. [Google Scholar]
- Zhang, K.; Liu, L. The Practical Exploration, Cognitive Thinking, and Countermeasures for the Revitalization of Urban-Rural Integrated Villages. Acad. J. Zhongzhou 2024, 1, 45–53. [Google Scholar]
- Sun, Y.; Lei, N.; Liu, X. Can Digital Economy Promote Urban-Rural Integration and Development: Empirical Evidence from 268 Cities in China. South China Financ. 2023, 1, 38–53. [Google Scholar]
- Chang, M.; Li, F.; Liu, J. Effect of Population Urbanization on the Income Structure of Farmers: An Empirical Analysis Based on Chinese Provincial Panels. J. China Agric. Univ. 2024, 29, 228–239. [Google Scholar]
- Yang, S.; Du, H.; Yang, X. Land Transfer and Rural Household Income Gap: An Empirical Exploration from the Perspective of Household Development. J. Huazhong Agric. Univ. 2024, 1, 178–191. [Google Scholar] [CrossRef]
- Xu, X.; Wang, Y. Evaluation of Urban-Rural Integration Development and Analysis of Spatial Differences in the Yellow River Basin Based on the Dual Logic Perspective. J. Desert Res. 2024, 6, 1–13. [Google Scholar]
- Liu, W.; Wu, M.; Zhang, J. Study on the Impact of Polycentric Spatial Structure on Urban-Rural Integration and Development. J. Manag. 2024, 1, 1–18. [Google Scholar]
- Huo, L. Spatial and Temporal Evolution Analysis of the Coupling and Coordinated Development of Urban Expansion and Rural Revitalization in China. J. Tech. Econ. Manag. 2024, 2, 129–136. [Google Scholar]
- Ren, X.; Pan, Y.; Nie, J.; Shen, J. High-Quality Integration Level and Spatio-Temporal Characteristics of the Chengdu-Chongqing Twin-City Economic Circle. Resour. Dev. Mark. 2024, 40, 1–19. [Google Scholar]
- Luo, R.; You, W.; Zhou, N.; Li, Z. Impact of Digital Economy on New-Type Urbanization in the Yangtze River Delta: Simultaneous Discussion on the Moderating Effect of Digital Divide. Geogr. Geo-Inf. Sci. 2024, 40, 114–124+133. [Google Scholar]
- Xu, Y.; Ji, X. Impact of Digital Inclusive Finance on the Integration of Urban and Rural Capital Factors in Counties: Based on the Perspective of New Binary Transformation. J. Quant. Technol. Econ. 2024, 41, 193–212. [Google Scholar]
- Wang, L.; Wang, X. Impact of Inclusive Finance on Economic Growth and Urban-Rural Income Gap. Stat. Decis. 2024, 40, 145–150. [Google Scholar] [CrossRef]
- Wang, K.; Deng, Y. Whether New Urbanization Can Break through the “Hu Huanyong Line”—Another Discussion on the Geographic Connotation of the “Hu Huanyong Line”. Geogr. Res. 2016, 35, 825–835. [Google Scholar]
- Wang, K.; Chen, Y.; Ding, J. The Demand Forecast and Impact of Population Growth on Urban-Rural Construction Land after Implementing the Universal Two-Child Policy. China Land Sci. 2016, 30, 37–47. [Google Scholar]
- He, Y.; Zhou, G.; Tang, C.; Fan, S.; Guo, X. The Spatial Organization Pattern of Urban-Rural Integration in Urban Agglomerations in China: An Agglomeration-Diffusion Analysis of the Population and Firms. Habitat Int. 2019, 87, 54–65. [Google Scholar] [CrossRef]


| Subsystems | Indicators | Description or Calculation of Indicators | Weights | Causality |
|---|---|---|---|---|
| Economic integration | Rural and urban consumption structure | Regional total retail sales of consumer goods/regional average annual population (CNY/person) | 0.110 | + |
| Rural and urban income structure | Per capita disposable income of permanent urban residents/per capita disposable income of permanent rural residents (%) | 0.013 | − | |
| Population integration | Population urbanization level | Urban resident population/area average annual population (%) | 0.060 | + |
| Number of pupils in compulsory education | Number of students enrolled in secondary and primary schools/average annual population of the region | 0.033 | + | |
| Social integration | Social security services | Number of urban and rural residents enrolled in health insurance/area average annual population (%) | 0.166 | + |
| Number of urban and rural residents insured by unemployment insurance/average annual population of the region (%) | 0.247 | + | ||
| Configuration of educational services | Secondary school student–teacher ratio/ministry of education mandated student–teacher ratio standards | 0.018 | − | |
| Pupil–teacher ratio in primary schools/standard pupil–teacher ratio set by the ministry of education | 0.019 | − | ||
| Urban and rural infrastructure | Urban and rural water penetration rate (%) | 0.022 | + | |
| Urban and rural gas penetration rate (%) | 0.016 | + | ||
| Spatial integration | Urban spatial expansion | Built-up area/total urban area (%) | 0.168 | + |
| Density of road network | Road area per capita (square meters) | 0.051 | + | |
| Ecological integration | Urban and rural domestic waste disposal | Non-hazardous treatment rate of domestic waste (%) | 0.012 | + |
| Urban and rural air quality | PM2.5 annual average concentration (μg/m3) | 0.046 | − | |
| Level of urban and rural greening | Greening coverage of built-up areas (%) | 0.020 | + |
| Level 1 Indicators | Secondary Indicators | Description of Indicators | Data Sources |
|---|---|---|---|
| Input indicators | Labor inputs | Average annual number of practitioners | Municipal statistical yearbooks |
| Land inputs | Built-up area | ||
| Capital inputs | Total investment in fixed assets | ||
| Energy inputs | Annual electricity consumption | ||
| Output indicators | Expected outputs | Level of urban–rural integration and development | |
| GDP | |||
| Non-expected outputs | Total CO2 emissions | ||
| Pollutant emissions (entropy weighting synthesis) | |||
| Environmental indicators | Economic environment | Per capita GDP | |
| Institutional environment | Financial expenditure | ||
| Social environment | Value added of tertiary industry/value added of secondary industry |
| City | 2010 | 2011 | 2012 | 2013 | 2014 | 2015 | 2016 | 2017 | 2018 | 2019 | 2020 | 2021 | Average Value | Arrange in Order |
|---|---|---|---|---|---|---|---|---|---|---|---|---|---|---|
| Chongqing | 0.10 | 0.12 | 0.14 | 0.15 | 0.20 | 0.21 | 0.26 | 0.25 | 0.26 | 0.36 | 0.42 | 1.06 | 0.29 | 19 |
| Chengdu | 0.54 | 0.62 | 0.67 | 0.70 | 0.75 | 1.02 | 0.75 | 0.81 | 0.88 | 1.04 | 1.03 | 1.07 | 0.82 | 2 |
| Zigong | 0.46 | 0.53 | 0.56 | 0.59 | 0.64 | 0.67 | 0.79 | 1.01 | 1.01 | 1.01 | 0.77 | 1.14 | 0.76 | 5 |
| Panzhihua | 0.48 | 0.55 | 0.57 | 0.62 | 0.66 | 0.75 | 0.80 | 1.03 | 1.02 | 1.05 | 0.64 | 0.70 | 0.74 | 6 |
| Luzhou | 0.37 | 0.43 | 0.45 | 0.46 | 0.46 | 0.48 | 0.48 | 0.49 | 0.52 | 0.70 | 0.76 | 1.02 | 0.55 | 11 |
| Deyang | 0.42 | 0.50 | 0.58 | 0.60 | 0.66 | 0.74 | 1.01 | 1.01 | 1.02 | 1.03 | 0.88 | 1.04 | 0.79 | 3 |
| Mianyang | 0.30 | 0.38 | 0.42 | 0.43 | 0.46 | 0.48 | 0.53 | 0.61 | 0.61 | 0.79 | 0.94 | 1.08 | 0.59 | 10 |
| Guangyuan | 0.28 | 0.33 | 0.38 | 0.41 | 0.47 | 0.52 | 0.59 | 0.69 | 0.76 | 0.93 | 0.79 | 1.07 | 0.60 | 8 |
| Suining | 0.36 | 0.39 | 0.41 | 0.42 | 0.50 | 0.49 | 0.54 | 0.57 | 0.65 | 0.78 | 0.50 | 0.57 | 0.52 | 15 |
| Neijiang | 0.42 | 0.70 | 1.01 | 0.48 | 0.50 | 0.48 | 0.48 | 0.46 | 0.44 | 0.44 | 0.41 | 0.45 | 0.52 | 13 |
| Leshan | 0.33 | 0.40 | 0.40 | 0.41 | 0.44 | 0.47 | 0.52 | 0.56 | 0.58 | 0.69 | 0.66 | 1.06 | 0.54 | 12 |
| Nanchong | 0.32 | 0.36 | 0.39 | 0.41 | 0.44 | 0.47 | 0.49 | 0.50 | 0.50 | 0.57 | 0.78 | 1.02 | 0.52 | 14 |
| Meishan | 0.34 | 0.39 | 0.42 | 0.45 | 0.43 | 0.48 | 0.47 | 0.50 | 0.49 | 0.54 | 0.50 | 0.51 | 0.46 | 18 |
| Yibin | 0.37 | 0.42 | 0.42 | 0.41 | 0.45 | 0.45 | 0.45 | 0.50 | 0.44 | 0.55 | 0.53 | 0.66 | 0.47 | 17 |
| Guang’an | 0.40 | 0.51 | 0.55 | 0.44 | 0.48 | 0.52 | 0.53 | 0.48 | 0.46 | 0.53 | 0.55 | 0.70 | 0.51 | 16 |
| Dazhou | 0.41 | 0.42 | 0.58 | 0.47 | 0.50 | 0.49 | 0.53 | 0.52 | 0.54 | 0.79 | 0.85 | 1.05 | 0.60 | 9 |
| Ya’an | 0.39 | 0.51 | 0.56 | 0.64 | 0.64 | 0.67 | 0.77 | 1.00 | 0.77 | 0.86 | 0.82 | 1.10 | 0.73 | 7 |
| Bazhong | 0.54 | 0.56 | 1.00 | 0.57 | 0.62 | 0.77 | 1.01 | 0.64 | 0.64 | 1.04 | 1.01 | 1.07 | 0.79 | 4 |
| Ziyang | 0.58 | 1.00 | 1.00 | 1.02 | 1.01 | 1.05 | 0.71 | 1.01 | 1.04 | 0.75 | 0.77 | 1.12 | 0.92 | 1 |
| Average value | 0.39 | 0.48 | 0.55 | 0.51 | 0.54 | 0.59 | 0.62 | 0.67 | 0.66 | 0.76 | 0.72 | 0.92 | 0.62 |
| Input Slack Variables | Labor Input Slack Variables | Land Input Slack Variables | Capital Input Slack Variables | Energy Input Slack Variables |
|---|---|---|---|---|
| Constant term | 36.95 *** | 102.35 *** | 8,501,899.20 *** | 498,236.33 *** |
| Economic climate | −5.27 *** | −18.30 *** | −2,161,124.50 *** | 9578.52 *** |
| Institutional environment | −5.64 *** | 5.26 | 4,702,793.30 *** | −40,576.05 *** |
| Social environment | 1.61 *** | −3.17 | 383,117.31 *** | −57,032.68 *** |
| Sigma-squared | 1029.00 *** | 5513.91 *** | 56,401,398,000,000.00 *** | 153,092,780,000.00 *** |
| Gamma | 0.97 *** | 0.81 *** | 0.33 *** | 0.85 *** |
| Log likelihood function | −743.85 | −1157.60 | −3898.32 | −3105.43 |
| Lr test of the one-sided error | 116.81 *** | 10.39 ** | 14.07 *** | 130.55 *** |
| City | 2010 | 2011 | 2012 | 2013 | 2014 | 2015 | 2016 | 2017 | 2018 | 2019 | 2020 | 2021 | Average Value | Arrange in Order |
|---|---|---|---|---|---|---|---|---|---|---|---|---|---|---|
| Chongqing | 0.29 | 0.38 | 0.42 | 0.43 | 0.45 | 0.49 | 0.51 | 0.53 | 0.54 | 0.90 | 0.81 | 1.15 | 0.58 | 3 |
| Chengdu | 0.55 | 0.61 | 0.65 | 0.68 | 0.74 | 0.75 | 0.80 | 0.81 | 0.83 | 1.03 | 1.28 | 1.36 | 0.84 | 1 |
| Zigong | 0.27 | 0.30 | 0.35 | 0.39 | 0.44 | 0.48 | 0.53 | 0.70 | 0.71 | 0.91 | 0.61 | 1.07 | 0.56 | 5 |
| Panzhihua | 0.34 | 0.41 | 0.45 | 0.50 | 0.55 | 0.63 | 0.69 | 0.86 | 0.86 | 1.03 | 0.55 | 0.64 | 0.63 | 2 |
| Luzhou | 0.21 | 0.24 | 0.28 | 0.29 | 0.34 | 0.37 | 0.41 | 0.45 | 0.47 | 0.60 | 0.58 | 0.67 | 0.41 | 9 |
| Deyang | 0.27 | 0.31 | 0.35 | 0.39 | 0.43 | 0.48 | 0.52 | 0.59 | 0.59 | 0.68 | 0.62 | 1.01 | 0.52 | 6 |
| Mianyang | 0.28 | 0.33 | 0.38 | 0.39 | 0.45 | 0.50 | 0.55 | 0.62 | 0.66 | 0.75 | 0.87 | 1.07 | 0.57 | 4 |
| Guangyuan | 0.15 | 0.18 | 0.21 | 0.23 | 0.27 | 0.30 | 0.33 | 0.37 | 0.41 | 0.47 | 0.46 | 0.56 | 0.33 | 18 |
| Suining | 0.18 | 0.22 | 0.25 | 0.28 | 0.36 | 0.36 | 0.43 | 0.47 | 0.54 | 0.56 | 0.45 | 0.54 | 0.39 | 13 |
| Neijiang | 0.19 | 0.21 | 0.23 | 0.28 | 0.31 | 0.34 | 0.38 | 0.41 | 0.41 | 0.44 | 0.44 | 0.49 | 0.34 | 17 |
| Leshan | 0.22 | 0.26 | 0.30 | 0.33 | 0.40 | 0.44 | 0.48 | 0.53 | 0.52 | 0.58 | 0.55 | 0.78 | 0.45 | 7 |
| Nanchong | 0.20 | 0.23 | 0.26 | 0.28 | 0.32 | 0.34 | 0.37 | 0.41 | 0.44 | 0.48 | 0.59 | 0.75 | 0.39 | 12 |
| Meishan | 0.19 | 0.23 | 0.26 | 0.27 | 0.32 | 0.36 | 0.39 | 0.43 | 0.44 | 0.48 | 0.46 | 0.56 | 0.37 | 15 |
| Yibin | 0.23 | 0.27 | 0.30 | 0.33 | 0.37 | 0.41 | 0.45 | 0.48 | 0.52 | 0.58 | 0.56 | 0.62 | 0.43 | 8 |
| Guang’an | 0.16 | 0.19 | 0.21 | 0.24 | 0.28 | 0.31 | 0.34 | 0.37 | 0.37 | 0.40 | 0.40 | 0.46 | 0.31 | 19 |
| Dazhou | 0.20 | 0.23 | 0.25 | 0.28 | 0.32 | 0.35 | 0.37 | 0.42 | 0.43 | 0.54 | 0.62 | 0.75 | 0.40 | 10 |
| Ya’an | 0.19 | 0.22 | 0.24 | 0.26 | 0.30 | 0.33 | 0.37 | 0.40 | 0.42 | 0.46 | 0.47 | 1.02 | 0.39 | 11 |
| Bazhong | 0.11 | 0.13 | 0.15 | 0.17 | 0.21 | 0.23 | 0.25 | 0.29 | 0.30 | 0.58 | 0.68 | 1.05 | 0.35 | 16 |
| Ziyang | 0.18 | 0.21 | 0.25 | 0.27 | 0.31 | 0.34 | 0.31 | 0.35 | 0.40 | 0.38 | 0.52 | 1.08 | 0.38 | 14 |
| Average value | 0.23 | 0.27 | 0.30 | 0.33 | 0.38 | 0.41 | 0.45 | 0.50 | 0.52 | 0.62 | 0.61 | 0.82 | 0.45 |
| Year | Moran’s I | z | p-Value * | Year | Moran’s I | z | p-Value * |
|---|---|---|---|---|---|---|---|
| 2010 | 0.472 *** | 3.558 | 0.0000 | 2016 | 0.638 *** | 3.908 | 0.0000 |
| 2011 | 0.505 *** | 3.482 | 0.0000 | 2017 | 0.65 *** | 3.856 | 0.0000 |
| 2012 | 0.51 *** | 3.403 | 0.0000 | 2018 | 0.587 *** | 3.492 | 0.0000 |
| 2013 | 0.56 *** | 3.678 | 0.0000 | 2019 | 0.572 *** | 3.357 | 0.0000 |
| 2014 | 0.57 *** | 3.77 | 0.0000 | 2020 | 0.022 | 0.51 | 0.3050 |
| 2015 | 0.633 *** | 3.942 | 0.0000 | 2021 | −0.249 | −1.013 | 0.1560 |
| Tests | Categorization | Statistic | p-Value | |
|---|---|---|---|---|
| LM test | Spatial error model (SEM) | Lagrange multipliers | 22.74 | 0.000 |
| Lagrange multipliers (robust) | 2.554 | 0.110 | ||
| Spatial lag model (SAR) | Lagrange multipliers | 25.196 | 0.000 | |
| Lagrange multipliers (robust) | 5.01 | 0.025 | ||
| Wald test | Spatial error model (SEM) | 19.31 | 0.002 | |
| Spatial lag model (SAR) | 22.67 | 0.000 | ||
| LR test | Spatial lag model (SAR) vs. spatial Durbin model (SDM) | 38.82 | 0.000 | |
| Spatial error model (SEM) vs. spatial Durbin model (SDM) | 43.16 | 0.000 | ||
| Hausman test | SDM | 33.35 | 0.000 | |
| Joint significance tests | Likelihood ratio test (assumption: ind nested in both) | 171 | 0.000 | |
| Likelihood ratio test (assumption: time nested in both) | 154.51 | 0.000 | ||
| Variable | Ratio | Variable | Ratio |
|---|---|---|---|
| DE | 4.14 × 10⁻¹⁰ *** (3.23) | W*DE | −9.64 × 10⁻¹⁰ *** (−5.43) |
| SES | 0.675 ** (2.30) | W*SES | −0.162 (−0.38) |
| Fin | −0.00806 (−0.23) | W*Fin | −0.168 *** (−3.31) |
| BE | 0.0214 * (1.80) | W*BE | 0.0187 (1.12) |
| PQ | −0.0000291 (−0.76) | W*PQ | −0.0000264 (−0.40) |
| MD | −0.0000476 * (−1.83) | W*Com | 0.000103 (1.51) |
| Rho | −0.26092 *** (−3.69) | sigma2 | 0.0044461 *** (10.58) |
| Log-L | 290.75200 | n | 228 |
| Variables | Direct Effects | Indirect Effects | Total Effects |
|---|---|---|---|
| DE | 5.28 × 10⁻¹⁰ *** (4.02) | −9.61 × 10⁻¹⁰ *** (−5.76) | −4.33 × 10⁻¹⁰ ** (−2.42) |
| SES | 0.696 ** (2.37) | −0.312 (−0.90) | 0.384 (0.99) |
| Fin | 0.0114 (0.33) | −0.146 *** (−3.30) | −0.135 *** (−2.87) |
| BE | 0.0197 * (1.67) | 0.0120 (0.83) | 0.0318 * (1.90) |
| PQ | −0.0000265 (−0.70) | −0.0000170 (−0.30) | −0.0000435 (−0.69) |
| MD | −0.0000580 ** (−2.09) | 0.000110 * (1.73) | 0.0000516 (0.86) |
Disclaimer/Publisher’s Note: The statements, opinions and data contained in all publications are solely those of the individual author(s) and contributor(s) and not of MDPI and/or the editor(s). MDPI and/or the editor(s) disclaim responsibility for any injury to people or property resulting from any ideas, methods, instructions or products referred to in the content. |
© 2024 by the authors. Licensee MDPI, Basel, Switzerland. This article is an open access article distributed under the terms and conditions of the Creative Commons Attribution (CC BY) license (https://creativecommons.org/licenses/by/4.0/).
Share and Cite
Jiang, P.; Yang, Y.; Ye, W.; Liu, L.; Gu, X.; Chen, H.; Zhang, Y. Study on the Efficiency, Evolutionary Trend, and Influencing Factors of Rural–Urban Integration Development in Sichuan and Chongqing Regions under the Background of Dual Carbon. Land 2024, 13, 696. https://doi.org/10.3390/land13050696
Jiang P, Yang Y, Ye W, Liu L, Gu X, Chen H, Zhang Y. Study on the Efficiency, Evolutionary Trend, and Influencing Factors of Rural–Urban Integration Development in Sichuan and Chongqing Regions under the Background of Dual Carbon. Land. 2024; 13(5):696. https://doi.org/10.3390/land13050696
Chicago/Turabian StyleJiang, Pan, Yirui Yang, Wei Ye, Liang Liu, Xinchen Gu, Haipeng Chen, and Yuhan Zhang. 2024. "Study on the Efficiency, Evolutionary Trend, and Influencing Factors of Rural–Urban Integration Development in Sichuan and Chongqing Regions under the Background of Dual Carbon" Land 13, no. 5: 696. https://doi.org/10.3390/land13050696
APA StyleJiang, P., Yang, Y., Ye, W., Liu, L., Gu, X., Chen, H., & Zhang, Y. (2024). Study on the Efficiency, Evolutionary Trend, and Influencing Factors of Rural–Urban Integration Development in Sichuan and Chongqing Regions under the Background of Dual Carbon. Land, 13(5), 696. https://doi.org/10.3390/land13050696