


Identification of Critical Areas of Openness–Vitality Intensity Imbalance in Waterfront Spaces and Prioritization of Interventions: A Case Study of Xiangjiang River in Changsha, China


Abstract
1. Introduction
2. Materials
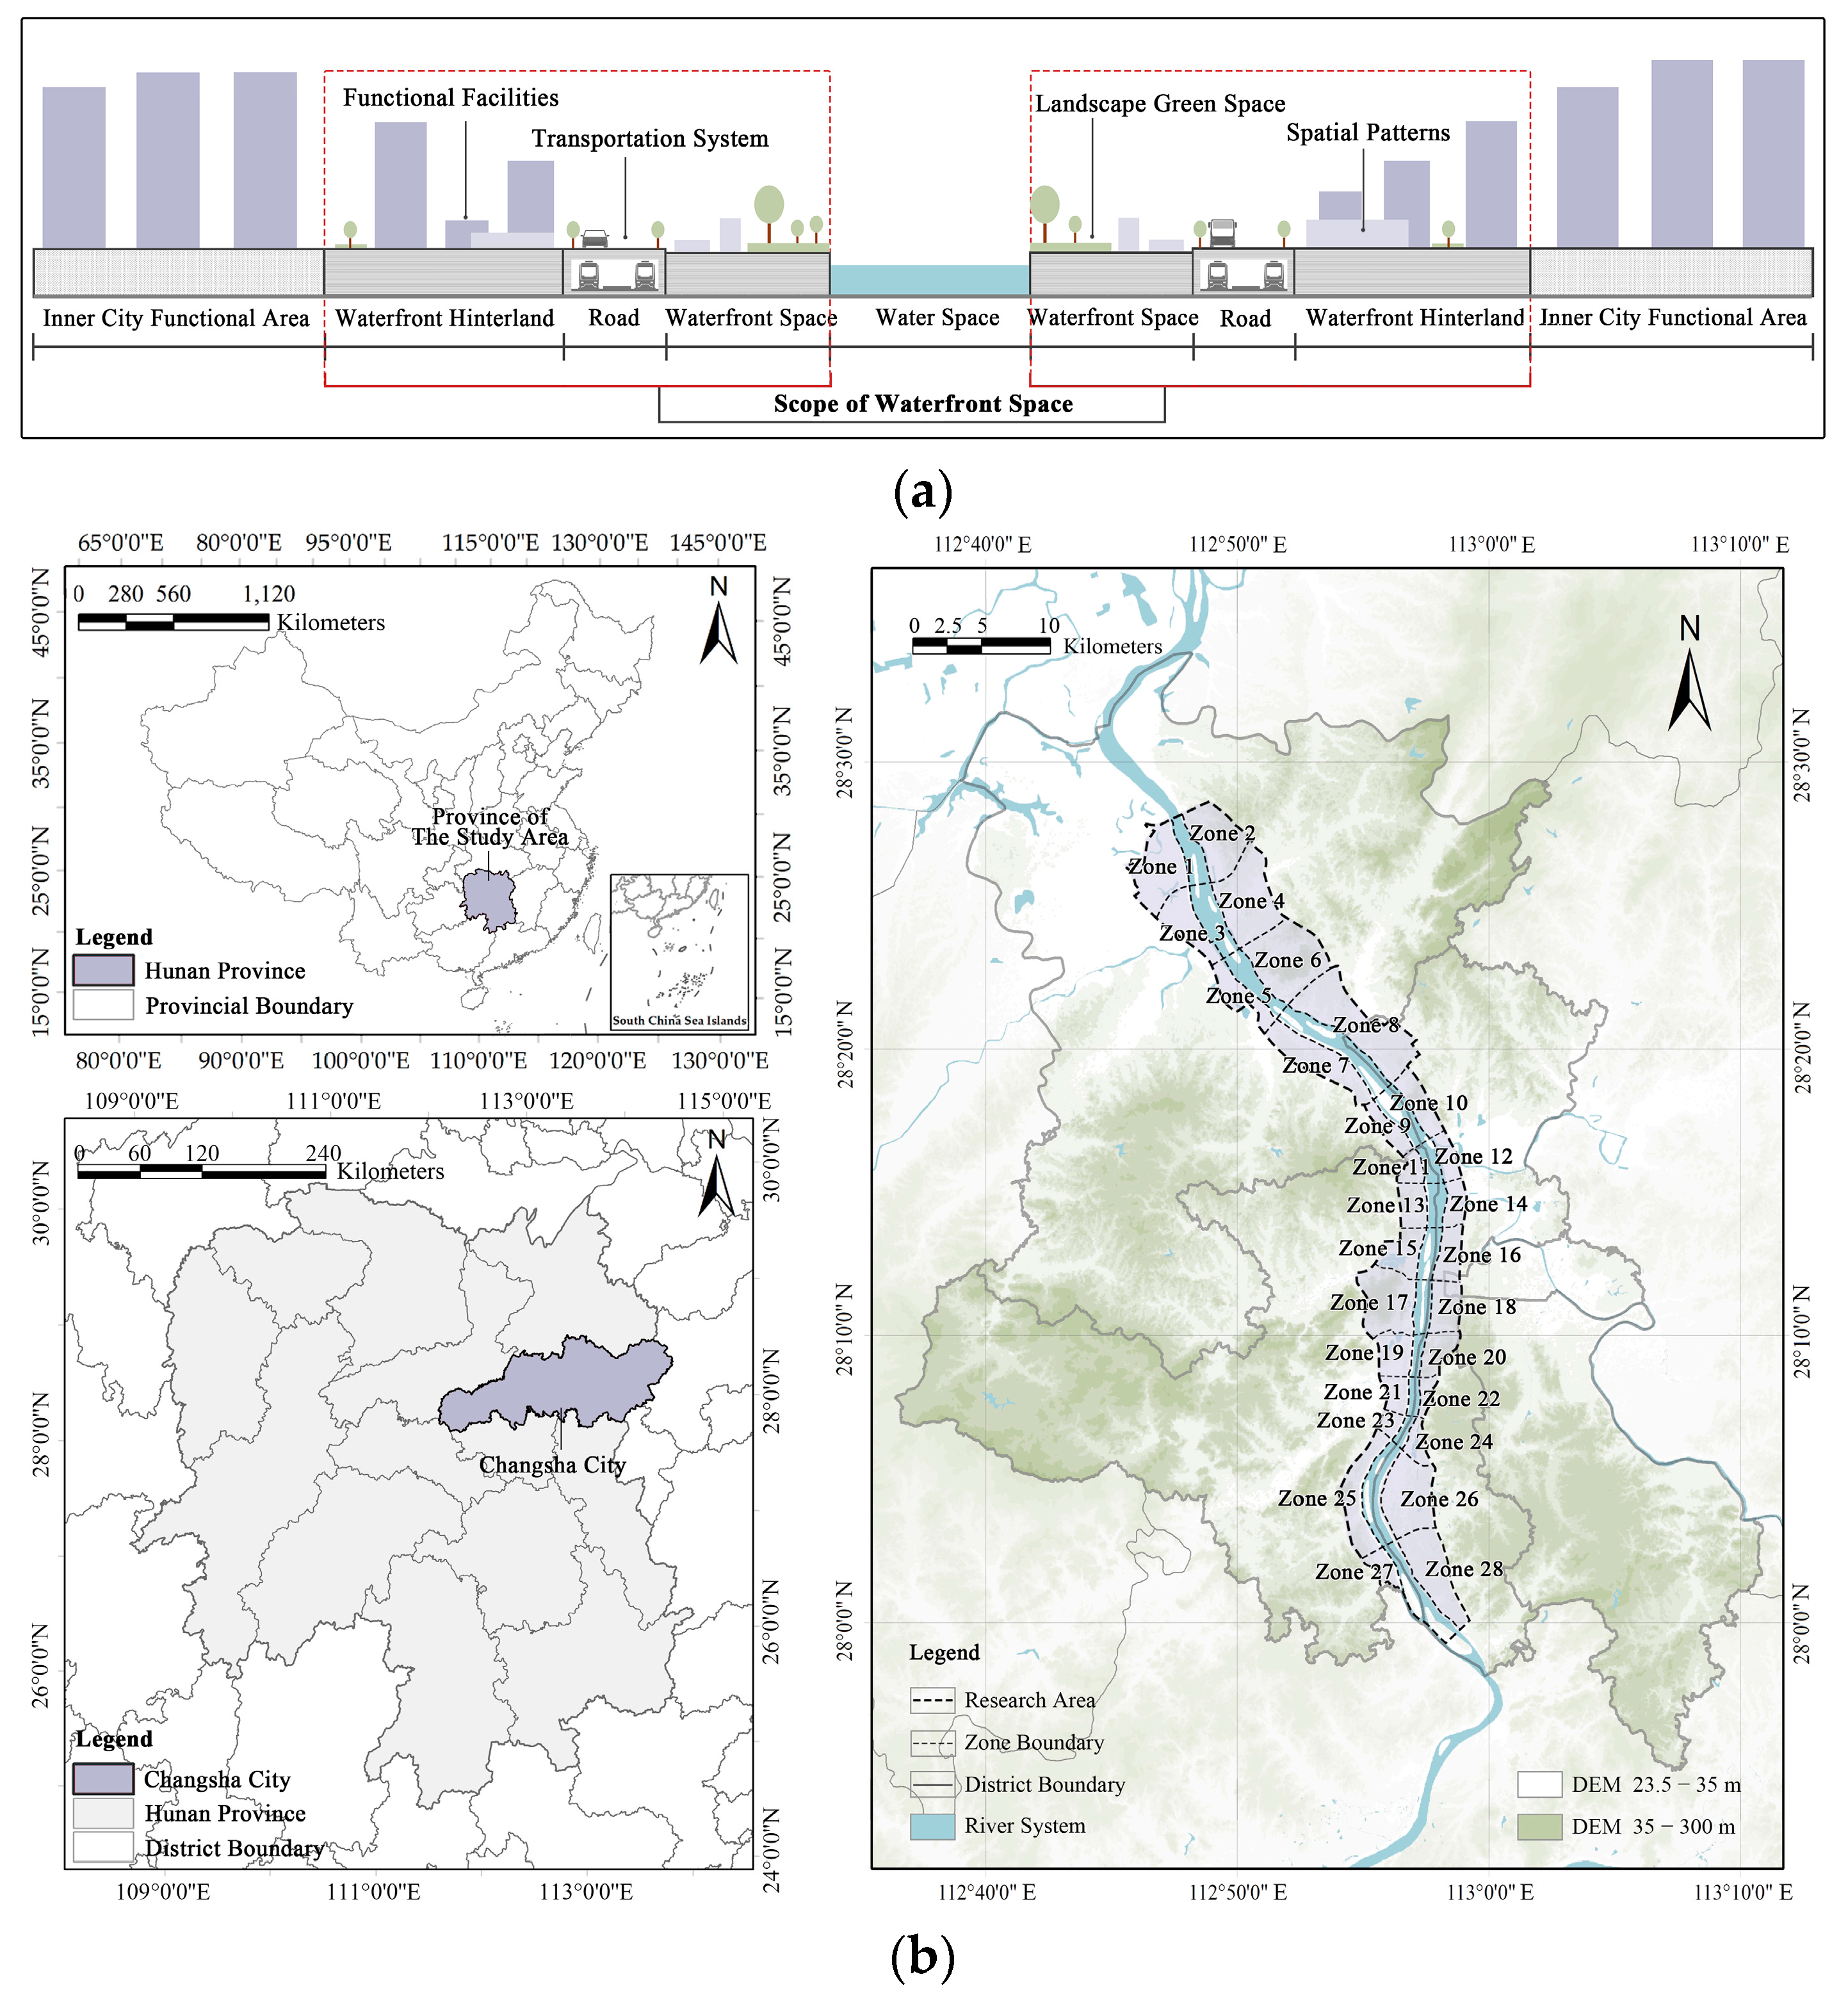
2.1. Study Area
2.2. Data Sources and Pre-Processing
3. Methods
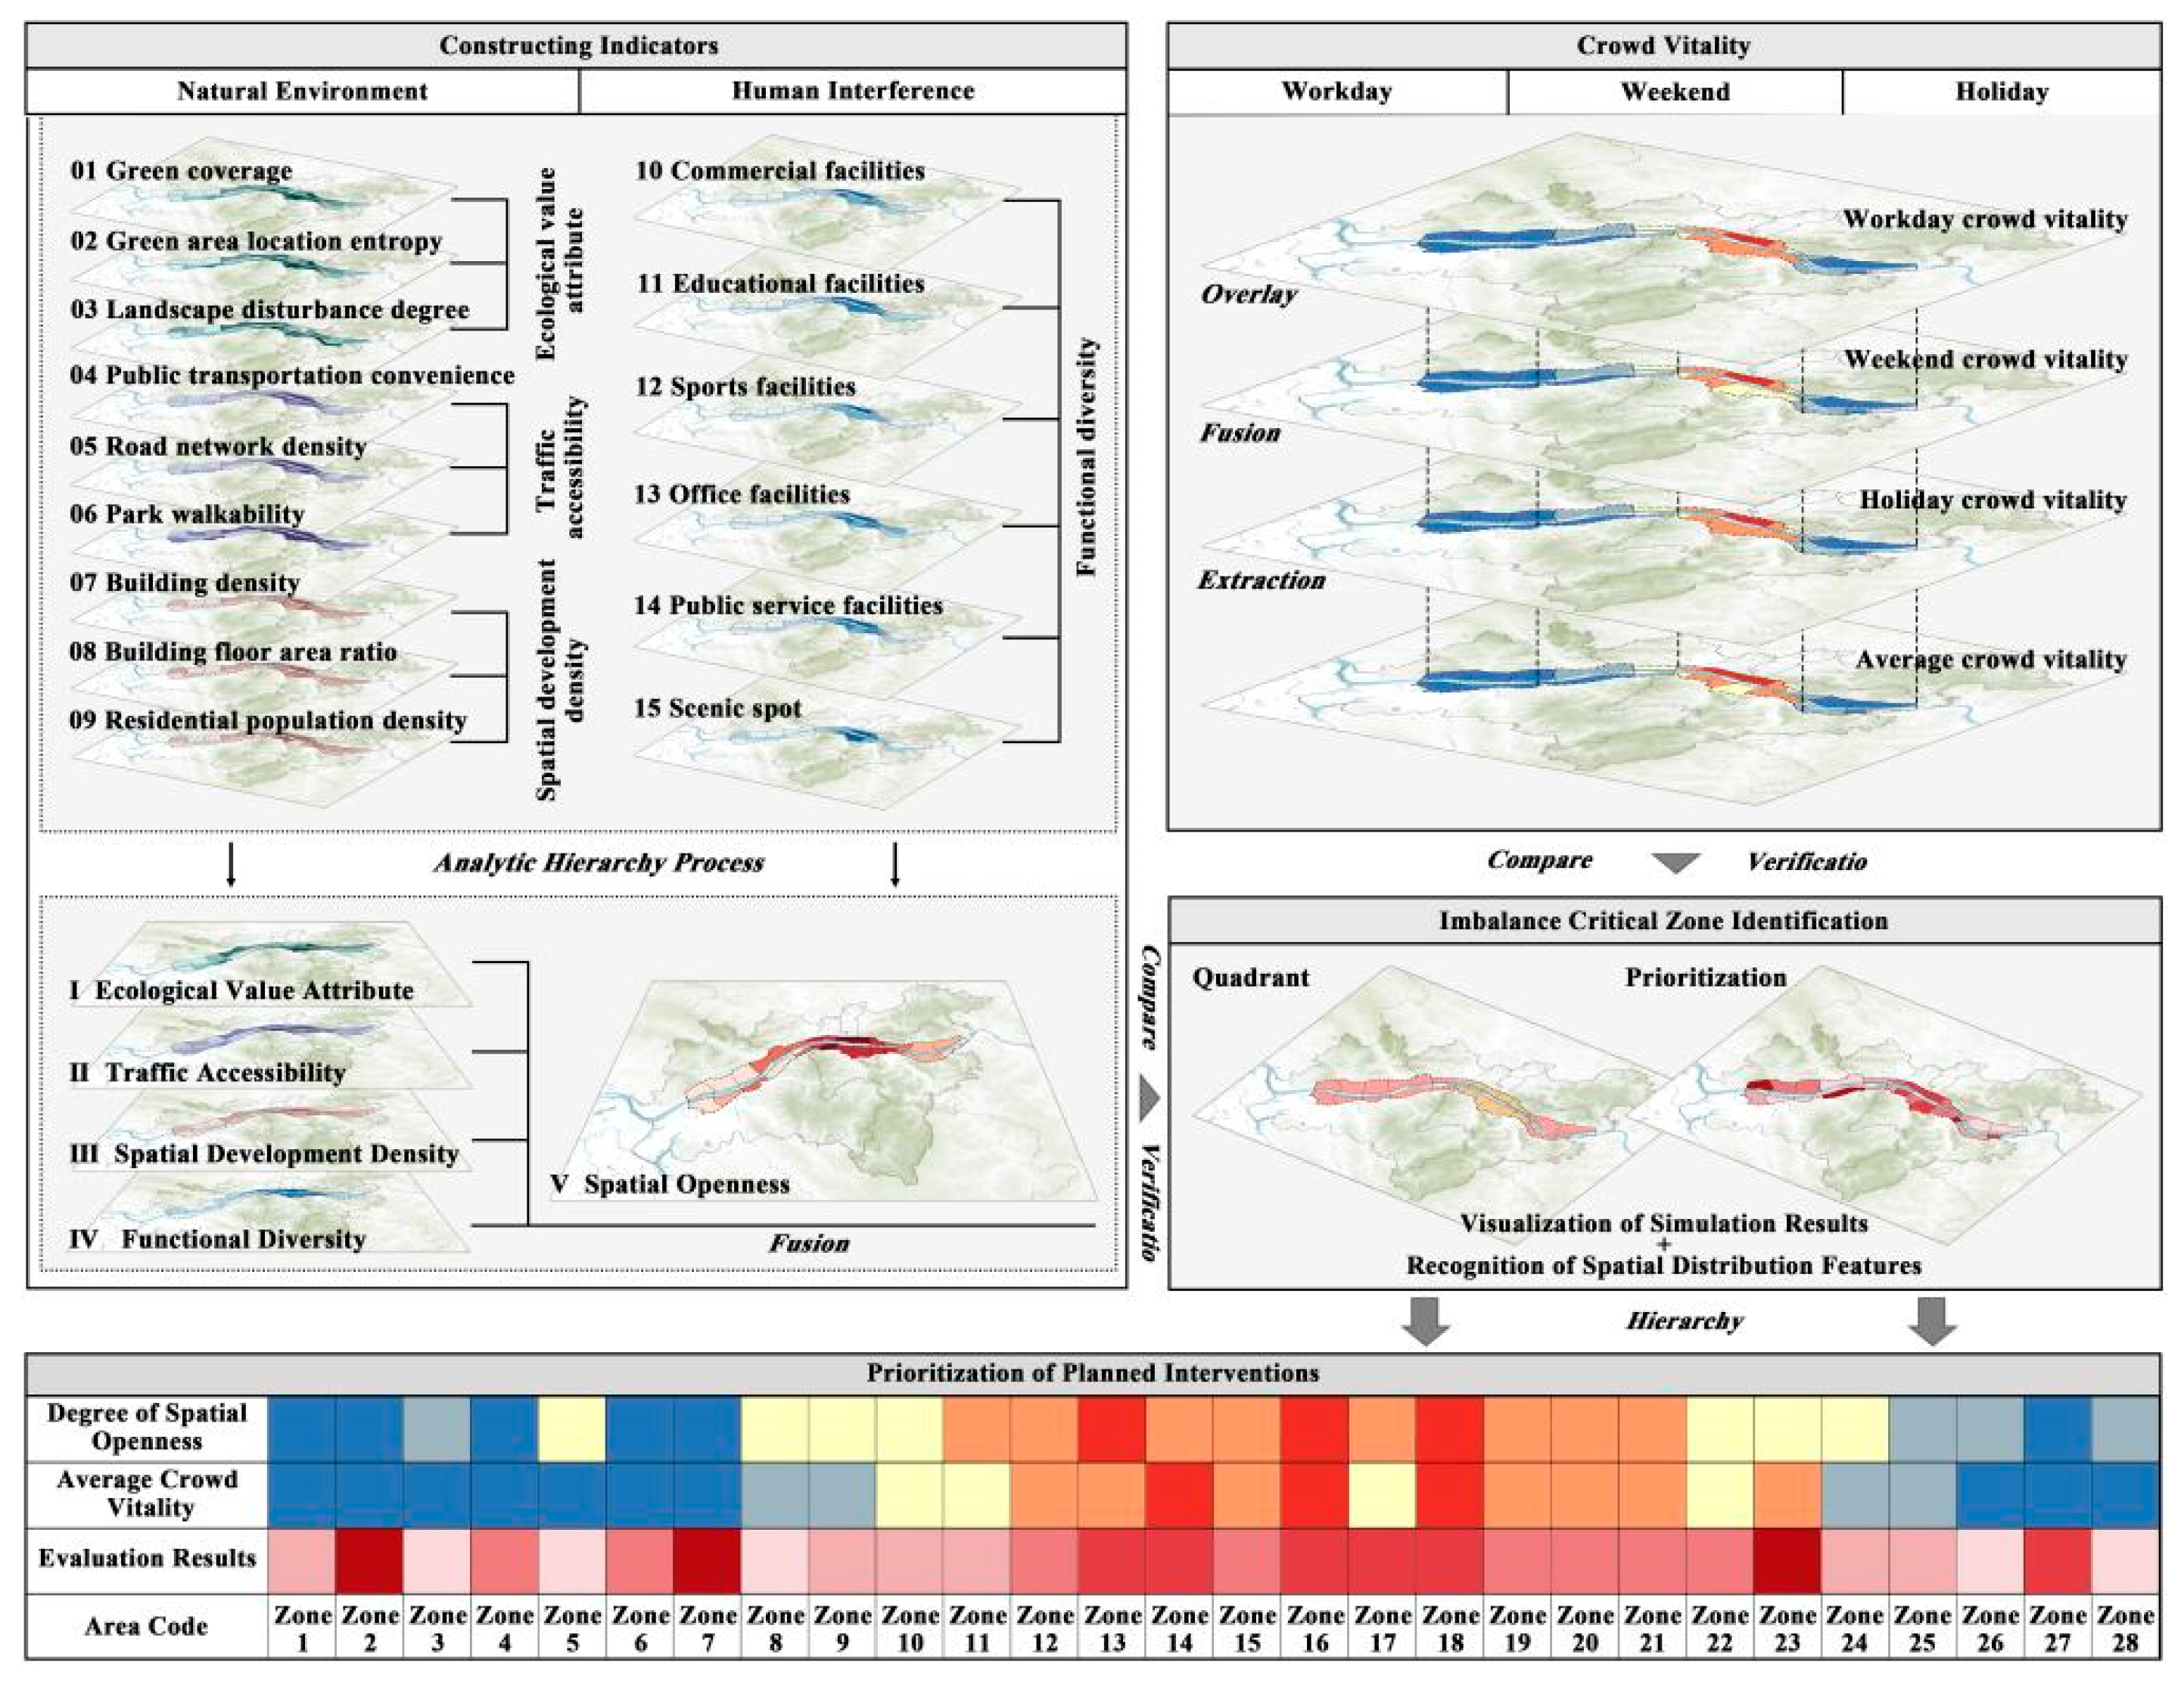
3.1. Research Framework
3.2. Methodology
3.2.1. Construction of Evaluation Indicator System for Openness of Waterfront Space
- Ecological value attribute analysis
- 2.
- Traffic accessibility analysis
- 3.
- Spatial development intensity analysis
- 4.
- Functional diversity analysis
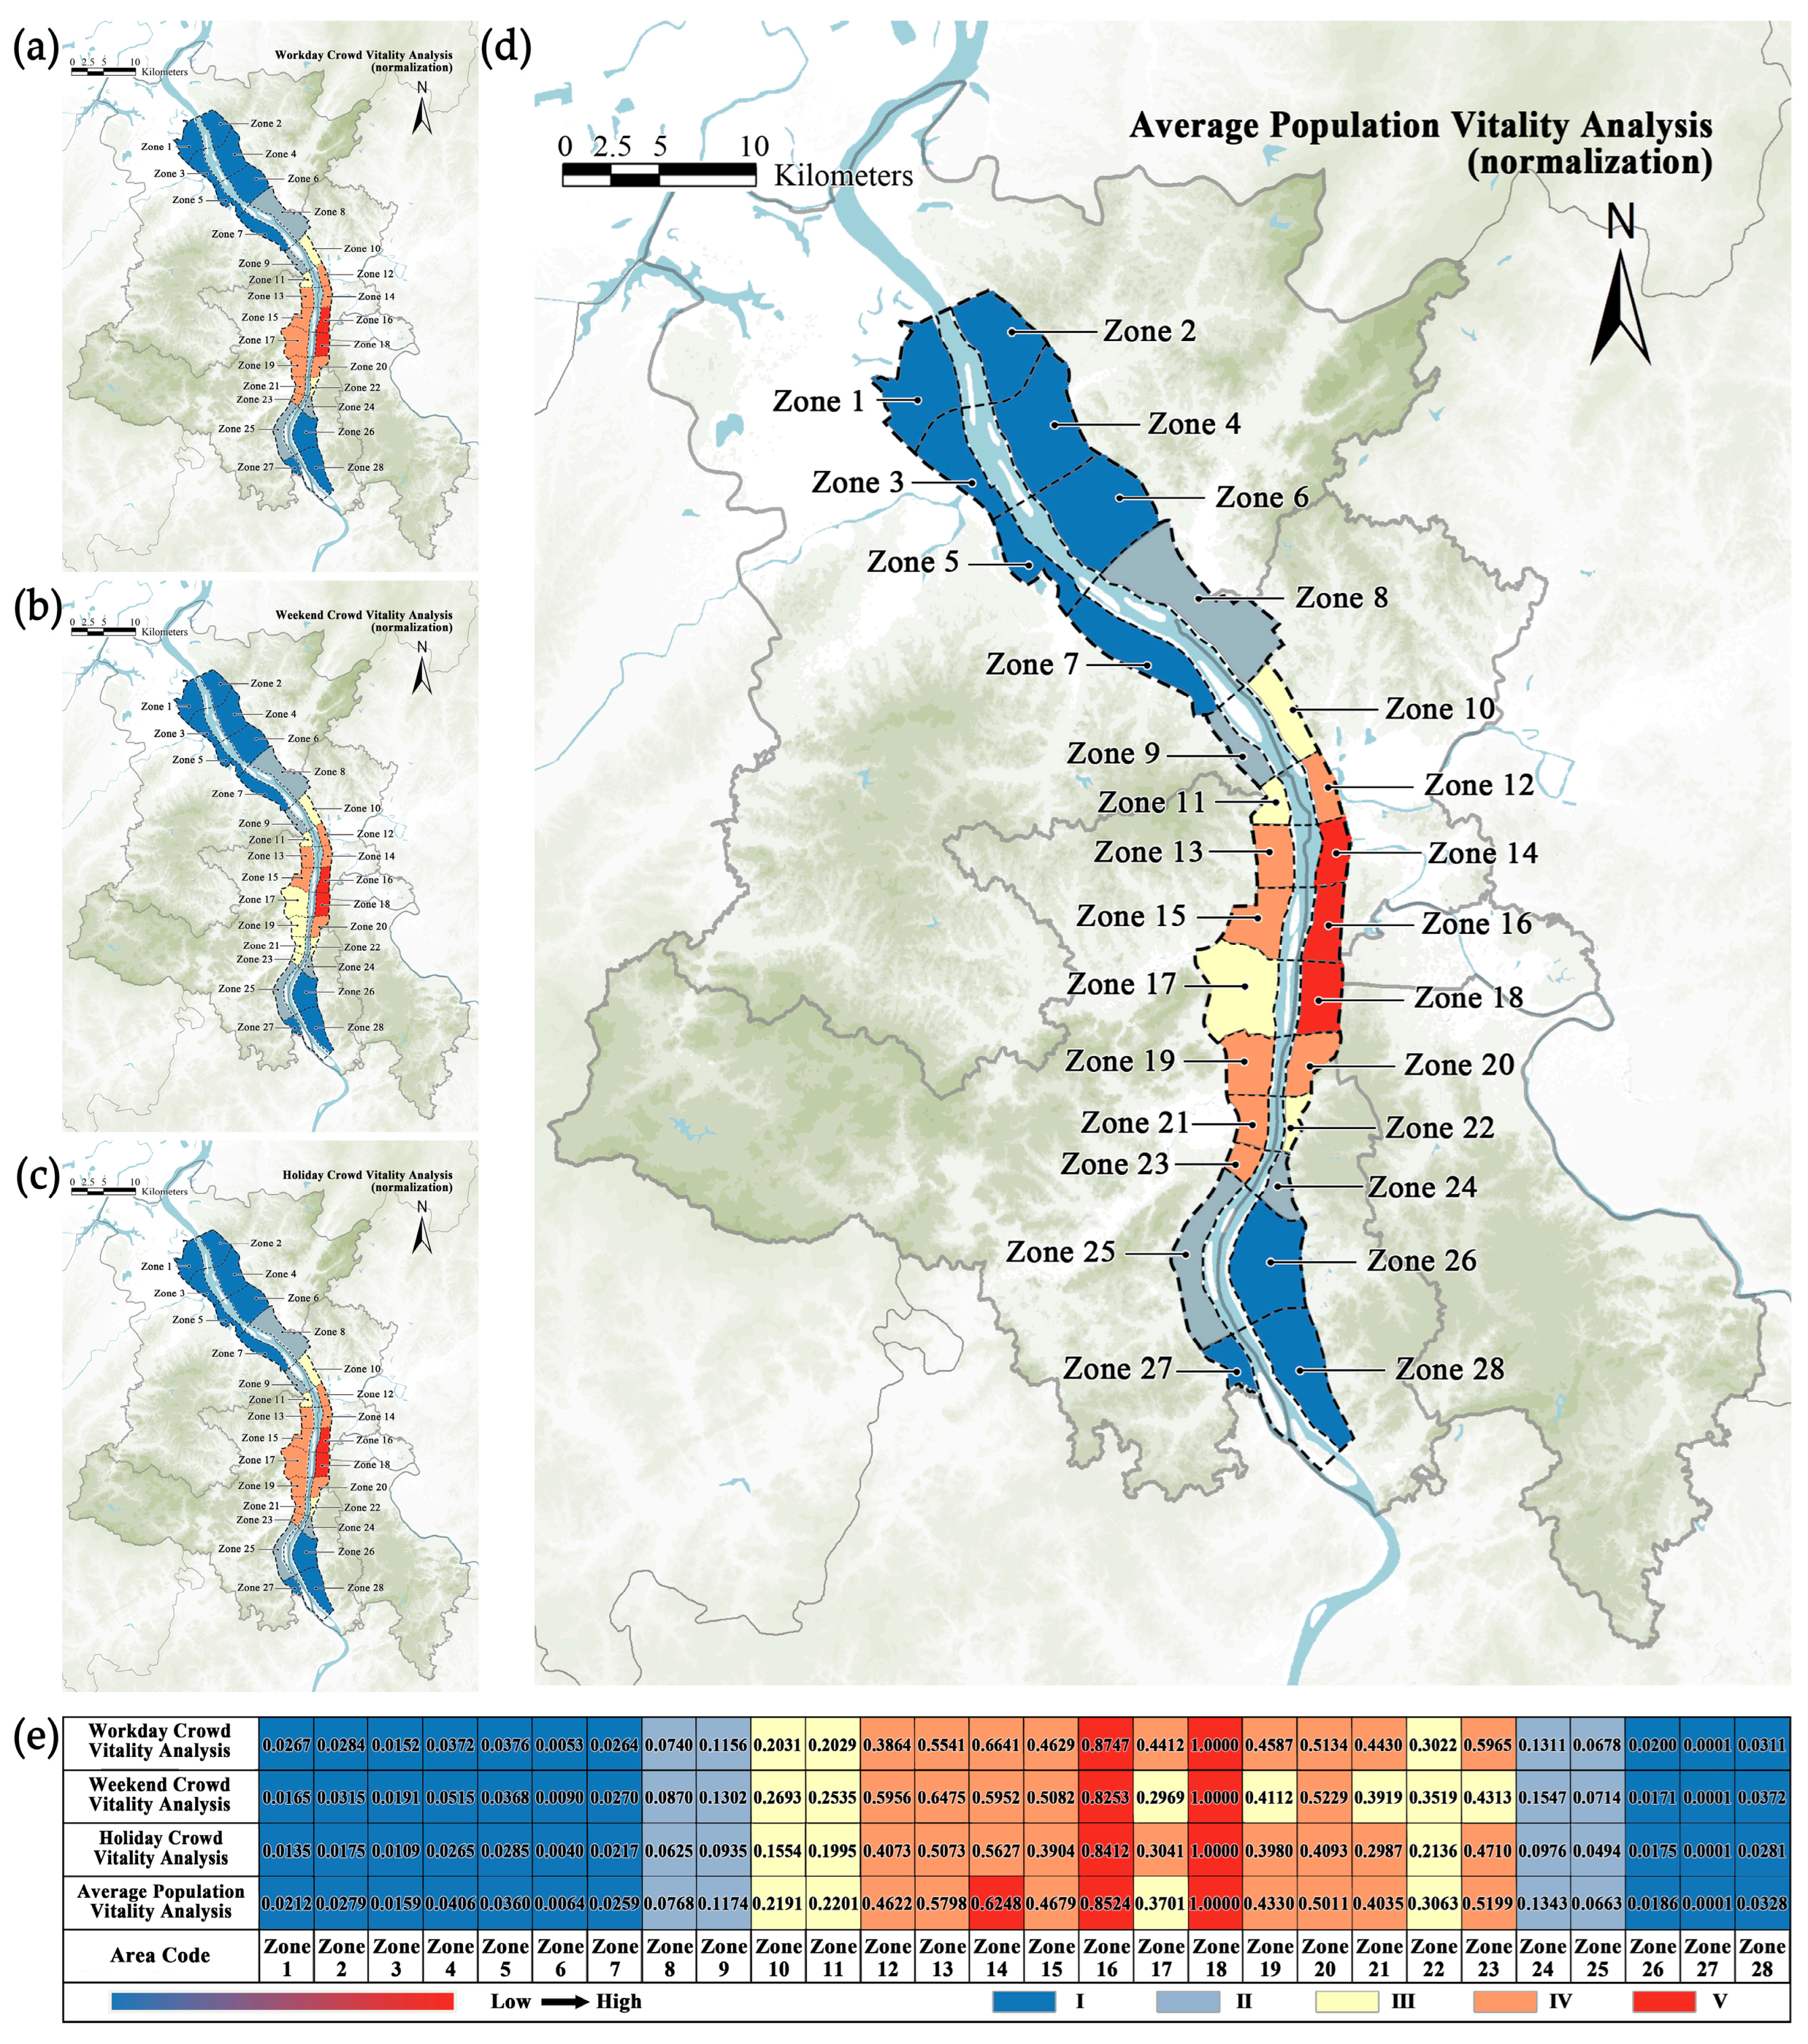
3.2.2. Calculation of Average Crowd Vitality Intensity in Waterfront Spaces
3.2.3. Determination of Indicator Weights
3.2.4. Z-Score Normalization
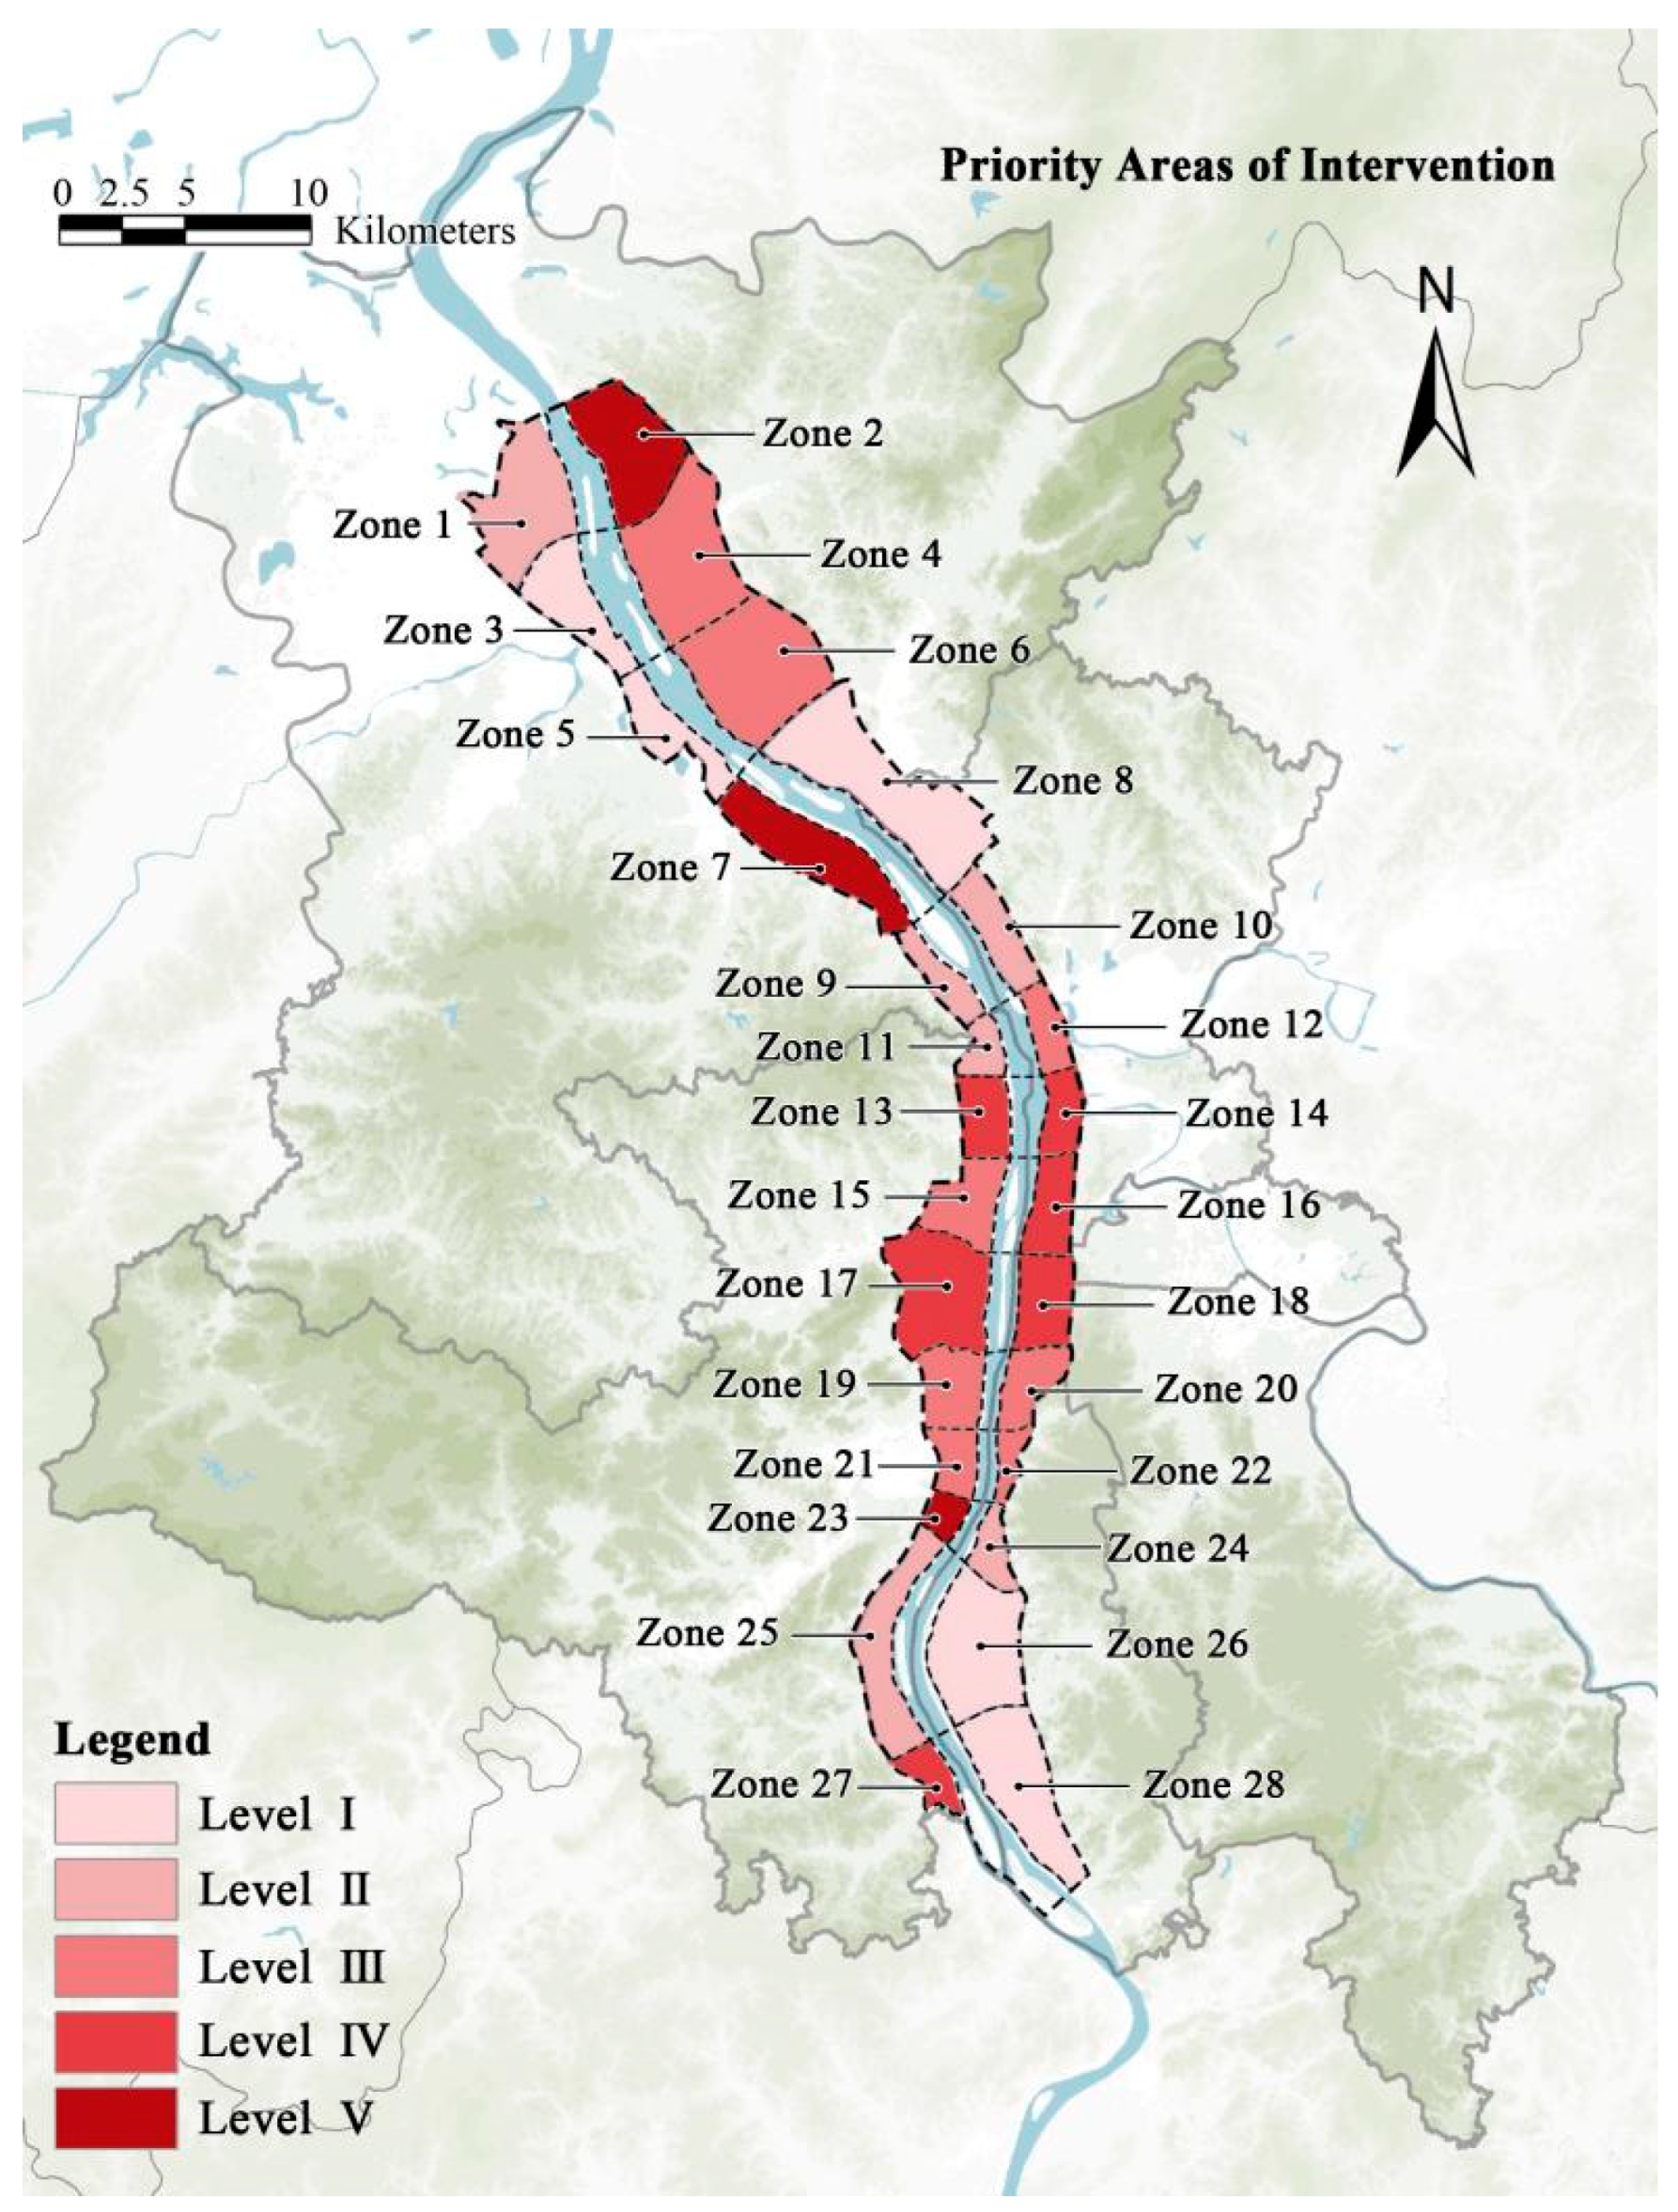
3.2.5. Prioritization of Planning Interventions
4. Results
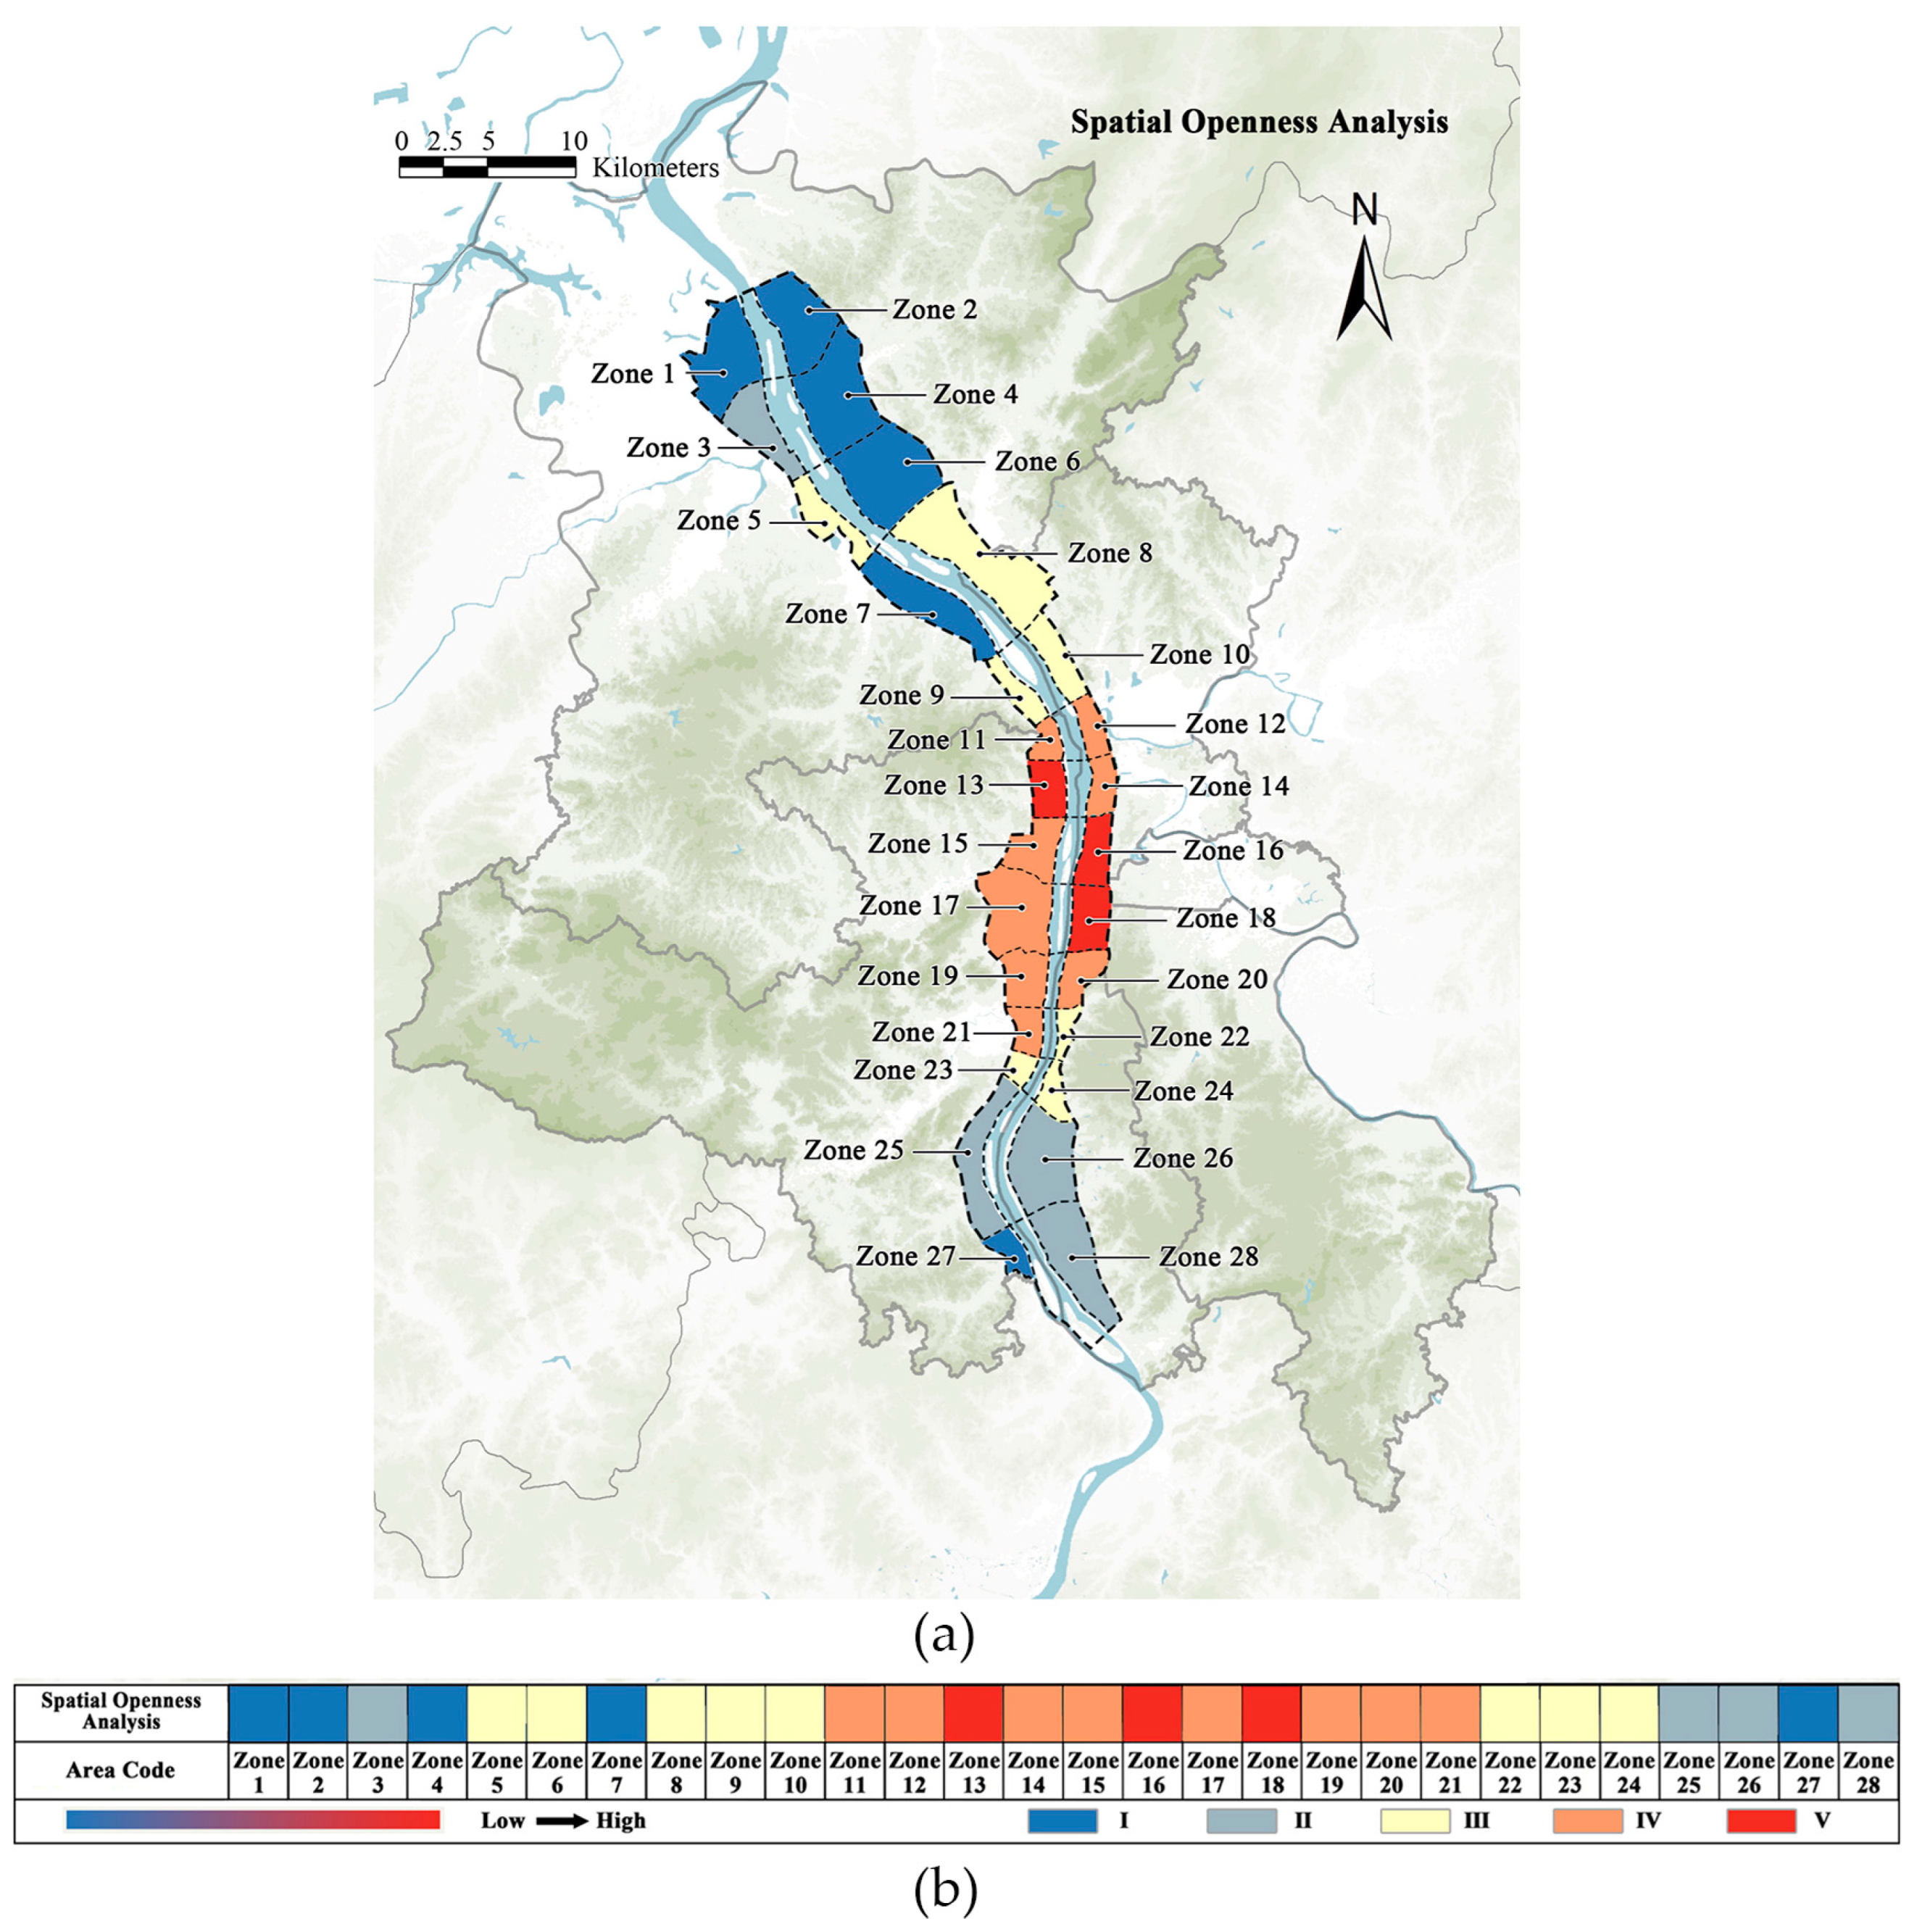
4.1. Calculation of Waterfront Space Openness
4.1.1. Ecological Value Attribute Analysis
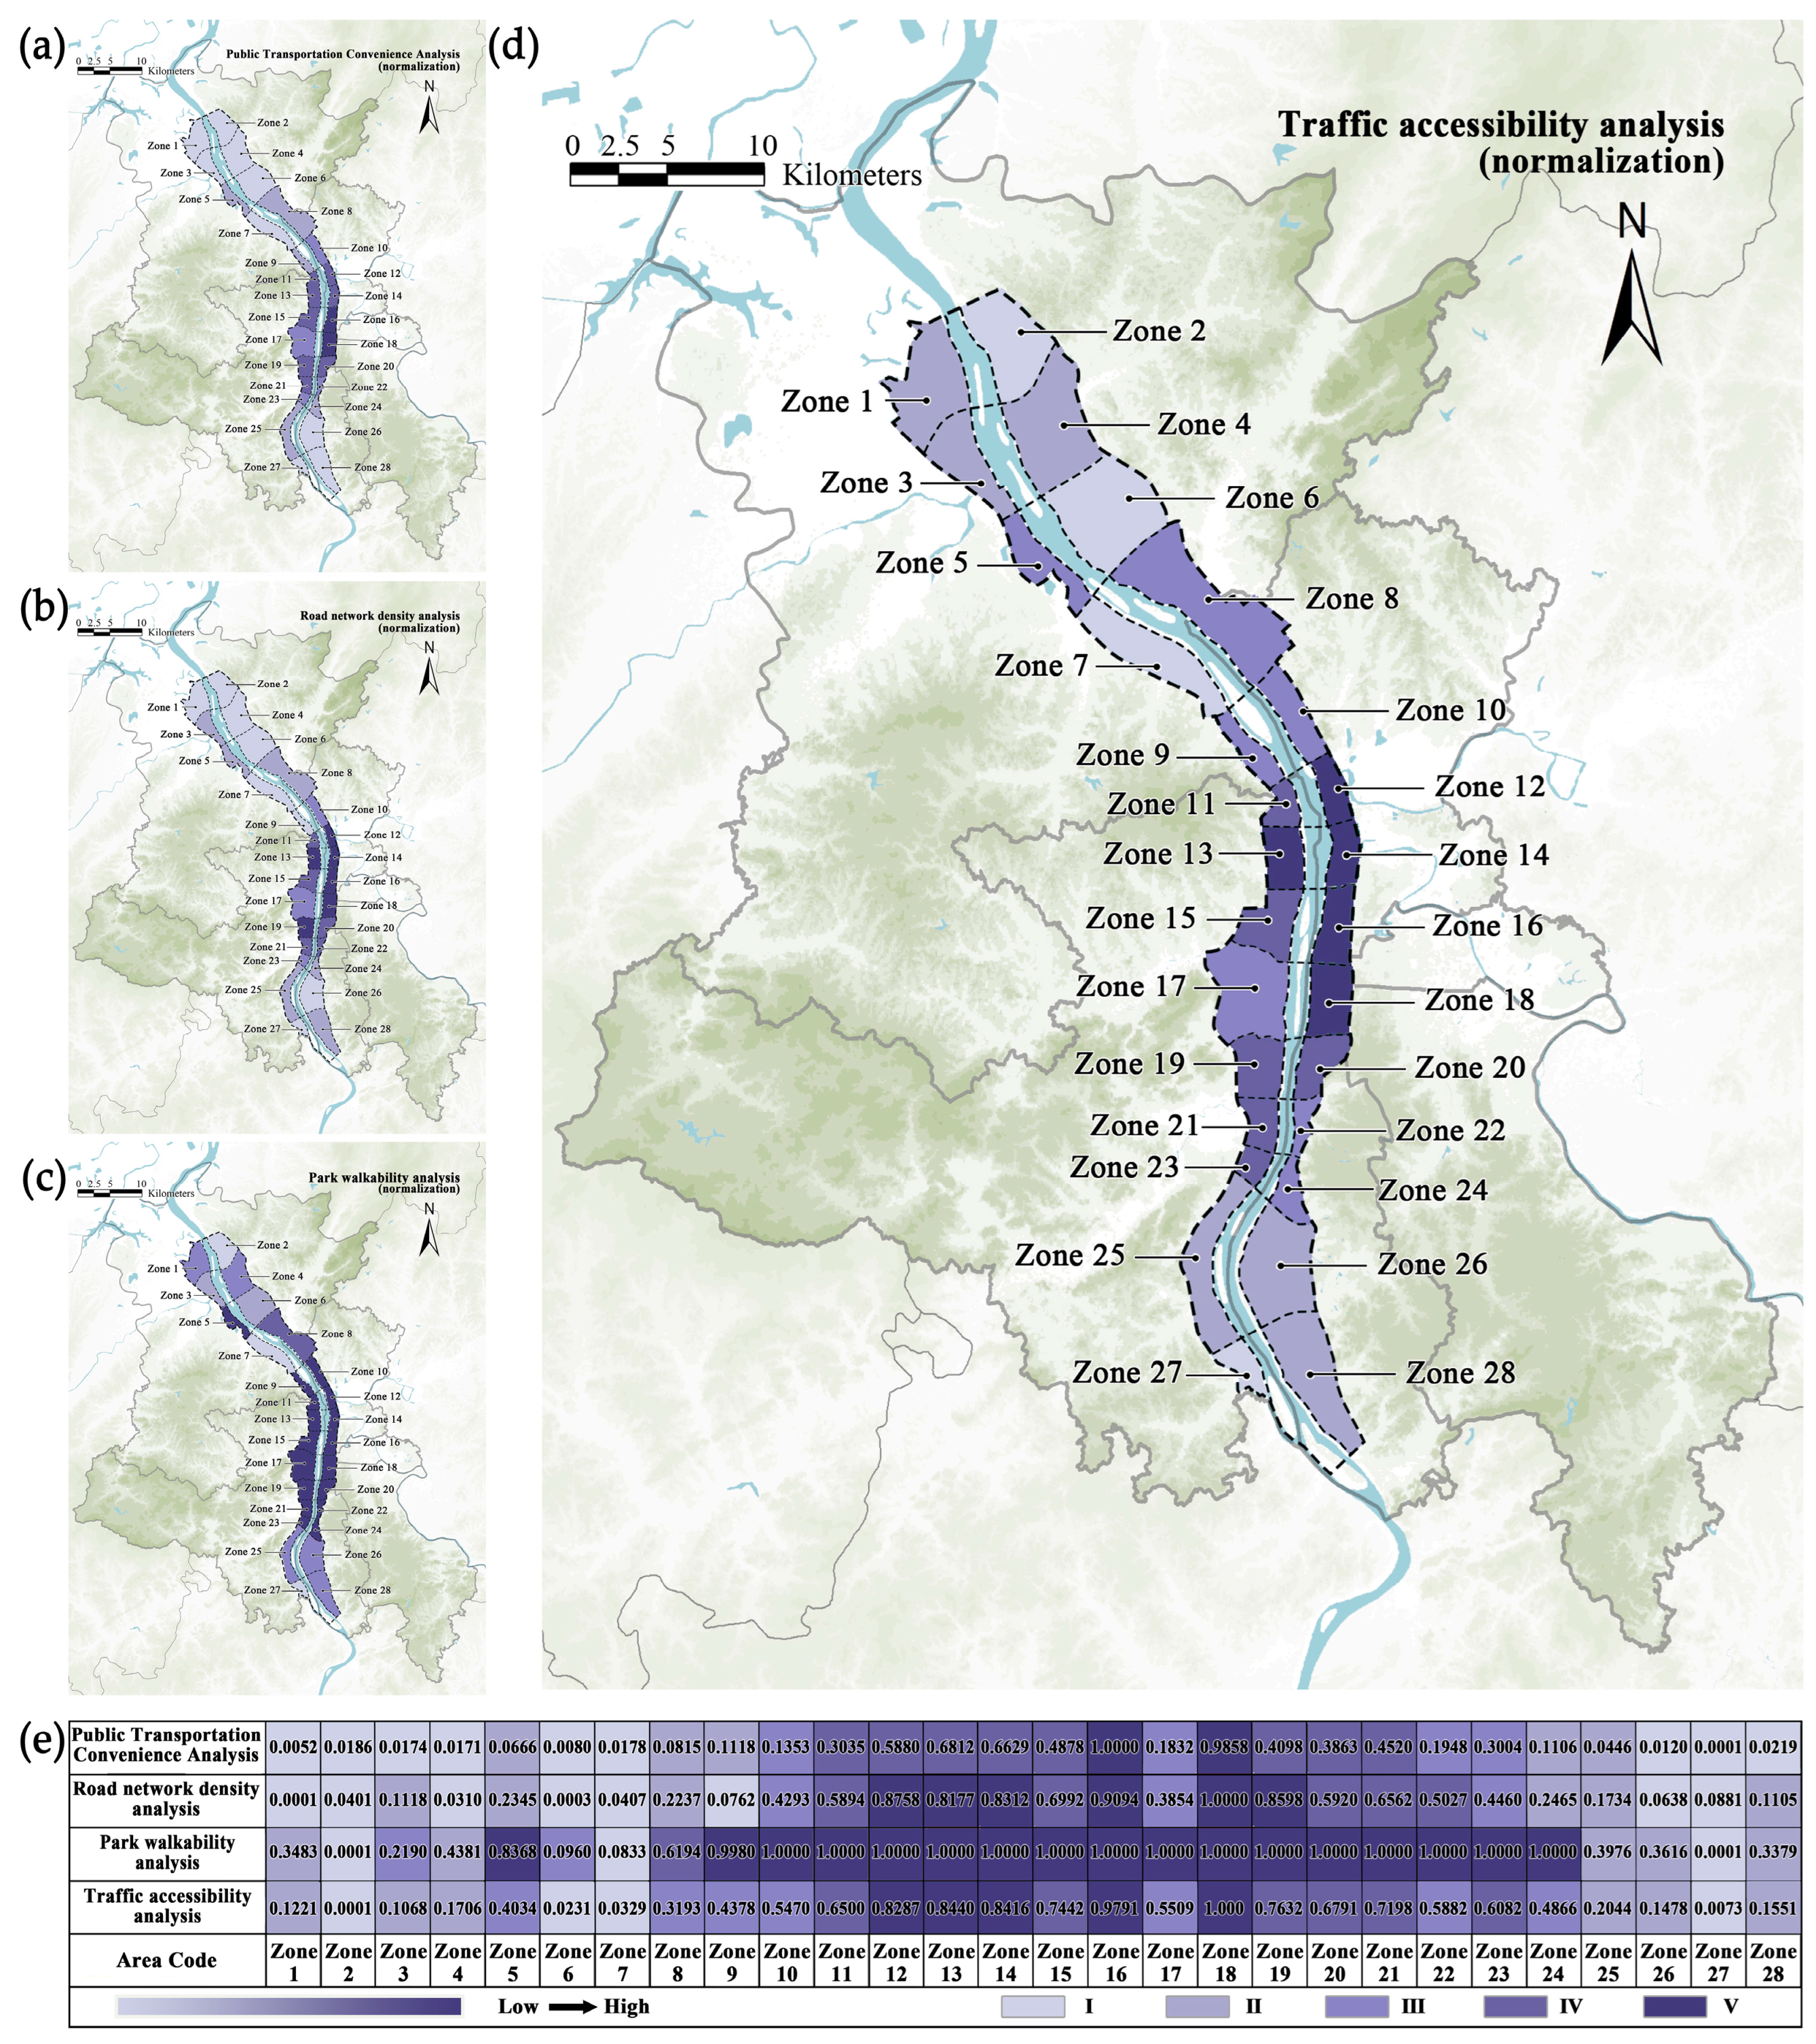
4.1.2. Traffic Accessibility Analysis
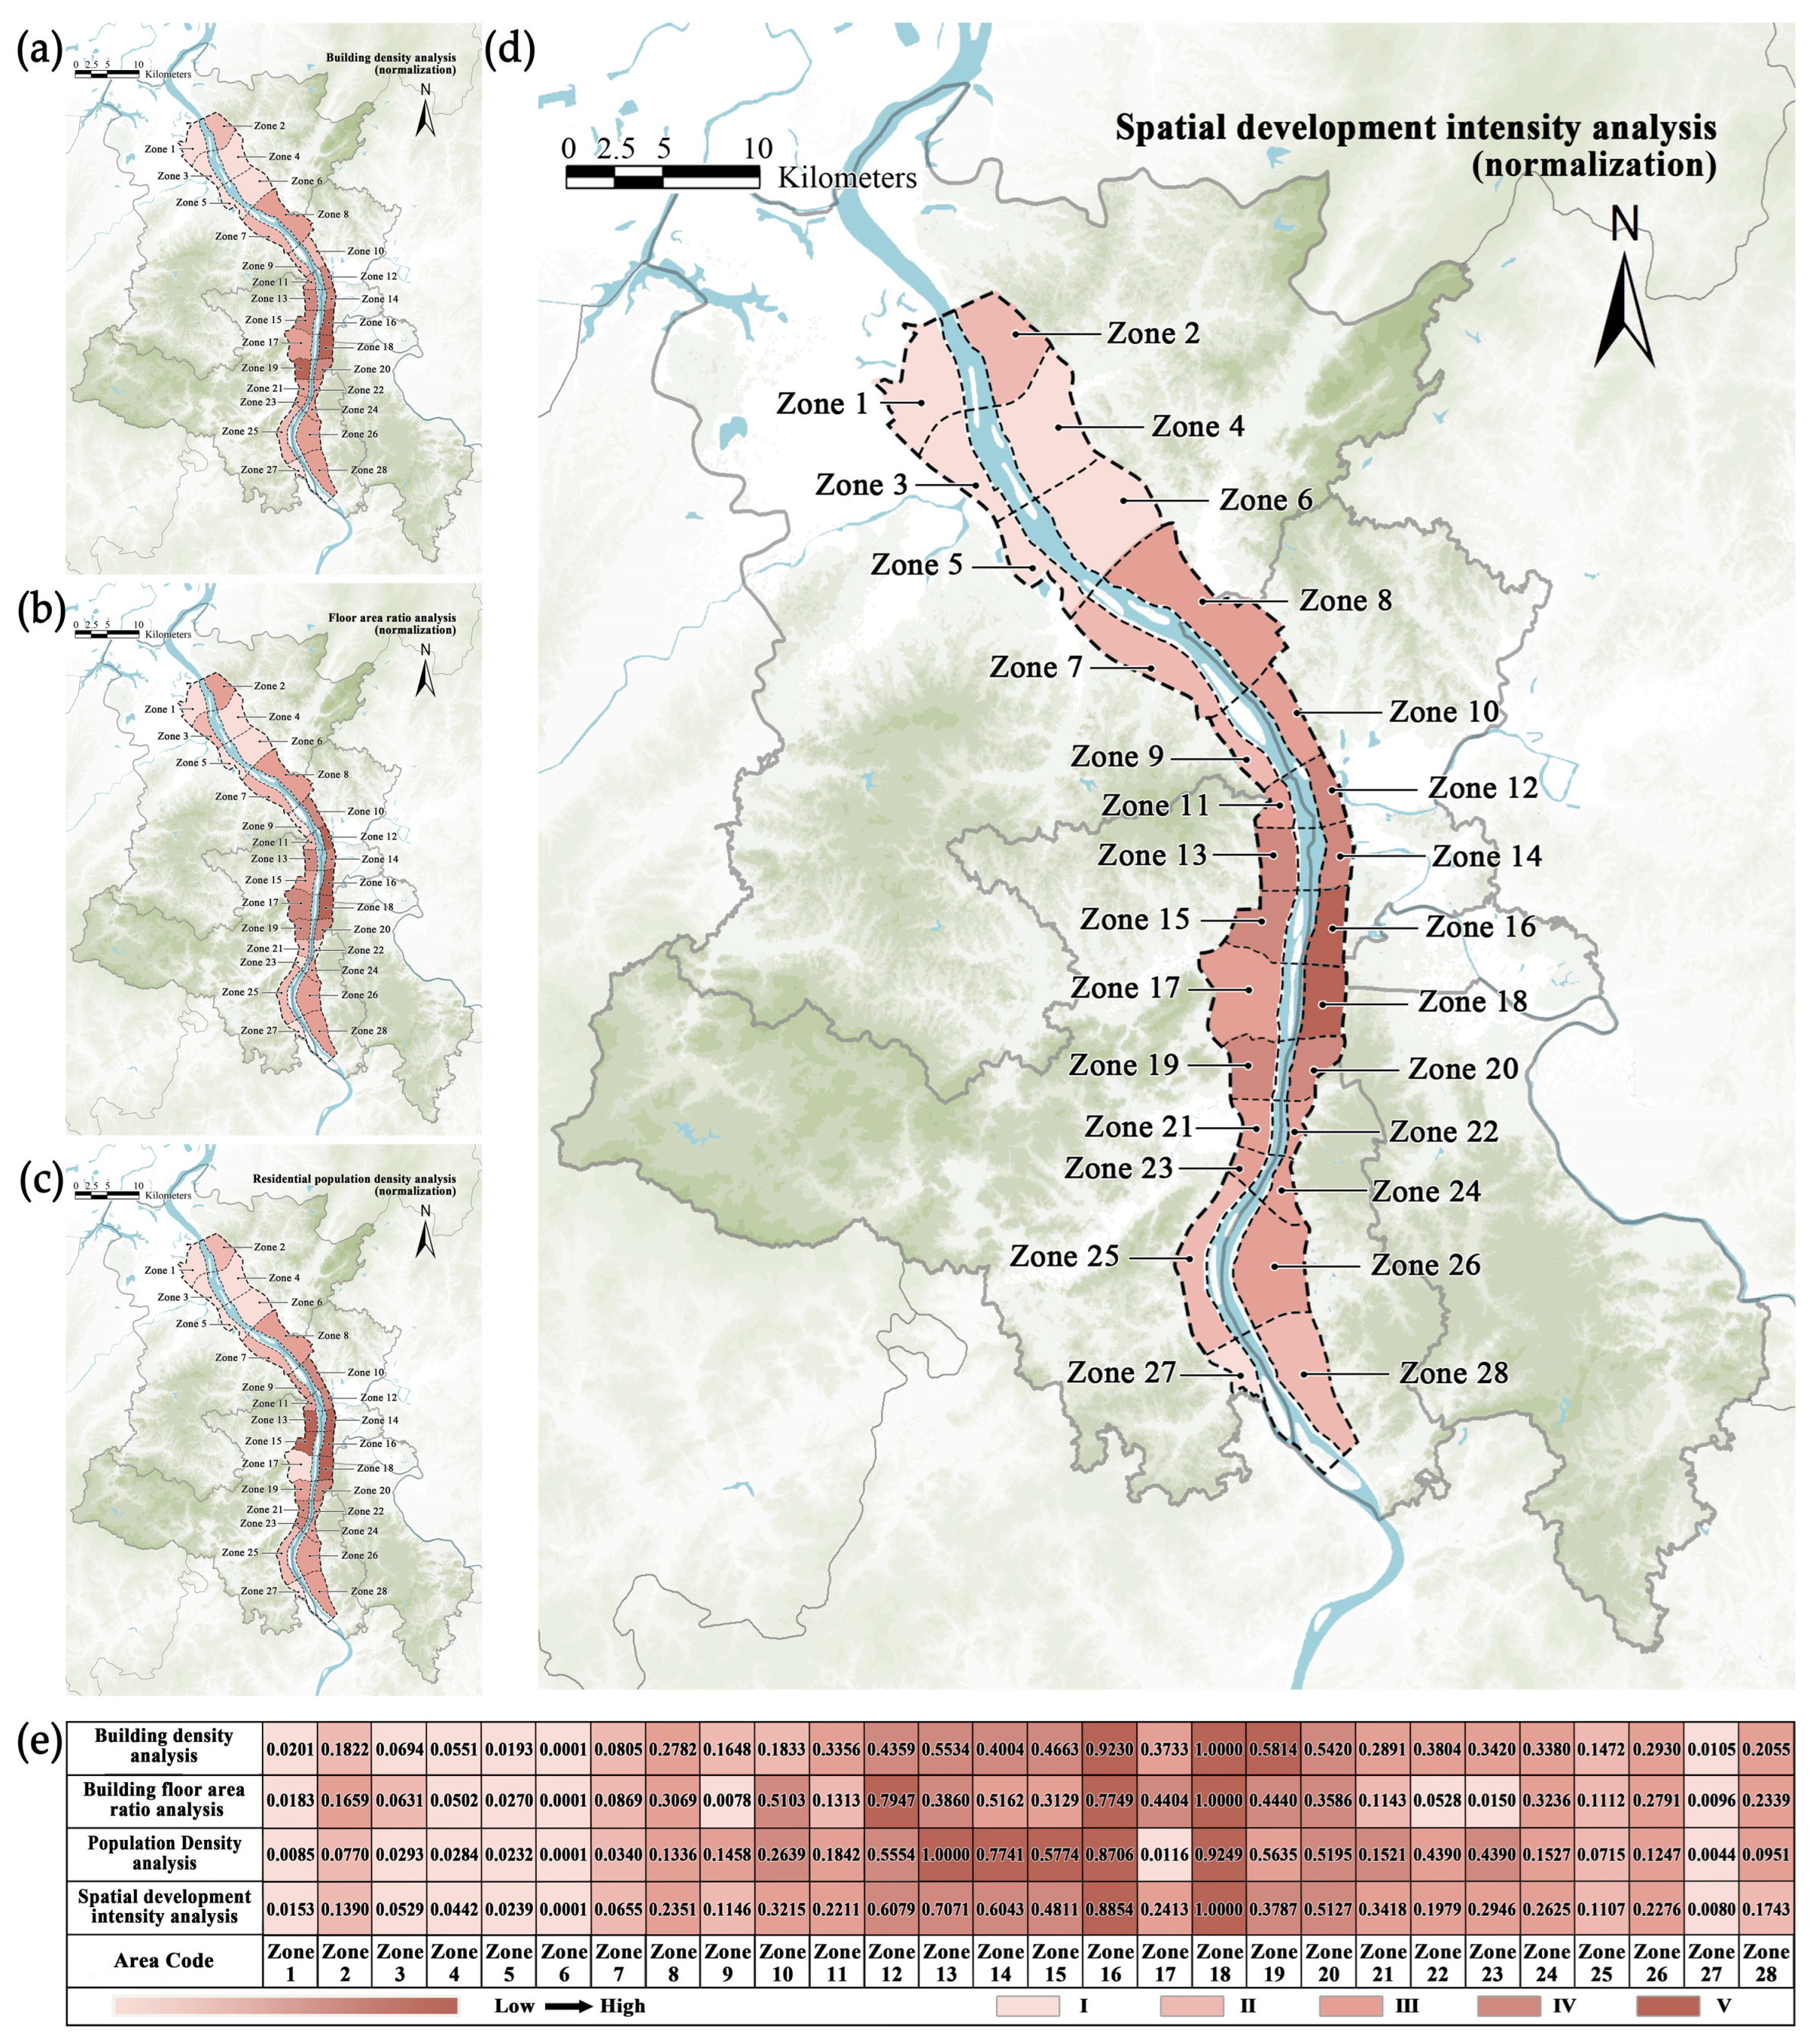
4.1.3. Spatial Development Intensity Analysis
4.1.4. Functional Diversity Degree Analysis
4.2. Analysis of the Openness of Xiangjiang River Waterfront Space
4.3. Analysis of Average Crowd Vitality in Xiangjiang River Waterfront Space
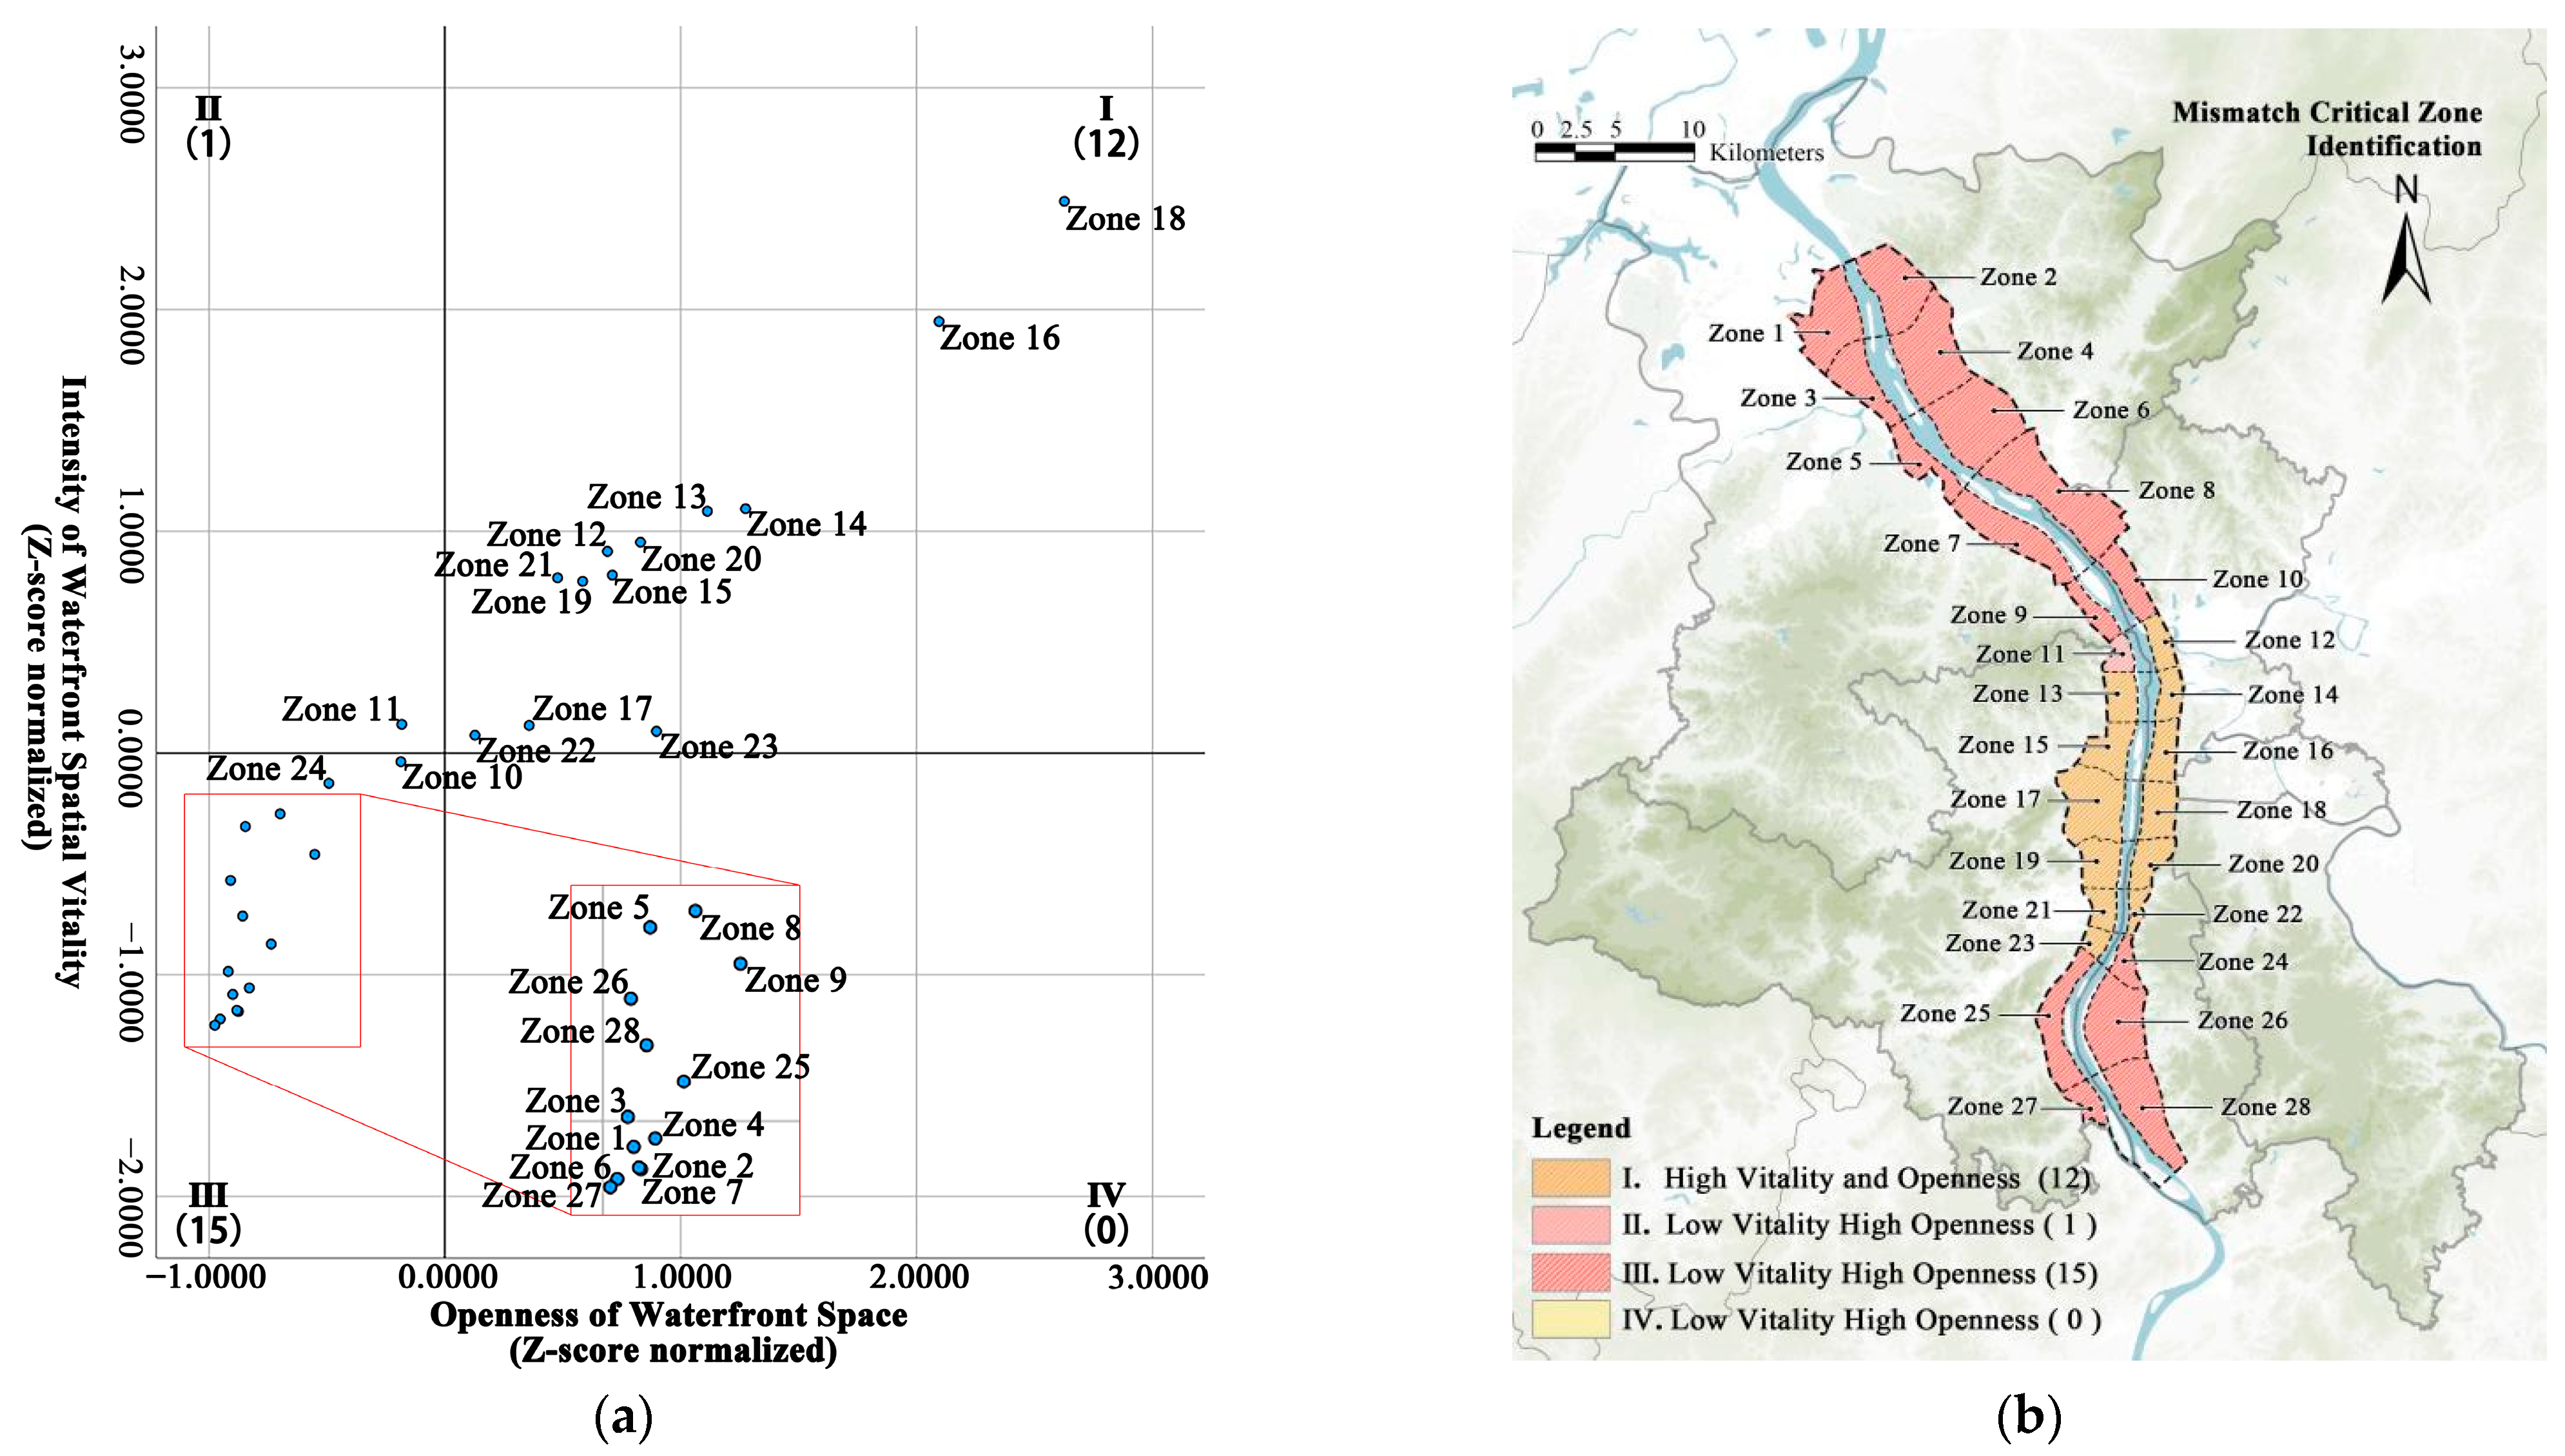
4.4. Mismatch Critical Zone Identification
4.5. Prioritization of Planning Interventions
5. Discussion
6. Conclusions
Author Contributions
Funding
Data Availability Statement
Acknowledgments
Conflicts of Interest
References
- Cheung, D.M.W.; Tang, B.S. Social order, leisure, or tourist attraction? The changing planning missions for waterfront space in Hong Kong. Habitat Int. 2015, 47, 231–240. [Google Scholar] [CrossRef]
- Niu, Y.X.; Mi, X.Y.; Wang, Z. Vitality evaluation of the waterfront space in the ancient of Suzhou. Front. Archit. Res. 2021, 10, 729–740. [Google Scholar] [CrossRef]
- Wu, J.; Chen, X.R.; Chen, S.L. Temporal Characteristics of Waterfronts in Wuhan City and People’s Behavioral Preferences Based on Social Media Data. Sustainability 2019, 11, 6308. [Google Scholar] [CrossRef]
- Chen, L.L.; Liu, Y.; Leng, H.; Xu, S.N.; Wang, Y.C. Current and Expected Value Assessment of the Waterfront Urban Design: A Case Study of the Comprehensive Urban Design of Beijing’s Waterfront. Land 2023, 12, 85. [Google Scholar] [CrossRef]
- Woo, S.W.; Omran, A.; Lee, C.L.; Hanafi, M.H. The impacts of the waterfront development in Iskandar Malaysia. Environ. Dev. Sustain. 2017, 19, 1293–1306. [Google Scholar] [CrossRef]
- Morton, L.W.; Olson, K.R. Settlement, development, despoilment, and recovery of the Hudson River, New York. J. Soil Water Conserv. 2020, 75, 13A–19A. [Google Scholar] [CrossRef]
- Hutcheson, W.; Hoagland, P.; Jin, D. Valuing environmental education as a cultural ecosystem service at Hudson River Park. Ecosyst. Serv. 2018, 31, 387–394. [Google Scholar] [CrossRef]
- Zhang, J.Y.; Song, J.S.; Fan, Z.Y. The Study of Historical Progression in the Distribution of Urban Commercial Space Locations-Example of Paris. Sustainability 2023, 15, 4499. [Google Scholar] [CrossRef]
- Xu, H.S.; Cai, C.L.; Du, H.Y.; Guo, Y.P. Responses of water quality to land use in riparian buffers: A case study of Huangpu River, China. GeoJournal 2021, 86, 1657–1669. [Google Scholar] [CrossRef]
- Liu, S.; Lai, S.Q.; Liu, C.; Li, J. What influenced the vitality of the waterfront open space? A case study of Huangpu River in Shanghai, China. Cities 2021, 114, 10. [Google Scholar] [CrossRef]
- Xiao, Y.L. Urban Waterfront Revitalization—A Case Study of Downtown Waterfront in Rochester, New York. Master’s Thesis, Rochester Institute of Technology Rochester, Rochester, NY, USA, 2023. [Google Scholar]
- Üzümcüoglu, D.; Polay, M. The Assessment of Creative Waterfronts: A Case Study of the Kyrenia Waterfront. Sustainability 2022, 14, 11906. [Google Scholar] [CrossRef]
- Huang, D.Q.; Liu, Z.; Zhao, X.S.; Zhao, P.J. Emerging polycentric megacity in China: An examination of employment subcenters and their influence on population distribution in Beijing. Cities 2017, 69, 36–45. [Google Scholar] [CrossRef]
- Zhai, W.Y.; Zhang, K.L.; Gou, F.C.; Cheng, H.B.; Li, Z.G.; Zhang, Y. Examining supply-demand imbalances and social inequalities of regulating ecosystem services in high-density cities: A case study of Wuhan, China. Ecol. Indic. 2023, 154, 12. [Google Scholar] [CrossRef]
- Yin, G.M.; Huang, Z.; Yang, L.; Ben-Elia, E.; Xu, L.Y.; Scheuer, B.; Liu, Y. How to quantify the travel ratio of urban public transport at a high spatial resolution? A novel computational framework with geospatial big data. Int. J. Appl. Earth Obs. Geoinf. 2023, 118, 11. [Google Scholar] [CrossRef]
- Tang, B.S. Explaining the inequitable spatial distribution of public open space in Hong Kong. Landsc. Urban Plan. 2017, 161, 80–89. [Google Scholar] [CrossRef]
- Xia, H.C.; Yin, R.; Xia, T.Y.; Zhao, B.; Qiu, B. People-Oriented: A Framework for Evaluating the Level of Green Space Provision in the Life Circle from a Supply and Demand Perspective: A Case Study of Gulou District, Nanjing, China. Sustainability 2024, 16, 955. [Google Scholar] [CrossRef]
- Dahal, R.P.; Grala, R.K.; Gordon, J.S.; Munn, I.A.; Petrolia, D.R.; Cummings, J.R. A hedonic pricing method to estimate the value of waterfronts in the Gulf of Mexico. Urban For. Urban Green. 2019, 41, 185–194. [Google Scholar] [CrossRef]
- Li, M.; Shen, Z.; Hao, X. Revealing the relationship between spatio-temporal distribution of population and urban function with social media data. GeoJournal 2016, 81, 919–935. [Google Scholar] [CrossRef]
- Wu, J.Y.; Ta, N.; Song, Y.; Lin, J.; Chai, Y.W. Urban form breeds neighborhood vibrancy: A case study using a GPS-based activity survey in suburban Beijing. Cities 2018, 74, 100–108. [Google Scholar] [CrossRef]
- Mouratidis, K.; Poortinga, W. Built environment, urban vitality and social cohesion: Do vibrant neighborhoods foster strong communities? Landsc. Urban Plan. 2020, 204, 9. [Google Scholar] [CrossRef]
- Costa, J.P.; Andrade, M.J.; Dal Cin, F. The (Re)Industrialised Waterfront as a “Fluid Territory”: The Case of Lisbon and the Tagus Estuary. Urban Plan. 2023, 8, 363–375. [Google Scholar] [CrossRef]
- Othman, A.; Al-Hagla, K.; Hasan, A.E. The impact of attributes of waterfront accessibility on human well-being: Alexandria Governorate as a case study. Ain Shams Eng. J. 2021, 12, 1033–1047. [Google Scholar] [CrossRef]
- Fan, Z.X.; Duan, J.; Luo, M.L.; Zhan, H.R.; Liu, M.R.; Peng, W.C. How Did Built Environment Affect Urban Vitality in Urban Waterfronts? A Case Study in Nanjing Reach of Yangtze River. ISPRS Int. J. Geo-Inf. 2021, 10, 611. [Google Scholar] [CrossRef]
- Ding, J.; Luo, L.J.; Shen, X.; Xu, Y.J. Influence of built environment and user experience on the waterfront vitality of historical urban areas: A case study of the Qinhuai River in Nanjing, China. Front. Archit. Res. 2023, 12, 820–836. [Google Scholar] [CrossRef]
- Fan, Y.T.; Kuang, D.; Tu, W.; Ye, Y. Which Spatial Elements Influence Waterfront Space Vitality the Most?—A Comparative Tracking Study of the Maozhou River Renewal Project in Shenzhen, China. Land 2023, 12, 1260. [Google Scholar] [CrossRef]
- Wekerle, G. From eyes on the street to safe cities (Jane Jacobs’ book, The ‘Death and Life of Great American Cities’). Places-Forum Environ. Des. 2000, 13, 44–49. [Google Scholar]
- Jacobs, J. The Death and Life of Great American Cities. N. Y. Times Book Rev. 2021, 126, 25. [Google Scholar]
- Wang, M.Y.; He, Y.J.; Meng, H.; Zhang, Y.; Zhu, B.; Mango, J.; Li, X. Assessing Street Space Quality Using Street View Imagery and Function-Driven Method: The Case of Xiamen, China. ISPRS Int. J. Geo-Inf. 2022, 11, 282. [Google Scholar] [CrossRef]
- Zhang, L.; Xu, X.X.; Guo, Y.L. Comprehensive Evaluation of the Implementation Effect of Commercial Street Quality Improvement Based on AHP-Entropy Weight Method-Taking Hefei Shuanggang Old Street as an Example. Land 2022, 11, 2091. [Google Scholar] [CrossRef]
- Xia, X.J.; Zhang, Y.; Zhang, Y.; Rao, T.C. The spatial pattern and influence mechanism of urban vitality: A case study of Changsha, China. Front. Environ. Sci. 2022, 10, 15. [Google Scholar] [CrossRef]
- Liu, S.J.; Zhang, L.; Long, Y. Urban Vitality Area Identification and Pattern Analysis from the Perspective of Time and Space Fusion. Sustainability 2019, 11, 4032. [Google Scholar] [CrossRef]
- Chen, L.; Ma, Y. How Do Ecological and Recreational Features of Waterfront Space Affect Its Vitality? Developing Coupling Coordination and Enhancing Waterfront Vitality. Int. J. Environ. Res. Public Health 2023, 20, 1196. [Google Scholar] [CrossRef]
- Sung, H.; Lee, S. Residential built environment and walking activity: Empirical evidence of Jane Jacobs’ urban vitality. Transport. Res. Part D-Transport. Environ. 2015, 41, 318–329. [Google Scholar] [CrossRef]
- Long, Y.; Zhai, W.X.; Shen, Y.; Ye, X.Y. Understanding uneven urban expansion with natural cities using open data. Landsc. Urban Plan. 2018, 177, 281–293. [Google Scholar] [CrossRef]
- Yang, J.W.; Cao, J.; Zhou, Y.F. Elaborating non-linear associations and synergies of subway access and land uses with urban vitality in Shenzhen. Transp. Res. Pt. A-Policy Pract. 2021, 144, 74–88. [Google Scholar] [CrossRef]
- Wu, C.; Ye, X.Y.; Ren, F.; Du, Q.Y. Check-in behaviour and spatio-temporal vibrancy: An exploratory analysis in Shenzhen, China. Cities 2018, 77, 104–116. [Google Scholar] [CrossRef]
- Liu, Y.S.; Wang, Z.Y.; Shan, Z.R. Research on Evaluation and Optimization Strategies of Cultural Ecosystem Services of Rural Water Spaces in Suzhou. Landsc. Archit. Front. 2021, 9, 38–49. [Google Scholar] [CrossRef]
- Taufen, A.; Yocom, K. Transitions in Urban Waterfronts: Imagining, Contesting, and Sustaining the Aquatic/Terrestrial Interface. Sustainability 2021, 13, 366. [Google Scholar] [CrossRef]
- Luo, M. Exploring the Influencing Factors of Riverside Spatial Vitality Based on Spatio-Temporal Geographic Weighted Regression Modeling. Master’s Thesis, Southeast University, Nanjing, China, 2024. [Google Scholar]
- Wu, J.; Li, J.W.; Ma, Y. Exploring the Relationship between Potential and Actual of Urban Waterfront Spaces in Wuhan Based on Social Networks. Sustainability 2019, 11, 3298. [Google Scholar] [CrossRef]
- Li, J. The Study of Xiang River Basin Transport and Folk Culture Change in Tang and Song Dynasties. Master’s Thesis, Jinan University, Guangzhou, China, 2010. [Google Scholar]
- Chen, J. A Research and Realization of the Heavy Metal Pollution Water Quality Simulation Forecast System Based on GIS. Ph.D. Thesis, Chinese Academy of Sciences, Beijing, China, 2008. [Google Scholar]
- Yang, L.; Li, H.Y.; Feng, C.; Peng, L.L.; Sun, R.S. Study on the Evolution and Adaptability of the River Network System under Rapid Urbanization in the Xiangjiang River Basin, China. Water 2023, 15, 3768. [Google Scholar] [CrossRef]
- Zhang, Y.Y.; Yi, L.W.; Xie, B.G.; Li, J.H.; Xiao, J.Y.; Xie, J.; Liu, Z.X. Analysis of ecological quality changes and influencing factors in Xiangjiang River Basin. Sci. Rep. 2023, 13, 17. [Google Scholar] [CrossRef] [PubMed]
- Chen, X.H.; Yi, G.D.; Liu, J.; Liu, X.; Chen, Y. Evaluating Economic Growth, Industrial Structure, and Water Quality of the Xiangjiang River Basin in China Based on a Spatial Econometric Approach. Int. J. Environ. Res. Public Health 2018, 15, 2095. [Google Scholar] [CrossRef] [PubMed]
- Chen, Y.T.; Jia, B.Y.; Wu, J.; Liu, X.J.; Luo, T.Y. Temporal and Spatial Attractiveness Characteristics of Wuhan Urban Riverside from the Perspective of Traveling. Land 2022, 11, 1434. [Google Scholar] [CrossRef]
- Zhang, Z.; Li, J.M.; Luo, X.; Li, C.M.; Zhang, L. Urban lake spatial openness and relationship with neighboring land prices: Exploratory geovisual analytics for essential policy insights. Land Use Pol. 2020, 92, 13. [Google Scholar] [CrossRef]
- Yang, Y.Z.; Ma, Y.Y.; Jiao, H.Z. Exploring the Correlation between Block Vitality and Block Environment Based on Multisource Big Data: Taking Wuhan City as an Example. Land 2021, 10, 984. [Google Scholar] [CrossRef]
- Song, J.H.; Zhu, Y.Y.; Chu, X.Z.; Yang, X. Research on the Vitality of Public Spaces in Tourist Villages through Social Network Analysis: A Case Study of Mochou Village in Hubei, China. Land 2024, 13, 359. [Google Scholar] [CrossRef]
- Wang, Z.; Li, H.; He, D.; Li, X. Study on the Openness of Urban Waterfront Space under Multi-dimensional Perspective—Example of the Upper Haibin River Core Area. Mod. Urban Res. 2022, 72–78. [Google Scholar] [CrossRef]
- Dahal, R.P.; Grala, R.K.; Gordon, J.S.; Munn, I.A.; Petrolia, D.R. Geospatial Heterogeneity in Monetary Value of Proximity to Waterfront Ecosystem Services in the Gulf of Mexico. Water 2021, 13, 2401. [Google Scholar] [CrossRef]
- Li, J.Y.; Huang, Z.L.; Zheng, D.L.; Zhao, Y.J.; Huang, P.L.; Huang, S.J.; Fang, W.Q.; Fu, W.C.; Zhu, Z.P. Effect of Landscape Elements on Public Psychology in Urban Park Waterfront Green Space: A Quantitative Study by Semantic Segmentation. Forests 2023, 14, 244. [Google Scholar] [CrossRef]
- Gao, H.T.; Liu, F.F.; Kang, J.; Wu, Y.; Xue, Y.Z. The relationship between the perceptual experience of a waterfront-built environment and audio-visual indicators. Appl. Acoust. 2023, 212, 20. [Google Scholar] [CrossRef]
- Gong, M.; Ren, M.Y.; Dai, Q.; Luo, X.Y. Aging-Suitability of Urban Waterfront Open Spaces in Gongchen Bridge Section of the Grand Canal. Sustainability 2019, 11, 6095. [Google Scholar] [CrossRef]
- Chen, Z.H.; Gong, Z.Y.; Yang, S.; Ma, Q.W.; Kan, C.C. Impact of extreme weather events on urban human flow: A perspective from location-based service data. Comput. Environ. Urban Syst. 2020, 83, 15. [Google Scholar] [CrossRef] [PubMed]
- Li, J.L.; Lin, S.P.; Kong, N.N.; Ke, Y.L.; Zeng, J.; Chen, J.C. Nonlinear and Synergistic Effects of Built Environment Indicators on Street Vitality: A Case Study of Humid and Hot Urban Cities. Sustainability 2024, 16, 1731. [Google Scholar] [CrossRef]
- Guo, X.; Chen, H.F.; Yang, X.P. An Evaluation of Street Dynamic Vitality and Its Influential Factors Based on Multi-Source Big Data. ISPRS Int. J. Geo-Inf. 2021, 10, 143. [Google Scholar] [CrossRef]
- Maragno, D.; Gaglio, M.; Robbi, M.; Appiotti, F.; Fano, E.A.; Gissi, E. Fine-scale analysis of urban flooding reduction from green infrastructure: An ecosystem services approach for the management of water flows. Ecol. Model. 2018, 386, 1–10. [Google Scholar] [CrossRef]


| Types of POI | Specific Details |
|---|---|
| Commercial facilities | Commercial shopping, hotels, and restaurants. |
| Educational facilities | Schools, training institutions, and cultural centers. |
| Sports facilities | Stadiums, recreation centers, and fitness clubs. |
| Office facilities | Corporate, office housing, and financial bond services. |
| Public service facilities | Government agencies, hospitals, clinics, and lifestyle services. |
| Scenic spot | Scenic spots, and attractions. |
| Category | Indicator | Description | Weight Coefficient | |
|---|---|---|---|---|
| Ecological Value Attribute Analysis | Green coverage. | Ratio of ecological green space area to zone area | 0.1103 | 0.2398 |
| Green area location entropy | Ratio of park area to total park area within the waterfront space zone | 0.0794 | ||
| Landscape disturbance degree (negative) | Sensitivity of different landscape components to external disturbances | 0.0501 | ||
| Traffic Accessibility Analysis | Public transportation convenience | Number of bus stops, subway stops, and parking facilities per zone area | 0.0915 | 0.2737 |
| Road network density | Ratio of road length to footprint within each zone | 0.0761 | ||
| Park walkability | Ratio of serviceable area to zone area covered by each park | 0.1061 | ||
| Spatial Development Intensity Analysis | Building density | Ratio of building footprint to floor area within each zone | 0.0604 | 0.2002 |
| Floor area ratio | Gross floor area to floor area ratio within each zone | 0.0586 | ||
| Residential population density | Ratio of total residential population to area within each zone | 0.0812 | ||
| Functional Diversity Analysis | Commercial facilities | Density of distribution of various types of commercial and recreational facilities | 0.0489 | 0.2863 |
| Educational facilities | Density of distribution of various types of scientific, educational, and cultural facilities | 0.0398 | ||
| Sports facilities | Density of distribution of various types of sports and leisure facilities | 0.0491 | ||
| Office facilities | Density of distribution of various types of business office facilities | 0.0416 | ||
| Public service facilities | Density of distribution of various types of amenities | 0.0525 | ||
| Scenic spot | Density of distribution of various scenic spots | 0.0544 | ||
Disclaimer/Publisher’s Note: The statements, opinions and data contained in all publications are solely those of the individual author(s) and contributor(s) and not of MDPI and/or the editor(s). MDPI and/or the editor(s) disclaim responsibility for any injury to people or property resulting from any ideas, methods, instructions or products referred to in the content. |
© 2024 by the authors. Licensee MDPI, Basel, Switzerland. This article is an open access article distributed under the terms and conditions of the Creative Commons Attribution (CC BY) license (https://creativecommons.org/licenses/by/4.0/).
Share and Cite
Zhou, Z.; Yang, F.; Li, J.; Li, J.; Zou, Z. Identification of Critical Areas of Openness–Vitality Intensity Imbalance in Waterfront Spaces and Prioritization of Interventions: A Case Study of Xiangjiang River in Changsha, China. Land 2024, 13, 686. https://doi.org/10.3390/land13050686
Zhou Z, Yang F, Li J, Li J, Zou Z. Identification of Critical Areas of Openness–Vitality Intensity Imbalance in Waterfront Spaces and Prioritization of Interventions: A Case Study of Xiangjiang River in Changsha, China. Land. 2024; 13(5):686. https://doi.org/10.3390/land13050686
Chicago/Turabian StyleZhou, Zhaoyu, Fan Yang, Jiayu Li, Jiale Li, and Zhuojun Zou. 2024. "Identification of Critical Areas of Openness–Vitality Intensity Imbalance in Waterfront Spaces and Prioritization of Interventions: A Case Study of Xiangjiang River in Changsha, China" Land 13, no. 5: 686. https://doi.org/10.3390/land13050686
APA StyleZhou, Z., Yang, F., Li, J., Li, J., & Zou, Z. (2024). Identification of Critical Areas of Openness–Vitality Intensity Imbalance in Waterfront Spaces and Prioritization of Interventions: A Case Study of Xiangjiang River in Changsha, China. Land, 13(5), 686. https://doi.org/10.3390/land13050686