1. Introduction
Greenways are linear green corridors that are planned, designed, and managed for multi-use purposes and sustainable land use [
1,
2]. In the worldwide greenway movement, the concept of greenways has attracted policymakers, community leaders, and planners for their co-benefits of recreational, ecological, cultural, and economic value [
3]. The economic influences, particularly property value increments and decrements, have received increasing scholarly interest [
4]. On the one hand, residents can benefit from the recreational, ecological, and cultural services of greenways [
5,
6,
7], making the proximity and accessibility of greenways important factors for housing preferences [
8,
9]. On the other hand, greenway activities could have both environmental and social impacts on surrounding communities, such as crime, vandalism, and traffic, which could cause not only “not in my backyard” complaints but also decrements in proximate property values [
10,
11]. As a result, the impact of greenways on proximate property values has become a primary lens through which to understand community attitudes toward greenway development [
12]. Moreover, while funding remains a major challenge for greenway development worldwide, few practices recognize potential economic benefits as a financial alternative for developing greenways [
13].
Jincheng Greenway, a mega greenway project in Chengdu, China, managed to utilize potential property value increments to finance greenway development. In 2017, the Chengdu Municipal Government launched the Tianfu Greenway scheme, aimed at an 85-km green belt surrounding the city center. Arguing that the greenway project can increase the value of proximate properties, the municipal government initiated a new policy to collect the assumed increment from the incomes of land transactions upfront and to apply it to fund greenway development. The government then delineated a 500 m zone along greenways as the value capture area. However, while the value capture policy helps to raise funds for greenway development, three key hypotheses remain unexamined: Can greenways increase the value of proximate properties? To what extent does the greenway project increase the values of proximate properties? To what extent does the policy effectively capture the value increments? To examine these hypotheses, this study conducted a hedonic analysis by examining the economic influences of greenways on proximate apartments based on data from preowned apartment transactions. This study aims to fill two research gaps. On the one hand, by examining the property value increments along the Jincheng Greenway, we can understand the economic benefits of greenways on a larger scale, which is overlooked in existing studies. On the other hand, using proximity as a key factor in examining property value increments, we can not only unpack the factors that influence the economic benefits of greenways but also further investigate how to define greenway properties for future study and decision-making.
This paper is organized into seven sections. Following this introduction,
Section 2 reviews the theoretical perspectives and existing findings on greenways and their impacts on property values. Additionally, a review of issues associated with the funding of greenways is included.
Section 3 illustrates the study areas, data collection, and methodology of this research. The empirical findings are then presented in
Section 4.
Section 5,
Section 6,
Section 7 serve as the discussion, the conclusion, and the limitation of this study, summarizing our main theoretical and empirical contributions to the studies of greenway development and property value increments along greenways.
3. Study Area, Data Collection, and Methodology
3.1. Study Area
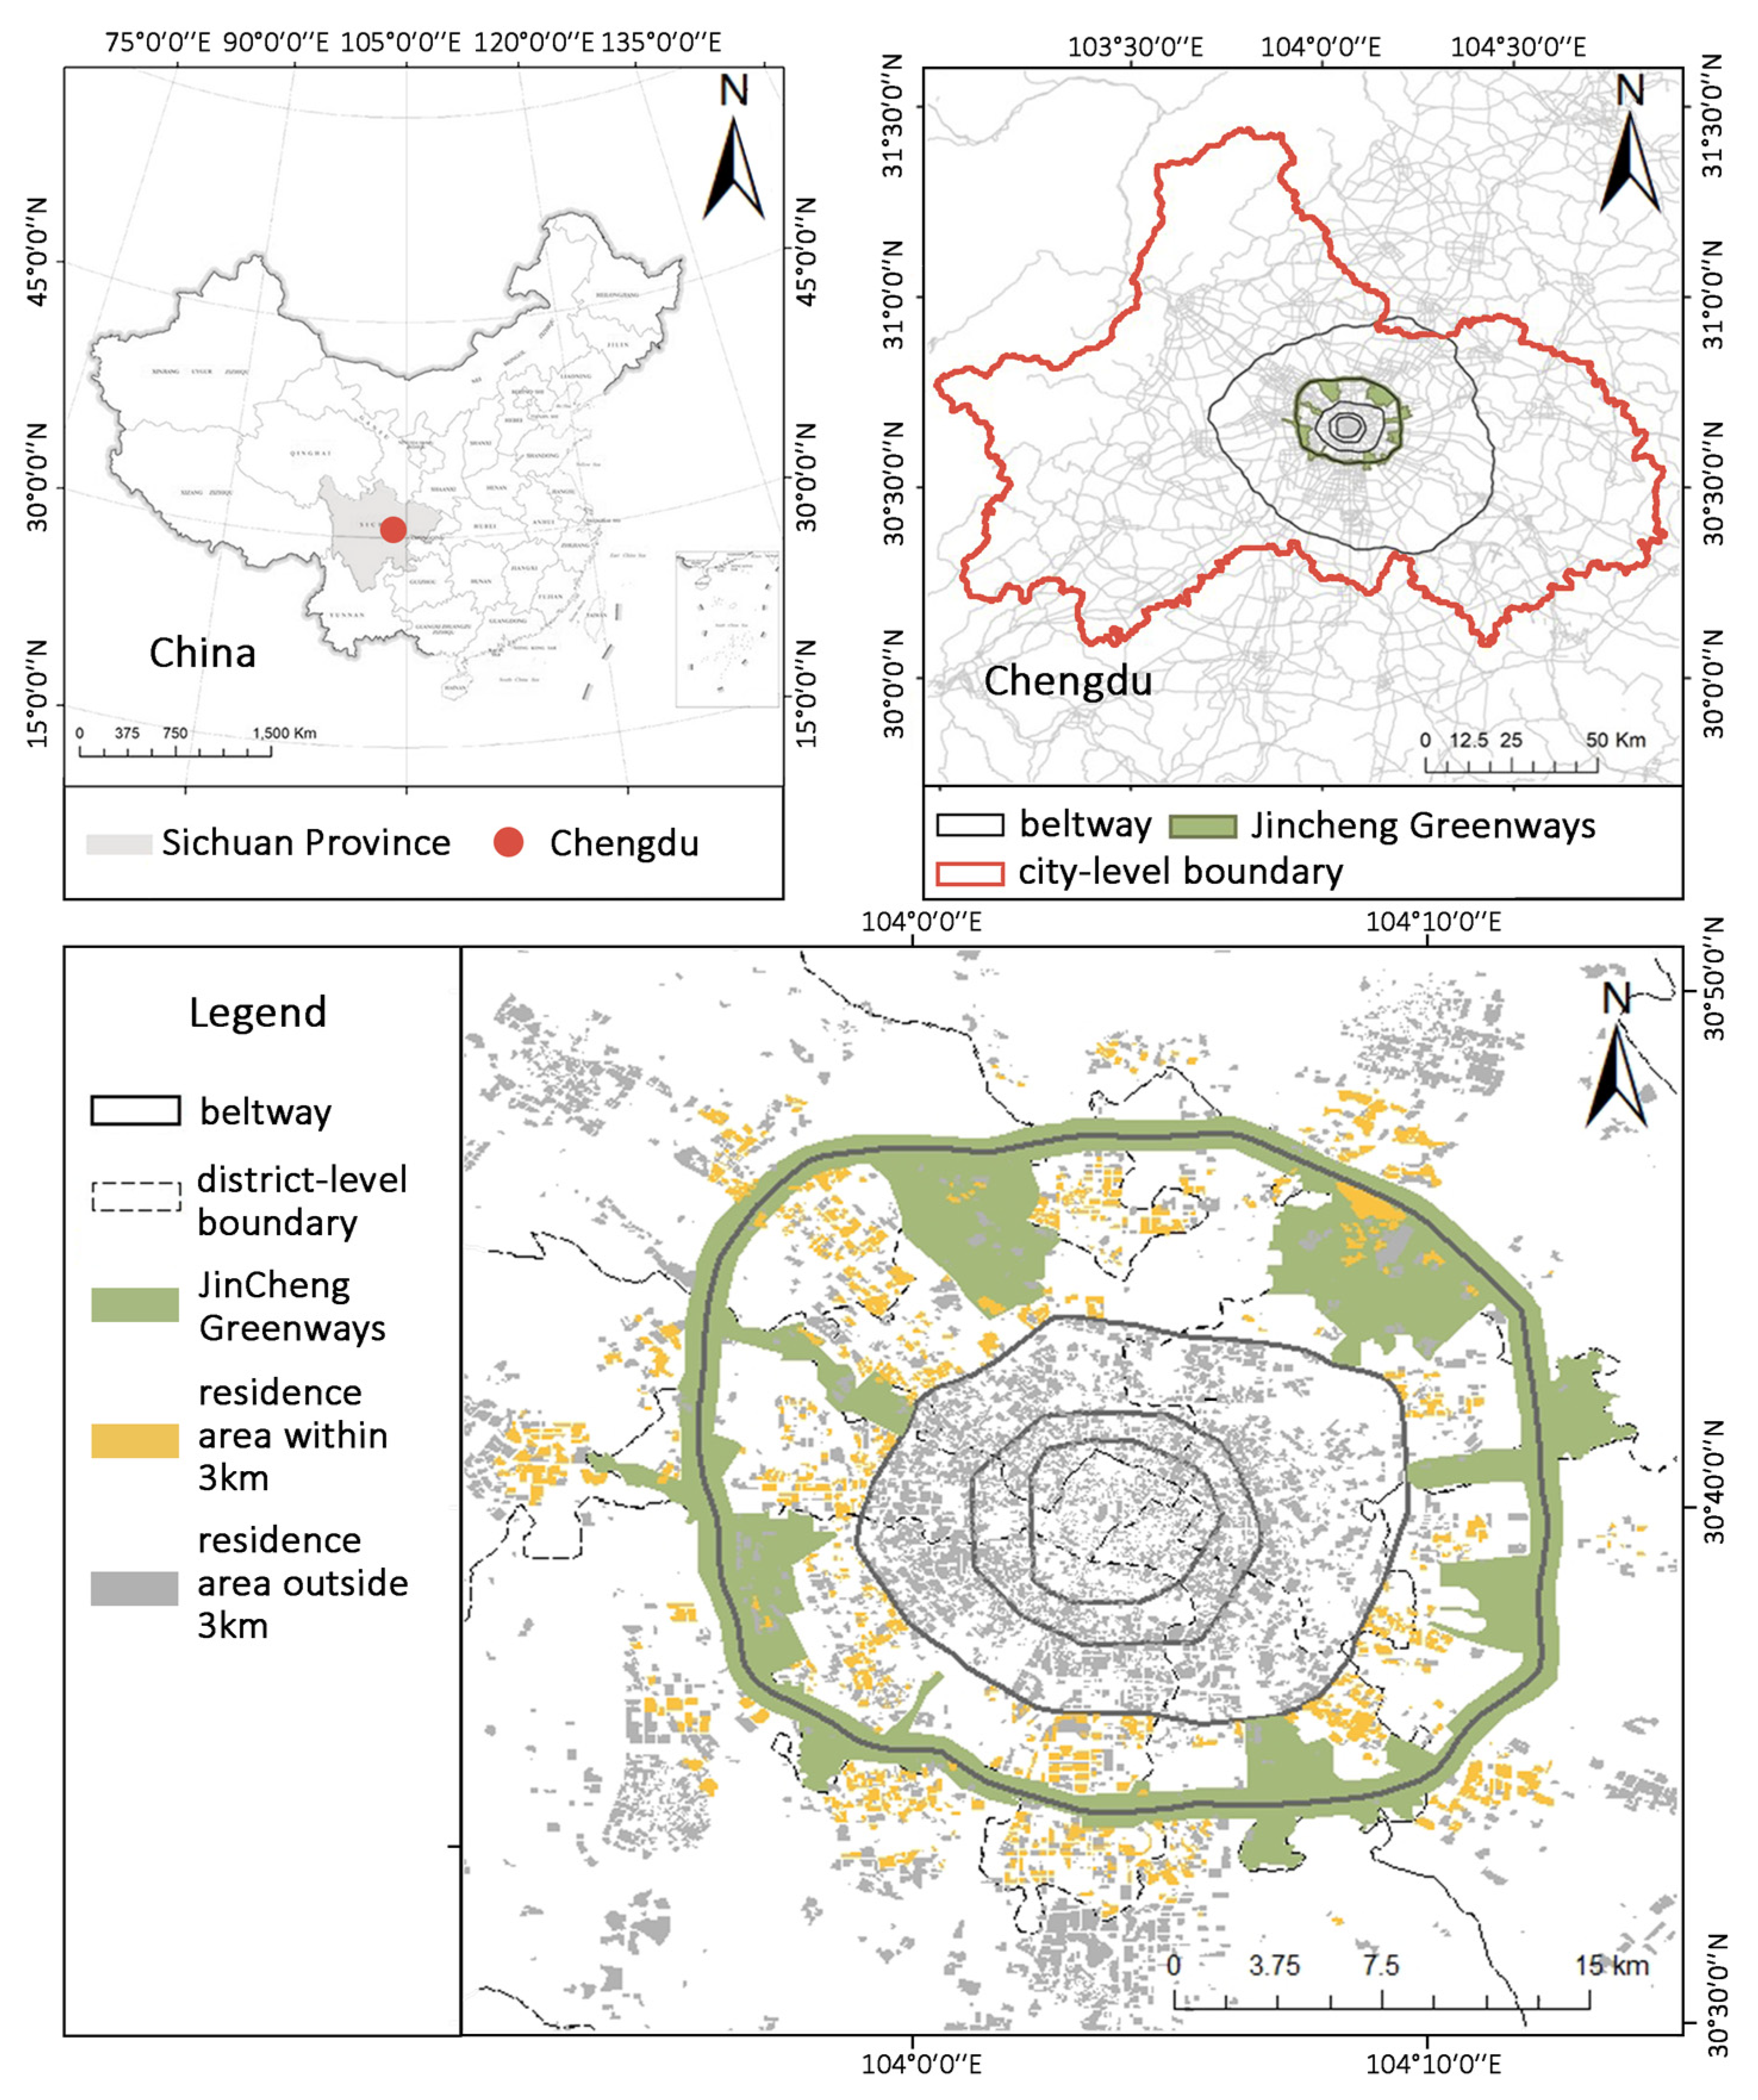
Located in Southwest China, Chengdu accommodates more than 21 million people within an area of 14,335 square kilometers. For decades, its urban area has been expanding rapidly following a concentric pattern. The city center has remained the core area, and newly developed land is organized in a circular structure of beltways. In 2017, the Chengdu Municipality initiated the Tianfu Greenway Scheme, aiming at a 16,930-km greenway network, of which the Jincheng Greenway was one primary project. Serving as a belt surrounding the city, the Jincheng Greenway spans an area of 187.15 square kilometers. Delegated by the municipal government, Chengdu Tianfu Greenway Construction Investment Co., Ltd. (Chengdu, China), a state-owned enterprise, is responsible for the development and management of the Jincheng Greenway. According to the official plan, the Jincheng Greenway project includes 500-km trails, a 20-square-kilometer water area, a 100-km ecological agriculture landscape, 640 cultural facilities, 1050 sports facilities, and 410 tourism facilities [
29,
30]. The Jincheng Greenway is now a 1-km-wide and 85-km-long green belt along both sides of the fourth beltway. There are 1349 residential communities located within a 3-km radius along the Jincheng Greenway (see
Figure 1).
Predominantly funded by the government, Jincheng Greenway also sees the value increments of proximate properties as a potential source of funding. More specifically, the Chengdu municipal government claimed that the values of proximate lands would increase by between 2 million and 5 million CNY after greenways are developed [
31]. To capture the assumed increments, the authority further decided that for any transactions of state-owned land in a 500-m area along greenways, a portion of the revenue income would be allocated to greenway funding at a rate of one million CNY per mu (666 square meters). Moreover, Chengdu Xingcheng Investment Group Co., Ltd. (Chengdu, China), the parent company of the greenway developer, issued over 6.5 billion CNY in bonds, listing the income from land value increments as one of its financial capacities. In the end, the estimated investment in the Jincheng Greenway reached 41.5 billion CNY [
32,
33]. The associated state-owned land transfer fee, according to a consulting institute (i.e., Cushman & Wakefield), is expected to be over 1 trillion CNY [
34].
3.2. Hedonic Pricing Model
Derived from Lancaster’s consumer theory and Rosen’s theoretical model, the Hedonic Price Model (HPM) has been applied extensively to studying the various determinants of housing prices [
35], such as transport infrastructure [
36], urban regeneration [
37], and educational facilities [
38], as well as in the evaluation of environmental (dis)amenity, such as natural landscapes [
39], air pollution [
40], airport noise [
41], air quality [
42], water pollution [
43], and urban greenery [
44,
45]. It correlates the sale price of a property with locational, structural, and neighborhood characteristics that could contribute to its value. As Chau and Chin proposed, the commonly used attributes are (1) distance from CBD, view of the sea, lakes or rivers, view of hills/valley/golf course, obstructed view, and length of land lease in the locational dimension; (2) number of rooms/bathrooms/bedrooms, floor area, basement/garage, building services, floor level, structural quality, facilities, and age of the building in the structural dimension; and (3) income of residents, proximity to good schools, proximity to hospitals, proximity to places of worship, crime rate, traffic/airport noise, proximity to shopping centers, proximity to forests, and environmental quality in the neighborhood dimension [
35]. However, few studies have involved all these variables due to the different research hypotheses, the various contexts of housing markets, and differences in the availability of data collection. Moreover, the specification of variables has been a key issue [
35]. On the other hand, the over-specification not only resulted in inefficient issues because of the inclusion of the irrelevant variable but also a greater chance of mis-specification of the hedonic price model [
35]. On the other hand, although a smaller sample can help reduce the abovementioned problem, underspecification could also be biased and inconsistent [
35]. As a result, the specification of variables varies from case to case due to the relevance of the research question and the availability of data collection.
To investigate the impact of the Jincheng Greenway on surrounding residential property prices, we developed a multivariate regression equation with preowned apartment prices as the dependent variable and various characteristic variables as the independent variables. The regression coefficients symbolize the implied boundary values of these characteristics, facilitating an analysis of the factors that affect housing prices. The relationships among these variables are expressed in Equation (1). The classic hedonic price model is often formulated as a linear function and estimated using the least squares method, which can be expressed as Equation (2).
Equation (1) defines the housing price (P) as a function of a vector of housing characteristics (Z), where S refers to structural variables, L to locational variables, and G to environmental variables.
In Equation (2), refers to the price of the housing, refers to the housing characteristic vector for the residential sample point, refers to the characteristic elasticity coefficient for housing prices, refers to constants for factors beyond characteristic variables, and denotes the random error term.
3.3. Data Collection and Variable Description
First, we collected 343,382 transaction records from a Chinese internet-based real estate brokerage platform (Lianjia) in July 2023. The transactions occurred between January 2017 and December 2020. Each transaction record includes property value, floor area, apartment floor, transaction date, window orientation, number of bedrooms/bathrooms/living rooms/kitchens, and community name. Second, taking the area between the third beltway and the fifth beltway as the research scope, a total of 3007 communities and 106,328 transaction records were identified. Third, we collected points of interest, including schools, hospitals, and subway stations, from an internet map website (Gaode) and obtained the location of the Jincheng Greenway from public documents. Fourth, we calculated the nearest spatial distances between residential communities and the Jincheng Greenway, surrounding facilities, and the city center.
Considering the special context of the housing market in China, we follow the variable specifications of Jim and Chen [
46,
47], Wen et al. [
39], and Chen and Li [
48] and set up a pool of all potential variables according to our available data. Then, we conducted several rounds of statistical modeling to test whether these variables are relevant to apartment prices in this study. In the end, we excluded eight variables for two main reasons. One reason is inaccurate categorization in the original dataset from Lianjia because apartment floors are oversimplified into top, mid-rise, and low-rise floors without considering the total number of floors. The other reason is statistically insignificant: the variables are the number of kitchens/living rooms, the district, the closest commercial area, the transaction date, the total number of apartments per floor, and the type of building structure. Finally, we categorized 15 independent variables into 3 groups of property characteristics (
Table 1). The structural characteristics refer to floor area, building age, number of rooms and toilets, south-facing windows, and elevator availability. Locational characteristics refer to proximity to medical facilities, parks, schools, sports facilities, city center, subway stations, and bus stations. Environmental characteristics refer to the distance between the community and the Jincheng Greenway.
3.4. Model Specification
Employing the Hedonic Price Model, we formulated eight models to ascertain the influence of the Jincheng Greenway on adjacent apartment prices. Initially, Model (1) establishes the basic hedonic price model regression, considering only the housing characteristic vectors and excluding the greenway factors (see Equation (3)).
To verify the first two hypotheses proposed in this study, “Can the greenways increase the value of proximate properties?” and “To what extent does the greenway project increase the values of proximate properties?”, we used the 500-m criterion proposed by the Jincheng Greenway Policy. Building on Equation (2), we introduced a dummy variable (dis) to determine different value capture intervals and established models (2), (3), and (4):
To further validate the third hypothesis, “To what extent does the policy effectively capture the value increments?”, we narrowed the scope of the study and divided it into four intervals. Building on Equation (2), we introduced a dummy variable (distance) and established models (5), (6), (7), and (8).
Models (5) and (6) divided the study area into two zones (i.e., less than 0.5 km and 0.5 km–1 km) based on proximity to the Jincheng Greenway. The following dummy variable (distance) was used:
Models (7) and (8) divided the study area into two zones (i.e., 1 km–1.5 km and 1.5 km–2 km) based on proximity to the Jincheng Greenway. The following dummy variable (distance) was used:
This division was used to assess the influence of greenway proximity on housing prices (see
Figure 2).
4. Empirical Findings
4.1. Preowned Apartment Prices around Greenways between 2017 and 2020
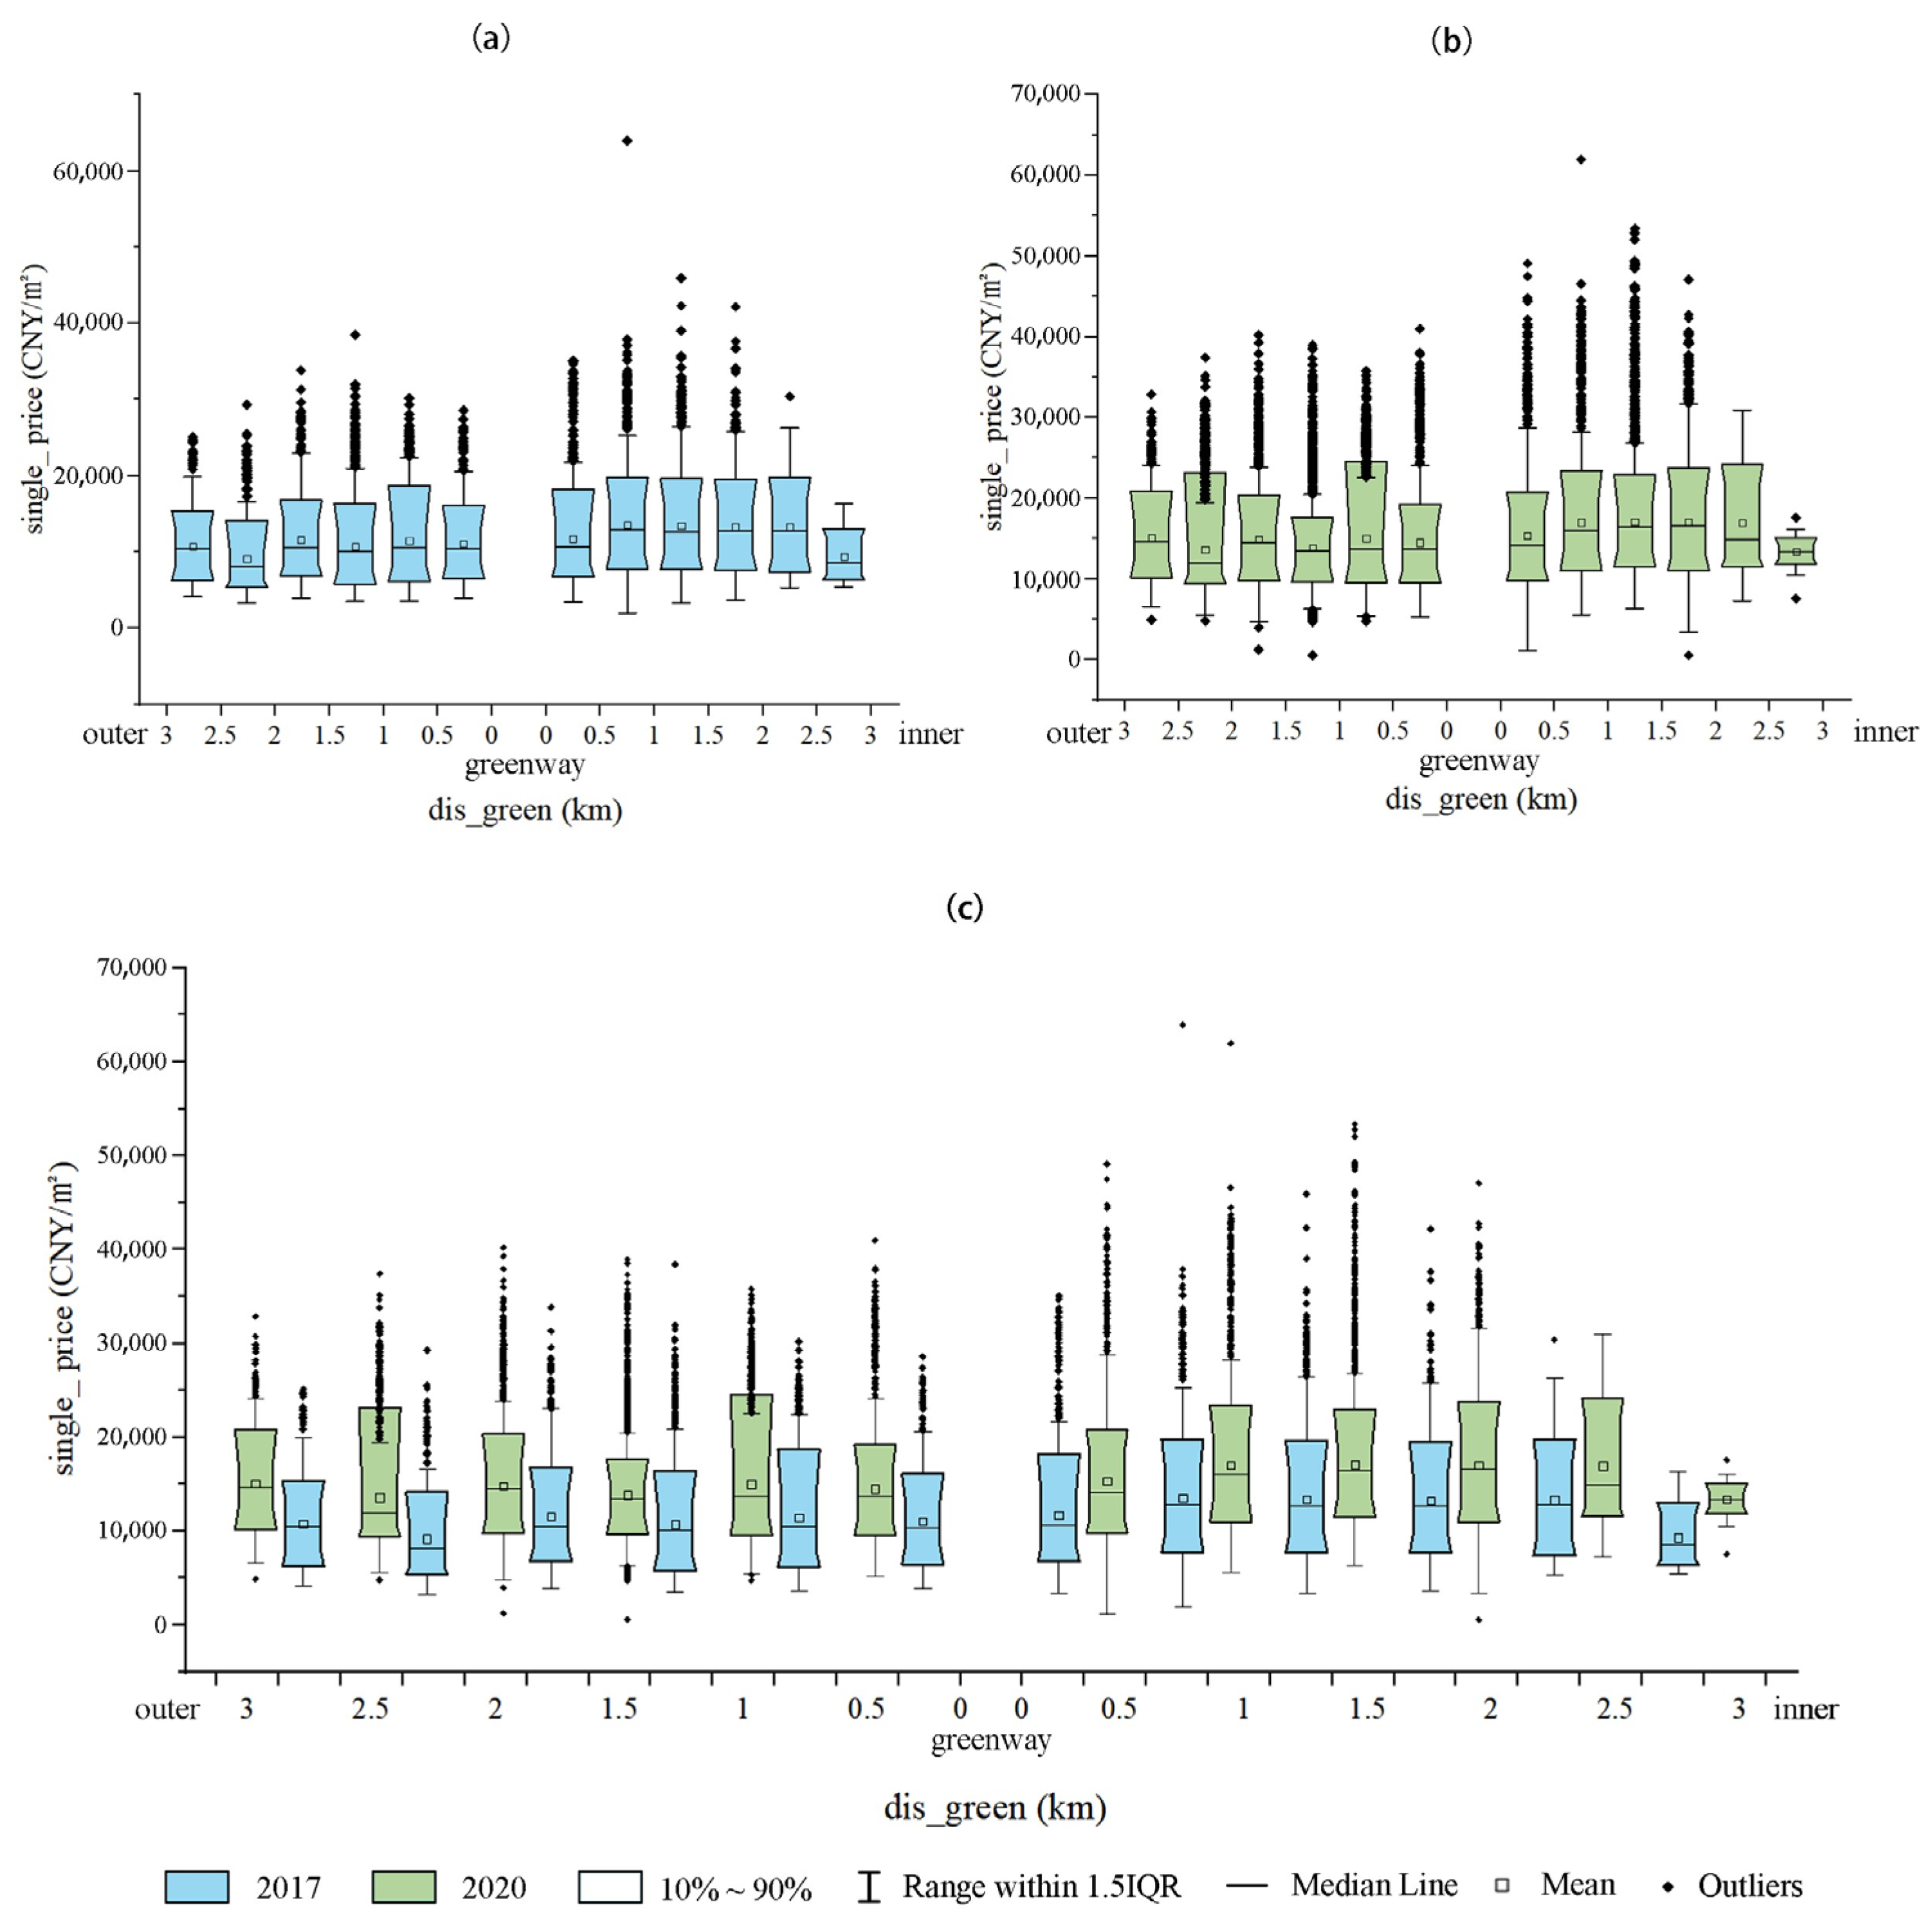
We used a boxplot (
Figure 3) to provide a general description of preowned apartment prices along greenways. The horizontal axis represents the distance between communities and greenways, divided into 12 groups every 500 m, where ‘inner’ indicates the direction toward the city center, and ‘outer’ refers to the opposite direction away from the city center. The vertical axis represents the unit price of preowned apartments. The boxes denote the majority of apartment prices with the median price within them, and the dots represent extreme outliers. The outliers in the top segment can be seen as extremely high-priced apartments. We further compared the prices in 2017 and 2020, as shown in
Figure 3a,b, respectively, and then combined the data from both years to show the differences (c). The year 2017 refers to the starting time of the Jincheng Greenway, and 2020 was the newest date in our dataset.
For most apartments, as the location changed from closer to the city center to further away, the median prices changed slightly in both years. This means that, in the investigated area, the distance to the city center is not a key factor in differentiating the properties from each other. From 2017 to 2020, apartment prices generally increased with the growth of the real estate market. However, the relationship between the change in apartment prices and spatial location on both sides did not follow a linear pattern. Along greenways, the prices of apartments within 500 m were indeed lower than those located between 500 m and 1000 m in both years. In the meantime, as extreme outliers show, the prices of high-priced apartments were more location-sensitive, while in general, the prices increased when the location was closer to the city center. However, the extreme outliers of apartments within 500 m increased rapidly compared with those of other groups, which means that the prices of high-end apartments experience growth along greenways. Moreover, within a 500-m radius of the greenway, the upper price threshold exceeds that observed within a 0.5–1 km range. A comparison of the different results from 2017 and 2020 suggests that the influence of greenways on property value is more significant within a 500-m area.
4.2. Impact of the Jincheng Greenway on Residential Property Prices
Based on the analytical framework of the hedonic price approach, eight models were estimated using Stata (version 17.0) software. The ANOVA test revealed that the significance probability of the P value of the hedonic price equation was less than 0.001, indicating that each equation is highly significant [
49]. It also suggests a close linear relationship between the residential characteristics considered in the equations and the housing prices. Furthermore, all the models passed the hypothesis test, indicating the validity of all eight models. The adjusted R
2 values for all the models ranged from 0.604 to 0.679, indicating good explanatory power of the equations. Most of the variables entered into the model showed significance at the 5 percent level, and their signs were as expected.
To assess the impact of greenways on proximate property values, we first proposed a basic hedonic price model (Model 1) that incorporates apartment prices and related attributes to evaluate the influence of structural and locational factors on apartment prices. Regression analysis shows that all considered housing-related attributes significantly affect apartment prices (see
Table 2). The adjusted R
2 value for Model 1 was 0.635. All variables had a significant effect on housing prices. The results were as expected, except for the floor area of the apartment and the presence of a south-facing window, which had coefficients of −9.331 and −134.196, respectively. This suggests that in Chengdu, homebuyers do not prioritize these two factors when purchasing property.
Model 2–Model 4 have adjusted R2 values of 0.636, 0.636, and 0.635, respectively, indicating the high explanatory power of these spatial models. The dummy variables in these models are significant at the 1% level. For Model 2, the results indicate that the average apartment price of properties located within the 500-m area of the greenway is greater than that of properties not located within the area. The proximity effect remains significant after all control variables are included. Further analysis indicates that apartments within a 500-m area adjacent to the Jincheng Greenway have higher prices, with an increase of 297.98 CNY per square meter, compared with apartments outside the area. For Model 3, the results indicate that the average property price within 500 m–1000 m of the greenway is greater than that outside this range, with an increase of 365.23 CNY per square meter. According to the results of Model 4, the economic influence of greenways on property value within 1000 m to 1500 m from the greenway is greater than that of properties outside this range, with an increase of 83.66 CNY per square meter. In general, these results show that, as expected, the Jincheng Greenway has a positive impact on the prices of surrounding properties. The natural environment and services along the greenway attract homebuyers who are willing to pay for better proximity to green spaces.
4.3. Effects of Greenways on Properties with Different Proximities
Models 5–8 adopt proximity to greenways as a key variable to test for any spatial variation in the effects of the Jincheng Greenway on apartment prices in various distance segments. The regression results (see
Table 3) show that these models have adjusted R
2 values of 0.605, 0.679, 0.643, and 0.604, respectively, indicating high explanatory ability. The majority of variables within Models 5–8 are significant at the 1% level, with coefficient signs aligning with the anticipated directions. This indicates that the Jincheng Greenway has a significant effect on apartment prices in these regions, and their price elasticities are −1.396, −2.383, −1.125, and 1.550, respectively. The results indicate that the effect of the Jincheng Greenway on the prices of proximate apartments varies according to the distance from the greenways. Within a 1.5-km radius from a greenway, apartment prices decrease as distance increases, with a substantial effect occurring between 0.5 and 1 km. For each kilometer away from the greenway, there is an average reduction of 2383 CNY per square meter in apartment prices. Conversely, beyond a 1.5 km radius, apartment prices begin to increase with increasing distance from the greenway. Contrary to expectations, residential areas within 0.5 km experience a smaller positive impact (−1.396) than those within 0.5–1.0 km (−2.383). In other words, as the distance to greenways increases, the positive influence of greenways on apartment prices reaches its peak between 0.5 km and 1.0 km and diminishes beyond a distance of 1.0 km. This implies that the greenway still has a positive effect on proximate properties beyond the assumed 500-m range in the value capture policy. The impact is even greater within the 0.5–1-km range. Moreover, the prices of apartments located within 1.5 km of the greenway increase with the distance from the greenway. The prices of apartments 1.5 km away from the greenway decrease with increasing distance. This result suggests that there is a nonlinear relationship between housing prices and distance.
5. Discussion
Greenways are one of the most popular planning strategies for creating and protecting urban green spaces. Policymakers and planners are enthusiastic about the multiple benefits of greenways, especially their economic benefits [
3]. The economic influences of greenways on proximate property values have been intensively studied, but the results vary from case to case due to differences in research scope, variable specifications, and, most importantly, the quality and form of greenways. In particular, the heterogeneity in the property value increments comes from not only the recreational, scenic, and ecological values of greenways but also the increasing traffic, potential crime, and vandalism associated with greenway use [
11]. However, optimism bias usually exists in many greenway practices, anticipating economic benefits without supporting evidence and strategies [
21]. However, as Crompton and Nicholls’ literature review shows [
4], there are several issues in the literature on the economic influences of greenways on property values, which inhibit the explanatory capacity of greenway studies for policymaking and planning.
First, there is currently no consensus on the spatial extent of the economic impact of greenways on housing prices due to differences in housing preferences, lifestyles, and, most importantly, the size, form, and quality of greenways. The majority of existing studies of greenway properties only use “adjacent” or “distance to the nearest trail/greenway” as the factor of the spatial relation between properties and greenways [
4]. Second, citywide investigations on the economic influences of greenways on property values are lacking. The existing studies usually have only small sample sizes, ranging from dozens to thousands [
4], due to the difficulty in data collection and neighborhood-scale greenway practices. Third, emerging mega-greenway projects are still overlooked in academic studies. Crompton and Nicholls suggested that there has been a new phenomenon in recent decades, namely, “mega-trails”, which are defined as projects with large-scale investments and long-term mass popular appeal that have a substantial positive impact on a community’s image and identity [
4]. However, considering the small number of successful practices and the large sample size required at the city scale, only a few studies have focused on mega-greenway projects, such as public perception [
11] and property value analysis at the neighborhood scale [
10], in the Atlanta Beltline. Fourth, while funding remains a key challenge in greenway development, few studies have investigated alternatives that leverage value increments of greenway properties to fund greenway development and management. More specifically, the policy design to identify the spatial scope of benefited properties and the amount of value increase remains overlooked, especially in countries that do not have a property tax system.
From this perspective, the Jincheng Greenway provides a novel and unique case. There are over 500 km of trails in the one-kilometer-wide and 85-km-long green belt. Moreover, the local authority placed great emphasis on the economic influences of greenways on proximate property. Assuming that greenways can bring value increments to proximate land, the municipal government saw these increments as a special source for raising funds for greenways. The local authority initiated a land value capture policy to collect future land value increments upfront before greenways were implemented. Furthermore, the income from the land value capture policy further becomes proof of the municipality’s ability to repay funds through bond financing in Shanghai, Hong Kong, and Germany. However, there is a lack of empirical research on the existence and extent of property value increments.
This study examines the property value increments along the Jincheng Greenway, aiming to provide new evidence of the economic influences on greenway properties at the city scale. By focusing on mega-greenway practices and employing three years of transaction data from an internet-based real estate brokerage platform, this study featured a city-wide scale, a large amount of transaction data, and a long-term period. The empirical findings fill the research gap of property value increments associated with Chinese greenway practices and serve as evidence for examining the value capture policy in the Chengdu Municipality. The empirical findings show a nonlinear relation between proximity to greenways and apartment prices and heterogeneity in the property value increments compared within four buffering zones along greenways. The comparison not only focuses on the extent to which the economic influence is asserted on proximate properties but also examines the capacity of the value capture policy adopted by the local authorities. In particular, it examines whether the 500-m area delineated by the local authorities is efficient for capturing the property value increments. On the one hand, greenways indeed contribute to the value increments to proximate properties. However, the benefit area is three times larger than the 500-m area delineated by the local authorities. On the other hand, the 500–1000-m area from greenways has the greatest economic influence on property value, rather than the 500-m area adjacent to greenways.
5.1. The Economic Influence of Mega Greenway Projects on Proximate Property Value
As the most famous “mega-trail” projects, the 1.5-mile High Line in New York, the Bloomingdale 606 Trail in Chicago, and the 33-mile Atlanta Beltline in Atalante cost 187 million, 95 million, and 4.8 billion USD, respectively [
4]. However, city-scale investigations of the economic influences of mega-greenway projects are still rare. Moreover, most existing studies have concentrated on greenway practices in the United States, as summarized by Crompton and Nicholls [
4]. Considering the differences in the housing market, housing preferences, and greenway development, there is also an urgent need for evidence in other countries, particularly in developing countries such as China. From this perspective, the Jincheng Greenway is a typical mega-greenway project, regardless of the size of the green spaces, the length of the trails, the total investment, or the large number of residents surrounding it. The project developed a green belt 85 km long and one kilometer wide, which approximately equals the sum of 22 New York Central Parks connected end to end. There are 1163 communities located within two kilometers of the Jincheng Greenway.
The empirical findings show that at the city scale, greenways strongly influence proximate property values. We found economic influences in the 1500-m-wide areas on both sides of the greenway, which helps to fill the research gap on the influence scope of greenways, particularly mega-greenways. Compared to a few studies with clear definitions of spatial extent [
10], this study shows that the benefit area around the Jincheng Greenway is larger. The possible reason for this difference is its large-scale green spaces, as well as diverse facilities funded by the local authorities. In the 1500-m-wide corridors on both sides of greenways, the property value increments are between 83 CNY and 365 CNY per square meter, approximately 0.6–2.5% of the mean apartment unit price (i.e., 14,430 CNY) of all apartments located within 1.5 km of the greenway. Moreover, the comparison between preowned apartment prices in 2017 and 2020 shows that high-price apartments increased along greenways, indicating greater economic influence of greenways on high-end apartments. However, it should be noted that the property increments are less than the findings in many other studies, while a review of 20 hedonic studies revealed an increase of between 3% and 5% due to greenways and trails [
4]. There could be two reasons for the disparities. On the one hand, in this study, we chose a larger area for hedonic analysis, while most existing studies focused on properties adjacent to greenways or a closer area with a proximity of less than 0.5 miles [
4]. On the other hand, the investigated properties are located in the suburban area of Chengdu, where apartment buyers are more price-sensitive than amenity-sensitive.
5.2. The Heterogeneous Effects of Greenway Proximity on Property Value Increments
Described as the process of capitalization of green spaces into the value of nearby properties, the “proximity principle” has been the basis of studies of property value increments associated with parks, green spaces, and, in particular, trails and greenways [
16]. Some scholars optimistically see proximity to greenways and green spaces as an important factor of environmental amenities and expect a linear positive correlation with property values. In other words, the closer a property is to a greenway, the higher the price. However, there has been growing evidence of heterogeneity in greenway capitalization [
20], particularly as concerns about traffic, vandalism, and crime have increased [
11]. A study on the Champlain Canalway Trail, a multiuse trail in northeastern New York, showed that greenways in suburban and rural areas can result in a 17% decrease in housing prices within 0.5 miles from the trail [
50]. However, the prices of houses located within a 0.5–1.0-mile area from the trail will increase by approximately 6%, indicating that housing buyers prefer a walking distance from a greenway rather than adjacent to it [
50]. Our investigation of the one-kilometer-wide greenway project reached a similar conclusion. Although the overall economic influences on property value are positive, the property increments are greater in areas 500–1000 m from the greenways than in the areas adjacent to the greenways. Moreover, using proximity to greenways as a key viable measure, the findings further show that the influence of greenway proximity is greater in the same area, that is between 500 m and 1000 m from the greenways. The unit apartment price decreases by 1.396 CNY, 2.383 CNY, and 1.125 CNY for every meter distance from the greenways in the 500-m, 500–1000 m, and 1000–1500 m areas, respectively. In addition, the unit apartment price increases by 1.550 CNY for every meter of distance from the greenways, and for the majority of the samples, every meter is close to the city center, which indicates that the economic influence of greenways no longer exists in this area.
The empirical findings suggest that the economic influences on proximate property values do not follow a linear relationship. It is lower in adjacent areas than in areas with a walking distance between 500 m and 1000 m from the greenways. The lower economic influence in adjacent areas could be associated with four issues. First, as existing studies have argued, crime, traffic, and vandalism could decrease the willingness to pay for properties adjacent to greenways. However, in this study, we assume that the possibility of such impacts could be minimized, considering that apartments are often located in gated communities and greenways are managed by professional agencies. Second, the Jincheng Greenway is a one-kilometer-wide green belt, which places properties adjacent to the greenway further away from the neighboring center. Although these properties may enjoy better proximity to greenways and even better scenic views of green spaces, they are also away from public facilities and commercial services due to their remote location [
51]. Third, the impact of the beltway should also be considered in this study. The beltway not only creates a boundary between communities but also brings environmental disamenity to the neighborhood, such as noise and air pollution [
52]. Fourth, differences in greenway development surcharges may also lead to heterogeneity, since the cost of land transfer fees for apartments within 500 m of greenways is higher.
5.3. Implications for Value Capture Policies and Greenway Development
Funding is a common problem in developing and managing greenways and is particularly challenging for emerging mega-greenway projects worldwide. In most countries, especially in China, the responsibility to raise funds belongs to the government, and therefore, a new greenway project could be an additional burden on local finances [
53]. For instance, in Wuhan, China, the local government had to sell three plots of state-owned land to raise funds for the East Lake Greenway Project [
54]. In the case of the Pearl River Delta Greenways, because of the lack of financial support, local governments must replace the original ideas of ecological corridors with bikeway-like greenways to decrease costs [
21,
23]. From this perspective, the Jincheng Greenway represents a new alternative and practical solution for raising funds for greenways. The Chengdu Municipal Government incorporates the value capture policy into the existing land transfer revenue. For each plot of land located within 500 m of the greenway, approximately 1 million CNY per
mu will be allocated to the greenway developer, accounting for approximately 5–10% of the total transfer fee. In this way, the local government managed to achieve two goals. First, the local government can capture property value increments upfront and invest funds to develop greenways before apartments are sold to buyers. Second, apartments can benefit from proximate green spaces and therefore have higher prices in terms of both first-time sale and property holding.
In the case of the Jincheng Greenway, two issues are overlooked in both policy design and academic studies. One is how to delineate the policy area, and the other is how to determine the amount of value increments associated with greenways. In this study, the empirical findings show that within the 500-m area delineated by the value capture policy, property increments exist but are less than expected. The unit price of apartments is 290 CNY higher than that of apartments located between the third and fifth beltways, accounting for approximately 2% of the average price in the whole area. However, the value capture policy requires approximately 5–10% of the total transfer fee for greenway development. In other words, the value capture policy set up a proportion that is higher than it should be in the 500-m area. The local authority needs to lower its proportion of the total land transfer fee. Moreover, we find that the proposed policy area is less than appreciated areas, while the economic influences on greenways can be found in a 1500-km buffer zone. The property value increase in the 500–1500 m area is neglected in the value capture policy, which causes a loss in the potential captured value. In particular, for properties that are located in the 500–1000 m area, there are greater property value increments than in the targeted areas. The value capture policy should be comprehensively and thoroughly revisited for a more accurate policy area.
For future policymaking on value capture associated with greenways, efficiency and effectiveness should be the keys to designing and implementing value capture policies. First, the efficiency of the value capture policy is highly dependent on institutional resources; therefore, the experiences of other cases need to be carefully adapted to the local context. For the Jincheng Greenway, the local authority managed to implement the value capture policy without a property tax system. Although capturing the potential value increments through land transfer fees is efficient, it also raises new issues. On the one hand, if the high-value lands are all sold or occupied, the sustainability of the policy could be undermined. On the other hand, if the housing market cools down, as occurs now in China, the land market will be hit hard, leading to the failure of the current value capture policy. Second, as we discussed mostly in this study, the issue of effectiveness refers to the delineation of the policy area and the setting of value increments. In the case of the Jincheng Greenway, neither the scope nor the amount complies with the actual value increment in the proximate apartments. The primary reason is that, although usually overlooked, heterogeneity exists in the influences of greenways on proximate properties. In fact, in addition to locational attributions, differences in structural and neighborhood dimensions could also be key factors of heterogeneity and should be further investigated in future studies.
6. Conclusions
As Fábos suggested, greenways usually fall into one of three major categories: ecologically significant corridors, recreational greenways, and greenways with historical heritage and cultural value [
2]. By improving the accessibility of ecological, recreational, and cultural resources, greenways also have a strong influence on proximate property values [
4]. These influences have been extensively studied because they refer not only to the attitudes of communities toward greenway development but also to the willingness of residents to pay for greenways [
9]. However, most of the existing studies are based on investigations on greenways at the neighborhood scale [
4], which has resulted in a lack of comprehensive examination of the economic influences of greenways on proximate property value, let alone emerging mega-greenway projects in the past decade. Moreover, during the last decade, although there have been widespread greenway practices arguing for the economic benefits of greenways in China, the actual economic benefits have rarely been examined. According to case studies in the Pearl River Delta, one possible reason is that the majority of developed greenways are bikeways with street greenery, and there is a lack of sufficient green space [
26,
28]. Hence, the Jincheng Greenway, a mega-greenway project recently implemented in Chengdu, provides essential evidence for understanding the heterogeneity in the economic influences of greenways on proximate property values. In addition, although the Jincheng Greenway has been featured in the land value capture policy, the hypothesis-based policy design of the anticipated value increment and influence scope has not been examined.
This study focuses on the property value increments along the Jincheng Greenways based on 106,328 transaction records from 3007 communities between 2017 and 2020. By applying the hedonic pricing approach, nine models are established to examine the property value increments in four areas along greenways according to their location and proximity to greenways. We find the economic benefits of greenways in terms of proximate apartment prices. As expected in the value capture policy, greenways strongly influence the properties within a 500-m area adjacent to greenways. There is an average increase of 297.98 CNY per square meter compared to other apartments located between the third and fifth beltways. Moreover, the apartment unit price will increase by 1.369 CNY per square meter if its location is one meter closer to the greenways. Furthermore, we find that the economic impact is more pronounced within 500–1000 m of greenways than within 500 m of greenways. Similarly, proximity to greenways has an even stronger effect on property value when comparing areas within 500–1000 m to those within 500 m of greenways. For every meter closer to greenways, the apartment unit price will increase by 2.382 CNY per square meter. By comparing the economic influences in different areas, we find that apartment prices and proximity to greenways are not linearly related. Moreover, to capture property increments effectively, local authorities need to redesign value capture policies based on extent and scope. In summary, this empirical analysis provides comprehensive evidence of the economic influences of greenways on proximate properties, suggesting a nonlinear relationship with proximity.
7. Limitations of This Study
This study has limitations in terms of data sampling and accuracy, which further constrains the variable specification and data analysis. First, the investigated transaction data come from Lianjia, and transactions that were conducted by other real estate brokerage agencies are not included in this study. Second, geographic deviation of apartment locations exists in this study. Lianjia does not provide the specific geographic location of each building in its database. We, therefore, determined the location according to the points of interest of the associated communities. The geographic deviation ranged from meters to hundreds of meters, considering the distance between the point of interest and the periphery of the community. If accurate geographic information could be added to the model, the economic influence could increase. Third, due to data availability in China and the data collection that we conducted, some variables were not included in the variable specification. For instance, because the apartment floor information in the Lianjia database only indicates its relative location in the building, we had to exclude apartment floors from the independent variables. Likewise, due to the lack of specific geographic locations of apartments, it was impossible to analyze the views of green spaces, rivers, and other resources with environmental value.


