
Have Agricultural Land-Use Carbon Emissions in China Peaked? An Analysis Based on Decoupling Theory and Spatial EKC Model

Abstract
1. Introduction
2. Approach and Data
2.1. Research Framework
2.2. Accounting Boundary of ALUCEs
2.3. Criteria for Assessing Emission-Peaking Process
2.4. Robustness Analysis for Peaking Process of ALUCEs
2.4.1. Tapio Decoupling Theory
2.4.2. Spatial EKC Model
2.5. Data Sources and Processing
3. Results and Analysis
3.1. Peaking Process of ALUCEs in China
3.1.1. Peaking Process of ALUCEs at the National Level
3.1.2. Peaking Process of ALUCEs at the Provincial Level
3.2. Robustness of the Peaking Process of ALUCEs Based on Decoupling Theory
3.2.1. Decoupling Analysis of ALUCEs and Agricultural GDP at the National Level
3.2.2. Decoupling Analysis of ALUCEs and Agricultural GDP at the Provincial Level
3.3. Robustness Test of ALUCE Peaking Process Based on Spatial Durbin Model
4. Discussion
4.1. Discussion of ALUCE Accounting
4.2. Discussion on the Peaking Process of ALUCEs
4.3. Limitations and Future Directions
5. Conclusions and Policy Recommendations
5.1. Conclusions
- (1)
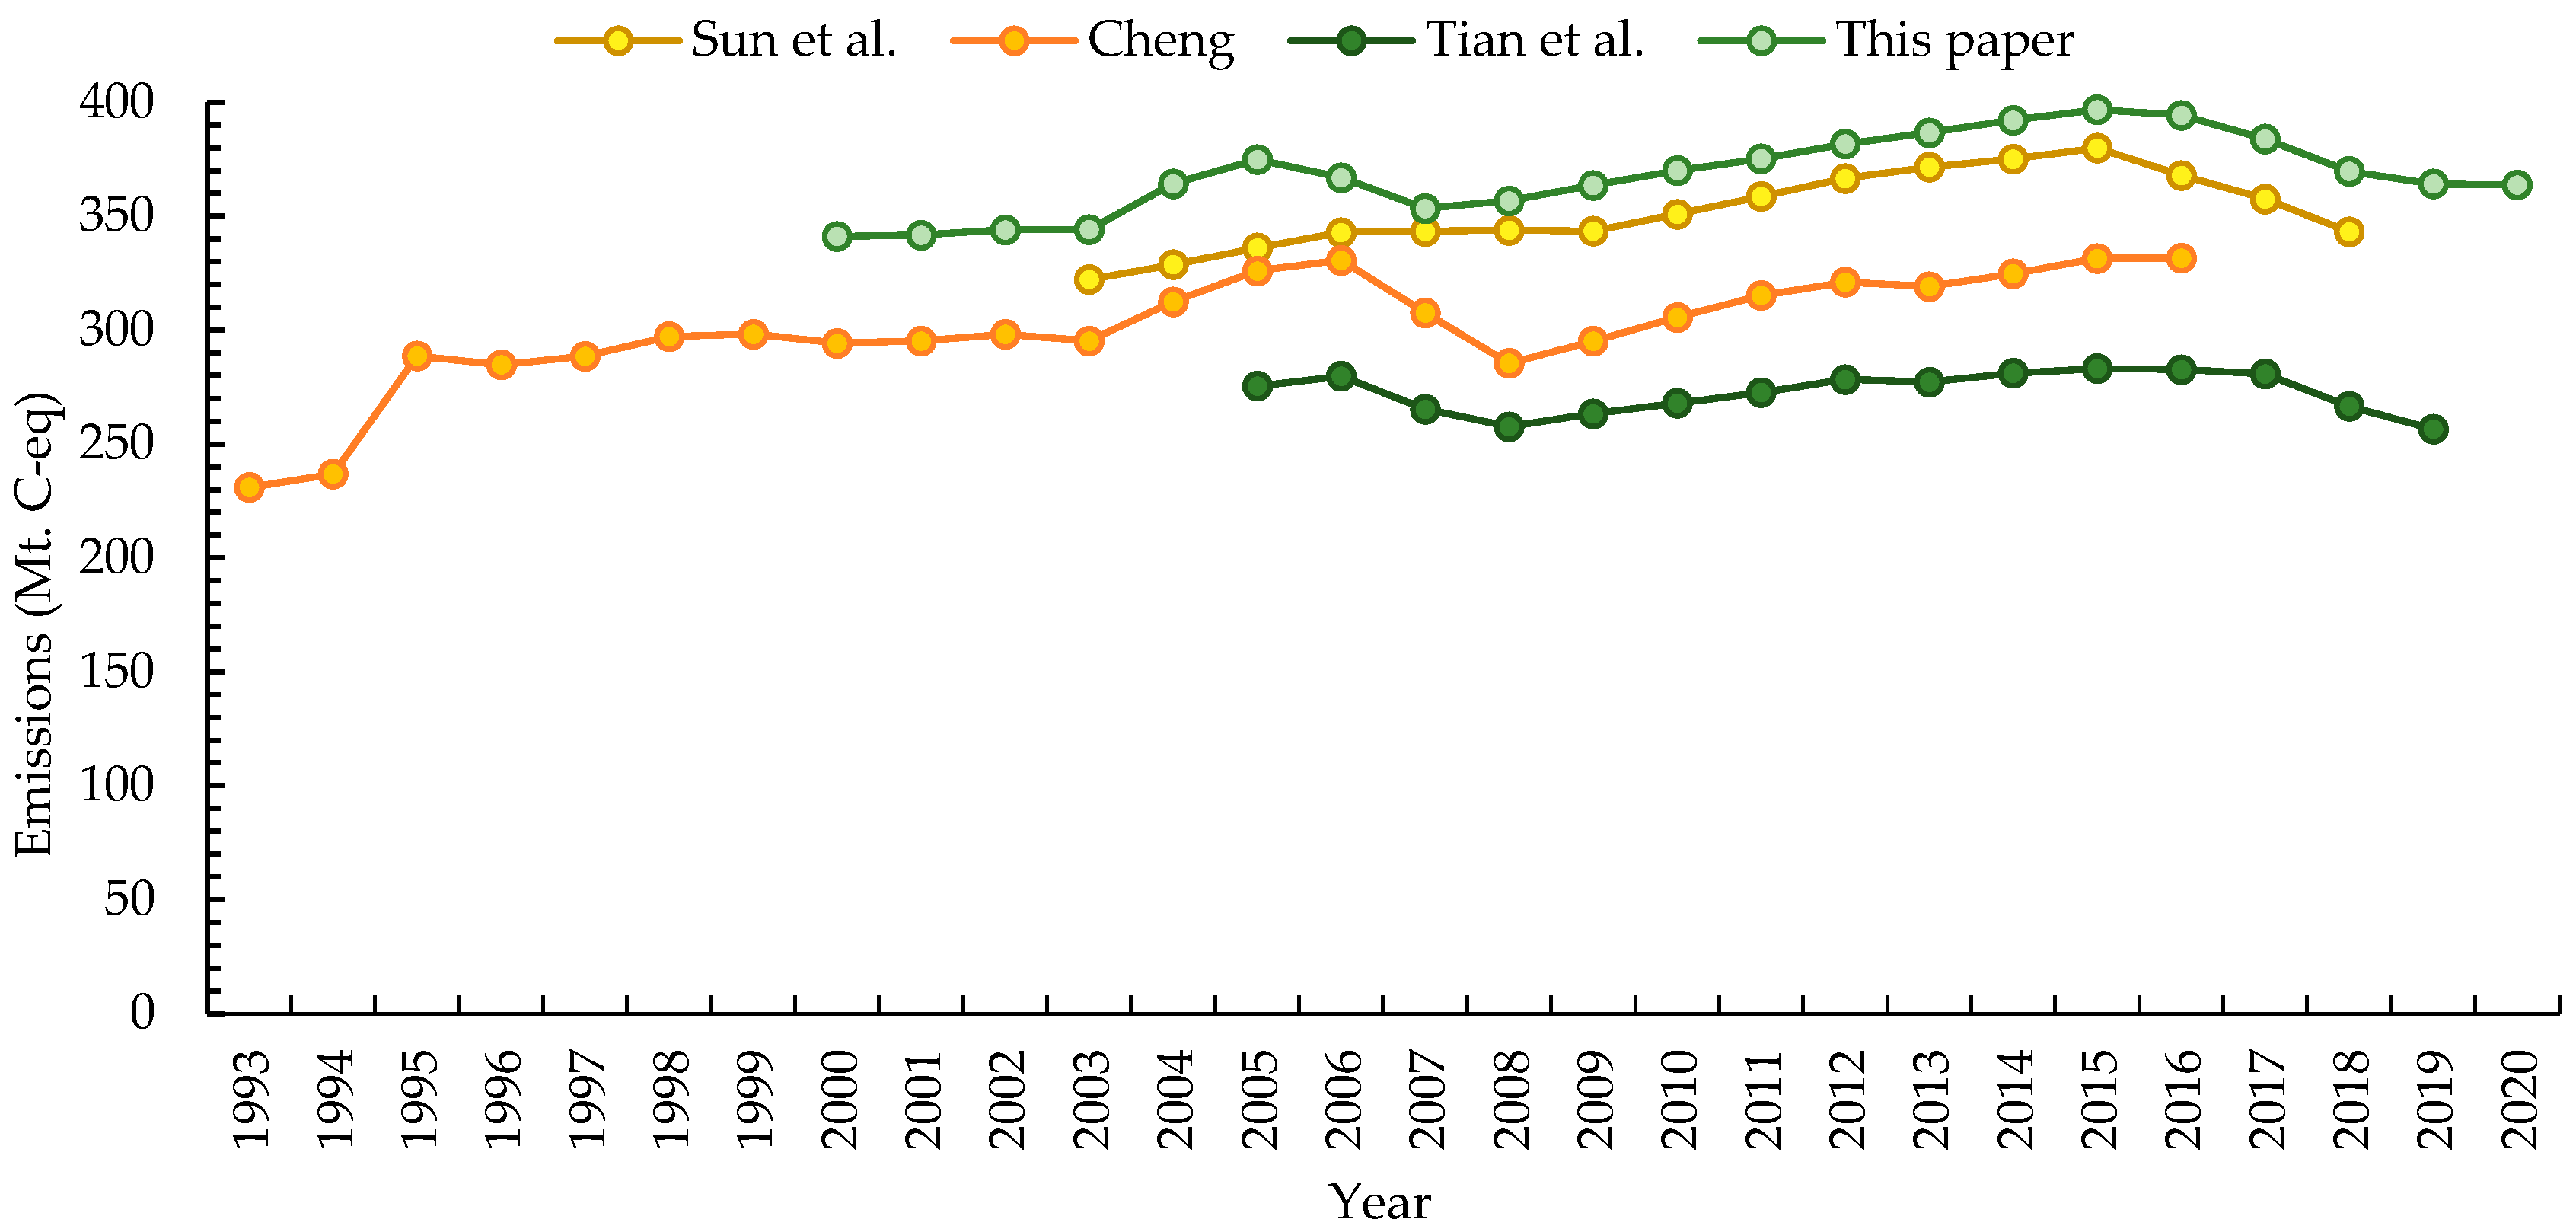
- Over 21 years, China’s ALUCEs averaged 368.1 Mt (1349.7 CO2-eq), with a historical maximum of 396.9 Mt C-eq (1455.3 CO2-eq) occurring in 2015. The annual change rate compared with the peak emissions was −1.7%, indicating that ALUCEs have entered the plateauing phase. In terms of emission structure, each carbon source’s annual average share decreased in the order of livestock breeding (36.6%), agricultural materials (21.3%), straw burning (17.0%), rice cultivation (16.9%), and soil management (8.2%). Emissions from agricultural materials and soil management had entered the declining period, while those from rice cultivation were in the peaking period, those from straw burning were still rising, and those from livestock breeding remained at the plateauing phase.
- (2)
- Based on the overall development and annual change rate after reaching the peak, ALUCEs in Beijing, Tianjin, and nine other provinces had been declining. Conversely, in Hainan, Guizhou, and nine other provinces, ALUCEs had plateaued, while those in Ningxia, Qinghai, and six other provinces were still peaking.
- (3)
- At a national scale, the long-term relationship between ALUCEs and agricultural GDP was weak decoupling. The short-term relationship was gradually moving towards strong decoupling from weak decoupling. At a provincial level, the connection changed from a diverse pattern to a polarized distribution pattern in which strong decoupling prevailed. The decoupling analysis verified that the emission-peaking states were stable even with agricultural growth.
- (4)
- Instead of an inverted U-shaped relationship between ALUCEs and economic development, there existed an N-shaped relationship. Consequently, more efforts should be paid to ALUCE mitigation to smoothly pass the plateauing phase. Additionally, the peaking process of ALUCEs had spillover effects between provinces, suggesting an opportunity to make spatial-coordinating policies to achieve emission peaking.
5.2. Policy Recommendations
Supplementary Materials
Author Contributions
Funding
Data Availability Statement
Acknowledgments
Conflicts of Interest
References
- Lamb, A.; Green, R.; Bateman, I.; Broadmeadow, M.; Bruce, T.; Burney, J.; Carey, P.; Chadwick, D.; Crane, E.; Field, R.; et al. The potential for land sparing to offset greenhouse gas emissions from agriculture. Nat. Clim. Chang. 2016, 6, 488–492. [Google Scholar] [CrossRef]
- Searchinger, T.D.; Wirsenius, S.; Beringer, T.; Dumas, P. Assessing the efficiency of changes in land use for mitigating climate change. Nature 2018, 564, 249–253. [Google Scholar] [CrossRef]
- Han, J.; Qu, J.; Wang, D.; Maraseni, T.N. Accounting for and comparison of greenhouse gas (GHG) emissions between crop and livestock sectors in China. Land 2023, 12, 1787. [Google Scholar] [CrossRef]
- Yu, Z.; Zhang, F.; Gao, C.; Mangi, E.; Ali, C. The potential for bioenergy generated on marginal land to offset agricultural greenhouse gas emissions in China. Renew. Sustain. Energy Rev. 2024, 189, 113924. [Google Scholar] [CrossRef]
- Bennetzen, E.H.; Smith, P.; Porter, J.R. Decoupling of greenhouse gas emissions from global agricultural production: 1970–2050. Glob. Chang. Biol. 2016, 22, 763–781. [Google Scholar] [CrossRef]
- Su, K.; Lee, C. When will China achieve its carbon emission peak? A scenario analysis based on optimal control and the STIRPAT model. Ecol. Indic. 2020, 112, 106138. [Google Scholar] [CrossRef]
- Liao, C.; Nolte, K.; Brown, D.G.; Lay, J.; Agrawal, A. The carbon cost of agricultural production in the global land rush. Glob. Environ. Chang. 2023, 80, 102679. [Google Scholar] [CrossRef]
- Saha, D.; Basso, B.; Robertson, G.P. Machine learning improves predictions of agricultural nitrous oxide (N2O) emissions from intensively managed cropping systems. Environ. Res. Lett. 2021, 16, 24004. [Google Scholar] [CrossRef]
- Chen, M.; Xiao, H.; Zhao, H.; Liu, L. The power of attention: Government climate-risk attention and agricultural-land carbon emissions. Environ. Res. 2024, 251, 118661. [Google Scholar] [CrossRef]
- West, T.O.; Brandt, C.C.; Baskaran, L.M.; Hellwinckel, C.M.; Mueller, R.; Bernacchi, C.J.; Bandaru, V.; Yang, B.; Wilson, B.S.; Marland, G.; et al. Cropland carbon fluxes in the United States: Increasing geospatial resolution of inventory-based carbon accounting. Ecol. Appl. 2010, 20, 1074–1086. [Google Scholar] [CrossRef]
- Jiang, Z.; Zhong, Y.; Yang, J.; Wu, Y.; Li, H.; Zheng, L. Effect of nitrogen fertilizer rates on carbon footprint and ecosystem service of carbon sequestration in rice production. Sci. Total Environ. 2019, 670, 210–217. [Google Scholar] [CrossRef]
- Guenet, B.; Gabrielle, B.; Chenu, C.; Arrouays, D.; Balesdent, J.; Bernoux, M.; Bruni, E.; Caliman, J.P.; Cardinael, R.; Chen, S.; et al. Can N2O emissions offset the benefits from soil organic carbon storage? Glob. Chang. Biol. 2021, 27, 237–256. [Google Scholar] [CrossRef]
- Laamrani, A.; Voroney, P.R.; Gillespie, A.W.; Chehbouni, A. Development of a land use carbon inventory for agricultural soils in the Canadian province of Ontario. Land 2021, 10, 765. [Google Scholar] [CrossRef]
- Sun, J.; Peng, H.; Chen, J.; Wang, X.; Wei, M.; Li, W.; Yang, L.; Zhang, Q.; Wang, W.; Mellouki, A. An estimation of CO2 emission via agricultural crop residue open field burning in China from 1996 to 2013. J. Clean. Prod. 2016, 112, 2625–2631. [Google Scholar] [CrossRef]
- Wang, S.; Zhao, Y.; Wang, J.; Zhu, P.; Cui, X.; Han, X.; Xu, M.; Lu, C. The efficiency of long-term straw return to sequester organic carbon in Northeast China’s cropland. J. Integr. Agric. 2018, 17, 436–448. [Google Scholar] [CrossRef]
- Bellarby, J.; Tirado, R.; Leip, A.; Weiss, F.; Lesschen, J.P.; Smith, P. Livestock greenhouse gas emissions and mitigation potential in Europe. Glob. Chang. Biol. 2013, 19, 3–18. [Google Scholar] [CrossRef]
- Hao, D.; Wang, R.; Gao, C.; Song, X.; Liu, W.; Hu, G. Spatial-temporal characteristics and influence factors of carbon emission from livestock industry in China. Int. J. Environ. Res. Public Health 2022, 19, 14837. [Google Scholar] [CrossRef]
- Herrero, M.; Henderson, B.; Havlík, P.; Thornton, P.K.; Conant, R.T.; Smith, P.; Wirsenius, S.; Hristov, A.N.; Gerber, P.; Gill, M.; et al. Greenhouse gas mitigation potentials in the livestock sector. Nat. Clim. Chang. 2016, 6, 452–461. [Google Scholar] [CrossRef]
- Wu, H.; Huang, H.; Chen, W.; Meng, Y. Estimation and spatiotemporal analysis of the carbon-emission efficiency of crop production in China. J. Clean. Prod. 2022, 371, 133516. [Google Scholar] [CrossRef]
- Liang, D.; Lu, X.; Zhuang, M.; Shi, G.; Hu, C.; Wang, S.; Hao, J. China’s greenhouse gas emissions for cropping systems from 1978–2016. Sci. Data 2021, 8, 171. [Google Scholar] [CrossRef]
- IPCC. 2019 Refinement to the 2006 IPCC Guidelines for National Greenhouse Gas Inventories. 2019. Available online: https://www.ipcc-nggip.iges.or.jp/public/2019rf/index.html (accessed on 27 March 2024).
- Bai, Y.; Wang, Y.; Xuan, X.; Weng, C.; Huang, X.; Deng, X. Tele-connections, driving forces and scenario simulation of agricultural land, water use and carbon emissions in China’s trade. Resour. Conserv. Recycl. 2024, 203, 107433. [Google Scholar] [CrossRef]
- Khoshnevisan, B.; Rafiee, S.; Omid, M.; Mousazadeh, H. Applying data envelopment analysis approach to improve energy efficiency and reduce GHG (greenhouse gas) emission of wheat production. Energy 2013, 58, 588–593. [Google Scholar] [CrossRef]
- Cheng, K.; Pan, G.; Smith, P.; Luo, T.; Li, L.; Zheng, J.; Zhang, X.; Han, X.; Yan, M. Carbon footprint of China’s crop production—An estimation using agro-statistics data over 1993–2007. Agric. Ecosyst. Environ. 2011, 142, 231–237. [Google Scholar] [CrossRef]
- Tian, Y.; Zhang, J.; He, Y. Research on spatial-temporal characteristics and driving factor of agricultural carbon emissions in China. J. Integr. Agric. 2014, 13, 1393–1403. [Google Scholar] [CrossRef]
- Tian, Y.; Pu, C.; Wu, G. New evidence on the impact of No-tillage management on agricultural carbon emissions. Environ. Sci. Pollut. Res. 2023, 30, 105856–105872. [Google Scholar] [CrossRef]
- Sun, B.; Xu, X. Spatial–temporal evolution of the relationship between agricultural material inputs and agricultural greenhouse gas emissions: Experience from China 2003–2018. Environ. Sci. Pollut. Res. 2022, 29, 46600–46611. [Google Scholar] [CrossRef]
- Ministry of Ecology and Environment of the People’s Republic of China. The People’s Republic of China Second Biennial Update Report on Climate Change. 2018. Available online: https://unfccc.int/documents/197666 (accessed on 27 March 2024).
- Cheng, L. Spatial and Temporal Differentiation of China’s Agricultural Carbon Productivity: Mechanism and Demonstration. Ph.D. Thesis, Huazhong Agricultural University, Wuhan, China, 2018. [Google Scholar]
- Tian, Y.; Yin, M. Re-evaluation of China’s agricultural carbon emissions: Basic status, dynamic evolution and spatial spillover effects. Chin. Rural Econ. 2022, 3, 104–127. [Google Scholar]
- Zhang, J.; Tian, H.; Shi, H.; Zhang, J.; Wang, X.; Pan, S.; Yang, J. Increased greenhouse gas emissions intensity of major croplands in China: Implications for food security and climate change mitigation. Glob. Chang. Biol. 2020, 26, 6116–6133. [Google Scholar] [CrossRef]
- Wu, H.; Sipiläinen, T.; He, Y.; Huang, H.; Luo, L.; Chen, W.; Meng, Y. Performance of cropland low-carbon use in China: Measurement, spatiotemporal characteristics, and driving factors. Sci. Total Environ. 2021, 800, 149552. [Google Scholar] [CrossRef]
- Ye, X.; Cheng, Y.; Zhang, Y.; Wu, Z.; Li, Q.; Liu, C. Scenario simulation, main paths and policy measures of greenhouse gas emission reduction of agricultural activities in China. Issues Agric. Econ. 2022, 2, 4–16. [Google Scholar]
- Zhang, Y.; Yan, J. The false appearance of peaking carbon emissions in China’s beef cattle industry: Empirical analysis and test based on EKC theory. Issues Agric. Econ. 2022, 93–105. [Google Scholar]
- Li, H.; Qin, Q. Challenges for China’s carbon emissions peaking in 2030: A decomposition and decoupling analysis. J. Clean. Prod. 2019, 207, 857–865. [Google Scholar] [CrossRef]
- Shi, C. Decoupling analysis and peak prediction of carbon emission based on decoupling theory. Sustain. Comput. Inform. Syst. 2020, 28, 100424. [Google Scholar] [CrossRef]
- Jiang, J.; Zhao, T.; Wang, J. Decoupling analysis and scenario prediction of agricultural CO2 emissions: An empirical analysis of 30 provinces in China. J. Clean. Prod. 2021, 320, 128798. [Google Scholar] [CrossRef]
- Xu, G.; Li, J.; Schwarz, P.M.; Yang, H.; Chang, H. Rural financial development and achieving an agricultural carbon emissions peak: An empirical analysis of Henan Province, China. Environ. Dev. Sustain. 2022, 24, 12936–12962. [Google Scholar] [CrossRef]
- Chen, X.; Shuai, C.; Wu, Y.; Zhang, Y. Analysis on the carbon emission peaks of China’s industrial, building, transport, and agricultural sectors. Sci. Total Environ. 2020, 709, 135768. [Google Scholar] [CrossRef]
- Cubasch, U.; Wuebbles, D.; Chen, D.; Facchini, M.C.; Frame, D.; Mahowald, N.; Winther, J. Climate Change 2013: The Physical Science Basis. Contribution of Working Group I to the Fifth Assessment Report of the Intergovernmental Panel on Climate Change; Cambridge University Press: Cambridge, UK; New York, NY, USA, 2013. [Google Scholar]
- Zhang, L.; Wan, X.; Jinag, H.; Li, X.; Xu, S.; Cai, B. Quantitative evaluation on the status of CO2 emissions: Peak period, plateau period, and decline period. Environ. Eng. 2021, 39, 1–7. [Google Scholar]
- Intergovernmental Panel on Climate Change. Climate Change 2007: The Physical Science Basis: Working Group I Contribution to the Fourth Assessment Report of The Intergovernmental Panel on Climate Change; Cambridge University Press: New York, NY, USA, 2007. [Google Scholar]
- Li, B.; Zhang, J.B.; Li, H.P. Research on spatial-temporal characteristics and affecting factors decomposition of agricultural carbon emission in China. China Popul. Resour. Environ. 2011, 21, 80–86. [Google Scholar] [CrossRef]
- PRC National Development and Reform Commission. Guidelines for the Preparation of Provincial Greenhouse Gas Inventories (Trial); PRC National Development and Reform Commission: Beijing, China, 2011.


| Criteria | Peaking Process |
|---|---|
| Carbon emissions fluctuate within ±1% of the peak emissions | Peaking |
| Annual change rate compared to the peak emissions is between −1% and −2%. | Plateauing |
| Annual change rate compared to the peak emissions is lower than −2% | Declining |
| Variable | Unit | Explanation | Mean | Std. Dev. | Min | Max | |
|---|---|---|---|---|---|---|---|
| Core explanatory variable | Agricultural GDP per person/AGDP | 104 CNY/Person | The ratio of agricultural GDP to agricultural employees | 1.953 | 1.420 | 0.247 | 8.637 |
| Squared term of agricultural GDP per person/AGDP2 | 104 CNY/Person | The square term of the ratio of agricultural GDP to agricultural employees | 5.829 | 9.396 | 0.061 | 74.601 | |
| Cube term of agricultural GDP per person/AGDP3 | 104 CNY/Person | The cubic term of the ratio of agricultural GDP to agricultural employees | 23.918 | 64.083 | 0.015 | 644.345 | |
| Control variable | Proportion of Agricultural Sector (agristruc) | - | Ratio of output value of non-planting industry to total output value of agriculture | 0.477 | 0.086 | 0.260 | 0.661 |
| Crop Planting Structure (cropstruc) | - | Ratio of area of economic crops to total planting area of crops | 0.342 | 0.132 | 0.029 | 0.646 | |
| Animal farming structure (animal) | - | Ratio of number of herbivorous animals to total number of animals raised | 0.488 | 0.253 | 0.094 | 0.987 | |
| Degree of agricultural mechanization (machine) | kW/Person | Ratio of total agricultural machinery power to number of laborers | 3.499 | 2.163 | 0.383 | 12.593 | |
| Degree of Agricultural Disasters (disaster) | - | Ratio of disaster-affected agricultural area to total crop planting area | 0.231 | 0.162 | 0.000 | 0.936 | |
| Financial Support for Agriculture (fiscal) | - | Proportion of agricultural expenditure in total fiscal budget expenditure | 0.090 | 0.042 | 0.012 | 0.204 | |
| Degree of urbanization (urban) | - | Ratio of urban population to total population | 0.506 | 0.166 | 0.131 | 0.896 | |
| Intensity of environmental protection (environ) | - | Proportion of environmental protection expenditure in total fiscal budget expenditure | 0.031 | 0.012 | 0.008 | 0.068 | |
| Intensity of Technology Investment (tech) | - | Proportion of expenditure on scientific research activities in total fiscal budget expenditure | 0.020 | 0.014 | 0.004 | 0.072 | |
| Variable | Model 1 (Classical Squared Function) | Model 2 (Cubic Function without Control Variables) | Model 3 (Cubic Function with Control Variables) | |||
|---|---|---|---|---|---|---|
| Coefficient | z-Score | Coefficient | z-Score | Coefficient | z-Score | |
| AGDP | 0.835 *** | 5.33 | 1.563 *** | 4.07 | 0.967 *** | 3.32 |
| AGDP2 | −0.063 *** | −3.60 | −0.262 *** | −3.02 | −0.150 *** | −2.67 |
| AGDP3 | 0.016 *** | 2.58 | 0.008 ** | 2.25 | ||
| agristruc | −0.702 | −1.05 | ||||
| cropstruc | −0.465 | −1.22 | ||||
| animal | 0.941 ** | 2.53 | ||||
| machine | 0.145 *** | 3.39 | ||||
| disaster | −0.079 | −0.95 | ||||
| fiscal | −1.798 * | −1.77 | ||||
| urban | −1.290 *** | −3.43 | ||||
| environ | −4.998 ** | −2.32 | ||||
| tech | 3.124 | 0.98 | ||||
| W × AGDP | −0.225 | −1.46 | −0.718 | −1.38 | −0.801 ** | −2.34 |
| W × AGDP2 | 0.008 | 0.42 | 0.102 | 0.73 | 0.191 ** | 2.21 |
| W × AGDP3 | −0.005 | −0.45 | −0.014 * | −1.97 | ||
| W × agristruc | 2.318 *** | 3.86 | ||||
| W × cropstruc | −0.185 | −0.29 | ||||
| W × animal | 0.742 | 1.01 | ||||
| W × machine | −0.078 | −1.12 | ||||
| W × disaster | −0.253 * | −1.68 | ||||
| W × fiscal | 3.099 * | 1.71 | ||||
| W × urban | 1.373 ** | 2.29 | ||||
| W × environ | −9.255 | −1.16 | ||||
| W × tech | 0.134 | 0.02 | ||||
| ρ | 0.196 ** | 2.57 | 0.213 ** | 2.25 | 0.106 | 1.22 |
| Hausman | 24.01 | 29.19 | 27.05 | |||
| Wald-SAR | 28.52 | 48.11 | 71.87 | |||
| Wald-SEM | 21.92 | 36.69 | 71.37 | |||
| LR-SAR | 27.46 | 45.44 | 67.88 | |||
| LR-SEM | 21.45 | 39.93 | 68.24 | |||
| R2 | 0.6368 | 0.672 | 0.7928 | |||
| Log-pseudolikelihood | −47.7003 | −15.8746 | 126.1126 | |||
| Observations | 630 | 630 | 630 | |||
Disclaimer/Publisher’s Note: The statements, opinions and data contained in all publications are solely those of the individual author(s) and contributor(s) and not of MDPI and/or the editor(s). MDPI and/or the editor(s) disclaim responsibility for any injury to people or property resulting from any ideas, methods, instructions or products referred to in the content. |
© 2024 by the authors. Licensee MDPI, Basel, Switzerland. This article is an open access article distributed under the terms and conditions of the Creative Commons Attribution (CC BY) license (https://creativecommons.org/licenses/by/4.0/).
Share and Cite
Wu, H.; Ding, B.; Liu, L.; Zhou, L.; Meng, Y.; Zheng, X. Have Agricultural Land-Use Carbon Emissions in China Peaked? An Analysis Based on Decoupling Theory and Spatial EKC Model. Land 2024, 13, 585. https://doi.org/10.3390/land13050585
Wu H, Ding B, Liu L, Zhou L, Meng Y, Zheng X. Have Agricultural Land-Use Carbon Emissions in China Peaked? An Analysis Based on Decoupling Theory and Spatial EKC Model. Land. 2024; 13(5):585. https://doi.org/10.3390/land13050585
Chicago/Turabian StyleWu, Haoyue, Bangwen Ding, Lu Liu, Lei Zhou, Yue Meng, and Xiangjiang Zheng. 2024. "Have Agricultural Land-Use Carbon Emissions in China Peaked? An Analysis Based on Decoupling Theory and Spatial EKC Model" Land 13, no. 5: 585. https://doi.org/10.3390/land13050585
APA StyleWu, H., Ding, B., Liu, L., Zhou, L., Meng, Y., & Zheng, X. (2024). Have Agricultural Land-Use Carbon Emissions in China Peaked? An Analysis Based on Decoupling Theory and Spatial EKC Model. Land, 13(5), 585. https://doi.org/10.3390/land13050585