
Spatio-Temporal Dynamics of Carbon Emissions and Their Influencing Factors at the County Scale: A Case Study of Zhejiang Province, China

 , ,
, ,
Abstract
1. Introduction
2. Materials and Methods
2.1. Research Framework
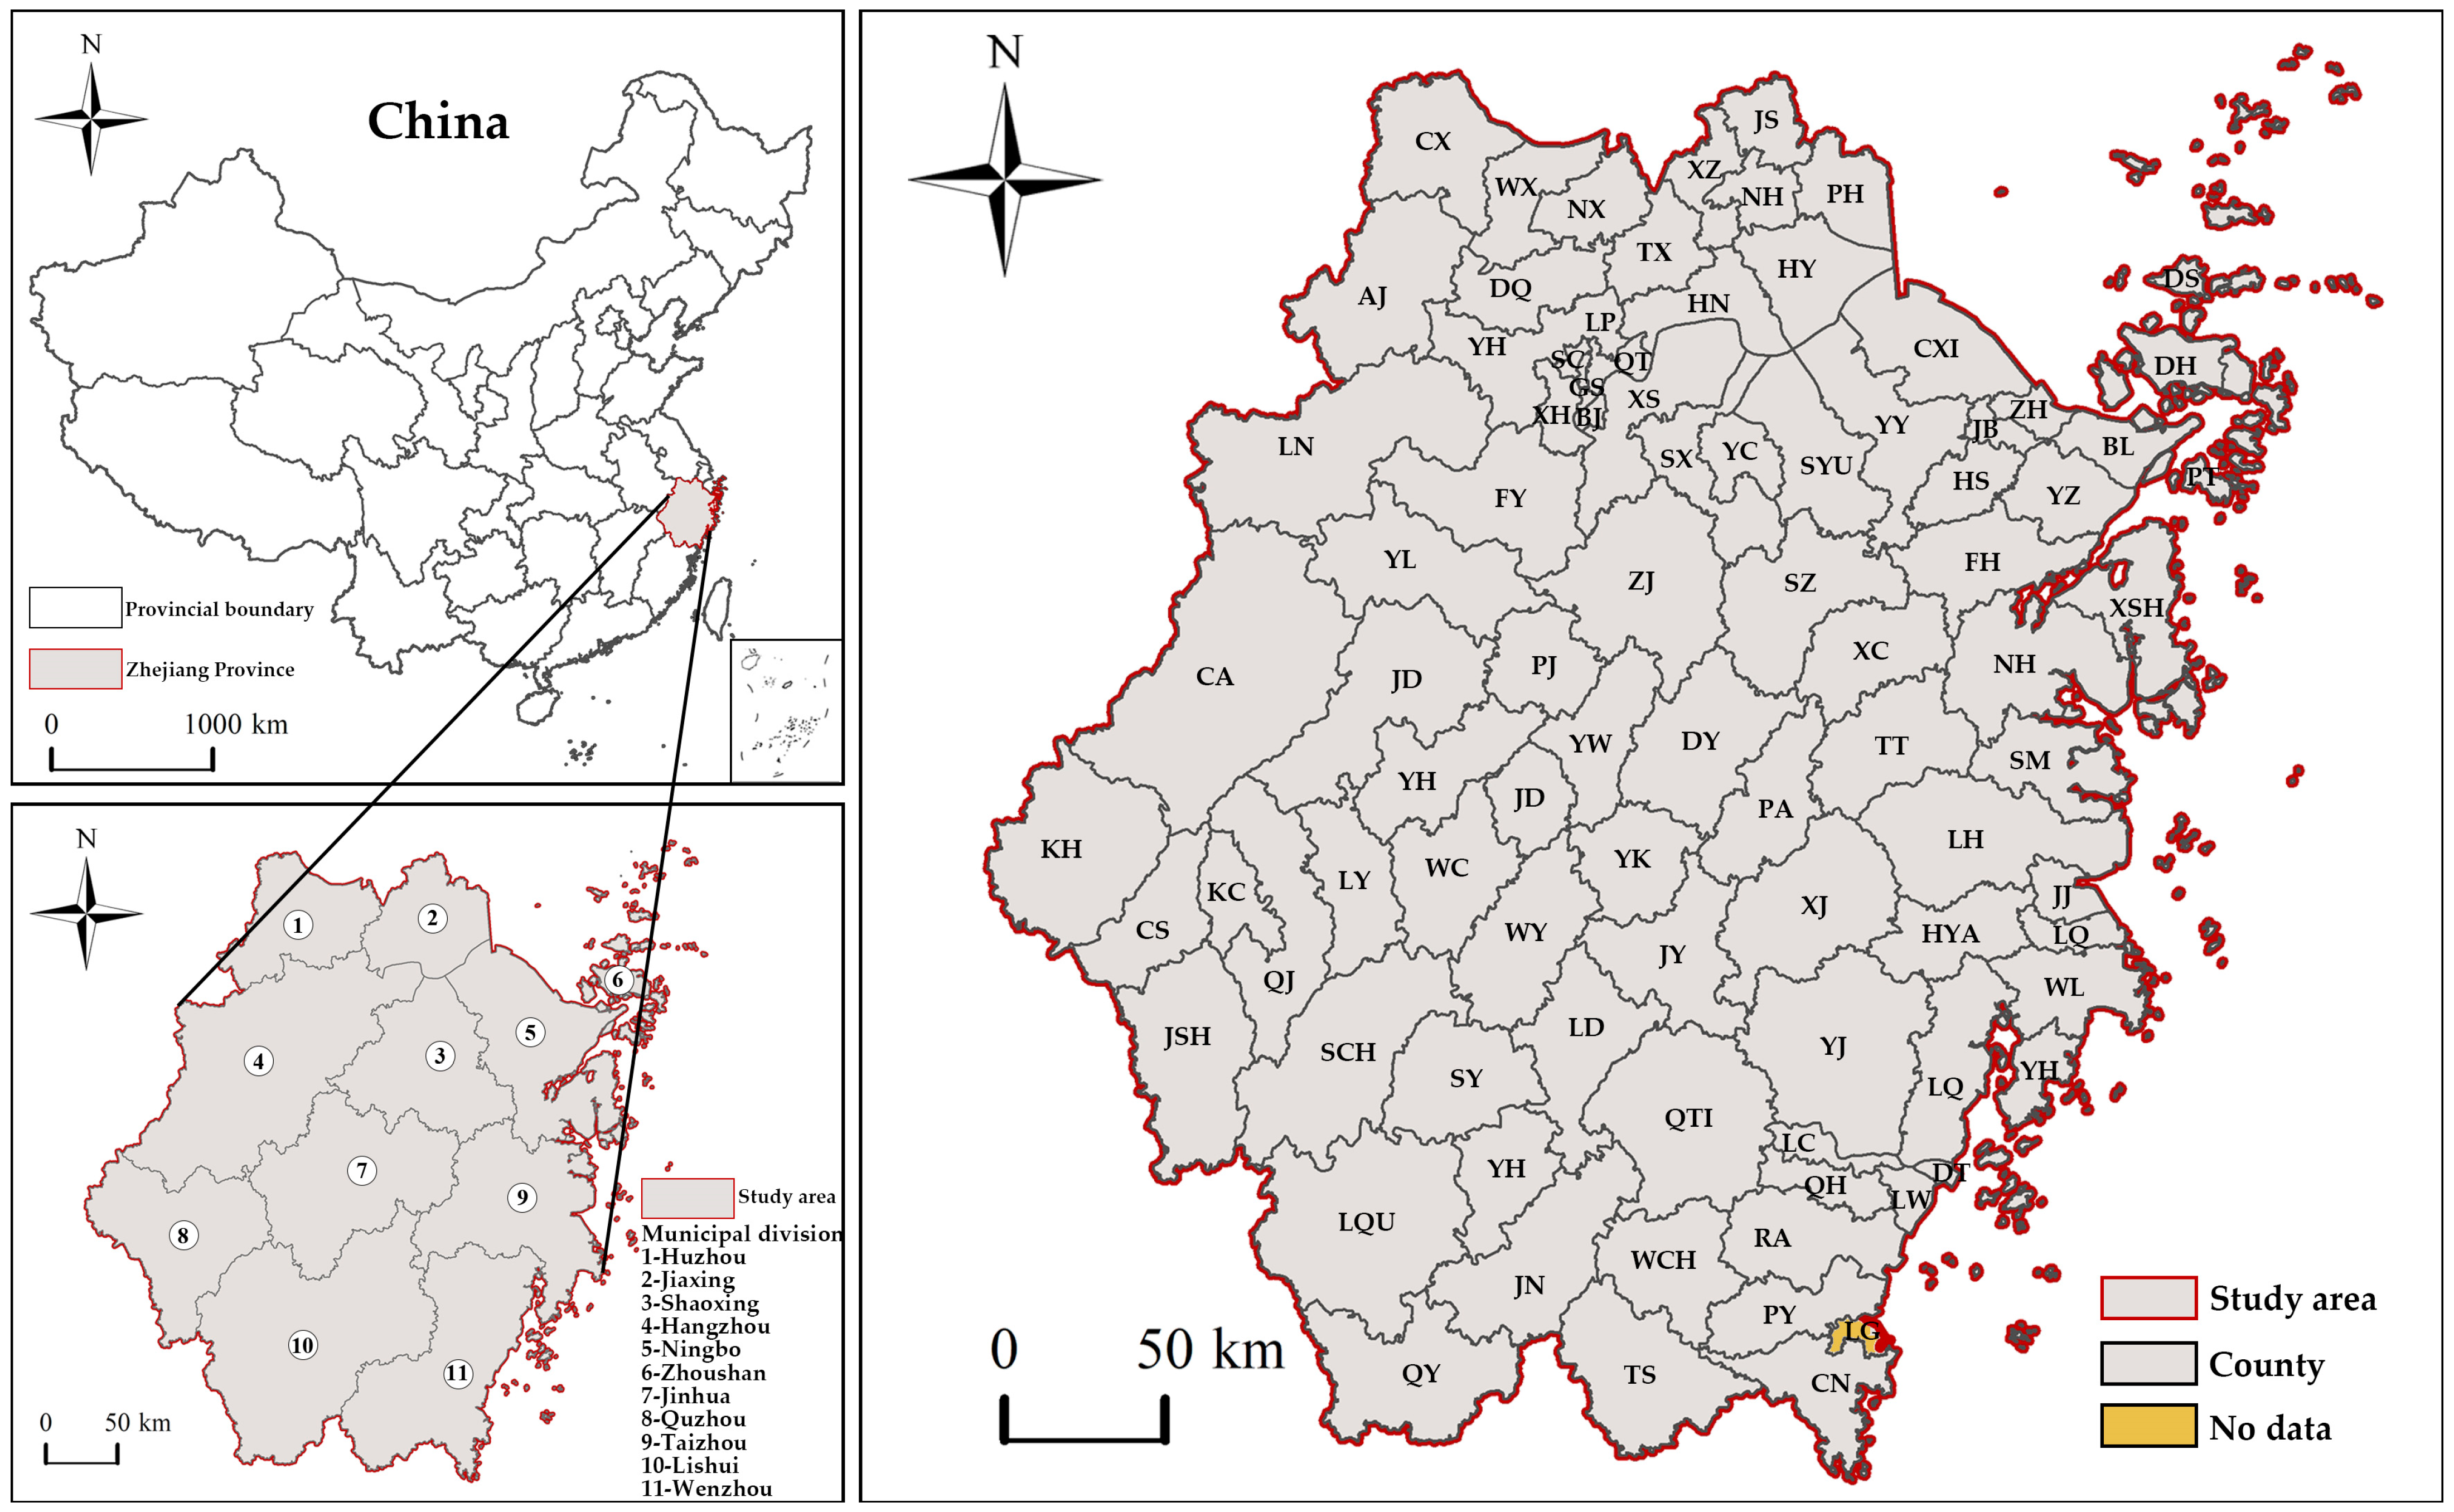
2.2. Research Area
2.3. Data Sources
2.4. Methods for Studying the Spatio-Temporal Dynamics of Carbon Emissions
2.4.1. LISA Time Path
2.4.2. Spatio-Temporal Transition
2.4.3. Standard Deviational Ellipse and Gravity Center Migration
2.5. Methods for Studying the Factors Influencing Carbon Emissions
2.5.1. Indicator Selection and Processing
2.5.2. Spatio-Temporal Geographically Weighted Regression Model
3. Results
3.1. Analysis of LISA Time Paths
3.1.1. Analysis of Relative Length
3.1.2. Analysis of Curvature
3.1.3. Analysis of Transition Directions
3.2. Analysis of Spatio-Temporal Transition
3.3. Standard Deviational Ellipse and Gravity Center Migration Analysis of Carbon Emissions
3.4. Analysis of Spatio-Temporal Heterogeneity of Carbon Emission Influencing Factors
3.4.1. Construction of GTWR Model and Analysis of Regression Model Results
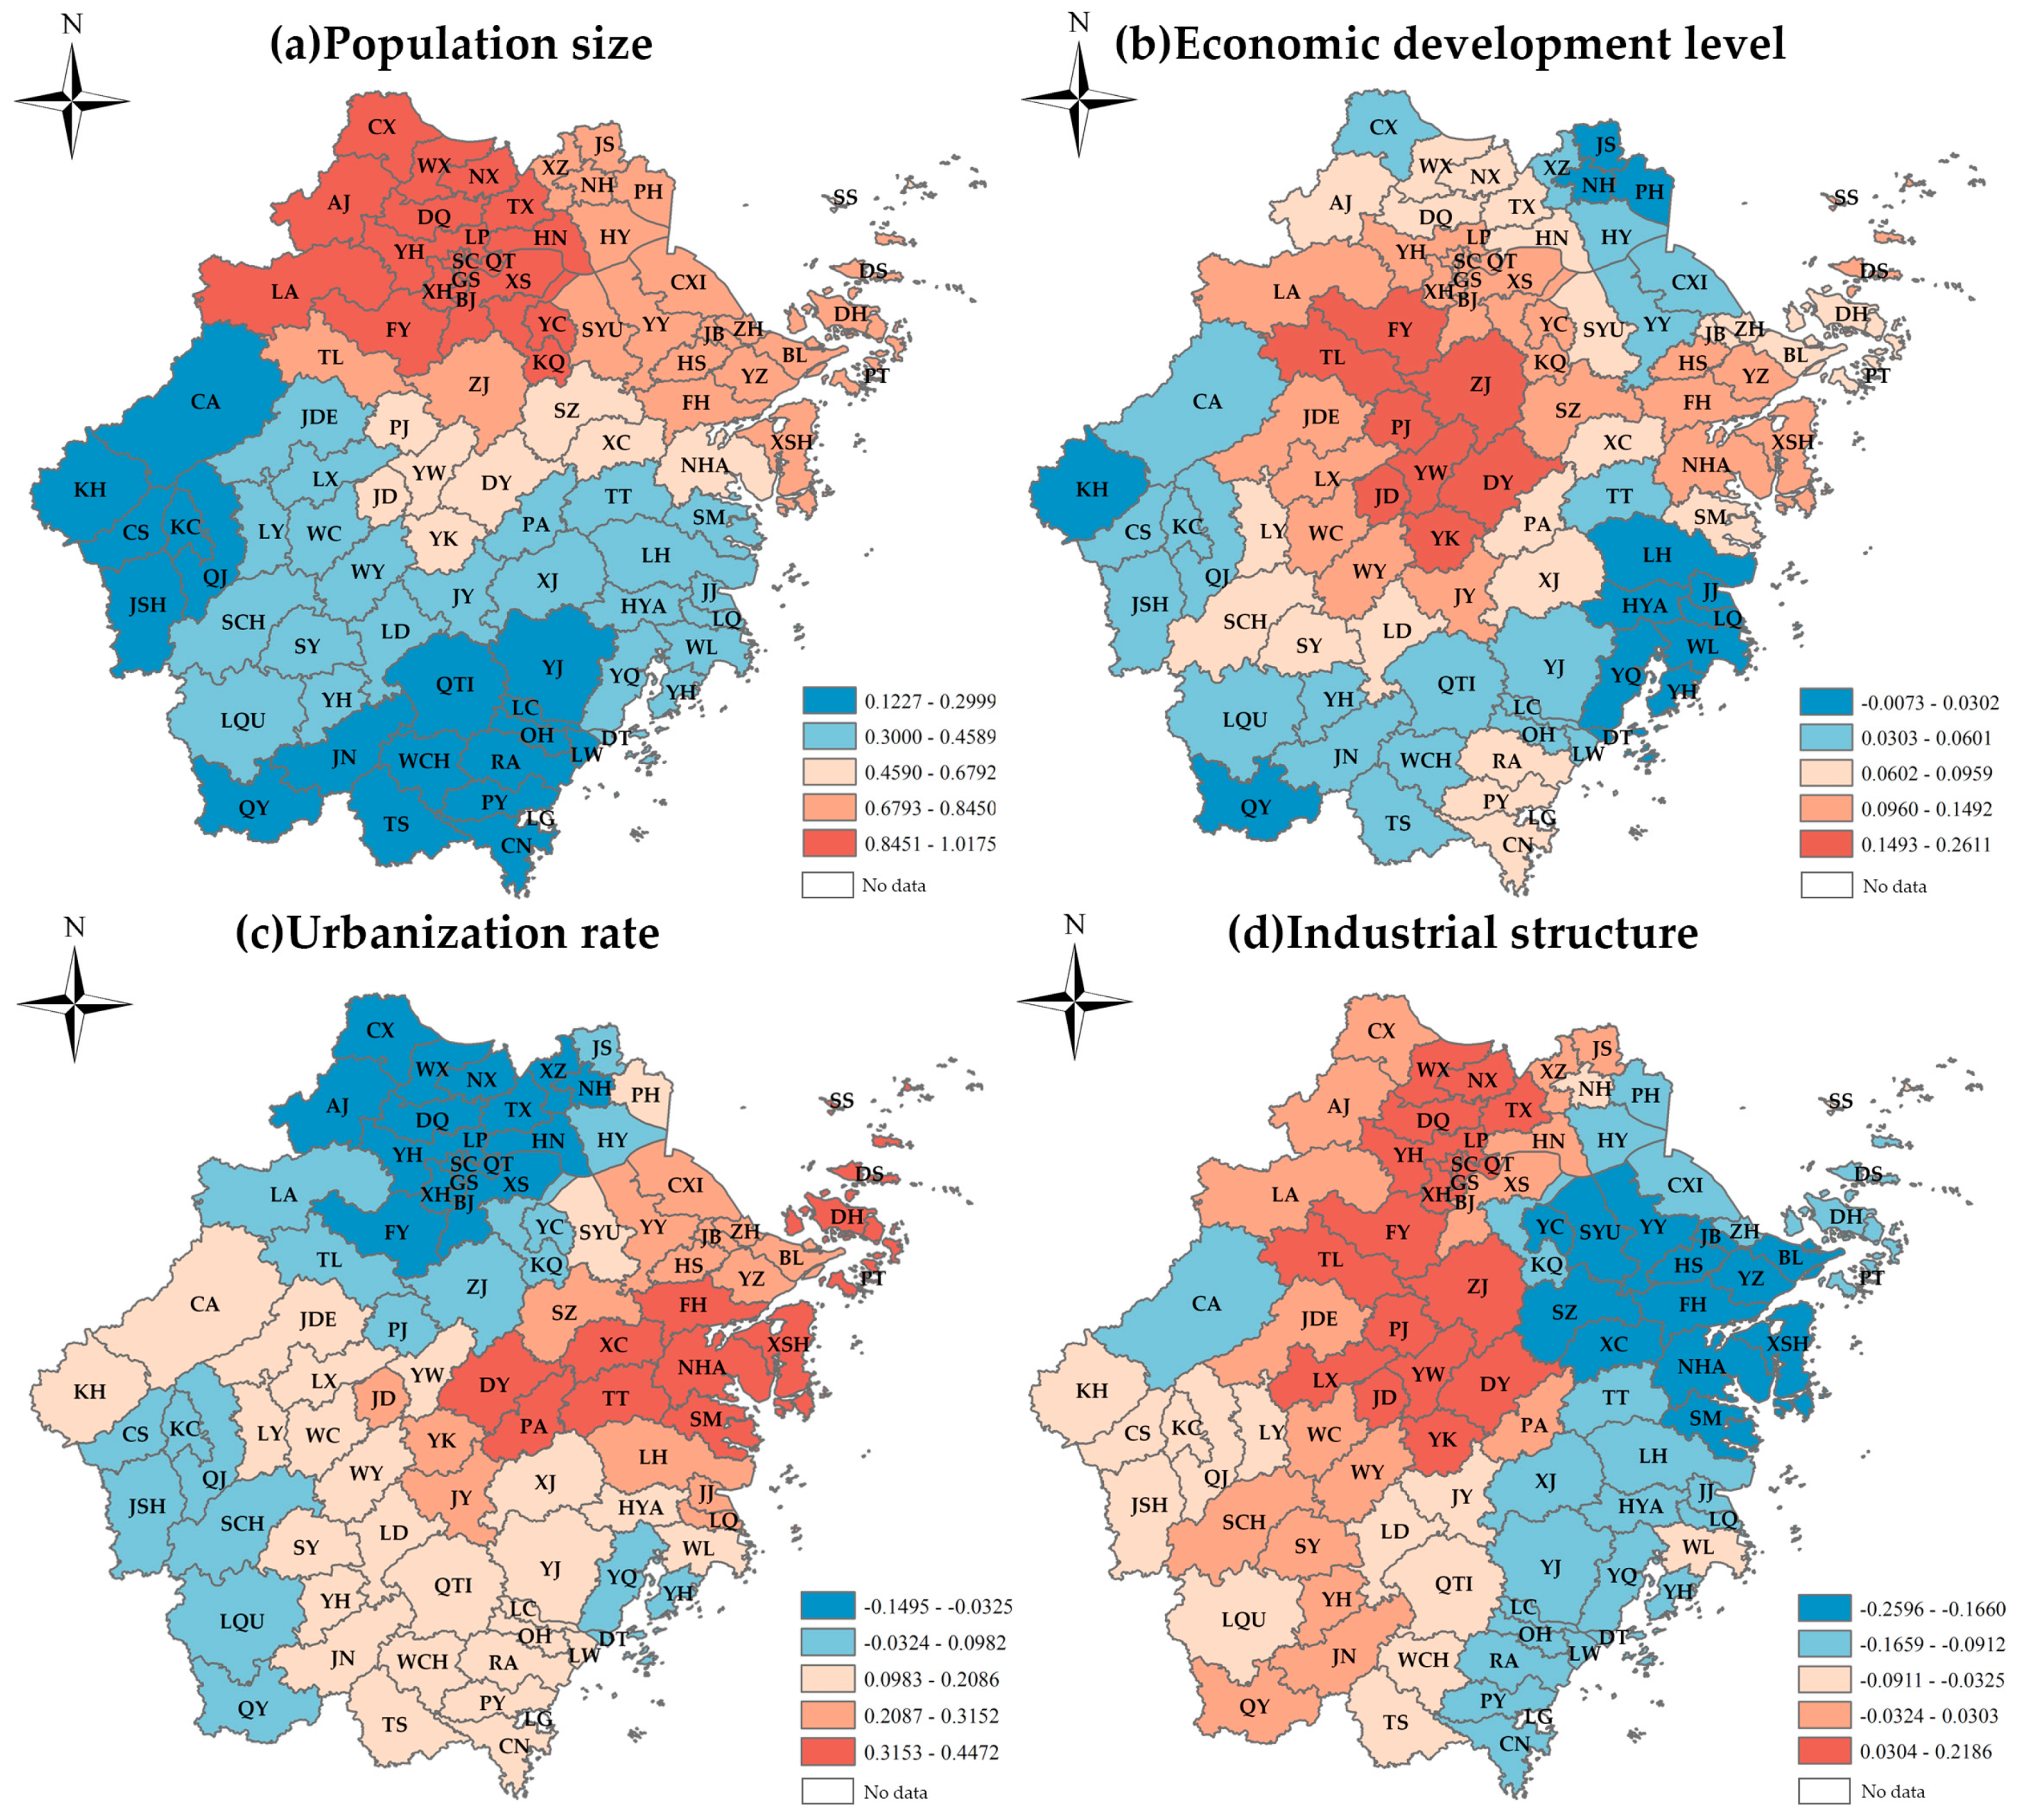
3.4.2. Spatio-Temporal Evolution of Various Influences


4. Conclusions
5. Discussions
5.1. Implications
5.2. Limitations and Future Research Direction
Author Contributions
Funding
Data Availability Statement
Acknowledgments
Conflicts of Interest
Abbreviations
| Counties | Abbreviations |
| Shangcheng | SC |
| Gongshu | GS |
| Xihu | XH |
| Binjiang | BJ |
| Xiaoshan | XS |
| Yuhang | YHA |
| Fuyang | FY |
| Linan | LA |
| Tonglu | TL |
| Chunan | CA |
| Jiande | JDE |
| Haishu | HS |
| Jiangbei | JB |
| Zhenhai | ZH |
| Beilun | BL |
| Yinzhou | YZ |
| Fenghua | FH |
| Yuyao | YY |
| Cixi | CXI |
| Xiangshan | XSH |
| Ninghai | NHA |
| Lucheng | LC |
| Taishun | TS |
| Ruian | RA |
| Yueqing | YQ |
| Nanhu | NH |
| Xiuzhou | XZ |
| Jiashan | JS |
| Haiyan | HY |
| Haining | HN |
| Pinghu | PH |
| Tongxiang | TX |
| Wuxing | WX |
| Nanxun | NX |
| Deqing | DQ |
| Changxing | CX |
| Anji | AJ |
| Yuecheng | YC |
| Kecheng | KQ |
| Shangyu | SYU |
| Zhuji | ZJ |
| Shengzhou | SZ |
| Xinchang | XC |
| Wucheng | WC |
| Yongkang | YK |
| Kecheng | KC |
| Qujiang | QJ |
| Jiangshan | JSH |
| Changshan | CS |
| Kaihua | KH |
| Longyou | LY |
| Dinghai | DH |
| Putuo | PT |
| Daishan | DS |
| Shengsi | SS |
| Jiaojiang | JJ |
| Huangyan | HYA |
| Luqiao | LQ |
| Wenling | WL |
| Linhai | LH |
| Yuhuan | YHU |
| Sanmen | SM |
| Tiantai | TT |
| Xianju | XJ |
| Liandu | LD |
| Longquan | LQU |
| Longwan | LW |
| Ouhai | OH |
| Dongtou | DT |
| Yongjia | YJ |
| Pingyang | PY |
| Cangnan | CN |
| Wencheng | WCH |
| Jindong | JD |
| Wuyi | WY |
| Pujiang | PJ |
| Panan | PA |
| Lanxi | LX |
| Yiwu | YW |
| Dongyang | DY |
| Qingtian | QTI |
| Yunhe | YH |
| Qingyuan | QY |
| Jinyun | JY |
| Suichang | SCH |
| Songyang | SY |
| Jingning | JN |
| Longgang | LG |
References
- Calvia, M. Worldwide Fluctuations in Carbon Emissions: Characterization and Synchronization. Clean. Prod. Lett. 2024, 6, 100054. [Google Scholar] [CrossRef]
- Oyewo, B.; Tauringana, V.; Tawiah, V.; Aju, O. Impact of Country Governance Mechanisms on Carbon Emissions Performance of Multinational Entities. J. Environ. Manag. 2024, 352, 120000. [Google Scholar] [CrossRef]
- Perdichizzi, S.; Buchetti, B.; Cicchiello, A.F.; Dal Maso, L. Carbon Emission and Firms’ Value: Evidence from Europe. Energy Econ. 2024, 131, 107324. [Google Scholar] [CrossRef]
- Perera, K.; Kuruppuarachchi, D.; Kumarasinghe, S.; Suleman, M.T. The Impact of Carbon Disclosure and Carbon Emissions Intensity on Firms’ Idiosyncratic Volatility. Energy Econ. 2023, 128, 107053. [Google Scholar] [CrossRef]
- Khan, A.A.; Mei, B.; Khan, S.U.; Ali, M.A.S.; Luo, J. Agri-Food Evolution and Carbon Emissions in Chinese Residential Consumption: A Life Cycle Analysis of Urban-Rural Disparities and Socioeconomic Influences. Environ. Impact Assess. Rev. 2024, 105, 107387. [Google Scholar] [CrossRef]
- Kotsompolis, G.; Konstantakis, K.N.; Xidonas, P.; Michaelides, P.G.; Thomakos, D.D. Climate Change Economics and the Determinants of Carbon Emissions’ Futures Returns: A Regime-Driven ARDL Model. Financ. Res. Lett. 2023, 58, 104485. [Google Scholar] [CrossRef]
- Zhou, K.; Yang, J.; Yang, T.; Ding, T. Spatial and Temporal Evolution Characteristics and Spillover Effects of China’s Regional Carbon Emissions. J. Environ. Manag. 2023, 325, 116423. [Google Scholar] [CrossRef] [PubMed]
- Liu, H.; Song, Y. Financial Development and Carbon Emissions in China since the Recent World Financial Crisis: Evidence from a Spatial-Temporal Analysis and a Spatial Durbin Model. Sci. Total Environ. 2020, 715, 136771. [Google Scholar] [CrossRef] [PubMed]
- Zhou, C.; Chen, X. Forecasting China’s Energy Consumption and Carbon Emission Based on Multiple Decomposition Strategy. Energy Strategy Rev. 2023, 49, 101160. [Google Scholar] [CrossRef]
- Dong, F.; Yu, B.; Hadachin, T.; Dai, Y.; Wang, Y.; Zhang, S.; Long, R. Drivers of Carbon Emission Intensity Change in China. Resour. Conserv. Recycl. 2018, 129, 187–201. [Google Scholar] [CrossRef]
- Pang, J.; Li, N.; Mu, H.; Zhang, M.; Zhao, H. Study on the Spatial Interaction between Carbon Emission Intensity and Shadow Economy in China. Sci. Total Environ. 2022, 813, 152616. [Google Scholar] [CrossRef] [PubMed]
- Zheng, J.; Mi, Z.; Coffman, D.; Milcheva, S.; Shan, Y.; Guan, D.; Wang, S. Regional Development and Carbon Emissions in China. Energy Econ. 2019, 81, 25–36. [Google Scholar] [CrossRef]
- He, Q.; Wei, F.; Deng, X.; Kong, F.; Li, C.; Yan, Z.; Qi, Y. Spatiotemporal Pattern of Carbon Productivity and Carbon Offset Potential in Chinese Counties. Sci. Total Environ. 2022, 846, 157153. [Google Scholar] [CrossRef]
- NBS. China Statistical Yearbook (County-Level); China Statistics Press: Beijing, China, 2018. [Google Scholar]
- Liu, X.; Jin, X.; Luo, X.; Zhou, Y. Quantifying the Spatiotemporal Dynamics and Impact Factors of China’s County-Level Carbon Emissions Using ESTDA and Spatial Econometric Models. J. Clean. Prod. 2023, 410, 137203. [Google Scholar] [CrossRef]
- Zhao, J.; Chen, Y.; Ji, G.; Wang, Z. Residential Carbon Dioxide Emissions at the Urban Scale for County-Level Cities in China: A Comparative Study of Nighttime Light Data. J. Clean. Prod. 2018, 180, 198–209. [Google Scholar] [CrossRef]
- Qi, H.; Shen, X.; Long, F.; Liu, M.; Gao, X. Spatial–Temporal Characteristics and Influencing Factors of County-Level Carbon Emissions in Zhejiang Province, China. Environ. Sci. Pollut. Res. 2022, 30, 10136–10148. [Google Scholar] [CrossRef] [PubMed]
- Duman, Z.; Mao, X.; Cai, B.; Zhang, Q.; Chen, Y.; Gao, Y.; Guo, Z. Exploring the Spatiotemporal Pattern Evolution of Carbon Emissions and Air Pollution in Chinese Cities. J. Environ. Manag. 2023, 345, 118870. [Google Scholar] [CrossRef]
- Liu, X.; Xu, H.; Zhang, M. The Effects of Urban Expansion on Carbon Emissions: Based on the Spatial Interaction and Transmission Mechanism. J. Clean. Prod. 2024, 434, 140019. [Google Scholar] [CrossRef]
- Zhang, Y.; Lin, W.; Ren, E.; Yu, Y. Evaluation of Spatial Distribution of Carbon Emissions from Land Use and Environmental Parameters: A Case Study in the Yangtze River Delta Demonstration Zone. Ecol. Indic. 2024, 158, 111496. [Google Scholar] [CrossRef]
- Soares, T.C.; Fernandes, E.A.; Toyoshima, S.H. The CO2 Emission Gini Index and the Environmental Efficiency: An Analysis for 60 Leading World Economies. EconomiA 2018, 19, 266–277. [Google Scholar] [CrossRef]
- Williams, R.G.; Ceppi, P.; Roussenov, V.; Katavouta, A.; Meijers, A.J.S. The Role of the Southern Ocean in the Global Climate Response to Carbon Emissions. Phil. Trans. R. Soc. A. 2023, 381, 20220062. [Google Scholar] [CrossRef] [PubMed]
- Qu, H.; You, C.; Feng, C.-C.; Guo, L. Spatial Responses of Ecosystem Services to Carbon Emission Efficiency Based on Spatial Panel Models in the Yangtze River Economic Belt. J. Clean. Prod. 2024, 434, 139953. [Google Scholar] [CrossRef]
- Quan, C.; Cheng, X.; Yu, S.; Ye, X. Analysis on the Influencing Factors of Carbon Emission in China’s Logistics Industry Based on LMDI Method. Sci. Total Environ. 2020, 734, 138473. [Google Scholar] [CrossRef] [PubMed]
- González, P.F.; Presno, M.J.; Landajo, M. Tracking the Change in Spanish Greenhouse Gas Emissions through an LMDI Decomposition Model: A Global and Sectoral Approach. J. Environ. Sci. 2024, 139, 114–122. [Google Scholar] [CrossRef] [PubMed]
- Khodakarami, L.; Pourmanafi, S.; Soffianian, A.R.; Lotfi, A. Modeling Spatial Distribution of Carbon Sequestration, CO2 Absorption, and O2 Production in an Urban Area: Integrating Ground-Based Data, Remote Sensing Technique, and GWR Model. Earth Space Sci. 2022, 9, e2022EA002261. [Google Scholar] [CrossRef]
- Li, W.; Dong, F.; Ji, Z. Research on Coordination Level and Influencing Factors Spatial Heterogeneity of China’s Urban CO2 Emissions. Sustain. Cities Soc. 2021, 75, 103323. [Google Scholar] [CrossRef]
- Nosheen, M.; Abbasi, M.A.; Iqbal, J. Analyzing Extended STIRPAT Model of Urbanization and CO2 Emissions in Asian Countries. Environ. Sci. Pollut. Res. 2020, 27, 45911–45924. [Google Scholar] [CrossRef]
- Zhu, E.; Qi, Q.; Chen, L.; Wu, X. The Spatial-Temporal Patterns and Multiple Driving Mechanisms of Carbon Emissions in the Process of Urbanization: A Case Study in Zhejiang, China. J. Clean. Prod. 2022, 358, 131954. [Google Scholar] [CrossRef]
- NBS. China Statistical Yearbook (County-Level); China Statistics Press: Beijing, China, 2022. [Google Scholar]
- Xia, C.; Li, Y.; Ye, Y.; Shi, Z.; Liu, J. Decomposed Driving Factors of Carbon Emissions and Scenario Analyses of Low-Carbon Transformation in 2020 and 2030 for Zhejiang Province. Energies 2017, 10, 1747. [Google Scholar] [CrossRef]
- Rey, S.J. Spatial Empirics for Economic Growth and Convergence. Geogr. Anal. 2001, 33, 195–214. [Google Scholar] [CrossRef]
- Gui, D.; He, H.; Liu, C.; Han, S. Spatio-Temporal Dynamic Evolution of Carbon Emissions from Land Use Change in Guangdong Province, China, 2000–2020. Ecol. Indic. 2023, 156, 111131. [Google Scholar] [CrossRef]
- Jiang, H.; Yin, J.; Qiu, Y.; Zhang, B.; Ding, Y.; Xia, R. Industrial Carbon Emission Efficiency of Cities in the Pearl River Basin: Spatiotemporal Dynamics and Driving Forces. Land 2022, 11, 1129. [Google Scholar] [CrossRef]
- Ye, X.; Rey, S. A Framework for Exploratory Space-Time Analysis of Economic Data. Ann. Reg. Sci. 2013, 50, 315–339. [Google Scholar] [CrossRef]
- Razzaq, A.; Sharif, A.; Yang, X.; Dogan, E. Influence Mechanism of Electricity Price Distortion on Industrial Green Transformation: A Spatial Analysis of Chinese Regions. Energy Econ. 2024, 130, 107308. [Google Scholar] [CrossRef]
- Güneyli, H.; Saleh Ahmed, S.M. Detecting Abnormal Seismic Activity Areas of Anatolian Plate and Deformation Directions Using Python Geospatial Libraries. Heliyon 2023, 9, e14394. [Google Scholar] [CrossRef] [PubMed]
- Lefever, D.W. Measuring Geographic Concentration by Means of the Standard Deviational Ellipse. Am. J. Sociol. 1926, 32, 88–94. [Google Scholar] [CrossRef]
- Talkhabi, H.; Ghalehteimouri, K.J.; Mehranjani, M.S.; Zanganeh, A.; Karami, T. Spatial and Temporal Population Change in the Tehran Metropolitan Region and Its Consequences on Urban Decline and Sprawl. Ecol. Inform. 2022, 70, 101731. [Google Scholar] [CrossRef]
- Qin, Q.; Yan, H.; Li, B.; Lv, W.; Wasif Zafar, M. A Novel Temporal-Spatial Decomposition on Drivers of China’s Carbon Emissions. Gondwana Res. 2022, 109, 274–284. [Google Scholar] [CrossRef]
- Tang, D.; Ma, T.; Li, Z.; Tang, J.; Bethel, B. Trend Prediction and Decomposed Driving Factors of Carbon Emissions in Jiangsu Province during 2015–2020. Sustainability 2016, 8, 1018. [Google Scholar] [CrossRef]
- Wang, S.; Ma, Y. Influencing Factors and Regional Discrepancies of the Efficiency of Carbon Dioxide Emissions in Jiangsu, China. Ecol. Indic. 2018, 90, 460–468. [Google Scholar] [CrossRef]
- Zhang, F.; Deng, X.; Phillips, F.; Fang, C.; Wang, C. Impacts of Industrial Structure and Technical Progress on Carbon Emission Intensity: Evidence from 281 Cities in China. Technol. Forecast. Soc. Chang. 2020, 154, 119949. [Google Scholar] [CrossRef]
- Huang, Y.; Matsumoto, K. Drivers of the Change in Carbon Dioxide Emissions under the Progress of Urbanization in 30 Provinces in China: A Decomposition Analysis. J. Clean. Prod. 2021, 322, 129000. [Google Scholar] [CrossRef]
- Zhang, H.; Zhang, X.; Yuan, J. Driving Forces of Carbon Emissions in China: A Provincial Analysis. Environ. Sci. Pollut. Res. 2021, 28, 21455–21470. [Google Scholar] [CrossRef] [PubMed]
- Liu, Y.; Jiang, Y.; Liu, H.; Li, B.; Yuan, J. Driving Factors of Carbon Emissions in China’s Municipalities: A LMDI Approach. Environ. Sci. Pollut. Res. 2022, 29, 21789–21802. [Google Scholar] [CrossRef]
- Shum, W.Y.; Ma, N.; Lin, X.; Han, T. The Major Driving Factors of Carbon Emissions in China and Their Relative Importance: An Application of the LASSO Model. Front. Energy Res. 2021, 9, 726127. [Google Scholar] [CrossRef]
- Sitorus, F.; Brito-Parada, P.R. A Multiple Criteria Decision Making Method to Weight the Sustainability Criteria of Renewable Energy Technologies under Uncertainty. Renew. Sustain. Energy Rev. 2020, 127, 109891. [Google Scholar] [CrossRef]
- Hohl, A.; Lotfata, A. Modeling Spatiotemporal Associations of Obesity Prevalence with Biking, Housing Cost and Green Spaces in Chicago, IL, USA, 2015–2017. J. Transp. Health 2022, 26, 101412. [Google Scholar] [CrossRef]
- Ariken, M.; Zhang, F.; Chan, N.W.; Kung, H. Coupling Coordination Analysis and Spatio-Temporal Heterogeneity between Urbanization and Eco-Environment along the Silk Road Economic Belt in China. Ecol. Indic. 2021, 121, 107014. [Google Scholar] [CrossRef]
- Mohammadnazar, A.; Mahdinia, I.; Ahmad, N.; Khattak, A.J.; Liu, J. Understanding How Relationships between Crash Frequency and Correlates Vary for Multilane Rural Highways: Estimating Geographically and Temporally Weighted Regression Models. Accid. Anal. Prev. 2021, 157, 106146. [Google Scholar] [CrossRef]
- Bui Minh, T.; Nguyen Ngoc, T.; Bui Van, H. Relationship between Carbon Emissions, Economic Growth, Renewable Energy Consumption, Foreign Direct Investment, and Urban Population in Vietnam. Heliyon 2023, 9, e17544. [Google Scholar] [CrossRef]
- Rehman, E.; Rehman, S. Modeling the Nexus between Carbon Emissions, Urbanization, Population Growth, Energy Consumption, and Economic Development in Asia: Evidence from Grey Relational Analysis. Energy Rep. 2022, 8, 5430–5442. [Google Scholar] [CrossRef]
- Gershon, O.; Asafo, J.K.; Nyarko-Asomani, A.; Koranteng, E.F. Investigating the Nexus of Energy Consumption, Economic Growth and Carbon Emissions in Selected African Countries. Energy Strategy Rev. 2024, 51, 101269. [Google Scholar] [CrossRef]
- Balta-Ozkan, N.; Watson, T.; Mocca, E. Spatially Uneven Development and Low Carbon Transitions: Insights from Urban and Regional Planning. Energy Policy 2015, 85, 500–510. [Google Scholar] [CrossRef]
- Wojewodzki, M.; Wei, Y.; Cheong, T.S.; Shi, X. Urbanisation, Agriculture and Convergence of Carbon Emissions Nexus: Global Distribution Dynamics Analysis. J. Clean. Prod. 2023, 385, 135697. [Google Scholar] [CrossRef]
- Raihan, A.; Ibrahim, S.; Muhtasim, D.A. Dynamic Impacts of Economic Growth, Energy Use, Tourism, and Agricultural Productivity on Carbon Dioxide Emissions in Egypt. World Dev. Sustain. 2023, 2, 100059. [Google Scholar] [CrossRef]
- Awan, A.; Alnour, M.; Jahanger, A.; Onwe, J.C. Do Technological Innovation and Urbanization Mitigate Carbon Dioxide Emissions from the Transport Sector? Technol. Soc. 2022, 71, 102128. [Google Scholar] [CrossRef]
- Mehmood, S.; Zaman, K.; Khan, S.; Ali, Z.; Khan, H.U.R. The Role of Green Industrial Transformation in Mitigating Carbon Emissions: Exploring the Channels of Technological Innovation and Environmental Regulation. Energy Built Environ. 2024, 5, 464–479. [Google Scholar] [CrossRef]
- Yang, L.; Xia, H.; Zhang, X.; Yuan, S. What Matters for Carbon Emissions in Regional Sectors? A China Study of Extended STIRPAT Model. J. Clean. Prod. 2018, 180, 595–602. [Google Scholar] [CrossRef]
- Tao, A. Research on the Realization Path of Carbon Emission Reduction in Zhejiang Province. Energy Rep. 2022, 8, 501–506. [Google Scholar] [CrossRef]
- Zeng, S.; Wang, M. Theoretical and Empirical Analyses on the Factors Affecting Carbon Emissions: Case of Zhejiang Province, China. Environ. Dev. Sustain. 2023, 25, 2522–2549. [Google Scholar] [CrossRef]
- Di, K.; Chen, W.; Zhang, X.; Shi, Q.; Cai, Q.; Li, D.; Liu, C.; Di, Z. Regional Unevenness and Synergy of Carbon Emission Reduction in China’s Green Low-Carbon Circular Economy. J. Clean. Prod. 2023, 420, 138436. [Google Scholar] [CrossRef]
- Ke, S.; Zhang, Z.; Wang, Y. China’s Forest Carbon Sinks and Mitigation Potential from Carbon Sequestration Trading Perspective. Ecol. Indic. 2023, 148, 110054. [Google Scholar] [CrossRef]
- Li, Z.; Lu, Z.; Xu, L.; Shi, Y.; Ma, Q.; Wu, Y.; Cao, Y.; Sheng, B. Examining the Decoupling of Economic Growth with Land Expansion and Carbon Emissions in Zhejiang Province, China. Land 2023, 12, 1618. [Google Scholar] [CrossRef]
- Chen, W.; Wang, G.; Xu, N.; Ji, M.; Zeng, J. Promoting or Inhibiting? New-Type Urbanization and Urban Carbon Emissions Efficiency in China. Cities 2023, 140, 104429. [Google Scholar] [CrossRef]


| Indicators | Indicator Abbreviations | Connotation | Unit |
|---|---|---|---|
| Population size | POP | Resident population by county at the end of the year | Ten thousand |
| Economic development level | PGDP | GDP per capita | Ten thousand yuan |
| Urbanization rate | URB | Ratio of urban population to resident population | % |
| Industrial structure | INS | Ratio of secondary sector output to GDP | % |
| Period | t/t + 1 | HH | LH | LL | HL | Types | Number | Proportions | St |
|---|---|---|---|---|---|---|---|---|---|
| 2002–2007 | HH | 0.975 | 0.005 | 0.005 | 0.015 | I | 7 | 0.013 | 0.972 |
| LH | 0.020 | 0.980 | 0.000 | 0.000 | II | 7 | 0.013 | ||
| LL | 0.000 | 0.005 | 0.989 | 0.005 | III | 1 | 0.002 | ||
| HL | 0.063 | 0.000 | 0.063 | 0.875 | IV | 520 | 0.972 | ||
| 2007–2012 | HH | 0.973 | 0.016 | 0.000 | 0.011 | I | 4 | 0.007 | 0.985 |
| LH | 0.000 | 0.991 | 0.009 | 0.000 | II | 4 | 0.007 | ||
| LL | 0.000 | 0.000 | 1.000 | 0.000 | III | 0 | 0.000 | ||
| HL | 0.025 | 0.000 | 0.025 | 0.950 | IV | 526 | 0.985 | ||
| 2012–2017 | HH | 0.977 | 0.012 | 0.000 | 0.012 | I | 4 | 0.007 | 0.985 |
| LH | 0.018 | 0.982 | 0.000 | 0.000 | II | 4 | 0.007 | ||
| LL | 0.000 | 0.000 | 1.000 | 0.000 | III | 0 | 0.000 | ||
| HL | 0.045 | 0.000 | 0.000 | 0.955 | IV | 526 | 0.985 | ||
| 2017–2022 | HH | 0.971 | 0.018 | 0.006 | 0.006 | I | 7 | 0.013 | 0.976 |
| LH | 0.017 | 0.983 | 0.000 | 0.000 | II | 4 | 0.007 | ||
| LL | 0.005 | 0.005 | 0.990 | 0.000 | III | 2 | 0.004 | ||
| HL | 0.047 | 0.000 | 0.047 | 0.907 | IV | 521 | 0.976 |
| Year | Coordinates of Gravity Center | Shift of Gravity Center | Long Axis/km | Short Axis/km | Angle° | ||
|---|---|---|---|---|---|---|---|
| Longitudes | Latitudes | Orientations | Length/km | ||||
| 2002 | 120°55′15″ E | 29°55′52″ N | 117.730 | 165.998 | 1.798 | ||
| 2007 | 120°56′18″ E | 29°59′74″ N | northwestern | 5.542 | 117.863 | 161.424 | 1.836 |
| 2012 | 120°56′65″ E | 29°61′72″ N | northwestern | 0.746 | 117.597 | 160.764 | 2.117 |
| 2017 | 120°56′47″ E | 29°58′82″ N | southwestern | 0.285 | 117.797 | 161.855 | 1.582 |
| 2022 | 120°57′01″ E | 29°59′11″ N | northwestern | 0.853 | 117.487 | 161.923 | 0.820 |
| Variable | Population Size | Level of Economic Development | Urbanization Rate | Industrial Structure |
|---|---|---|---|---|
| VIF | 1.155 | 1.411 | 1.230 | 1.211 |
| Model Parameters | OLS | GWR | GTWR |
|---|---|---|---|
| R2 | 0.7487 | 0.8556 | 0.8846 |
| Adjusted R2 | 0.7368 | 0.8203 | 0.8844 |
| AICc | −157.3643 | −180.3784 | −4784.4224 |
Disclaimer/Publisher’s Note: The statements, opinions and data contained in all publications are solely those of the individual author(s) and contributor(s) and not of MDPI and/or the editor(s). MDPI and/or the editor(s) disclaim responsibility for any injury to people or property resulting from any ideas, methods, instructions or products referred to in the content. |
© 2024 by the authors. Licensee MDPI, Basel, Switzerland. This article is an open access article distributed under the terms and conditions of the Creative Commons Attribution (CC BY) license (https://creativecommons.org/licenses/by/4.0/).
Share and Cite
Wang, X.; Yu, H.; Wu, Y.; Zhou, C.; Li, Y.; Lai, X.; He, J. Spatio-Temporal Dynamics of Carbon Emissions and Their Influencing Factors at the County Scale: A Case Study of Zhejiang Province, China. Land 2024, 13, 381. https://doi.org/10.3390/land13030381
Wang X, Yu H, Wu Y, Zhou C, Li Y, Lai X, He J. Spatio-Temporal Dynamics of Carbon Emissions and Their Influencing Factors at the County Scale: A Case Study of Zhejiang Province, China. Land. 2024; 13(3):381. https://doi.org/10.3390/land13030381
Chicago/Turabian StyleWang, Xuanli, Huifang Yu, Yiqun Wu, Congyue Zhou, Yonghua Li, Xingyu Lai, and Jiahao He. 2024. "Spatio-Temporal Dynamics of Carbon Emissions and Their Influencing Factors at the County Scale: A Case Study of Zhejiang Province, China" Land 13, no. 3: 381. https://doi.org/10.3390/land13030381
APA StyleWang, X., Yu, H., Wu, Y., Zhou, C., Li, Y., Lai, X., & He, J. (2024). Spatio-Temporal Dynamics of Carbon Emissions and Their Influencing Factors at the County Scale: A Case Study of Zhejiang Province, China. Land, 13(3), 381. https://doi.org/10.3390/land13030381