Article

Multiscale Ecological Zoning Management with Coupled Ecosystem Service Bundles and Supply–Demand Balance, the Case of Hangzhou, China

1
Department of Regional and Urban Planning, Zhejiang University, Hangzhou 310058, China
2
Zhejiang University Architectural Design and Research Institute Co., Ltd., Hangzhou 310058, China
3
Center for Balance Architecture, Zhejiang University, Hangzhou 310058, China
4
Information Center, Ministry of Ecology and Environment, Beijing 100029, China
5
Zhejiang University Urban-Rural Planning & Design Institute Co., Ltd., Hangzhou 310058, China
6
Land Consolidation and Rehabilitation Center, Ministry of Natural Resources, Beijing 100035, China
*
Authors to whom correspondence should be addressed.
These authors contributed equally to this work.
Land 2024, 13(3), 360; https://doi.org/10.3390/land13030360
Submission received: 9 February 2024 / Revised: 8 March 2024 / Accepted: 10 March 2024 / Published: 12 March 2024

Abstract

:
Grasping the interrelationship between the supply and demand of ecosystem services (ESs) and spatial scale characteristics is the foundation for effective ecological zoning management, which helps to realize a win–win situation for both ecological protection and economic development. This paper focuses on the following three real problems: mismatch in ES supply and demand evaluation, mechanical and subjective delineation of ecological zoning, and rough management strategies, and constructs a multi-scale ecological zoning management framework for the “comprehensive evaluation of supply and demand, ecological zoning, and enhancement of human well-being”. This study integrates the InVEST model, SOM, Z-score quadrant matching, and coordination degree method, and applies them to the ecological management zoning of Hangzhou. The results show that (1) the spatial differentiation of ESs in Hangzhou is significant. The spatial pattern of the five types of ES supply varies at the county scale and the grid scale on which ES demand is concentrated and is consistent at different scales. (2) ES supply–demand matching in Hangzhou is at the basic coordination and can be divided into four modes including HH, LH, LL, and HL at both the county and grid scales. On the small scale, the proportion of mismatches declines slightly, but the severity rises. (3) ES supply is divided into four categories as follows: the food production bundle, the carbon storage bundle, the ESs balancing bundle, and the ESs depleting bundle, and clarifies the priority of ES management. (4) Construct an ecological management practice path, delineates 6 ecological management zones at the county scale and 19 secondary management zones at the grid scale. Targeted measures are proposed in terms of supply–demand adjustment strategies, ecological management strategies, and key implementation areas. This study helps to incorporate the interaction between the supply and demand of ESs into the planning framework and provides decision-making support for refined ecological management.

1. Introduction

Ecosystem services (ESs) are the benefits that humans obtain from ecosystems [1,2] and are the basis for human survival and development [3]. However, with the acceleration of urbanization and industrialization, human activities continue to encroach on ecological land, resulting in ecosystem function degradation and structural imbalance [4,5]. Global climate change exacerbates ecological risks [6,7]. In recent years, ecological problems such as land desertification, soil erosion, and biodiversity reduction have occurred frequently in China [8], affecting the enhancement of regional well-being and constraining sustainable development [9,10]. Due to the spatial heterogeneity in ecosystem services [11], different regions face different ecological problems. Therefore, it is necessary to carry out differentiated ecological management for the whole region.
Ecological zoning management, as an ecosystem management approach to differentially regulate spatial resources [12], can accurately solve environmental problems, systematically promote the protection of ecological multi-factors [13], and provide decision support for spatial governance [14,15]. Early studies can be categorized into three branches as follows: (1) for a single ecological element, following the natural geography, combining the current problems with the spatial differentiation characteristics, and then selecting the appropriate scale to determine the zoning, such as hydro-ecoregion [16,17], agro-ecological management zoning [18], etc.; (2) focusing on potential problems, from the perspectives of ecological sensitivity [19] or ecological vulnerability [20], integrating natural indicators such as geomorphology, vegetation, etc., with ecological pressure indicators, constructing an evaluation system, and carrying out zoning grading; and (3) based on the ecological security goal orientation, according to the basic paradigm of “source–corridor–node” [21,22,23], focusing on the integrity and structural connectivity of the ecosystem. However, the above studies simplify the process of ecological degradation into the loss of ES supply, focus on the analysis of supply services and neglect human demand, and ignore the fact that ESs are a cyclical process of supply and demand flow and that the essence of ecological problems is the dysfunctional coupling of ecosystems and socio-economic systems. This leads to the mistake of mechanically separating ecological land use and social activity areas in ecological management and the disadvantage of reactively solving problems rather than proactively preventing them [24,25], which is not conducive to sustainable development. To address this challenge, research based on the ES supply–demand perspectives has gradually emerged.
ES supply refers to the production of products and services by ecosystems for humans; ES demand refers to the consumption and use of these products and services by human systems, as well as part of the unsatisfied or short-term potential needs [26,27]. Habitat quality, soil conservation, carbon storage, water yield, and food production are recognized as essential ESs [12,15]. Among them, soil, as one of the most important providers of ESs, can be directly related to land use. The research methods for the supply and demand of ESs mainly include the equivalent value method [28], the expert assessment matrix method [29], and the ecological modeling method [15]. The ecological modeling method has significant advantages in ES supply assessment because it is more accurate and not affected by subjective factors. With the development of time and the progress of social cognition, the quantity and quality of human demand for ESs have significantly increased [30], shifting from basic physiological and safety needs to high-level and diversified needs such as socialization and self-actualization. Previous studies have used panel data or per capita indicators to calculate the ES demand level [28], which shows the status quo or the bottom line, so it cannot truly reflect actual human needs. The use of socio-economic indicators to evaluate ES demand is more realistic and has a higher degree of match and adaptability to ES supply indicators.
Currently, there are fewer studies on ecological zoning management based on the relationship between the supply and demand of ESs. These studies either focus on ecological issues, introduce measurement indices such as the supply–demand ratio or hot–cold spot analysis to identify high-risk zones for each ES [31] or are based on the goal of regional supply–demand balance, comprehensively evaluating multiple ESs and adopting spatial autocorrelation analysis or the quadrant distribution method for spatial matching [29]. There are obvious shortcomings in these studies. Firstly, the regional ecosystem is a whole with trade-offs and synergies between ESs, and zoning from the perspective of a single type of ES is biased. Secondly, ESs have a scale effect. However, previous studies mainly focus on large-scale highly sensitive natural areas and lack comprehensive consideration of the supply–demand relationship and spatial scale dependence, which leads to rigid and poorly applied zoning results and even spatial injustices. Thirdly, the studies only stay at the stage of spatial mechanical division and do not discuss in depth how to make ecological management decisions and deploy spatial resources scientifically based on the results of the zoning following local conditions to improve the effectiveness and precision of ecological zoning management, which can truly enhance human well-being. Therefore, there is an urgent need to construct a comprehensive multi-scale ecological management framework for supply–demand well-being enhancement to improve the science and foresight of ecological zoning management.
This study focuses on three problems including the non-matching supply–demand evaluation of ESs, mechanical and subjective ecological zoning delineation, and rough management strategies, couples ecosystems and human systems, optimizes the ES supply–demand evaluation system, focuses on the multi-scale spatial differences in supply–demand matching, and constructs a new ecological management framework of comprehensive supply–demand evaluation, ecological zoning delineation, and human well-being enhancement. Hangzhou is taken as an example to develop implementation measures. The specific objectives are as follows: (1) to assess the spatial distribution of supply and demand among ESs at multiple scales in Hangzhou and analyze the interaction mechanism between ecosystems and human systems; (2) to explore the scale effect of ES patterns and delineate two levels of ecological management zones in Hangzhou at county and grid scales; and (3) identify ES bundles to clarify the types of ESs to be managed, formulate supply–demand adjustment measures based on the zoning results, and propose ecological management measures in combination with the current status quo and planning.

2. Study Area and Data
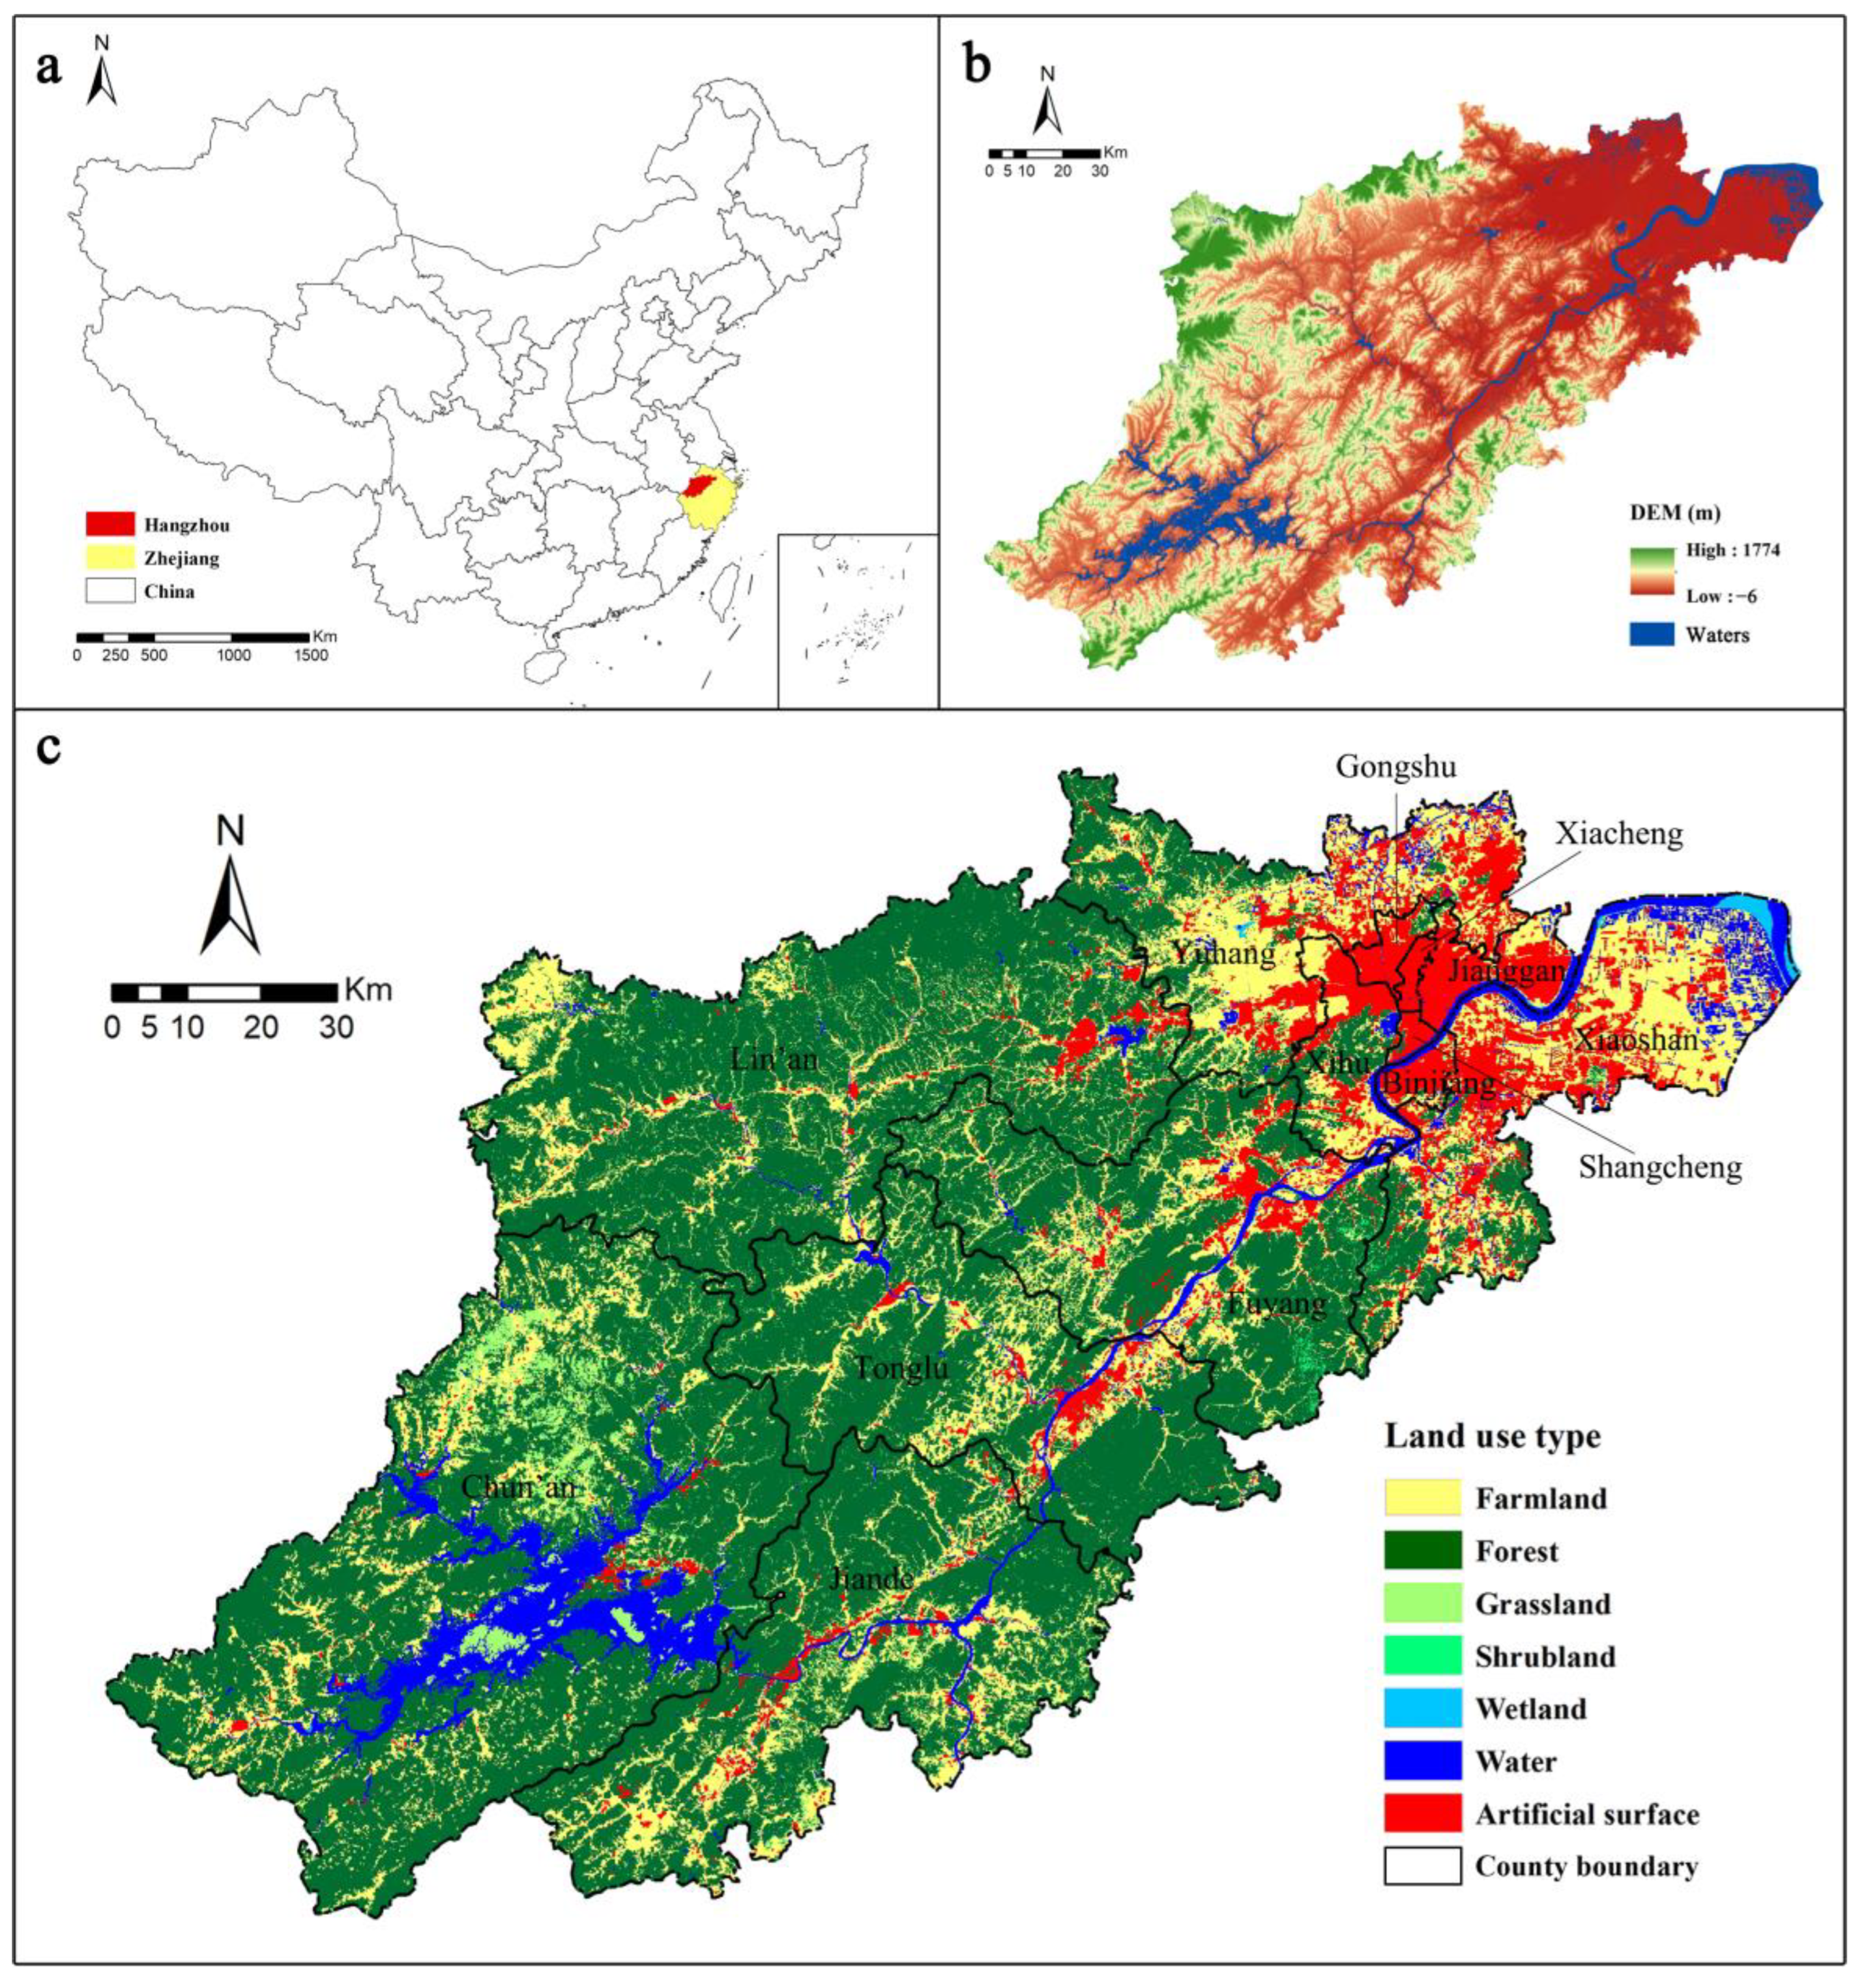
2.1. Study Area

Hangzhou is located on the southeast coast of China, between 29°11′~30°33′ N and 118°21′~120°30′ E. It is the political, economic, and cultural center of Zhejiang Province, a national key scenic tourist city. Hangzhou has 13 administrative counties (Figure 1), with a total area of 16,596 km2, and a built-up area of 64,846 km2. At the end of 2020, the resident population was 11.9 million, and the gross domestic product (GDP) was RMB 1610.6 billion.
Hangzhou belongs to the subtropical monsoon zone, with an average annual temperature of 16.2 °C and an average annual precipitation of 1435 mm. The territory is rich in natural resources, such as forests, lakes, and wetlands. It is an important ecological barrier and water source protection area in the Yangtze River Delta region, and ecological patches such as Xixi Wetland and West Lake are also biodiversity hotspots. However, in the process of rapid urbanization, the contradiction between people and land has intensified. Hangzhou is facing ecological threats such as forest degradation, water pollution, and urban flooding; at the same time, residents’ ecological demand is growing, and the problem of mismatch between supply and demand is severe. Under the dual policy guidelines of high-quality development and ecological civilization construction, it has become crucial to coordinate the benign development of economic development and ecological optimization.

2.2. Data Sources

The dataset in this study includes raster data, vector data, and statistical data (Table 1). Among them, the soil erosion factor and plant available water content were obtained by calculating the relevant data in the soil database, and the road data were corrected against the satellite map. To eliminate the impact of climate change on ESs, we obtained the meteorological data of the time series from 2001 to 2020 and averaged them. Based on the data availability, the population (POP) density and GDP density data used in our analysis were from 2019. Upon comparing them in the Hangzhou Statistical Yearbook between 2019 and 2020, we found that the differences were minimal and the spatial distribution of socio-economic data was consistent over time. Therefore, we opted to substitute the 2020 data with the 2019 data. All raster data were resampled and processed to a 30 × 30 m resolution in ArcGIS10.3. The projected coordinate system of all data was unified as WGS_1984_UTM_Zone_50N.

3. Methods

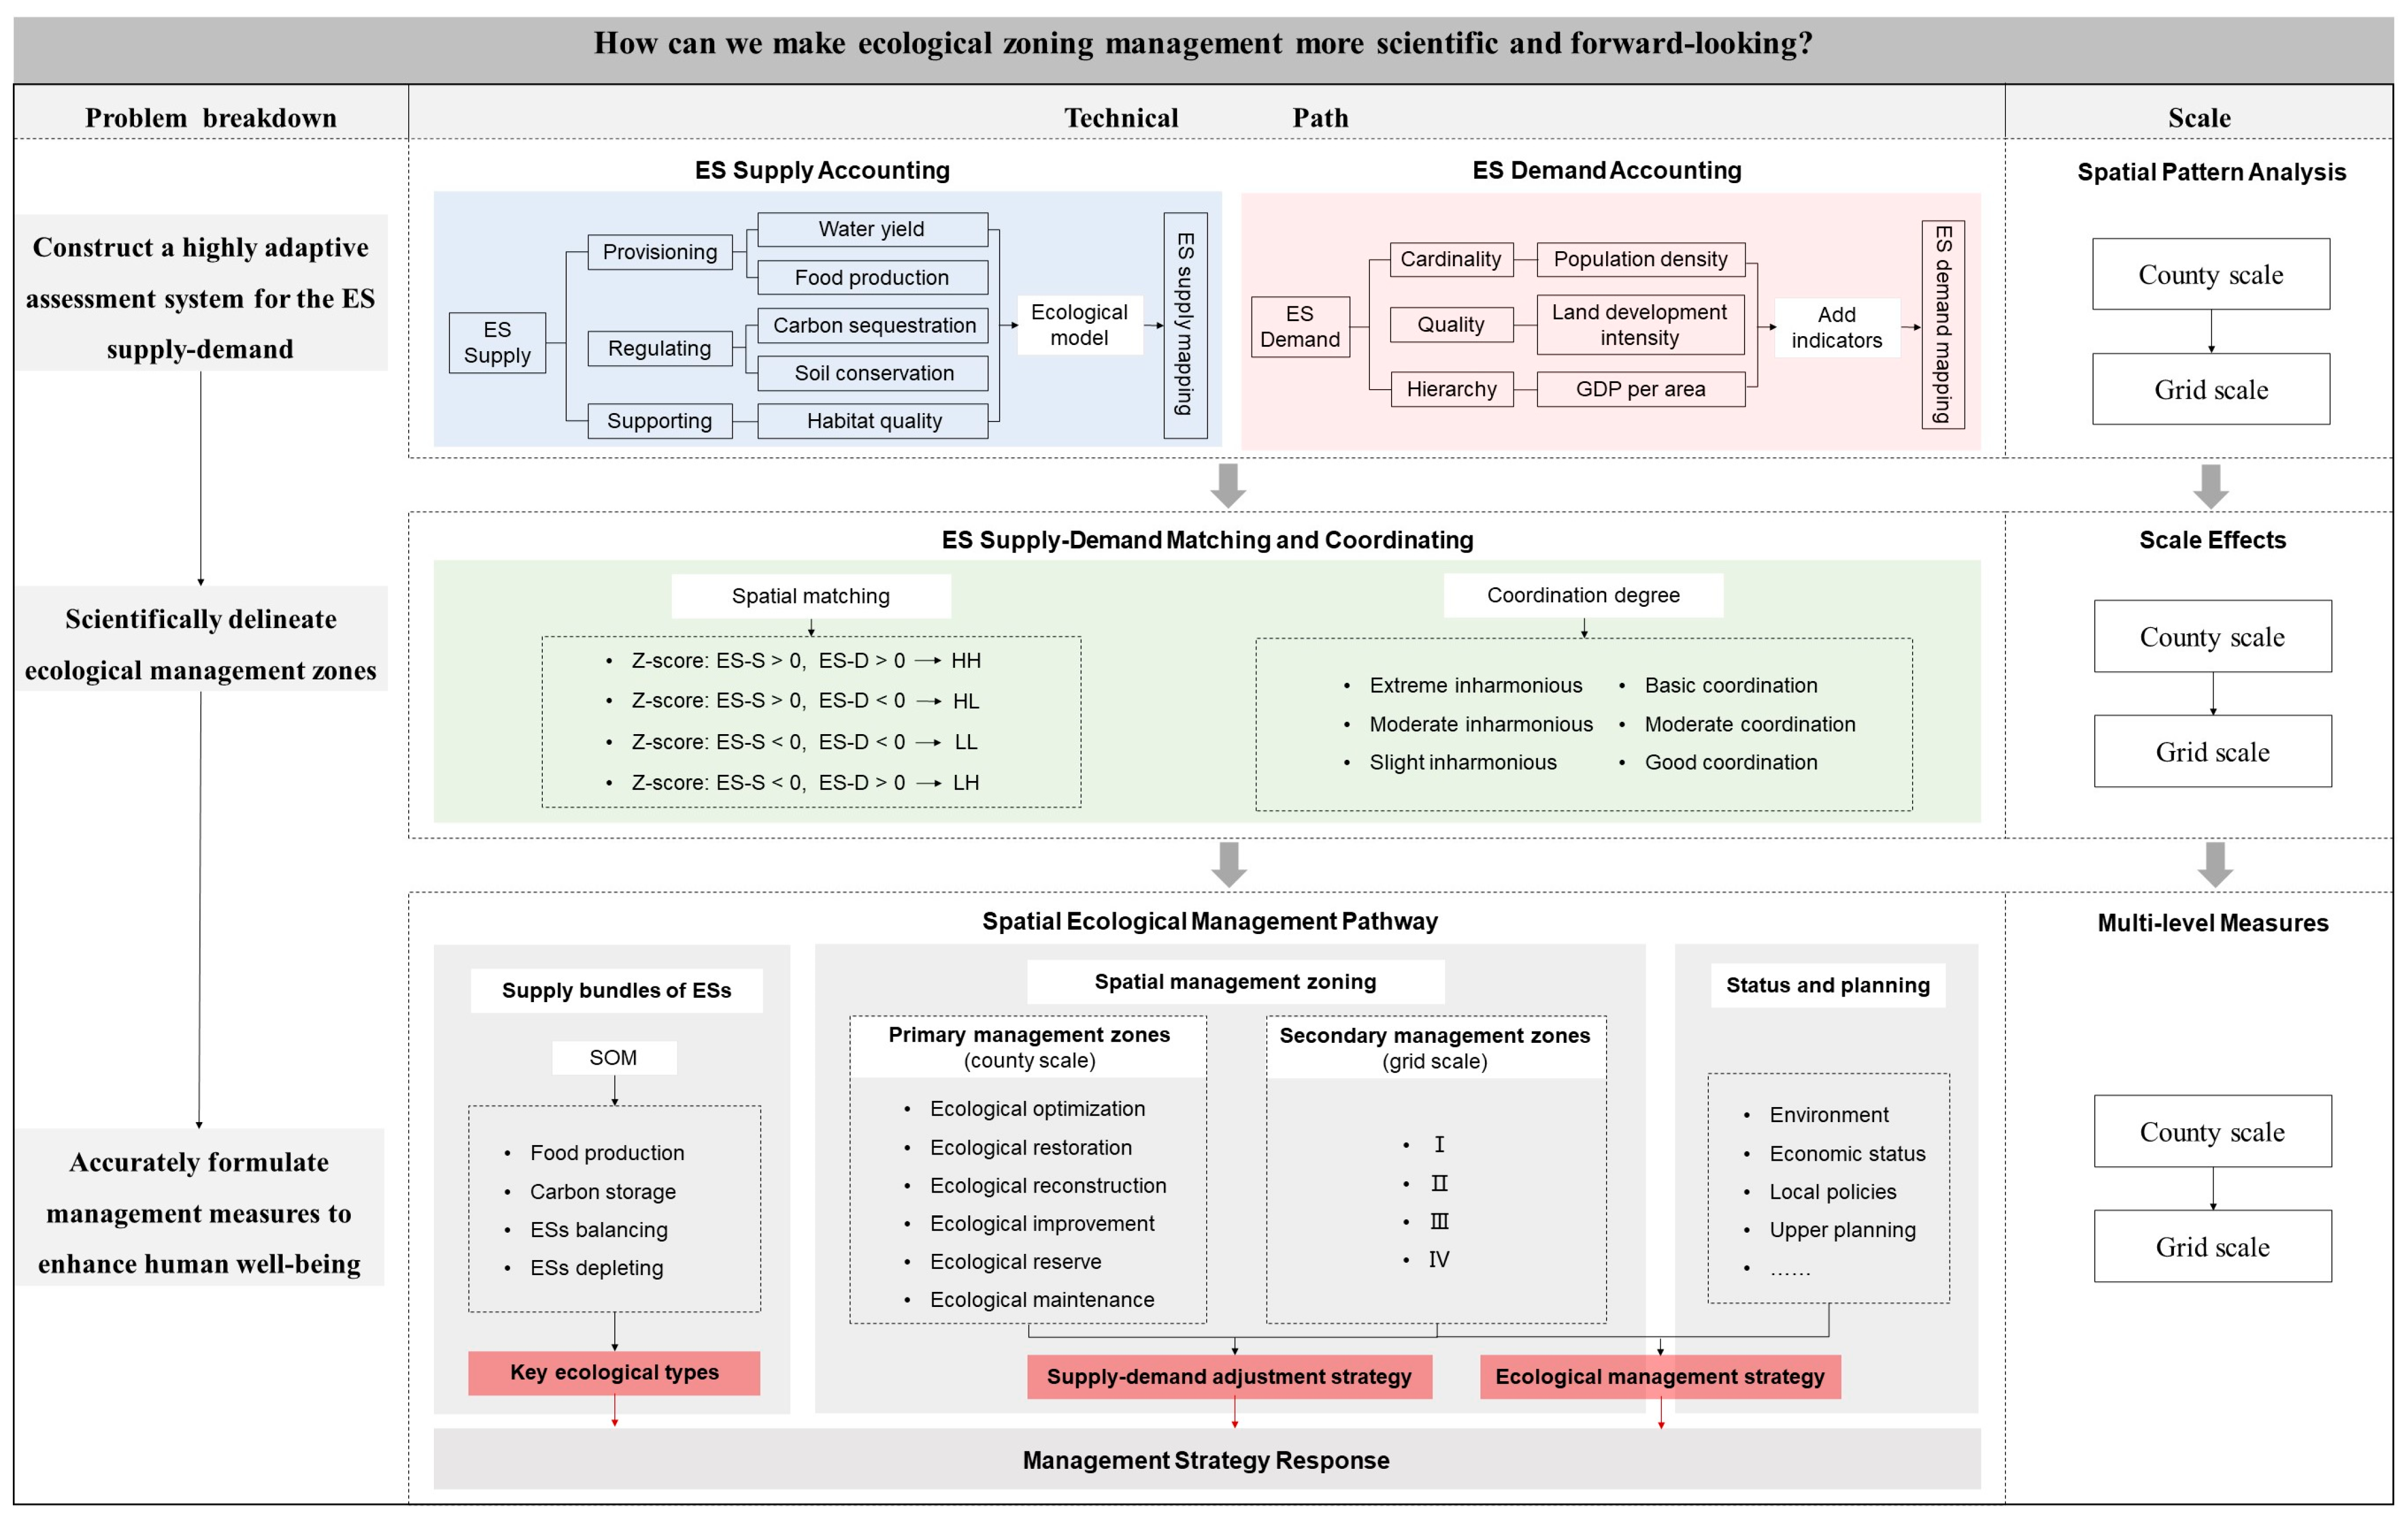
3.1. Research Framework

Coupled with ecosystems and human systems, this study starts from the perspective of ES supply–demand and sets “make ecological zoning management more scientific and forward-looking” as the goal. This study focuses on three practical problems as follows: the mismatch between ES supply and ES demand assessments, the mechanical and subjective delineation of ecological zoning, and rough management strategies, then constructs a practical multi-scale ecological management framework for “comprehensive supply–demand evaluation, ecological zoning delineation, and human well-being enhancement”.
The framework mainly included the following three parts (Figure 2): (1) ES supply–demand accounting: the supply side adopts the ecological model, and the demand side decomposes three indicators including cardinality, quality, and hierarchy to construct a highly adaptive assessment system for ES supply–demand, assessing the supply–demand level of sub-items as well as comprehensive ESs in Hangzhou in 2020; (2) ES supply–demand matching and coordinating: assessing the spatial matching and coordinating degree of total ES supply raster and ES demand raster, identifying supply–demand mismatch areas and key points, and guiding the delineation of zoning; and (3) spatial ecological management pathway: following the logic of “delineate zones–identify management priorities–refine measures”, delineate the first and second level zones for ecological management by matching supply and demand, and develop strategies to adjust supply and demand; identify the dominant ES bundles, clarify the priority of ESs, and then determine the key management types; and formulate measures by combining natural conditions, social conditions, and superior planning, which will help to accurately take management measures to enhance human well-being. Since ESs have a scale effect, this study considers the multi-scale characteristics of ES supply–demand and carries out a dual-scale analysis at the county and grid scale in three parts to improve the accuracy and practicability of ecological management decisions. In the area of Hangzhou, we select a 2000 m × 2000 m grid scale based on the average area of the township.

3.2. Quantifying ES Supply

ESs include provisioning, regulating, supporting, and cultural services [33]. Among them, cultural services are non-material benefits acquired by humans through subjective perception, which are mostly accounted for using social surveys and fluctuate significantly within a decade [34]. This study focuses on the material supply and long-term management of ESs. Combining the natural resource endowment, planning orientation, and current ecological problems of Hangzhou, based on the Integrated Valuation of Ecosystem Service and Trade-offs (InVEST) model, and considering data accessibility, five ESs were selected, including support services (habitat quality), regulation services (soil conservation, carbon storage), and provisioning services (water yield, food production).

3.2.1. Habitat Quality (HQ)

HQ refers to the ability of ecosystems to provide appropriate conditions for the sustainable development of species [35], and it is an important characterization of regional biodiversity [36]. The HQ module of the InVEST model generates a map of habitat quality for the current scenario or a future point in time by setting the sources of habitat threats and introducing the level of anthropogenic disturbance. The core formula is as follows:
E S x , s h = H j [ 1 D x j z D x j z + k z ]
where E S x , s h is the habitat quality index of the xth grid in Hangzhou; H j is the habitat suitability of land use type j; D x j is the threatened degree of the xth grid in land use type j; k is the half-saturation constant, which takes the value of 0.38 after the trial run of the model based on the User’s Guide [37]; and z is the constant of 2.5. Parameterization is based on the literature from the same climatic zone and areas with similar industrial structures (Table 2 and Table 3).

3.2.2. Soil Conservation (SC)

SC refers to ecosystems that reduce soil erosion by slowing down erosion and intercepting sediment [1], which is important for preventing land degradation, reducing flooding, and guaranteeing food security [43,44]. The SDR module of the InVEST model uses the revised universal soil loss equation [12]. The core formula is as follows:
E S x , s s = R K L S x U S L E x = R x × K x × L S x × 1 C x × P x
where E S x , s s is the total soil retention amount (t/hm2) of the xth grid in Hangzhou; R K L S x and U S L E x are the potential soil erosion and actual soil erosion of the xth grid; and R x , K x , L S x , C x , and P x are the precipitation erosivity factor, soil erodibility, slope length gradient, crop management factor, and erosion control practice factor of the xth grid, respectively. Parameterization is based on the literature from the proximate climatic zone (Table 4).

3.2.3. Carbon Storage (CS)

CS refers to ecosystems that regulate the climate by increasing or decreasing greenhouse gases in the atmosphere [47,48], which is of strategic importance for achieving carbon neutrality. The CSS module of the InVEST model estimates carbon stocks by correlating land use types with the four basic carbon pools [49]. The formula is as follows:
E S x , s c = C x _ a b o v e + C x _ b e l o w + C x _ s o i l + C x _ d e a d
where E S x , s c is the total carbon density (t/hm2) in Hangzhou and C x _ a b o v e , C x _ b e l o w , C x _ s o i l , and C x _ d e a d are the aboveground vegetation carbon density, belowground vegetation carbon density, soil carbon density, and dead organic matter carbon density of the xth grid, respectively. Parameterization is based on the literature from the same climatic zone and areas with similar industrial structures (Table 5).

3.2.4. Water Yield (WY)

WY is essential to the regional water cycle and sustainable social development [52]. The AWY module of the InVEST model does not consider surface water–groundwater interactions. The formula is as follows:
E S x , s w = 1 A E T x j P x × P x
where E S x , s w is the annual water production of the xth grid in Hangzhou (m3) and A E T x and P x are the actual annual evapotranspiration (mm) and average annual precipitation (mm) of the xth grid, respectively.
A E T x P x = 1 + ω × P E T / P 1 + ω × P E T / P + P / P E T
where P E T is the annual potential evapotranspiration (mm) and ω is a non-physical parameter with no dimension.
ω = P A W C P × Z + 1.25
where P A W C is the plant available water content (mm) and Z is a seasonal constant, which, in this study, was calibrated by the water-producing coefficient of the statistical data of Hangzhou to take the value of 1.35.
The model also requires inputs of Root Restricting Layer Depth and biophysical tables to correct for AET; the former was replaced with depth-to-bedrock in this study; the latter parameter was set concerning the model guidelines and literature (Table 6). We compared the total water production with the data in the Statistical Yearbook and found that the actual relative error was −0.01%, which indicates that the results have high confidence.

3.2.5. Food Production (FP)

FP contributes to the improvement of living standards, human well-being, and national security. In this study, the gross output values of agriculture, forestry, animal husbandry, and fisheries in Hangzhou are assigned to farmland, forest and shrubland, grassland, waters, and wetlands, respectively (Table 7).

3.2.6. The Total ES Supply

In this study, since each ES supply is crucial for Hangzhou, after normalizing the assessment results of the five ESs, they were superimposed by equal weights to obtain the comprehensive assessment results of the total ES supply in Hangzhou.

3.3. Quantifying ES Demand

ES demand is closely related to the level of urbanization, economic conditions, and the degree of social development. In this paper, considering the demand drivers and data availability, three types of indicators, namely, POP, GDP per area, and land development intensity, were selected to reflect the intensity of ES demand [12,15,54,55]. The larger the indicator value, the higher the ES demand in the space. In detail, POP characterizes the demand cardinality, and the population size is directly proportional to the demand. Land development intensity reflects the intensity of human activities, and the construction of towns needs to be supported by the material supply of ecosystems. At the same time, under the role of the functionality and scarcity of ecological elements, the higher the intensity of human activities, the higher the quantity and quality of ES demand, so it is used to characterize the quality of demand. GDP per area represents the efficiency of land use, which can roughly reflect the economic conditions and living standards of the surrounding residents. So, it is used to characterize the hierarchy of demand.
Due to the notable differences in the spatial distribution of demographic and economic data, this study uses the natural logarithm to eliminate its local dramatic fluctuation without affecting the overall distribution. The formula is as follows [12]:
E S x d = a x 1 + lg a x 2 + lg a x 3
where E S x d is the total ES demand intensity of the xth grid in Hangzhou and a x 1 , a x 2 , and a x 3 are the land development intensity, population density (person/km2), and GDP per area (million RMB /km2) of the xth grid, respectively.

3.4. Matching the Supply and Demand of ESs

ES supply–demand in Hangzhou is an indicator for weighing regional ecological protection and economic development. The Z-score standardized method was used to spatially match the total ES supply and ES demand, which takes the overall average value of Hangzhou as a benchmark. Instead of pursuing an absolute equilibrium of supply and demand, this study is based on the ecological resources and future demand trends for ecological management zoning. The formula is as follows:
Z = x μ σ
where Z is the standardized value of the total supply or demand of ESs in Hangzhou; x is the raw score of ES supply or demand; μ is the overall mean of ES supply or demand; and σ is the standard deviation of ES supply or demand.
A coordination index is constructed to describe the sustainability of ES supply–demand in each area. The formula is as follows:
ES_C = B × T
B = N s × N d N s + N d / 2 2
T = α N s + β N d
where ES_C is the coordination degree of ES supply–demand in Hangzhou, ES_C∈[0, 1]; B is the coupling degree; N s is the normalized ES supply; N d is the normalized ES demand; T is the coordination index; and α and β are the weights of supply and demand, where α = β = 0.5 because supply and demand are equally important in the framework of this study.
Coordination was divided into 6 levels using the interval breakpoint (Table 8).

3.5. Identification of ES Bundles

ES bundles are stable combinations of multiple ES types that occur repeatedly in the same time and space [56,57]. They can reflect the trade-offs and synergies among ESs and the spatial distribution patterns of different bundles [58] (Huang et al., 2023). By identifying the dominant ES bundle in the region, control priorities can be clarified to provide decision support for regional ecological management.
The Self-Organizing Feature Map (SOM) method was implemented to identify ES bundles at the grid scale, which is an unsupervised artificial neural network with multiple iterations, self-learning, and non-linear mapping [59]. We used the “Kohonen” package in the R4.3.0 platform to complete the calculations, and the final spatial presentation was performed in ArcGIS 10.3.

4. Results

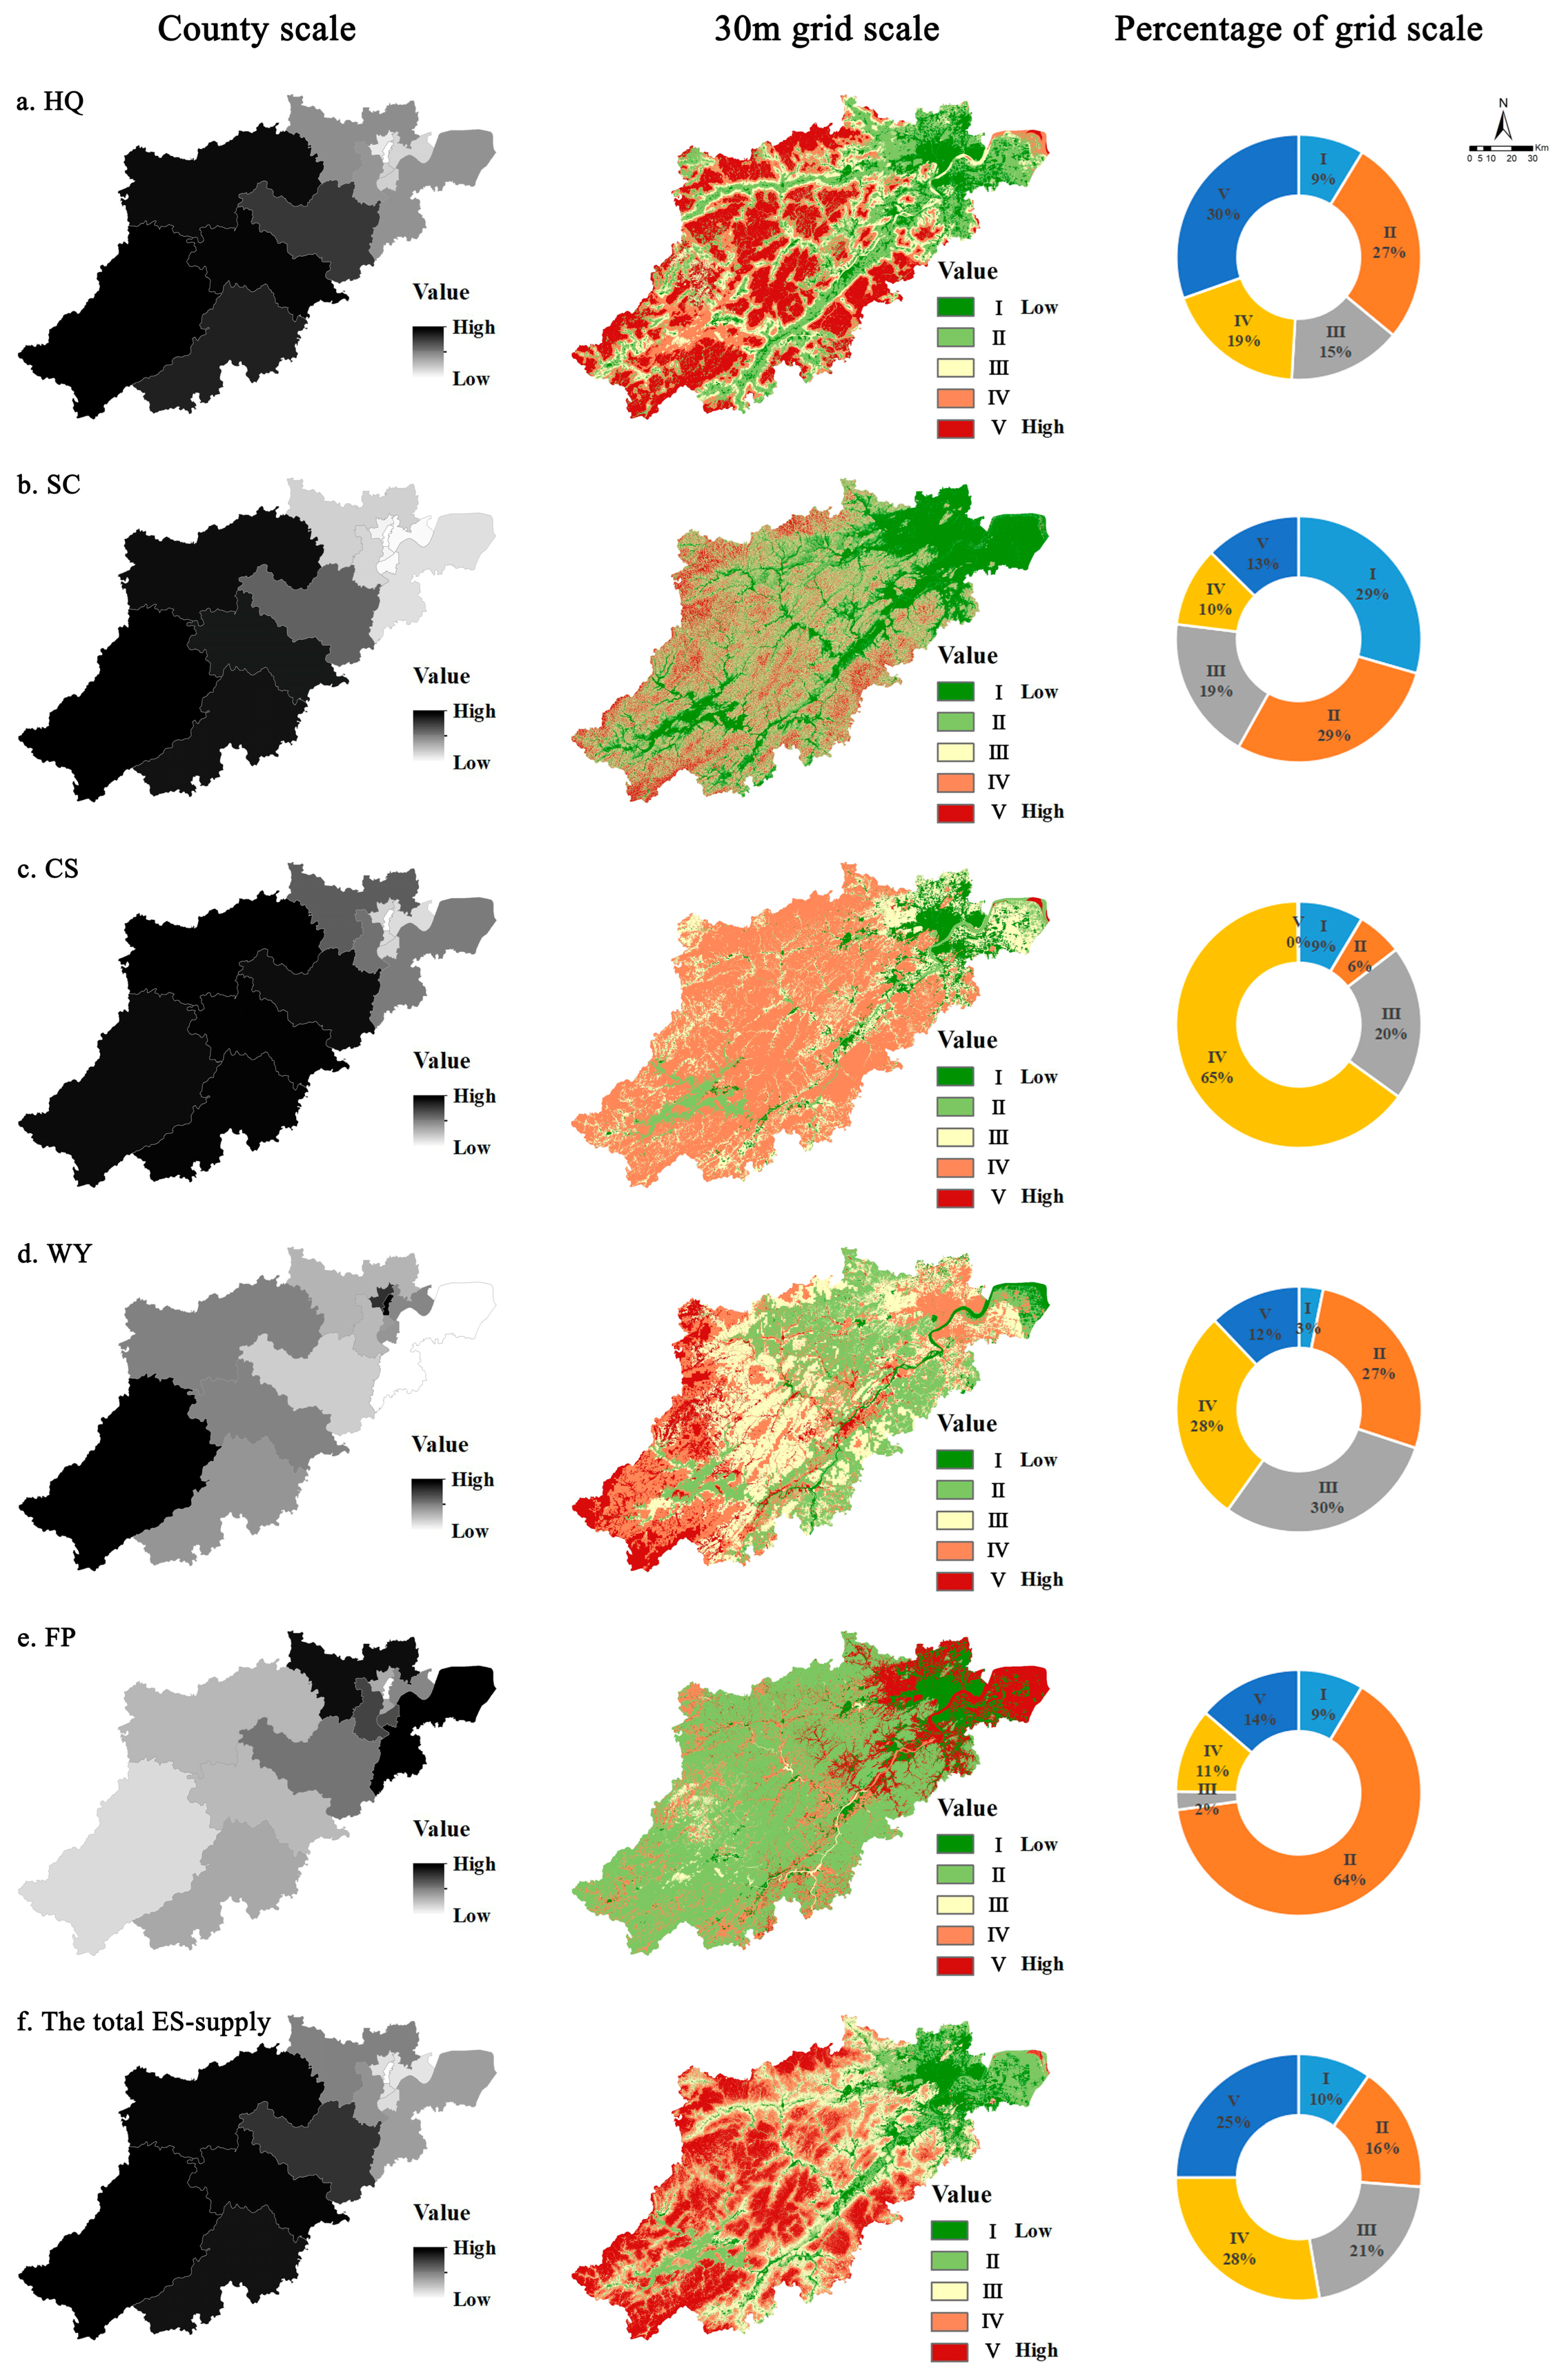
4.1. Spatial Patterns of ES Supply

HQ, WY, FP, and CS used the natural breakpoint, while SC used the manual breakpoint due to the large data extremes and uneven distribution of quantities, to categorize ES supply in Hangzhou into five levels (Figure 3).
Figure 3 reports the significant spatial differentiation in the ES supply pattern in Hangzhou. Generally, the ES supply level in Hangzhou is relatively good, showing a spatial pattern of “high in the southwest and low in the northeast”. The spatial trends at the grid and county scales are the same.
At the grid scale, the high-value zones (2.04–3.37) account for 52.7% of the total, mainly located in Chun’an, Lin’an, Tonglu, Jiande, and western Fuyang. The above area contains ecological reserves such as Qingliang Peak, Tianmu Mountain National Nature Reserve, West Lake Scenic Spot, and Banshan National Forest Park and is very rich in wildlife resources, where the ecological base is fine and structurally intact. The median-value zones (1.57–2.03) account for 21.1%, mainly located in Lin’an, Jiande, Fuyang, central Xihu, eastern Yuhang, and southern Xiaoshan and partly scattered in other counties, with the mainland types of farmland and forestry close to the construction land. These areas are less disturbed by human beings, and their ecological functions are relatively stable. The low-value zones (0.47–1.56) account for 26.2%, mainly distributed in the eight counties of the main city. The region is extremely densely populated, socio-economically active, and productive, and over the years, high-intensity urbanization has encroached on a large amount of ecological land, with daily human activities frequently interfering with ecological processes.
Specifically, the spatial distribution of HQ and CS are relatively similar, with differences in the other ESs. The average value of HQ in Hangzhou is 0.56. The high-value zones are mainly distributed in Lin’an, Tonglu, and Chun’an, which have large areas of forests, meadows, and lakes with large topographic undulations, showing a spatial pattern of “divided by two urban development belts”. The average value of SC is 399.18 t/hm2. The high-value zones are mainly distributed in areas with higher elevations, such as Tianmu Mountain in Lin’an, northeastern Tonglu, southern Jiande, etc. The region has a complex soil composition and high vegetation cover, which helps to reduce erosion from rainfall runoff and increase infiltration capacity, thus slowing down soil erosion. The average value of CS is 12.62 t/hm2, with a higher level overall. The low-value zones are mainly distributed in Gongshu, Xiacheng, Shangcheng, Jianggan, Binjiang, etc., which have a high level of urbanization, as well as in large areas of water, such as the Qiantang River and Qiandao Lake. It shows a spatial pattern of “radial growth from the northeast to the outside”, which is highly positively correlated with the spatial distribution of woody plants. The average value of WY is 1297.69 mm. The high-value zones are mainly distributed in Chun’an, which has more annual precipitation, as well as Gongshu and Xiacheng. The average value of FP is 286.20 million RMB/km2, and the high-value zones are mainly around the center of the city, such as Yuhang, Xiaoshan, and the southern wing of Xihu, with flat terrain and mostly cultivated land, showing a spatial pattern of “high in the northeast and low in the southwest”.

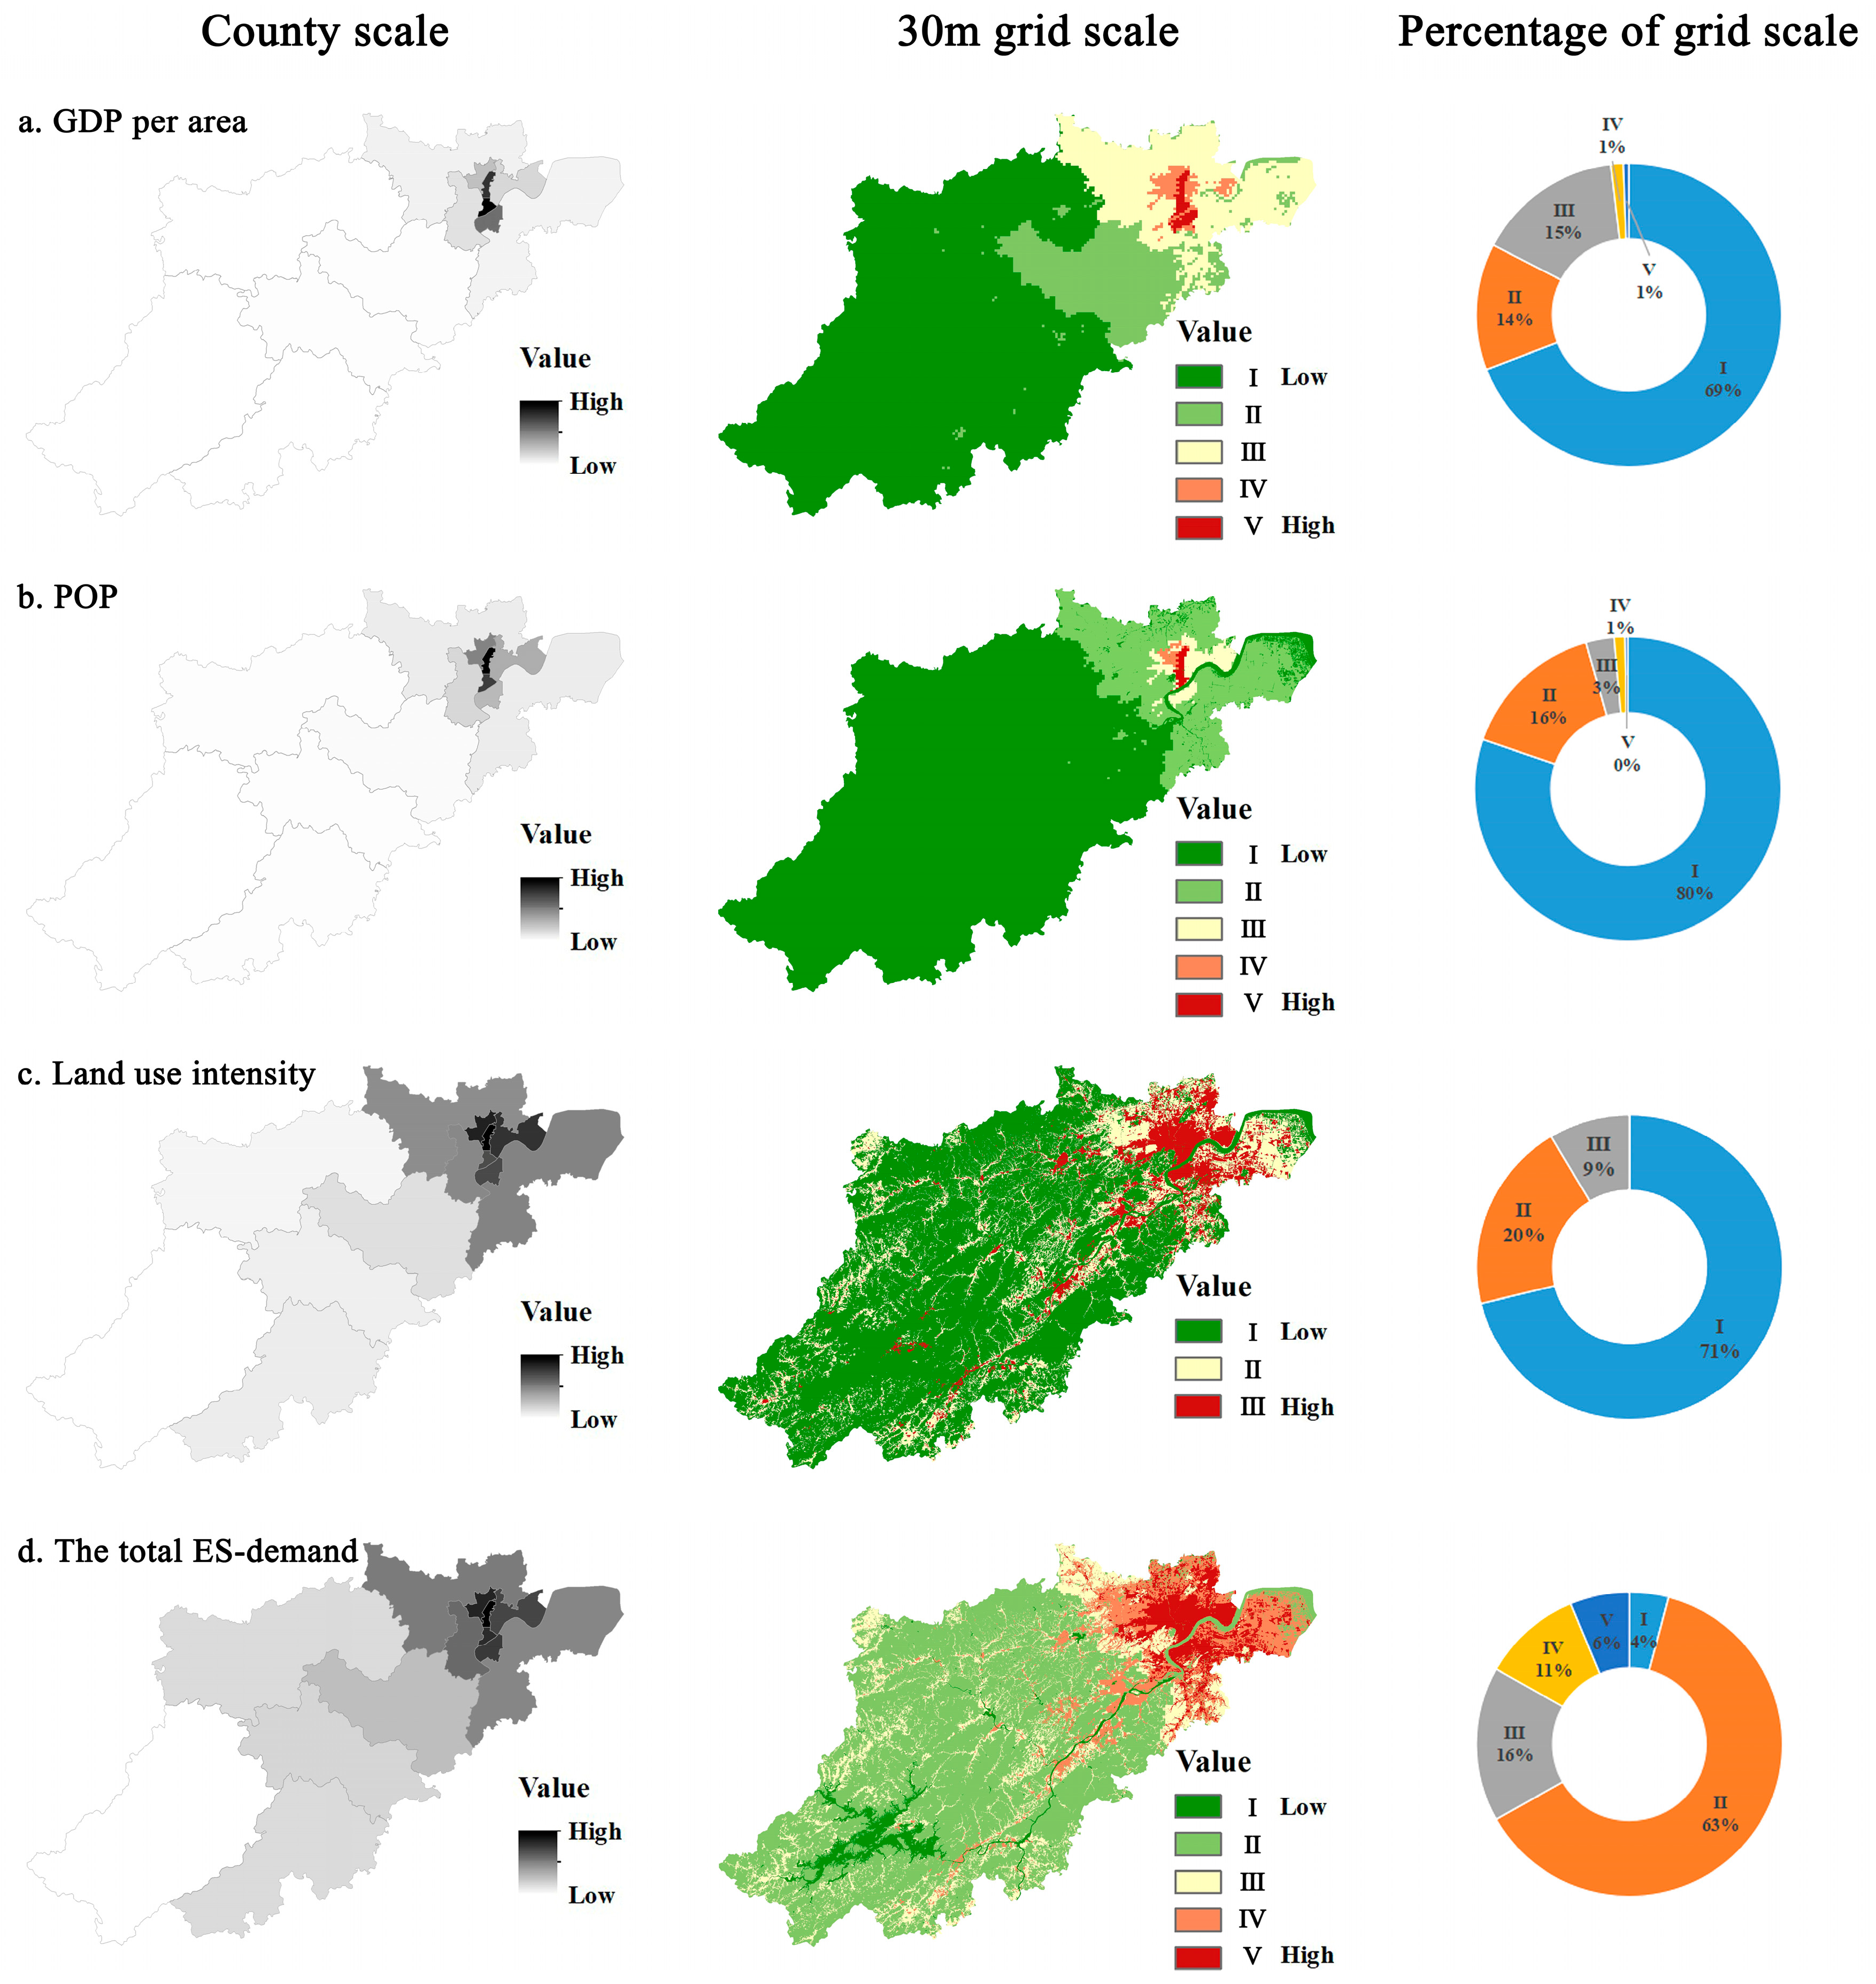
4.2. Spatial Patterns of ES Demand

The Natural Breaks was used to categorize the ES supply in Hangzhou into five levels (Figure 4).
Figure 4 reports the uneven spatial distribution of the ES demand pattern in Hangzhou. Generally, ES demand is relatively concentrated, showing a spatial pattern of “high in the northeast and low in the southwest”. Spatial distribution patterns at the grid scale are similar to those at the county scale.
At the grid scale, high-value zones account for 16.7% of the total, mainly located in the eight counties of the main city as well as in eastern Fuyang. The above areas are highly urbanized with a developed economy, dense population, and extremely high land development intensity. Medium-value zones accounted for 16.5%, mainly distributed in western Yuhang, the central part of Xihu, and southern Xiaoshan and sporadically distributed in the six southwestern counties. It is worth noting that although West Lake, Liangzhu Cultural Village, Xianghu National Tourism Resort, and Banshan National Forest Park are located in highly urbanized zones, they have fewer large-scale human activities and lower ecological needs. This is mainly due to the implementation of a series of ecological protection policies in Hangzhou, such as the “13th Five-Year Plan for Environmental Protection in Hangzhou”, “Ecological Restoration Plan for Hangzhou Territorial Space”, and “Regulations on the Protection of Wetlands in Hangzhou”, which limit the conversion of land types and human activities and strengthen the supervision. The low-value zones account for 66.8%, mainly located in Lin’an, Fuyang, Tonglu, Chun’an, Jiande, eastern Xiaoshan, and West Lake and Qiantang River. There are fewer towns, and human ecological needs are relatively homogenous.

4.3. Matching Supply and Demand of ESs at Multiple Scales

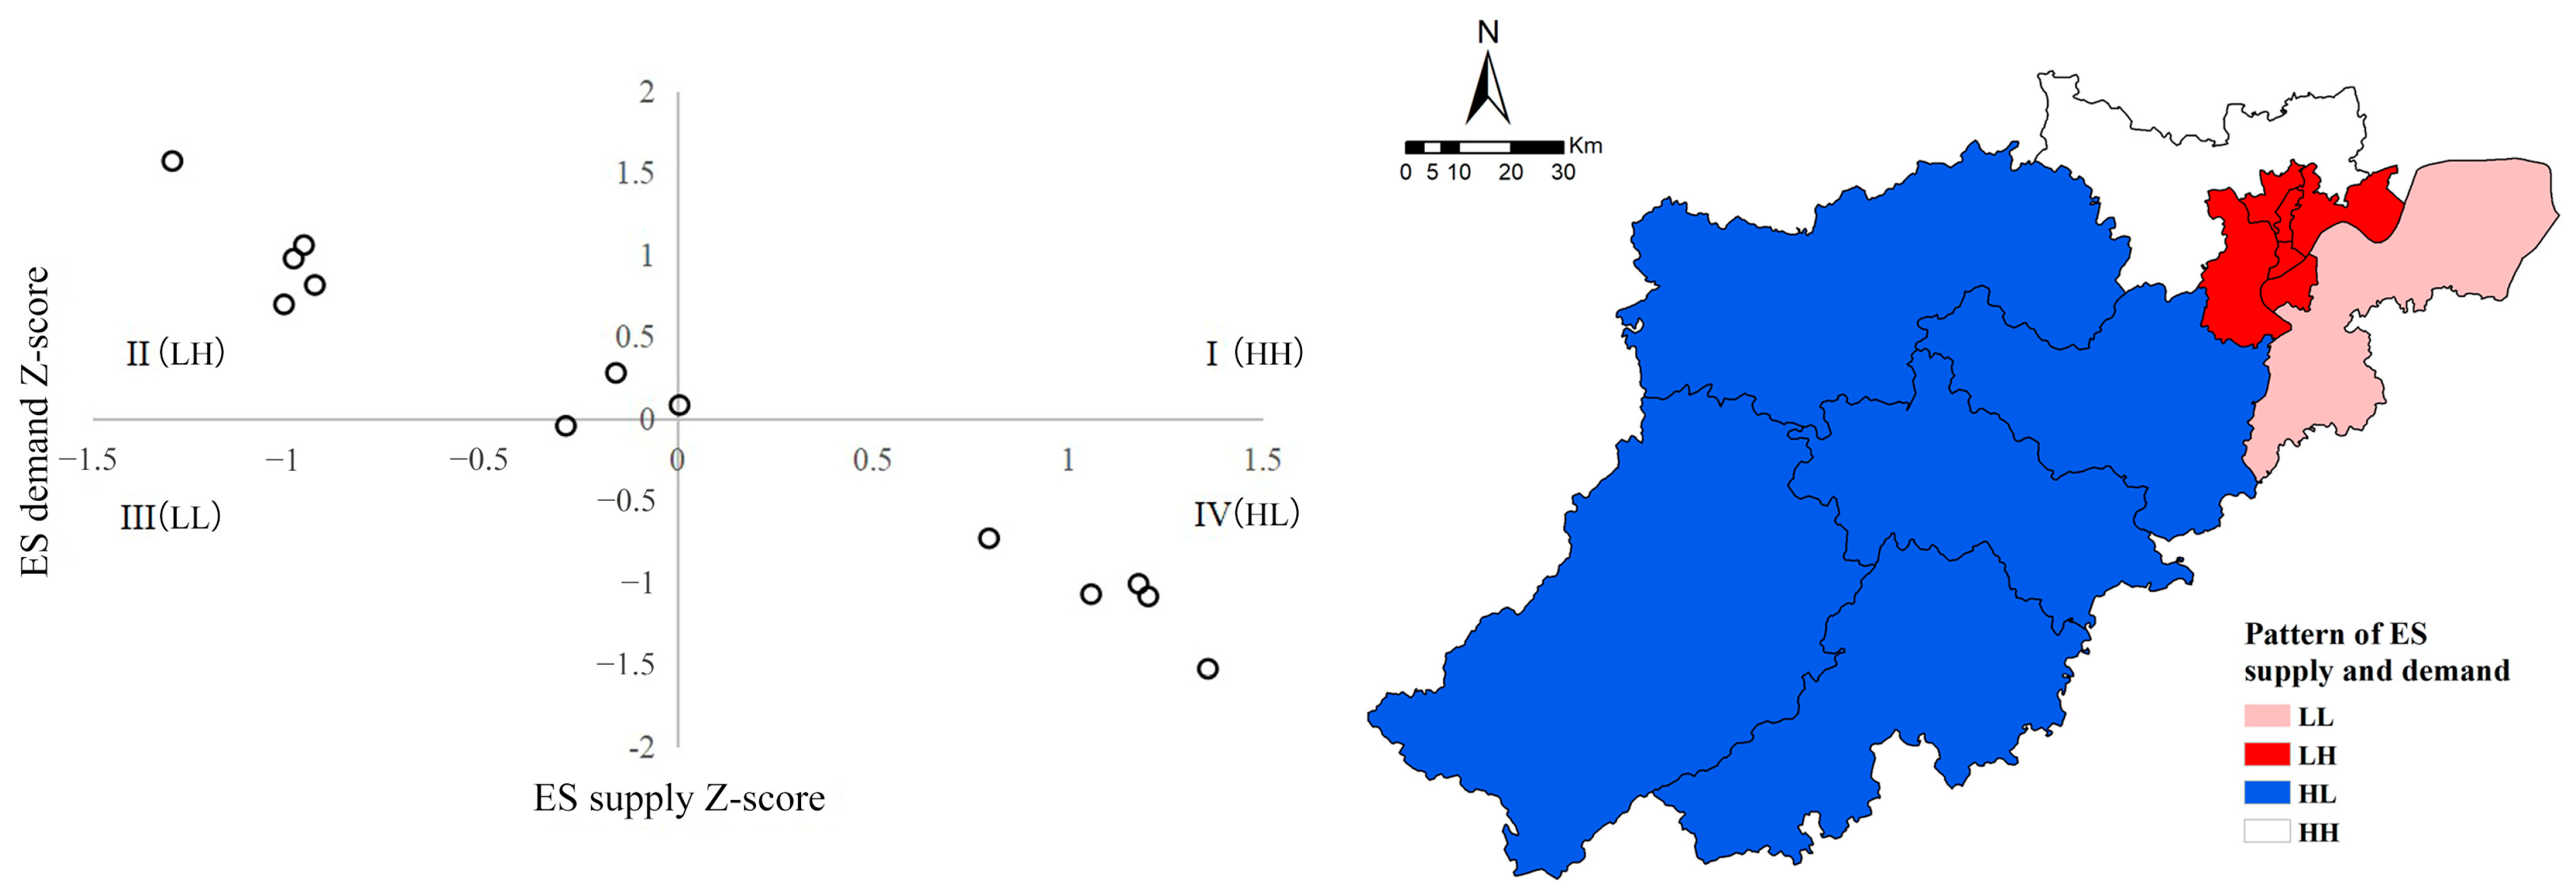
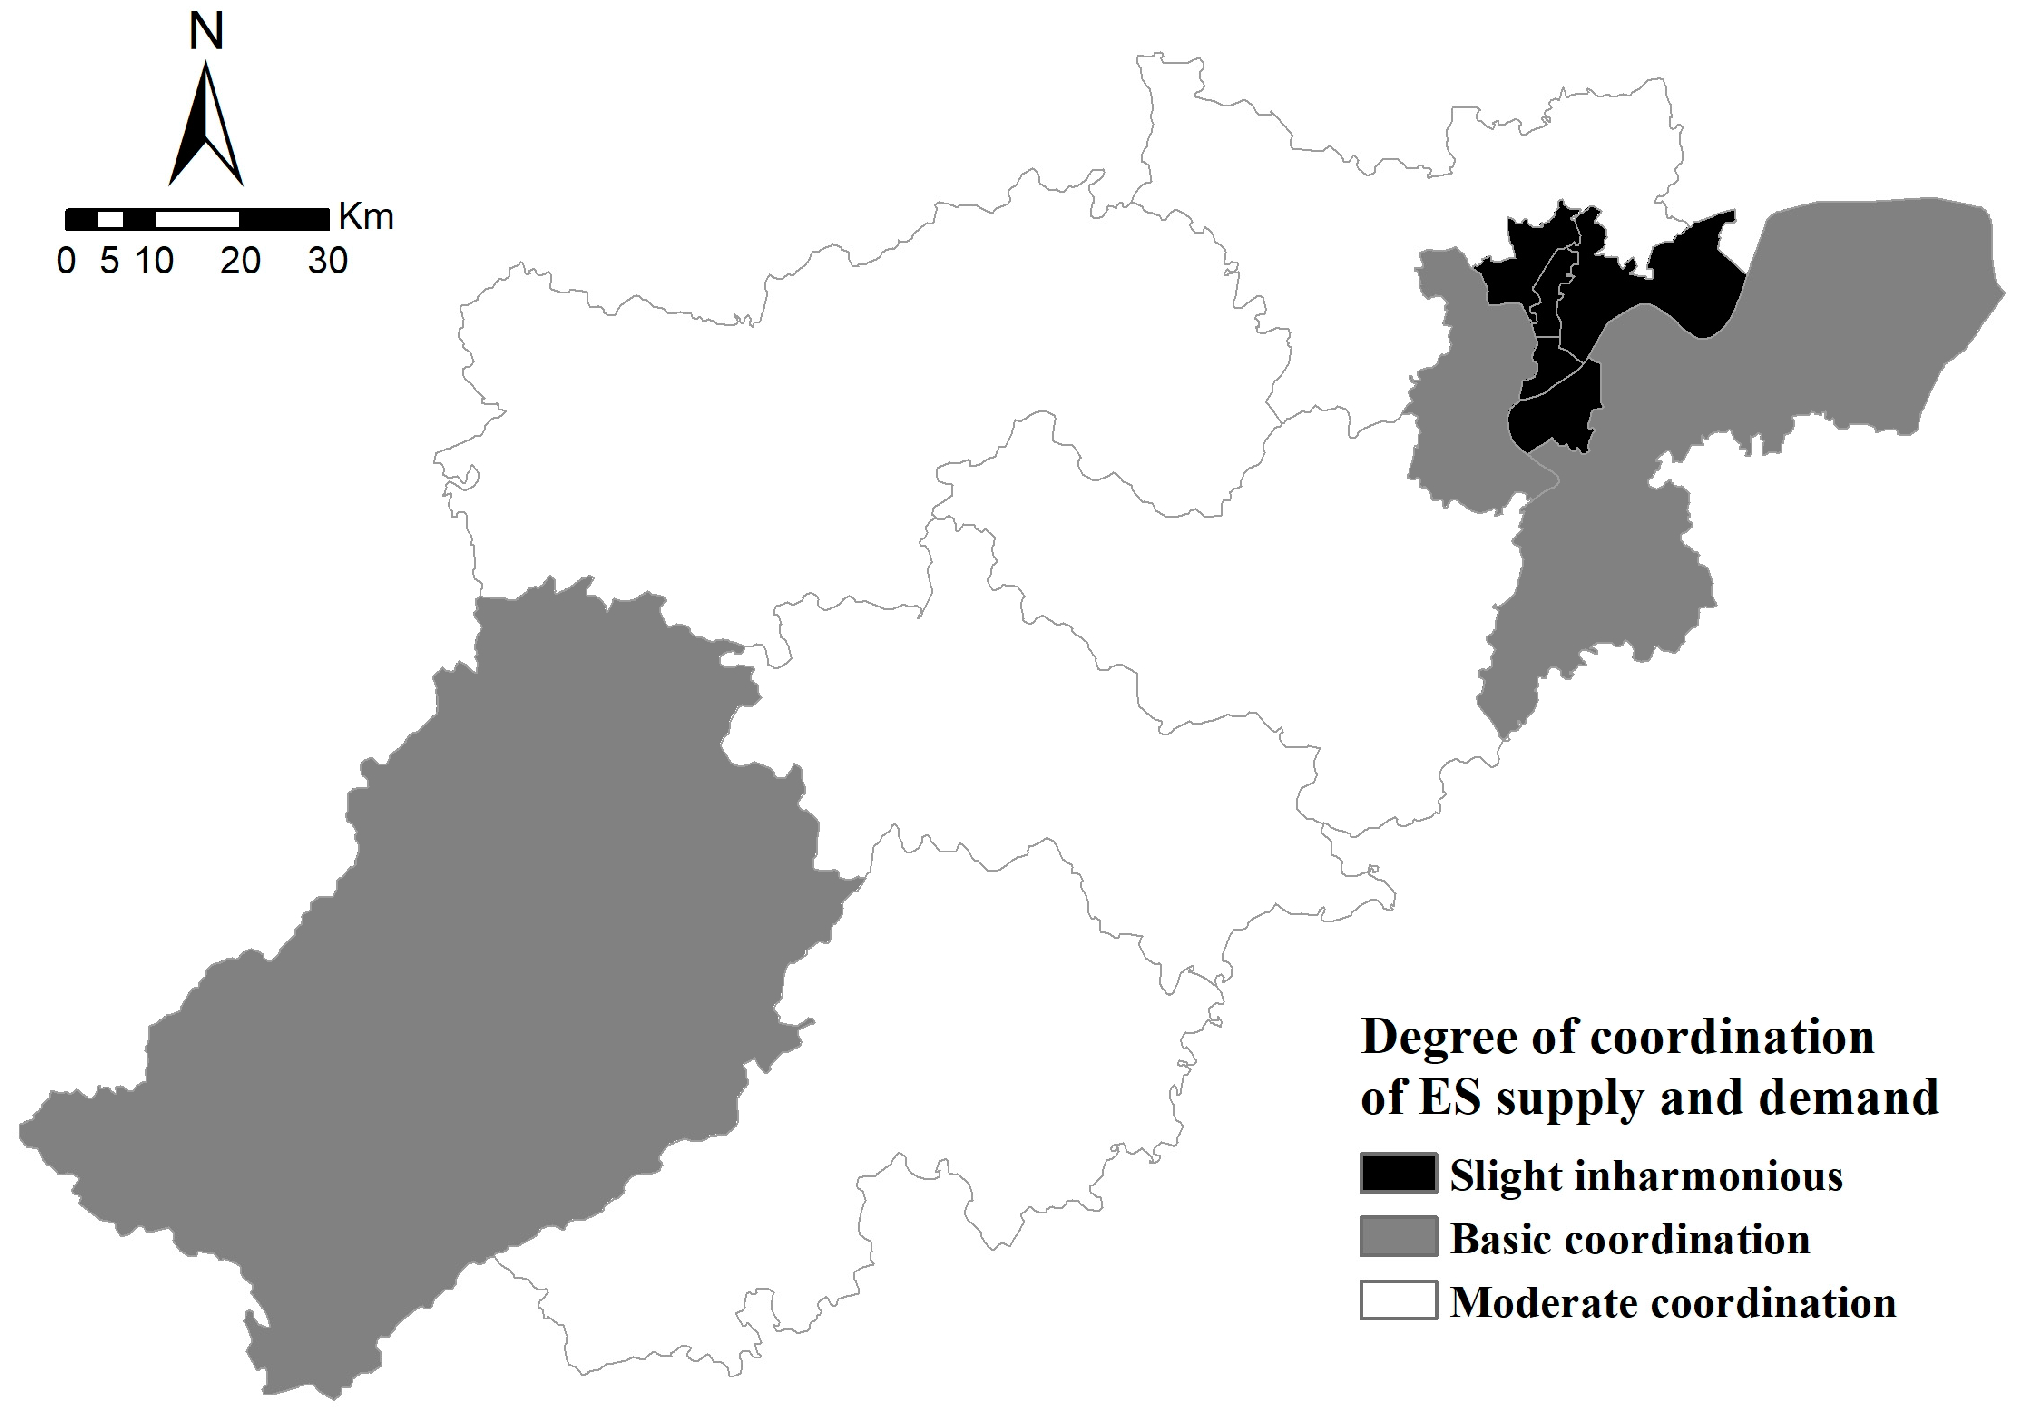
4.3.1. Matching Supply and Demand of ESs at the County Scale

The ES supply–demand matching in Hangzhou consists of four patterns: high supply–high demand of relative matching type (HH) (Quadrant I, Z-supply > 0, Z-demand > 0, including Yuhang); low supply–high demand of mismatch type (LH) (Quadrant II, Z-supply < 0, Z-demand > 0, including Shangcheng, Xiucheng, Binjiang, Gongshu, Xihu, Jianggan); low supply–low demand of relative matching type (LL) (Quadrant III, Z-supply < 0, Z-demand < 0, including Xiaoshan); and high supply–low demand of mismatch type (HL) (Quadrant IV, Z-supply > 0, Z-demand < 0, including Lin’an, Fuyang, Tonglu, Chun’an, Jiande) (Figure 5). In terms of quadrant and spatial distribution, the five counties of HL type are all distributed in the southwest, and the difference in Z-score values is small. The six counties of LH type are all distributed in the northeast, with Xihu close to the equilibrium state, and the most intense contradiction in Xiaocheng. Supply and demand of ESs in Yuhang and Xiaoshan are both close to the regional average level.
In terms of the coordination degree, the ES supply–demand coordination index in Hangzhou is in the range of 0–0.84, with an average value of 0.59, which is at a basic level of coordination overall. This indicates that the supply and demand of ESs in Hangzhou are relatively balanced, and the interaction between the social system and the ecosystem is sustainable. The average coordination degree of each county is in the range of 0.44–0.63 (Figure 6), with a small regional gap. Among them, moderate coordination areas dominate, accounting for 61.2%, clustered in the central part of Hangzhou.

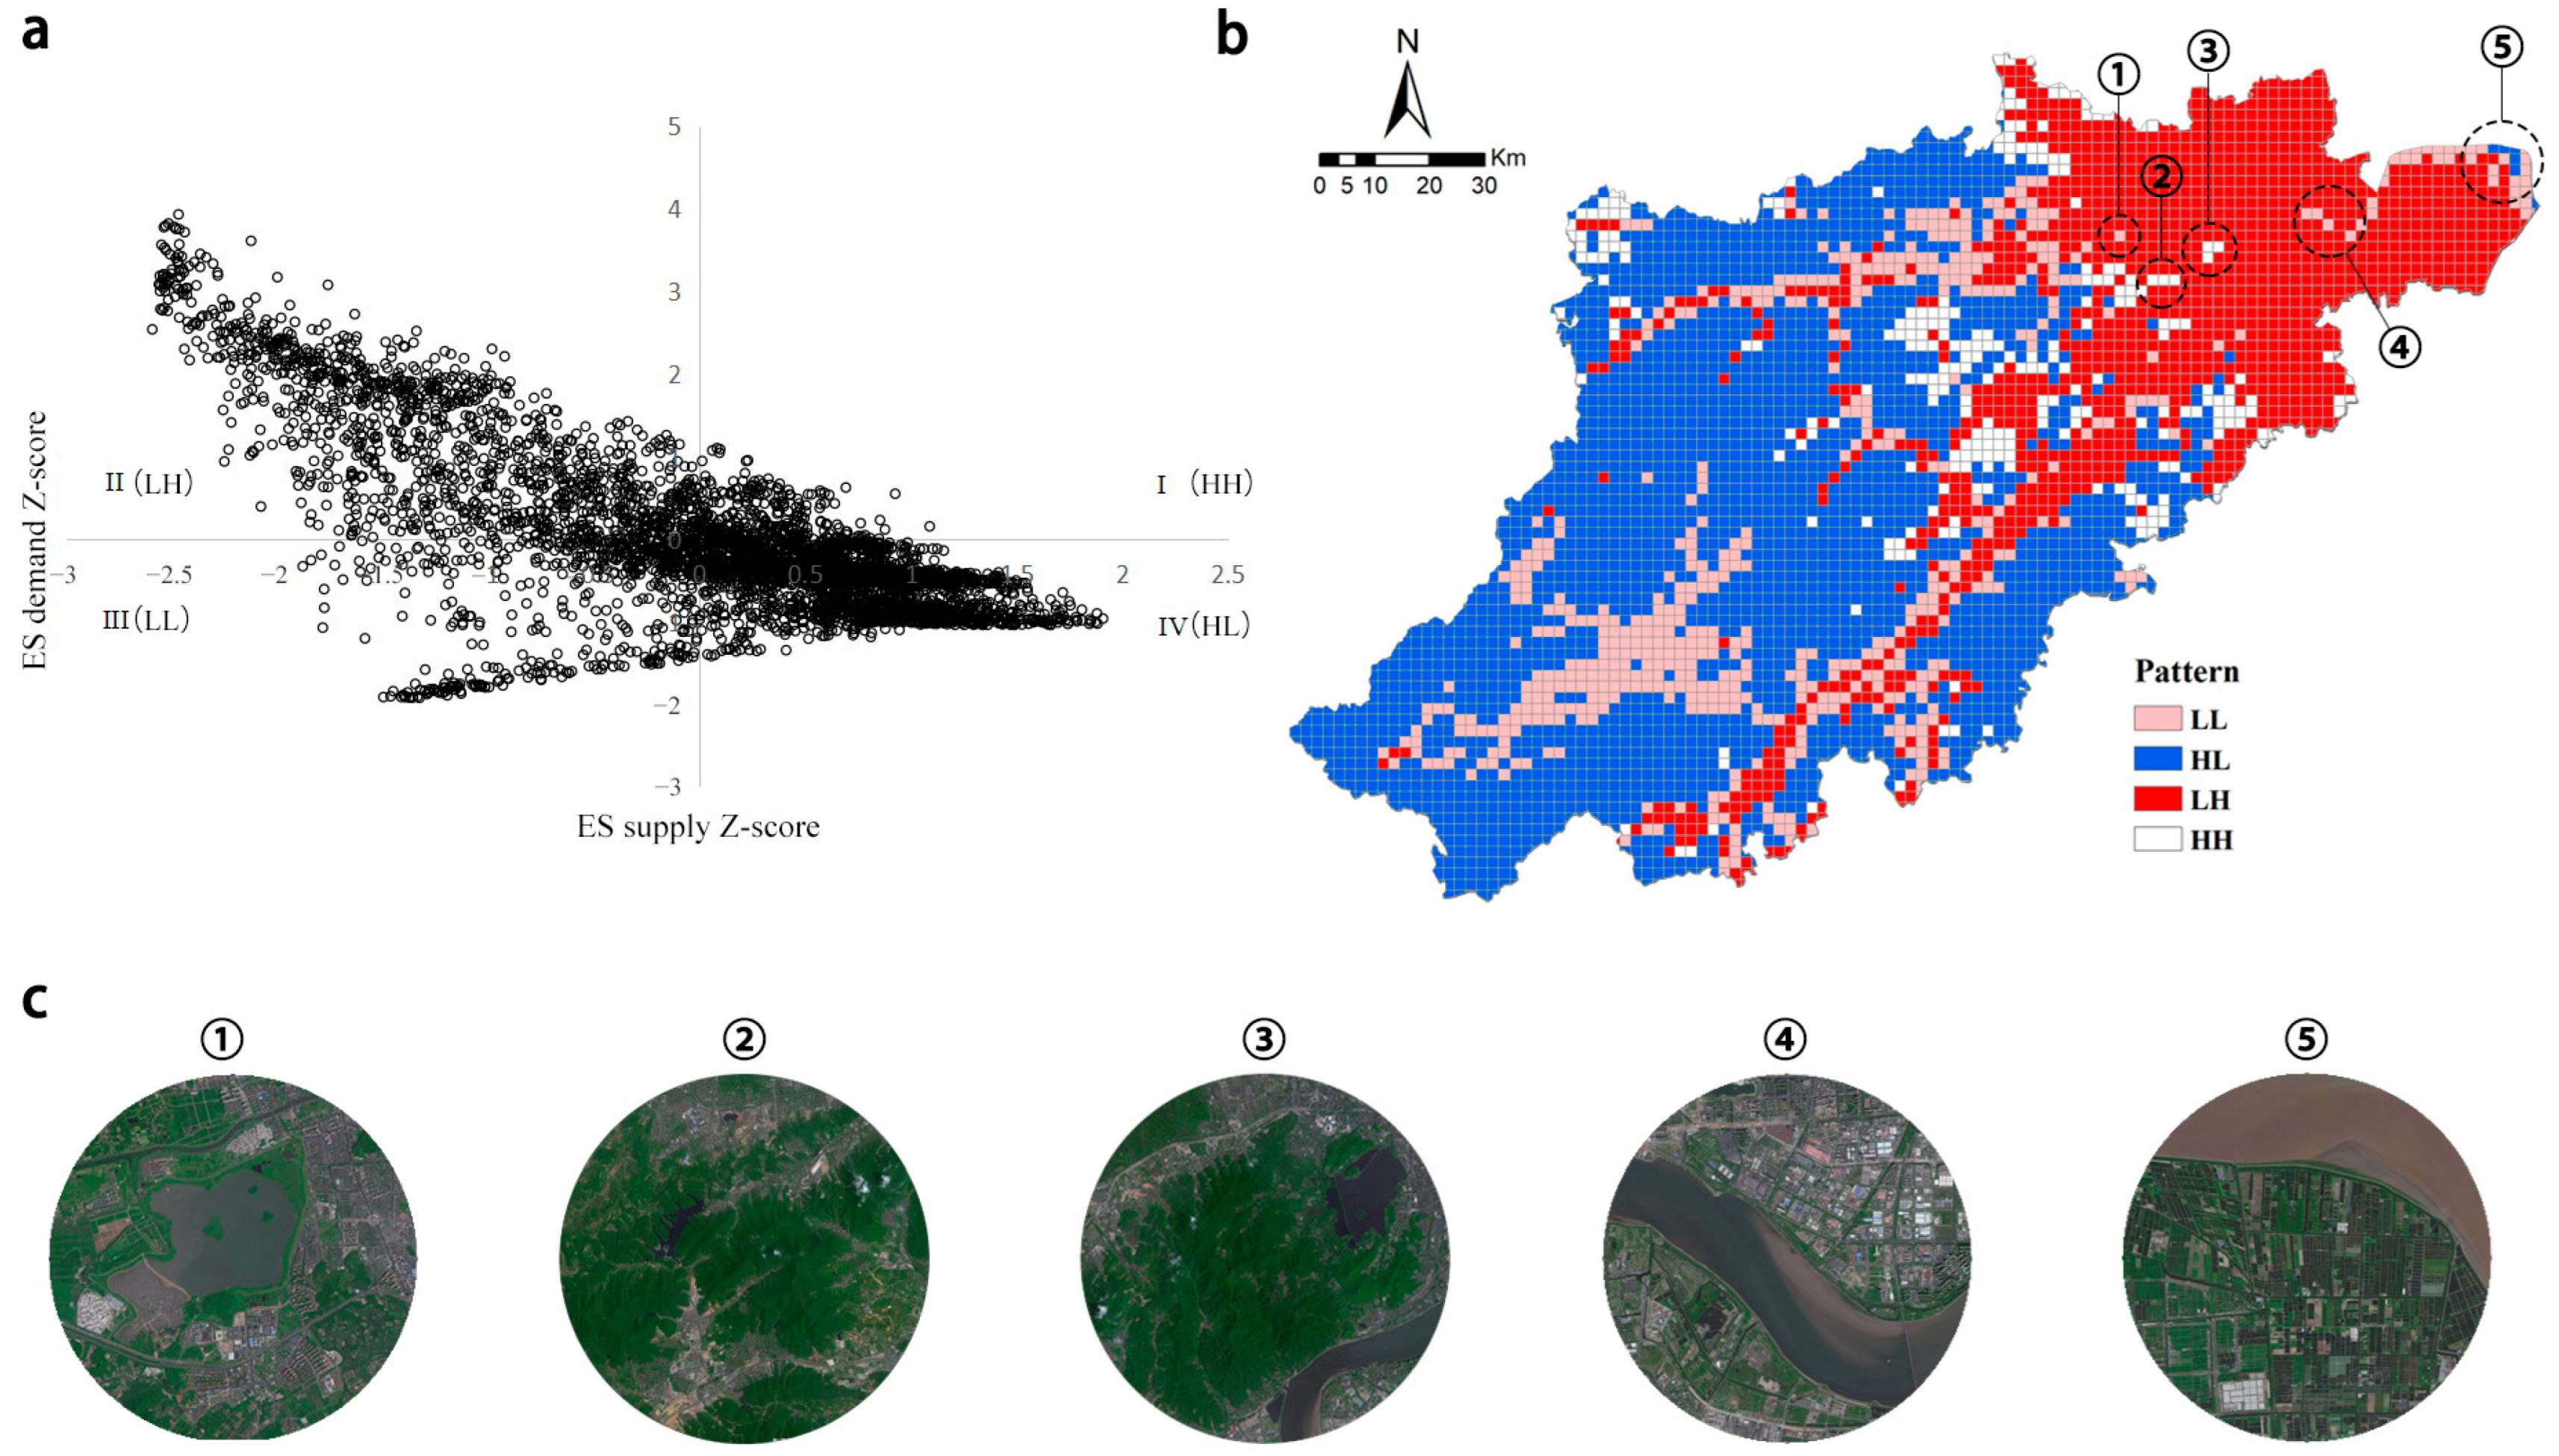
4.3.2. Matching Supply and Demand of ESs at the Grid Scale

Overall, Hangzhou has a serious problem of mismatch between the supply and demand of ESs, with a prominent imbalance in spatial distribution (Figure 7). HH space accounts for 6.2%, mainly distributed in Dongqiao and Xindeng towns in Fuyang. This type of area has excellent ecological resources, usually has a large area of woodland and lakes, and the boundary of human activities is obvious, with limited access conditions, which is a more ideal pattern. LH space accounts for 28.6%, mainly distributed in the eight counties of the main city, as well as other contiguous construction land, which is concentrated in human socio-economic activities, with a high intensity of land development, and little ecological land. Therefore, the conflict between supply and demand requires strict ecological control and optimization of the spatial pattern. LL space accounts for 12.8%, mainly distributed in Qiandao Lake, Qingshan Lake, the banks of Qiantang River, and Fuchun River, as well as around the construction sites in Lin’an, Tonglu, and Jiande. The former are affected by the watershed environment and perform generally among the five types of ESs selected. The latter are mostly farmland and woodland, which are shared spaces for the survival of small organisms and human activities and are vulnerable to neighboring towns. HL space accounts for 52.4%, which is the main type of ES supply–demand in Hangzhou, and is mostly distributed in the hilly areas around the large forests, grasslands, and watersheds. This indicates that Hangzhou is rich in natural resources and has a good ecological background, and there is an urgent need for corresponding management and control measures to stabilize the ecological security pattern, adjust the supply and demand service flow, and radiate to more ES demand areas.
Specifically, Chun’an has good ecological supply conditions and low ES demand, which can provide a large amount of ESs to Hangzhou. Lin’an, Tonglu, and Jiande have more similar ES supply–demand patterns. Influenced by the highway, a belt-shaped HH space is formed, and the LL space is distributed on both sides of it. The proportion of the four types of space in Fuyang is close. Within the main urban area, LH space occupies absolute dominance, and a small amount of HL space is located in the Jianghai wetland. LL space is mainly in the Qiantang River, West Lake, South Lake, and Tiaoxi Wetland. And HH space is mainly in the West Lake Scenic Area and Wuchaoshan National Forest Park in Xihu, the area of Banshan National Forest Park–Chaoshan Scenic Area–Gaoting Mountain Scenic Area in Yuhang and Jing Mountain–Cormorant Mountain, and the area of Bailong Temple–Hangwu Park and Shiyushan Mountain in Xiaoshan.

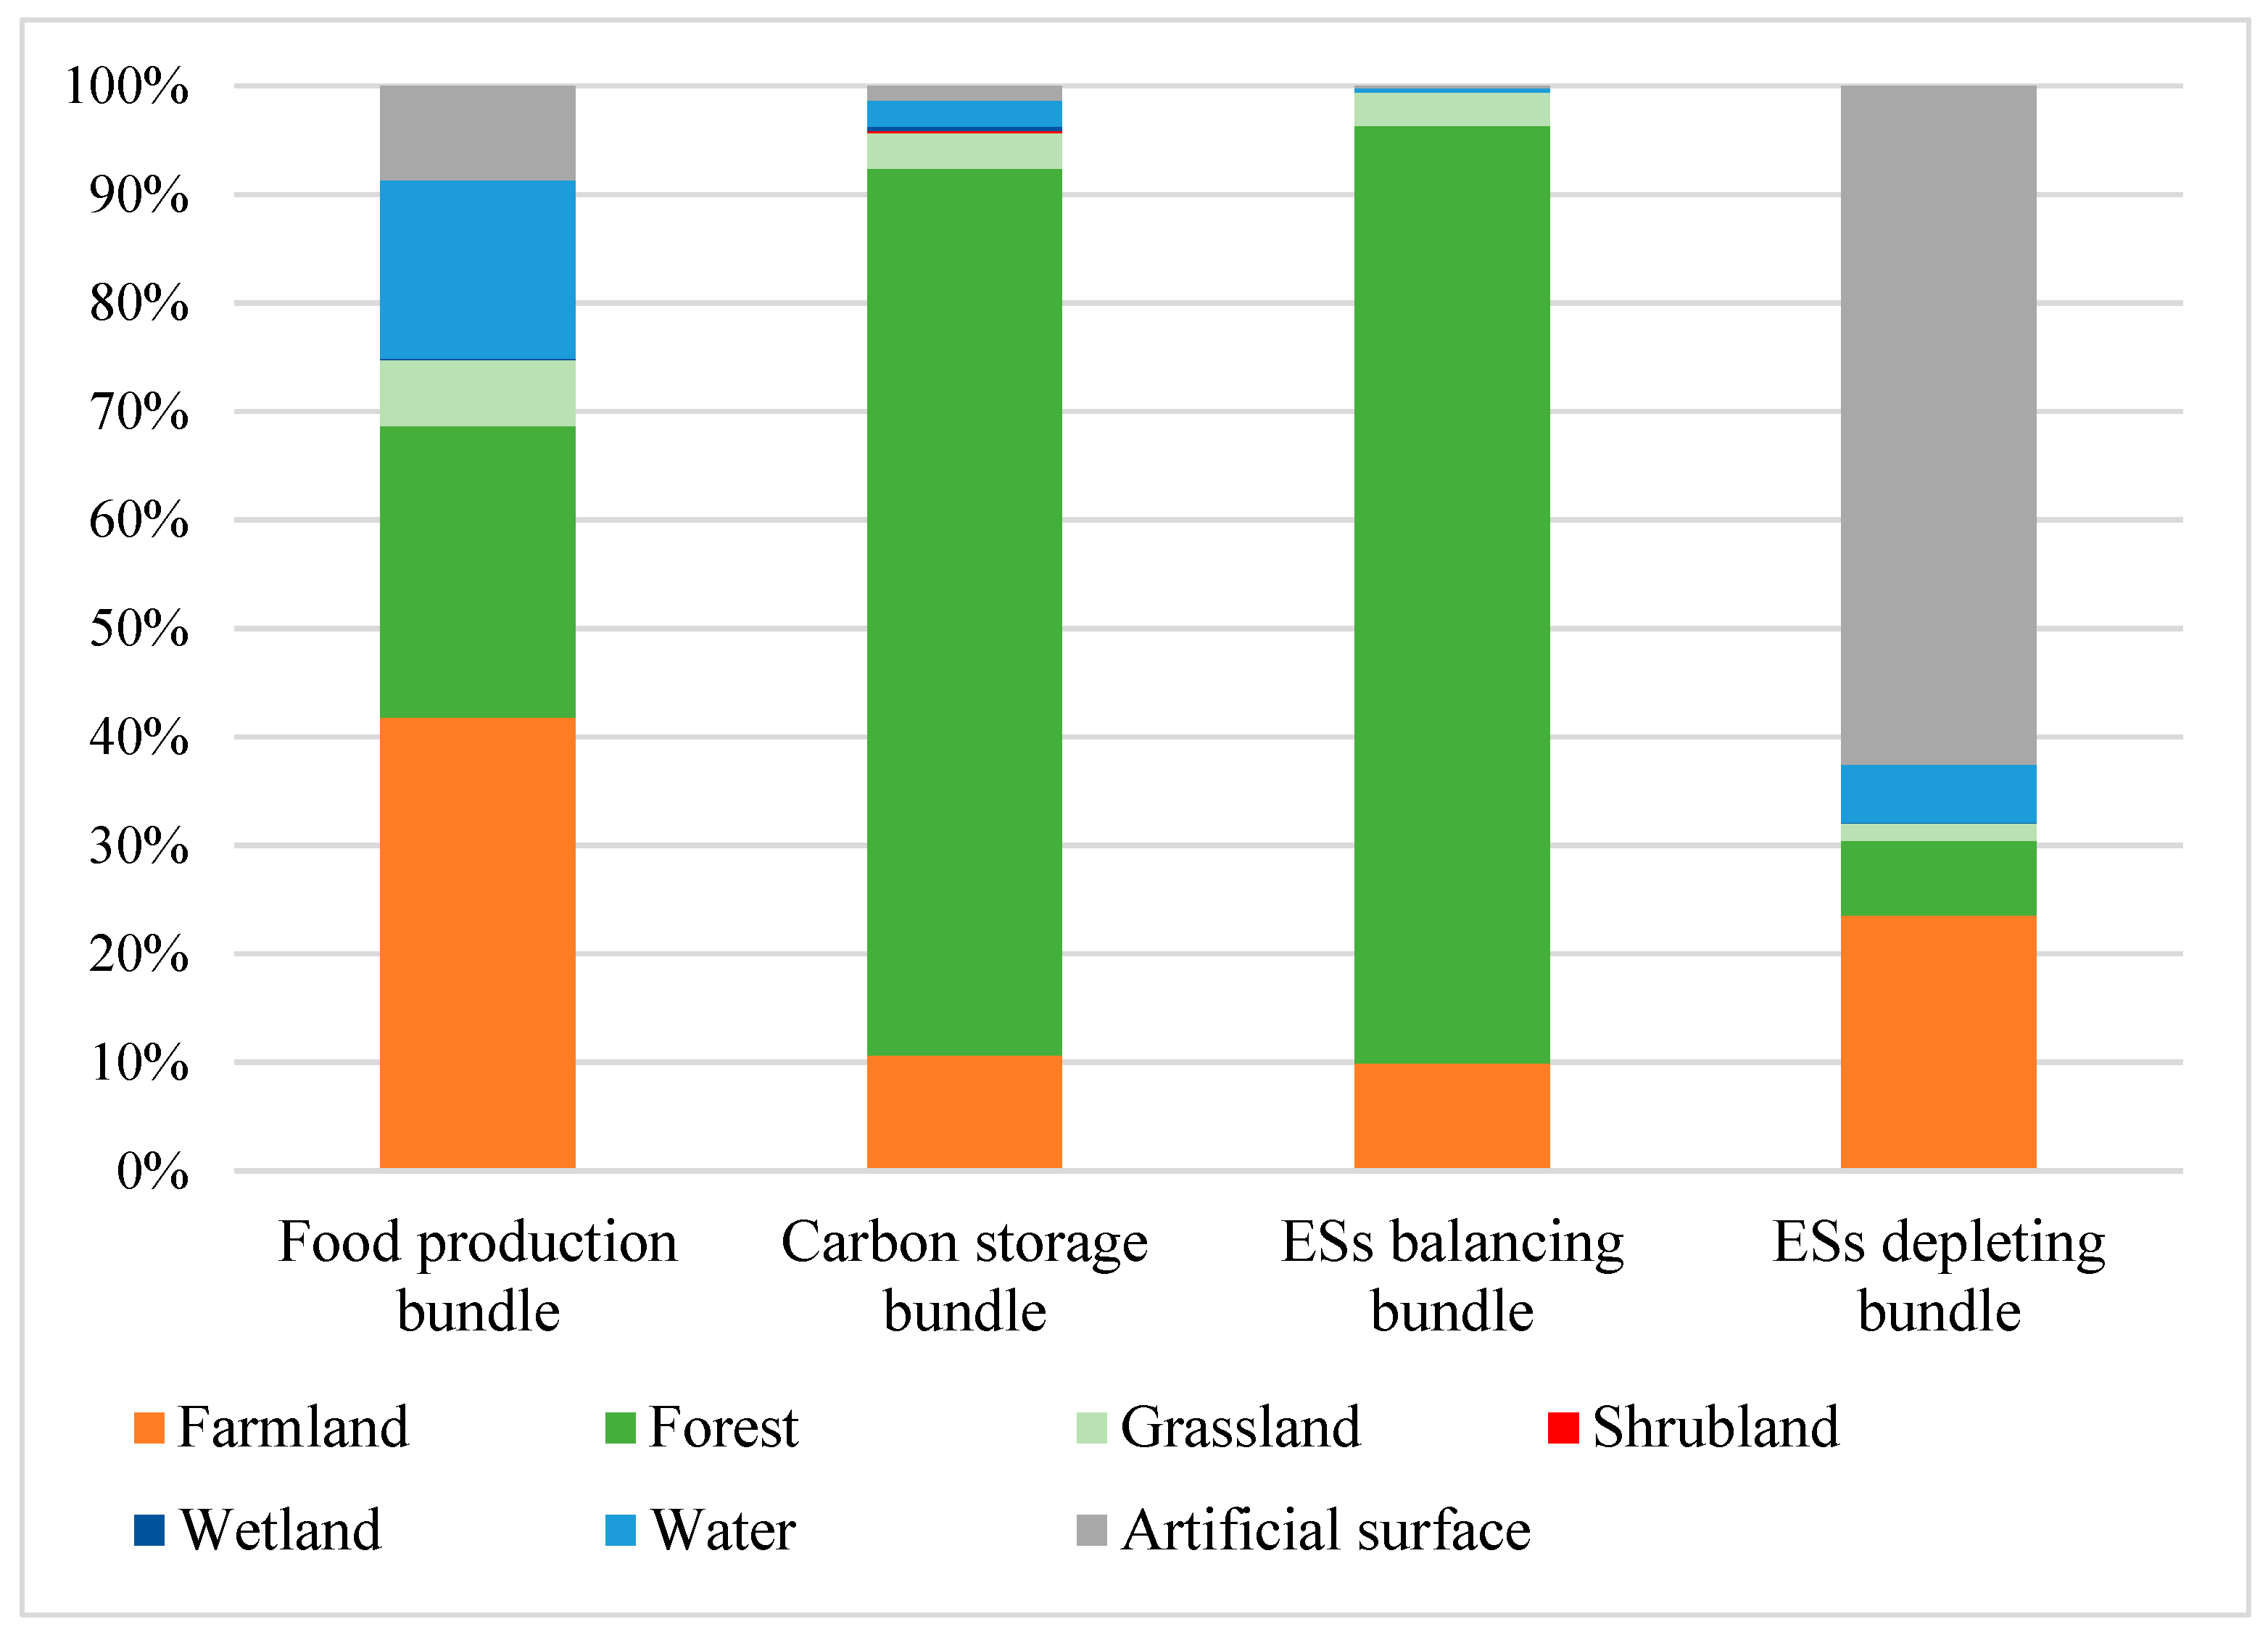
4.4. Supply Bundles of ESs

We used the SOM method to obtain four ES supply bundles (Figure 8). According to the leading ES supply types, they were named the food production bundle, the carbon storage bundle, the ESs balancing bundle, and the ESs depleting bundle, respectively. The proportion of land use types in each ES bundle was counted to explore the correspondence (Figure 9).
(1) Food production bundle: FD supply is prominent, and SC and WY supply are minimal. The dominant land type is farmland, mainly because Hangzhou has a subtropical monsoon climate with sufficient water and heat conditions. It is very suitable for rice, soybean, and other crops, and the agricultural productivity is high. Influenced by the hydrological environment and farming habits, it is mostly located in plains and river valleys with lower elevations. (2) Carbon storage bundle: CS and HQ supply are dominant, followed by SR, and other ESs are hardly visible. Among them, forest accounts for 81.7%, playing an important role in sequestering carbon, increasing sinks, and maintaining ecological balance. This bundle is mainly located in the central hilly area with high forest cover. (3) ESs balancing bundle: the four supply capacities of CS, HQ, SR, and WY are relatively balanced and have extensive synergistic relationships. Among them, forest land occupies a dominant position. This bundle is mainly located in Chun’an and the west side of Lin’an. Due to the high elevation of the location, complete and concentrated ecological patches, and scarce human activities, the ecosystem structure is stable, and the environmental quality is excellent. (4) ESs depleting bundle: All types of ESs are relatively small, and the large area of hard surface in the built-up land reduces the amount of rainwater infiltration and evapotranspiration, so the WY is relatively high. This bundle is concentrated in the core area of economic development in the northeast of Hangzhou. The diverse spatial distribution of ES bundles in Hangzhou implies the importance of developing differentiated ecological management strategies.

4.5. Zoning for Supply and Demand of ESs

In this study, the spatial matching map of ES supply–demand is superimposed on the results of the coordination degree to obtain six combinations. Combined with the strategic requirements of “building an ecological security pattern, protecting natural resources, and carrying out ecological restoration” proposed in the “Hangzhou Territorial Spatial Master Plan (2021–2035)”, the “14th Five-Year Plan for the Development of Nature Reserve System in Zhejiang Province”, the “Three-Year Action Plan for Wetland Protection in Hangzhou (2021–2023)”, and natural conditions and economic conditions of each county, six primary ecological management zones are designated. They are named ecological optimization zones, ecological restoration zones, ecological reconstruction zones, ecological improvement zones, ecological reserve zones, and ecological maintenance zones. Based on the two-level ES demand zoning, 19 secondary ecological management zones (I, II, III, IV) can be divided by artificially filtering grids that are smaller in size, lower in value, scattered in location, or located at the administrative boundaries (Figure 10, Table 9).

5. Discussion

5.1. Scale Effects of ES Supplies, Demands, and Relationships

Due to the multiple interactions of ecological and social effects with spatio-temporal flow properties [24], metacoupling (including telecoupling, pericoupling, and intracoupling) relationships among various ESs in different scales can lead to different spatial aggregation situations [60]. The data in this study came from different scales, and the resample tool in ArcGIS was used to standardize the scale, but this may affect the precision and results of this study.
Figure 3 reports that, at the county scale, the high-value and low-value zones show a faceted distribution with a stepped downward trend. At the grid scale, the low-value zones are banded and consistent with the direction of urban expansion. Due to the influence of the mean calculation method and the ecological remote coupling effect, the large scale will blur the details of the ecological spatial distribution of Hangzhou, mainly in the low-value nodes, while the grid scale is more likely to be affected by the geographical pattern and vegetation species.
Figure 4 reports that at the county scale, the high-value and low-value zones are in a continuous planar distribution. At the grid scale, the high-value zones are distributed in a combination of points and planes, and the low-value zones are distributed in strips along the Qiantang River, Fuchun River, Xin’an River, Qiandao Lakes, etc. Compared with ES supply, the gap is smaller. This is due to the spatial aggregation of population distribution and human activities.
Figure 7 reports that at the county scale, LL, LH, HL, and HH spaces account for 8.4%, 4.2%, 80.1%, and 7.3%, respectively. At the grid scale, LL, LH, HL, and HH spaces account for 12.8%, 28.6%, 52.4%, and 6.2%, respectively. The proportion of mismatched spaces decreased by 3.3%, which was caused by the fact that water and farmland with low ES supply and low human demand were neglected in the large-scale matching. However, the proportion of LH, a spatial type that poses the greatest threat to the enhancement of human well-being, rises sharply, indicating that the degree of spatial mismatch is more serious. For example, in Xiaoshan, from LL type to nearly 81.0% of the space is covered by LH type.

5.2. Impact of ES Supply–Demand Balance on Delineating Zones

Constructing city-scale ecological management zoning is crucial for efficiently solving meso-environmental problems and maintaining ecological security. Due to the variations in resource endowment and socio-economic conditions, ES spatial disparities are serious in Hangzhou. This causes environmental injustice problems among counties [61] and hinders regional sustainable development. Previous researchers have carried out ecological management zoning studies from the perspectives of ecological security patterns, ES function, ecological vulnerability, and ecological risk. However, ecosystem issues involve a dynamic game between human systems and ecosystems, and considering the supply of ESs alone will inevitably lead to the mistake of rigidly dividing ecological land use and social activity areas, departing from the values of ecological civilization.
This study incorporates supply and demand trade-offs into the ecological management zoning methodology. In terms of ES trade-offs, the ideal supply–demand state is not unique, and ecological management based on the supply–demand pattern does not pursue parity in the mathematical sense. For example, a supply deficit zone does not necessarily require massive enrichment of blue–green networks or containment of daily human activities. It emphasizes the discernment of ecology and development in the same dimension and the integration of urban realities to explore a local sustainable model. At the same time, trade-offs and synergies between multiple supplies of ESs need to be considered. For example, it is not desirable to convert farmland with a low supply of CS services into high-quality forest land. Therefore, this study introduced the concept of ES bundles to clarify the ES spatial management priority. Ultimately, based on the current regional pattern and the dominant types of ESs, zoning management strategies are formulated to ensure the long-term coordinated development of ecology and socio-economy in Hangzhou.

5.3. Governance Implications

Under the dual background of China’s ecological civilization construction and high-quality development, Hangzhou established the “Chun’an Special Ecological Functional Zone” and proposed improving the new pattern of protection and development of “One Core, Nine Stars, Three Rivers, and Green Wedge” in the Hangzhou Territorial Spatial Master Plan (2021–2035). It is not difficult to find that the primary ecological management zones in this study have a good correspondence with the above planning pattern. This study puts forward targeted strategies for different zones in terms of supply–demand adjustment strategies, ecological management strategies, and key implementation areas (Figure 11) as follows:
(1)
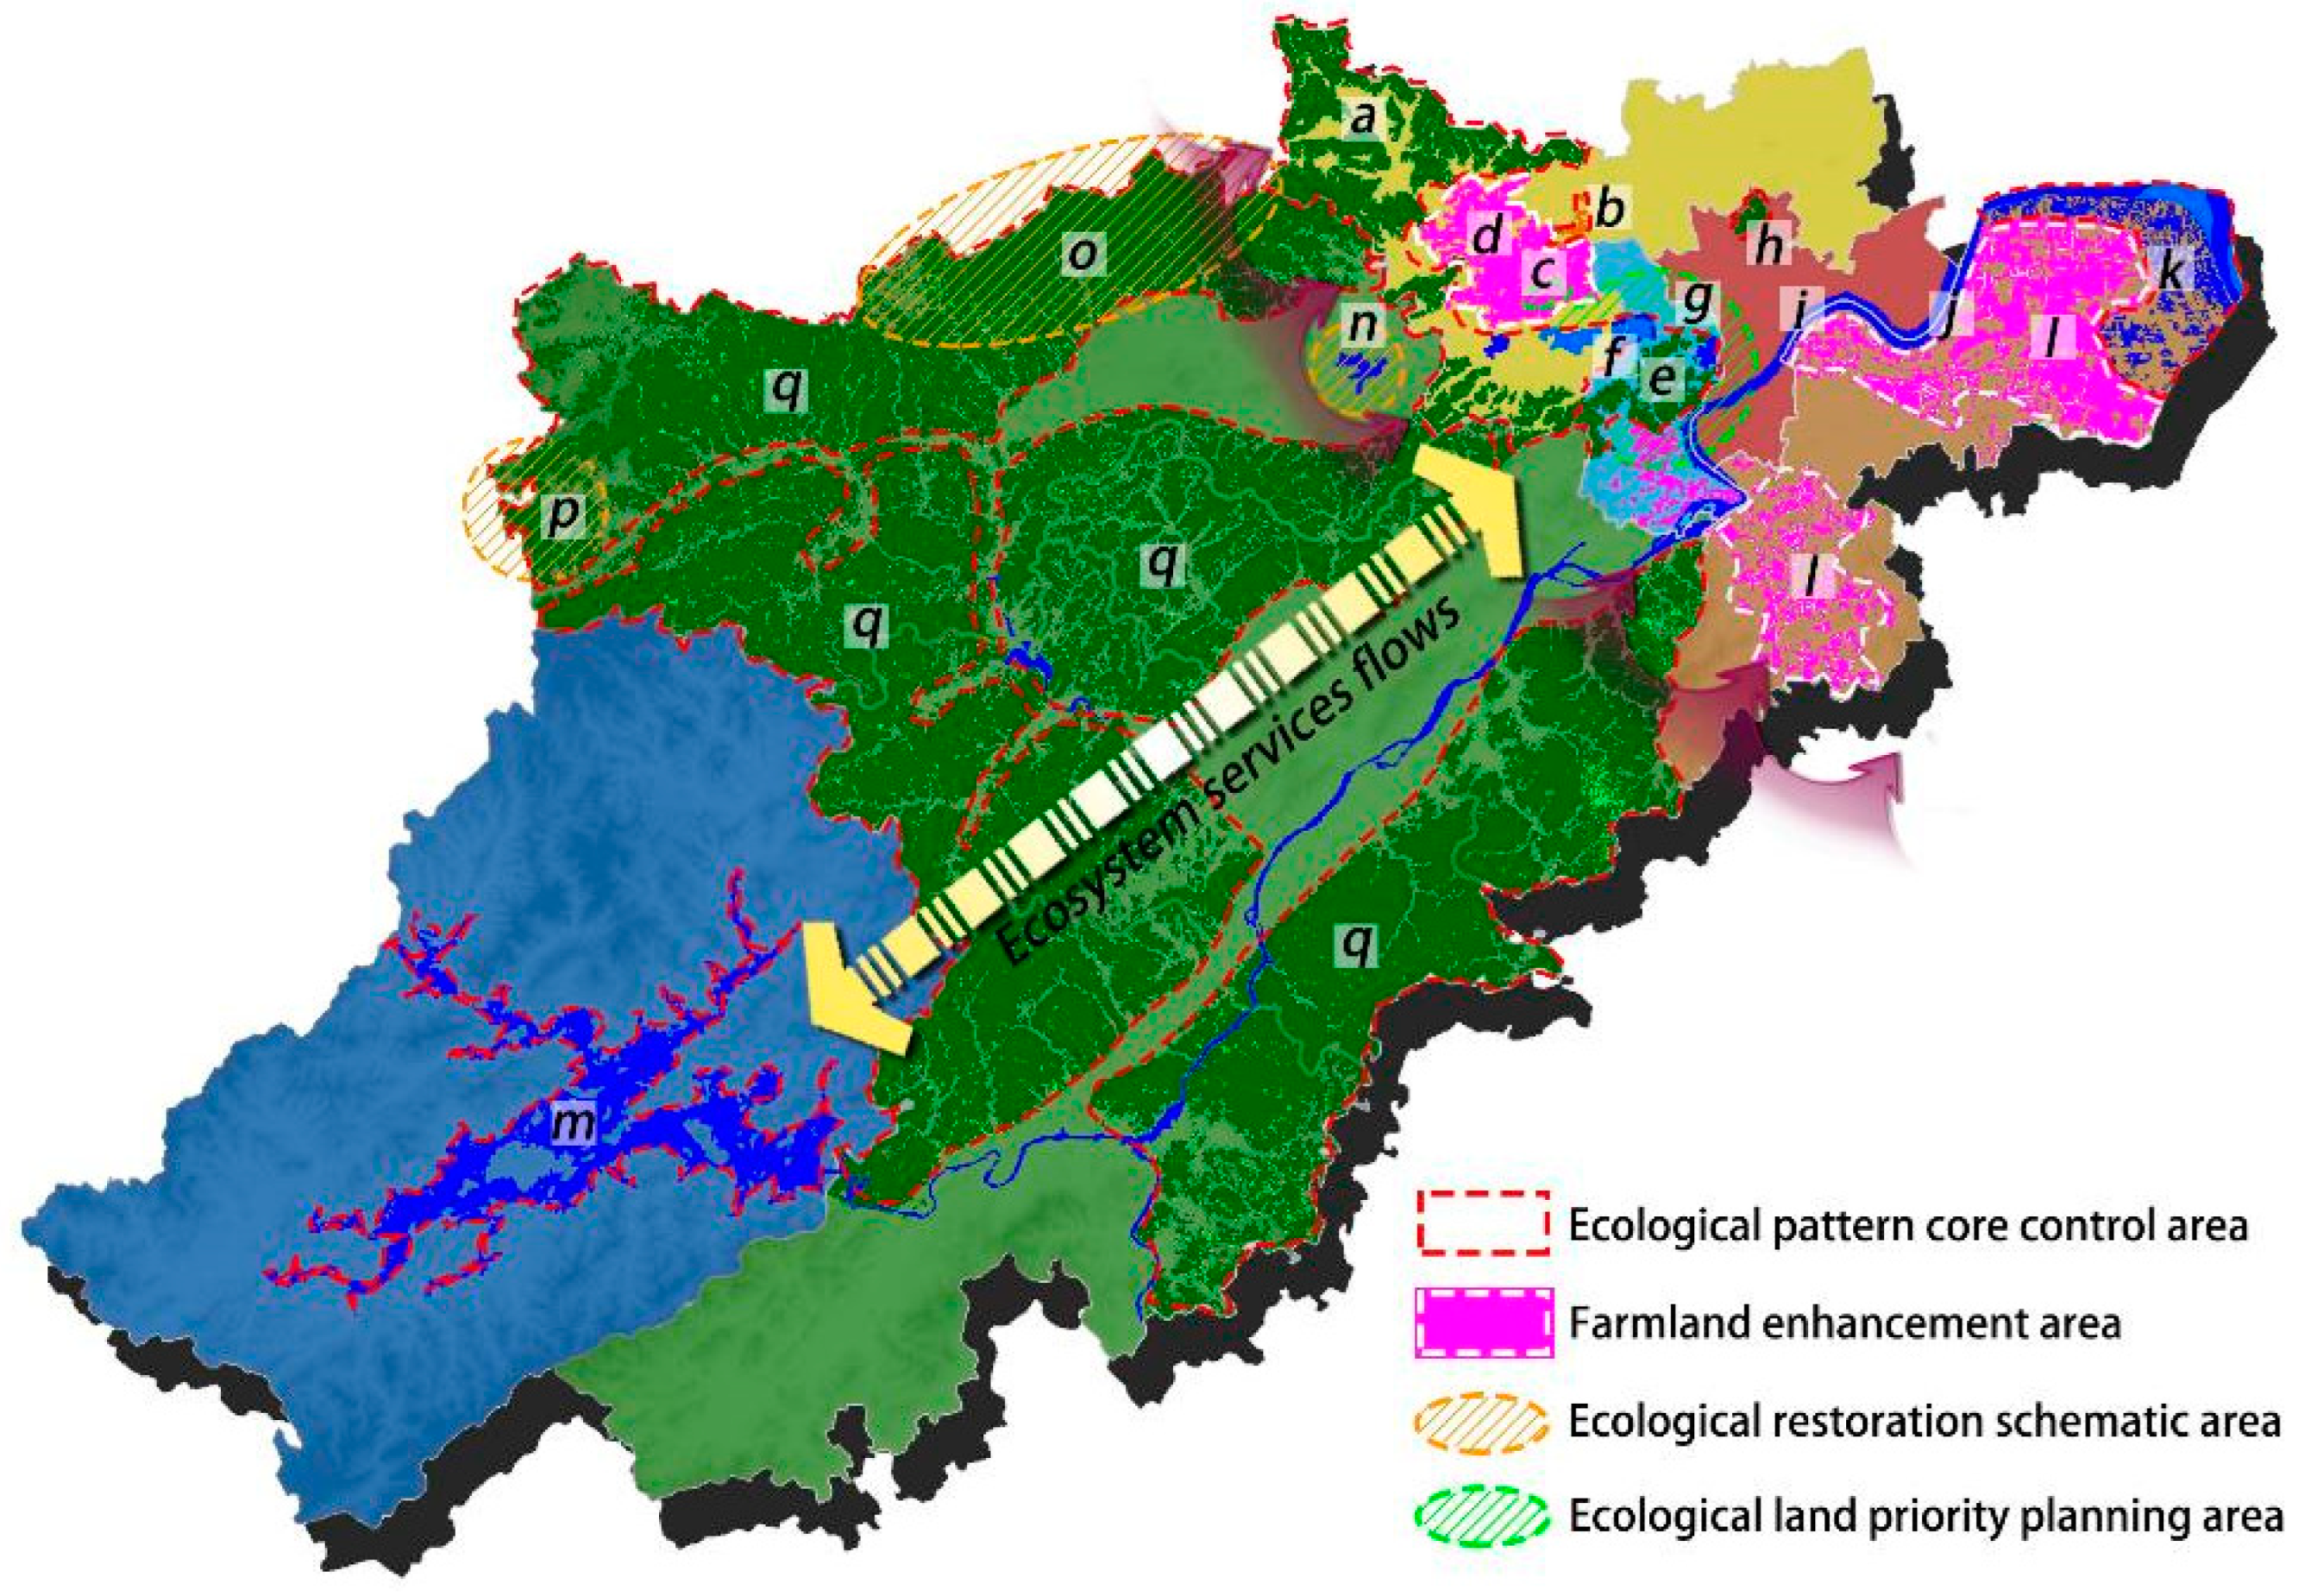
Ecological optimization zones (HH, moderate coordination): ES supply–demand is relatively balanced, focusing on the dynamic balance in the case of changes in the ES demand hierarchy and quality in the future [62,63]. Strictly protect the current ecological pattern (a); limit the boundary, quantity, and intensity of human activities; integrate cultural and eco-industries based on the historical heritage of Liangzhu (b); and moderately allocate ecological land in the vicinity of West Railway Station to cope with future demand (c). The focus falls on the agricultural sector in implementing the upgrading and transformation of existing farmland (d) and promoting the scale and concentration of farmland.
(2)
Ecological restoration zone (LH, basic coordination): Optimize the current ES supply–demand pattern, focusing on controlling the growth of demand and improving supply capacity. Strictly protect the current ecological pattern of “one mountain, one lake, and one wetland” (e); implement a comprehensive restoration project focusing on the promotion of biodiversity conservation displays in Xixi Wetland (f); delineate the construction boundary to limit land development and population growth; moderately increase the wedge-shaped ecological land around the ecological core of West Lake (g); and develop eco-tourism and the modern agricultural economy. The emphasis is placed on the protection of the waters, woodlands, and other habitats of the West Lake Scenic Area while stabilizing the amount of farmland.
(3)
Ecological reconstruction zones (LH, slightly inharmonious): Reconstruct the status quo of the ES supply–demand structure, decentralize the quantity of demand, focus on improving the quality of supply, and adjust the direction of ES flow. Strictly control land development and population growth and promote urban development intensively; implement ecological restoration projects, strengthen the protection of Banshan National Forest Park (h); increase investment in green infrastructure and promote the establishment of landscape corridors such as the Qiantang River (i); and improve accessibility to other ecological land within the city and guide the main demanders to move in multiple directions in using the services.
(4)
Ecological improvement sone (LL, basic coordination): Focus on improving the quantity and quality of ES supply. Implement ecological restoration projects to withstand flooding disasters (j); rely on parks to build places for ecological science popularization; and set aside enough ecological land for future development and improve the ecological attractiveness of the region. The focus falls on wetland protection (k) and farmland remediation (l).
(5)
Ecological reserve zones (HL, basic coordination): Protect the current ES supply–demand patterns, focusing on regional ecological integration and coordination and promoting the flow of regional ESs. Clarify the concept of ecological priority development, designate the whole area as an ecological protection area, and strengthen species conservation, soil conservation, and the ecological barrier role; orderly and efficient development with strict control of the number of new construction lands and behaviors, where some areas can carry out short-distance ecological migration projects; moderate development of ecological economy in non-core protected areas; and attract tourism consumption of residents in ES supply deficit areas. The focus falls on promoting the restoration of the water environment of Qiandao Lake (m) and the synergistic protection of multiple types of ESs in the whole area.
(6)
Ecological maintenance zone (HL, moderate coordination): Maintain the current ES supply–demand pattern, moderately increase the amount of demand, and focus on the flow of ESs among regions. Implement ecological projects to repair damaged ecological patterns; promote the forest conservation project in Qingshan Lake National Forest Park (n), the construction of digital management systems for Tianmu Mountain Nature Reserve (o), and strengthen the cultivation of famous mountain parks such as Qingliang Peak (p); delimit the development boundaries of towns and villages to prevent uncontrolled spatial growth, and encourage new residents to settle; and build ecological supply chain strips connecting the surroundings to form a benign interactive relationship. The focus falls on forest and grassland resource protection (q).

5.4. Limitations and Prospects

This study has the following limitations: Firstly, ecological processes and human activities are dynamic processes, and the supply and demand of ESs are always under long-term change. Considering the magnitude and availability of the data, this study is in a relatively static perspective, only measuring the distribution at fixed nodes, without considering the changes in the pattern and trade-off process in the time dimension. We will continue to simulate the ES supply–demand pattern for future climate scenarios to optimize the management zones in our following study. Secondly, the indicators chosen for ES demand evaluation ignore the differences among different human groups and the types of ESs corresponding to the hierarchies of demand. In future studies, public preference or potential demand can be incorporated into the evaluation framework. Thirdly, for the convenience of management, the city scale is taken as the study scope, and county units are selected as the primary zones. However, the ES supply is not restricted by administrative boundaries. The ecological functions and processes in Hangzhou are susceptible to surrounding regions, such as Ningbo and Huzhou, and even other provinces within the watershed or climate zone. Cross-regional and large-scale trade-offs between ES supply–demand will become a key direction for future ecological management. Lastly, this study was based on an ecological management perspective and focused on goal orientation, so we organized the work according to the logic of “primary ecological management zones at the county scale and secondary ecological management zones at the grid scale”, which is consistent with [29,54]. However, in some studies, small-scale analyses were performed before the large-scale analyses [64]. In future studies, researchers can choose a different order of scales depending on the purpose of the study.

6. Conclusions

Globally, the exploration of ecological management based on ESs is gradually emerging. However, most scholars focus on the natural ecosystem, and not many consider the relationship between supply–demand and scale dependency. This study couples ecosystem and socioeconomic systems and constructs a scientific and prospective multiscale ecological zoning management framework for “comprehensive supply–demand evaluation, ecological zoning delineation, and human well-being enhancement”. The main conclusions are as follows: ES supply in Hangzhou has significant spatial differentiation, which shows a planar pattern of “high in the southwest and low in the northeast”. ES demand is relatively concentrated, showing a trade-off relationship with supply. The average value of the supply–demand coordination index at the county scale is 0.59, which is at a moderate level. Compared with the county scale, the proportion of mismatched spaces at the grid scale decreased by 3.3%, but the proportion of the LH space type increased by 24.4%, so the severity rose. Four ES bundles were obtained through the SOM method to clarify the management priority. The distribution characteristics of the bundles were highly correlated with the hydrothermal conditions, vegetation types, and human construction activities. Hangzhou was divided into six primary ecological management zones, namely, ecological optimization zones, ecological restoration zones, ecological reconstruction zones, ecological improvement zones, ecological reserve zones, ecological maintenance zones, and 19 secondary ecological management zones.
Most of the cities in the Yangtze River Delta (YRD) region, represented by Hangzhou, are facing conflicts between ecological protection and socio-economic development. Therefore, the case study of Hangzhou has the following implications: (1) the multiscale ecological zoning management framework can be used to assess the matching and coordination degree of ES supply–demand at multiple situations and scales, so as to scientifically recognize the interaction between human beings and the land and (2) the ecological management zoning based on the balance of supply–demand and bundles couples ecosystems and human systems and helps to improve the effectiveness of policy formulation and promote harmonious coexistence between humans and nature.
Several issues in this study require further investigation. The pattern of ES supply–demand is the result of spatial games between ecosystems and human systems over a certain period and is not static. However, this study is conducted from a relatively static perspective, and in future research, the concept of time can be introduced to explore the dynamic process of pattern change and assist policy formulation. In addition, this study considered fewer indicator factors for ES demand, public willingness preferences, or potential needs that can be included in the evaluation framework in the future.

Author Contributions

Conceptualization, Y.L., X.D., S.Y., J.Z. and X.L.; data curation, X.D., S.Y. and H.J.; formal analysis, Y.L. and X.D.; funding acquisition, Y.L. and J.Z.; investigation, X.D. and S.Y.; methodology, X.D., S.Y. and B.Z.; project administration, Y.L., J.Z. and X.L.; resources, Y.L.; software, X.D., S.Y. and H.J.; supervision, Y.L., J.Z. and X.L.; validation, Y.L., X.D., B.Z. and X.L.; visualization, Y.L. and X.D.; writing—original draft, Y.L. and X.D.; writing—review and editing, X.D., S.Y. and B.Z. All authors have read and agreed to the published version of the manuscript.

Funding

This work was supported by the National Natural Science Foundation of China (Grant No. 51878593), the Center for Balance Architecture, Zhejiang University (Grant No. KH-20212946), and the Artificial Intelligence Key Technologies R & D Program of Hangzhou (2022AIZD0057).

Data Availability Statement

The original contributions presented in the study are included in the article, further inquiries can be directed to the corresponding author.

Conflicts of Interest

Yonghua Li was employed by Zhejiang University Architectural Design and Research Institute Co., Ltd. Junshen Zhang was employed by Zhejiang University Urban-Rural Planning & Design Institute Co., Ltd. The authors declare that the research was conducted in the absence of any commercial or financial relationships that could be construed as a potential conflict of interest.

References

  1. Costanza, R.; d’Arge, R.; De Groot, R.; Farber, S.; Grasso, M.; Hannon, B.; Limburg, K.; Naeem, S.; O’Neill, R.V.; Paruelo, J.; et al. The value of the world’s ecosystem services and natural capital. Nature 1997, 387, 253–260. [Google Scholar] [CrossRef]
  2. Daily, G.C. Nature’s Services: Societal Dependence on Natural Ecosystems; Island Press: Washington, DC, USA, 1997; pp. 1–49. [Google Scholar]
  3. De Groot, R.S.; Alkemade, R.; Braat, L.; Hein, L.; Willemen, L. Challenges in integrating the concept of ecosystem services and values in landscape planning, management and decision making. Ecol. Complex 2010, 7, 260–272. [Google Scholar] [CrossRef]
  4. Schröter, M.; Barton, D.N.; Remme, R.P.; Hein, L. Accounting for capacity and flow of ecosystem services: A conceptual model and a case study for Telemark, Norway. Ecol. Indic. 2014, 36, 539–551. [Google Scholar] [CrossRef]
  5. Zhao, Q.; Huang, G.; Ma, Y. The ecological environment conditions and construction of an ecological civilization in China. Acta Ecol. Sin. 2016, 36, 6328–6335. (In Chinese). Available online: https://kns.cnki.net/kcms2/article/abstract?v=3uoqIhG8C44YLTlOAiTRKibYlV5Vjs7ijP0rjQD-AVm8oHBO0FTadg6LjQjGLFAvehZMbx18A0CxRjLjyquPrd7jYfS1dpC9&uniplatform=NZKPT (accessed on 28 September 2023).
  6. Trisos, C.H.; Merow, C.; Pigot, A.L. The projected timing of abrupt ecological disruption from climate change. Nature 2020, 580, 496–501. [Google Scholar] [CrossRef] [PubMed]
  7. Urban, M.C. Accelerating extinction risk from climate change. Science 2015, 348, 571–573. [Google Scholar] [CrossRef] [PubMed]
  8. Peng, J.; Tian, L.; Liu, Y.; Zhao, M.; Hu, Y.; Wu, J. Ecosystem services response to urbanization in metropolitan areas: Thresholds identification. Sci. Total Environ. 2017, 607–608, 706–714. [Google Scholar] [CrossRef] [PubMed]
  9. Bai, Y.; Jiang, B.; Wang, M.; Li, H.; Alatalo, J.M.; Huang, S. New ecological redline policy (ERP) to secure ecosystem services in China. Land Use Policy 2016, 55, 348–351. [Google Scholar] [CrossRef]
  10. Folke, C.; Polasky, S.; Rockström, J.; Galaz, V.; Westley, F.; Lamont, M.; Scheffer, M.; Österblom, H.; Carpenter, S.R.; Chapin, F.S.; et al. Our future in the Anthropocene biosphere. Ambio 2021, 50, 834–869. [Google Scholar] [CrossRef] [PubMed]
  11. Chen, W.; Chi, G. Urbanization and ecosystem services: The multi-scale spatial spillover effects and spatial variations. Land Use Policy 2022, 114, 105964. [Google Scholar] [CrossRef]
  12. Yue, W.; Hou, L.; Xia, H.; Wei, J.; Lu, Y. Territorially ecological restoration zoning and optimization strategy in Guyuan City of Ningxia, China: Based on the balance of ecosystem service supply and demand. Chin. J. Appl. Ecol. 2022, 33, 149–158. [Google Scholar] [CrossRef]
  13. Sun, C.; Wang, Z.; Li, J.; Li, C.; Wang, C. Ecological protection and restoration zoning of territorial space in the Guangdong-Hong Kong-Macao Greater Bay Area based on multidimensional ecosystem features. Acta Ecol. Sin. 2023, 43, 2061–2073. (In Chinese). Available online: https://kns.cnki.net/kcms2/article/abstract?v=3uoqIhG8C44YLTlOAiTRKibYlV5Vjs7ioT0BO4yQ4m_mOgeS2ml3UD46LNBMcs31X_qcn09xGLBoBXAFHS7x_DVKQFz83Fi2&uniplatform=NZKPT (accessed on 28 September 2023).
  14. Omernik, J.M. Perspectives on the Nature and Definition of Ecological Regions. Environ. Manag. 2004, 34, S27–S38. [Google Scholar] [CrossRef]
  15. Xu, Z.; Peng, J.; Dong, J.; Liu, Y.; Liu, Q.; Lyu, D.; Qiao, R.; Zhang, Z. Spatial correlation between the changes of ecosystem service supply and demand: An ecological zoning approach. Landsc. Urban Plan 2022, 217, 104258. [Google Scholar] [CrossRef]
  16. Abell, R.; Thieme, M.L.; Revenga, C.; Bryer, M.; Kottelat, M.; Bogutskaya, N.; Coad, B.; Mandrak, N.; Balderas, S.C.; Bussing, W.; et al. Freshwater Ecoregions of the World: A New Map of Biogeographic Units for Freshwater Biodiversity Conservation. Bioscience 2008, 58, 403–414. [Google Scholar] [CrossRef]
  17. Zogaris, S.; Economou, A.N.; Dimopoulos, P. Ecoregions in the Southern Bal-kans: Should Their Boundaries Be Revised? Environ. Manag. 2009, 43, 682–697. [Google Scholar] [CrossRef] [PubMed]
  18. Guan, Q.; Hao, J.; Xu, Y.; Ren, G.; Kang, L. Zoning of agroecological management based on the relationship between supply and demand of ecosystem services. Resour. Sci. 2019, 41, 1359–1373. (In Chinese). Available online: https://kns.cnki.net/kcms2/article/abstract?v=3uoqIhG8C44YLTlOAiTRKibYlV5Vjs7iLik5jEcCI09uHa3oBxtWoFE9d97XnHnmK_AzEEZiIqwqulVQUZis3gQvEMXnjTnA&uniplatform=NZKPT (accessed on 4 April 2023).
  19. Dai, X.; Li, Z.; Lin, S.; Xu, W. Assessment and zoning of eco-environmental sensitivity for a typical developing province in China. Stoch. Environ. Res. Risk Assess. 2012, 26, 1095–1107. [Google Scholar] [CrossRef]
  20. Zhang, X.; Wang, Z.; Lin, J. GIS Based Measurement and Regulatory Zoning of Urban Ecological Vulnerability. Sustainability 2015, 7, 9924–9942. [Google Scholar] [CrossRef]
  21. Ding, M.; Liu, W.; Xiao, L.; Zhong, F.; Lu, N.; Zhang, J.; Zhang, Z.; Xu, X.; Wang, K. Construction and optimization strategy of ecological security pattern in a rapidly urbanizing region: A case study in central-south China. Ecol. Indic. 2022, 136, 108604. [Google Scholar] [CrossRef]
  22. Li, Q.; Zhou, Y.; Yi, S. An integrated approach to constructing ecological security patterns and identifying ecological restoration and protection areas: A case study of Jingmen, China. Ecol. Indic. 2022, 137, 108723. [Google Scholar] [CrossRef]
  23. Peng, J.; Pan, Y.; Liu, Y.; Zhao, H.; Wang, Y. Linking ecological degradation risk to identify ecological security patterns in a rapidly urbanizing landscape. Habitat Int. 2018, 71, 110–124. [Google Scholar] [CrossRef]
  24. Fu, B. Several Key Points in Territorial Ecological Restoration. Bull. Chin. Acad. Sci. 2021, 36, 64–69. [Google Scholar] [CrossRef]
  25. Leslie, H.M.; Basurto, X.; Nenadovic, M.; Sievanen, L.; Cavanaugh, K.C.; Cota-Nieto, J.J.; Erisman, B.E.; Finkbeiner, E.; Hinojosa-Arango, G.; Moreno-Báez, M.; et al. Operationalizing the social-ecological systems framework to assess sustainability. Proc. Natl. Acad. Sci. USA 2015, 112, 5979–5984. [Google Scholar] [CrossRef] [PubMed]
  26. Kroll, F.; Müller, F.; Haase, D.; Fohrer, N. Rural–urban gradient analysis of ecosystem services supply and demand dynamics. Land Use Policy 2012, 29, 521–535. [Google Scholar] [CrossRef]
  27. Martín-López, B.; Iniesta-Arandia, I.; García-Llorente, M.; Palomo, I.; Casado-Arzuaga, I.; Amo, D.G.D.; Gómez-Baggethun, E.; Oteros-Rozas, E.; Palacios-Agundez, I.; Willaarts, B.; et al. Uncovering Ecosystem Service Bundles through Social Preferences. PLoS ONE 2012, 7, e38970. [Google Scholar] [CrossRef] [PubMed]
  28. Yuan, Y.; Bai, Z.; Zhang, J.; Huang, Y. Investigating the trade-offs between the supply and demand for ecosystem services for regional spatial management. J. Environ. Manag. 2023, 325, 116591. [Google Scholar] [CrossRef]
  29. Zeng, J.; Cui, X.; Chen, W.; Yao, X. Ecological management zoning based on the supply-demand relationship of ecosystem services in China. Appl. Geogr. 2023, 155, 102959. [Google Scholar] [CrossRef]
  30. Wolff, S.; Schulp, C.J.E.; Verburg, P.H. Mapping ecosystem services demand: A review of current research and future perspectives. Ecol. Indic. 2015, 55, 159–171. [Google Scholar] [CrossRef]
  31. Zhu, Y.; Hou, Z.; Xu, C.; Gong, J. Ecological risk identification and management based on ecosystem service supply and demand relationship in the Bailongjiang River Watershed of Gansu Province. Sci. Geogr. Sin. 2023, 43, 423–433. (In Chinese). Available online: https://kns.cnki.net/kcms2/article/abstract?v=S5uBaE2M3OdbTXQP-0YAdcEmrODDAban9fMx6RVDBRsSuCHfO2nEQPVZQkoq0liRfSZx7wfaKOYHD8J6ALP_E_CnqakxpTfTQXCiErxcTEtZa5X_tO5ShrUDw_i9Bvq5JVbi6Wb8pFdGYbONEgQtMg==&uniplatform=NZKPT&language=CHS (accessed on 14 April 2023).
  32. Yan, F.; Shangguan, W.; Zhang, J.; Hu, B. Depth-to-bedrock map of China at a spatial resolution of 100 meters. Sci. Data 2020, 7, 2. [Google Scholar] [CrossRef]
  33. Millennium Ecosystem Assessment. Ecosystems and Human Well-Being: Synthesis; Island Press: Washington, DC, USA, 2005. [Google Scholar]
  34. Milcu, A.I.; Hanspach, J.; Abson, D.; Fischer, J. Cultural Ecosystem Services: A Literature Review and Prospects for Future Research. Ecol. Soc. 2013, 18, art44. [Google Scholar] [CrossRef]
  35. Hall, L.S.; Krausman, P.R.; Morrison, M.L. The Habitat Concept and a Plea for Standard Terminology. Wildl. Soc. Bull. 1997, 25, 173–182. Available online: https://www.jstor.org/stable/3783301?seq=5 (accessed on 28 September 2023).
  36. Maes, J.; Paracchini, M.L.; Zulian, G.; Dunbar, M.B.; Alkemade, R. Synergies and trade-offs between ecosystem service supply, biodiversity, and habitat conservation status in Europe. Biol. Conserv. 2012, 155, 1–12. [Google Scholar] [CrossRef]
  37. Sharp, R.; Tallis, H.T.; Ricketts, T.; Guerry, A.D.; Wood, S.A.; Chaplin-Kramer, R.; Nelson, E.; Ennaanay, D.; Wolny, S.; Olwero, N.; et al. InVEST 3.12.0 User’s Guide; Collaborative Publication by The Natural Capital Project, Stanford University, the University of Minnesota, The Nature Conservancy, and the World Wildlife Fund; Stanford University: Stanford, CA, USA, 2018; Available online: https://naturalcapitalproject.stanford.edu/software/invest (accessed on 12 April 2023).
  38. Liu, Z.; Tang, L.; Qiu, Q.; Xiao, L.; Xu, T.; Yang, L. Temporal and spatial changes in habitat quality based on land-use change in Fujian Province. Acta Ecol. Sin. 2017, 37, 4538–4548. (In Chinese). Available online: https://kns.cnki.net/kcms2/article/abstract?v=3uoqIhG8C44YLTlOAiTRKibYlV5Vjs7iAEhECQAQ9aTiC5BjCgn0Rvm67coTwvbwUuGQj8tdtYzjw3b4q71ixQ3lDKjkhBnT&uniplatform=NZKPT (accessed on 10 September 2023).
  39. Wu, J.; Cao, Q.; Shi, S.; Huang, X.; Lu, Z. Spatio-temporal variability of habitat quality in Beijing-Tianjin-Hebei Area based on land use change. Chin. J. Appl. Ecol. 2015, 26, 3457–3466. [Google Scholar] [CrossRef]
  40. Wu, J.; Mao, J.; Lin, Q.; Li, J. Urban Growth Boundary Based on the Evaluation of Habitat Quality: Taking the Yangtze River Delta as an Example. Sci. Geogr. Sin. 2017, 37, 28–36. [Google Scholar] [CrossRef]
  41. Yue, W.; Xia, H.; Wu, T.; Xiong, J.; Zhong, P.; Chen, Y. Spatio-temporal evolution of habitat quality and ecological red line assessment in Zhejiang Province. Acta Ecol. Sin. 2022, 42, 6406–6417. (In Chinese). Available online: https://kns.cnki.net/kcms2/article/abstract?v=3uoqIhG8C44YLTlOAiTRKibYlV5Vjs7iJTKGjg9uTdeTsOI_ra5_XfSNy__BMCty7grNasRB4Z8wqaRBN30m0X85oSZCl7ES&uniplatform=NZKPT (accessed on 28 September 2023).
  42. Zhu, C.; Zhang, X.; Zhou, M.; He, S.; Gan, M.; Yang, L.; Wang, K. Impacts of urbanization and landscape pattern on habitat quality using OLS and GWR models in Hangzhou, China. Ecol. Indic. 2020, 117, 106654. [Google Scholar] [CrossRef]
  43. Wall, D.H.; Six, J. Give soils their due. Science 2015, 347, 695. [Google Scholar] [CrossRef]
  44. Zhao, G.; Mu, X.; Wen, Z.; Wang, F.; Gao, P. Soil Erosion, Conservation, and Eco-Environment Changes in the Loess Plateau of China. Land Degrad. Dev. 2013, 24, 499–510. [Google Scholar] [CrossRef]
  45. Li, T.; Liu, K.; Hu, S.; Bai, Y. Soil erosion and ecological benefits evaluation of qinling mountains based on the invest model. Resour. Environ. Yangtze Basin 2014, 23, 1242–1250. (In Chinese). Available online: https://kns.cnki.net/kcms2/article/abstract?v=3uoqIhG8C44YLTlOAiTRKgchrJ08w1e7M8Tu7YZds88UZ7kpRwyi_g2edE5vh_oCjqAXBifN_lPRbOhQxVhrhxYjvvWJcplU&uniplatform=NZKPT (accessed on 28 September 2023).
  46. Hu, S.; Cao, M.; Liu, Q.; Zhang, T.; Qiu, H.; Liu, W.; Song, J. Comparative study on the soil conservation function of InVEST model under different perspectives. Geogr. Res. 2014, 33, 2393–2406. (In Chinese). Available online: https://kns.cnki.net/kcms2/article/abstract?v=3uoqIhG8C44YLTlOAiTRKibYlV5Vjs7ir5D84hng_y4D11vwp0rrtUZ1K39_CjzlnPHwPdRecW32J1LfjXFqlejeIi5-1Mbm&uniplatform=NZKPT (accessed on 28 September 2023).
  47. Biederman, L.A.; Harpole, W.S. Biochar and its effects on plant productivity and nutrient cycling: A meta-analysis. GCB Bioenergy 2013, 5, 202–214. [Google Scholar] [CrossRef]
  48. Li, Y.; Jiang, H.; Zhang, B.; Yao, S.; Gao, X.; Zhang, J.; Hua, C. Comparative evaluation of multi-scale spatiotemporal variability and drivers of carbon storage: An empirical study from 369 cities, China. Ecol. Indic. 2023, 154, 110568. [Google Scholar] [CrossRef]
  49. Li, Y.; Yao, S.; Jiang, H.; Wang, H.; Ran, Q.; Gao, X.; Ding, X.; Ge, D. Spatial-Temporal Evolution and Prediction of Carbon Storage: An Integrated Framework Based on the MOP–PLUS–InVEST Model and an Applied Case Study in Hangzhou, East China. Land 2022, 11, 2213. [Google Scholar] [CrossRef]
  50. Chuai, X.; Huang, X.; Lai, L.; Wang, W.; Peng, J.; Zhao, R. Land use structure optimization based on carbon storage in several regional terrestrial ecosystems across China. Environ. Sci. Policy 2013, 25, 50–61. [Google Scholar] [CrossRef]
  51. Xu, C.; Ren, Y.; Kong, F. Impacts and prediction of land use change on ecosystem carbon sequestration in Zhejiang Province, China. Chin. J. Appl. Ecol. 2023, 34, 1610–1620. [Google Scholar] [CrossRef]
  52. Jia, Q.; Jiao, L.; Lian, X.; Wang, W. Linking supply-demand balance of ecosystem services to identify ecological security patterns in urban agglomerations. Sustain. Cities Soc. 2023, 92, 104497. [Google Scholar] [CrossRef]
  53. Yang, J.; Xie, B.; Zhang, D. Spatio-temporal variation of water yield and its response to precipitation and land use change in the Yellow River Basin based on InVEST model. Chin. J. Appl. Ecol. 2020, 31, 2731–2739. [Google Scholar] [CrossRef]
  54. Zhou, L.; Zhang, H.; Bi, G.; Su, K.; Wang, L.; Chen, H.; Yang, Q. Multiscale perspective research on the evolution characteristics of the ecosystem services supply-demand relationship in the chongqing section of the three gorges reservoir area. Ecol. Indic. 2022, 142, 109227. [Google Scholar] [CrossRef]
  55. Zhai, T.; Wang, J.; Jin, Z.; Qi, Y.; Fang, Y.; Liu, J. Did improvements of ecosystem services supply-demand imbalance change environmental spatial injustices? Ecol. Indic. 2020, 111, 106068. [Google Scholar] [CrossRef]
  56. Gou, M.; Li, L.; Ouyang, S.; Wang, N.; La, L.; Liu, C.; Xiao, W. Identifying and analyzing ecosystem service bundles and their socioecological drivers in the Three Gorges Reservoir Area. J. Clean. Prod. 2021, 307, 127208. [Google Scholar] [CrossRef]
  57. Raudsepp-Hearne, C.; Peterson, G.D.; Bennett, E.M. Ecosystem service bundles for analyzing tradeoffs in diverse landscapes. Proc. Natl. Acad. Sci. USA 2010, 107, 5242–5247. [Google Scholar] [CrossRef]
  58. Huang, F.; Zuo, L.; Gao, J.; Jiang, Y.; Du, F.; Zhang, Y. Exploring the driving factors of trade-offs and synergies among ecological functional zones based on ecosystem service bundles. Ecol. Indic. 2023, 146, 109827. [Google Scholar] [CrossRef]
  59. Xia, H.; Yuan, S.; Prishchepov, A.V. Spatial-temporal heterogeneity of ecosystem service interactions and their social-ecological drivers: Implications for spatial planning and management. Resour. Conserv. Recycl. 2023, 189, 106767. [Google Scholar] [CrossRef]
  60. Liu, J. Integration across a metacoupled world. Ecol. Soc. 2017, 22, art29. [Google Scholar] [CrossRef]
  61. Wolch, J.R.; Byrne, J.; Newell, J.P. Urban green space, public health, and environmental justice: The challenge of making cities ‘just green enough’. Landsc. Urban Plan. 2014, 125, 234–244. [Google Scholar] [CrossRef]
  62. Qi, R.; Yang, H.; Wang, S.; Xie, Q.; Wang, Y. Study on Evaluation and Planning of Urban Parks Based on Baidu POI Data. Chin. Landsc. Archit. 2018, 34, 32–37. (In Chinese). Available online: https://kns.cnki.net/kcms2/article/abstract?v=3uoqIhG8C44YLTlOAiTRKibYlV5Vjs7i0-kJR0HYBJ80QN9L51zrP8o8Ll5p2MDLNuRXt1mL5YZqoSYu9mvQTOCBRXnISbMG&uniplatform=NZKPT (accessed on 29 September 2023).
  63. Hou, W.; Hu, T.; Yang, L.; Liu, X.; Zheng, X.; Pan, H.; Zhang, X.; Xiao, S.; Deng, S. Matching ecosystem services supply and demand in China’s urban agglomerations for multiple-scale management. J. Clean. Prod. 2023, 420, 138351. [Google Scholar] [CrossRef]
  64. Wang, L.-J.; Gong, J.-W.; Ma, S.; Wu, S.; Zhang, X.; Jiang, J. Ecosystem service supply–demand and socioecological drivers at different spatial scales in Zhejiang Province, China. Ecol. Indic. 2022, 140, 109058. [Google Scholar] [CrossRef]
Figure 1. Situation of Hangzhou City. (a) Geographical location; (b) digital elevation model (DEM); and (c) land use type.
Land 13 00360 g001
Figure 2. Research framework.
Land 13 00360 g002
Figure 3. Spatial patterns of ES supply in Hangzhou.
Land 13 00360 g003
Figure 4. Spatial pattern of ES demand in Hangzhou.
Land 13 00360 g004
Figure 5. Quadrant and spatial distribution of ES supply–demand at the county scale.
Land 13 00360 g005
Figure 6. Coordination degree of ES supply–demand at the county scale.
Land 13 00360 g006
Figure 7. Quadrant and spatial distribution of ES supply and demand at the grid scale. (a) Quadrant of ES supply–demand; (b) spatial distribution of ES supply–demand in 2000 m; and (c) critical nodes.
Land 13 00360 g007
Figure 8. ES supply bundles of Hangzhou. (a) The ratio of ES supply and (b) the spatial distribution of ES supply bundles.
Land 13 00360 g008
Figure 9. The ratio of LULC in different bundles.
Land 13 00360 g009
Figure 10. Ecological management zones in Hangzhou.
Land 13 00360 g010
Figure 11. Schematic diagram of the ecological management strategy.
Land 13 00360 g011
Table 1. Data information and source.
CategoryDataYearResolutionSource
Raster dataLand cover data202030 mhttp://www.globallandcover.com/ (accessed on 10 October 2022)
POP density 20191 kmhttp://www.resdc.cn/ (accessed on 12 October 2022)
GDP density 20191 kmhttp://www.resdc.cn/ (accessed on 12 October 2022)
Average annual precipitation (PRE)2001–20201 kmhttp://www.geodata.cn/ (accessed on 2 April 2023)
Potential evapotranspiration (PET)2001–20201 kmhttp://www.geodata.cn/ (accessed on 2 April 2023)
Pan-TPE soil map based on Harmonized World Soil Database V1.2-1 kmhttps://data.tpdc.ac.cn/ (accessed on 2 April 2023)
Digital elevation model (DEM)202030 mhttps://www.gscloud.cn/ (accessed on 2 April 2023)
Depth-to-bedrock20201 km[32]
Vector dataAdministrative boundaries2021-https://www.webmap.cn/ (accessed on 25 March 2023)
Distance to main roads2020-https://www.openstreetmap.org
http://www.resdc.cn/ (accessed on 25 March 2023)
Distance to minor roads2020-https://www.openstreetmap.org
http://www.resdc.cn/ (accessed on 25 March 2023)
Distance to railroad2020-https://www.openstreetmap.org
http://www.resdc.cn/ (accessed on 25 March 2023)
Distance to highway2020-https://www.openstreetmap.org
http://www.resdc.cn/ (accessed on 25 March 2023)
Watershed spatial boundary-30 arcsecondhttps://www.hydrosheds.org/ (accessed on 17 April 2023)
Statistical dataEconomic output data2020 https://www.hangzhou.gov.cn/ (accessed on 18 April 2023)
Table 2. Threat factors and their stress intensity in Hangzhou.
ThreatMaximum Distance of Influence (km)WeightDecay TypeReference
Artificial surface6.00.8exponential[38,39,40,41,42]
Farmland1.00.4linear
Main roads5.00.7linear
Minor roads2.00.5linear
Highways4.00.6linear
Railroads4.00.6linear
Table 3. Sensitivity of land use type to habitat threat factors in Hangzhou.
Land Use TypeHabitatArtificial SurfaceFarmlandMain RoadsMinor RoadsHighwaysRailroadsReference
Farmland0.40.70.00.60.50.50.6[38,39,40,41,42]
Forest0.90.90.70.80.70.80.8
Grassland0.60.90.60.80.70.70.8
Shrubland0.80.90.60.80.70.70.8
Wetland0.80.80.50.60.50.70.7
Water0.70.70.40.50.40.60.6
Artificial surface0.00.00.00.00.00.00.0
Table 4. Soil conservation data in Hangzhou (t/ hm2).
Land Use TypeCrop Management FactorErosion Control Practice FactorReference
Farmland0.200.25[45,46]
Forest0.051.00
Grassland0.071.00
Shrubland0.061.00
Wetland0.000.00
Water0.000.00
Artificial surface0.921.00
Table 5. Carbon density in Hangzhou (t/hm2).
Land Use Type C x _ a b o v e C x _ b e l o w C x _ s o i l C x _ d e a d Reference
Farmland18.912.585.52.4[48,49,50,51]
Forest28.78.2125.83.4
Grassland16.419.8108.22.9
Shrubland8.11.691.73.5
Wetland7.424.3247.81.2
Water0.10.064.00.0
Artificial surface0.80.152.60.0
Table 6. Biophysical parameters of water yield in Hangzhou.
Land Use TypeRoot Depth (mm)Crop CoefficientVegetated or NotReference
Farmland22000.751[53]
Forest52000.981
Grassland24000.801
Shrubland52000.951
Wetland1001.000
Water1001.000
Artificial surface1000.260
Table 7. The gross output values of agriculture, forestry, animal husbandry, and fishery in Hangzhou 2020 (million RMB /km2).
Gross Output Value per Unit Area, E S x , s f (Million Yuan/km2)AgricultureForestryAnimal HusbandryFisheries
Main urban area1004.87149.715014.181106.99
Tonglu769.8441.07938.44435.95
Chun’an653.5724.27203.1153.87
Jiande794.3022.731443.66377.21
Fuyang1158.00113.261476.65772.14
Lin’an678.6791.791015.97304.16
Hangzhou City780.5355.10984.73443.70
Notes: The main urban areas include Shangcheng, Xiacheng, Binjiang, Gongshu, Xihu, Jianggan, Xiaoshan, and Yuhang. Due to the adjustment of Hangzhou’s administrative division in 2021, some data are missing. Considering that the gap among the socio-economic levels of the eight counties is relatively small, the data processing is unified as a whole.
Table 8. Coordination rating of ES supply–demand.
Value≤0.2>0.2≤0.4>0.4≤0.5>0.5≤0.6>0.6≤0.8>0.8≤1.0
LevelExtreme inharmoniousModerate inharmoniousSlight inharmoniousBasic coordinationModerate coordinationGood coordination
Table 9. Primary and secondary ecological management zones in Hangzhou.
Match Type (County)Degree of CoordinationPrimary Ecological Management ZonesCounties (Major ES Types)Overview of the Natural Environment and EconomyMatch Type
(Grid)
Secondary Ecological Management Zones
HHModerate coordinationEcological optimization zonesYuhang (FP)Plain terrain, including the World Heritage-listed “China’s Archaeological Ruins of Liangzhu City”, with construction land, farmland, and forest land interspersed, and several abandoned mines. Now dominated by the digital economy.HHI
LHII
LLIV
LHBasic coordinationEcological restoration zonesXihu
(HQ, CS, FP)
Plain terrain, including the national 5A-level tourist attractions of Hangzhou West Lake Scenic Area, the national wetland park of Xixi Wetland, and Wuchao Mountain National Forest Park on the border with Yuhang and Fuyang. Highly urbanized area, densely populated. Dominated by high-tech industries and tourism.HHI
LHII
LLIV
Slight inharmoniousEcological reconstruction zonesShangcheng, Xiacheng, Binjiang, Gongshu, JiangganPlain terrain, including Banshan National Forest Park. A highly urbanized area with a high intensity of land development and dense population. Dominated by the digital economy, manufacturing industry, modern service industries, etc.LHII
LLIV
LLBasic coordinationEcological improvement zonesXiaoshan (FP)Plain terrain, including the estuary of the Qiantang River, more arable land in the north, and more forested land in the south. Dominated by manufacturing, trade, and e-commerce industries mainly.HHI
LHII
HLIII
LLIV
HLBasic coordinationEcological reserve zonesChun’an (HQ, SC, CS,
WY, FP)
Hilly, high elevation, with Qiandao Lake (580 km2, containing a national aquatic germplasm resource reserve). Dominated by tourism and eco-industry.LHII
LLIII
HLIV
Moderate coordinationEcological maintenance zonesLin’an, Fuyang, Tonglu, Jiande (HQ, CS, FP)Hilly, complex terrain; Lin’an contains a national nature reserve of Tianmu Mountain Nature Reserve. Dominated by agriculture and service industries.HHI
LHII
HLIV
LLIII
Disclaimer/Publisher’s Note: The statements, opinions and data contained in all publications are solely those of the individual author(s) and contributor(s) and not of MDPI and/or the editor(s). MDPI and/or the editor(s) disclaim responsibility for any injury to people or property resulting from any ideas, methods, instructions or products referred to in the content.

