Article

Comparison of Compact and Decentralized Urban Development Pathways for Flood Mitigation in Urbanizing Deltas—Guangzhou in the Pearl River Delta as a Case Study

1
School of Architecture and Art, Hunan Provincial Key Laboratory of Low Carbon Healthy Building, Central South University, Changsha 410083, China
2
School of Architecture, State Key Laboratory of Subtropical Building and Urban Science, South China University of Technology, Guangzhou 510641, China
3
Faculty of Architecture and the Built Environment, Department of Urbanism, Delft University of Technology (TU Delft), Julianalaan 134, 2628 BL Delft, The Netherlands
*
Authors to whom correspondence should be addressed.
Land 2024, 13(3), 351; https://doi.org/10.3390/land13030351
Submission received: 31 January 2024 / Revised: 28 February 2024 / Accepted: 4 March 2024 / Published: 8 March 2024
(This article belongs to the Section Land Environmental and Policy Impact Assessment)

Abstract

:
Floods are common and inevitable natural disasters. Achieve Sustainable Development Goal (SDG) 11.5 is a critical challenge for coastal cities, especially those in deltaic lowlands such as in the case of Guangzhou, China. Regarding the spatial planning and design of such urban regions, it is crucial to study the impacts of flooding in compact or decentralized spatial development pathways. This reinforces the understanding of the relationship between strategic decisions for spatial planning and flood mitigation. However, the lack of a computer model to assess spatial evolution paths is a significant limitation. The non-dominated Sorting Genetic Algorithm II (NSGA-II) explores the possibility of a compact built-up land layout in 2030. The results showed that, concerning the 2030 decentralized scenario, the 2030 compact scenario presents a large increase in the integrated fitness function value from 0.618 to 0.771 (the increase is equivalent to 0.153 or about 24.75%). In addition, different development scenarios were constructed by setting different target weights. Compared to the decentralized scenario results, the fitness function values of the optimization results of each scenario showed better results at different levels. They could also serve as a reference for other similar coastal areas to achieve SDG 11.5 by 2030.

1. Introduction

Floods are common and inevitable natural disasters, especially in low-lying coastal regions [1]. The annual losses in flood-prone areas worldwide are uncalculated, but the number will increase drastically in the coming years due to climate change and urbanization [2,3,4]. Over the next 80 years, the global land area exposed to coastal flooding will increase by about 48% due to climate change, thus threatening tens of millions of people and affecting 20% of the global gross domestic product (GDP) [5].
Currently, 60% of the world’s population lives in coastal areas within 100 km of the coast, and 23 of the world’s 30 large cities are located in coastal areas [6,7]. Due to compound events such as storm surges, precipitation, and subsidence, coastal flooding is a critical factor of the safe development of delta estuaries, especially in lowland floodplain areas [4,8]. According to a new assessment that analyzed the coastal flood impact using new elevation and high-resolution population data, asset damage and casualties are significantly increased in delta lowland floodplains [9,10]. Thus, with the far-reaching influence of coastal flood disasters and the compressed timelines of mitigation and adaptation, delta lowland cities should take aggressive action to respond quickly [11].
To deal with these challenges, international institutes, researchers, and governments have continued to conduct extensive research. The Sustainable Development Goals (SDG) promulgated by the United Nations (UN) aim to create better conditions for a safe, thriving, prosperous, and inclusive urban environment by 2030. The core aim of SDG 11.5 is to significantly reduce the number of deaths and the number of people affected by disasters, and to substantially decrease the direct economic losses caused by disasters, including water-related disasters, relative to the global GDP, with a focus on protecting the poor and people in vulnerable situations. The increase in the resilience of coastal cities will lead to a decrease in the damage losses and casualties due to flooding. It is the key aspect of SDG 11.5 that coastal cities must implement during spatial planning [12].
To achieve SDG 11.5 by 2030 in lowland floodplain areas, flood impact assessments at different scales have attracted the attention of domestic and foreign researchers. For instance, Hirabayashi et al. (2013), Vousdoukas et al. (2018), and Wang et al. (2019) published studies on the change in flood risk due to climatic alterations, socioeconomic networks, and road networks, respectively, at the global, European, and Chinese scales [13,14,15]. Lin et al. (2020) explored multi-scenario flood risk assessment in the Guangzhou, China, estuary area using the future land use (FLUS) model [16]. Further research has focused on the formulation of policies via the creation of disaster prevention and mitigation procedures [17,18,19]. However, a few researchers have attempted to establish a compact and decentralized spatial evolution path in delta lowland cities for the future, which will result in a conflict between spatial expansion and flood risk management. This conflict means that the layout of development areas must balance some contradictory objectives, e.g., maximizing the probability of built-up land development and minimizing the exposure to coastal flooding.
Fast urbanization in flood-prone areas, such as the Greater Bay Area with megacities like Guangzhou, will face huge challenges due to coastal flooding. Thus, this paper proposes a new, compact and decentralized decision-making support tool for spatial evolution pathways. It can provide a more comprehensive and systemic understanding of the flooding problem. In the field of operations research, economist Pareto proposed, for the first time, the incomparable multi-objective optimization problem to solve the disagreement between different objectives. It was used to solve complex engineering problems [20,21]. Midwood and Dawson (2015) built a multi-objective optimization function by developing an algorithm that minimizes flood exposure risk, heat island exposure risk, transportation costs, and encroachment on green spaces to reach new residential areas in the Tees Valley area [22]. Caparros-Midwood et al. (2017) developed a framework for spatial optimization that synergizes multiple objectives in response to growing populations, increasing climate-related risks, and reduced greenhouse gas emissions [23].
Therefore, the application of the multi-objective optimization theory is a key approach to the identification of priority development areas in delta lowland cities. However, less research has been carried out on determining how to effectively consider the coastal flood risk faced by the development of delta lowland cities on compact and decentralized spatial evolution paths, as well as the optimal spatial layout for coordination with other urban development goals.
Although the multi-objective optimization method can, theoretically, solve the spatial optimization problem, it suffers from the issues of large data size and high dimensionality. If the traditional solution method, for example linear programming, is used to enumerate the possible spatial layout combinations, the computational time complexity will grow exponentially with the data dimensionality [24]. Thus, this approach is unable to provide effective multi-objective spatial optimization solutions within the government decision cycle.
To solve such issues, scientists have proposed the Non-Dominated Sorting Genetic Algorithm II (NSGA-II) method, which is inspired by natural genetic mechanisms [25]. NSGA-II continuously generates diverse new individuals via the crossover and mutation of the genomes of individuals in a population, and it selects and filters the population from one generation to another to promote continuous evolution toward the optimal solution. This method reduces the number of solution space searches, as well as the model simulation time complexity of the system. In addition, the NSGA-II genetic coding method can correspond to urban spatial information, thus leading to a robust algorithm, and the results, after repetitive compilation, are consistent [26]. Therefore, the application of NSGA-II can couple compact development conditions and is beneficial to improving the efficiency and accuracy of solving such problems.
The objective of this research is to use Python and ArcGIS to envisage a decision-making support tool to compare compact and decentralized spatial evolution paths to help the Guangzhou estuary area achieve SDG 11.5 by 2030. Under the complexity and uncertain impact of the environment, this decision-making support tool provides a new perspective on the use of computer model reasoning, and it can overcome the limitations of the use of human reasoning alone. In addition, this computer model designs a new criterion of spatial optimization that can extend the knowledge of decision-makers to consider more comprehensive factors. The criterion considers both the safety and sustainability needs of the future development in the Guangzhou estuary area. Considering the ecological value and the regional spatial planning goals, and under the constraints of compact development, the basic principles of the high probability of built-up land development and low coastal flood exposure are constructed using the objective function.
In addition, different goal-oriented urban development scenarios are designed by setting different target weights to explore the possibility of a new compact land layout. The rate of urbanization is an important factor influencing future urban spatial changes, and high and slow rate development scenarios are set up in this study. The optimization results of the different scenarios are compared with decentralized land layout scenarios to select the ideal development path. The research results can provide a scientific basis for policy formulation and decision-making in response to coastal flooding in the Guangzhou estuary. They can also serve as a reference for other similar coastal areas to achieve SDG 11.5 by 2030, which may reduce casualties and property damage due to failure of development path decisions.
The remainder of this paper is arranged as follows. In Section 2, the material and methods, as well as the methodology of this work, are presented. The results and their analysis are presented in Section 3. Finally, Section 4 concludes this article and proposes some future ideas for enhancement.

2. Materials and Methods

2.1. Study Area

Guangzhou is located at longitude 112°57′ to 114°3′ east and latitude 22°26′ to 23°56′ north at the mouth of the Pearl River Delta in China, as shown in Figure 1. It is one of the four national central cities under construction in China, and has a regional area of 7434 km2. The Guangzhou estuary is located in the low-lying area of the Pearl River Delta plain [27]. The region has a subtropical monsoon climate influenced by subtropical cyclones and significant interactions between sea and land systems [28]. Typhoons cause landfalls every summer, resulting in frequent coastal flooding disasters in the Guangzhou estuary area [29].
Moreover, in the context of China’s construction of the Guangdong–Hong Kong–Macao Greater Bay Area, the urban expansion of Guangzhou toward the estuary has become an inevitable trend. Kang et al. (2015), at the Pearl River Delta scale, assessed the impact of future storm surge gain on the loss of arable land in the region, and found that the Guangzhou estuary will be one of the most severely affected areas in the future [28]. In fact, this region is at the highest risk of coastal flood exposure due to future sea level rise. In February 2019, the State Council released the Outline of Planning for the Guangdong–Hong Kong–Macao Greater Bay Area, which emphasizes that “spatial planning with a focus on disaster mitigation and prevention” is one of the key issues for future work in the region.

2.2. Data

Real built-up land data from 2015 and FLUS-based simulation data for 2030 obtained by Lin et al. (2020), which have high simulation accuracy, were adopted in this study [16].
The probability of built-up land development was calculated using the neural network-based occurrence probability calculation module of the FLUS model [30]. A random sample was chosen for training, and the 2015 Guangzhou land use data were applied for sampling; a sampling proportion of 10% of the overall sample size and the training data from the research of Lin et al. (2020) were used [16]. The number of hidden layers of the neural network was set at 15 levels based on experience and related studies [31].
Referring to the parameter settings of previous experiments and consultations with experts in related fields, the high estimate area of coastal flood exposure was set to 0.1 in this experiment, the low estimate area was set to 1, and other areas, namely those not in the 2030 once-a-century coastal flood exposure area, were set to 0 [22].
The cost of land conversion was sourced from the dissertation of Dr. Xun Liang of Sun Yat-sen University, who obtained the land conversion cost of the Pearl River Delta region by consulting experts in this field and by applying a spatial simulation; he verified that the model using the parameter had a good simulation effect and could effectively reflect the land use change pattern of the region [32].
The cost of spatial planning was sourced from the Pearl River Delta Master Plan (2014–2020). The value was set to 1 within urban development zones, namely those in which new built-up land has been encouraged, and 0 outside of them; this data have been used to delineate urban cluster borders in the Pearl River Delta. The results of the 2017–2035 Guangzhou Master Plan were used to determine the restricted development areas of permanent basic agricultural land and the Ecological Protection Red Line.
As shown in Figure 2, these data were evenly converted into 100 × 100 m raster data using the resampling feature of the ArcGIS platform.

2.3. Method

2.3.1. New Criterion Definition

The new criterion for achieving SDG 11.5 took into account the safety and sustainability needs of the Guangzhou estuary. The high probability of construction land development and low coastal flood exposure were considered the basic principles. Moreover, the ecological value and the impact of regional spatial planning objectives were determined as the basis of the objective function definition.
First, freshly developed land is closely related to the surrounding environment, and a good probability of the development of built-up land is advantageous for development and construction. Thus, the maximization of the probability of built-up land development was chosen as one of the requirements for the construction of the multi-objective optimization function. Second, in the development and construction process of the Guangzhou estuary area, new built-up land is established while considering its exposure to coastal flooding, thus yielding the minimization of coastal flood exposure as one of the main constraints for the construction of the multi-objective optimization function.
Moreover, in the selection process of new built-up land, the conversion from land use types with different ecological values has different costs; thus, the minimization of the land conversion cost was chosen as one of the requirements for the construction of the multi-objective optimization function. Finally, in the selection process of new built-up land, the planned development area is used as an important spatial development guidance goal. Spatial planning cost maximization was thus selected as another requirement for the construction of the multi-objective optimization function. Therefore, the multi-objective NSGA-II spatial optimization function of the Guangzhou estuary area is the result of the summation of four cost functions, and it is represented as follows:
E = i = 1 N j = 1 M x i j   d i j   +   i = 1 N j = 1 M x i j   ( 1 P i j )   +   i = 1 N j = 1 M x i j     ( 1 P m n )   +   i = 1 N j = 1 M x i j   P i j ,
where E represents the value of the integrated fitness function, E1 represents the probability of new built-up land development, E2 represents the exposure to coastal flooding, E3 represents the cost of land conversion, and E4 represents the cost of spatial planning. The specific requirements of each objective are as follows.
(1)
Objective 1: Maximize the probability of built-up land
E 1 = i = 1 N j = 1 M x i j   d i j ,
If cellij is not used, then the value of xij is set as 0; otherwise, if cellij is used, then the value of xij is set as 1. Moreover, ij is the selected spatial location and dij is the development probability of the construction site.
(2)
Objective 2: Minimize the exposure to coastal flooding
E 2 = i = 1 N j = 1 M x i j   ( 1 P i j ) ,
If cellij is not used, then the value of xij is set as 0; otherwise, if cellij is used, then the value of xij is set as 1. Moreover, Pij is the cost of exposure to coastal flooding. If ZijZ, Zij = 1, Z is the inundation range for the low estimate scenario. If Zijz, Zij = 0.1, z is the inundation range for the high estimate scenario.
(3)
Objective 3: Minimize the cost of land conversion
  E 3 = i = 1 N j = 1 M x i j   ( 1 P m n ) ,
If cellij is not used, then the value of xij is set as 0; otherwise, if cellij is used, then the value of xij is set as 1. Moreover, m is the current land use type, n is the land use type to be converted, and Pmn is the conversion cost.
(4)
Objective 4: Maximize the cost of spatial planning
E 4 = i = 1 N j = 1 M x i j   P i j ,
If cellij is not used, then the value of xij is set as 0; otherwise, if cellij is used, then the value of xij is set as 1. Moreover, Pij indicates whether the selection point is within the spatial planning area.
(5)
Constraints
Xi−1,j + Xi+1,j + Xi,j−1 + Xi,j+1 ≥ 2,
to avoid the disorderly expansion of built-up land, at least two adjacent sides of the proposed built-up land area must be built-up land to proceed.
TP (Xij) = 0, if XijΩ,
where TP (Xij) denotes the spatial conversion probability of the land use type, and Ω represents the spatial control area of basic agricultural land, water, etc.

2.3.2. Construction of the Compact and Decentralized Spatial Evolution Paths

The compact spatial evolution path, which includes a compact selection rule for exploring new layouts of built-up land, can help to mitigate flooding in urbanizing deltas. Furthermore, to explore a compact layout with better performance, this study used NSGA-II spatial optimization algorithm to investigate the possibility of a compact built-up land layout in 2030.
The decentralized spatial evolution path through FLUS model simulation has high simulation accuracy in Lin et al. (2020) [16]. The FLUS model, operating through the CA model, distributes different land use types based on complex competitions and interactions. This process can achieve decentralized spatial evolution.
In the construction of NSGA-II spatial optimization algorithms, the Python language has been widely used in intelligent algorithm experimental simulations due to its flexible editing constructs and simple language style. Python is currently considered one of the most popular programming languages worldwide. The ArcGIS platform, a classical spatial analysis operation platform with powerful spatial data processing and computing capabilities, has been widely used in ArcGIS simulation, spatial information integration, and other fields. In this study, the data material needed to be pre-processed; the data were converted to ASCII code through the ArcGIS platform, and were then imported into the Python platform for calculation. As shown in Figure 3, the calculation procedure mainly included six processes: (1) compact selection, (2) crossover operation, (3) mutation operation, (4) non-dominated sorting, (5) crowding degree calculation, and (6) termination output. They are defined as follows.
 (1) 
Compact selection
To ensure the compactness of the new construction sites, the multi-objective NSGA-II spatial optimization algorithm could select only non-restricted development areas, and at least two adjacent construction sites could be selected as new sites. Randomly, the points selected based on the original construction sites were coded as 1, whereas those not selected were coded as 0. The individual was added to the initial population while the number of newly selected sites approached the target value. The aforementioned rule was extended until the number of selected individuals met the initial population size requirement.
 (2) 
Crossover operation
The number of crossed individuals is determined by multiplying the crossover rate by the overall population size. The selected individuals are paired two by two. In the process of the crossover operation on chromosomes of paired individuals, and due to the traditional single- and double-point crossover, excellent genomes are easily destroyed because of the large chromosome alteration.
As a result, the crossover mechanism was appropriately adjusted in this study to increase the flexibility of the crossover operation while reducing the damage to superior individuals’ genes by randomly selecting two crossover points. Furthermore, to efficiently improve the population evolution, a comparison operator was used to calculate the integrated fitness function values of the new individuals generated after crossover versus the original individuals. Individuals with high integrated fitness function values were selected for the new population based on the results.
 (3) 
Mutation operation
The number of points to mutate is calculated by multiplying the mutation rate by the number of new points required for each individual. Under the traditional random variation mechanism, an individual’s chromosomal quality may deteriorate, necessitating an iterative search for the optimal solution; which may also lead to convergence failure. Therefore, a comparison operator was also placed at this level in the mutation operation. A randomly selected desired mutation point scenario is investigated from left to right and from top to bottom at that gene point location until a new gene point with a better integrated fitness function value than the original gene point is found. Then, the mutation operation can be performed. If no better gene point is found even after searching all the gene points, no further mutation is performed at that point.
 (4) 
Non-dominated sorting operation
Once the new population is obtained after the crossover and variation operations, the previous and the newly generated populations are merged. Non-dominated sorting is performed on the merged population to obtain the stratified group of individuals. They are selected into the new population of the next generation according to the non-dominated stratum until the individuals of a stratum exceed the population size after being added to the new population. At this level, the group of individuals of that stratum is subjected to crowding degree calculation.
 (5) 
Crowding degree calculation and the selection of outstanding individuals
The crowding degree calculation of four objectives is performed for the portion that exceeds the number of individuals in the population. Moreover, the crowding degree value size is ranked, and the individuals with a higher crowding degree are selected into the new population of the next generation one by one until the new population of individuals reaches the population size requirement.
 (6) 
Termination output
Based on multiple experiments and previous research experience (Li and Parrott, 2016) [26], the termination condition was set as 150 generations. The comprehensive fitness function values of the population individuals were calculated and ranked from largest to smallest. The individual in the population with the largest integrated fitness function value was selected as the optimal solution and inserted into the ArcGIS platform for display. The data were converted into raster data by the “ASCII to Raster” tool and displayed together with water bodies and current construction sites.

2.3.3. Design of Scenarios for Compact Spatial Evolution Path

The simulation scenarios for compact spatial evolution path were designed in the following steps.
 (1) 
Different target weighting scenarios
Faced with uncertainty regarding the spatial development strategy of the Guangzhou estuary, different goal-oriented spatial optimization scenarios were explored. They were designed with different combinations of objective weights to test the applicability of the proposed multi-objective spatial layout optimization, as well as to provide different development paths for the sustainable development of the region. The BAU scenario was defined by setting the weight of each objective to 0.25. There were 6364 new built-up land rosters for the BAU scenario (2015–2030).
The specific scenarios were designed as follows, as shown in Table 1:
-
Scenario A entails giving the highest priority to the probability of the built-up land development objective. The weight of built-up land development was set to 0.5, while the weights of coastal flood exposure, the land conversion cost, and spatial planning cost were set to 0.17, 0.17, and 0.16, respectively;
-
− Scenario B consists of giving the highest priority to the coastal flood exposure objective with a weight of 0.5, and the weights of the probability of built-up land development, the land conversion cost, and the spatial planning cost were set to 0.17, 0.17, and 0.16, respectively;
-
Scenario C consists of prioritizing the land conversion cost objective with the weight of 0.5, and the weights of the probability of built-up land development, coastal flood exposure, and the spatial planning cost were set to 0.17, 0.17, and 0.16, respectively;
-
Scenario D prioritizes the spatial planning cost objective with a weight of 0.5, and the weights of the probability of built-up land development, coastal flood exposure, and the spatial planning cost were set to 0.17, 0.17, and 0.16, respectively;
-
Scenario E prioritizes the probability of built-up land development and coastal flood exposure objectives, the weights of which were both set to 0.4. The weights of the land conversion cost and spatial planning were both set to 0.1;
-
Finally, Scenario F prioritizes the land conversion and spatial planning cost by setting their weights to 0.4, while the weights of the two remaining parameters are set to 0.1.

2.3.4. Overview of the Performance of the Computer Simulation Experiment

This experiment used Python as the simulation platform for coding multi-objective NSGA-II algorithms. The simulation was performed on an HP G7 workstation consisting of an Intel® Core™ i7 CPU with 8 GB of RAM. The pattern of built-up land in the Guangzhou estuary from 2015 to 2030 served as the experimental object of the multi-objective NSGA-II spatial optimization.

3. Results

3.1. Analysis of the Simulation Results

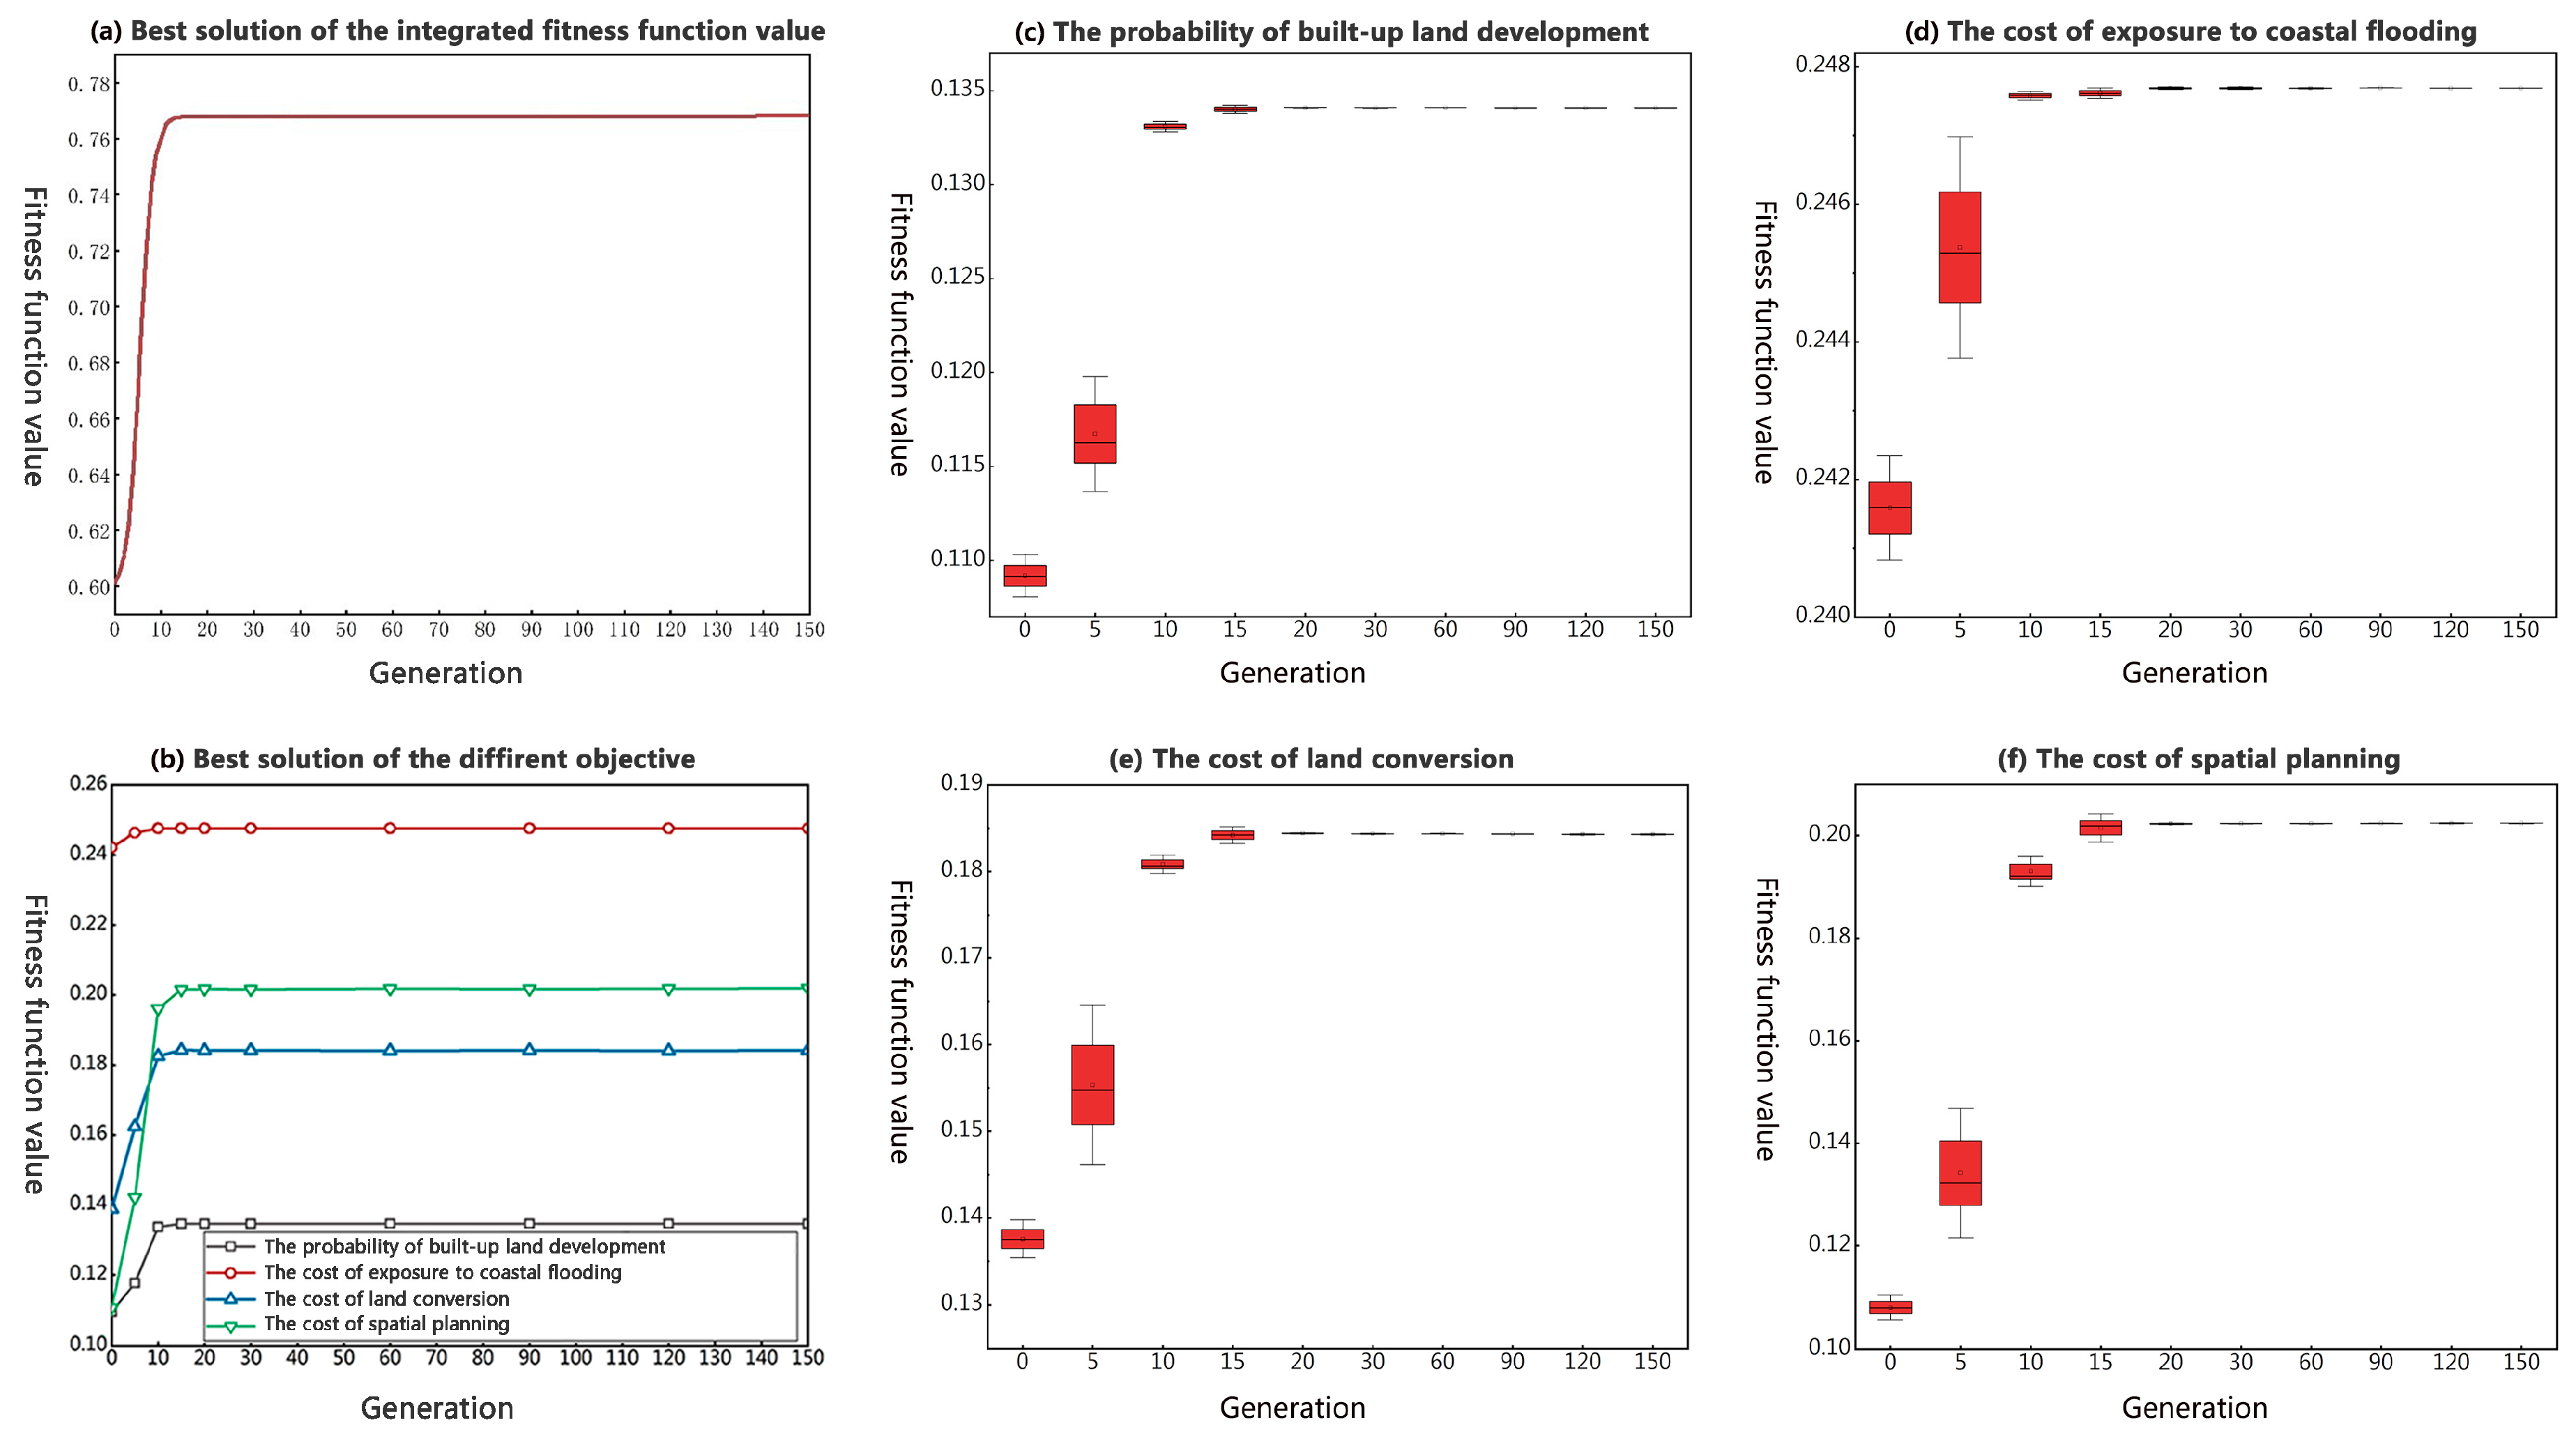
3.1.1. Analysis of the Integrated Fitness Function Values for the BAU Scenario

 (1) 
The integrated fitness function value of the best solution
The base year of 2015 was considered for the construction land in the Guangzhou estuary area, and the multi-objective NSGA-II algorithm built using the Python platform was used to optimize the spatial layout of new construction land in 2030. The integrated fitness values of the individuals in the population were ranked using the previously described approach, and the individual with the highest value was selected as the alternative optimal solution. In the process of population iteration, the integrated fitness function value was increased from the initial population in the 1st generation to convergence in the 150th generation. Specifically, the integrated fitness function value began from a value equal to 0.601 in the 1st generation, reached the value of 0.767 in the 15th generation, then exhibited a slow growth process, and converged after 140 generations. Referring to the executed simulations, the integrated fitness function value converged to 0.768 at the end of the 150th generation.
Regarding the analysis in terms of individual objectives, the first objective, i.e., the built-up land development probability, represents the spatial distribution of the suitability of new built-up land under the existing urban environmental conditions. It improved from 0.101 to 0.134 and converged after just 15 generations; this was basically synchronized with the convergence of the integrated fitness function value.
The second objective is the exposure to coastal flooding, which reflects the exposure of new construction land to future coastal flooding. Its value increased from 0.242 to 0.247 and reached a steady state in the 12th generation before converging after a small fluctuation.
The third objective is the land conversion cost, which represents the ease of conversion from other land use types to built-up land. It increased from 0.139 to 0.184 and began to converge in the 15th generation. This result is suitable for the convergence rate of the integrated fitness function.
Finally, the fourth objective is the spatial planning cost, which represents the spatial location of the new construction land in the original plan. It improved from 0.111 to 0.202 and began to converge in the 20th generation, slightly after the convergence of the overall fitness function.
Based on the spatial layout optimization process, the new built-up land was found to be more dispersed in the initial population optimization solution. With the iteration of the population, the originally scattered new built-up land gradually converged to a more concentrated location, and the local spatial optimization was adjusted until finally reaching the convergence state, as shown in Figure 4 and Figure 5.
 (2) 
Analysis of the distribution of solution sets
Analysis of the distribution of each target value in the evolution of the population, as shown in Figure 4c–f, is as follows.
First, the initial populations of the value of the probability of built-up land development were in the lower range overall. In contrast, the 5th generation population showed a large increase in the interval and overall mean of the distribution of this target value. The interval of the distribution improved from about 0.108 to 0.110 to about 0.114 to 0.120. The mean value improved from about 0.108 to about 0.117. Although the overall mean value was still increasing and gradually reaching convergence, the interval of the population was shrinking and finally concentrated around about 0.135.
Second, the objective related to coastal flooding exposure showed rapid growth over the first 10 generations, a large population expansion within this target value range between generations 1 to 5, followed by a rapid contraction and minor fluctuations between generations 60 and 150. Specifically, during the overall population evolution, the coastal flooding exposure was highly unstable. There was some non-synergy with other objectives, which required a constant search to find the ideal optimal solution. There was a slight pullback between generations 15 and 20, with mean values between 0.247 and 0.248, and then they slowly converged.
Furthermore, the objective of land conversion cost had a similar trend to the probability of built-up land development. With a significant increase in the mean value in the first 10 generations, the distribution of individuals in the population in the interval of this target value also expanded and then gradually contracted, and then converged to about 0.185. Due to the wide distribution of agricultural land around the Guangzhou estuary area near the built-up land, the process of population evolution facilitated the search for spatial layout options for land conversion at a low cost.
Finally, in terms of spatial planning cost, the mean value increased significantly over the first 10 generations. Then, it continued to grow until 15 generations later, when it showed a slow growth trend and eventually converged at around 0.201. Compared to other objectives, the spatial planning cost resulted in the largest increase in the mean value of the population from the initial population to the final convergence, with an increase of approximately 0.09. It indicated that spatial planning had a large impact on the spatial layout of new built-up land.

3.1.2. Analysis of the Distribution of the 150th Generation Solution Set of the BAU Scenario

In the solution set of all Pareto fronts, the distribution of different targets presented different patterns, as shown in Figure 6. The value of the probability of built-up land development was at about 0.13455 to 0.13470, and the overall distribution was more balanced, indicating that there was more variability in this target.
The value of the exposure to coastal flooding was mainly distributed between about 0.24757 and 0.24780, with a relatively large range of variation intervals, indicating that this target has been coordinated with other targets to a greater extent.
The distribution of land conversion cost and spatial planning cost was between (0.18381 to 0.18433) and (0.20151 to 0.20205). Some solutions were aligned to produce a diversity of spatially optimized solutions through coordination with other objectives.

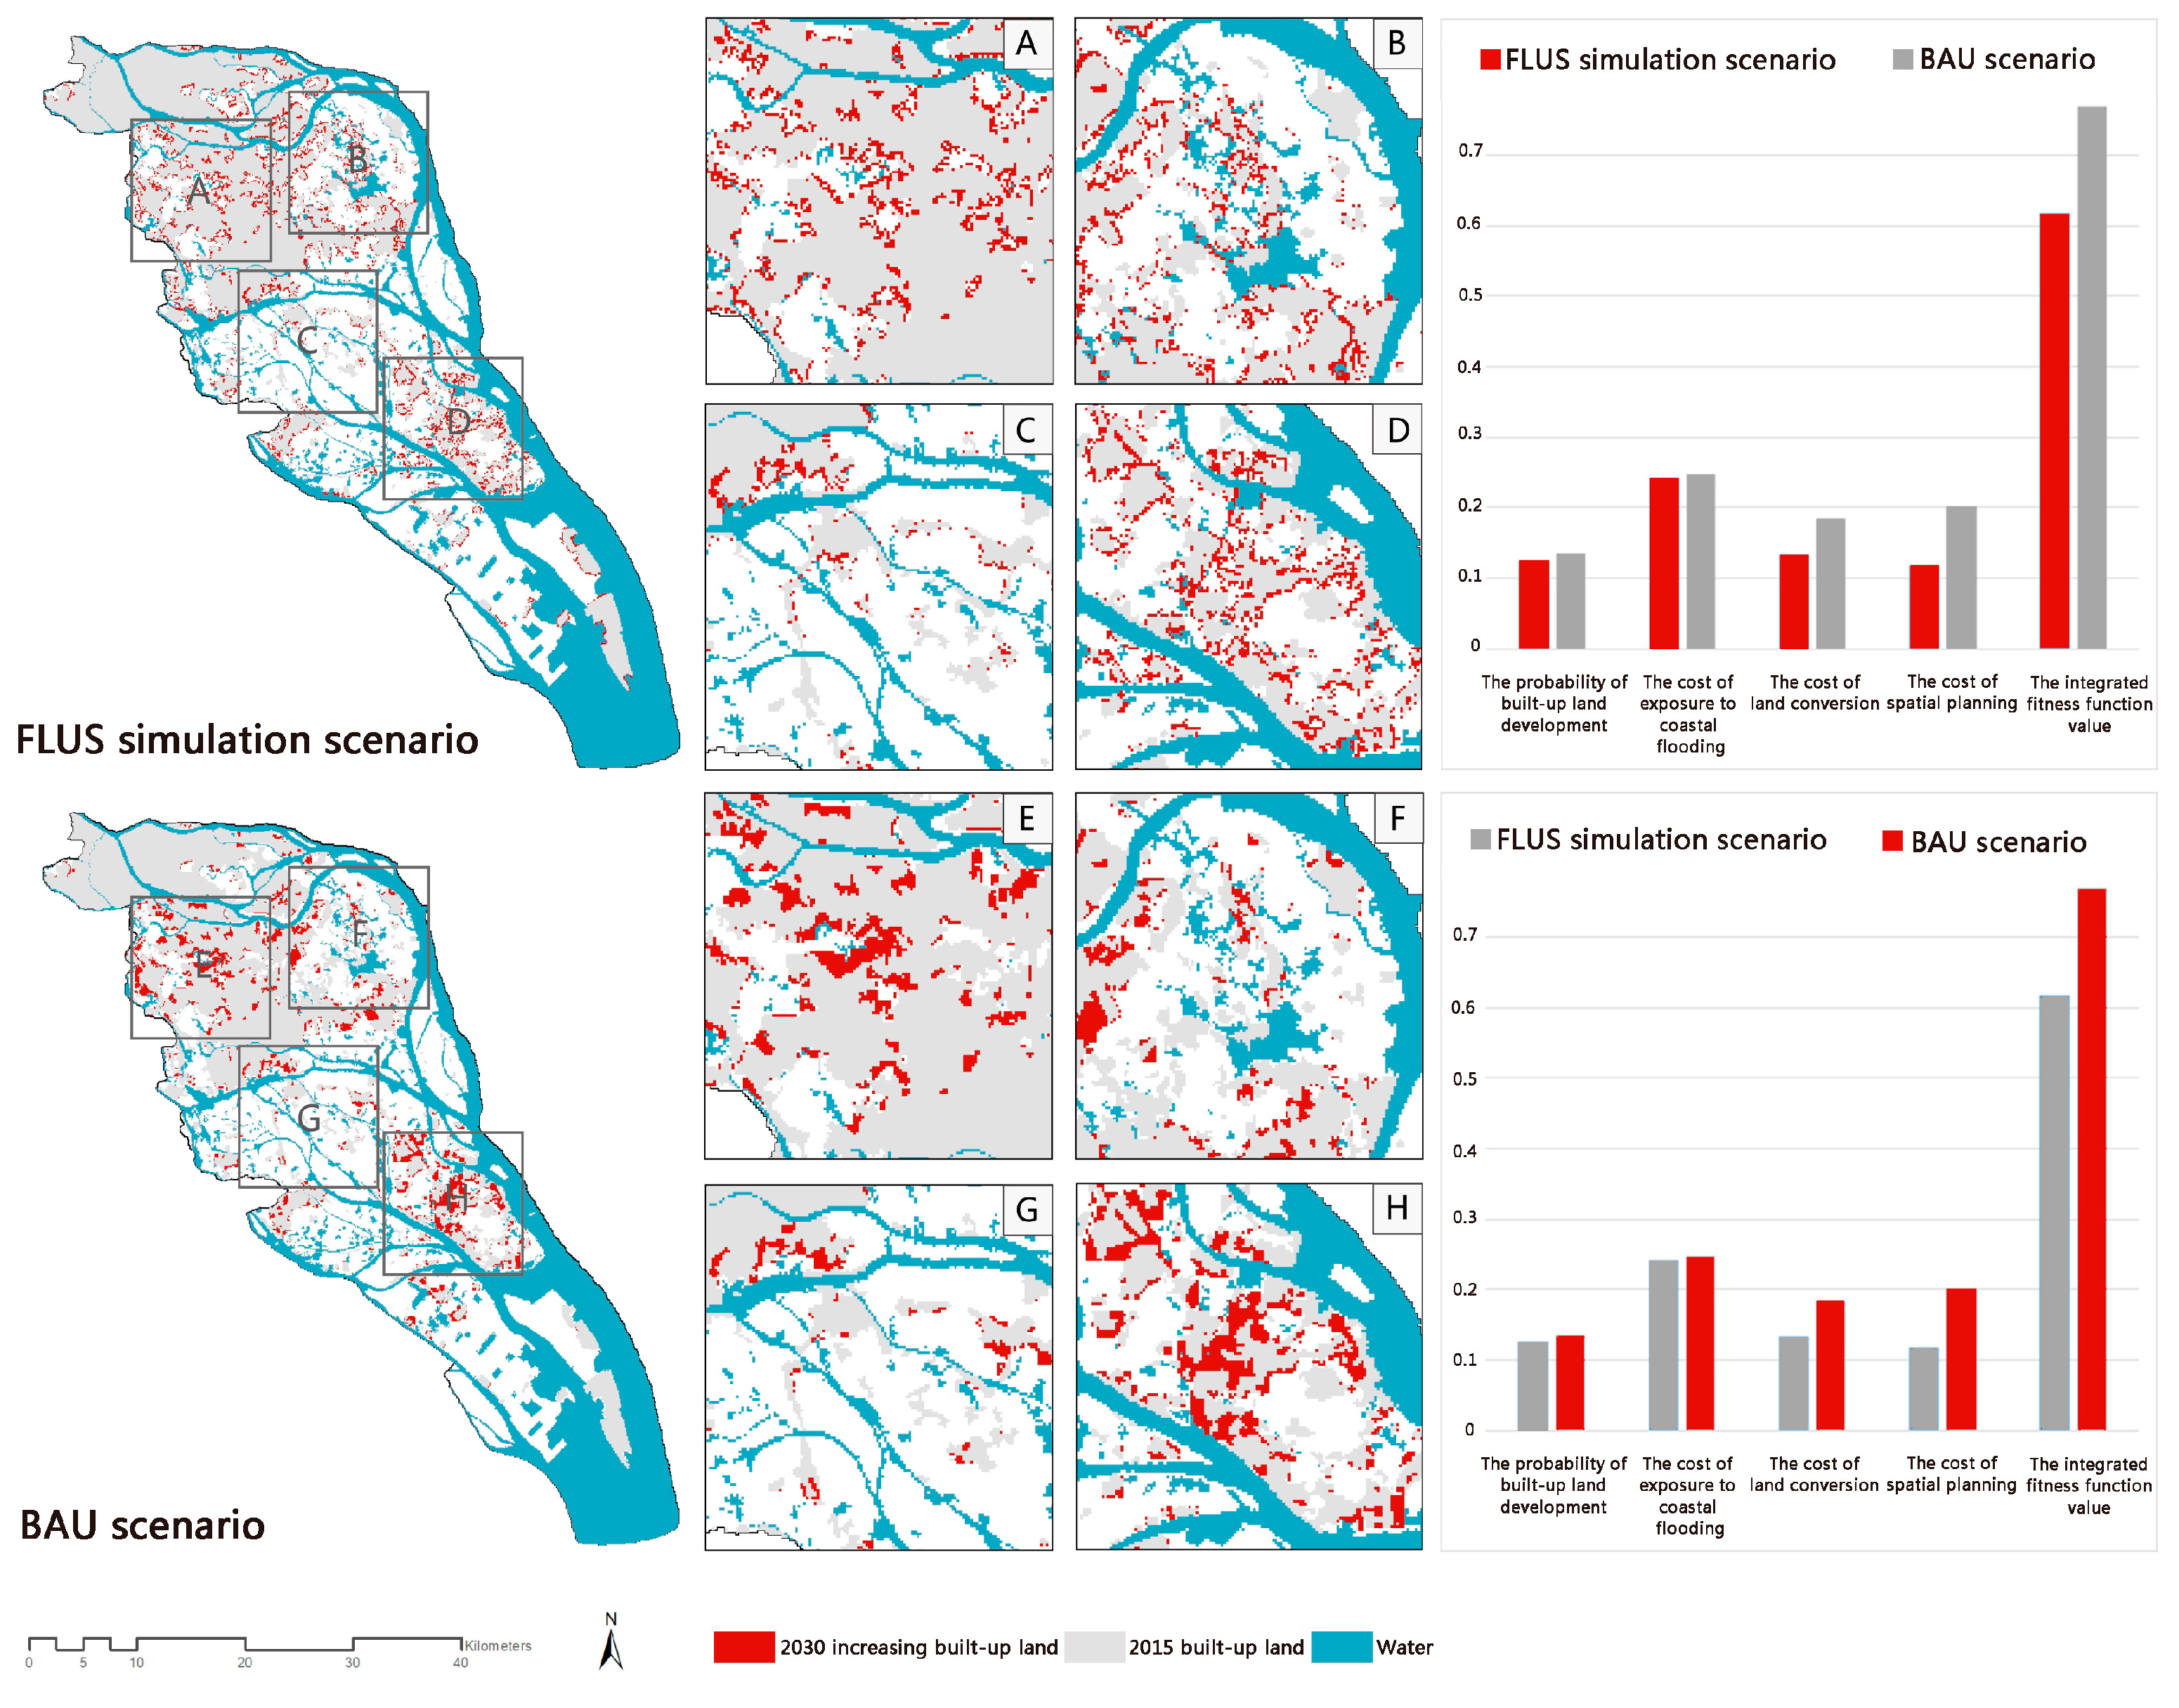
3.1.3. Comparison of the Results of the Compact Spatial Evolution Path of the BAU Scenario and the Decentralized Spatial Evolution Path of the FLUS Simulation Scenario

As a new compact and decentralized spatial evolution paths decision-making support tool, computer model reasoning can enrich the hypothesis scenario to generate a possible ensemble. The use of the new criterion of spatial optimization provides a new perspective for deliberating on new priority development areas. In addition, this approach considers more comprehensive factors that will help decision-makers raise awareness about the complexity and uncertain impact of the environment. Furthermore, with the guidance of the new spatial optimization criterion, it is possible to find solutions that are more conducive to meeting the requirements of the decision objectives than the FLUS simulation results.
The method’s effectiveness was verified after running the multi-objective NSGA-II spatial optimization algorithm and performing the spatial optimization solution of the BAU scenario. Individuals in the 150 generations were ranked, and the one with the highest values was selected for comparison with the FLUS simulation scenario. The results show that the multi-objective NSGA-II spatial optimization algorithm achieved a large improvement over the FLUS simulation scenario in terms of the integrated fitness function values (an increase of 0.153 from 0.618 to 0.771, thus reflecting an improvement of about 24.75%) as compared to the FLUS simulation scenario, as shown in Figure 7.
For each objective fitness function, the multi-objective NSGA-II spatial optimization exhibited several degrees of improvement over the FLUS simulation scenario; however, the magnitude varied widely. Among these objectives, the increases in the values of the probability of built-up land development and the coastal flood exposure fitness function were small. On the one hand, in the FLUS model simulation process, the probability of built-up land development and the original areas with a high probability of built-up land development were preferentially selected. Although multi-objective NSGA-II spatial optimization was carried out, the space available for adjustment was limited, and the probability of built-up land development was found to increase from about 0.126 to about 0.139. On the other hand, the study area of the Guangzhou estuary is extensive, and the coastal flooded area is mainly distributed in the lowland area of the river network. The coastal flood exposure area of the new construction land was found to be at a low level compared to the overall quantity. In the multi-objective NSGA-II spatial optimization process, although the construction land exposed to coastal flooding was reduced, the value of the coastal flood exposure fitness function was marginally improved from 0.241 to 0.247 when averaged with the overall base value of new construction land.
The fitness function values of the land conversion cost and the spatial planning cost were found to improve more significantly, from 0.134 to 0.184 and from 0.118 to 0.200, respectively. In terms of the land conversion cost and based on the spatial constraints of permanent basic agricultural land protection and the ecological protection control line, the spatial optimization preferentially selected a low conversion cost. As the agricultural land in the estuary region is the main spatial pattern of agricultural land, this objective was greatly improved as compared to the FLUS simulation scenario. In terms of the spatial planning cost, as the spatial development area is planned to be adjacent to the existing construction land, this area can be selected as the priority for new land development in 2030 in the optimized layout; thus, this achieved the most significant performance improvement (about 0.82) among the four objectives as compared with the FLUS simulation scenario.

3.1.4. Spatial Optimization Results for Scenarios with Different Target Weights

Based on the analysis of the experimental results and in contrast to the results of the FLUS simulation scenario (the decentralized spatial evolution path), the fitness function values of the optimal solutions searched within the 150 generations were found to be improved for each scenario to different degrees, as shown in Figure 6. The results prove the effectiveness of the multi-objective NSGA-II spatial optimization method, as shown in Figure 8. Specifically, among the scenarios with a single-objective priority, as compared to the FLUS simulation scenario, the value of the integrated fitness function of Scenario D increased the most, from 0.570 to 0.800. The main reason for this is that the spatial planning area was within the range in which new construction land could be selected, and when the weight of this objective increased, points in the spatial planning area were preferentially selected.
In contrast to the results discussed previously, based on the comparison of the FLUS simulation scenario to the value of the integrated fitness function for Scenario A, the increase became smaller as the value increased from 0.581 to 0.702. The main reason for this is that the FLUS simulation made this target a priority factor, and even if the weight was increased for this target, there would be limited room for further improvement. In Scenario C, the probability of built-up land development was decreased, and a better overall spatial layout solution was obtained by coordinating other target values. The reduction of the land conversion cost will help protect forest land and water bodies as compared to higher land conversion costs, and will give priority to agricultural land suitable for development within the spatial planning scope based on the protection of permanent basic agricultural land. In addition, in Scenario B, the increase of the integrated fitness function value was also smaller, with an increase from 0.733 to 0.842. The main reason for this is that the extent of coastal flood exposure coverage is limited, as is the amount (eventually, the total amount) of new construction land exposed to coastal flooding. Thus, even if the weight of this target is increased, the increase will be restricted, but it is important for reducing the future coastal flood exposure of new construction land.
For the dual-objective priority scenario, the value of the integrated fitness function for Scenario E was only increased by about 0.093 as compared to the FLUS simulation scenario. This is due to the low sensitivity to changes in the land conversion cost and the coastal flood exposure. Regarding Scenario F, the value of the integrated fitness function was increased by 0.210 as compared to the FLUS simulation scenario.

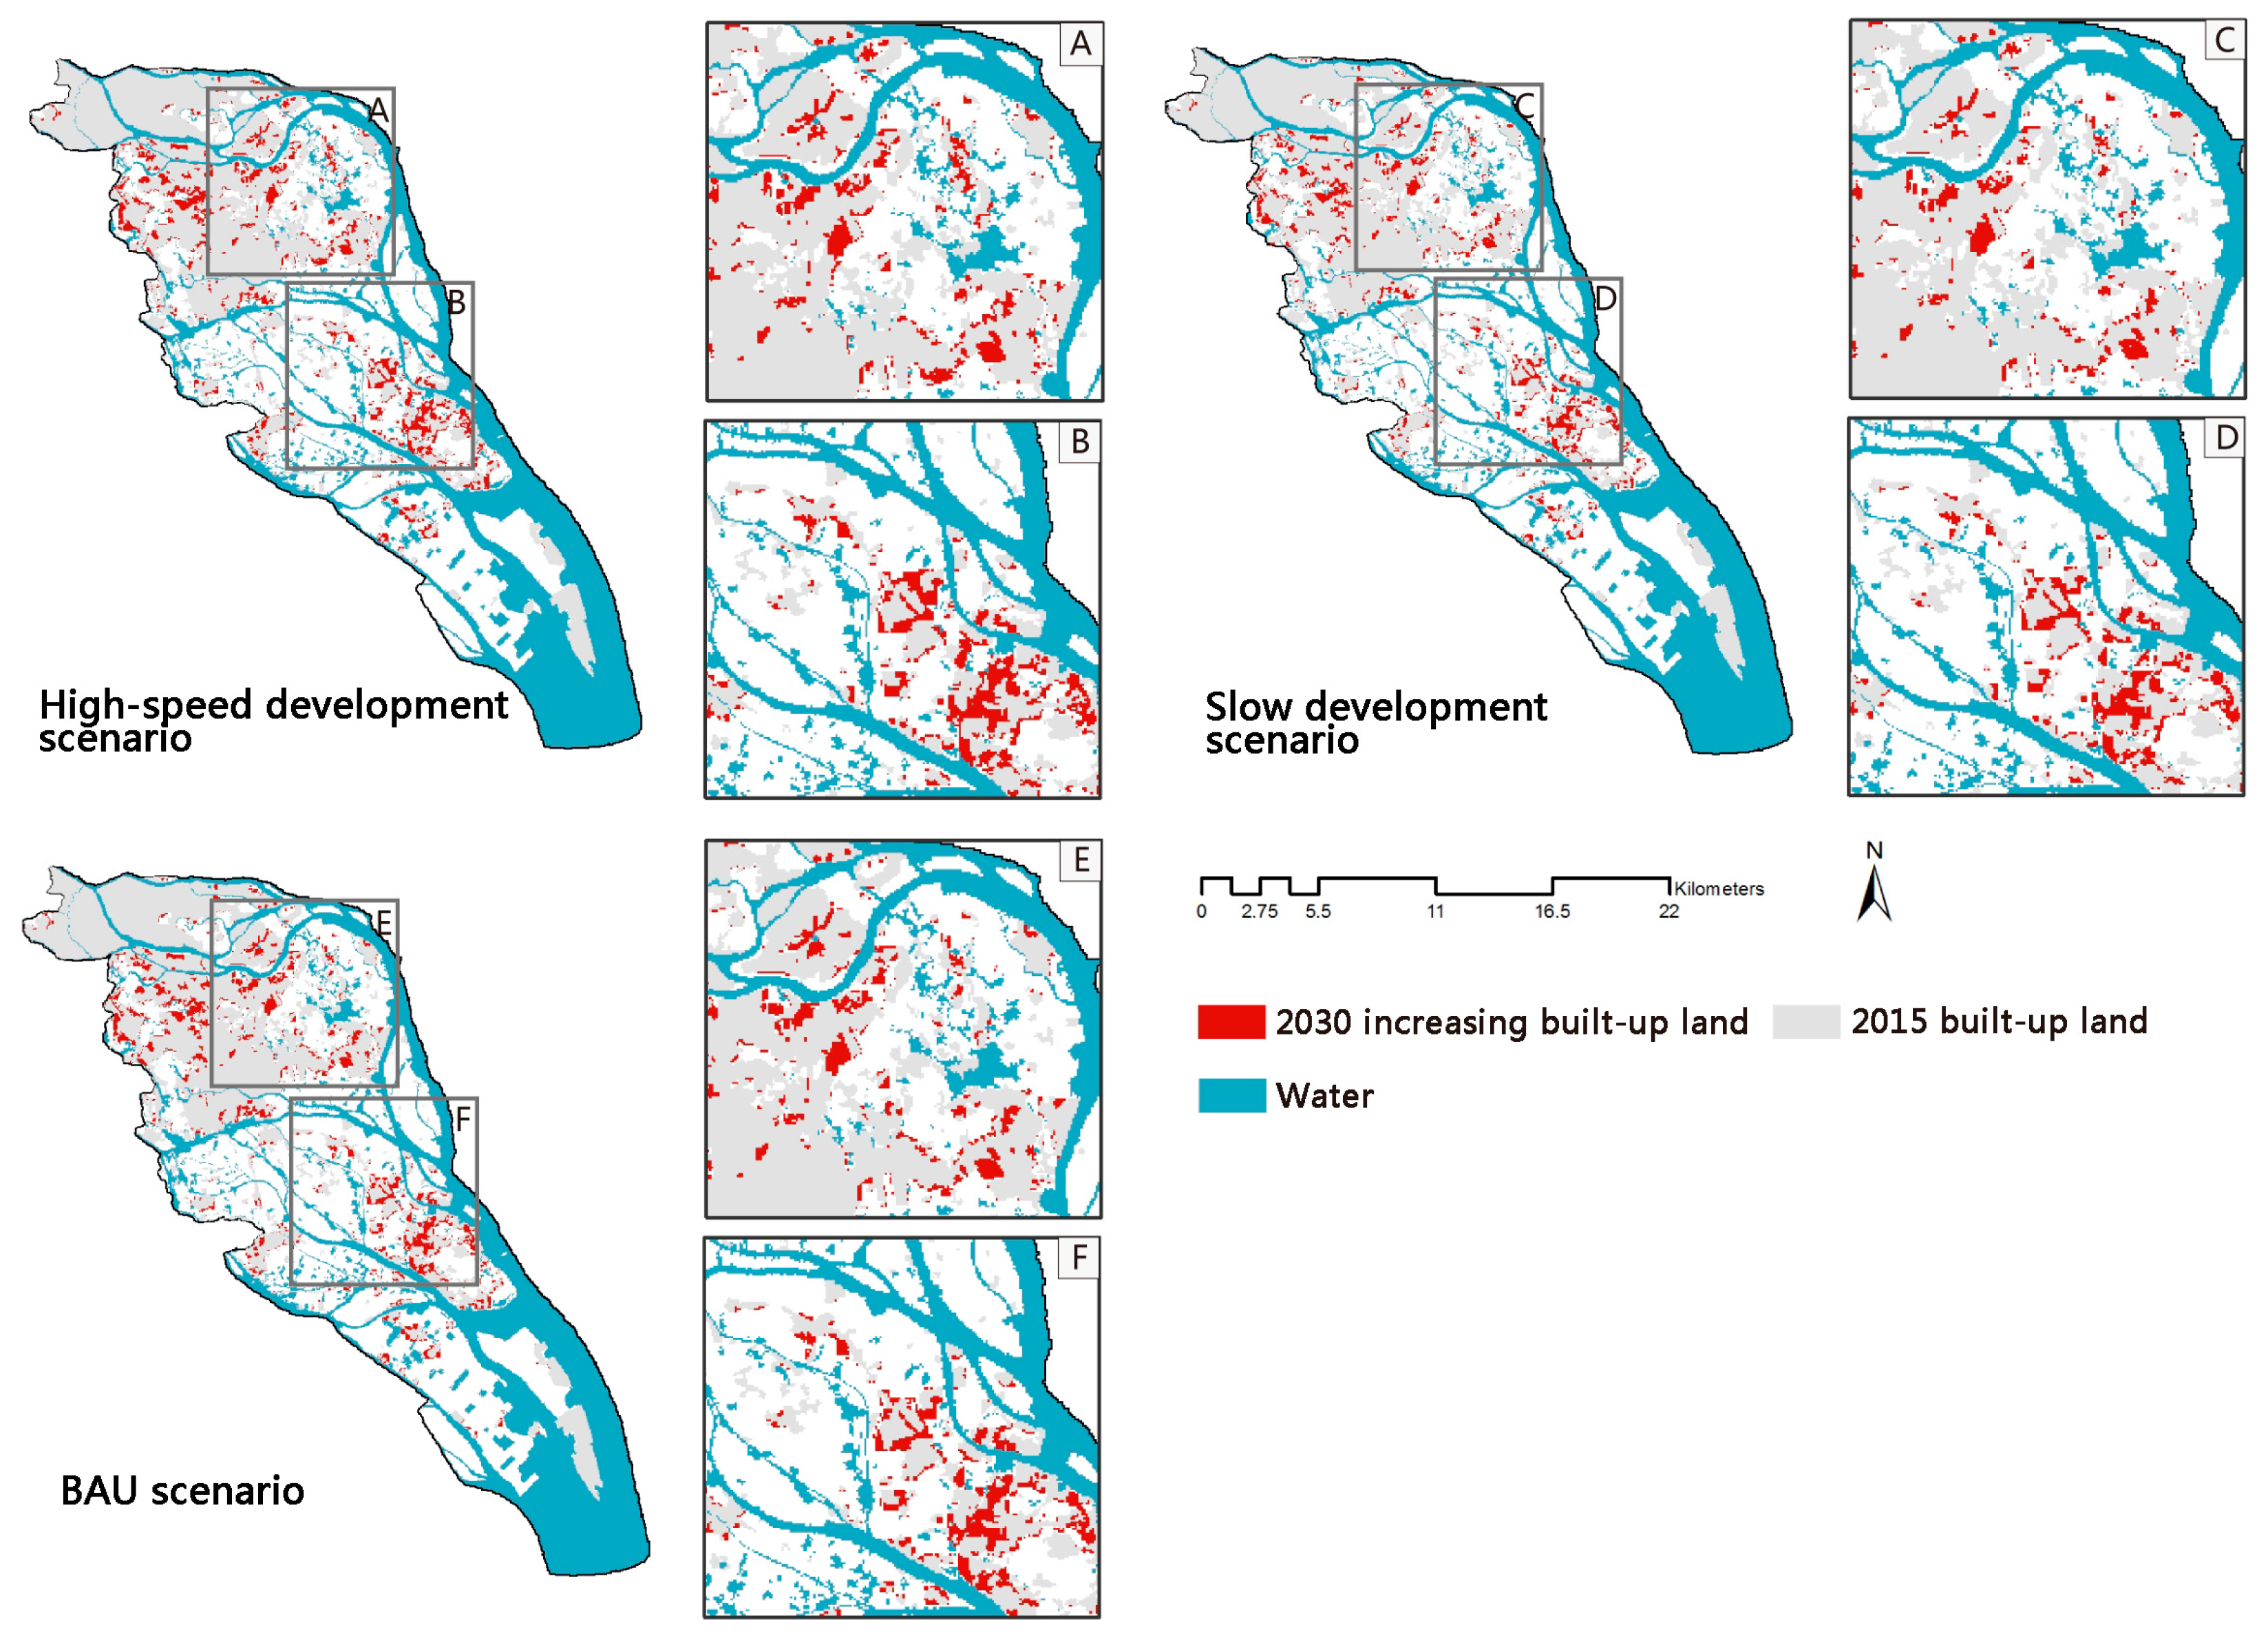
3.1.5. Spatial Optimization Results of the Urbanization Rate Scenarios under the Influence of Different Policies

Compared to that of the BAU scenario, the integrated fitness function value of the high-speed development scenario was found to decrease by about 0.009, while that of the slow development scenario increased by about 0.011. This indicates that controlling the scale of urban expansion via the spatial planning policy can effectively reduce the negative impacts of urbanization in the Guangzhou estuary, as shown in Table 2 and Figure 9. From the analysis of the fitness function values of each objective, compared with the BAU scenario, the costs of the probability of the development of built-up land, exposure to coastal flooding, land conversion, and spatial planning were reduced by about 0.003, 0.001, 0.003, and 0.005, respectively. This new built-up land will be selected in areas facing coastal flood exposure or a low development probability, those converted from forested land and water bodies where the land conversion cost is higher, or those outside the spatial planning area. In contrast, in the mitigation development scenario, as compared to the normal development scenario, the changes in the development probability of built-up land and the coastal flood exposure were not significant. The land conversion cost and the spatial planning cost were both about 0.005 higher, which is favorable for protecting forest land and water bodies with ecological and environmental benefits.

3.2. Model Robustness Verification

The NSGA-II algorithm, a classical heuristic algorithm, has certain uncertainties in the optimal solution search process that can affect the validity of the spatial optimization solution. Therefore, the stability of the results of the multi-objective NSGA-II optimization model must be verified. Thus, the assumption considered in this study was that each objective weight was 0.25. Five repetitive experiments were conducted using the same simulation environment, the optimal solution was computed for each experiment, and the matrix data were converted into raster space data that were converted, once again, into vector space data through the ArcGIS platform. Using the Overlay function in the ArcGIS toolbox, the spatial distribution and the number of overlapping parts in the results of the five repeated simulation experiments were determined. The results show that the overlapping portion of the optimal solution found in the five simulations accounted for 90.21% of the totally new area in 2030, as shown in Figure 10.
In summary, it was proved that the multi-objective NSGA-II algorithm developed in this study can search for an effective optimized layout with strong robustness via continuous evolutionary iterations. Therefore, as an effective spatial optimization aid for decision-making, it can provide a scientific basis for planners and relevant government spatial planning departments to identify priority development areas in urbanized coastal areas.

4. Discussion

4.1. Review of Simulation Results

Applying the proposed framework to optimize built-up land layout in 2030, improvements were observed for each scenario to different degrees between the compact spatial evolution path and the decentralized spatial evolution path. Based on scenarios with different target weights, and regardless of the single- or multiple-objective priority, the change in the target development probability of construction land was not found to be significantly affected by the weights in both the single-objective-first and multi-objective-first scenarios. Therefore, it is likely that the future spatial development strategy of the Guangzhou estuary region will favor the spatial layout scenario that meets the spatial planning objectives via the reduction of coastal flood exposure and the decrease of the land conversion cost.
Additionally, reducing the scale of future urban expansion by controlling the urbanization rate leads to the increased probability of built-up land development and the increased effectiveness of spatial planning policy implementation. Simultaneously, this aims to reduce future coastal flood exposure and land conversion costs. This is an effective strategy to enhance the value of the future comprehensive spatial fitness function. It also demonstrates the effectiveness of the algorithm developed in this study for different optimization needs and multi-objective spatial optimization.
In summary, the multi-objective NSGA-II spatial optimization model constructed in this study achieved good spatial optimization results under complex environments and constraints. It can also provide a scientific basis for governments and planners to formulate spatial optimization policies.

4.2. Flood Adaptation Strategies and Policies

After the design of each objective weight to define different development scenarios, the spatial optimization results can help decision-makers determine the priority development areas using different scenarios for the future Guangzhou estuary area. However, even with the support of a multi-objective spatial optimization decision mechanism, the coastal flood exposure of all construction sites cannot be circumvented by using only multi-objective spatial optimization results, regardless of which development scenario is implemented for future urban spatial development. Therefore, further development of coastal flood response strategies is required.
From the long-term perspective, to achieve SDG 11.5, the Guangzhou estuary must generate multi-scale solutions and spatial form. This long-term vision should be achieved through spatial design to support spatial transformation as an integrated activity. As one powerful approach, backcasting can help designers and policymakers organize this ambitious vision more realistically [33]. The achievement of SDG 11.5 requires the utilization of knowledge about natural and urban systems to formulate short-term strategic projects and actions to explore possible solutions and new knowledge. By arranging these strategic projects and actions at adaptive transformation path points, designers and policymakers can implement these solutions step by step to achieve SDG 11.5.
In some areas in the Guangzhou estuary that must face unavoidable coastal flooding impacts, flood risk management is carried out by both engineering and non-engineering strategies. By incorporating the concepts of resilient cities and nature-based solutions into the spatial planning of the area, its safety can be enhanced by raising the ground elevation of the construction area and building dikes in flood-hazard-affected areas. Multi-scale solutions based on the natural environment of the river network and the coast of the Guangzhou estuary can also be arranged to allow the region to effectively cope with the increasingly severe coastal flooding. The protection of floodplains and the construction of coastal mangroves, sand dunes, and salt marsh systems will be considered propriety strategies to deal with coastal flooding. As one of the critical tools used in the decision-making process, the model developed in this research can be used to explore the possible priority development areas in the future, providing new knowledge to bridge the gap between the limited experience of experts and the best spatial planning solutions. In summary, the experience of spatial planning and flood management policies in the Guangzhou estuary can serve as an example to help similar coastal cities deal with coastal flooding to achieve SDG 11.5 by 2030.

4.3. Limitations and Future Work

As this research was focused on coastal flooding, the challenge of waterlogging was not considered in the computational model. Moreover, due to the lack of a dike system, which is an essential element of a flood defense system, it was not included in this study. In an urban environment, multi-objective NSGA-II spatial optimization without flood risk management may cause certain inevitable deviations in the placement of key development areas. In addition, as in the case of other similar research, the simulation parameters used in this study were characterized by some uncertainty. Thus, more research must be conducted in the future, when more solid data will be available, to obtain more precise outputs. In addition, according to different target preferences, other SDG can be included in multi-objective NSGA-II spatial optimization function design to achieve better sustainability in different spatial development areas.

5. Conclusions

The achievement of flood mitigation in urbanizing deltas is crucial for coastal cities, especially those in low-lying areas. To achieve SDG 11.5, a new compact and decentralized spatial evolution path decision-making support tool was developed to explore new priority development areas driven by economic development as projected in 2030. By considering the safety and sustainability needs of the future development of the Guangzhou estuary area, the multi-objective genetic algorithm explores the possibility of a new built-up layout in 2030. The results show that, with reference to the 2030 BAU scenario (the compact spatial evolution path), comparing the FLUS simulation scenario (the decentralized spatial evolution path) to the multi-objective NSGA-II spatial optimization scenario revealed an increase in the integrated fitness function value for the second scenario from 0.618 to 0.771 (an increase equivalent to 0.153 or about 24.75%). In addition, different development scenarios were constructed by setting different target weights. When compared to those of the FLUS simulation scenarios, the fitness function values of the optimization results of each scenario exhibited better results at different levels. This demonstrated that the Guangzhou estuary area adopted a compact spatial evolution path and may reap additional benefits.
From the perspective of achieving SDG 11.5 in the flood mitigation path of coastal cities, the multi-objective NSGA-II spatial optimization model allows for the identification of priority development areas in 2030. As a powerful tool in spatial planning decision-making, it provides not only a comprehensive understanding of the conflict between urban sprawl and the expansion of the flooded area in 2030, but also a new perspective from which to extend the edge of knowledge to explore the possible new built-up land layout to achieve SDG 11.5.

Author Contributions

Conceptualization, W.L. and Y.S.; methodology, W.L.; software, W.L.; resources, Y.S.; writing—original draft preparation, W.L. and S.N.; writing—review and editing, W.L. and S.N.; visualization, W.L. All authors have read and agreed to the published version of the manuscript.

Funding

This work was supported by the National Natural Science Foundation of China (grant number: 51761135025 and 51778233).

Data Availability Statement

Data are contained withing the article.

Conflicts of Interest

The authors declare no conflicts of interest.

References

  1. Tellman, B.; Sullivan, J.A.; Kuhn, C.; Kettner, A.J.; Doyle, C.S.; Brakenridge, G.R.; Erickson, T.A. Satellite imaging reveals increased proportion of population exposed to floods. Nature 2021, 596, 80–86. [Google Scholar] [CrossRef]
  2. Chen, G.; Li, X.; Liu, X.; Chen, Y.; Liang, X.; Leng, J.; Wu, X.; Liao, W.; Oiu, Y.; Wu, Q.; et al. Global projections of future urban land expansion under shared socioeconomic pathways. Nat. Commun. 2020, 11, 537. [Google Scholar] [CrossRef]
  3. Hallegatte, S.; Green, C.; Nicholls, R.J.; Corfee-Morlot, J. Future flood losses in major coastal cities. Nat. Clim. Chang. 2013, 3, 802–806. [Google Scholar] [CrossRef]
  4. Nicholls, R.J.; Lincke, D.; Hinkel, J.; Brown, S.; Vafeidis, A.T.; Meyssignac, B.; Hanson, S.E.; Merkens, J.-L.; Fang, J. A global analysis of subsidence, relative sea-level change and coastal flood exposure. Nat. Clim. Chang. 2021, 11, 338–342. [Google Scholar] [CrossRef]
  5. Kirezci, E.; Young, I.R.; Ranasinghe, R.; Muis, S.; Nicholls, R.J.; Lincke, D.; Hinkel, J. Projections of global-scale extreme sea levels and resulting episodic coastal flooding over the 21st Century. Sci. Rep. 2020, 10, 11629. [Google Scholar] [CrossRef]
  6. Barragán, J.M.; de Andrés, M. Analysis and trends of the world’s coastal cities and agglomerations. Ocean Coast. Manag. 2015, 114, 11–20. [Google Scholar] [CrossRef]
  7. Wheeler, B.W.; White, M.; Stahl-Timmins, W.; Depledge, M.H. Does living by the coast improve health and wellbeing? Health Place 2012, 18, 1198–1201. [Google Scholar] [CrossRef]
  8. Best, J. Anthropogenic stresses on the world’s big rivers. Nat. Geosci. 2019, 12, 7–21. [Google Scholar] [CrossRef]
  9. Smith, A.; Bates, P.D.; Wing, O.; Sampson, C.; Quinn, N.; Neal, J. New estimates of flood exposure in developing countries using high-resolution population data. Nat. Commun. 2019, 10, 1814. [Google Scholar] [CrossRef]
  10. Kulp, S.A.; Strauss, B.H. New elevation data triple estimates of global vulnerability to sea-level rise and coastal flooding. Nat. Commun. 2019, 10, 4844. [Google Scholar] [CrossRef]
  11. Hinkel, J.; Jaeger, C.; Nicholls, R.J.; Lowe, J.; Renn, O.; Peijun, S. Sea-level rise scenarios and coastal risk management. Nat. Clim. Chang. 2015, 5, 188–190. [Google Scholar] [CrossRef]
  12. Sachs, J.D.; Schmidt-Traub, G.; Mazzucato, M.; Messner, D.; Nakicenovic, N.; Rockström, J. Six Transformations to achieve the Sustainable Development Goals. Nat. Sustain. 2019, 2, 805–814. [Google Scholar] [CrossRef]
  13. Hirabayashi, Y.; Mahendran, R.; Koirala, S.; Konoshima, L.; Yamazaki, D.; Watanabe, S.; Kim, H.; Kanae, S. Global flood risk under climate change. Nat. Clim. Chang. 2013, 3, 816–821. [Google Scholar] [CrossRef]
  14. Vousdoukas, M.I.; Mentaschi, L.; Voukouvalas, E.; Bianchi, A.; Dottori, F.; Feyen, L. Climatic and socioeconomic controls of future coastal flood risk in Europe. Nat. Clim. Chang. 2018, 8, 776–780. [Google Scholar] [CrossRef]
  15. Wang, W.; Yang, S.; Stanley, H.E.; Gao, J. Local floods induce large-scale abrupt failures of road networks. Nat. Commun. 2019, 10, 2114. [Google Scholar] [CrossRef]
  16. Lin, W.; Sun, Y.; Nijhuis, S.; Wang, Z. Scenario-based flood risk assessment for urbanizing deltas using future land-use simulation (FLUS): Guangzhou Metropolitan Area as a case study. Sci. Total Environ. 2020, 739, 139899. [Google Scholar] [CrossRef]
  17. Dryden, R.; Anand, M.; Lehner, B.; Fluet-Chouinard, E. Do we prioritize floodplains for development and farming? Mapping global dependence and exposure to inundation. Glob. Environ. Chang. 2021, 71, 102370. [Google Scholar] [CrossRef]
  18. Francesch-Huidobro, M.; Dabrowski, M.; Tai, Y.; Chan, F.; Stead, D. Governance challenges of flood-prone delta cities: Integrating flood risk management and climate change in spatial planning. Prog. Plan. 2017, 114, 1–27. [Google Scholar] [CrossRef]
  19. Liao, K.-H.; Le, T.A.; Nguyen, K.V. Urban design principles for flood resilience: Learning from the ecological wisdom of living with floods in the Vietnamese Mekong Delta. Landsc. Urban Plan. 2016, 155, 69–78. [Google Scholar] [CrossRef]
  20. Ghaderian, M.; Veysi, F. Multi-objective optimization of energy efficiency and thermal comfort in an existing office building using NSGA-II with fitness approximation: A case study. J. Build. Eng. 2021, 41, 102440. [Google Scholar] [CrossRef]
  21. Zhai, Y.; Wang, Y.; Huang, Y.; Meng, X. A multi-objective optimization methodology for window design considering energy consumption, thermal environment and visual performance. Renew. Energy 2019, 134, 1190–1199. [Google Scholar] [CrossRef]
  22. Caparros-Midwood, D.; Barr, S.; Dawson, R. Optimised spatial planning to meet long term urban sustainability objectives. Comput. Environ. Urban Syst. 2015, 54, 154–164. [Google Scholar] [CrossRef]
  23. Caparros-Midwood, D.; Barr, S.; Dawson, R. Spatial optimization of future urban development with regards to climate risk and sustainability objectives. Risk Anal. 2017, 37, 2164–2181. [Google Scholar] [CrossRef] [PubMed]
  24. Ma, W.; Zhou, X.; Zhu, H.; Li, L.; Jiao, L. A two-stage hybrid ant colony optimization for high-dimensional feature selection. Pattern Recognit. 2021, 116, 107933. [Google Scholar] [CrossRef]
  25. Chen, Q.; Hu, X. Design of intelligent control system for agricultural greenhouses based on adaptive improved genetic algorithm for multi-energy supply system. Energy Rep. 2022, 8, 12126–12138. [Google Scholar] [CrossRef]
  26. Li, X.; Parrott, L. An improved Genetic Algorithm for spatial optimization of multi-objective and multi-site land use allocation. Comput. Environ. Urban Syst. 2016, 59, 184–194. [Google Scholar] [CrossRef]
  27. Xiong, L.; Nijhuis, S. Exploring Spatial Relationships in the Pearl River Delta. In Cities as Spatial and Social Networks, Human Dynamics in Smart Cities; Ye, X., Liu, X., Eds.; Springer International Publishing: Cham, Switzerland, 2019; pp. 147–163. [Google Scholar] [CrossRef]
  28. Lei, Y.; Liu, C.; Zhang, L.; Wan, J.; Li, D.; Yue, Q.; Guo, Y. Adaptive governance to typhoon disasters for coastal sustainability: A case study in Guangdong, China. Environ. Sci. Policy 2015, 54, 281–286. [Google Scholar] [CrossRef]
  29. Weng, Q. A historical perspective of river basin management in the Pearl River Delta of China. J. Environ. Manag. 2007, 85, 1048–1062. [Google Scholar] [CrossRef]
  30. Liang, X.; Liu, X.; Li, X.; Chen, Y.; Tian, H.; Yao, Y. Delineating multi-scenario urban growth boundaries with a CA-based FLUS model and morphological method. Landsc. Urban Plan. 2018, 177, 47–63. [Google Scholar] [CrossRef]
  31. Liu, X.; Liang, X.; Li, X.; Xu, X.; Ou, J.; Chen, Y.; Li, S.; Wang, S.; Pei, F. A future land use simulation model (FLUS) for simulating multiple land use scenarios by coupling human and natural effects. Landsc. Urban Plan. 2017, 168, 94–116. [Google Scholar] [CrossRef]
  32. Liang, X. The Development and Application of the Future Land Use Simulation Model (FLUS) by Coupling Human and Natural Effects. Ph.D. Dissertation, School of Geography and Planning, Sun Yat-sen University, Guangzhou, China, 2018. [Google Scholar]
  33. Nijhuis, S. Landscape-Based Urbanism: Cultivating Urban Landscapes Through Design. In Design for Regenerative Cities and Landscapes, Contemporary Urban Design Thinking; Roggema, R., Ed.; Springer International Publishing: Cham, Switzerland, 2022; pp. 249–277. [Google Scholar] [CrossRef]
Figure 1. The study area of the Guangzhou estuary.
Land 13 00351 g001
Figure 2. The data used in this study.
Land 13 00351 g002
Figure 3. The overall framework of compact and decentralized spatial evolution paths.
Land 13 00351 g003
Figure 4. Iterative process for the integrated fitness function value.
Land 13 00351 g004
Figure 5. The results of spatial optimization in the BAU scenario until the convergence state was reached.
Land 13 00351 g005
Figure 6. Matrix scatter plot of 150 generation solution set.
Land 13 00351 g006
Figure 7. The comparison of the BAU scenario and FLUS simulation scenario results.
Land 13 00351 g007
Figure 8. The comparison of the results of the scenarios with different target weights and the FLUS simulation scenario.
Land 13 00351 g008
Figure 9. The results of the spatial optimization of the urbanization rate scenarios.
Land 13 00351 g009
Figure 10. The results of model robustness verification.
Land 13 00351 g010
Table 1. Spatial optimization scenarios of different target weight combinations.
ScenarioThe Probability of Built-Up LandThe Exposure to Coastal FloodingThe Cost of
Land Conversion
The Cost of
Spatial
Planning
A0.50.170.170.16
B0.170.50.170.16
C0.170.170.50.16
D0.170.170.160.5
E0.40.40.10.1
F0.10.10.40.4
Table 2. The results for scenarios with the urbanization rate scenarios.
ScenarioThe Probability of Built-Up LandThe Exposure to Coastal FloodingThe Cost of Land ConversionThe Cost of Spatial PlanningThe Value of the Integrated Fitness Function
BAU0.1350.2480.1840.2020.768
The high-speed development 0.1320.2470.1820.1970.759
The slow development0.1350.2480.1890.2070.779
Disclaimer/Publisher’s Note: The statements, opinions and data contained in all publications are solely those of the individual author(s) and contributor(s) and not of MDPI and/or the editor(s). MDPI and/or the editor(s) disclaim responsibility for any injury to people or property resulting from any ideas, methods, instructions or products referred to in the content.

