Article

Revealing the Spatial-Temporal Evolution and Obstacles of Ecological Security in the Xiamen-Zhangzhou-Quanzhou Region, China

1
School of Land Science and Technology, China University of Geosciences (Beijing), Beijing 100083, China
2
Key Laboratory of Land Consolidation and Rehabilitation, Ministry of Natural Resources, Beijing 100035, China
*
Author to whom correspondence should be addressed.
Land 2024, 13(3), 339; https://doi.org/10.3390/land13030339
Submission received: 21 January 2024 / Revised: 4 March 2024 / Accepted: 5 March 2024 / Published: 6 March 2024
(This article belongs to the Section Land, Biodiversity, and Human Wellbeing)

Abstract

:
Climate change and human activities have caused various ecological risks to coastal urban agglomerations. Ecological security refers to the state of health of an ecosystem and its integrity. An objective and comprehensive evaluation of ecological security is significant for protecting the structure and function of coastal ecosystems. The driving force–pressure–state–impact–response (DPSIR) model was used to construct a dynamic simulation model of ecological security in the Xiamen–Zhangzhou–Quanzhou region (XZQR), located on the eastern coast of China. The ecological security level (ESL) characteristics of the spatial and temporal patterns were evaluated by calculating the ecological security index (ESI). Obstacle factors were analyzed as well. The results show the following: (1) From 2011 to 2021, the average ESI rose from 0.238 to 0.686 and went through a relatively insecure stage (2011–2015), a critical stage (2016–2019), and a relatively secure stage (2020–2021). (2) The ESI level in Quanzhou was higher in the early stage, and the level of ecological security in Zhangzhou showed a significant rising trend, increasing by 0.541. Its increase depended on increases in the impact layer. (3) The impact layer is the main obstacle layer affecting the ESL, and the main obstacles include CO2 emissions (0.117), annual rainfall (0.091), general public budget expenditures (0.082), GDP growth rates (0.082), and green coverage in built-up areas (0.075). Therefore, we recommend promoting the complementary advantages of the XZQR and implementing ecological restoration projects.

1. Introduction

The industrial revolution has vigorously driven global economic development, but rapid economic growth has led to the deterioration of the environment [1]. How to coordinate economic development and simultaneously protect the ecological environment has become a significant issue of concern [2]. Ecological security refers to the state of an ecosystem which can provide services for the sustainable development of human society and the economy within a certain space and time range [3]. An ecosystem is a unified whose elements interact with each other through energy flow and material cycling on a specific spatial and temporal scale, as well as in which interactions occur both between various organisms and between a community of organisms and its inorganic environment. The concept of an ecosystem includes a series of natural elements such as water, soil, and air. It is the sum of various ecological factors and relationships under natural conditions, as well as forming the background conditions supporting human survival and sustainable social development [4]. Ensuring the ecological security of urban construction has become an essential prerequisite for achieving sustainable development, and the construction of an ecological civilization has gradually become an important goal of national development and construction [5,6]. Therefore, understanding the security status of a regional ecological environment is significant for urban sustainable development [7].
In 1989, the International Institute for Applied Systems Analysis (IIASA) put forward the concept of ecological security for the first time [8]. It refers to a state in which people’s life, health, well-being, fundamental rights, sources of livelihood security, necessary resources, social order, and the human ability to adapt to environmental changes are not threatened [9,10]. Ecological security is affected by the environmental background, land use and cover change, social and economic development, and policy implementation [11]. In the 1960s, ecological security evaluation was introduced as a tool to assess environmental conditions, and is now the core of ecological security research [12]. Ecological security evaluation is the basis for assessing a region’s ecological status and ecological environmental pressure, issuing early warnings on ecological security, and making ecological security management decisions [13]. Moreover, it can also provide a scientific basis for regional urban planning, environment governance, and ecological policy implementation [14]. From a research perspective, ecological security evaluation is linked to economic development, social construction, and environmental protection, mainly focusing on spatio-temporal patterns, driving factors, evolutionary mechanisms, simulations, and early warnings [15,16,17]. Furthermore, relevant research areas involve wetland ecological security [18], tourism ecological security [19], marine ecological security [5,20], and cultivated land ecological security [21].
With the continuous development of urbanization, the conflict between humans and land has become increasingly prominent, and environmental problems have emerged one after another. Scholars have carried out in-depth research on the evaluation method of ecological security. It can be divided into four categories: mathematical model method, ecological model method, digital model method, and landscape model method. Model characterization methods such as the ecological footprint model are widely used to determine the resource consumption demand of human activities and whether natural assets are overused [22]. However, they often fail to identify adverse factors affecting ecological security. Due to data limitations, they cannot describe the heterogeneity of ecological security well. The second category are mathematical model methods. In these methods, the general determination of the ecological security index (ESI) is achieved by building a reasonable index system and determining the weight of each index. After standardization, each index and its corresponding weight are weighted and summed to obtain the comprehensive value, namely the ESI, to quantitatively evaluate the research object. The current state of regional ecological security is measured from multiple angles, and the problems existing in the ecological environment are assessed [10]. The ESI is comprehensive, integrated, and hierarchical. The evaluation results can objectively reflect the current ecological and environmental conditions, providing data support and references for formulating ecological and environmental protection policies and strategies [12,23]. It helps people to make reasonable use of natural resources and not exceed the ecological carrying capacity and to achieve harmony between human society and the natural environment [24].
Determining a reasonable and rigorous index system is the basis of ensuring the accuracy of ecological security evaluation results [25]. Scientific evaluation methods are a decisive factor in measuring whether research results are comprehensive, scientific, and accurate [26,27]. Many scholars use different evaluation methods to evaluate ecological security in different regions [28]. The DPSIR model was proposed by the Organization for Economic Cooperation and Development (OECD) in 1993 and has been popularized in policy making and research. It is a suitable method for evaluating ecological security because it combines the characteristics of the driving force–state–response (DSR) model and the pressure–state–response (PSR) model, which can effectively reflect the cause-and-effect relationships of a system and integrate elements of resources, development, and human health. In contrast, the PSR model only focuses on the three links of pressure, state, and response, and lacks the assessment of environmental impacts, while the DSR model emphasizes the driving factors in the pressure link but assesses environmental impacts relatively little. The DPSIR model, on the other hand, makes the analysis more comprehensive and accurate by introducing the impact link. This model fully reflects the impact of social activities on the ecological environment and can also measure the impact of changes in environmental status indexes. It is comprehensive and inherits the advantages of previous models [29]. Therefore, the DPSIR model, as an effective method to explore the impact of socio-economic development on the ecological environment and the relationship between the two, has been widely used by scholars [4,21].
Academics have carried out much research on ecological security evaluation and obtained abundant research results. From the perspective of research areas, most previous studies are mainly concentrated on interprovincial administrative units or prefecture–city administrative units. Urban agglomerations in relatively advanced stages of development, such as the Beijing–Tianjin–Hebei urban agglomeration, the Yangtze River Delta urban agglomeration, and the Pearl River Delta urban agglomeration have been discussed [13,17,30,31]. However, there has been little discussion on urban agglomerations such as the Xiamen–Zhangzhou–Quanzhou region (XZQR), which is relatively less developed; Research on ecological security evaluation based on county areas has been especially scarce. The main factors of ecological security are different depending on geographical heterogeneity. Research on developing urban agglomerations helps to improve the existing problems and deficiencies in their current development process and then promote the further development of urban agglomerations.
In this paper, an interpretation of remote sensing images and measured data is used to achieve more accurate evaluation results. Constructing objective and accurate evaluation index factors is an essential prerequisite for the ecological security evaluation of coastal urban agglomerations. In selecting ecological security evaluation indicators, economic and social factors have predominantly been considered in previous research, while other factors affecting ecological security (such as food, energy supply, etc.) have not been included. What is more, previous indicators used to evaluate the level of ecological security are mainly statistical data. As the XZQR is located in the southeast coastal region, the ecological environment of this coastal urban agglomeration is more complex than that of inland agglomerations. The ecological security evaluation of coastal urban agglomerations needs to comprehensively consider index factors relevant to the coastal zone and the ocean while combining the existing index factors used in research on inland areas.
Finally, obstacle degree analysis is widely used to measure the gap between the current ecological security level (ESL) and the ideal state. It has shown good performance in analyzing the internal factors and functions of systems. Previous research has found that studying relevant factors may help identify obstacles to ecological security [32]. For developing urban agglomerations, especially using the more refined research scale of the county area, it is more meaningful to identify the key factors that affect the level of ecological security. Based on the evaluation of ecological security, it is necessary to determine the obstacle degree of the influencing factors.
As an important economic center in Fujian Province, the XZQR is faced with specific ecological problems in the process of economic development. Compared with more highly developed urban agglomerations, this region receives less attention. It is of great significance to conduct a fine-grained ecological security evaluation on a county scale and identify the obstacles affecting ecological security. The purpose of this study is to use the DPSIR model to calculate the ESI, which is used to measure the ESL in the XZQR; determine the critical obstacle factors; and provide a theoretical basis for ecosystem management in coastal areas. Firstly, the ESI layers are constructed based on the DPSIR model. Then, using the multi-level weighted composite index method and obstacle degree model, the temporal and spatial evolution characteristics and main obstacle factors of the ESL in the XZQR from 2011 to 2021 are analyzed. The findings are expected to provide a scientific reference for formulating environmental protection policies and strategies in coastal urban agglomerations.

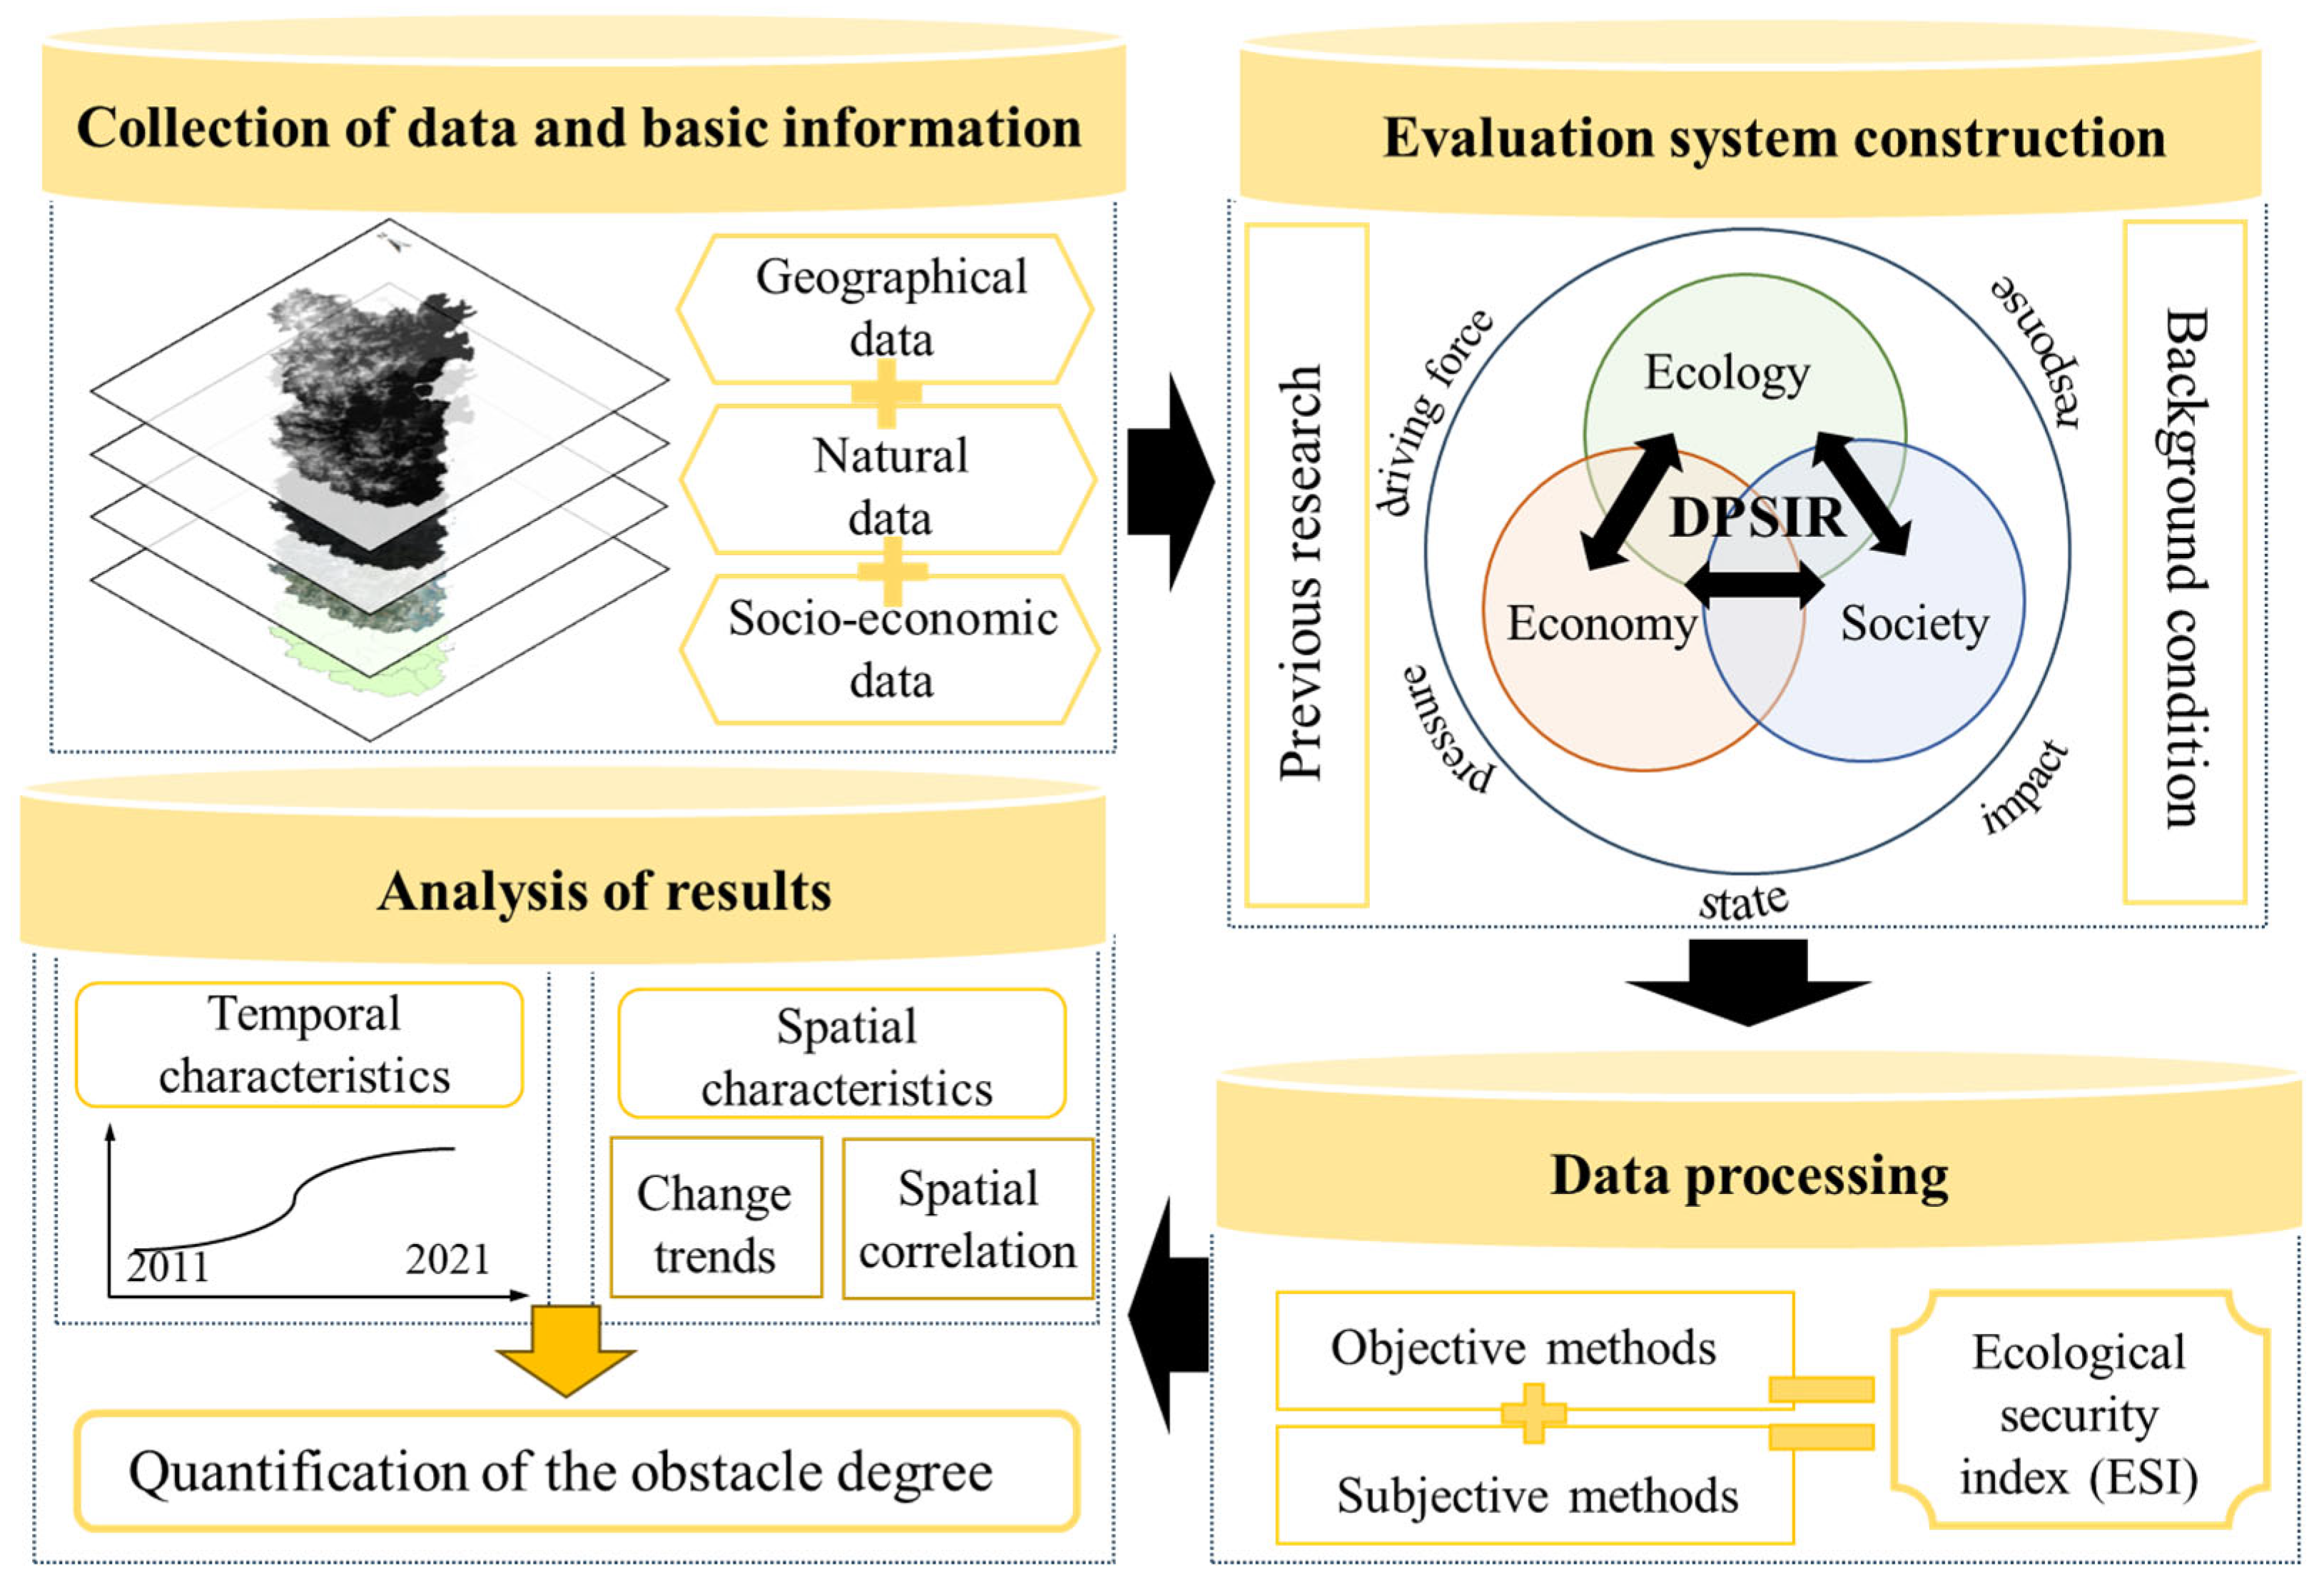
2. Materials and Methods

2.1. Study Area

The XZQR is a coastal urban agglomeration located in the southern part of Fujian Province, and its geographic location is shown in Figure 1. It is composed of 29 counties, districts, and cities in Xiamen, Zhangzhou, and Quanzhou (Figure 1). (Due to the lack of some data on Jinmen counties, 28 counties and cities are discussed in this paper.) It is also the economic development center of Fujian Province, accounting for more than 75% of the total economy of Fujian Province. Specifically, Xiamen is an international city with highly developed finance, economy, and tourism; Zhangzhou has a unique natural geography and a good agricultural base; and Quanzhou, a historic and cultural city, has a strong industrial base.
Under the continuous influence of human activities, a series of common urban problems such as environmental pollution, resource shortage, population expansion, and land use shortage have affected the area and are deteriorating. They negatively affect the region’s resource carrying capacity and accelerate the frequent occurrence of natural disasters, threatening the ecological security and sustainable development of the region. According to the Statistical Yearbook of Fujian Province, the total GDP of the XZQR, whose land area accounts for only 20.87% of Fujian Province, was CNY 25,612.21 billion in 2022, accounting for 48.22% of the province’s GDP. Although the annual average concentration of PM2.5 in the XZQR has decreased in recent years, it is still much higher than the latest World Health Organization (WHO) target value of 5 μg m−3 for PM2.5 [33]. In addition, due to the wide distribution of mountains and hills, the soil texture is mainly composed of ultisols, inceptisols, and mountain soils. The area suffers from a high frequency of natural disasters, resulting in severe soil and water loss and posing a serious challenge to ecological security in the region [34].

2.2. Data Sources

This paper takes a total of 28 counties, districts, and cities in Xiamen, Zhangzhou, and Quanzhou as the research object (due to the partial absence of data in Kinmen, some data from the Taiwan investment area before 2012 are missing, so this area will not be discussed in this paper), with a time span from 2011 to 2021, and calculates the ESI as well as evaluates the ESL of the XZQR by constructing a DPSIR model to select indexes. The data types include economic development, social development, resource exploitation, population situation, natural environment, and other aspects. The data sources are shown in Table 1.

2.3. Research Methods

The ESI and ESL of the XZQR from 2011 to 2021 were calculated and evaluated by constructing an ecological security evaluation index layer for the coastal urban agglomeration using the DSPIR model, standardizing the data processing, calculating the weights of the indexes, determining the ESI values, and classifying the grades. The obstacle degree of each index was also calculated. The research framework is shown in Figure 2.

2.3.1. The DPSIR Model

The DPSIR model combines and extends the DSR model and the PSR model. It can effectively capture social, economic, human, and environmental factors and retrieve the relationship between multiple factors to comprehensively evaluate regional ecology and environment [14]. The DPSIR model fully reveals the causal relationship between the environment and human activities, providing a clear and simple framework for the research and evaluation of human activities and resource and environmental sustainability [35]. Based on the development characteristics of the XZQR, a clear index layer is constructed (Figure 3). Social and economic development is the “driving force”, which causes “pressure” on the regional ecological environment during the development process, resulting in changes in the “state” of the regional ecological environment and resource utilization, and these changes have a specific “impact” on the development of the city and human activities. In order to improve the current situation of the ecological environment, human beings should make an inevitable “response” to reduce pressure on the ecological environment and improve its state.

2.3.2. Index Selection

Factors affecting ecological security include economic, social, environmental, resource-related, and demographic factors, and each of them is interdependent and interrelated. The selection principle is mainly to consider the requirements of the DPSIR model, the current ecological environment of the study area, data availability, and previous relevant studies [24,35,36,37]. Firstly, the common indexes of the DPSIR subsystem, which are widely recognized, relatively significant, and have local characteristics, are summarized. We also make full reference to the background conditions of coastal urban agglomerations, such as the output value of aquatic products, sewage treatment rate, and other indicators.
The driving force (D) layer primarily consists of socio-economic and demographic indexes, influenced by human activities. These include per capita GDP, population growth rate, urbanization rate, various output values, etc.
The pressure (P) layer mainly considers the factors that cause specific damage and threats to the ecological environment in the process of the development of human society. It mainly includes massive discharges of pollutants and increases in population density.
The state (S) layer refers to the condition of the ecological environment under the influence of driving forces and pressure factors, based on the existing carrying capacity of the ecological environment, including various environmental conditions. For coastal cities, total aquatic products are also an important state measure.
The impact (I) layer refers to changes in human activities and adjustments to ecosystems due to environmental conditions, including the changes in environmental and industrial structures as well as demographic and economic changes.
The response (R) layer refers to the measures taken by human beings to improve the existing problems of the ecological environment in response to changes in the ecological environment. Generally, environmental protection measures and scientific and technological investment are defined as response indexes. For coastal cities, sewage treatment rates are also an important response measure.
In this paper, the ecological security evaluation index of the XZQR is divided into a criterion layers and index layers, and a total of 20 indexes are calculated (Table 2).

2.3.3. ESL Evaluation Methods

  • Original matrix normalization processing
In order to eliminate the positive or negative impact of different dimensions and sizes on the indexes, we standardized the selected indexes [17].
Benefit indexes:
X i j = x i j m i n ( x 1 j , , x n j ) m a x ( x 1 j , , x n j ) m i n ( x 1 j , , x n j )
Cost indexes:
X i j = m a x ( x 1 j , , x n j ) x i j m a x ( x 1 j , , x n j ) m i n ( x 1 j , , x n j )
where Xij and X′ij are the original and normalized values of the jth index in year i, respectively.
  • Calculation of the evaluation index weights
The commonly used weight calculation methods can be divided into subjective and objective methods, each with its advantages and disadvantages. In order to ensure the accuracy of the research results, this paper adopted a combination of subjective and objective methods. The entropy method and analytic hierarchy process were combined to determine the weight of each index.
The entropy method measures the disorder degree of a system’s state through information entropy and judges the relative amplitude of index change [11]. The calculation formula is as follows:
P i j = X i j i = 1 n X i j
e j = k i = 1 n P i j L n ( P i j )
W j = 1 e j j = 1 n ( 1 e j )
where X i j and W j are the data of each index factor and the weight of the jth index, respectively; k = 1/ln(n). When Pij = 0, then ln(Pij) is set to 0, although it should be undefined.
The analytic hierarchy process (AHP) is a quantitative analysis method used to solve multi-criterion decision problems [38]. In our study, the analytic hierarchy process consisted of three steps: (1) drawing up a hierarchical structure model: decision target layer, factor layer, and alternative layer; (2) construction of a judgment matrix: according to the weight results of AHP ecological security evaluation indicators combined with expert suggestions, a judgment matrix was constructed. A scale of 1 to 9 was used to quantify the relative importance of each indicator; (3) matrix consistency test: the judgment matrix was tested in Yaahp V11.0 software. If the consistency ratio was less than 0.1, the matrix satisfied the consistency requirements and the weight results were reasonable. All the judgment matrices in this study passed the consistency test and met the research criteria [39]. Through comparison and induction, complex problems were simplified into easy-to-handle modules, and the relative weights of each factor were obtained by combining subjective judgments and objective data to provide a scientific basis for decision-making [24].
  • Combined weight
The final weight was determined by combining the two results.
T i j = 1 / 2 ( W i j + P i j )
where Wij is the result of the entropy method and Pij is the result of the analytic hierarchy process.
  • Comprehensive evaluation
The weighted synthesis method calculated the ESI for the study area.
Y i = j = 1 n T i j X i j
Tij is the combined weight coefficient based on the analytic hierarchy process and the entropy weight method. X′ij is the result of the normalization of the original data. Yi is the ESI, which is used to reflect the ESL [40]. Results regarding the calculation of the factor layer weights are proven by existing studies [4,21,26].

2.3.4. Classification of the ESI

Based on the classification methods and evaluation levels in the literature, the critical classification value of the ESI was delimited according to the current situation of the XZQR. The security level corresponding to the ESI was divided as depicted in Table 3 [17,21,40]. Five security levels were formulated. The ESI ranges between 0 and 1; values closer to 1 indicate a higher level and a more desirable state; values closer to 0 indicate a lower level and less desirable state.

2.3.5. Exploratory Spatial Data Analysis

Exploratory spatial data analysis is a method to analyze spatial data by detecting the spatial correlation of variables [41]. If a variable is clustered in space, it has a certain correlation in a certain region.
  • Global spatial autocorrelation
Global spatial autocorrelation refers to the correlation in the whole research area and the general trend of the spatial correlation of a specific variable in the research area [40]. The statistical value is Moran’s I and the value range is [–1, 1]. When Moran’s I is positive, it indicates that the ESI presents a positive correlation in space, with an aggregation trend. If it is negative, it proves that there is a spatial dispersion tendency. When Moran’s I is 0, it indicates that the ESI has no correlation in space.
I = n i = 1 n j = 1 n W i j ( y i y ¯ ) ( y j y ¯ ) ( i = 1 n j = 1 n W i j ) i = 1 n ( y i y ¯ ) 2
where n is the number of units in the study area and Wij is the element value of the spatial weight matrix (adjacent counties are assigned 1, and non-adjacent counties are assigned 0). yi and yj represent the ith and jth space unit attribute values, respectively; y ¯ is the mean value of the attribute value of the space unit.
  • Local spatial autocorrelation
Local spatial autocorrelation can be used to discuss the local correlation of the study area and is a decomposition of Moran’s I, with the value range [–1, 1] [40]. The higher the value, the more concentrated the units of the spatial region with similar variable values. The lower the value, the more dispersed the units of spatial regions with similar variable values. The formula is as follows:
I i = n 2 i j W i j × ( x i x ¯ ) j W i j ( x j x ¯ ) j ( x j x ¯ ) 2
where a positive Ii indicates that a high value is surrounded by a high value (high–high) or a low value is surrounded by a low value (low–low). A negative Ii indicates that a low value is surrounded by a high value (low–high) or a high value is surrounded by a low value (high–low). It is usually characterized by a cluster map of local indicators of spatial association (LISA), which analyzes the degree of data aggregation based on the similarity of data in geospatial space. It compares each region with its neighboring regions and calculates a local Moran’s I for each region.

2.3.6. Obstacle Degree Analysis

In existing research on comprehensive evaluation models, the obstacle degree model is widely used to diagnose the factors affecting the development of things [21]. By calculating the obstacle degree of each index, the model can quantitatively identify the main obstacle factors to provide targeted suggestions for the sustainable development of the ESL. The formula is as follows:
P i j = 1 X i j
A i j = P i j × W j / i = 1 n P i j × W j × 100 %
U j = A i j
A ¯ i j = A i j n
U j ¯ = U j n
where Pij is the deviation between the jth index value and the standardized value; X′ij is the normalized index value; Wj is the index weight; Aij is the impact degree of each index on the ESL, that is, the obstacle degree of the index layer, and A ¯ i j is the average obstacle degree during the study period. Uj is the obstacle degree of each standard layer to the ESL, U j ¯ is the average obstacle degree during the study period, and n is the time interval.

3. Results

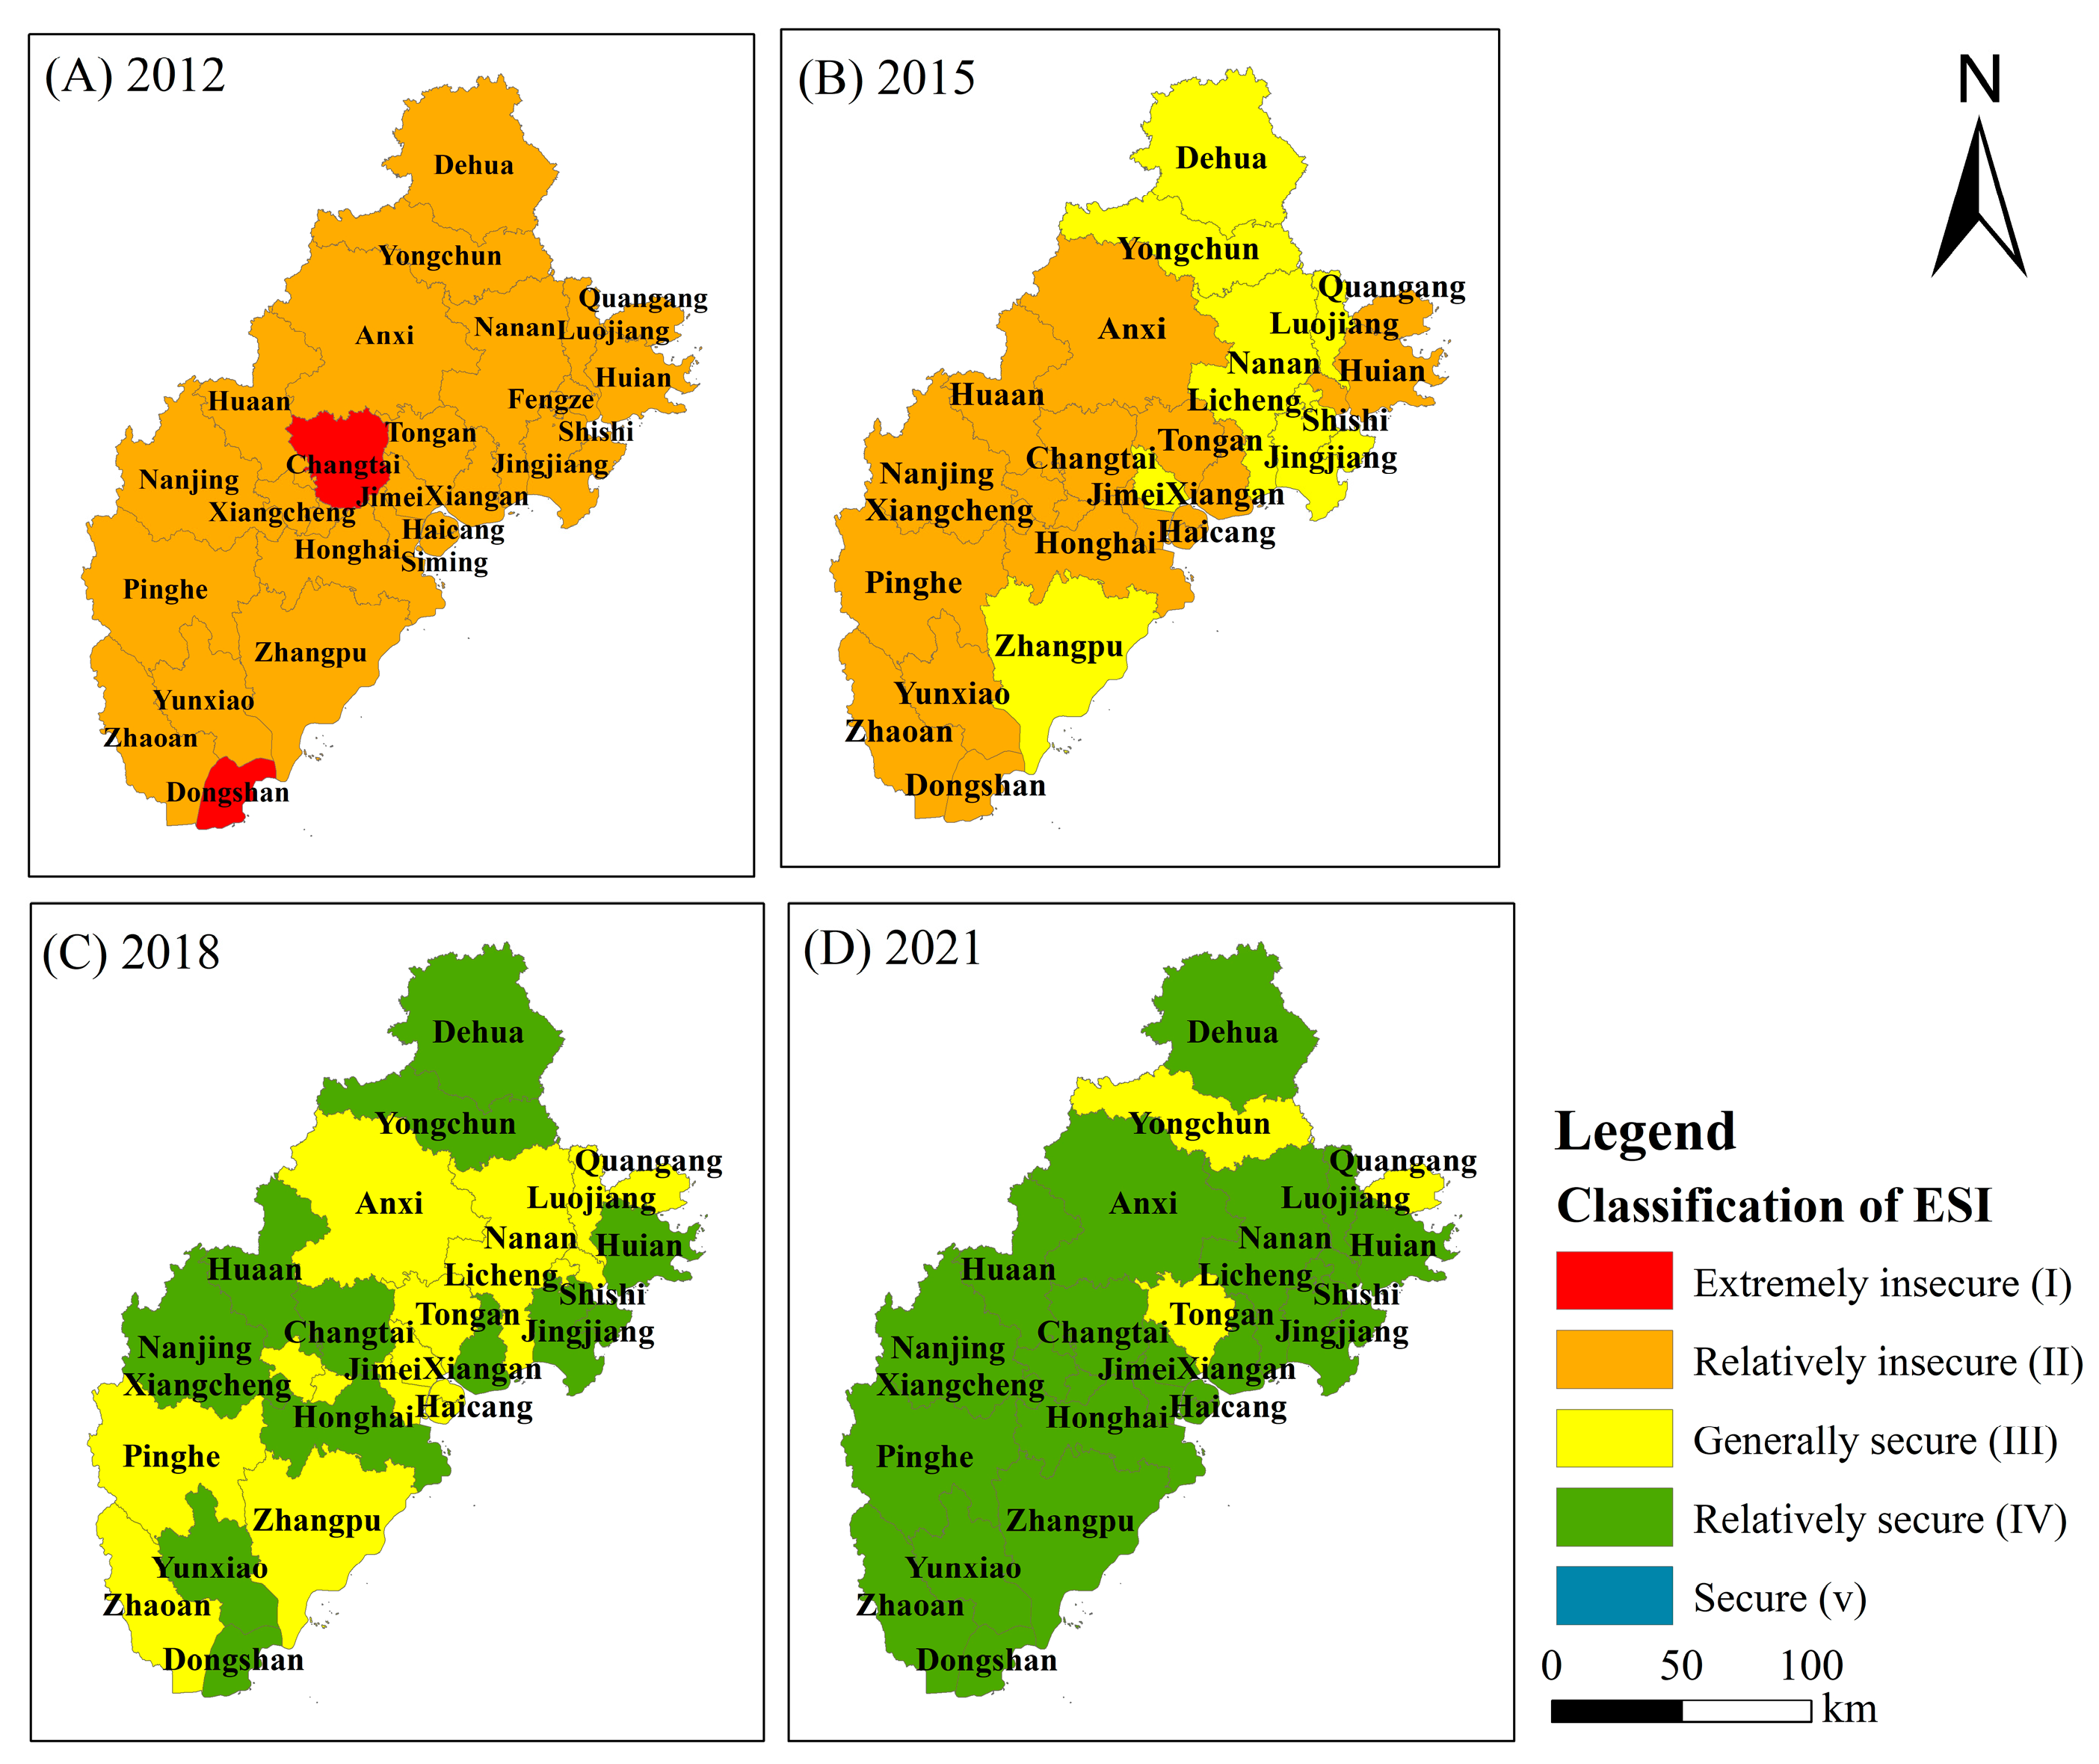
3.1. Analysis of ESI Spatial and Temporal Characteristics

3.1.1. ESI Temporal Characteristics

The ESI values for each county in the XZQR from 2011 to 2021 were calculated using the DPSIR model. On the whole, the ESI level in the XZQR improved (Figure 4a) from 0.2318 to 0.6856. This was mainly due to the growth of the impact layer, driving force layer, and the response layer, which grew by 0.201, 0.138, and 0.106, respectively. This indicates that the ecological environment developed in a positive way. The ESL improved from relatively insecure to relatively secure. Among them, the overall ESI of Zhangzhou had a more significant growth rate, and the average ESI increased by 0.541 (Figure 4c). The driving force layer and the impact layer, which increased by 0.139 and 0.261, respectively, were the factors that caused the most significant increases in ESI in Zhangzhou. As for Xiamen, the average ESI increased by 0.486, and the growth of the impact layer (0.211) is the main reason. On the contrary, Quanzhou initially had a better ESL, but the growth trend was slower, and the average ESI increased by 0.335 (Figure 4d). The increase in the impact layer, which increased by 0.26, is the main reason for growth in this case, too. For Xiamen and Quanzhou, population density and the natural population growth rate increased rapidly, and the industrial output value and CO2 emissions also increased. Therefore, the ecological environment is under great pressure and the level of ecological security is under threat. In contrast, relatively secure areas with a weak economic foundation and low population density can be found in Zhangzhou. As Zhangzhou is a large agricultural province, the grain output per unit increased year by year, and the corresponding measures for ecological restoration were actively taken.
In terms of counties, Changtai and Zhao ‘an, belonging to Zhangzhou, had the most significant increases, reaching 0.628 and 0.594, respectively (Figure 4c), which was mainly due to increases of 0.247 and 0.285 in the impact layer. Other counties in Zhangzhou also showed a similar significant growth trend. In Xiamen, Siming had the largest increase, with an increase of 0.565, and the impact layer increased significantly, reaching 0.245 (Figure 4b). The fluctuation ranges of counties and districts in the city are quite different (Figure 4b). For Quanzhou, the largest increase was in Hui ‘an, but only of 0.382, and was mainly due to increases of 0.123 and 0.128 in the impact layer and response layer, respectively. The effect of the impact layer on the improvement in ecological security level was not as good as that of Zhangzhou and Xiamen. Other regions also showed a slight upward trend with large fluctuations (Figure 4d).

3.1.2. ESI Spatial Evolution Characteristics

The ESI values of the XZQR in 2012, 2015, 2018, and 2021 were selected for spatial visualization. The results showed that the ESI pattern gradually improved from a relatively insecure state, and the high-value area showed a trend of shifting from north to south (Figure 5). In 2012, Dongshan and Changtai in Zhangzhou were the only counties in a relatively insecure state (Figure 5A). By 2015, the whole region had shown a specific upward trend (Figure 5B). The most apparent rise at this time point was in the northern part of Quanzhou. Due to its good ecological environment foundation, it transitioned to the generally secure state. In 2018, some counties rose to a relatively secure state, showing an irregular multicenter distribution (Figure 5C). By 2020, except for Quangang and Yongchun in Quanzhou and Tongan in Xiamen, which had a generally secure state, all of XZQR had reached a relatively secure state (Figure 5D). This is because of the characteristics of the local industry and production.

3.2. ESI Spatial Correlation in the XZQR

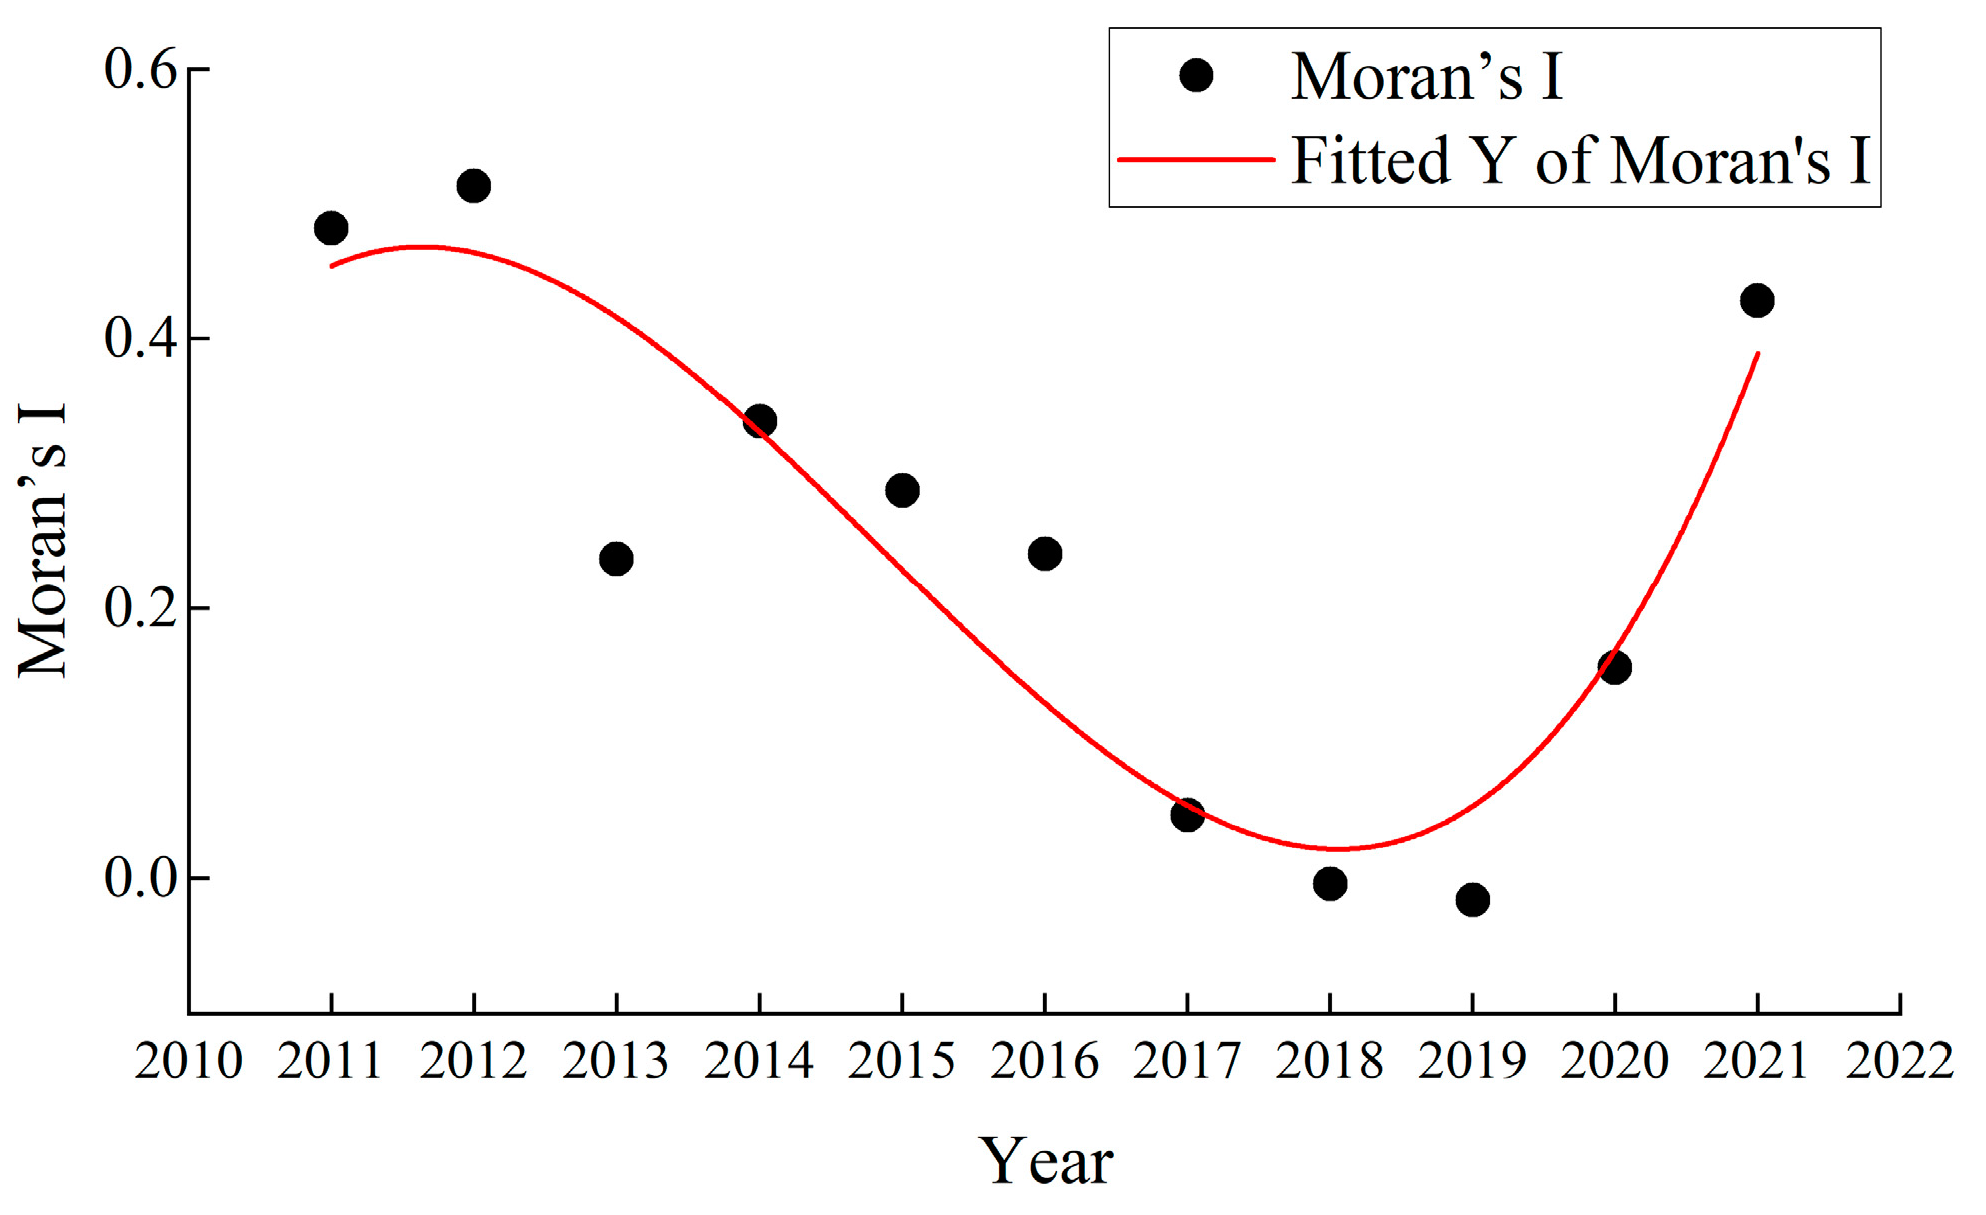
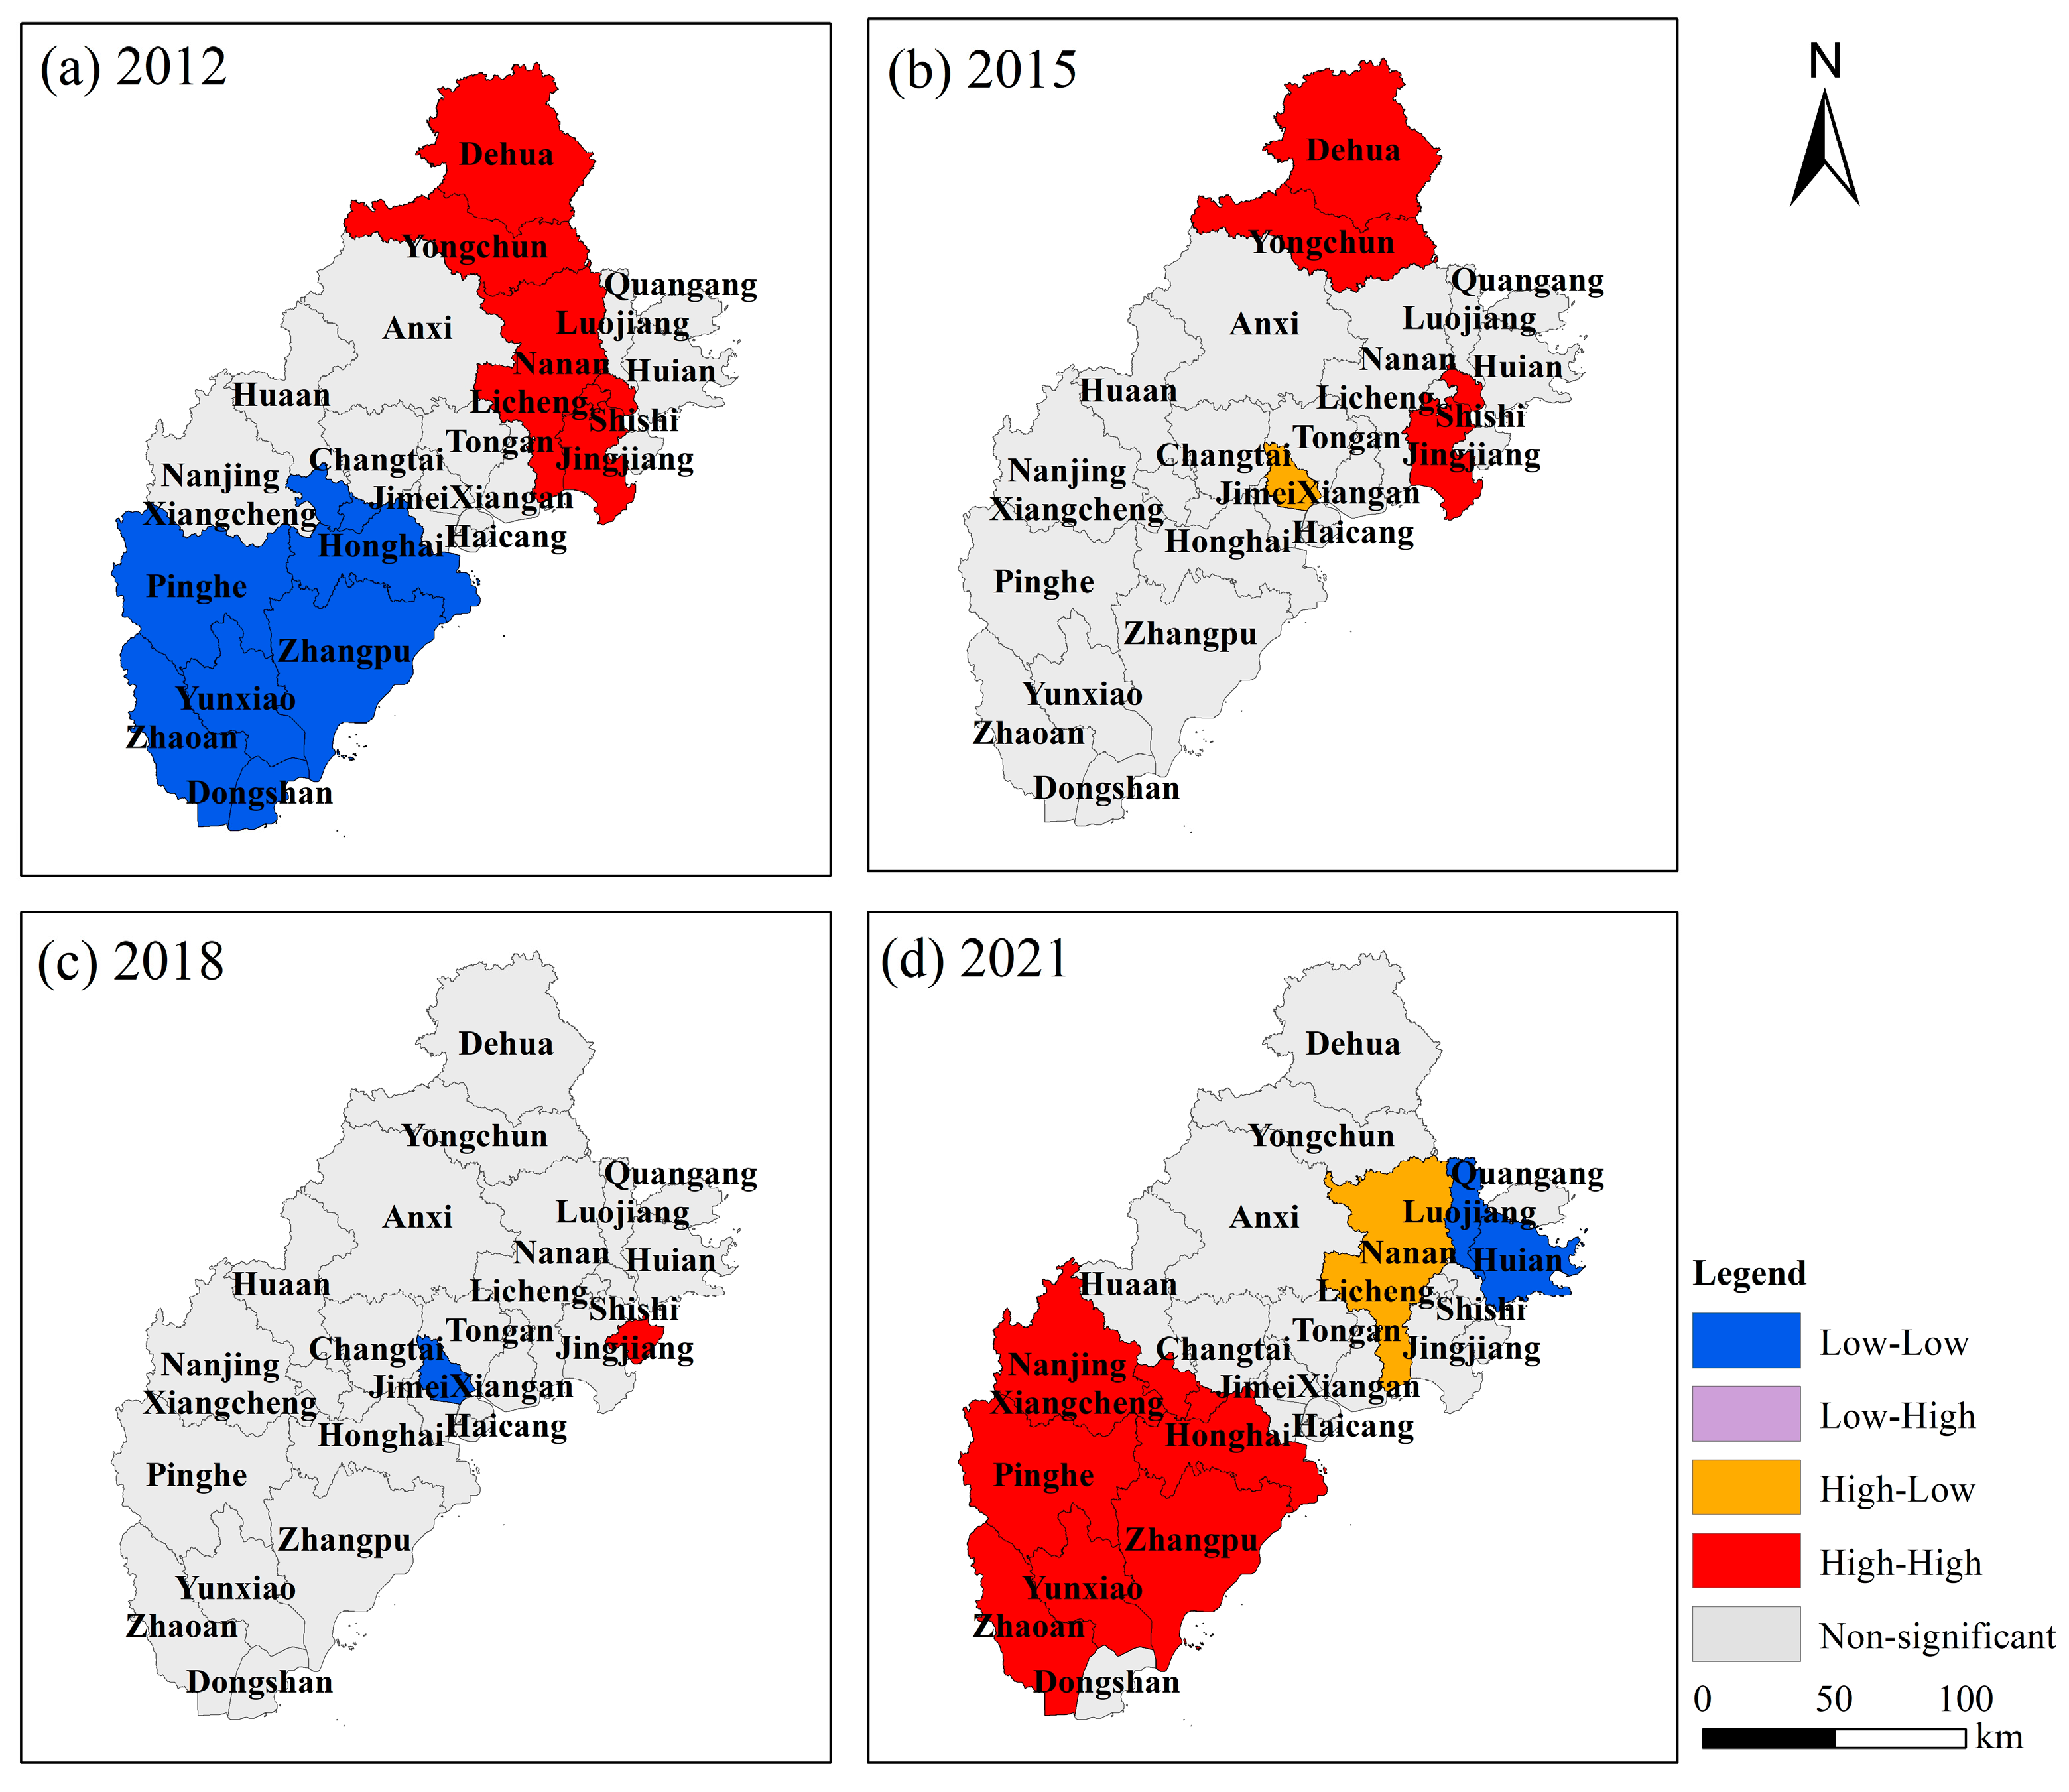
3.2.1. Changes in Spatial Interrelationships

Moran’s I of the ESI in the XZQR from 2011 to 2021 was calculated and passed the 5% significance level test (Equation (8)). The change trend showed a “U” trend, first decreasing before 2018 and then increasing. All of the values were greater than 0 (Figure 6). This means that the ESI in the XZQR area has a positive correlation, and its spatial distribution has an aggregation effect. Before 2018, the ESI had an aggregation effect in terms of geographical Llocation, but the aggregation effect showed a downward trend with the development of time. After 2018, the spatial correlation gradually increased, and the ESI had an aggregation effect significantly in geographical locations again. It shows that the construction of City Integration, other than achieving economic and industrial integration, enables the harmonious development of the ecological environment in different places.

3.2.2. Characteristics of Spatial Interrelationships

The global Moran’s I only reflects the overall spatial autocorrelation level and general trend of each county in the XZQR, so it is necessary to explore the spatial distribution characteristics of regional ESI through local Moran’s I, which is produced by drawing LISA cluster maps and making a specific analysis of the interaction of indicators between regions (Equation (9)). LISA cluster maps of county ESI in the XZQR in 2012, 2015, 2018, and 2021 were drawn, and the significance test of p ≤ 0.05 was passed. High–high regions indicate that counties with high ESI are surrounded counties with high values; low–low regions indicate that counties with low ESI are surrounded counties with low values; low–high regions indicate that counties with low ESI are surrounded counties with high values; high–low regions indicate that counties with high ESI are surrounded counties with low values.
At the beginning of the study period, Quanzhou had a high level of ecological foundation and was widely populated with high–high region types, while Zhangzhou had a poor ecological foundation and mostly comprised low–low region types (Figure 7a). In 2015, Jimei, in Xiamen, became a high–low region type, indicating that the ESI of Jimei was good at this stage, but the results have no certain “spillover effect” that would affect the surrounding area (Figure 7b). By 2018, few regions had undergone significant changes (Figure 7c). In 2021, the ESI of Zhangzhou increased significantly; especially, the spillover effect of the Zhangzhou core area on the surrounding counties gradually increased (Figure 7d). Interrelation intensity increased among Zhangzhou counties, and the high–high region type was widely distributed.

3.3. Obstacle Degree Analysis

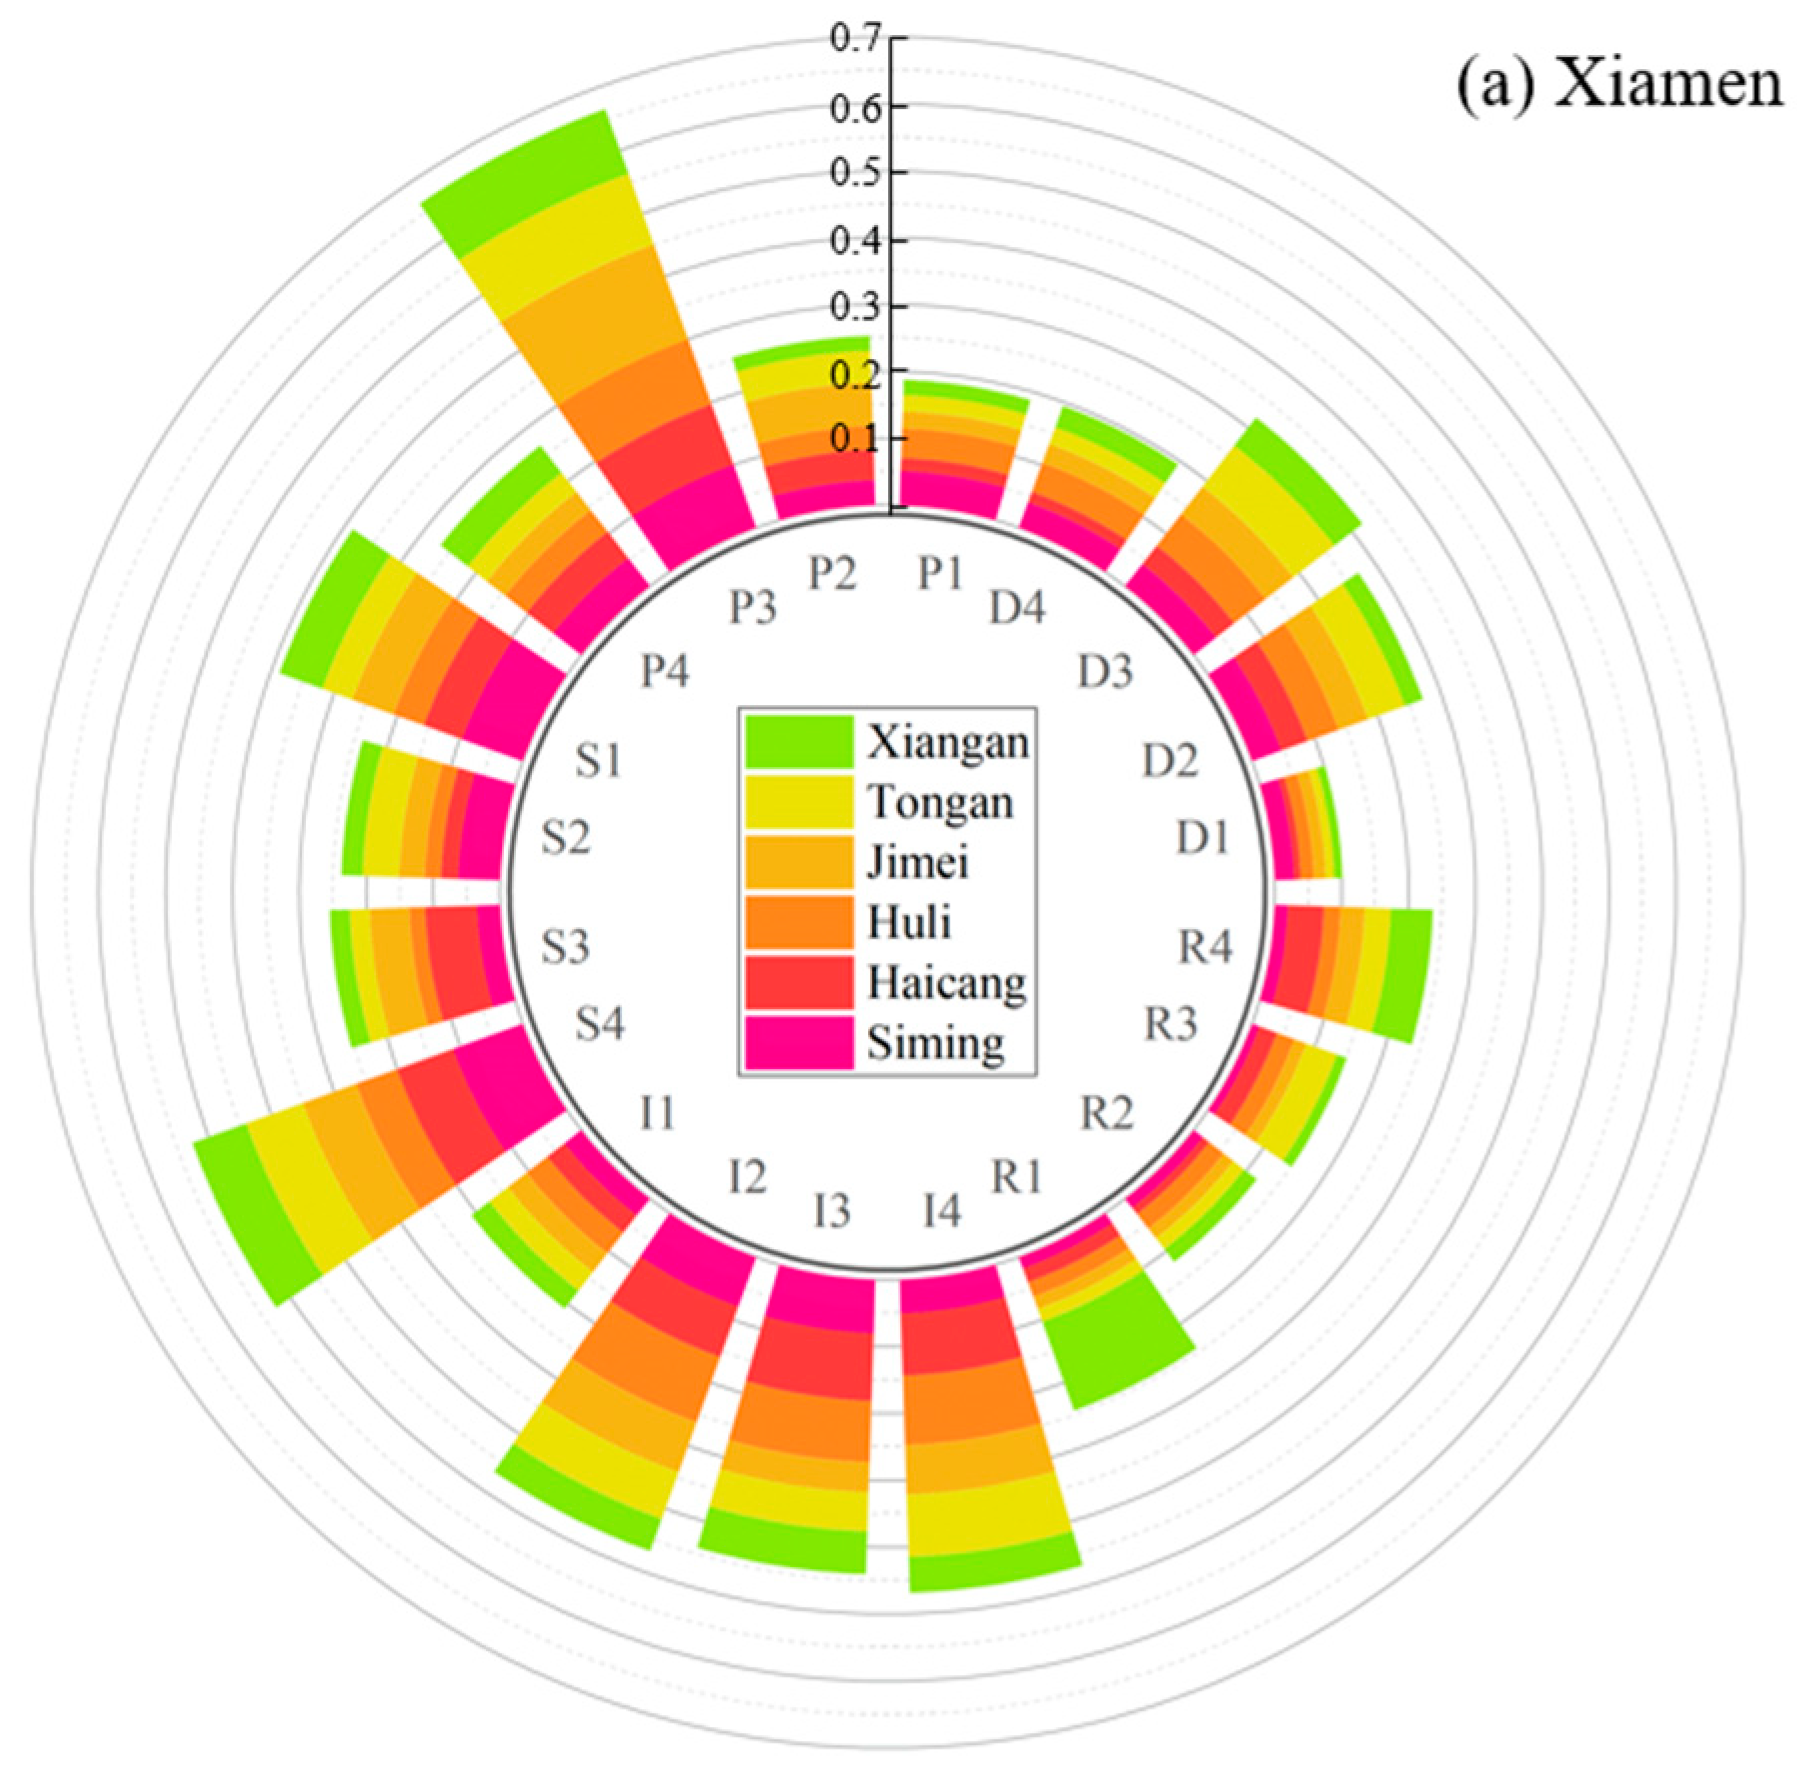
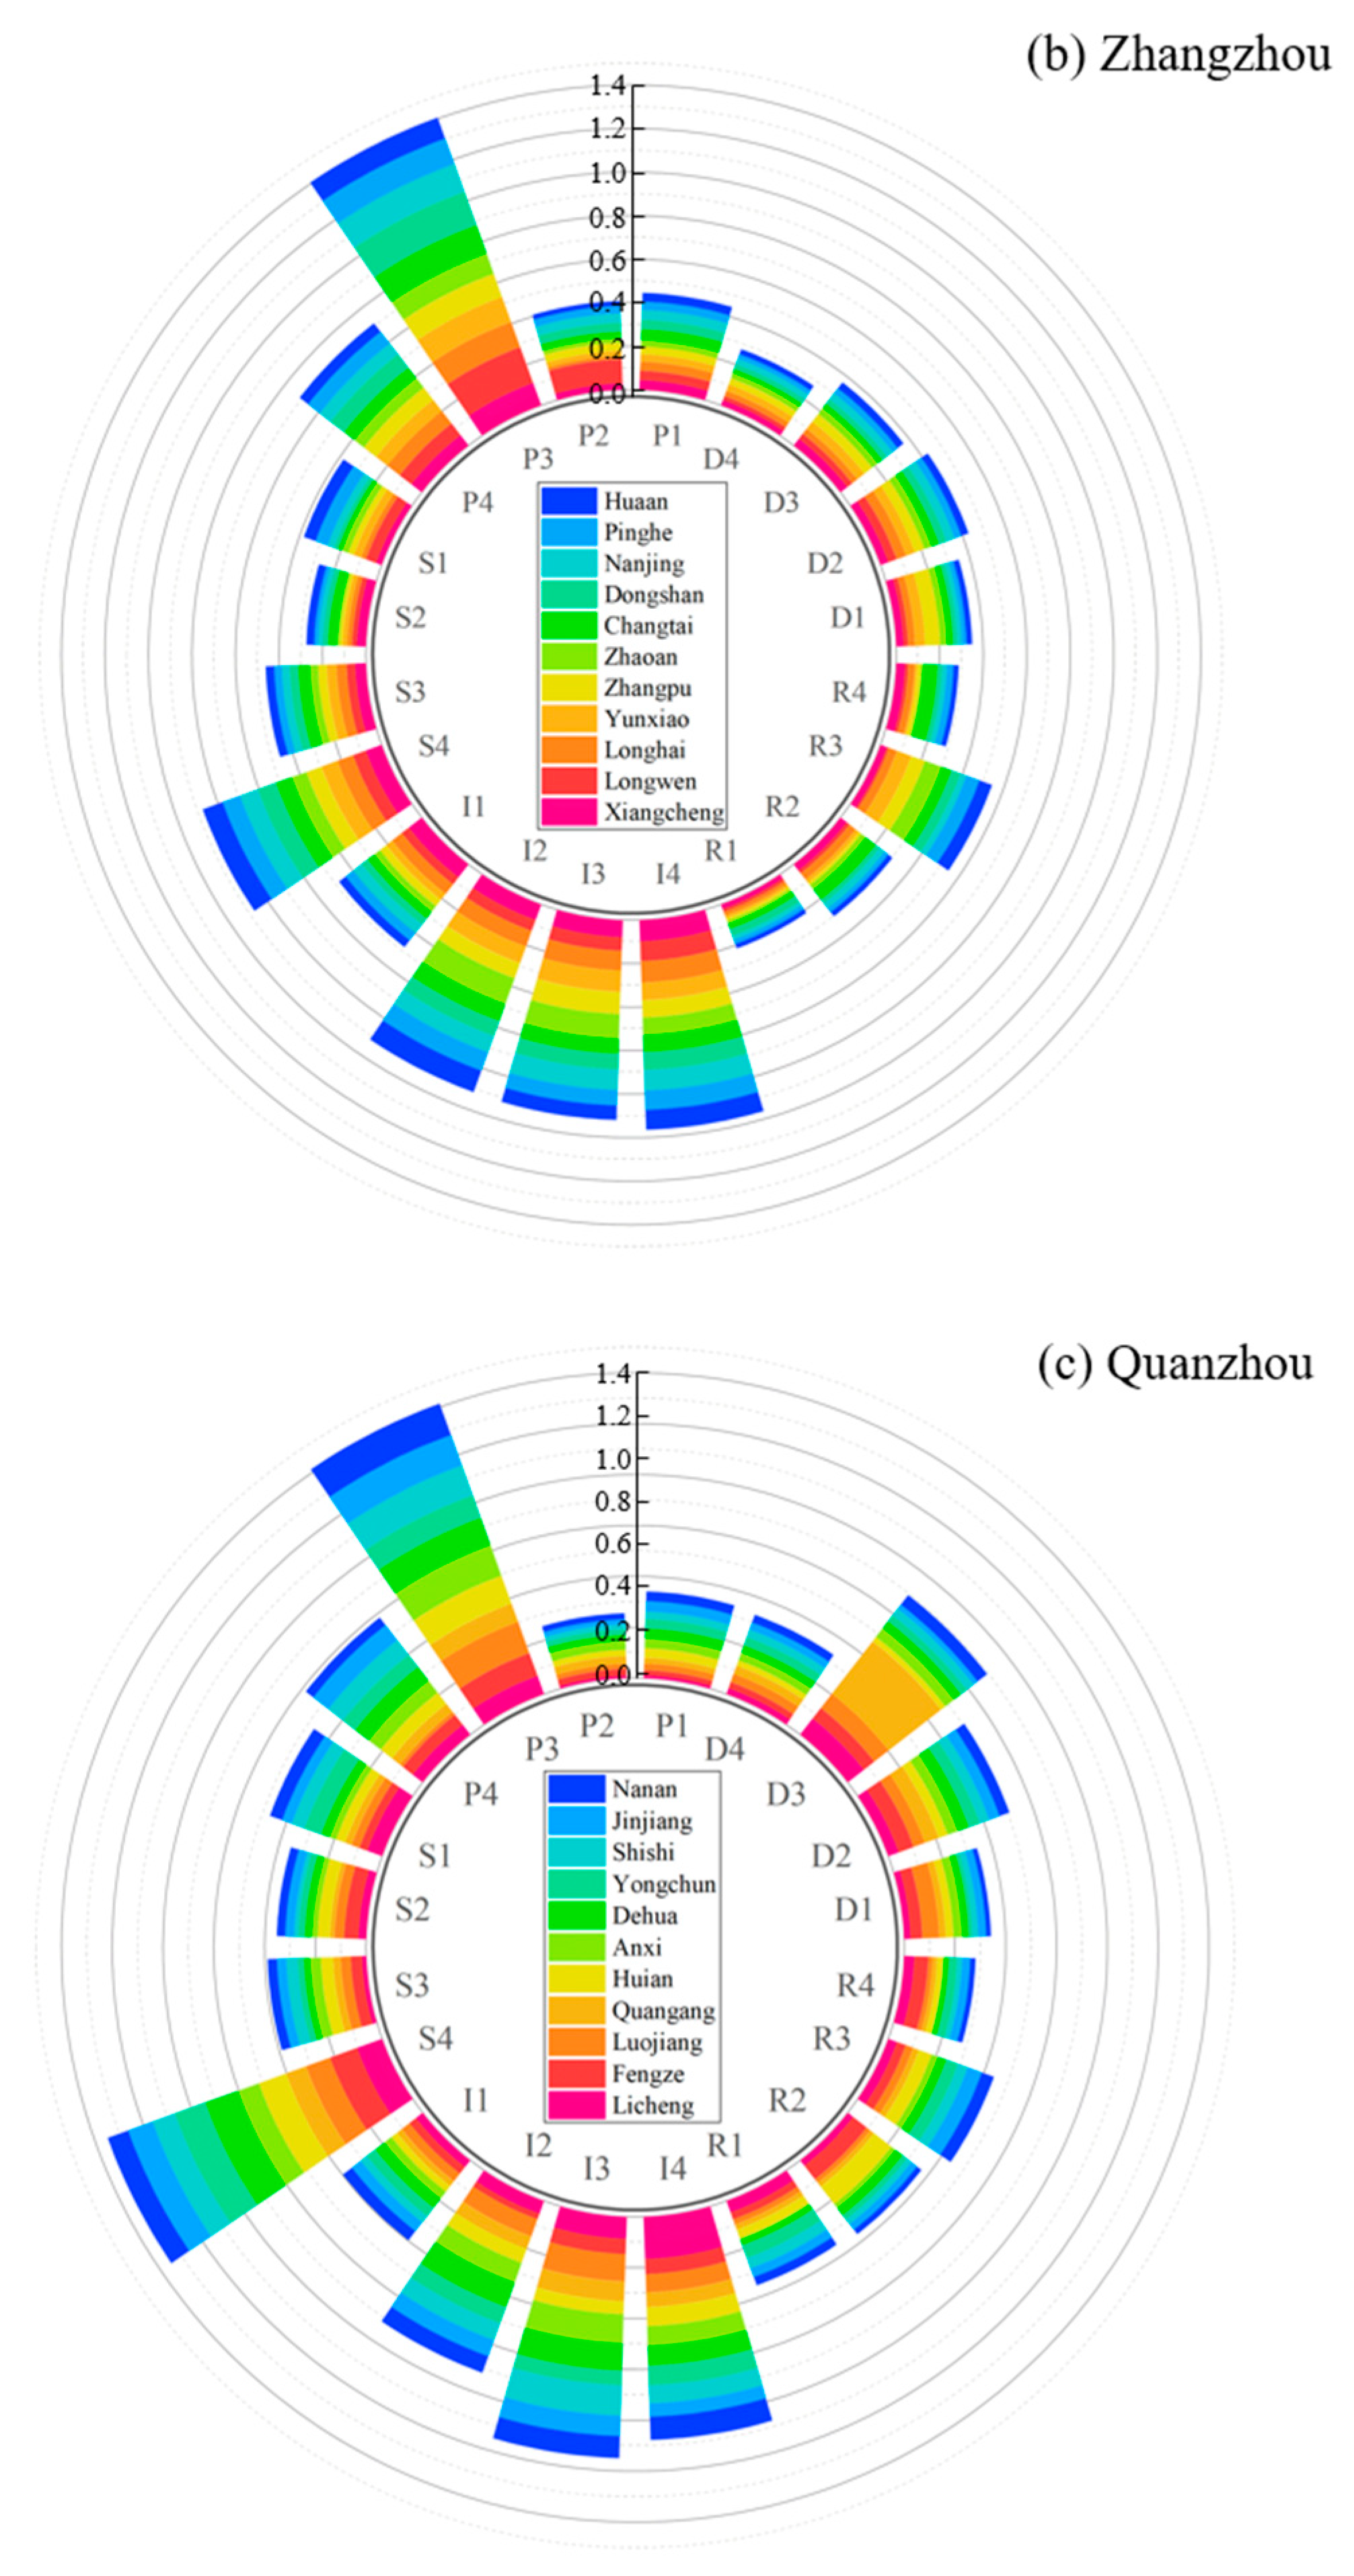
3.3.1. Obstacle Degree Analysis of the Criterion Layer

The obstacle degree distribution trend of each county in the XZQR was calculated (Figure 8) (Equation (14)). It can be seen that the obstacle degree of the pressure layer and the impact layer is the highest, concentrating around 29.3% and 23.6%, respectively, and they are the main obstacles in the standard system. Moreover, the response layer has the smallest obstacle degree, which is concentrated around 12.4%.
In terms of the distribution range, the obstacle degree of the driving force layer, pressure layer, and response layer in the XZQR are concentrated in specific areas. However, the obstacle degree of the pressure layer is the largest, and the obstacle degree of the pressure layers differs between different counties. The obstacle degree of the pressure layer caused by the natural environment has fewer variations and the differences are mainly related to human activities. The distribution of the state layer’s obstacle degree is the most concentrated, indicating that the differences in the obstacle degree of the state layer between regions are slight. At the same time, two concentration areas of the state layer’s obstacle degree exist: Xiamen and Quanzhou have a higher obstacle degree of the state layer, while Zhangzhou has a lower obstacle degree of the state layer.

3.3.2. Obstacle Degree Analysis of the Index Layer

In order to identify the most critical obstacle factors, the differences in obstacle degree between the different indexes in the ESI index layer were calculated, and these obstacle degrees were superimposed on different counties. On the whole, the main obstacle factors affecting the ESI in different regions are similar (Figure 9) (Table 4). For Xiamen and Zhangzhou, the five most significant indexes are CO2 emission, annual precipitation, green coverage rate, GDP growth rate, and general public budget expenditure. For Quanzhou, in addition to the above factors, which have a high obstacle degree, the total output value of agriculture, forestry, fisheries, and animal husbandry is also a major obstacle factor.

4. Discussion

4.1. Main Findings

Unstable natural conditions and high-intensity development activities lead to changes in the ESL [25]. With the construction and development of urbanization and industrialization, ecological security has become important [15]. We used the DPSIR model to construct the ESI to describe the interaction between humans and natural ecosystems more clearly [42]. The causal relationship of each factor layer was identified, and the main obstacle factors were analyzed to form a logical closed loop of the ecological security process.
In terms of index construction, though there is no universally recognized index layer, a scientific index evaluation system is crucial to ecological security evaluation [43]. We selected evaluation indexes from the five aspects of driving force, pressure, state, impact, and response, drawing from the index layers described in previous studies and the background conditions of local natural resources, thus effectively and objectively reflecting the relationship between various factors [44]. Then, combined with subjective and objective weighting methods, the entropy method and the analytic hierarchy process were used, respectively, to determine the final weights of each index. Through changes in the ESI, it was found that the ecological security level of the XZQR rose from a relatively insecure stage to a relatively secure stage, and the growth rates are as follows: Zhangzhou > Xiamen > Quanzhou, 0.541, 0.485, and 0.330, respectively. The impact layer had the highest obstacle degree, and the average obstacle degree was 0.2928. The specific impact factor with the highest obstacle degree in the XZQR is GDP growth rate, and the average obstacle degree is 0.059. Our study also provides a reference for future ecological security optimization.
The ecological security evaluation has the research-based, but most research studies are carried out on a macro scale. The county area is the basic unit of policy formulation, and we took it as the unit to study the difference in ecological security level in time and space from the perspective of micro-urban management so as to provide operational suggestions for improving urban management. Our study shows that in Quanzhou, the overall ecological security base was good initially, but its increase rate during the study period was small. The ecological security foundation of Zhangzhou was relatively weak, but its ESI significantly improved. Spatial correlation also shows a trend of shifting from north to south, which is mainly attributed to the development history and geographical environment of the region. Quanzhou is a famous industrial city in Fujian Province. Moreover, Quanzhou is located in a coastal area, which influences its aquaculture structure and industrial layout [45]. Most human activities are based on agriculture, and industrial activities that pose a more significant threat to the environment have less impact and cause less damage to the environment. In the early days, Zhangzhou mainly relied on resource-intensive traditional industries. The agricultural city of Zhangzhou is home to many fruits, flowers, edible mushrooms, and aquaculture, and is famous for its pomelo production. In recent years, Zhangzhou has focused on agricultural development; it continues to explore the “ecological +” model, and the modernization of its ecological environment governance capacity has been further improved. What is more, the government has enacted and implemented a series of ecological restoration policies that helped improve the ESI [6,16].
In addition, previous studies have found that studying relevant factors may help to identify the obstacles to ecological security. In order to better explain ecological security, most authors have adopted regression equations or qualitative surveys [32,46]. This paper used the obstacle degree model to determine the degree of impact and used the changes in influencing factors to identify the main obstacles faced by the ecological security of coastal urban agglomerations. In terms of the obstacle factor results obtained in this study, the analysis was mainly carried out on two aspects: criterion layer and index layer. The impact layer had the most significant impact on the ESI in the XZQR and the highest obstacle degree. The ecosystem is under intense pressure due to a dense population and intensive development, resulting in issues such as reduced per capita income, insufficient green space, and lack of public services, resulting in high obstacles posed by the impact layer and in an urgent need for government response. The carbon emission problem is prominent in high-carbon industries, which brings about environmental pollution and ecological damage while bringing about economic growth [29]. Therefore, CO2 emissions are the main obstacle factor.

4.2. Implications and Limitations

In terms of time, the ESI of the XZQR has shown a steady upward trend. Now, most regions have reached a relatively secure ESI level, and environmental policies have achieved specific results. In terms of space, the difference in ESI between the regions is obvious, and a coordinated management of environmental protection between the regions is lacking. It can be observed from the changes in the high-value areas of the ESI that a noticeable north–south divide exists in the ESI, and the development of the XZQR is extremely unbalanced. The negative impact of the widening gap in ecological security also leads to a widening gap in terms of the economy and essential public services, causing a series of social problems [21]. Therefore, when formulating environmental protection policies, the government should fully consider the differences in ecological security in different regions and give full play to regional synergies [47]. These policies should focus on Quanzhou counties to reduce the spatial differences in ESI. Meanwhile, regional cooperation and integration should be strengthened to prevent polarization in regional development.
In addition, regarding the obstacle degree that affects the ESI in the XZQR, the impact layer is the has the greatest influence, and CO2 emission and green space coverage are the main obstacle indexes. In the future, it is necessary to actively develop new energy sources, such as the development and utilization of new clean energy sources like tidal energy, to curb the continuous growth of carbon emissions and achieve a green and low-carbon energy transformation. What is more, the government should fully consider accelerating the layout of the green industry and implement ecological strategies for industrial development. Promoting ecological restoration and controlling projects in the XZQR to increase green space area are also good measures.
Due to the limitation of data availability, the index layer constructed in this study cannot contain complete indexes. This uncertainty exists objectively in ecological security evaluation and can be eliminated to the maximum extent through more research scales and dynamic data sources in the future. What is more, due to the different background conditions, selected indicators, and measurement standards, the absolute value of the ESI is different from that of existing studies. However, the ESI of the XZQR was evaluated using uniform data types and universal metrics, which can be used for comparing internal differences and proposing optimization paths. In addition, the action mechanisms among various elements of ecological security evaluation still need to be further studied. Multiple regression, component analysis, and other methods can evaluate the impact of the system and the relationship between individual indexes. In the future, we will examine the conduction paths between the five principal dimensions and sub-dimensions by referring to various methods.

5. Conclusions

Ecological security is of great significance to the development of ecological environment protection and the promotion of sustainable and healthy social and economic growth [48]. Based on the DPSIR framework, this study comprehensively evaluated the ESI in a coastal urban agglomeration from 2011 to 2021. Firstly, we constructed an index layer for ecological security, which effectively reflected the interaction mechanism between evaluation subjects and indexes [36]. On the other hand, we identified the primary obstacle factors influencing the development of ESL improvement pathways according to regional natural conditions.
From 2011 to 2021, the ESI level in the XZQR fluctuated and rose. The average ESI increased by 0.448, but regional differences in ESI were noticeable. In 2012, the ESI level in the north regions was lower than in the south regions, while in 2021, the ESI in the south regions was lower than that in the north regions. It meant that the ESI of the counties in the south, mainly belonging to Zhangzhou, improved significantly. The main obstacle factor affecting the level of ecological security was the impact layer. The most typical obstacle factor in the XZQR was CO2 emission, with an average obstacle degree of 9.21%. Quanzhou was also hindered by the total output value of agriculture, forestry, fisheries, and animal husbandry, with an obstacle degree of 3.2%. This was related to the background conditions and economic and industrial characteristics of Quanzhou [45]. These results also reflect those regions with more industrial production and higher output values have larger CO2 emissions and are facing more serious ecological problems. Targeted planning and management measures should be implemented according to local natural conditions.
This paper provides information on the spatial development and obstacle factors to ecological security in a coastal urban agglomeration. It is a reference for the spatial evaluation of other regions of the world that have similar background conditions. Enhancing the regional integration of ecological and environmental governance, focusing on monitoring changes in the impact layer, is significant. Areas with poor ecological security need to focus on developing new energy industries and promoting ecological restoration projects.

Author Contributions

Conceptualization, Y.Z. and J.Z.; methodology, Y.Z.; software, S.L.; validation, Y.L. and Y.D.; formal analysis, Y.L.; investigation, W.C.; resources, Y.L.; data curation, Y.Z.; writing—original draft preparation, Y.Z.; writing—review and editing, Y.Z.; visualization, Y.Z.; supervision, J.Z.; project administration, J.Z.; funding acquisition, J.Z. All authors have read and agreed to the published version of the manuscript.

Funding

This research received no external funding.

Institutional Review Board Statement

Not applicable.

Informed Consent Statement

Not applicable.

Data Availability Statement

The data presented in this study are available on request from the corresponding author. The data are not publicly available due to privacy restrictions.

Acknowledgments

The authors are grateful to the anonymous reviewers for their comments and suggestions, which contributed to further improvement of this paper.

Conflicts of Interest

The authors declare no conflicts of interest.

References

  1. Cheng, H.; Zhu, L.; Meng, J. Fuzzy evaluation of the ecological security of land resources in mainland China based on the Pressure-State-Response framework. Sci. Total Environ. 2022, 804, 150053. [Google Scholar] [CrossRef]
  2. Jatav, S.S.; Naik, K. Measuring the agricultural sustainability of India: An application of Pressure-State-Response (PSR) model. Reg. Sustain. 2023, 4, 218–234. [Google Scholar] [CrossRef]
  3. Bi, M.; Xie, G.; Yao, C. Ecological security assessment based on the renewable ecological footprint in the Guangdong -Hong Kong -Macao Greater Bay Area, China. Ecol. Indic. 2020, 116, 106432. [Google Scholar] [CrossRef]
  4. Gari, S.R.; Newton, A.; Icely, J.D. A review of the application and evolution of the DPSIR framework with an emphasis on coastal social-ecological systems. Ocean Coast. Manag. 2015, 103, 63–77. [Google Scholar] [CrossRef]
  5. Yu, Y.; Bao, Y.; Zhang, Q.; Shen, P.; Yang, H.; Xu, Z. Evaluation of marine resources environmental responsibility audit based on PSR framework. Ocean Coast. Manag. 2023, 245, 106742. [Google Scholar] [CrossRef]
  6. Xiao, Y.; Zhong, J.; Wang, J.; Zhang, L.; Qian, X.; Liu, W.; Huang, H. Exploring the Coupling Coordination Relationship of Urban Resilience System in Ecologically Fragile Areas: Case Study of the Loess Plateau in China. Land 2023, 12, 1997. [Google Scholar] [CrossRef]
  7. Salvati, L.; Carlucci, M. A composite index of sustainable development at the local scale: Italy as a case study. Ecol. Indic. 2014, 43, 162–171. [Google Scholar] [CrossRef]
  8. Holdgate, M.W. Our Common Future: The Report of the World Commission on Environment and Development. Environ. Conserv. 1987, 14, 282. [Google Scholar] [CrossRef]
  9. Xie, B.; Jones, P.; Dwivedi, R.; Bao, L.; Liang, R. Evaluation, comparison, and unique features of ecological security in southwest China: A case study of Yunnan Province. Ecol. Indic. 2023, 153, 110453. [Google Scholar] [CrossRef]
  10. Liu, C.; Li, W.; Xu, J.; Zhou, H.; Li, C.; Wang, W. Global trends and characteristics of ecological security research in the early 21st century: A literature review and bibliometric analysis. Ecol. Indic. 2022, 137, 108734. [Google Scholar] [CrossRef]
  11. Zhao, C.; Wang, C.; Yan, Y.; Shan, P.; Li, J.; Chen, J. Ecological Security Patterns Assessment of Liao River Basin. Sustainability 2018, 10, 2401. [Google Scholar] [CrossRef]
  12. Zhang, K.; Lin, N.; Xu, D.; Yu, D.; Zou, C. Research Advance on Ecological Security in China: Assessment Models and Management Measures. J. Ecol. Rural Environ. 2018, 34, 1057–1063. [Google Scholar]
  13. Qiu, M.; Yang, Z.; Zuo, Q.; Wu, Q.; Jiang, L.; Zhang, Z.; Zhang, J. Evaluation on the relevance of regional urbanization and ecological security in the nine provinces along the Yellow River, China. Ecol. Indic. 2021, 132, 108346. [Google Scholar] [CrossRef]
  14. von Döhren, P.; Haase, D. Ecosystem Services for Planning Post-Mining Landscapes Using the DPSIR Framework. Land 2023, 12, 1077. [Google Scholar] [CrossRef]
  15. Sun, Y.; Dong, Y.; Chen, X.; Song, M. Dynamic evaluation of ecological and economic security: Analysis of China. J. Clean. Prod. 2023, 387, 135922. [Google Scholar] [CrossRef]
  16. Xiaomin, Z.; Zhaoyou, L. Coupling Coordination between Ecological Security and Economy Development in the Fujian Triangle Urban Agglomeration. Areal Res. Dev. 2022, 41. [Google Scholar]
  17. Liu, L.; Li, J.; Wang, J.; Liu, F.; Cole, J.; Sha, J.; Jiao, Y.; Zhou, J. The establishment of an eco-environmental evaluation model for southwest China and eastern South Africa based on the DPSIR framework. Ecol. Indic. 2022, 145, 109687. [Google Scholar] [CrossRef]
  18. Du, Y.-W.; Cao, W.-M. DEPD model for evaluating marine ranching ecological security and its application in Shandong, China. Ocean Coast. Manag. 2022, 224, 106206. [Google Scholar] [CrossRef]
  19. Sobhani, P.; Esmaeilzadeh, H.; Wolf, I.D.; Deljouei, A.; Marcu, M.V.; Sadeghi, S.M.M. Evaluating the ecological security of ecotourism in protected area based on the DPSIR model. Ecol. Indic. 2023, 155, 110957. [Google Scholar] [CrossRef]
  20. Du, Y.-W.; Gao, K. Ecological security evaluation of marine ranching with AHP-entropy-based TOPSIS: A case study of Yantai, China. Mar. Policy 2020, 122, 104223. [Google Scholar] [CrossRef]
  21. He, N.; Zhou, Y.; Wang, L.; Li, Q.; Zuo, Q.; Liu, J.; Li, M. Spatiotemporal evaluation and analysis of cultivated land ecological security based on the DPSIR model in Enshi autonomous prefecture, China. Ecol. Indic. 2022, 145, 109619. [Google Scholar] [CrossRef]
  22. Wei, Q.; Halike, A.; Yao, K.; Chen, L.; Balati, M. Construction and optimization of ecological security pattern in Ebinur Lake Basin based on MSPA-MCR models. Ecol. Indic. 2022, 138, 108857. [Google Scholar] [CrossRef]
  23. Cao, B.; Zou, C.; Gao, J.; He, P. Review on Methodology and Application of Ecological Security Assessment. J. Ecol. Rural Environ. 2019, 35, 953–963. [Google Scholar]
  24. Manservisi, F.; Banzi, M.; Tonelli, T.; Veronesi, P.; Ricci, S.; Distante, D.; Faralli, S.; Bortone, G. Environmental complaint insights through text mining based on the driver, pressure, state, impact, and response (DPSIR) framework: Evidence from an Italian environmental agency. Reg. Sustain. 2023, 4, 261–281. [Google Scholar] [CrossRef]
  25. Ou, D.; Xia, J.; Ou, X. Regional Ecological Security Assessment and Change Trend Prediction in Peri-Urban Areas Based on GIS and RBF: A Case Study in Longquanyi District of Chengdu City. Geogr. Geo-Inf. Sci. 2017, 33, 49–58. [Google Scholar]
  26. Chen, H.; Xu, J.; Zhang, K.; Guo, S.; Lv, X.; Mu, X.; Yang, L.; Song, Y.; Hu, X.; Ma, Y.; et al. New insights into the DPSIR model: Revealing the dynamic feedback mechanism and efficiency of ecological civilization construction in China. J. Clean. Prod. 2022, 348, 131377. [Google Scholar] [CrossRef]
  27. Zhang, L.; Peng, W.; Zhang, J. Assessment of Land Ecological Security from 2000 to 2020 in the Chengdu Plain Region of China. Land 2023, 12, 1448. [Google Scholar] [CrossRef]
  28. Ghosh, S.; Chatterjee, N.D.; Dinda, S. Urban ecological security assessment and forecasting using integrated DEMATEL-ANP and CA-Markov models: A case study on Kolkata Metropolitan Area, India. Sustain. Cities Soc. 2021, 68, 102773. [Google Scholar] [CrossRef]
  29. Wang, Z.; Fu, X. Scheme simulation and predictive analysis of water environment carrying capacity in Shanxi Province based on system dynamics and DPSIR model. Ecol. Indic. 2023, 154, 110862. [Google Scholar] [CrossRef]
  30. Xiaobin, M.; Biao, S.; Guolin, H.; Xing, Z.; Li, L. Evaluation and spatial effects of tourism ecological security in the Yangtze River Delta. Ecol. Indic. 2021, 131, 108190. [Google Scholar] [CrossRef]
  31. Dai, L.; Liu, Y.; Luo, X. Integrating the MCR and DOI models to construct an ecological security network for the urban agglomeration around Poyang Lake, China. Sci. Total Environ. 2021, 754, 141868. [Google Scholar] [CrossRef] [PubMed]
  32. Peng, J.; Yang, Y.; Liu, Y.; Hu, Y.n.; Du, Y.; Meersmans, J.; Qiu, S. Linking ecosystem services and circuit theory to identify ecological security patterns. Sci. Total Environ. 2018, 644, 781–790. [Google Scholar] [CrossRef] [PubMed]
  33. Xiang, L.; Shui-ping, W.; Bing-qi, J.; Yi-jing, L. Atmospheric NH3 Emission Inventory and Its Tempo-spatial Changes in Xiamen-Zhangzhou-Quanzhou Region from 2015 to 2020. Environ. Sci. 2022, 43, 4914–4923. [Google Scholar]
  34. Guo, R.; Fan, J.; Liu, H. Impact of Resource-Environmental Restriction on the Layout of Metropolitan Area: A Case Study of Xiamen-Zhangzhou-Quanzhou Metropolitan Area. Econ. Geogr. 2021, 41, 10–19. [Google Scholar]
  35. Khemiri, K.; Jebari, S.; Mahdhi, N.; Saidi, I.; Berndtsson, R.; Bacha, S. Drivers of Long-Term Land-Use Pressure in the Merguellil Wadi, Tunisia, Using DPSIR Approach and Remote Sensing. Land 2022, 11, 138. [Google Scholar] [CrossRef]
  36. Ruan, W.; Li, Y.; Zhang, S.; Liu, C.-H. Evaluation and drive mechanism of tourism ecological security based on the DPSIR-DEA model. Tour. Manag. 2019, 75, 609–625. [Google Scholar] [CrossRef]
  37. Quevedo, J.M.D.; Lukman, K.M.; Ulumuddin, Y.I.; Uchiyama, Y.; Kohsaka, R. Applying the DPSIR framework to qualitatively assess the globally important mangrove ecosystems of Indonesia: A review towards evidence-based policymaking approaches. Mar. Policy 2023, 147, 105354. [Google Scholar] [CrossRef]
  38. Cai, X.; Li, Z.; Liang, Y. Tempo-spatial changes of ecological vulnerability in the arid area based on ordered weighted average model. Ecol. Indic. 2021, 133, 108398. [Google Scholar] [CrossRef]
  39. Gong, J.; Jin, T.; Cao, E.; Wang, S.; Yan, L. Is ecological vulnerability assessment based on the VSD model and AHP-Entropy method useful for loessial forest landscape protection and adaptative management? A case study of Ziwuling Mountain Region, China. Ecol. Indic. 2022, 143, 109379. [Google Scholar] [CrossRef]
  40. Yang, G.; Gui, Q.; Liu, J.; Chen, X.; Cheng, S. Spatial-temporal evolution and driving factors of ecological security in China based on DPSIR-DEA model: A case study of the Three Gorges reservoir area. Ecol. Indic. 2023, 154, 110777. [Google Scholar] [CrossRef]
  41. Ke, X.; Wang, X.; Guo, H.; Yang, C.; Zhou, Q.; Mougharbel, A. Urban ecological security evaluation and spatial correlation research—Based on data analysis of 16 cities in Hubei Province of China. J. Clean. Prod. 2021, 311, 127613. [Google Scholar] [CrossRef]
  42. Zhang, M.; Yu, L.; Zhang, H.; Jing, Z. Assessment of the ecological security of water environment in Henan based on PSR Model. Ecol. Sci. 2017, 36, 49–54. [Google Scholar]
  43. Yan, B.; Lv, S.; Zhao, M.; Han, G. Advances in the Research on Assessment Methods of Grassland Ecological Security. Chin. J. Grassl. 2019, 41, 164–171. [Google Scholar]
  44. Zheng, Y.; Yu, G.; Zhong, P.L.; Wang, Y.X. Integrated assessment of coastal ecological security based on land use change and ecosystem services in the Jiaozhou Bay, Shandong Peninsula, China. Yingyong Shengtai Xuebao 2018, 29, 4097–4105. [Google Scholar]
  45. Dezhi, X.; Shengze, Z.; Zhaomei, L.; Biaocai, Z.; Haibin, H. Research on Accelerating the Intercity of Xiamen-Zhangzhou-Quanzhou Golden Triangle: From the Perspective of the “14th Five Year Plan” and Medium and Long Term Planning. Urban Dev. Stud. 2021, 28. [Google Scholar]
  46. Tang, C.; Wu, X.; Zheng, Q.; Lyu, N. Ecological security evaluations of the tourism industry in Ecological Conservation Development Areas: A case study of Beijing’s ECDA. J. Clean. Prod. 2018, 197, 999–1010. [Google Scholar] [CrossRef]
  47. Carnohan, S.A.; Trier, X.; Liu, S.; Clausen, L.P.W.; Clifford-Holmes, J.K.; Hansen, S.F.; Benini, L.; McKnight, U.S. Next generation application of DPSIR for sustainable policy implementation. Curr. Res. Environ. Sustain. 2023, 5, 100201. [Google Scholar] [CrossRef]
  48. Ezeonu, I.C.; Ezeonu, F.C. The environment and global security. Environmentalist 2000, 20, 41–48. [Google Scholar] [CrossRef]
Figure 1. Location of the study area.
Land 13 00339 g001
Figure 2. Research framework.
Land 13 00339 g002
Figure 3. DPSIR model structure and logical relationships.
Land 13 00339 g003
Figure 4. Changes in ESI in XZQR, 2011–2021.
Land 13 00339 g004
Figure 5. Spatial maps of ESI in XZQR in 2012, 2015, 2018, and 2021.
Land 13 00339 g005
Figure 6. Moran’s I change trend from 2011 to 2021.
Land 13 00339 g006
Figure 7. LISA cluster map of spatial impacts of ESI in different periods.
Land 13 00339 g007
Figure 8. Trend of obstacle degree distribution in the criterion layer.
Land 13 00339 g008
Figure 9. Trend of obstacle degree distribution in the index layer.
Land 13 00339 g009aLand 13 00339 g009b
Table 1. Data sources.
TypeDataSourcesDescription
Geographical dataAdministrative divisionsMinistry of Natural Resources of the People’s Republic of Chinahttp://bzdt.ch.mnr.gov.cn/ (accessed on 1 December 2023)
Natural and environmental dataCarbon emission dataThe National Oceanic and Atmospheric Administration (NOAA)https://www.ngdc.noaa.gov/ (accessed on 1 December 2023)
PM2.5 dataGoogle Earth Enginehttps://developers.google.cn/earth-engine/ (accessed on 1 December 2023)
Rainfall data
Socio-economic and demographic dataThe Statistical YearbookStatistics Bureau of Fujian, Xiamen, Zhangzhou, and Quanzhouhttps://tjj.fujian.gov.cn/ (accessed on 1 December 2023); https://tjj.xm.gov.cn/ (accessed on 1 December 2023); http://tjj.quanzhou.gov.cn/ (accessed on 1 December 2023); http://tjj.zhangzhou.gov.cn/ (accessed on 1 December 2023)
Table 2. Multi-layer ecological security evaluation indexes based on DPSIR model.
Criterion LayerIndex LayerAbbreviationWeights
Driving force factors
(D)
Natural population growth rate (%)D10.0227
GDP per capita (CNY)D20.0587
Total output value of agriculture, forestry, fisheries, and animal husbandry (CNY 10,000)D30.0515
Investment in fixed assets (CNY 10,000)D40.0295
Pressure factors
(P)
Population density (person/km2)P10.0176
Growth rate of industrial added value above designated size (%)P20.0401
CO2 emission (10,000 tons)P30.0856
PM2.5 emission (10,000 tons)P40.0569
State factors (S)Total aquatic products (tons)S10.0647
Expenditure on agriculture, forestry, and water (CNY 10,000)S20.0175
Grain production per unit area (tons)S30.0318
Annual precipitation (mm)S40.0862
Impact factors (I)Disposable income per capita (CNY)I10.0227
Green coverage rate (%)I20.1027
GDP growth rate (%)I30.0956
General public budget expenditure (CNY 10,000)I40.1062
Response factors (R)Growth rate of tertiary industry (%)R10.0161
Science and technology expenditure (CNY 10,000)R20.0184
Sewage treatment rate (%)R30.0518
Proportion of investment in environmental pollution control in GDP (%)R40.0237
Table 3. ESI division standard.
RankIntervalSecurity Level
I0.0 ≤ ESI < 0.2Extremely insecure
II0.2 ≤ ESI < 0.4Relatively insecure
III0.4 ≤ ESI < 0.6Generally secure
IV0.6 ≤ ESI < 0.8Relatively secure
V0.8 ≤ ESI ≤ 1.0Secure
Table 4. Sums and averages of the obstacle degree of the index layer.
Index LayerSumAverage
AbbreviationXiamenZhangzhouQuanzhou
Natural population growth rate (%)D10.10130.34870.34120.0283
GDP per capita (CNY)D20.27190.42910.50650.0431
Total output value of agriculture, forestry, fisheries, and animal husbandry (CNY 10,000)D30.31980.36490.69370.0492
Investment in fixed assets (CNY 10,000)D40.19390.27410.33030.0285
Population density (person/km2)P10.18740.44590.34100.0348
Growth rate of industrial added value above designated size (%)P20.25330.40710.25480.0327
CO2 emission (10,000 tons)P30.66551.40501.21310.1173
PM2.5 emission (10,000 tons)P40.26690.70990.58160.0557
Total aquatic products (tons)S10.38710.38040.46870.0442
Expenditure on agriculture, forestry, and water (CNY 10,000)S20.23780.27420.35180.0309
Grain production per unit area (tons)S30.25490.46070.38810.0394
Annual precipitation (mm)S40.52530.87401.14860.0910
Disposable income per capita (CNY)I10.20830.48070.39660.0388
Green coverage rate (%)I20.46760.91620.71740.0750
GDP growth rate (%)I30.44030.91900.94910.0824
General public budget expenditure (CNY 10,000)I40.46810.96370.87700.0825
Growth rate of tertiary industry (%)R10.24390.21430.35170.0289
Science and technology expenditure (CNY 10,000)R20.11950.30090.36640.0281
Sewage treatment rate (%)R30.15070.54410.44160.0406
Proportion of investment in environmental pollution control in GDP (%)R40.23650.28710.28080.0287
Disclaimer/Publisher’s Note: The statements, opinions and data contained in all publications are solely those of the individual author(s) and contributor(s) and not of MDPI and/or the editor(s). MDPI and/or the editor(s) disclaim responsibility for any injury to people or property resulting from any ideas, methods, instructions or products referred to in the content.

