Article

Dynamical Identification of Urban-Rural Gradient and Ecosystem Service Response: A Case Study of Jinghong City, China

1
College of Oceanography and Space Informatics, China University of Petroleum (East China), Qingdao 266580, China
2
Key Laboratory of Agricultural Big Data, Ministry of Agriculture and Rural Affairs, Beijing 100081, China
3
Agricultural Information Institute of Chinese Academy of Agricultural Sciences, Beijing 100081, China
4
College of Ocean Science and Engineering, Shandong University of Science and Technology, Qingdao 266590, China
*
Author to whom correspondence should be addressed.
Land 2024, 13(3), 306; https://doi.org/10.3390/land13030306
Submission received: 13 January 2024 / Revised: 20 February 2024 / Accepted: 27 February 2024 / Published: 29 February 2024
(This article belongs to the Special Issue Deciphering Land-System Dynamics in China)

Abstract

:
Understanding ecosystem service characteristics along urban-rural gradients is vital for enhancing the well-being of urban and rural residents. Despite this importance, prior research has neglected the dynamic evolution of urban-rural gradients during urbanization. This study investigates the spatiotemporal variations of four ecosystem services—habitat quality, carbon sequestration, water yield, and soil retention—along the urban-rural gradient in Jinghong City, China. We propose a method for identifying the gradient using the inverse S function of urban land density distribution and concentric analysis. From 2000 to 2020, ecosystem service supply capacity in Jinghong City continuously declined, indicating degradation over the two decades. The urban-rural gradient zone is classified as core area, inner urban area, suburban area, and urban periphery, each experiencing outward expansion, reflecting significant urbanization. Changes in ecosystem services along the gradient revealed consistently high losses in habitat quality, carbon sequestration, and overall services in the inner urban area, while water yield and soil retention suffered the greatest losses in the urban periphery. As urbanization expanded outward, the loss of these services shifted from the inner urban area to the suburban and urban periphery. These results support decision-making in urban planning and sustainable development for urban-rural regions.

1. Introduction

As urbanization progresses rapidly worldwide, the Earth’s natural ecosystems face significant disruptions from various human activities [1]. Global urbanization, driven by the intensification of human activities, has facilitated social and economic development. However, it has also led to crucial ecological challenges, including the loss of biodiversity, habitat fragmentation, and the degradation of ecosystem services [2]. These issues require prompt attention as they hinder the achievement of the United Nations Sustainable Development Goals [3,4]. Properly understanding and managing the relationship between ecosystems and urbanization is essential to achieving sustainable human development [5,6,7].
China is currently undergoing an unprecedented urbanization process. The urbanization rate of the permanent resident population has maintained a stable annual growth of 1% for a long period, soaring from 17.92% in 1978 to 64.72% in 2021 [8]. Data indicate substantial growth in urban residents from 359 million to 848 million and an expansion of urban construction land from 44,700 km2 to 103,500 km2 between the first and third land use surveys (1996–2019). Simultaneously, agricultural land decreased from 1,300,100 km2 to 1,278,600 km2 [9]. This “super-rapid” urbanization pattern has drastically altered the resource distribution between urban and rural areas. On the one hand, a large number of agricultural populations continuously migrate from rural to urban areas; on the other hand, urban spaces expand extensively, unplanned, and with low density from cities to rural areas [10]. The material cycling, service transmission, and functional feedback between the natural ecological environment system and the human social-economic system continually adjust and reshape during this unbalanced transfer process [11,12], leading to a continuous decline in the quantity and quality of ecosystem services available to urban residents and presenting urban-rural spatial heterogeneity. Therefore, it is necessary to clarify the impact of urbanization on ecosystem services in urban-rural spaces, providing a decision-making basis for the management of urban-rural ecosystems and resource allocation [13,14,15].
The rural-urban gradient is widely utilized in landscape science and ecology to describe spatial land use patterns [16,17,18,19] and the structure and functions of ecosystems in rural-urban regions [20,21,22]. The rural-urban gradient also provides a robust tool to study the impact of human activities, particularly urbanization, on ecosystems [23] and offers a methodological foundation for ecosystem and urban planning management [24,25].
As the impact of urbanization on the ecological environment intensifies, characterizing the features of ecosystem services along the rural-urban gradient has become a hot topic in the field [26,27,28]. Existing studies have indicated that the rural-urban gradient constrains spatial variations in ecosystem services [29] and influences relationships between ecosystem services [30]. For instance, Francesc Baró (2016) assessed the capacity, flow, demand, and unsatisfied demand of two ecosystem services, outdoor recreation, and air purification, along the rural-urban gradient in Barcelona. The study revealed a consistent spatial pattern along the gradient, suggesting potential declines in ecosystem service flows in peri-urban areas due to future urban development [13]. Franziska Kroll (2012) conducted a study on the supply and demand of three ecosystem services—energy, food, and water—along the rural-urban gradient in the Leipzig-Halle region of Germany. The results showed a leveling of the rural-urban gradient in the pattern of ecosystem demands, reflecting profound changes in traditional rural-urban relationships [16]. Ilkwon Kim et al. (2020) identified upper ecosystem services along the rural-urban gradient of coastal cities in South Korea, exploring correlations between ecosystem services through correlation and principal component analysis. They also assessed landscape multifunctionality using diversity and capacity indices [13,30]. Qin Y. L. (2020) investigated the characteristics and relationships between landscape indices and ecosystem service values in Xi’an, China, along the rural-urban gradient, revealing the impact of urban development on urban ecosystems [31]. Additionally, the highly spatial heterogeneity of urban ecosystems necessitates a clear understanding of the impact of urbanization on ecosystem services along the rural-urban gradient, providing a basis for decision-making in urban and regional sustainable development [28]. Various methods have been employed to delineate the rural-urban gradient in research, with the following three approaches most used. The first relies on geographical distance as the sole division indicator, establishing one or more straight lines from the city center to the rural periphery [32] or using concentric circles to set multiple buffer zones [33,34]. The second utilizes demographic variables to generate gradient types, attempting to encapsulate urbanization processes into single indicators such as population density or educational attainment [35]. The third employs landscape indicators, such as average patch size, fractal dimensions, or a combination of multiple landscape indices [19,30,36], for clustering analysis to generate a rural-urban gradient [28,37]. However, each method has limitations. While concentric rings are widely used [38], they oversimplify complex urban forms and dynamic development trends. The second method, using a single metric threshold, ignores the nonlinear features of the complex human-ecosystem system and obscures the regional ecological diversity. The third method, although it considers the complexity of regional landscape patterns, requires users to specify the number of clustering targets by adjusting the relevant parameters, introducing a high level of personal subjectivity. Given these limitations, it is vital to apply methods capable of accurately characterizing the dynamic development of urbanization and urban growth along the rural-urban gradient. Jiao (2015) developed a quantitative method that uses the inverse S function to analyze urban structures and growth patterns [39,40], offering a new perspective for identifying the rural-urban gradient in the dynamic development of urbanization and exploring the spatiotemporal characteristics of ecosystem services along the gradient.
Jinghong City is an important port for China’s engagement with Southeast Asian countries and international exchanges. Since the initiation of economic reforms, it has undergone rapid urbanization. Additionally, Jinghong City is located on the northern edge of the tropical region, which provides extensive tropical rainforests and a favorable ecological environment. Despite its advantageous natural conditions, the process of urbanization has disrupted natural ecosystems, exacerbating the degradation of ecosystem services. Therefore, it is imperative to understand the response of ecosystem services along urban-rural gradients during the urbanization process to achieve the objectives of sustainable urban development. This study evaluates four typical ecosystem services as well as comprehensive ecosystem services in Jinghong City using the inverse S function based on urban land distribution and concentric circle analysis to identify the dynamic development process of urban-rural gradients. The research examines the spatiotemporal variation of ecosystem services along urban-rural gradients and explores the impact of urbanization on ecosystem services at different levels of urban-rural gradients, aiming to provide a decision-making basis for urban planning and the sustainable development of the region.

2. Materials and Methods

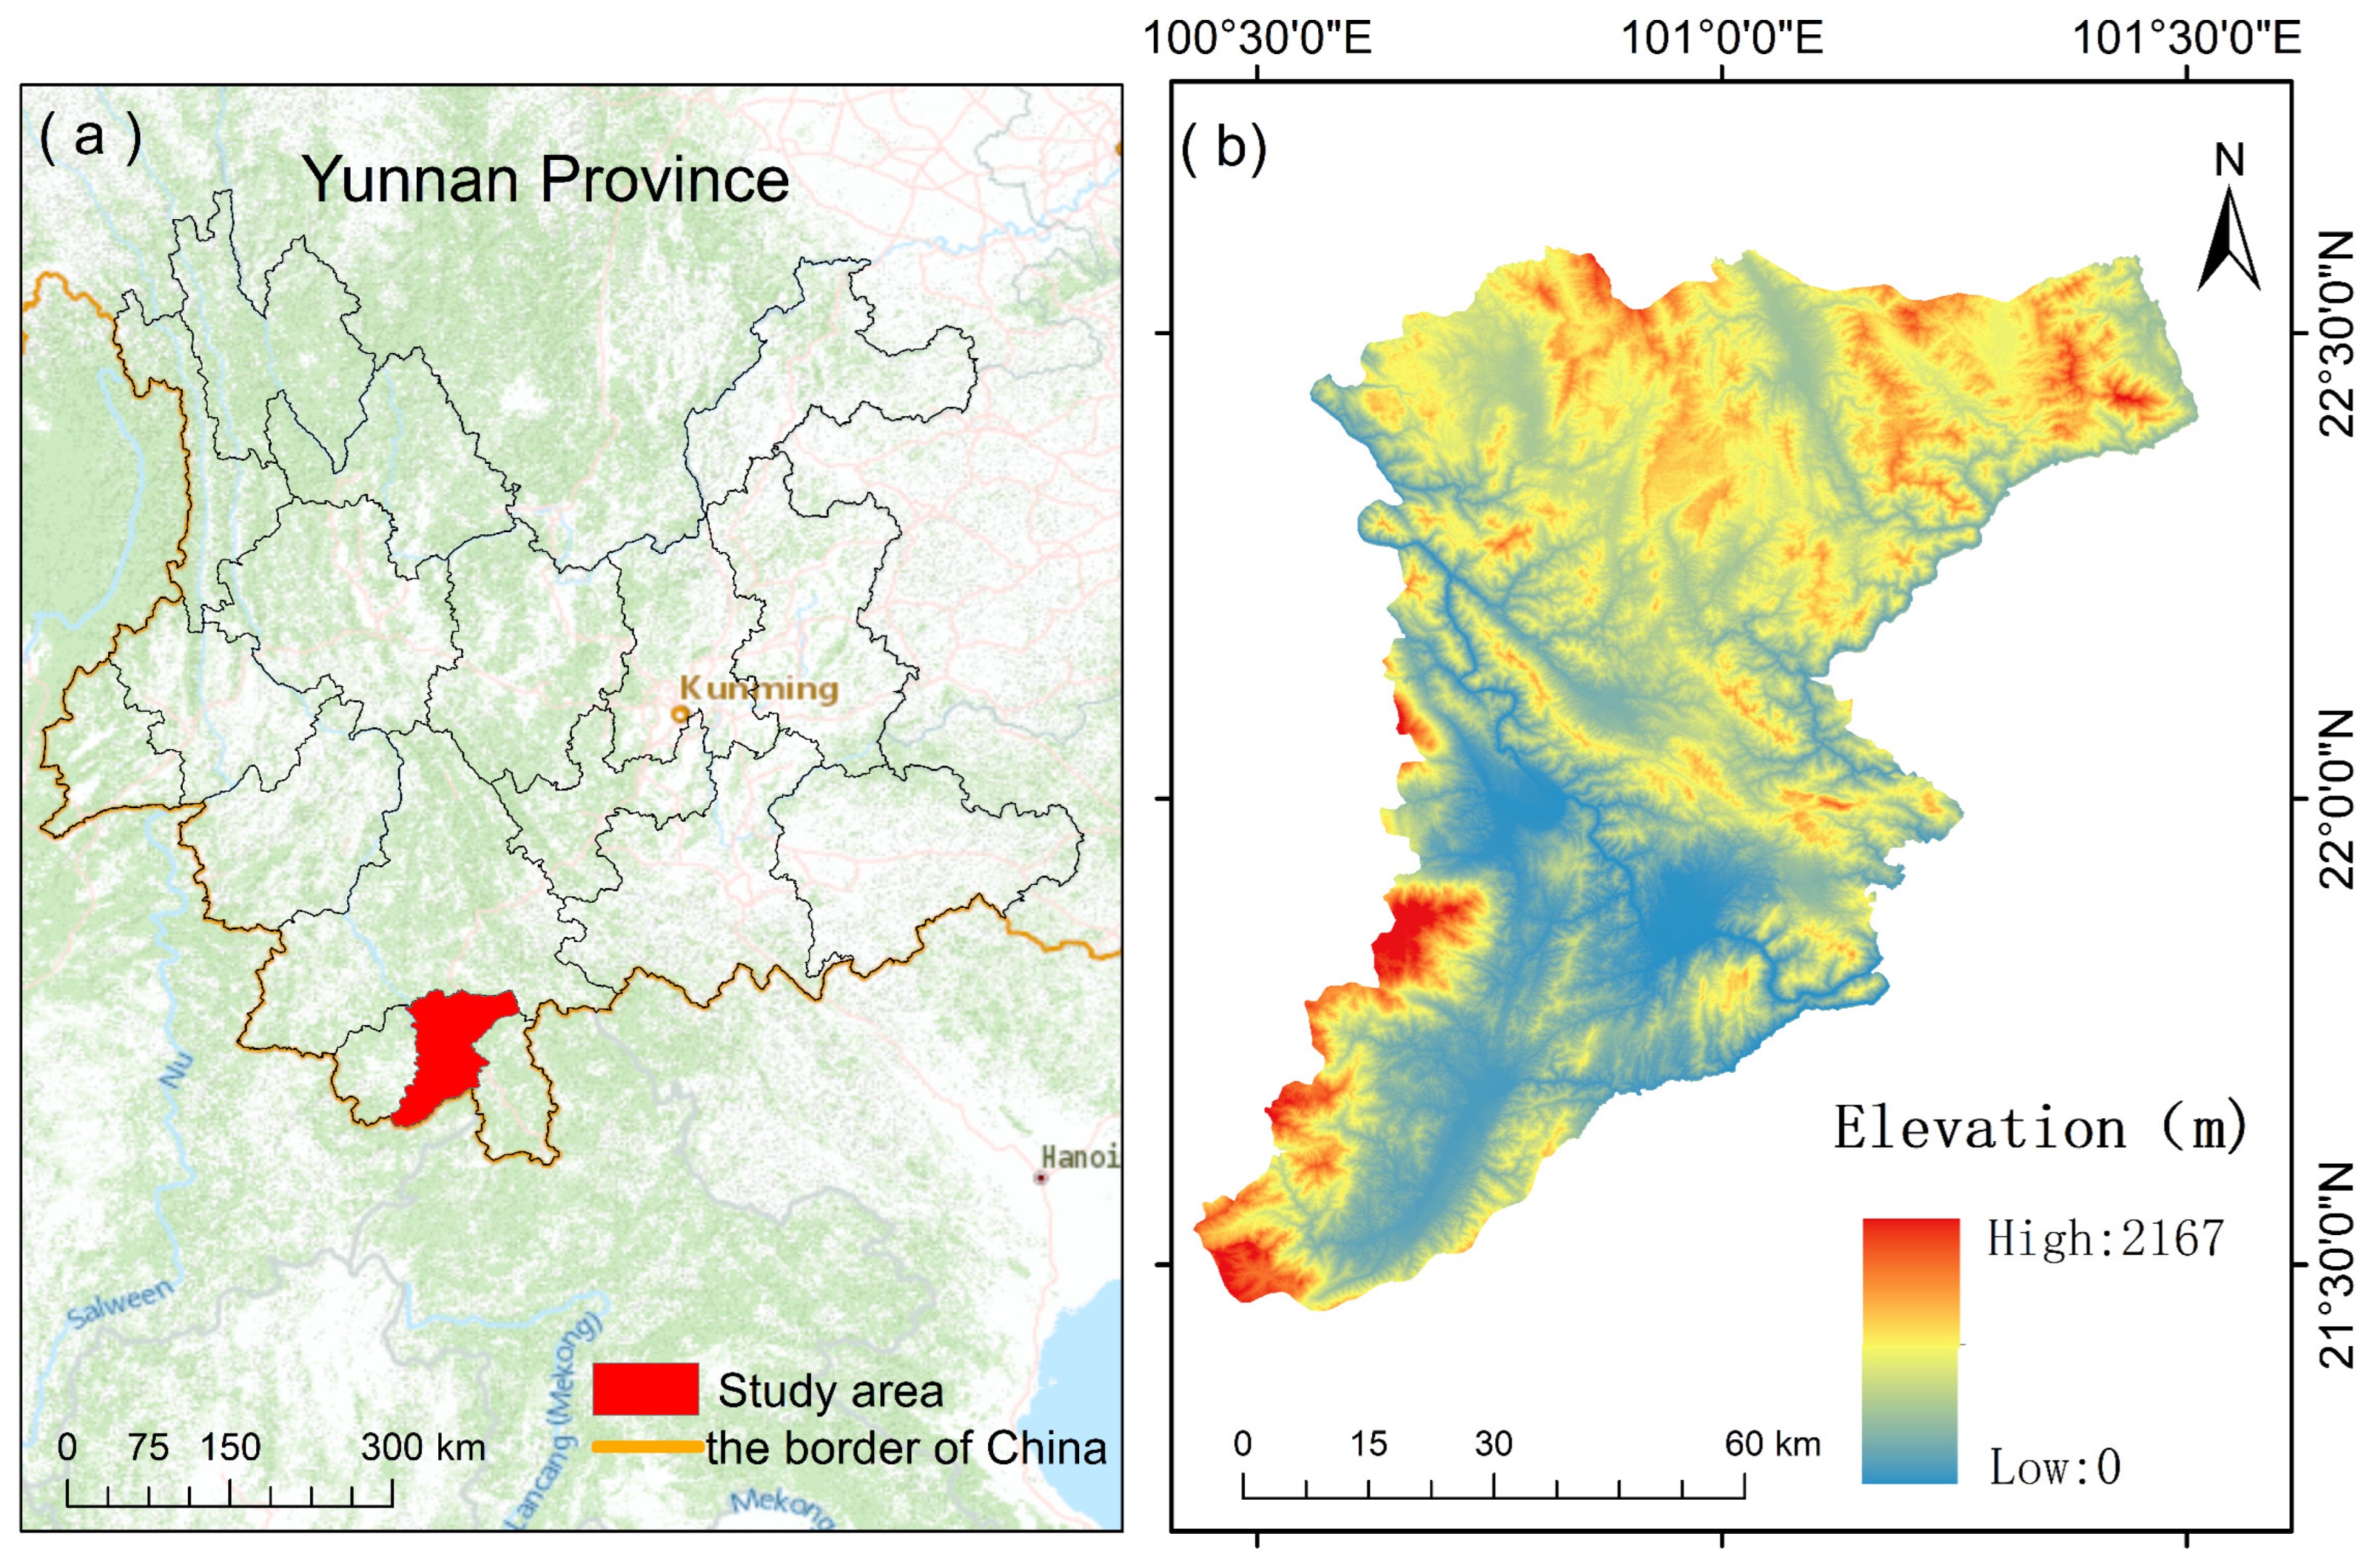
2.1. Study Area and Data Sources

Jinghong City is situated in the southwest of China (100°25′–101°31′ E, 21°27′–22°36′ N), bordering Myanmar to the south and adjacent to Laos and Thailand (Figure 1). The total length of the national border is 112.4 km. The city comprises five towns, five townships, two sub-district offices, six farm management committees, and one state-owned farm, namely: Menglong Town, Gasa Town, Menghan Town, Puwen Town, Mengyang Town, Mengwang Township, Jino Mountain Jino Ethnic Township, Jingne Township, Jingha Hani Township, Dadugang Township, Yunjinghong Sub-district, Jiangbei Sub-district, Jinghong Farm Management Committee, Dongfeng Farm Management Committee, Ganlanba Farm Management Committee, Dadugang Farm Management Committee, Mansha Farm Management Committee, Nanlianshan Farm Management Committee, and State-owned Mengyang Farm. It includes 85 village committees, 20 residents’ committees, and 768 natural villages, covering an area of approximately 6958 km2. As of 2020, the permanent population of Jinghong City was 644,000, with a population density of 93.78 people/km2. The topography of Jinghong City is characterized by higher elevation in the north and lower elevation in the south, with mountainous areas comprising 95% of the total area and basin areas making up the remaining 5%. The forest coverage rate is 85.04%, and the Lancang River-Mekong River forms a dense network of rivers that traverses the entire region from north to south. Jinghong City is located in the transitional zone between the northern tropical and southern subtropical regions. The city experiences high temperatures (average annual range of 19.12–24.29 °C) and abundant precipitation throughout the year (573.79–1828.80 mm annually).
The data utilized in this study encompass the following:
(1)
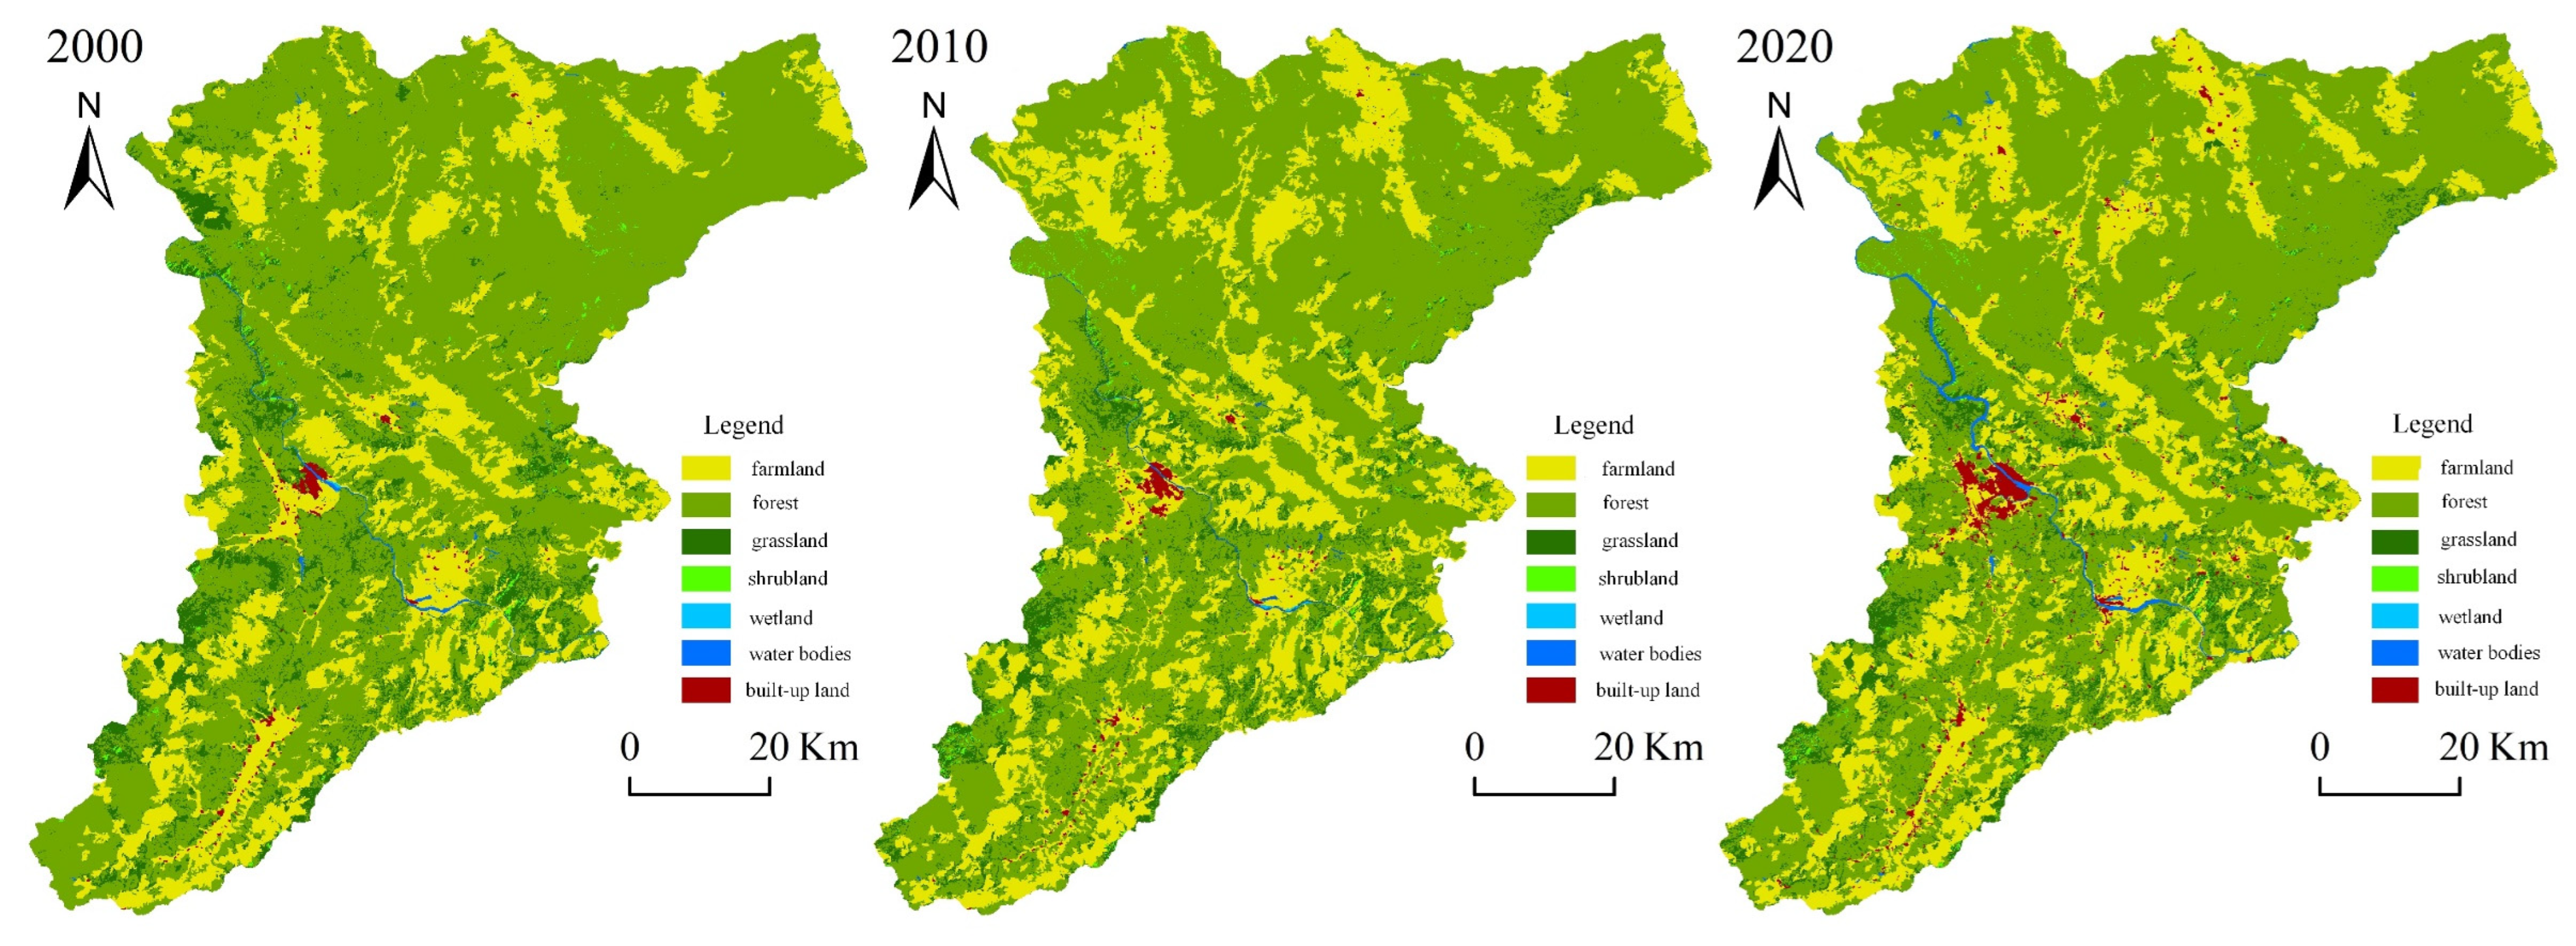
Land use data for the years 2000, 2010, and 2020 obtained from the Global 30-m Fine-Resolution Surface Cover Dynamics Monitoring Product (https://data.casearth.cn/ (accessed on 18 October 2022)). By using a reference classification system, the land use types in Jinghong City were categorized into farmland, forest, grassland, shrubland, wetland, built-up land, and water bodies (Figure 2).
(2)
Precipitation and solar radiation flux data from 2000 to 2020 were sourced from NASA’s FEWSNET and TRMM real-time datasets (https://disc.gsfc.nasa.gov/datasets/ (accessed on 18 October 2022)). Through the Globe Earth Engine platform, annual precipitation, monthly precipitation, and monthly solar radiation flux data were synthesized. Using the raster-to-point tool in ArcGIS, these data were simulated as “station data” and then subjected to Kriging interpolation to obtain 30-m resolution precipitation and solar radiation flux data. Temperature information was derived from meteorological station data in Jinghong City.
(3)
Soil data were obtained from the World Soil Database (http://www.fao.org/soils-portal/soil-survey/ (accessed on 20 October 2022)).
(4)
Digital Elevation Model (DEM) data were acquired from the Geospatial Data Cloud (http://www.gscloud.cn/ (accessed on 20 October 2022)).
(5)
Socioeconomic data primarily originated from the National Bureau of Statistics of the People’s Republic of China website and the Jinghong City Statistical Yearbook.

2.2. Evaluation of Ecosystem Services

Considering both the ecological system structure characteristics of Jinghong City and the availability of data, we selected four typical ecosystem services: habitat quality, carbon sequestration, soil retention, and water provision services. These four services are commonly regarded as key indicators representing the ecological health and safety of a region [41,42]. Utilizing composite indices constructed based on these services, we can comprehensively reveal the overall level of ecosystem service provisioning. This approach enables an accurate quantification of the urban-rural differentiations under an ecological health-oriented framework.
In this study, the InVEST model was employed to measure the physical quantities of habitat quality, water provision, carbon sequestration, carbon storage, and soil retention—the four critical ecosystem services in Jinghong City. Note that the descriptions of the parameters used below are detailed in the Supplementary Materials.
(1)
Habitat quality service
The Habitat Quality Index is a comprehensive indicator used to assess the suitability and degradation level of habitats in the study area [43]. The “Habitat Quality” module utilizes land-use data as a substrate and integrates stressor factors, including the maximum impact distance and relative weights of stressors, habitat suitability for various land cover classes, and the sensitivity of these classes to disturbance by stressor factors. The assessment of regional habitat quality is conducted based on this information. The calculation formula is as follows:
H Q x j = H j × 1 D x j z D x j z + k z ,
where H Q x j represents the habitat quality index for grid x within habitat type j; D x j z denotes the habitat degradation level of grid x within habitat type j; H j stands for the habitat suitability of habitat type j, with values ranging from 0 to 1; k is the half-saturation constant, determined by the maximum habitat degradation level (taken as the square root of half the maximum value of the habitat degradation index results); and z is the normalization constant, typically set to 2.5.
(2)
Water conservation service
The InVEST model calculates water yield based on the Budyko water balance principle. However, due to the model’s omission of surface runoff factors, it leads to ecologically significant land units, such as forests, displaying unrealistically lower water yields per unit area compared to developed land. In order to address this limitation, the present study modifies the water conservation model based on the characteristics of the study area. This modification involves adjusting the water yield model by subtracting the contribution of surface runoff from the total water yield. The formula is as follows:
W R x j = 1 A E T x j P x × P x D x j ,
D x j = C x j × P x ,
where W R x j represents the annual water conservation of grid x in the j-th type of ecosystem. P x represents the annual precipitation of grid x. A E T x j , D x j , and C x j denote the annual actual evapotranspiration, surface runoff, and surface runoff coefficient of grid x within the jth type of ecosystem, respectively.
(3)
Carbon sequestration service
Carbon sequestration represents a crucial regulatory function within ecosystems, wherein terrestrial ecosystems modulate atmospheric carbon levels by sequestering carbon elements in the soil and vegetation. In this study, the InVEST model’s carbon module was employed to assess the spatial distribution of carbon storage in the ecosystems of Jinghong City. Based on different land use/cover types within the study area, carbon storage was categorized into four fundamental reservoirs: aboveground carbon pool, belowground carbon pool, soil carbon pool, and detritus carbon pool (i.e., deceased organic carbon pool) [44]. The formula is as follows:
C t o t a l = C a b o v e + C b e l o w + C s o i l + C d e a d ,
where C t o t a l , C a b o v e , C b e l o w , C s o i l , and C d e a d represent the total carbon sequestration(t·hm−2), aboveground biochar, underground biochar, soil organic carbon, and dead organic carbon, respectively.
(4)
Soil retention service
Soil retention services refer to the ability of different ecosystems to reduce soil erosion, representing a crucial ecosystem service closely tied to human well-being. In this study, the InVEST model’s sediment delivery ratio module was employed to represent soil retention in the Jinghong City area. Initially, the potential soil erosion, based on topographic and climatic conditions, was calculated—termed the soil erosion quantity under natural and vegetation-protected conditions ( R K L S x ). Subsequently, the actual soil erosion quantity in the study area was determined under human management and conservation measures ( U S L E x ). The soil retention quantity ( S R x ) was computed as the difference between the potential and actual soil erosion quantities. The formula is as follows:
U S L E x = R x × K x × L S x × C x × G x ,
R K L S x = R x × K x × L S x ,
S R x = R K L S x U S L E x ,
where R x represents the rainfall erosivity factor, K x is the soil erodibility factor, L S x denotes the slope length and steepness factor, C x accounts for the vegetation cover and management factor, and G x signifies the soil retention practice factor.
(5)
Integrated ecosystem services
Due to the varied units of different ecosystem services, standardization is applied to each type of ecosystem service. Subsequently, a weighted sum of the standardized values is calculated to obtain the composite ecosystem services score. Given the relatively high forest coverage in Jinghong City, substantial weight is assigned to the habitat quality service. The formula is as follows:
T E S = 0.4 × H Q + 0.2 × ( W C + C + S R ) ,
where TES stands for total ecosystem services, HQ for habitat quality, C for carbon sequestration, WC for water conservation, and SR for soil retention.

2.3. Dynamic Identification of Urban-Rural Gradient

(1)
Division of urban rings
The division of urban rings involves establishing a series of equidistant buffer zones outward from the city center, utilizing it as the fundamental unit to depict the spatial differentiation of urban expansion. These zones serve as the basis for computing spatial indicators and analyzing the spatial characteristics manifested during different stages of urbanization processes [45]. In accordance with the overall planning of Jinghong City (1999–2020), this study designates the intersection of Xuanwei Avenue and Mengbo Avenue as the central point or epicenter of Jinghong City. By using a 10 km buffer radius, a series of concentric rings extending outward from the center were established, forming the basic units for analyzing the dynamic spatial changes within the city. This process continues until the entire urban area is encompassed (Figure 2). Subsequently, the land density for each ring is calculated as follows:
L a n d D i = S i b S i S i w ,
where L a n d D i denotes the land density of the i-th concentric ring; S i is the total area of the i-th concentric ring; S i b and S i w represent the built-up land area and water area of the i-th concentric ring, respectively. In this study, water bodies are considered as non-buildable land. When calculating land density, the water area is subtracted from the total area.
(2)
Urban-rural gradient grading
Jiao [40] observed a spatial pattern of decreasing impervious surface density in an inverse S-shaped fashion radiating outward from the city center. He proposed the use of an inverse S-function to fit the variation trend of urban land density. In this study, we employed this methodology to further delineate urban-rural gradient layers and investigate the spatial characteristics of urban land expansion during the process of urbanization. The formula is as follows:
f r = 1 c 1 + e α [ 2 r D 1 ] + c ,
where f denotes urban land density; r represents the distance from the city center; α is a parameter determining the slope of the urban land density function curve; c indicates the lower asymptote of the function, representing the background value of urban land density in the peripheral areas outside the city; and D represents the estimated value of the city radius.
According to the inverse S-curve of urban construction land density, Jinghong City’s urban-rural gradient zones can be further delineated into four distinct segments: the core zone, near-urban zone, far-urban zone, and peripheral zone. Within the core zone, the construction land density is the highest, decreasing gradually. In the near-urban and far-urban zones, the density decreases rapidly, followed by a slower decline in the peripheral zone. The radius ranges for these zones are expressed as r1, r0-r1, r2-r0, D-r2 [46]. The formula is as follows:
r 0 = D 2 ,
r 1 = D 2 ( 1.316957 α + 1 ) ,
r 2 = D 2 ( 1.316957 α + 1 )
where r1 denotes the core zone, r1-r0 represents the inner urban area, r0-r2 corresponds to the suburban area, and beyond r2 is considered the outer urban periphery. α is the same as above (Figure 3).

3. Results

3.1. Characteristics of Spatiotemporal Changes in Ecosystem Services

Over the period from 2000 to 2020, comprehensive ecosystem services in Jinghong City exhibited a declining trend (Table 1). The overall ecosystem services value decreased from 0.63 in 2000 to 0.58 in 2020, representing a reduction rate of 8.56%. Habitat quality services, carbon sequestration and storage services, water yield services, and soil retention services all demonstrated a decreasing trend over time. Among these, soil retention services experienced the most significant decline, dropping from 0.0067 in 2000 to 0.0021 in 2020, indicating a reduction rate of 68.66%. Water yield services followed, with a decrease of 30.77%. Habitat quality services decreased from 0.87 in 2000 to 0.83 in 2020, representing a reduction rate of 4.05%. Carbon sequestration services exhibited a relatively smaller decline compared to other service types, with a reduction of 4.05% from 2000 to 2020. It is noteworthy that the period from 2000 to 2010 witnessed the most substantial decline in ecosystem services in Jinghong City. Overall, the capacity to supply ecosystem services in Jinghong City has been degrading annually, posing a significant threat to regional ecological security and the high-quality development of the city.
From a spatial perspective (Figure 4), the study highlights notable temporal and spatial variations in ecosystem services in Jinghong City from 2000 to 2020. The areas with high ecosystem service values are primarily distributed along the northern bank of the Lancang River, which is a national nature reserve, and in the northeastern region with higher elevation, where vegetation coverage is relatively abundant. In contrast, areas with lower ecosystem service values are located in the central areas of Jinghong City and densely populated townships. Over the 20-year period, there has been a noticeable trend of decreasing high-value areas and expanding low-value areas spatially. This trend is particularly evident in the southern regions, especially south of the city center, where the expansion of low-value areas is more pronounced. The phenomenon described is primarily due to the ongoing expansion of Jinghong City towards the south and west from 2000 to 2020. This has resulted in the gradual replacement of ecological land with urban construction land.
The spatial unevenness of habitat quality services is apparent when considering various ecosystem service types. Specifically, from 2000 to 2020, the area of high-value regions in the northern mountainous habitats of Jinghong City consistently decreased. Conversely, in the relatively flat southern regions, the area of low-value regions continues to expand as the urban area expands outward. Carbon sequestration services have a balanced spatial distribution, with high-value areas located in the higher-elevated northern regions. These areas include extensive tropical rainforests with high forest vegetation cover and relatively favorable baseline conditions for ecosystem services, including a high biological carbon reservoir.
The distribution of water conservation services exhibits significant heterogeneity, with a spatial pattern of high values in the northeast and low values in the southwest. Throughout the 20-year period, areas with high values were consistently observed across the entire region of Mengwang Township, as well as the eastern parts of Mengyang Township and Gino Township. The high-value regions have been decreasing in size, moving from the northern mountainous areas towards the central regions. Conversely, low-value areas are expanding from the southern Menglong Township towards the central plains.
The regions with high soil retention services are scattered throughout Jinghong City. These areas have extensive vegetation cover, which provides strong rainwater interception capabilities and high soil retention capacity. The urban areas of Jinghong, Menghan Township, and Menglong Township are primarily low-value areas, forming a “low-value inverted triangle” zone. This region, marked by the clustering of villages and towns, has experienced high levels of land development and intensity of use from 2000 to 2020.
In summary, over the two decades, the overall status of the four ecosystem services in Jinghong City has tended to deteriorate. The area of high-value regions has consistently diminished, while low-value areas have expanded annually, presenting a spatial trend that is gradually spreading from the city center outward.

3.2. Types and Spatial Distribution of Urban-Rural Gradient

Figure 5 and Table 2 show that the inverse S equation effectively fits the trend of decreasing urban land density from the center to the periphery in Jinghong City. The R2 values indicate high fitting accuracy of the urban land density distribution in Jinghong City, with respective values of 0.99, 0.98, and 0.96 for the years 2000, 2010, and 2020. The parameter α characterizes the degree of spatial concentration of built-up land. The values of parameter α decreased in 2000, 2010, and 2020, indicating that as built-up land expands, the concentration of the built-up area towards the city’s core decreases, resulting in a more dispersed urban morphology in Jinghong. The inverse S curve for the years 2000, 2010, and 2020 shows consistent spatiotemporal patterns, displaying a process of gradual decline, followed by rapid descent, and finally, a slow decrease until reaching a plateau. Based on built-up land density, Jinghong City is categorized into core areas, inner urban areas, suburban areas, and urban periphery. In order to incorporate the entire Jinghong City into the urban-rural gradient, 10 concentric rings with intervals of 10 km were delineated for areas beyond the urban periphery. In 2000, the core area was within 0–1.48 km, the inner urban area was within 1.48–2.13 km, the suburban area was within 2.13–2.78 km, and the urban periphery was beyond 2.78 km. In 2010, the core area expanded to 0–1.53 km, the inner urban area was within 1.53–2.30 km, the suburban area was within 2.30–3.08 km, and the urban periphery was beyond 3.08 km. In 2020, the core area expanded to 0–1.74 km, the inner urban area was within 1.74–3.26 km, the suburban area was within 3.26–4.77 km, and the urban periphery was beyond 4.77 km. All of the urban-rural gradient zones in Jinghong City expanded outward over the 20-year period.

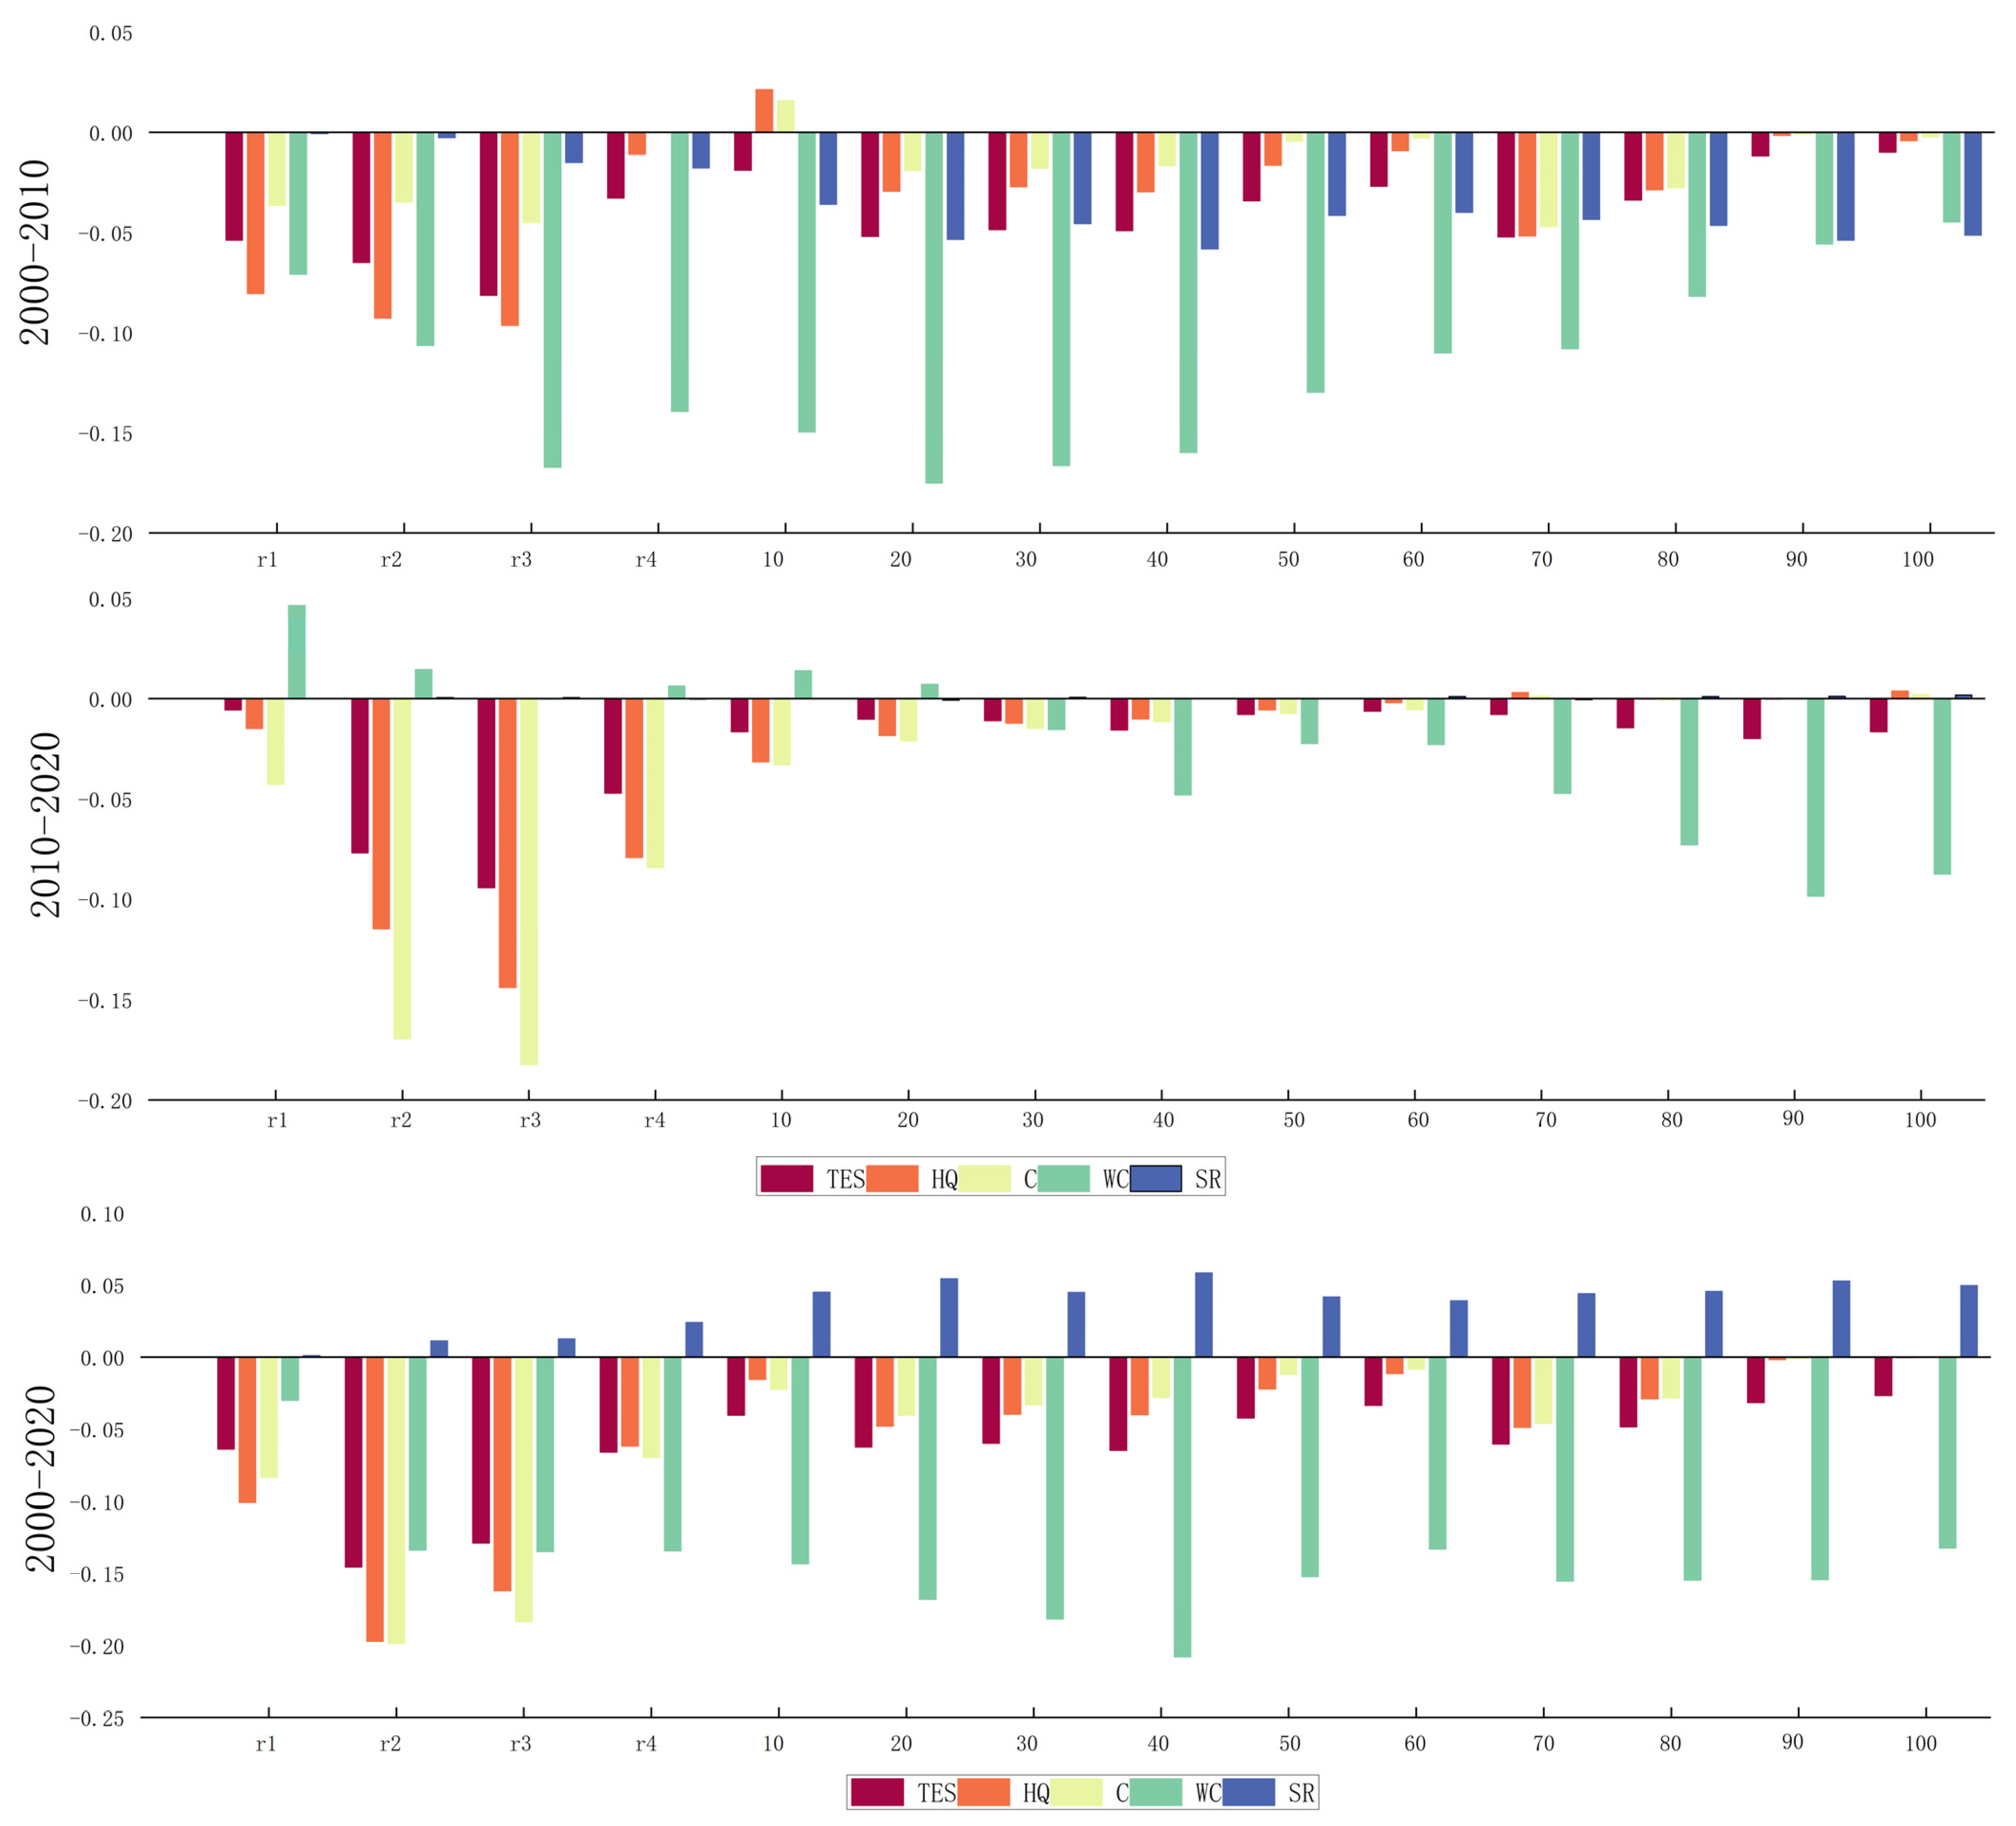
3.3. The Spatiotemporal Characteristics of Urban-Rural Gradient in Ecosystem Services

The changes in the urban-rural gradient of ecosystem services in Jinghong City were examined across three periods (2000–2010, 2010–2020, and 2000–2020). Significant variations were observed in the changes of different ecosystem service types along the gradient (Figure 6). The maximum loss in comprehensive ecosystem services from 2000 to 2020 was evident in the inner urban area, with a reduction of 0.146. The suburban area followed closely, experiencing a decrease of 0.129. During the periods 2000–2010 and 2010–2020, the suburban region consistently exhibits the highest loss in comprehensive ecosystem services, with reductions of 0.081 and 0.094, respectively. Notably, the decade from 2010 to 2020 sees the greatest loss of comprehensive ecosystem services in the suburban area (Figure 6). This suggests that over the 20-year span, the continuous urban expansion from the inner urban area to the suburban area in Jinghong City has intensified the loss of ecosystem services.
The loss of habitat quality services during the period from 2000 to 2020 was most pronounced within the inner urban areas, reaching 0.197, followed by suburban areas with a loss of 0.162. The peripheral regions, located beyond 100 km from the city, experienced the least habitat quality loss. During both the 2000–2010 and 2010–2020 periods, the greatest loss occurred in suburban areas. However, an interesting spatial observation emerged during the latter period (2010–2020), with an increase in habitat quality services observed in the region 70–100 km from the city (Figure 6). These findings indicate a continual decrease in ecosystem habitat quality services from the urban periphery towards the core areas of Jinghong City. The highest peaks are observed in the inner urban and suburban zones, while the least variation is observed in the areas furthest from the city, the habitat quality loss of which is minimal over the 20-year span.
The carbon sequestration service experienced the greatest loss in the inner urban areas during the period from 2000 to 2020, decreasing by 0.199. The least variation occurred in the spatial areas between 90 to 100 km on the urban periphery. Furthermore, comparing the periods 2010–2020 to 2000–2010, the loss of carbon sequestration service in the core, inner urban, and suburban areas increased by 17.5%, 386%, and 304%, respectively. During the 2000–2010 period, the area that experienced the greatest loss in carbon sequestration services was located approximately 70 km from the city, followed by the suburbs. In the years 2010–2020, the region with the greatest loss in carbon sequestration service shifted to the suburbs, while the areas around the 70 km ring experienced an increase in carbon sequestration service (Figure 6). This shift is attributed to Jinghong City’s recent efforts in response to the “returning farmland to forest” policy, involving the afforestation of cultivated land on the edge of the tropical rainforest, resulting in an enhancement of carbon sequestration capacity.
The region experiencing the greatest reduction in water conservation services during the period from 2000 to 2020 is located around the 40 km ring, with a decrease of 0.208. Conversely, the core urban area exhibits the smallest decrease, amounting to 0.030. From 2000 to 2010, the outskirts (20–40 km from the city) and suburban regions experienced the most significant reductions, with losses ranging from 0.167 to 0.160. From 2010 to 2020, the largest reduction occurred in the 80–100 km area beyond the city periphery, with a decrease ranging from 0.098 to 0.072. It is worth noting that water conservation services show an increasing trend from the city core to a distance of 20 km beyond the urban periphery (Figure 6). The expansion of urbanization has led to a continuous outward migration of water conservation functionality, with the areas beyond the urban periphery experiencing the greatest reduction in water conservation services. Recent growth in construction land, population increase, and rising water demand in the city core may be contributing factors to this phenomenon. The “Dai Ethnic Water City Construction” project in Jinghong City involves redirecting water resources from the outskirts to the urban area, resulting in an increase in water conservation services in the city core and its immediate surroundings. However, this comes at the expense of water conservation functionality beyond the urban periphery.
The soil retention service experienced the greatest losses during the period from 2000 to 2020 in the peripheral zones of the city at 40 km and 90 km, with reductions of 0.058 and 0.053, respectively (Figure 6). Conversely, the core and inner urban areas exhibited minimal changes, with reductions ranging from 0.001 to 0.011. Overall, there was a trend of increasing loss from the city core towards the outer regions. Between 2000 and 2010, the soil retention function saw the most significant decrease in the region extending up to 40 km from the city periphery, reaching a maximum reduction of 0.058, followed by a gradual decline towards 20 km. Additionally, the area located 90–100 km from the city periphery also experienced considerable losses in soil retention function, ranging from 0.054 to 0.051. From 2010 to 2020, soil retention services decreased less than in the previous decade. The most significant decline was observed at a distance of 20 km, while an increase in soil retention services was noted between 9 and 100 km. The findings suggest that Jinghong City’s soil and water conservation capabilities decreased during the first decade of the study due to intense human development, making the area more vulnerable to geological disasters. However, in the past decade, the city has taken measures to control landslides in regions prone to geological disasters, resulting in improved soil and water conservation services and reduced risks of geological disasters.
In summary, the ecosystem’s water yield conservation service experienced the greatest reduction in the peripheral area beyond 40 km from the urban center from 2000 to 2020, with a decrease of 0.208. Subsequently, carbon sequestration services and habitat quality services in the inner-city regions also witnessed substantial losses, decreasing by 0.199 and 0.197, respectively. Additionally, from 2010 to 2020, the ecosystem’s carbon sequestration service incurred the largest reduction in the suburban areas, decreasing by 0.182, while habitat quality services ranked second with a decrease of 0.144. In the period from 2000 to 2010, the water yield conservation service of the ecosystem experienced the most significant loss in the area beyond 20 m from the urban periphery, declining by 0.175. Simultaneously, noticeable reductions in water yield conservation services were observed in the suburban and peripheral urban areas ranging from 30 to 40 km, with decreases falling within the range of 0.160 to 0.166.
As urbanization progresses, developed land continues to expand annually, pushing suburban areas outward. Between 2010 and 2020, the suburban area expanded by 1.69 km. This expansion has resulted in the conversion of forested areas, cultivated land, and water bodies into developed land, leading to a continuous reduction in their respective areas. The construction of the Dai Cultural Park and tourism development along the Lancang River have significantly occupied large areas of forest and agricultural land, leading to a decline in the ecosystem’s carbon sequestration capacity and habitat quality. In regions located 20 to 40 km from the urban periphery, there has been recent development in aquaculture and hydraulic engineering. The conversion of large bodies of water into developed land may be a contributing factor to changes in water conservation service quantity.

4. Discussion

4.1. Factors Driving Changes in the Urban-Rural Gradient

Based on the results of the urban land density inverse S-function, there has been a continuous outward expansion of concentric rings along the urban-rural gradient in Jinghong City from 2000 to 2020. This indicates that the urban morphology has become more dispersed over the two decades, with the area of urban built-up land extending outward. During the urbanization construction process, traditional extensive land-use practices can result in land type conversions and ecological deterioration. The “General Urban Plan of Jinghong City (1999–2020)” indicates that the urban structure pattern in Jinghong City underwent significant changes between 2000 and 2020. The original pattern was characterized by clusters along the north-south direction of the Lancang River. However, it has transformed into a clustered layout along elevated areas near the mountains. This restructuring involved enhancing the central area and expanding four regions: Gadong, Gasa, Manlongfeng, and the south bank of the Lancang River. As a result, a new urban pattern has emerged, continuously expanding from the south bank of the Lancang River towards the southwest. This shift in the urban structure might be a direct cause for the increased dispersion of the urban morphology in the study area over the 20-year period, confirming the findings of our research.
Existing research suggests that population and economic growth are key drivers of changes in land use and ecosystem function in both urban and rural areas [47,48,49]. After the establishment of the Greater Mekong Subregion Cooperation (GMS) in 1992 [50], Jinghong City took advantage of the significant development opportunities. Between 2000 and 2020, Jinghong City’s Gross Domestic Product (GDP) grew from 2.48 billion yuan to 32.52 billion yuan, a remarkable increase of 1211.2%. The city’s economy shifted from being primarily reliant on agriculture and tourism services to industrial, financial, and service-oriented sectors. During the same period, the city’s population increased by 199,100 individuals, representing a growth rate of 44.87%. According to data released by the Jinghong City Statistics Bureau, the 2020 Seventh National Population Census Bulletin [51], the city’s total population (permanent residents) increased by 122,802 individuals compared to the Sixth National Population Census in 2010, reflecting a growth rate of 23.62%. In comparison to 2010, where the urban population was 205,523 and the rural population was 314,412, the urban population increased by 152,994 individuals, while the rural population decreased by 30,192 individuals. The significant shift in population structure from rural to urban areas during the period from 2010 to 2020 resulted in a surge in urban population, promoting an increase in urban construction land and a decrease in cultivated land. These factors contribute to the inherent driving mechanisms of Jinghong City’s tendency for urban expansion.
Additionally, the built-up area of Jinghong City increased by 8.2 km2 from 2000 to 2010 and by 15.7 km2 from 2010 to 2020. The decade from 2010 to 2020 witnessed the most rapid urban construction period in Jinghong City, with parts of the urban construction land exceeding the designated construction boundaries outlined in the original master plan. The majority of these expansions evolved into tourist-oriented land use. This phenomenon also explains why the outward migration range of each gradient layer from 2010 to 2020 exceeded that of the various sub-periods from 2000 to 2010.

4.2. The Impact of Urbanization on Ecosystem Services

Land use change is a significant factor that drives spatial patterns and variations in ecosystem services [2,52]. In Jinghong City, alterations in land use along the Lancang River-Mekong international river, as well as developments along the river, contribute to changes in ecosystem services. The Lancang River flows through Jinghong City from northwest to southeast. In the early 1990s, the primary urban area was divided into the Jiangnan (current central area) and Jiangbei areas. Urban development was concentrated in the Jiangnan area, extending southeast. By 2000, this area’s development had nearly saturated, leading to residential areas dispersing from the central core outward. This spatial shift is a primary factor contributing to the most significant change in comprehensive ecosystem services within the urban area over the past two decades.
The results suggest significant alterations in different ecosystem services in the peri-urban and outer urban areas of Jinghong City from 2000 to 2020. Since 2007, spurred by the tourism real estate boom in Xishuangbanna, where Jinghong serves as the state capital, the city has experienced rapid growth in the tourism industry. Numerous commercial, retirement, and tourism real estate development projects have emerged around the central urban area of Jinghong. These projects have primarily transformed large expanses of farmland and forested areas in the nearby suburbs (Gasuo, Gadong). The unplanned expansion of construction in the urban periphery and the excessive exploitation of high-quality natural resources have led to the degradation of ecosystem structure and function.
Simultaneously, driven by economic interests, rubber cultivation in Jinghong City has seen a rapid increase. Natural forests have suffered severe damage, and over the past two decades, besides rubber, other economically valuable tree species such as tea, fruit trees, and bananas have replaced natural forests, farmland, and water bodies [53,54]. This has resulted in the isolation of the regional ecosystem, causing a decline in the supply of ecosystem services. Existing research indicates that converting natural forests to rubber plantations has significant environmental impacts, including reduced water storage [55], carbon storage [56], soil productivity [57], and biodiversity [58]. Despite the government’s “retire rubber, return forests” policy, implemented in 2009 with 63,000 acres retired by 2019, achieving an impressive 85.04% coverage across the city, various ecosystem services have continued to decline across the urban-rural gradient.
Moreover, it’s worth noting that Jinghong City’s tropical forests form a globally recognized India-Myanmar biodiversity hotspot. The Lancang River-Mekong Basin is a critical transboundary river basin in Asia, facing controversy due to conflicting interests between upstream hydropower development, agricultural production, and biological corridors. This has also contributed to the reduction of water conservation functions in the city’s periphery. Jinghong City, being the sole habitat for Asian elephants in China, gained attention in March 2021 when a group of 17 elephants “left home and traveled north,” potentially linked to habitat destruction such as the replacement of tropical rainforests and farmland with rubber plantations, tea gardens, traditional Chinese medicine plantations, and the replacement of water sources with hydraulic engineering projects.

4.3. Implications for Urban and Landscape Planning

In order to achieve sustainable urban development and harmonize the relationship between economic development and ecological conservation, this study proposes recommendations for different urban-rural gradient regions based on research findings. The aim is to mitigate the impact on ecosystem services during the urbanization process.
(1)
In the urban core areas, we recommend a more comprehensive development of green infrastructure and an increase in urban green coverage. Urban green spaces provide a range of ecosystem services, including air and water purification, climate regulation, soil erosion reduction, and enhancement of human psychological well-being [59,60,61]. In order to maximize the ecological benefits of urban green areas, it is essential to plan urban landscapes scientifically and systematically, ensuring the even distribution of green spaces and structures [62].
(2)
Inner urban areas, where urbanization mainly occurs, experience the greatest loss of ecosystem services. In order to address this issue, urban planning should adhere to the principle of intensive land use, improve land use efficiency, and control the expansion of land in rapidly developing urban areas. For the southern bank of the Lancang River, it is advised to preserve essential mountainous and river corridor areas, leveraging their temperature regulation and recreational functions. It is important to maintain a balanced approach to development that considers both economic growth and environmental protection. In the northern bank region, it is recommended to exercise strict control over construction intensity. Emphasis should be placed on optimizing and developing existing resources to enhance soil retention and prevent landslides.
(3)
Suburban areas, characterized by fragile habitat quality for ecosystem services, require coordinated industrial development and urban-rural interaction. Efforts should focus on orderly population aggregation and advancing the construction of urban-rural service facilities. Additionally, while respecting nature, the construction of ecological networks, including farmland-forestry networks and natural structures of rivers and lakes, should be promoted to enhance habitat quality and create buffer zones for ecosystem protection.
(4)
The extensive distribution of farmland in urban peripheries serves essential functions such as food supply, water conservation, and soil protection. Urban expansion should prioritize the protection of basic farmland, control the expansion of construction land, and establish boundaries for urban development growth, such as defining permanent basic farmland boundaries. Furthermore, environmental improvements in rural settlements will enhance habitat quality, consequently promoting increased food supply capacity [28].
(5)
Beyond the urban periphery lie areas with highly functional ecosystems, including forests, grasslands, and water bodies. These regions act as critical safety barriers for the entire city and should be prioritized for ecosystem protection. Future efforts should continue implementing ecological conservation policies, such as the “returning rubber to forests” initiative. Additionally, the initiation of tropical rainforest restoration projects is suggested to mitigate ecological risks arising from excessive development and the replacement of natural forests with economic plantations. Concerning the Lancang River’s hydraulic projects, development activities should not compromise the ecosystem’s regenerative capacity, necessitating strict control over development intensity and scale. It is essential to determine the upper limits for natural resource development in this region.

4.4. Limitations and Future Research Directions

Within the scope of this study, it is important to acknowledge certain limitations that could be further explored in future research. Firstly, the study assessed only four crucial types of ecosystem services based on the survey of Jinghong City, considering practicality and data availability. However, given the diversity of ecosystem services, these four types alone may not adequately characterize the overall state of ecosystem services in Jinghong City. Future research should consider a broader perspective that includes the four major types of ecosystem services: supporting, provisioning, regulating, and cultural services. This would require selecting a wider range of ecosystem service types, creating a comprehensive evaluation framework, and quantifying these services to thoroughly investigate changes in ecosystem services. It is important to include leisure tourism services in the assessment framework, given Jinghong City’s unique tourism landscape resources.
Furthermore, to standardize the units of ecosystem service indicators, this study normalized each ecosystem service and used a weighted summation method to calculate the comprehensive ecosystem services index. However, it is crucial to note that the determination of weights involves some subjectivity. Future research should focus on constructing optimized and objective quantitative modeling methods to assess ecosystem services comprehensively.
The urban-rural gradient was delineated based on the spatial distribution of urban land density, dividing the area into core, inner city, suburban, and peripheral urban zones. However, the classification beyond the peripheral urban zones relied solely on concentric circles at 10 km intervals, encompassing Jinghong City in ten concentric circles. In order to enhance this approach, subsequent research could incorporate directional factors in addition to concentric circles to explore variations in ecosystem services along each gradient direction.

5. Conclusions

This study assesses four ecosystem services and the overall ecosystem service in the context of urban-rural gradient. The spatiotemporal evolution characteristics of ecosystem services along the gradient are explored. The results indicate the following trends:
(1)
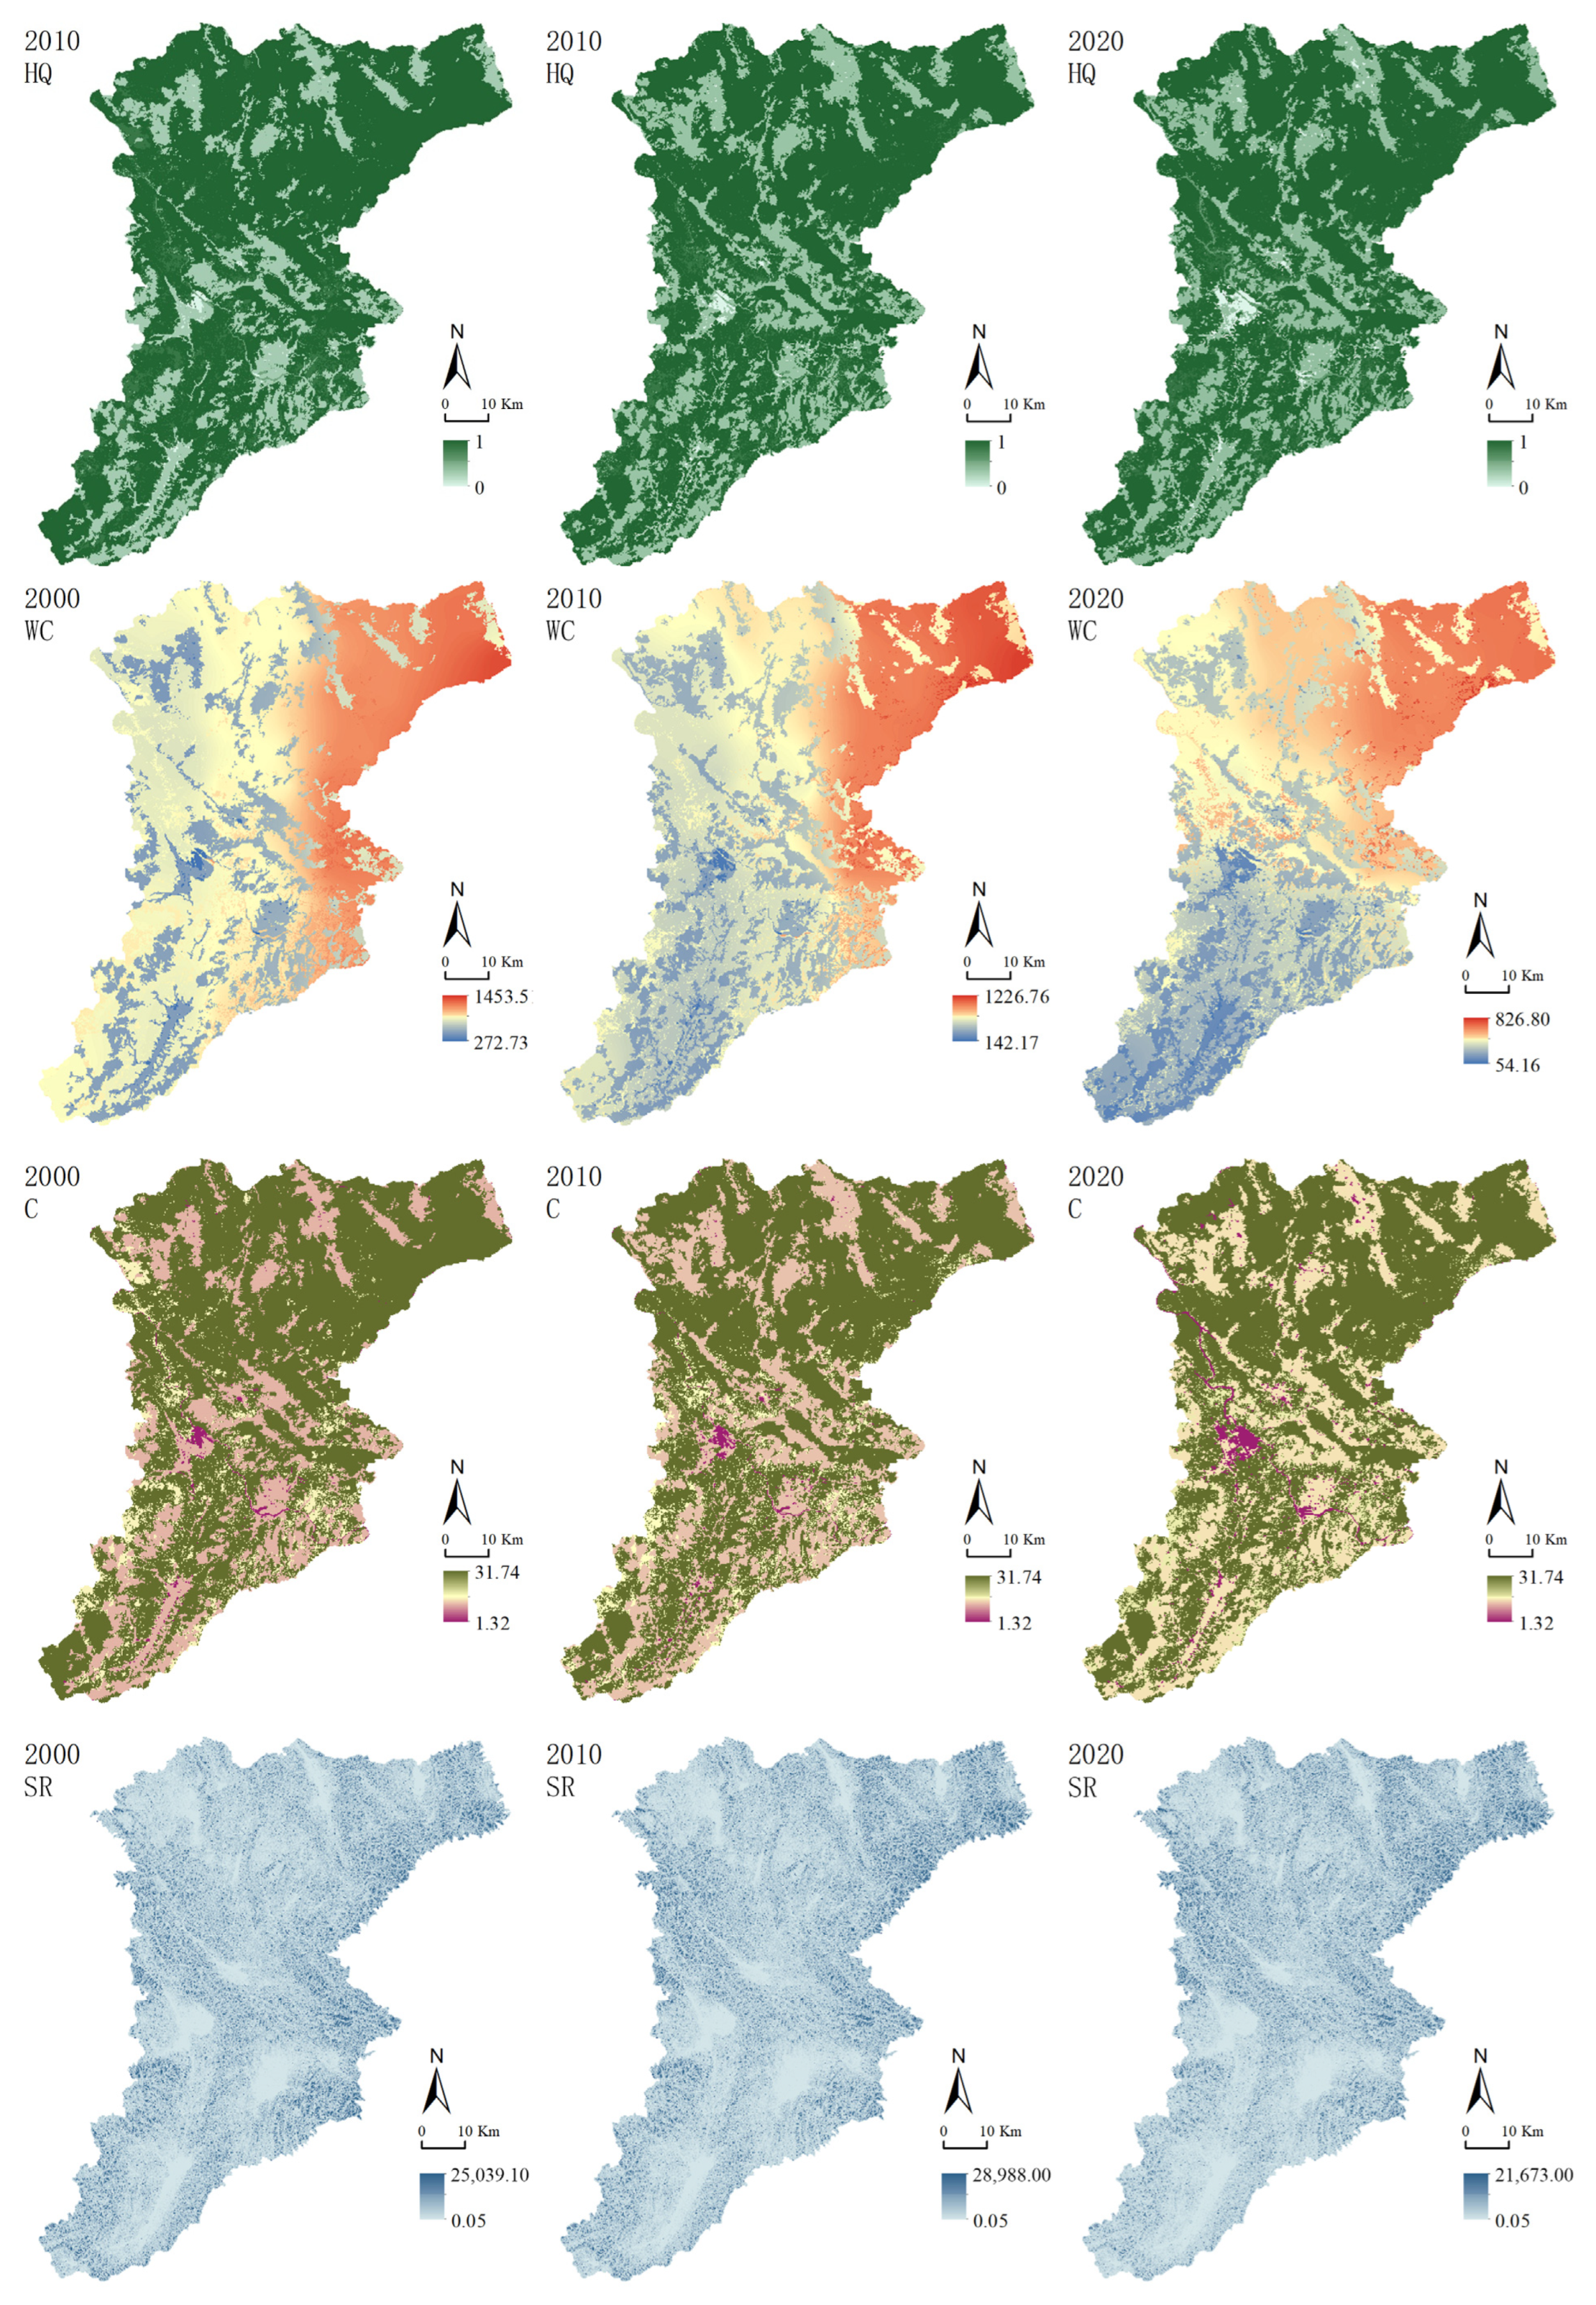
From 2000 to 2020, habitat quality, water conservation, carbon sequestration, soil retention, and the comprehensive ecosystem service in Jinghong City declined. Soil retention experienced the most substantial decrease. Additionally, the high-value areas for these ecosystem services progressively diminished, whereas low-value areas expanded annually. This reveals a spatial pattern spreading outward from the city center. Over the two decades, there was a gradual degradation in the provisioning capacity of ecosystem services in Jinghong City. This emphasizes the need for attention to the ecological security of the region.
(2)
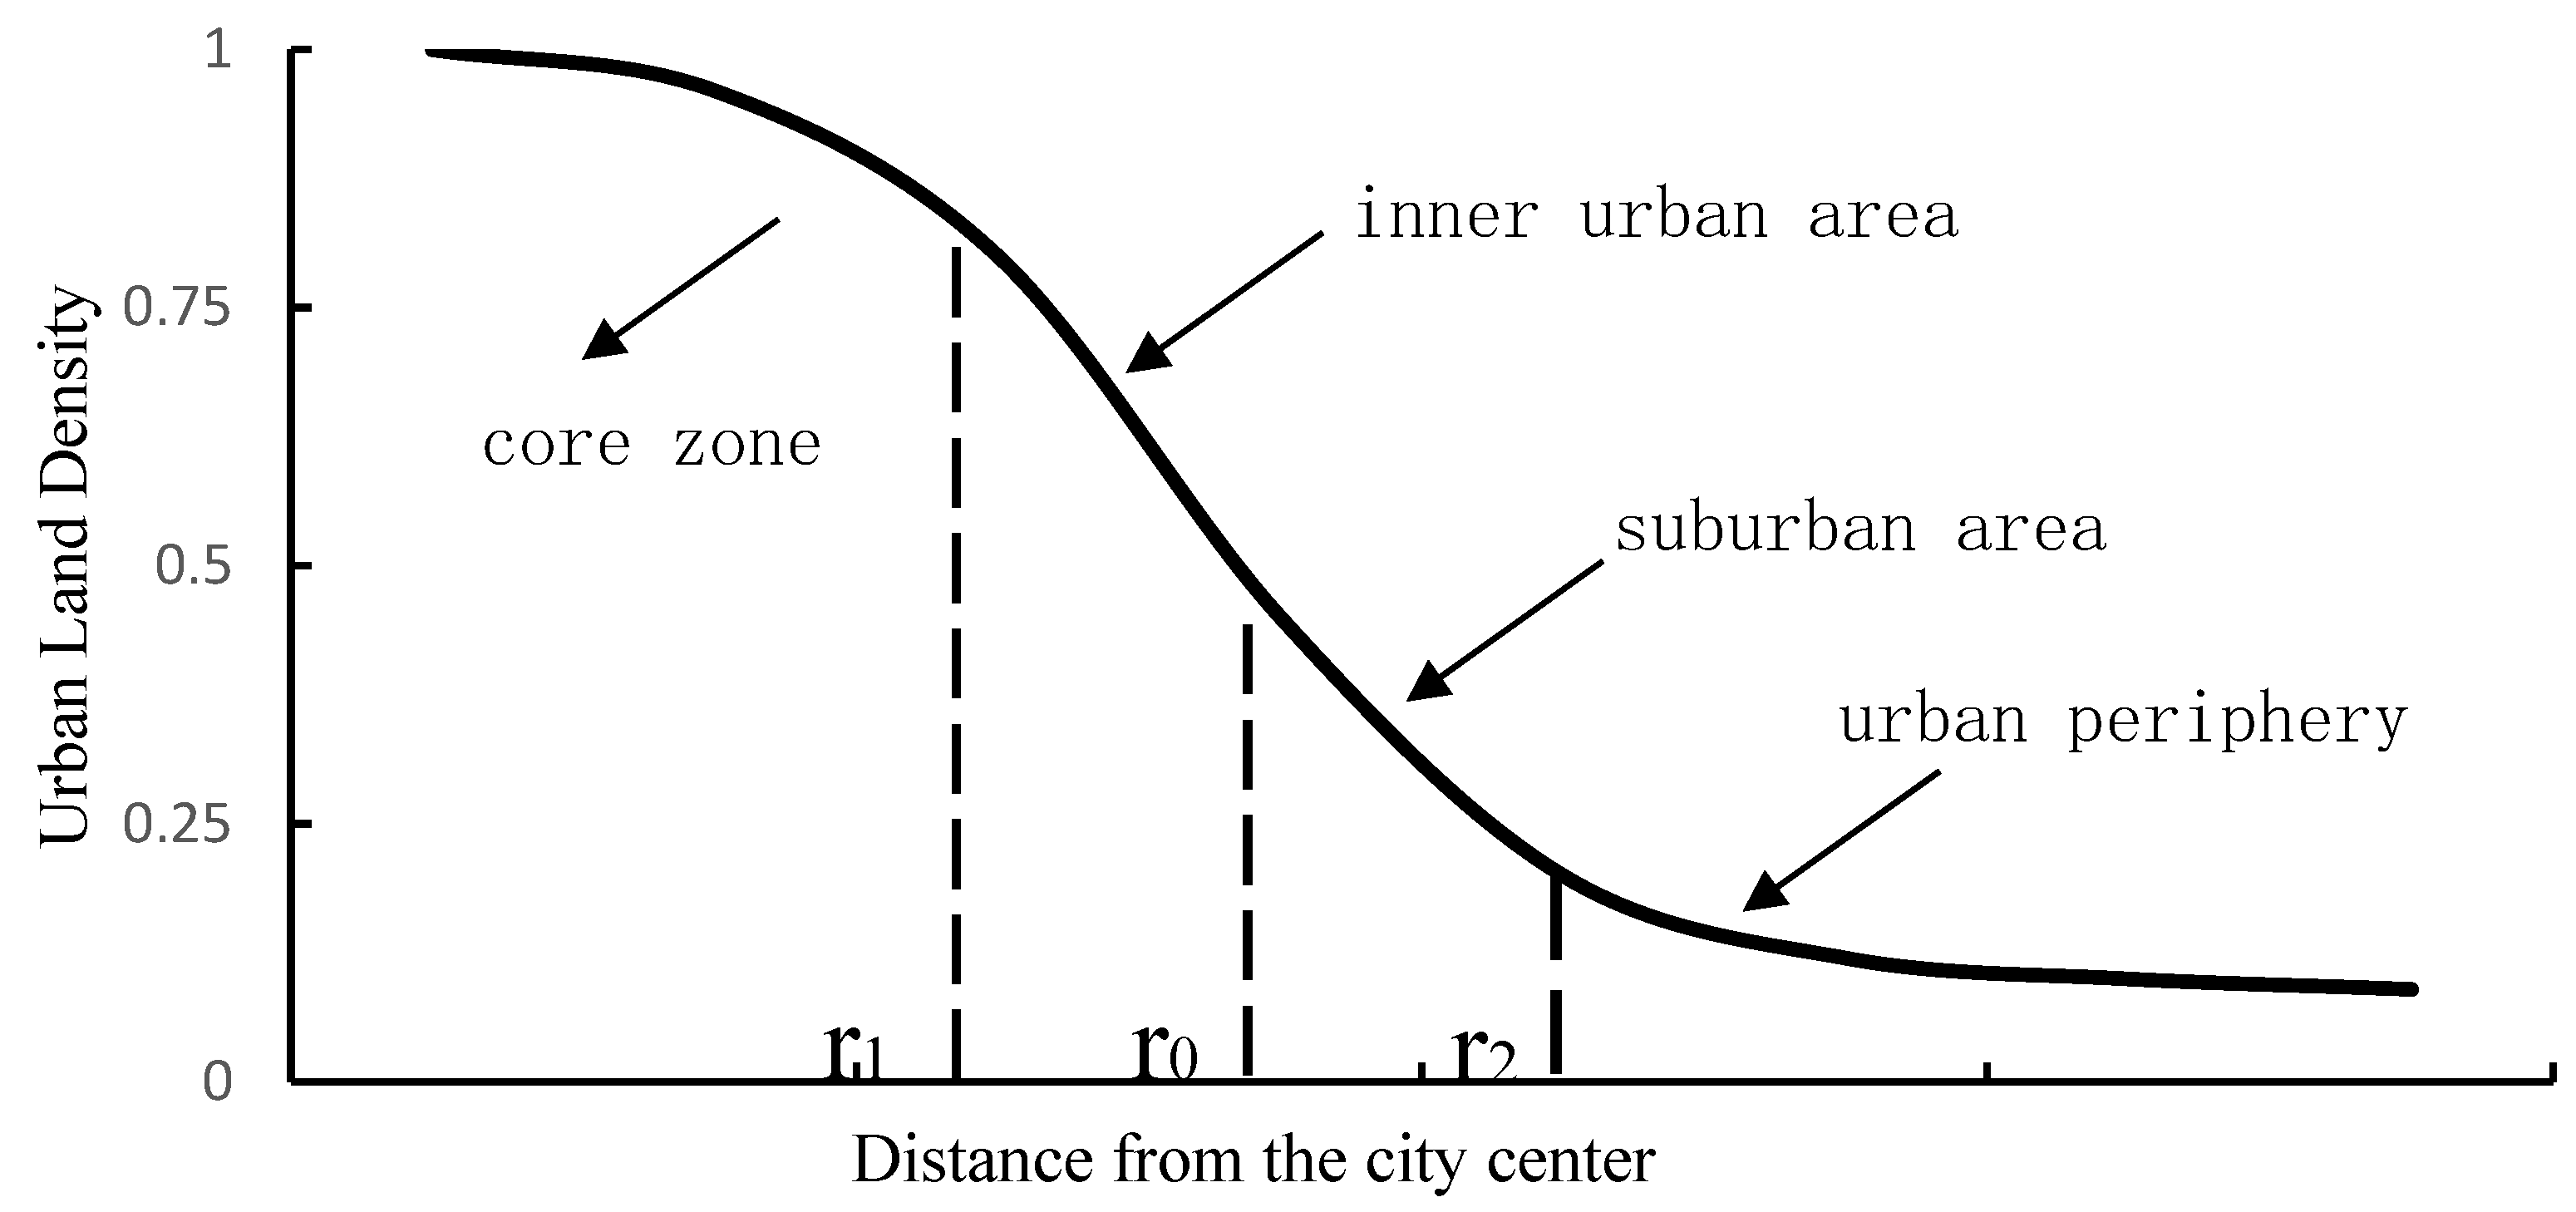
Based on the distribution of urban land density, Jinghong City is classified into four urban-rural gradient types: the core area, inner city, suburban area, and urban periphery. Each gradient zone experienced varying degrees of outward expansion over the 20-year period, with the movement range from 2010 to 2020 being notably larger than that from 2000 to 2010. This expansion marks a significant trend of urbanization and spatial sprawl.
(3)
The urban-rural gradient has proven to be a robust tool for investigating spatial heterogeneity in ecosystem services. The research identifies notable variations in the spatial distribution of different types of ecosystem services along the gradient. Over the two decades, there were consistent patterns of losses in habitat quality, carbon sequestration, and comprehensive ecosystem services. These losses were primarily concentrated in the inner urban area, with the regions experiencing the most substantial losses shifting outward over time. From 2010 to 2020, the areas with the greatest losses were predominantly located in the suburban zone. Meanwhile, water conservation and soil retention services suffered the greatest losses in the urban periphery. As urbanization expanded, water conservation became increasingly compromised. This research provides valuable insights into urban planning and the sustainable development of urban and rural regions.

Supplementary Materials

The following supporting information can be downloaded at: https://www.mdpi.com/article/10.3390/land13030306/s1, Table S1. The carbon density of each land use/land cover (mg/ha). Table S2. Biophysical table for water yield. Table S3. Biophysical table for soil retention. Table S4. Threat source impact distance level weights. Table S5. Sensitivity of threat factors for different land uses. Refs. [63,64,65,66,67,68] cited in Supplementary Materials.

Author Contributions

Conceptualization, Q.G.; methodology, Q.G.; software, Q.W.; validation, Q.G.; formal analysis, Q.G.; investigation, Q.W.; resources, Q.G.; data curation, Q.W.; writing—original draft preparation, Q.G. and C.G.; writing—review and editing, Q.G. and L.C.; visualization, Q.W. and H.L.; supervision, Q.G.; project administration, L.C.; funding acquisition, L.C. All authors have read and agreed to the published version of the manuscript.

Funding

This research was funded by Key Laboratory of Agricultural Big Data, Ministry of Agriculture (grant number JBYW-ALL-2021-42-3), National Natural Science Foundation of China (grant number 42106215), Natural Science Foundation of Shandong Province, China (grant number ZR2021QD064) and Fundamental Research Funds for the Central Universities (grant number 22CX06033A).

Institutional Review Board Statement

Not applicable.

Informed Consent Statement

Not applicable.

Data Availability Statement

The data presented in this study are openly available (see Section 2.1 for details).

Conflicts of Interest

The authors declare no conflicts of interest. The funders had no role in the design of the study; in the collection, analyses, or interpretation of data; in the writing of the manuscript; or in the decision to publish the results.

References

  1. Zhang, Z.; Peng, J.; Xu, Z.; Wang, X.; Meersmans, J. Ecosystem Services Supply and Demand Response to Urbanization: A Case Study of the Pearl River Delta, China. Ecosyst. Serv. 2021, 49, 101274. [Google Scholar] [CrossRef]
  2. Gordon, A.; Simondson, D.; White, M.; Moilanen, A.; Bekessy, S.A. Integrating Conservation Planning and Landuse Planning in Urban Landscapes. Landsc. Urban Plan. 2009, 91, 183–194. [Google Scholar] [CrossRef]
  3. Ding, Z.; Zheng, H.; Wang, J.; O’Connor, P.; Li, C.; Chen, X.; Li, R.; Ouyang, Z. Integrating Top-Down and Bottom-Up Approaches Improves Practicality and Efficiency of Large-Scale Ecological Restoration Planning: Insights from a Social–Ecological System. Engineering, 2022; in press. [Google Scholar] [CrossRef]
  4. Tang, H.; Peng, J.; Jiang, H.; Lin, Y.; Dong, J.; Liu, M.; Meersmans, J. Spatial Analysis Enables Priority Selection in Conservation Practices for Landscapes That Need Ecological Security. J. Environ. Manag. 2023, 345, 118888. [Google Scholar] [CrossRef] [PubMed]
  5. Ostrom, E. A General Framework for Analyzing Sustainability of Social-Ecological Systems. Science 2009, 325, 419–422. [Google Scholar] [CrossRef] [PubMed]
  6. Qiu, S.; Peng, J.; Dong, J.; Wang, X.; Ding, Z.; Zhang, H.; Mao, Q.; Liu, H.; Quine, T.A.; Meersmans, J. Understanding the Relationships between Ecosystem Services and Associated Social-Ecological Drivers in a Karst Region: A Case Study of Guizhou Province, China. Prog. Phys. Geogr. Earth Environ. 2021, 45, 98–114. [Google Scholar] [CrossRef]
  7. Zheng, H.; Li, Y.; Robinson, B.E.; Liu, G.; Ma, D.; Wang, F.; Lu, F.; Ouyang, Z.; Daily, G.C. Using Ecosystem Service Trade-Offs to Inform Water Conservation Policies and Management Practices. Front. Ecol. Environ. 2016, 14, 527–532. [Google Scholar] [CrossRef]
  8. China Statistical Yearbook—2022. Available online: https://www.stats.gov.cn/sj/ndsj/2022/indexch.htm (accessed on 6 January 2024).
  9. What Are the Quantities of Urban Construction Land and Rural Construction Land in China, Respectively? Available online: https://www.mnr.gov.cn/zt/hd/tdr/24tdr/nwwd/201404/t20140430_2050979.html (accessed on 6 January 2024).
  10. Yue, W.; Zhang, L.; Liu, Y. Measuring Sprawl in Large Chinese Cities along the Yangtze River via Combined Single and Multidimensional Metrics. Habitat Int. 2016, 57, 43–52. [Google Scholar] [CrossRef]
  11. Xu, Z.; Fan, W.; Wei, H.; Zhang, P.; Ren, J.; Gao, Z.; Ulgiati, S.; Kong, W.; Dong, X. Evaluation and Simulation of the Impact of Land Use Change on Ecosystem Services Based on a Carbon Flow Model: A Case Study of the Manas River Basin of Xinjiang, China. Sci. Total Environ. 2019, 652, 117–133. [Google Scholar] [CrossRef] [PubMed]
  12. Liu, R.; Dong, X.; Wang, X.; Zhang, P.; Liu, M.; Zhang, Y. Study on the Relationship among the Urbanization Process, Ecosystem Services and Human Well-Being in an Arid Region in the Context of Carbon Flow: Taking the Manas River Basin as an Example. Ecol. Indic. 2021, 132, 108248. [Google Scholar] [CrossRef]
  13. Baró, F.; Palomo, I.; Zulian, G.; Vizcaino, P.; Haase, D.; Gómez-Baggethun, E. Mapping Ecosystem Service Capacity, Flow and Demand for Landscape and Urban Planning: A Case Study in the Barcelona Metropolitan Region. Land Use Policy 2016, 57, 405–417. [Google Scholar] [CrossRef]
  14. Xu, Z.; Wei, H.; Dong, X.; Liu, Y.; Xue, H. Evaluating the Ecological Benefits of Plantations in Arid Areas from the Perspective of Ecosystem Service Supply and Demand-Based on Emergy Analysis. Sci. Total Environ. 2020, 705, 135853. [Google Scholar] [CrossRef] [PubMed]
  15. Wang, L.; Zheng, H.; Wen, Z.; Liu, L.; Robinson, B.E.; Li, R.; Li, C.; Kong, L. Ecosystem Service Synergies/Trade-Offs Informing the Supply-Demand Match of Ecosystem Services: Framework and Application. Ecosyst. Serv. 2019, 37, 100939. [Google Scholar] [CrossRef]
  16. Kroll, F.; Müller, F.; Haase, D.; Fohrer, N. Rural–Urban Gradient Analysis of Ecosystem Services Supply and Demand Dynamics. Land Use Policy 2012, 29, 521–535. [Google Scholar] [CrossRef]
  17. Foresman, T.W.; Pickett, S.T.A.; Zipperer, W.C. Methods for Spatial and Temporal Land Use and Land Cover Assessment for Urban Ecosystems and Application in the Greater Baltimore-Chesapeake Region. Urban Ecosyst. 1997, 1, 201–216. [Google Scholar] [CrossRef]
  18. Luck, M.; Wu, J. A Gradient Analysis of Urban Landscape Pattern: A Case Study from the Phoenix Metropolitan Region, Arizona, USA. Landsc. Ecol. 2002, 17, 327–339. [Google Scholar] [CrossRef]
  19. Hahs, A.K.; McDonnell, M.J. Selecting Independent Measures to Quantify Melbourne’s Urban–Rural Gradient. Landsc. Urban Plan. 2006, 78, 435–448. [Google Scholar] [CrossRef]
  20. McDonnell, M.J.; Pickett, S.T.A. Ecosystem Structure and Function along Urban-Rural Gradients: An Unexploited Opportunity for Ecology. Ecology 1990, 71, 1232–1237. [Google Scholar] [CrossRef]
  21. Blair, R.B. Land Use and Avian Species Diversity Along an Urban Gradient. Ecol. Appl. 1996, 6, 506–519. [Google Scholar] [CrossRef]
  22. McDonnell, M.J.; Pickett, S.T.A.; Groffman, P.; Bohlen, P.; Pouyat, R.V.; Zipperer, W.C.; Parmelee, R.W.; Carreiro, M.M.; Medley, K. Ecosystem Processes along an Urban-to-Rural Gradient. Urban Ecosyst. 1997, 1, 21–36. [Google Scholar] [CrossRef]
  23. Nagy, R.C.; Lockaby, B.G. Urbanization in the Southeastern United States: Socioeconomic Forces and Ecological Responses along an Urban-Rural Gradient. Urban Ecosyst 2011, 14, 71–86. [Google Scholar] [CrossRef]
  24. Wang, X.; Su, Y.; Ren, Y.; Zhang, H.; Sun, X.; Ouyang, Z. Urban ecosystem: Highly spatial heterogeneity. Acta Ecol. Sin. 2020, 40, 5103–5112. [Google Scholar]
  25. Herrero-Jáuregui, C.; Arnaiz-Schmitz, C.; Herrera, L.; Smart, S.M.; Montes, C.; Pineda, F.D.; Schmitz, M.F. Aligning Landscape Structure with Ecosystem Services along an Urban–Rural Gradient. Trade-Offs and Transitions towards Cultural Services. Landsc. Ecol 2019, 34, 1525–1545. [Google Scholar] [CrossRef]
  26. Peng, J.; Wang, X.; Liu, Y.; Zhao, Y.; Xu, Z.; Zhao, M.; Qiu, S.; Wu, J. Urbanization Impact on the Supply-Demand Budget of Ecosystem Services: Decoupling Analysis. Ecosyst. Serv. 2020, 44, 101139. [Google Scholar] [CrossRef]
  27. Larondelle, N.; Haase, D. Urban Ecosystem Services Assessment along a Rural–Urban Gradient: A Cross-Analysis of European Cities. Ecol. Indic. 2013, 29, 179–190. [Google Scholar] [CrossRef]
  28. Cai, Z.; Fang, C.; He, Q.; Yan, J.; Gao, D.; Liu, Z. Urban-Rural Gradient Identification and Ecosystem Service Response in Main Urban Area of Nanchang Based on Landscape Clustering. Res. Environ. Sci. 2022, 35, 806–817. [Google Scholar] [CrossRef]
  29. Tonyaloğlu, E.E. Spatiotemporal Dynamics of Urban Ecosystem Services in Turkey: The Case of Bornova, Izmir. Urban For. Urban Green. 2020, 49, 126631. [Google Scholar] [CrossRef]
  30. Kim, I.; Kwon, H.; Kim, S.; Jun, B. Identification of Landscape Multifunctionality along Urban-Rural Gradient of Coastal Cities in South Korea. Urban Ecosyst. 2020, 23, 1153–1163. [Google Scholar] [CrossRef]
  31. Qin, Y.L.; Shi, P.; He, W.H.; Huo, C.P.; Li, P.; Li, Z.B.; Yang, S.T.; Feng, Z.H. Influence of urbanization on landscape pattern and ecosystem service value in Xi’an City. Acta Ecol. Sin. 2020, 40, 8239–8250. [Google Scholar]
  32. Zhang, J.; Wu, Z.; Lv, Z.; Gao, Y. Extent effect of landscape gradient analysis of urban-rural transect. Chin. J. Ecol. 2008, 27, 978–984. [Google Scholar]
  33. Baró, F.; Gómez-Baggethun, E.; Haase, D. Ecosystem Service Bundles along the Urban-Rural Gradient: Insights for Landscape Planning and Management. Ecosyst. Serv. 2017, 24, 147–159. [Google Scholar] [CrossRef]
  34. Jia, W.; Zhao, S. Trends and Drivers of Land Surface Temperature along the Urban-Rural Gradients in the Largest Urban Agglomeration of China. Sci. Total Environ. 2020, 711, 134579. [Google Scholar] [CrossRef]
  35. Sengupta, S.; Mondal, M.; Basu, P. Bird Species Assemblages across a Rural Urban Gradient around Kolkata, India. Urban Ecosyst. 2014, 17, 585–596. [Google Scholar] [CrossRef]
  36. Salvati, L.; Sateriano, A.; Saradakou, E.; Grigoriadis, E. ‘Land-Use Mixité’: Evaluating Urban Hierarchy and the Urban-to-Rural Gradient with an Evenness-Based Approach. Ecol. Indic. 2016, 70, 35–42. [Google Scholar] [CrossRef]
  37. Kaminski, A.; Bauer, D.M.; Bell, K.P.; Loftin, C.S.; Nelson, E.J. Using Landscape Metrics to Characterize Towns along an Urban-Rural Gradient. Landsc. Ecol 2021, 36, 2937–2956. [Google Scholar] [CrossRef]
  38. Solon, J. Spatial Context of Urbanization: Landscape Pattern and Changes between 1950 and 1990 in the Warsaw Metropolitan Area, Poland. Landsc. Urban Plan. 2009, 93, 250–261. [Google Scholar] [CrossRef]
  39. Jiao, L.; Dong, T. Inverse S-Shape Rule of Urban Land Density Distribution and Its Applications. J. Geomat. 2018, 43, 8–16. [Google Scholar] [CrossRef]
  40. Jiao, L. Urban Land Density Function: A New Method to Characterize Urban Expansion. Landsc. Urban Plan. 2015, 139, 26–39. [Google Scholar] [CrossRef]
  41. Song, T.; Li, D.; Zhang, L.; Wang, G.; Gao, Y.; Yang, C.; Feng, C.; Ma, H. Importance Evaluation of Ecosystem Services and Construction ofEcological Security Pattern in Qinba Mountain Area. Strateg. Study CAE 2020, 22, 64–72. [Google Scholar] [CrossRef]
  42. Gao, M.-W.; Hu, Y.; Li, X.; Song, R. Construction of Ecological Security Pattern Based on the Importance of Ecosystem Services and Environmental Sensitivity in Karst Mountainous Areas: A Case Study in Hechi, Guangxi. Acta Ecol. Sin. 2021, 41, 2596–2608. [Google Scholar]
  43. Riedler, B.; Lang, S. A Spatially Explicit Patch Model of Habitat Quality, Integrating Spatio-Structural Indicators. Ecol. Indic. 2018, 94, 128–141. [Google Scholar] [CrossRef]
  44. Zhang, Z.; Hu, B.; Jiang, W.; Qiu, H. Identification and Scenario Prediction of Degree of Wetland Damage in Guangxi Based on the CA-Markov Model. Ecol. Indic. 2021, 127, 107764. [Google Scholar] [CrossRef]
  45. Jiao, L.; Zhang, X. Characterizing Urban Expansion of Main Metropolises in China Based on Built-up Densities in Concentric Rings. Resour. Environ. Yangtze Basin 2015, 24, 1721–1728. [Google Scholar]
  46. Jiao, L.; Gong, C.; Xu, G.; Dong, T.; Zhang, B.; Li, Z. Urban expansion dynamics and urban forms in three metropolitan areas—Tokyo, New York, and Shanghai. Prog. Geogr. 2019, 38, 675–685. [Google Scholar]
  47. Asadolahi, Z.; Salmanmahiny, A.; Sakieh, Y.; Mirkarimi, S.H.; Baral, H.; Azimi, M. Dynamic Trade-off Analysis of Multiple Ecosystem Services under Land Use Change Scenarios: Towards Putting Ecosystem Services into Planning in Iran. Ecol. Complex. 2018, 36, 250–260. [Google Scholar] [CrossRef]
  48. Wu, Y.; Tao, Y.; Yang, G.; Ou, W.; Pueppke, S.; Sun, X.; Chen, G.; Tao, Q. Impact of Land Use Change on Multiple Ecosystem Services in the Rapidly Urbanizing Kunshan City of China: Past Trajectories and Future Projections. Land Use Policy 2019, 85, 419–427. [Google Scholar] [CrossRef]
  49. Zhang, Z.; Liu, Y.; Wang, Y.; Liu, Y.; Zhang, Y.; Zhang, Y. What Factors Affect the Synergy and Tradeoff between Ecosystem Services, and How, from a Geospatial Perspective? J. Clean. Prod. 2020, 257, 120454. [Google Scholar] [CrossRef]
  50. Xian, J.; Chen, T.; Zhang, C.; Zhou, L. A Study on the Dynamic Mechanism of Border Cities in China under the Background of GMS—A Case Study of Jinghong City, Xishuangbanna. Spec. Zone Econ. 2017, 14, 78–79. [Google Scholar]
  51. Main Data Bulletin of the Seventh National Population Census in Jinghong City. Available online: https://www.jhs.gov.cn/1005.news.detail.dhtml?news_id=100132 (accessed on 7 January 2024).
  52. Nelson, E.; Sander, H.; Hawthorne, P.; Conte, M.; Ennaanay, D.; Wolny, S.; Manson, S.; Polasky, S. Projecting Global Land-Use Change and Its Effect on Ecosystem Service Provision and Biodiversity with Simple Models. PLoS ONE 2010, 5, e14327. [Google Scholar] [CrossRef]
  53. Hurni, K.; Fox, J. The Expansion of Tree-Based Boom Crops in Mainland Southeast Asia: 2001 to 2014. J. Land Use Sci. 2018, 13, 198–219. [Google Scholar] [CrossRef]
  54. Ahrends, A.; Hollingsworth, P.M.; Ziegler, A.D.; Fox, J.M.; Chen, H.; Su, Y.; Xu, J. Current Trends of Rubber Plantation Expansion May Threaten Biodiversity and Livelihoods. Glob. Environ. Chang. 2015, 34, 48–58. [Google Scholar] [CrossRef]
  55. Guardiola-Claramonte, M.; Troch, P.A.; Ziegler, A.D.; Giambelluca, T.W.; Vogler, J.B.; Nullet, M.A. Local Hydrologic Effects of Introducing Non-Native Vegetation in a Tropical Catchment. Ecohydrology 2008, 1, 13–22. [Google Scholar] [CrossRef]
  56. de Blécourt, M.; Brumme, R.; Xu, J.; Corre, M.D.; Veldkamp, E. Soil Carbon Stocks Decrease Following Conversion of Secondary Forests to Rubber (Hevea brasiliensis) Plantations. PLoS ONE 2013, 8, e69357. [Google Scholar] [CrossRef]
  57. Zhang, H.; Zhang, G.-L.; Zhao, Y.-G.; Zhao, W.-J.; Qi, Z.-P. Chemical Degradation of a Ferralsol (Oxisol) under Intensive Rubber (Hevea brasiliensis) Farming in Tropical China. Soil Tillage Res. 2007, 93, 109–116. [Google Scholar] [CrossRef]
  58. Warren-Thomas, E.; Dolman, P.M.; Edwards, D.P. Increasing Demand for Natural Rubber Necessitates a Robust Sustainability Initiative to Mitigate Impacts on Tropical Biodiversity. Conserv. Lett. 2015, 8, 230–241. [Google Scholar] [CrossRef]
  59. Lundy, L.; Wade, R. Integrating Sciences to Sustain Urban Ecosystem Services. Prog. Phys. Geogr. Earth Environ. 2011, 35, 653–669. [Google Scholar] [CrossRef]
  60. Wu, J. Making the Case for Landscape Ecology: An Effective Approach to Urban Sustainability. Landsc. J. 2008, 27, 41–50. [Google Scholar] [CrossRef]
  61. Pataki, D.E.; Carreiro, M.M.; Cherrier, J.; Grulke, N.E.; Jennings, V.; Pincetl, S.; Pouyat, R.V.; Whitlow, T.H.; Zipperer, W.C. Coupling Biogeochemical Cycles in Urban Environments: Ecosystem Services, Green Solutions, and Misconceptions. Front. Ecol. Environ. 2011, 9, 27–36. [Google Scholar] [CrossRef]
  62. Wang, M.; Xu, H. Temporal and spatial changes of urban impervious surface and its influence onurban ecological quality: A comparison between Shanghai and New York. Chin. J. Appl. Ecol. 2018, 9, 3735–3746. [Google Scholar] [CrossRef]
  63. Liu, H.; Cui, J.; Zhang, J. Temporal and spatial evolution of carbon storage and ecological compensation in the coastal wetlands of the Yellow River Delta. Ecol. Econ. 2023, 15, 1035. [Google Scholar]
  64. Zhou, F.; Ma, T.; Li, X.; Cui, B. Simulation and evaluation of ecosystem services in the coastal wetlands of the Yellow River Delta. Wetl. Sci. 2015, 13, 667–674. [Google Scholar]
  65. Liu, Y. Assessment of Tea Plantation Ecosystem Services in Karst Areas Based on the InVEST Model; Yunnan University: Kunming, China, 2021. [Google Scholar] [CrossRef]
  66. Zhang, J. Spatiotemporal Dynamics and Driving Mechanisms of Ecosystem Services in the Yellow River Delta. Master’s Thesis, Shandong University, Jinan, China, 2023. [Google Scholar]
  67. Zhang, E. Research on the Spatio-Temporal Patterns and Influencing Factors of Water Production Services and Soil Conservation Services in the Central Yunnan Urban Agglomeration. Master’s Thesis, Yunnan Normal University, Kunming, China, 2021. [Google Scholar]
  68. Wu, J.; Luo, J.; Zhang, H.; Qin, S.; Yu, M. Projections of Land Use Change and Habitat Quality Assessment by Coupling Climate Change and Development Patterns. Sci. Total Environ. 2022, 847, 157491. [Google Scholar] [CrossRef] [PubMed]
Figure 1. The geographical location (a) and topography (b) of Jinghong City.
Land 13 00306 g001
Figure 2. Land use status of Jinghong City in 2000, 2010, and 2020.
Land 13 00306 g002
Figure 3. Urban-rural gradient based on urban land density distribution (adapted from reference [39]).
Land 13 00306 g003
Figure 4. Spatial pattern of ecosystem services in Jinghong City in 2000, 2010, and 2020. HQ indicates habitat quality. WC indicates water conservation. C indicates carbon sequestration. SR indicates soil retention. TES indicates total ecosystem services.
Land 13 00306 g004
Figure 5. Urban land density measured across space.
Land 13 00306 g005
Figure 6. Changes in ecosystem services along the urban-rural gradient during 2000–2010 (top panel), 2010–2020 (middle panel), and 2000–2020 (bottom panel). HQ indicates habitat quality. WC indicates water conservation. C indicates carbon sequestration. SR indicates soil retention. TES indicates total ecosystem services. r1, r2, r3, and r4 in the x-axis indicate the core zone, inner urban area, suburban area, and urban periphery, respectively.
Land 13 00306 g006
Table 1. Comprehensive ecosystem services in Jinghong City in 2000, 2010, and 2020.
ESVEcosystem Service ScoreChange Rate
2000201020202000–2020
HQ0.870.840.83−4.05%
WC0.550.410.38−30.77%
C0.870.860.85−3.20%
SR0.00670.00210.0021−68.66%
TES0.630.590.58−8.56%
Table 2. Parameters of the fitted urban land density functions.
YearcαDr0r1r2R2
20000.0084.2974.2542.131.482.780.99
20100.0133.9124.6062.301.533.080.98
20200.0282.8336.5163.261.744.770.96
Disclaimer/Publisher’s Note: The statements, opinions and data contained in all publications are solely those of the individual author(s) and contributor(s) and not of MDPI and/or the editor(s). MDPI and/or the editor(s) disclaim responsibility for any injury to people or property resulting from any ideas, methods, instructions or products referred to in the content.

