Article

Study of Regional Spatial and Temporal Changes of Net Ecosystem Productivity of Crops from Remotely Sensed Data

1
School of Environment and Spatial Informatics, China University of Mining and Technology, Xuzhou 221116, China
2
College of Engineering and Technology, University of Derby, Derby DE22 1GB, UK
*
Author to whom correspondence should be addressed.
Land 2024, 13(2), 155; https://doi.org/10.3390/land13020155
Submission received: 16 December 2023 / Revised: 22 January 2024 / Accepted: 24 January 2024 / Published: 30 January 2024

Abstract

:
Net ecosystem productivity (NEP) is a crucial indicator of the carbon balance and health of an ecosystem. Until now, few studies have estimated the NEP of crops and analyzed it in space and time. The study of NEP in crops is crucial for comprehending the carbon cycle of agroecosystems and determining the status of carbon sources and sinks in farmland at the regional scale. In this study, we calculated the net primary productivity (NPP) and NEP of agricultural crops in Jiangsu Province, China, from 2001 to 2022 by using remote sensing data, land cover data and meteorological data. The modified Carnegie Ames Stanford Approach (CASA) model was employed to estimate the NPP, and the soil heterotrophic respiration model was used to calculate the soil heterotrophic respiration (Rh). Then, the availability of the NPP was evaluated. On this basis, the NEP was obtained by calculating the difference between the NPP and Rh. We explored the spatial and temporal changes in the NEP of crops and analyzed the correlation between the NEP and crop cultivation activities and climatic factors under the context of agricultural production information using the NEP datasets of agricultural crops. The study indicated that (1) the NEP of crops in Jiangsu Province showed a north-to-south pattern, being higher in the north and lower in the south. Over the course of 22 years, the average NEP of the crops in Jiangsu Province stands at 163.4 gC/m2, highlighting a positive carbon sink performance. Nonetheless, up to 88.04% of the crops exhibited declining NEP trends. (2) The monthly fluctuations in the NEP of crops in Jiangsu Province exhibited a bimodal pattern, with peaks occurring during spring and summer. The changes in the NEP of the crops were significantly associated with various agricultural production activities. (3) Significant regional differences were observed in the NEP of the crop response to temperature and precipitation, both of which directly impacted the annual performance of the NEP. This study could serve as a reference for research on the carbon cycle in agriculture and the development of policies aimed at reducing emissions and enhancing carbon sinks in local farmland.

1. Introduction

In recent times, the growing concentration of greenhouse gases such as CO2, CH4, NO2, etc. has led to an expedited rate of global warming. CO2 levels are at their highest point in two million years [1], and carbon sequestration has become a common concern of the international community. Agriculture has risen to become the second biggest contributor of greenhouse gases owing to the ubiquitous nature of agricultural production activities [2,3]. However, agro-ecosystems have a significantly higher net ecosystem productivity (NEP) than grassland and wetland ecosystems [4], indicating cropland has the potential to sequester carbon and diminish emissions on a large scale [5,6]. Quantifying the carbon sequestration capacity of crops and estimating carbon sources and sinks in agro-ecosystems is currently a significant topic of worldwide interest.
The NEP is the difference between the net primary productivity (NPP) of vegetation and the carbon fixed by photosynthetic products consumed through heterotrophic respiration (Rh) [7]. It is a critical indicator of ecosystem carbon balance and regional estimation of vegetation carbon sources and sinks, describing how much atmospheric carbon dioxide that an ecosystem captures per unit time and representing the actual carbon capture of an ecosystem [8,9,10]. While the NEP may not align with the concept of a carbon sink on a regional scale, it is frequently employed as a gauge of sink magnitude. Cropland ecosystems are generally considered to be weaker sources or sinks of carbon and less valuable to the global carbon cycle than forest and grassland ecosystems. Therefore, less research has been conducted on the carbon activities of cropland ecosystems. Most of the current research on the NEP focuses on natural ecosystems such as forests and grasslands, or on surface terrestrial ecosystems as a whole, with few crop-specific analyses [9,11,12,13,14]. Research on crops currently prioritizes the estimation of the crop NPP and crop yield [15,16,17,18]. However, there are few studies further estimating the regional-scale NEP and the spatial and temporal variation characteristics of cropland, investigating the connection between carbon source/sink status and agricultural activities, and the relationship between the NEP and impact factors, leaving us with a limited understanding of that process. Therefore, it is essential to carry out in-depth research on the carbon sequestration potential of cropland ecosystems, so as to enhance the scientific understanding of the carbon sequestration potential of cropland in global climate change and ecosystem management.
Jiangsu Province, being a significant agricultural province in China, possesses an exceptional geographical location, alongside distinctive climatic and hydrological conditions that contribute to its unique agricultural production capacities. Consequently, it is vital to conduct a thorough quantitative study of the agricultural region’s NPP and NEP to delve into the spatial and temporal variations’ peculiarities and their responses to climatic conditions. The objective of the study is to combine meteorological and satellite remote sensing data, using the refined CASA model and the soil microbial respiration model, to assess the agricultural NPP and NEP between 2001 and 2022 in Jiangsu Province. This study conducts a thorough investigation of the spatial and temporal patterns of change to provide an intuitive understanding of the relationship between crop carbon fixation and use, and fluctuations in crop production in the region. This study highlights the significance of carbon sequestration by crop vegetation and provides a theoretical reference for agricultural carbon cycle research and cropland management in the region. Additionally, it offers a template for studying the NEP of crops.

2. Study Area and Data
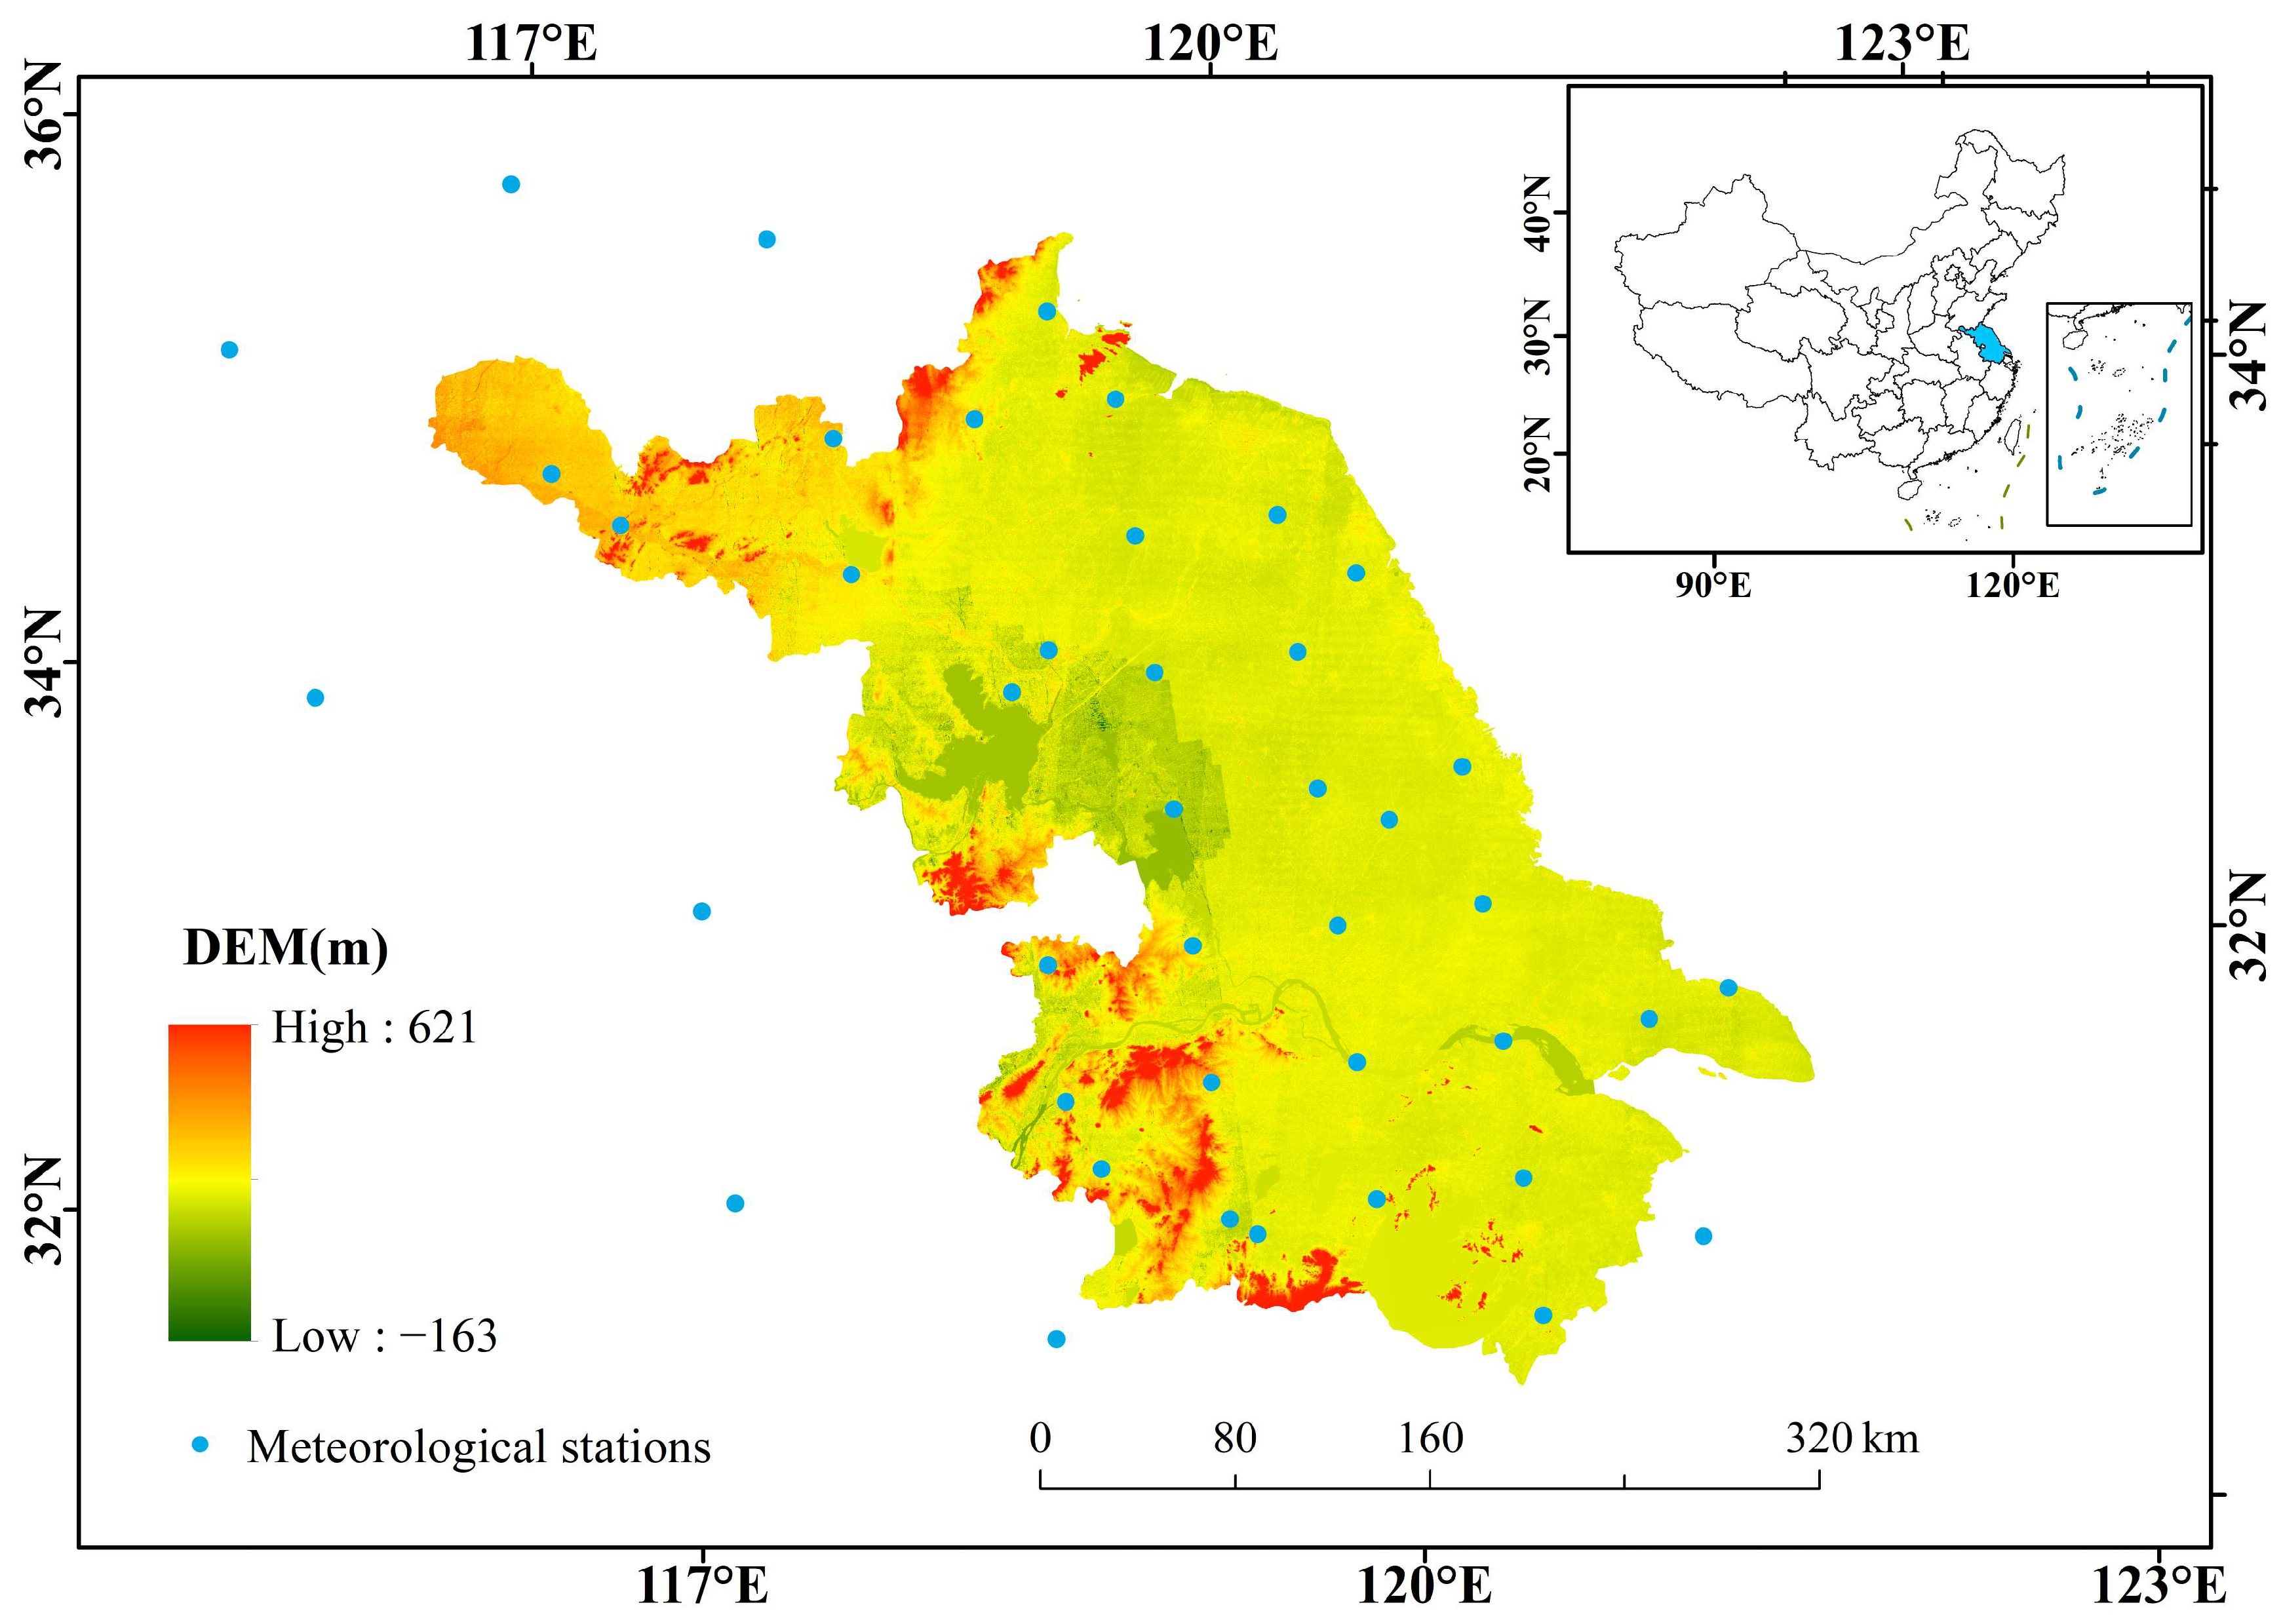
2.1. Study Area

Jiangsu Province (116°22′~121°55′ E, 30°46′~35°07′ N) is located in the eastern part of Mainland China, in the middle of the coastal region, at the lower reaches of the Yangtze River and the Huai River, which is one of the important components of the Yangtze River Delta. It covers an area of 107,200 square kilometers. There are 13 cities in the province, including one sub-provincial city (Nanjing) and 12 prefecture-level cities.
Jiangsu Province has a flat topography with three types of landforms: plains, mountains and hills. Of these, 86.90% are plains, 11.54% are hills and 1.56% are mountains. 93.89% of the province’s land area is in the flat slopes between 0° and 2° (Figure 1).
In terms of climate, Jiangsu Province belongs to the East Asian monsoon climate zone, in the climate transition zone of the subtropical and warm temperate zone. Generally, the Huaihe River and the northern Jiangsu irrigation canal are the boundary, and the area to the north has a warm temperate humid and semi-humid monsoon climate. The area to the south has a subtropical humid monsoon climate. Under the influence of the monsoon, spring and autumn are shorter, winter and summer are longer, rain and heat are in the same season, rainfall is abundant, light and heat are plentiful and the temperature difference between the north and south is obvious.
The unique geographical environment and climate make Jiangsu Province unique in terms of agricultural production conditions. It is the largest producer of japonica rice in the south of China and an advantageous area for the production of high-quality weak-grained wheat in the country. Maize, peanuts, rape and a variety of mixed cereals, beans and other special grain and economic crops are spread throughout the province. The main crops are rice, wheat, maize, rapeseed and soybeans. To visualize the distribution of major crops, this paper refers to the national 1 km planting distribution database of the three primary food crops from 2000 to 2019 (https://doi.org/10.12199/nesdc.ecodb.rs.2022.016 accessed on 20 June 2023) [19], as illustrated in Figure 2. Details on the growth period from planting to harvesting of these food crops are provided in Table 1. The phenological stages of wheat and rice do not overlap, and maize and soybean are predominantly planted at intervals that allow for two harvests in a single season.

2.2. Data Sources and Processing

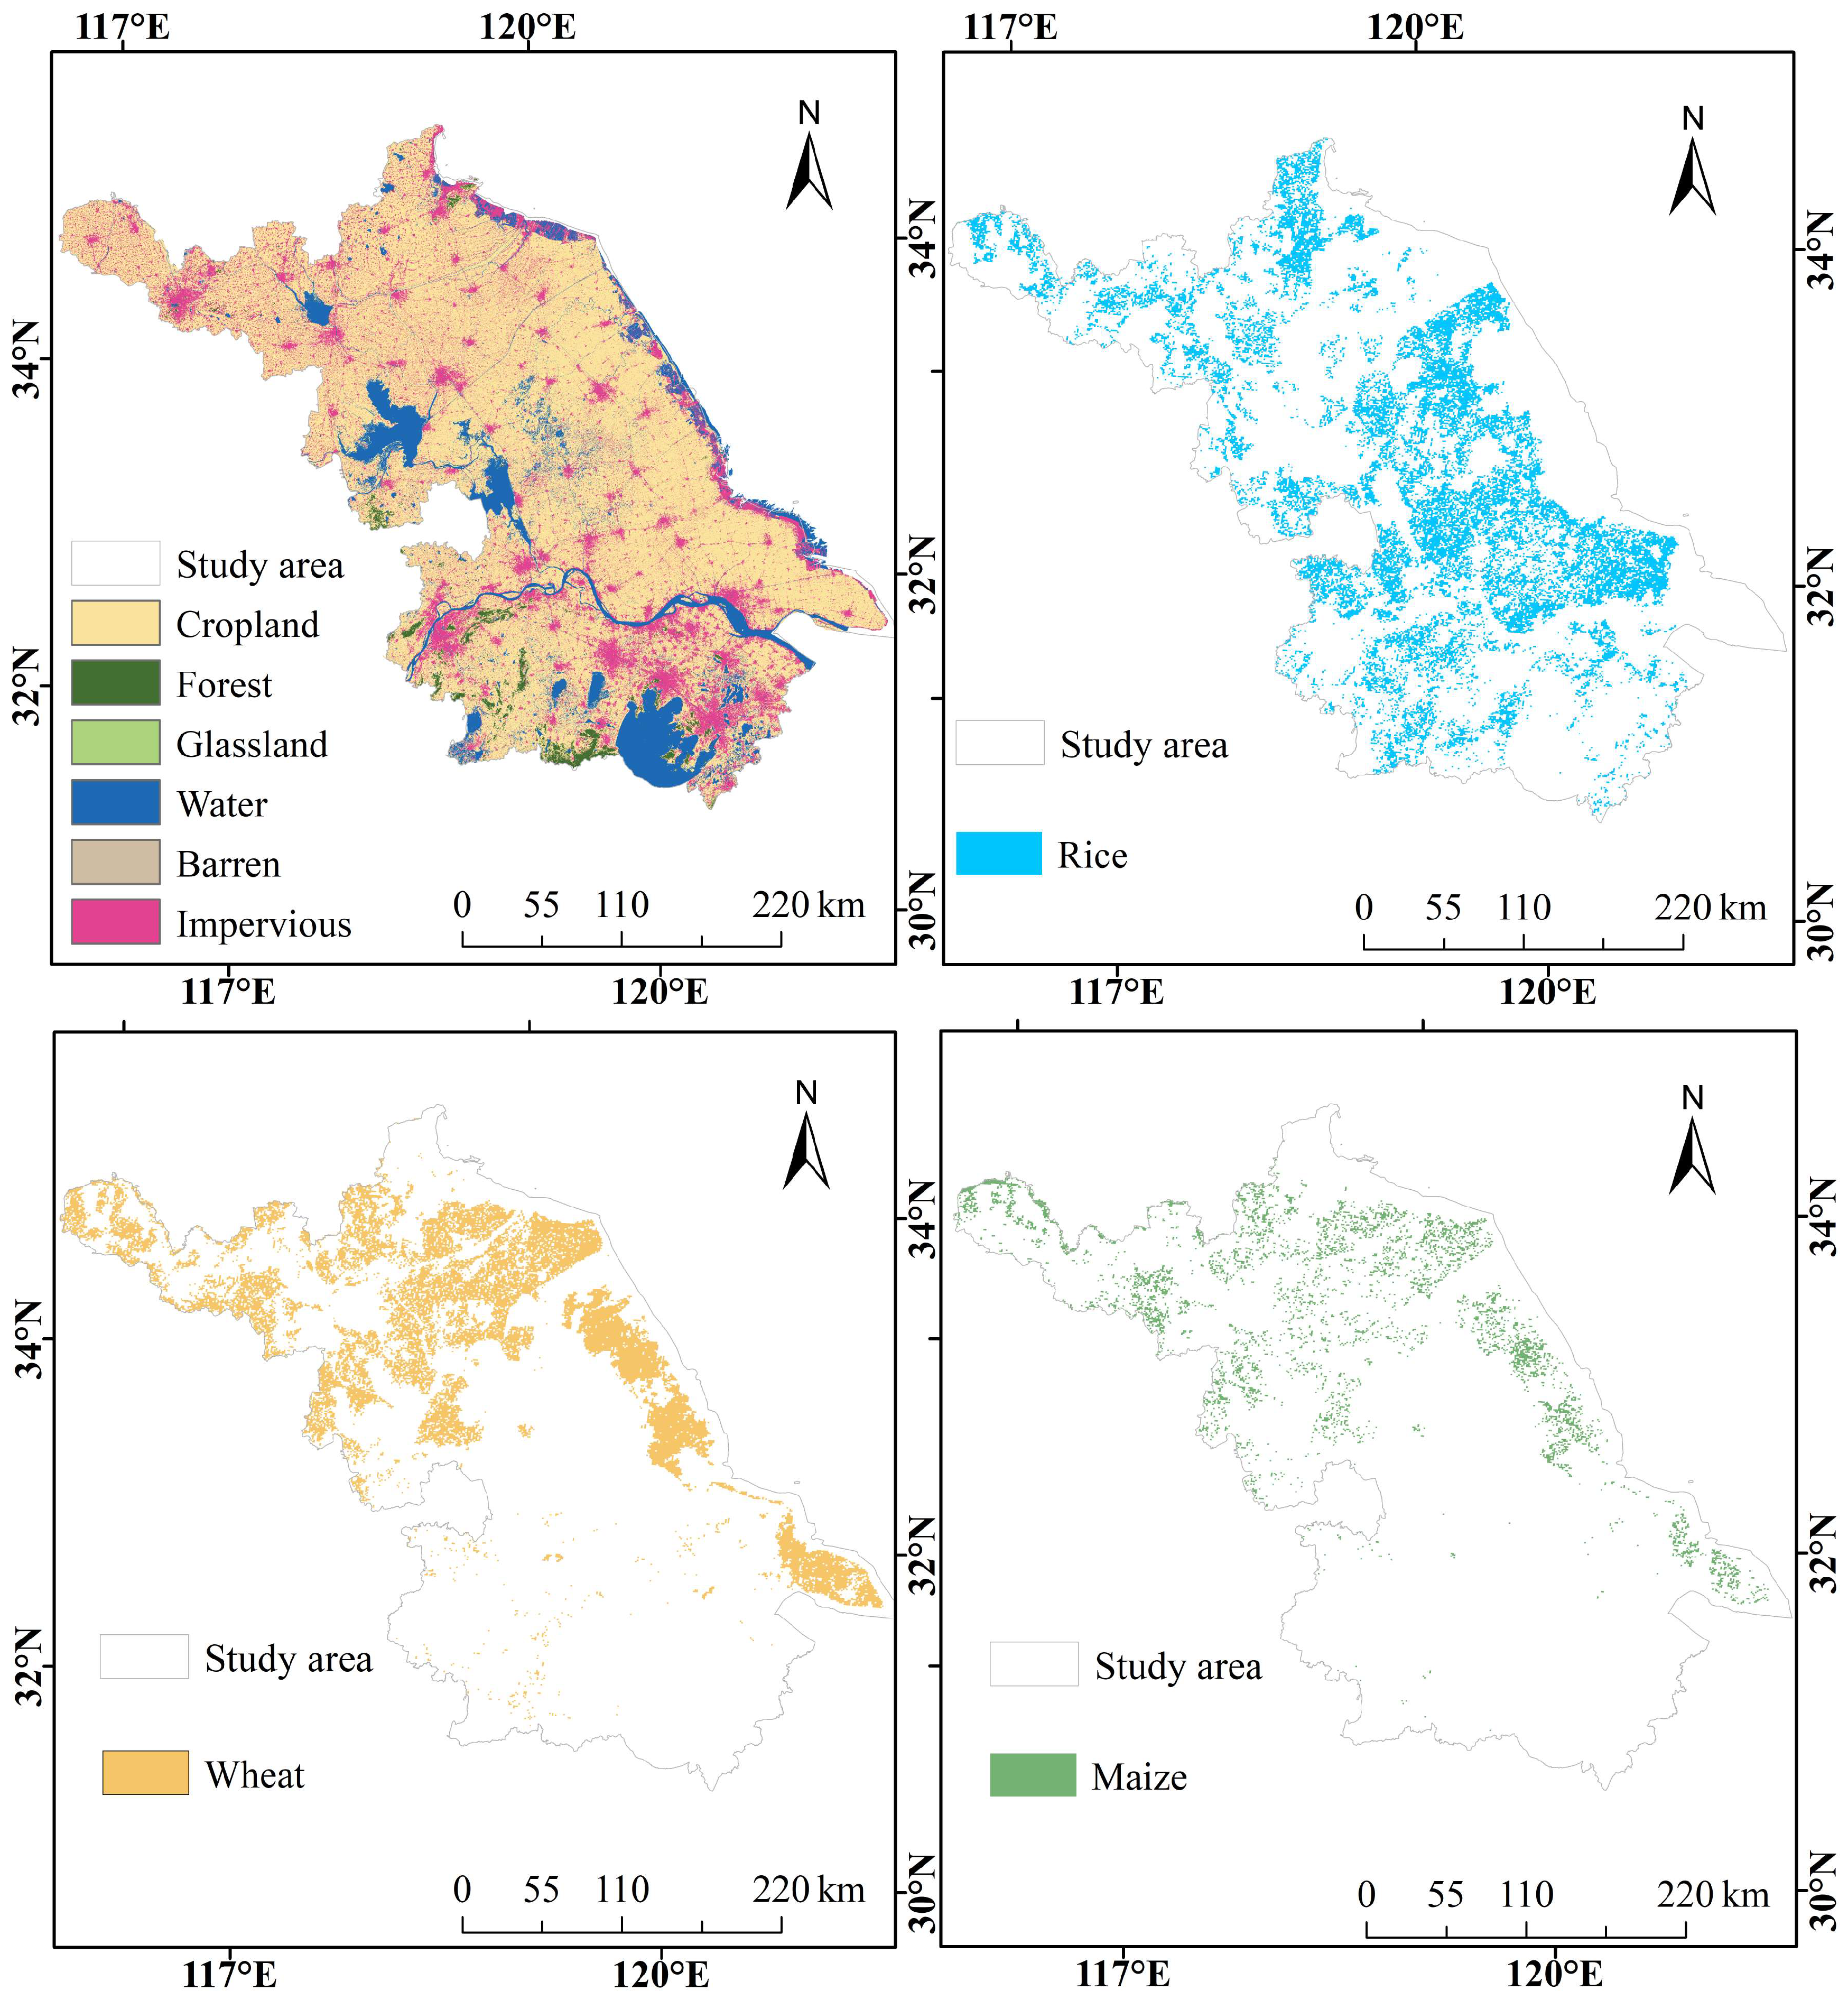
2.2.1. Land Cover Data

The arable land classification data of Jiangsu Province used in this investigation were attained from China’s CLCD, the land use classification data for each year ranging from 1985 to 2022 [20]. The data are classified into a total of nine categories, as shown in Table 2. The overall accuracy of the data is 80%. This data are processed by stitching, projection conversion, cropping and attribute extraction to obtain Jiangsu Province-wide arable land type data, and resampled to obtain raster data with a spatial resolution of 500 m.

2.2.2. MODIS NPP Product (MOD17A3H v006)

The validation of the NPP through measured values has been challenging due to the lack of ground-truthing data. The direct validation of the model’s estimates is not feasible. The MODIS NPP product with a spatial resolution of 500 m (MOD17A3H v006) from NASA (http://ladsweb.modaps.eosdis.nasa.gov/, accessed on 21 March 2023) is used in this study to compare the accuracy of the results with the CASA model estimates. The product is pre-processed in MRT (MODIS Reprojection Tool) for format conversion, projection conversion, image stitching and resampling.

2.2.3. NDVI

The NDVI data used in this study are obtained from the MODIS Level 3 product MOD13A1 (https://lpdaac.usgs.gov/products/mod13a1v006/, accessed on 27 March 2023), which provides NDVI raster data at a spatial resolution of 500 m at 16-day intervals. The images are pre-processed with the MRT (MODIS Reprojection Tool) tool for correction, stitching, projection conversion, etc. Finally, the NDVI data of Jiangsu province are processed using the maximum synthesis method and mask cropping for 23 periods per year to obtain the monthly NDVI data from 2001 to 2022.

2.2.4. Meteorological Data

The meteorological data used in this study include monthly average temperature data, monthly total precipitation data and monthly total solar radiation data. The temperature and precipitation data are obtained from the National Centers for Environmental Information (NCEI) of the National Oceanic and Atmospheric Administration (NOAA) (https://www.ncei.noaa.gov/maps/daily/, accessed on 26 January 2023). Information on the meteorological stations is shown in Figure 1. The monthly mean temperature and monthly total precipitation are obtained by collating the meteorological data, and then vectorized using kriging interpolation to obtain the temperature and precipitation raster data, which are uniformly resampled to a spatial resolution of 500 m in this study in order to participate in the calculations.

3. Methods

3.1. Estimation of NPP Based on an Improved CASA Model

In this study, an improved CASA model [21] is used to estimate the NPP of regional vegetation from two variables: photosynthetically active radiation absorbed by vegetation (APAR) and actual light energy utilization ( ε x , t ). The formulae are as follows:
N P P x , t = A P A R x , t × ε x , t
where A P A R x , t represents the photosynthetically active radiation absorbed by image element x in month t [MJ/m2/month]; ε x , t represents the actual light energy utilization of image element x in month t [gC/MJ]. N P P x , t represents the NPP of vegetation at spatial location x at time t [gC/m2/month].

3.1.1. Determination of Absorbed Photosynthetically Active Radiation

The estimation of the fraction of photosynthetically active radiation (PAR) absorbed by plant leaves (APAR) using remotely sensed data is achieved based on the reflectance characteristics of vegetation to the infrared and near-infrared wavelengths. Photosynthetically active radiation has been shown to be linked to reflectance values both theoretically and experimentally, and there is a strong correlation between photosynthetically active radiation and biomass. A great deal of work has been done on APAR at large scales as well as globally using satellite remote sensing data, and in comparison, to the foliar index (LAI), APAR is the best indicator of photosynthetic processes in the plant canopy. The photosynthetically active radiation absorbed by the vegetation depends on the total solar radiation and the characteristics of the plants themselves and can be calculated using the following equation [22]:
A P A R x , t = 1 2 × S O L x , t × F P A R x , t
where S O L x , t indicates the total solar radiation at the image element for the month [MJ/m2/month]; F P A R x , t is the proportion of incident photosynthetically active radiation absorbed by the vegetation layer (unitless); the constant 1 2 indicates the proportion of the total solar radiation (wavelength 0.38–0.71 μm) that can be used by the vegetation.

3.1.2. Estimation of FPAR

Within a certain range, there is a linear relationship between FPAR and NDVI [23,24,25], which can be determined from the maximum and minimum values of NDVI for a given vegetation type and the corresponding maximum and minimum values of FPAR, using the following equation:
F P A R x , t = N D V I x , t N D V I m i n × F P A R m a x F P A R m i n N D V I m a x N D V I m i n + F P A R m i n
where N D V I m a x and N D V I m i n are the maximum and minimum values of NDVI for arable land types in this experiment, the maximum value of NDVI refers to the NDVI value when the vegetation has just reached full cover, and not the actual maximum value of NDVI for a certain vegetation type. In this study, the NDVI value corresponding to the lower 95% quantile of the NDVI probability distribution for the cropland type was taken as the maximum NDVI value, while the NDVI value corresponding to the lower 5% quantile represented the minimum NDVI value. The probability distribution interval is [(1 − x )/2, (1 + x )/2] [26], where x is the vegetation classification accuracy and is taken to be 0.85 in this study.
Further research has shown that there is also a linear relationship between the FPAR and the specific vegetation index (SR) [27,28], which can be expressed in Equation (4):
F P A R x , t = S R x , t S R m i n F P A R m a x F P A R m i n S R m a x S R m i n + F P A R m i n
S R x , t = 1 + N D V I x , t 1 N D V I x , t
where F P A R m a x and F P A R m i n take values independent of vegetation type at 0.001 and 0.95, respectively; S R m a x and S R m i n are the 95% and 5% lower percentile of NDVI for the arable land type in this experiment. S R x , t is determined using Equation (5).
Both NDVI and SR are used for the estimation of the FPAR in the improved CASA model. Previous research has shown that the FPAR estimated from NDVI tends to be higher than the measured value, whereas the FPAR estimated from SR is lower than the measured value, but with a smaller error than the direct estimation from NDVI. Considering this situation, Los [29] combines these two methods and takes the average value as the estimated FPAR, where the error between the estimated FPAR and the measured value is minimized. The formula is as follows:
F P A R x , t = F P A R N D V I + 1 F P A R S R
where F P A R N D V I is the result estimated using Equation (3); F P A R S R is the result estimated using Equation (4); and is the adjustment factor between the two methods, which takes the value of 0.5 in this study.

3.1.3. Estimation of Actual Light Energy Utilization

Potter et al. [22] believed that under ideal conditions, plant vegetation has maximum light energy use efficiency, but in reality, light energy use efficiency is influenced by many external environmental factors, mainly temperature and precipitation. ε is calculated as follows:
ε x , t = T 1 x , t × T 2 x , t × W ε x , t × ε m a x
T 1 x , t = 0.8 + 0.002 T o p t x , t 0.0005 T 2 o p t x , t
T 2 x , t = 1.184 1 + exp 0.2 T o p t x , t 10 T x , t × { 1 + e x p 0.3 T o p t x , t 10 + T x , t }
W ε x , t = 1 2 E E T x , t P E T x , t + 1 2
where T 1 x , t and T 2 x , t represent the temperature stress factor for the light energy utilization efficiency of image element x at moment t . The equations are taken from the model developed by Potter (1993) and Field (1995) [28]. W ε x , t represents the water stress factor for the light energy use efficiency of image element x at moment t . The equation is the formula for calculating the water stress impact factor established by S.L. Piao [30]. ε m a x [gC/MJ] is the maximum light energy use of the vegetation under ideal conditions. T x , t is the mean temperature of image x at time t . T o p t x , t is the mean temperature [°C] of the month when the NDVI value of a region is at its highest in a year. E E T x , t is the actual regional evapotranspiration [mm], which can be obtained from the regional actual evapotranspiration model (11) developed by G.S. Zhou and X.S. Zhang [31]. P E T x , t is the potential regional evapotranspiration [mm], which can be obtained from the complementary relationship proposed by Boucher (13) [32].
E E T ( x , t ) = { P ( x , t ) × R n ( x , t ) × [ ( P ( x , t ) ) 2 + R n x , t 2 + P ( x , t ) × R n ( x , t ) ] } / { [ P ( x , t ) + R n ( x , t ) ] × [ ( P ( x , t ) ) 2 + R n x , t 2 ] }
where P ( x , t ) is the precipitation [mm] of image x in month t ; R n ( x , t ) is the net surface radiation [mm] of image x in month t , obtained from the empirical model developed by G.S. Zhou and X.S. Zhang (1996) [33].
R n x , t = E p 0 x , t × P x , t 0.5 × 0.369 + 0.598 × E p 0 x , t P x , t 0.5
P E T ( x , t ) = E x , t + E p 0 x , t 2
where E p 0 x , t is the local potential evapotranspiration [mm], which can be derived from the Thornthwaite vegetation–climate relationship model [34]. P x , t [mm] is the precipitation at pixel x at time t .
Regarding the value of the maximum light energy use ε m a x in the original CASA model, the global vegetation ε m a x was set to 0.389 gC/MJ. However, Peng et al. [35] estimated the light energy utilization of vegetation in Guangdong using GIS and RS, and concluded that the global maximum light energy utilization of vegetation used in the CASA model is low for the vegetation in Guangdong. Therefore, for this study, the maximum light energy use of arable land in this study is determined to be 0.542 gC/MJ by referring to the studies of Zhu et al. [36] and Liang et al. [9].

3.2. Calculation of NEP Based on the Soil Respiration Equation

NEP is the fraction of NPP minus the photosynthetic products consumed by Rh and is given by the following equation:
N E P = N P P R h
where NEP is net ecosystem productivity [gC/m2/month], NPP is net primary productivity [gC/m2/month] and R h is respiratory consumption of heterotrophs [gC/m2/month].
The regression Equation (15) for temperature, precipitation and carbon emissions established by Pei et al. [37] was used to estimate the distribution of soil microbial respiration in this study and was calculated as follows:
R h = 0.22 × E x p 0.0913 × T + L n 0.3145 × R + 1 × 30 × 46.5 %

3.3. Theil–Sen Median Slope Estimation and Mann–Kendall Trend Analysis

The Theil–Sen Median method, also known as Sen slope estimation, is a robust non-parametric statistical approach to trend calculation. The method is computationally efficient, insensitive to measurement error and niche data and is suitable for trend analysis of long time series data [38,39]. Its calculation formula is as follows:
β = M e d i a n x j x i j i   j > i
where Median () represents the median value; if β > 0, it indicates an increasing trend, otherwise, a decreasing trend.
The Mann–Kendall (MK) test is a non-parametric time series trend test that does not require the measured values to follow a positive terrestrial distribution, is not affected by missing values and outliers, and is suitable for testing the trend of long time series data for significance [40]. The test statistic S is calculated as follows:
S = i = 1 n 1 j = i + 1 n s g n x j x i
s g n x j x i = + 1   x j x i > 0   0   x j x i = 0 1   x j x i < 0
The trend test is performed using the test statistic Z. The Z value is calculated as follows:
Z = S V a r S   S > 0   0   S = 0 S + 1 V a r S   S < 0
V a r S = n n 1 2 n + 5 18
where n is the amount of data in the sequence; m is the number of recurring data sets in the sequence.
When using the bilateral trend test, the critical value Z1 − α/2 is found in the normal distribution table at a given significance level. When |Z| ≤ Z1 − α/2, the original hypothesis is accepted, and the trend is not significant; if |Z| > Z1 − α/2, the original hypothesis is rejected, and the trend is considered significant. In this paper, given a significance level of α = 0.05, the critical value Z1 − α/2 = ±1.96. When the absolute value of Z is greater than 1.65, 1.96 and 2.58, it means that the trend has passed the significance test with 90%, 95% and 99% confidence, respectively. The methods used to determine the significance of the trends are shown in Table 3.

3.4. Partial Correlations Analysis

Partial correlation analysis entails removing the impact of a third variable when two variables are concurrently correlated and only assessing the extent to which the two variables being investigated are correlated. The growth of crops is influenced by the combined impact of temperature and precipitation. As a result, this study uses this methodology to examine the relationship between crop vegetation’s carbon sink and meteorological factors. The formula for this analysis is as follows:
r i j · k = r i j r i k r j k 1 r i k 2 1 r j k 2
where r i j · k is the partial correlation coefficient between variable i and j after variable k is fixed. r i j , r j k , r i k are correlation coefficients for the variables i and j, j and k, and i and k, respectively.

4. Results

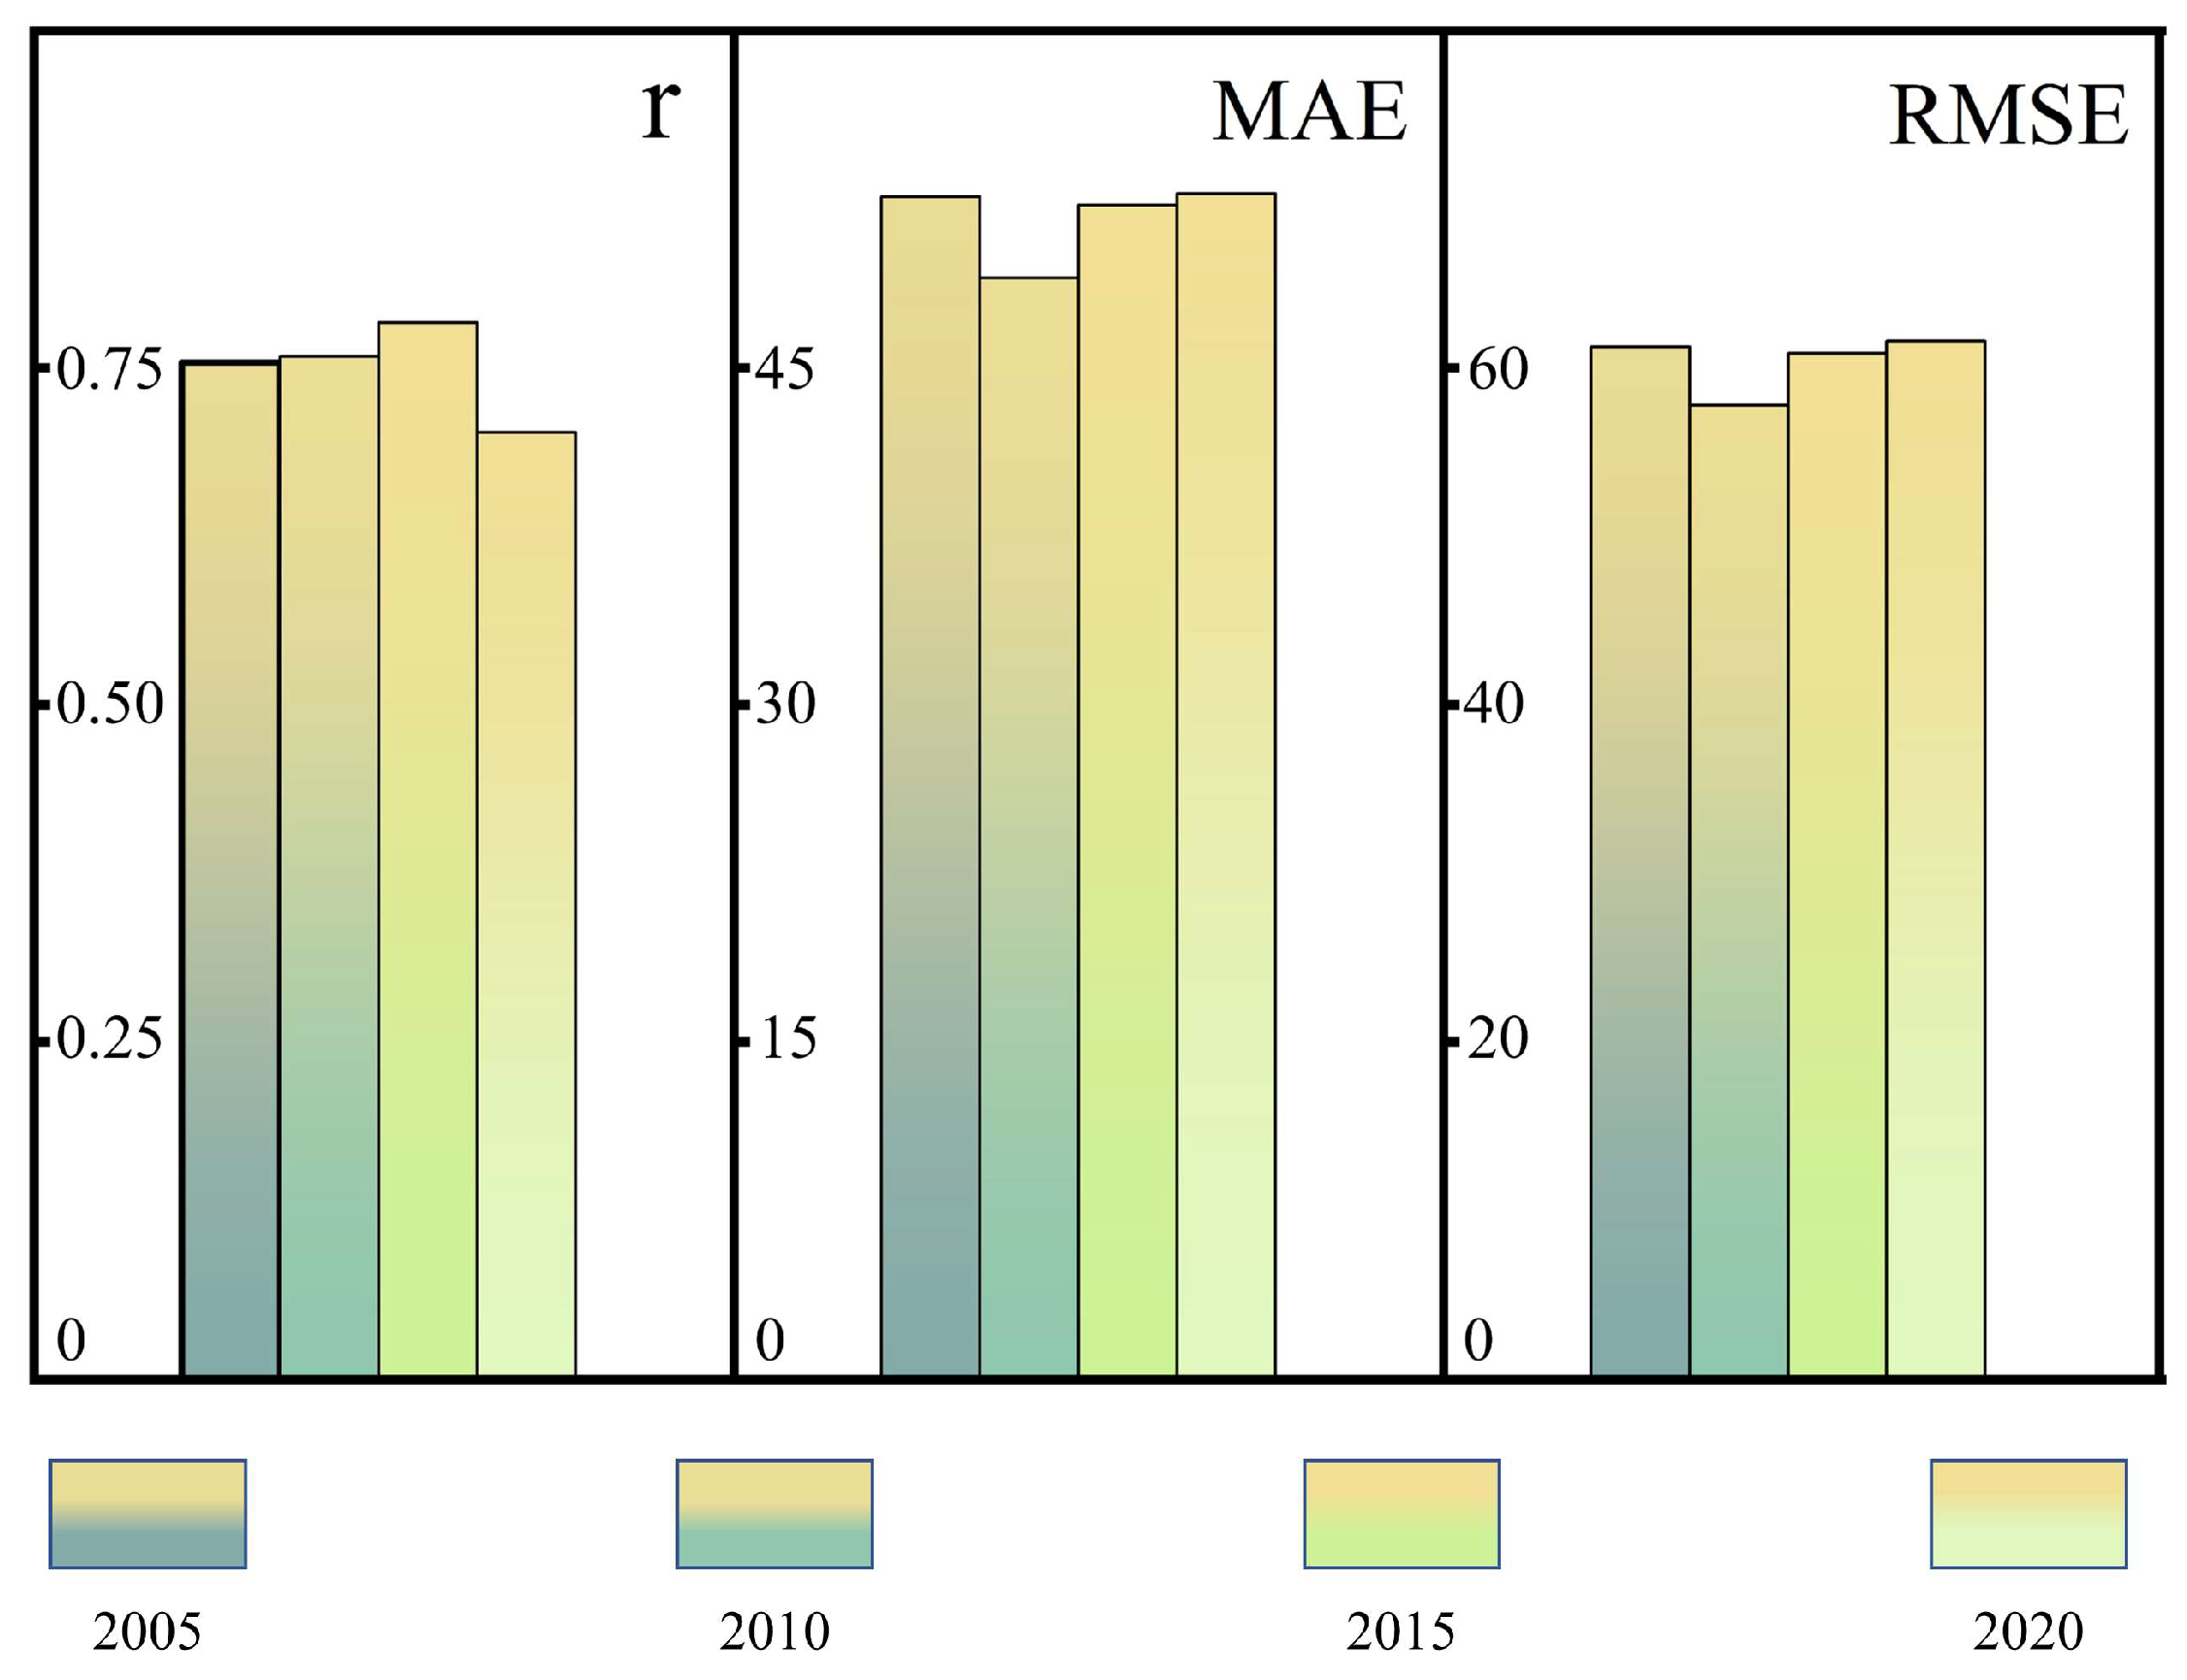
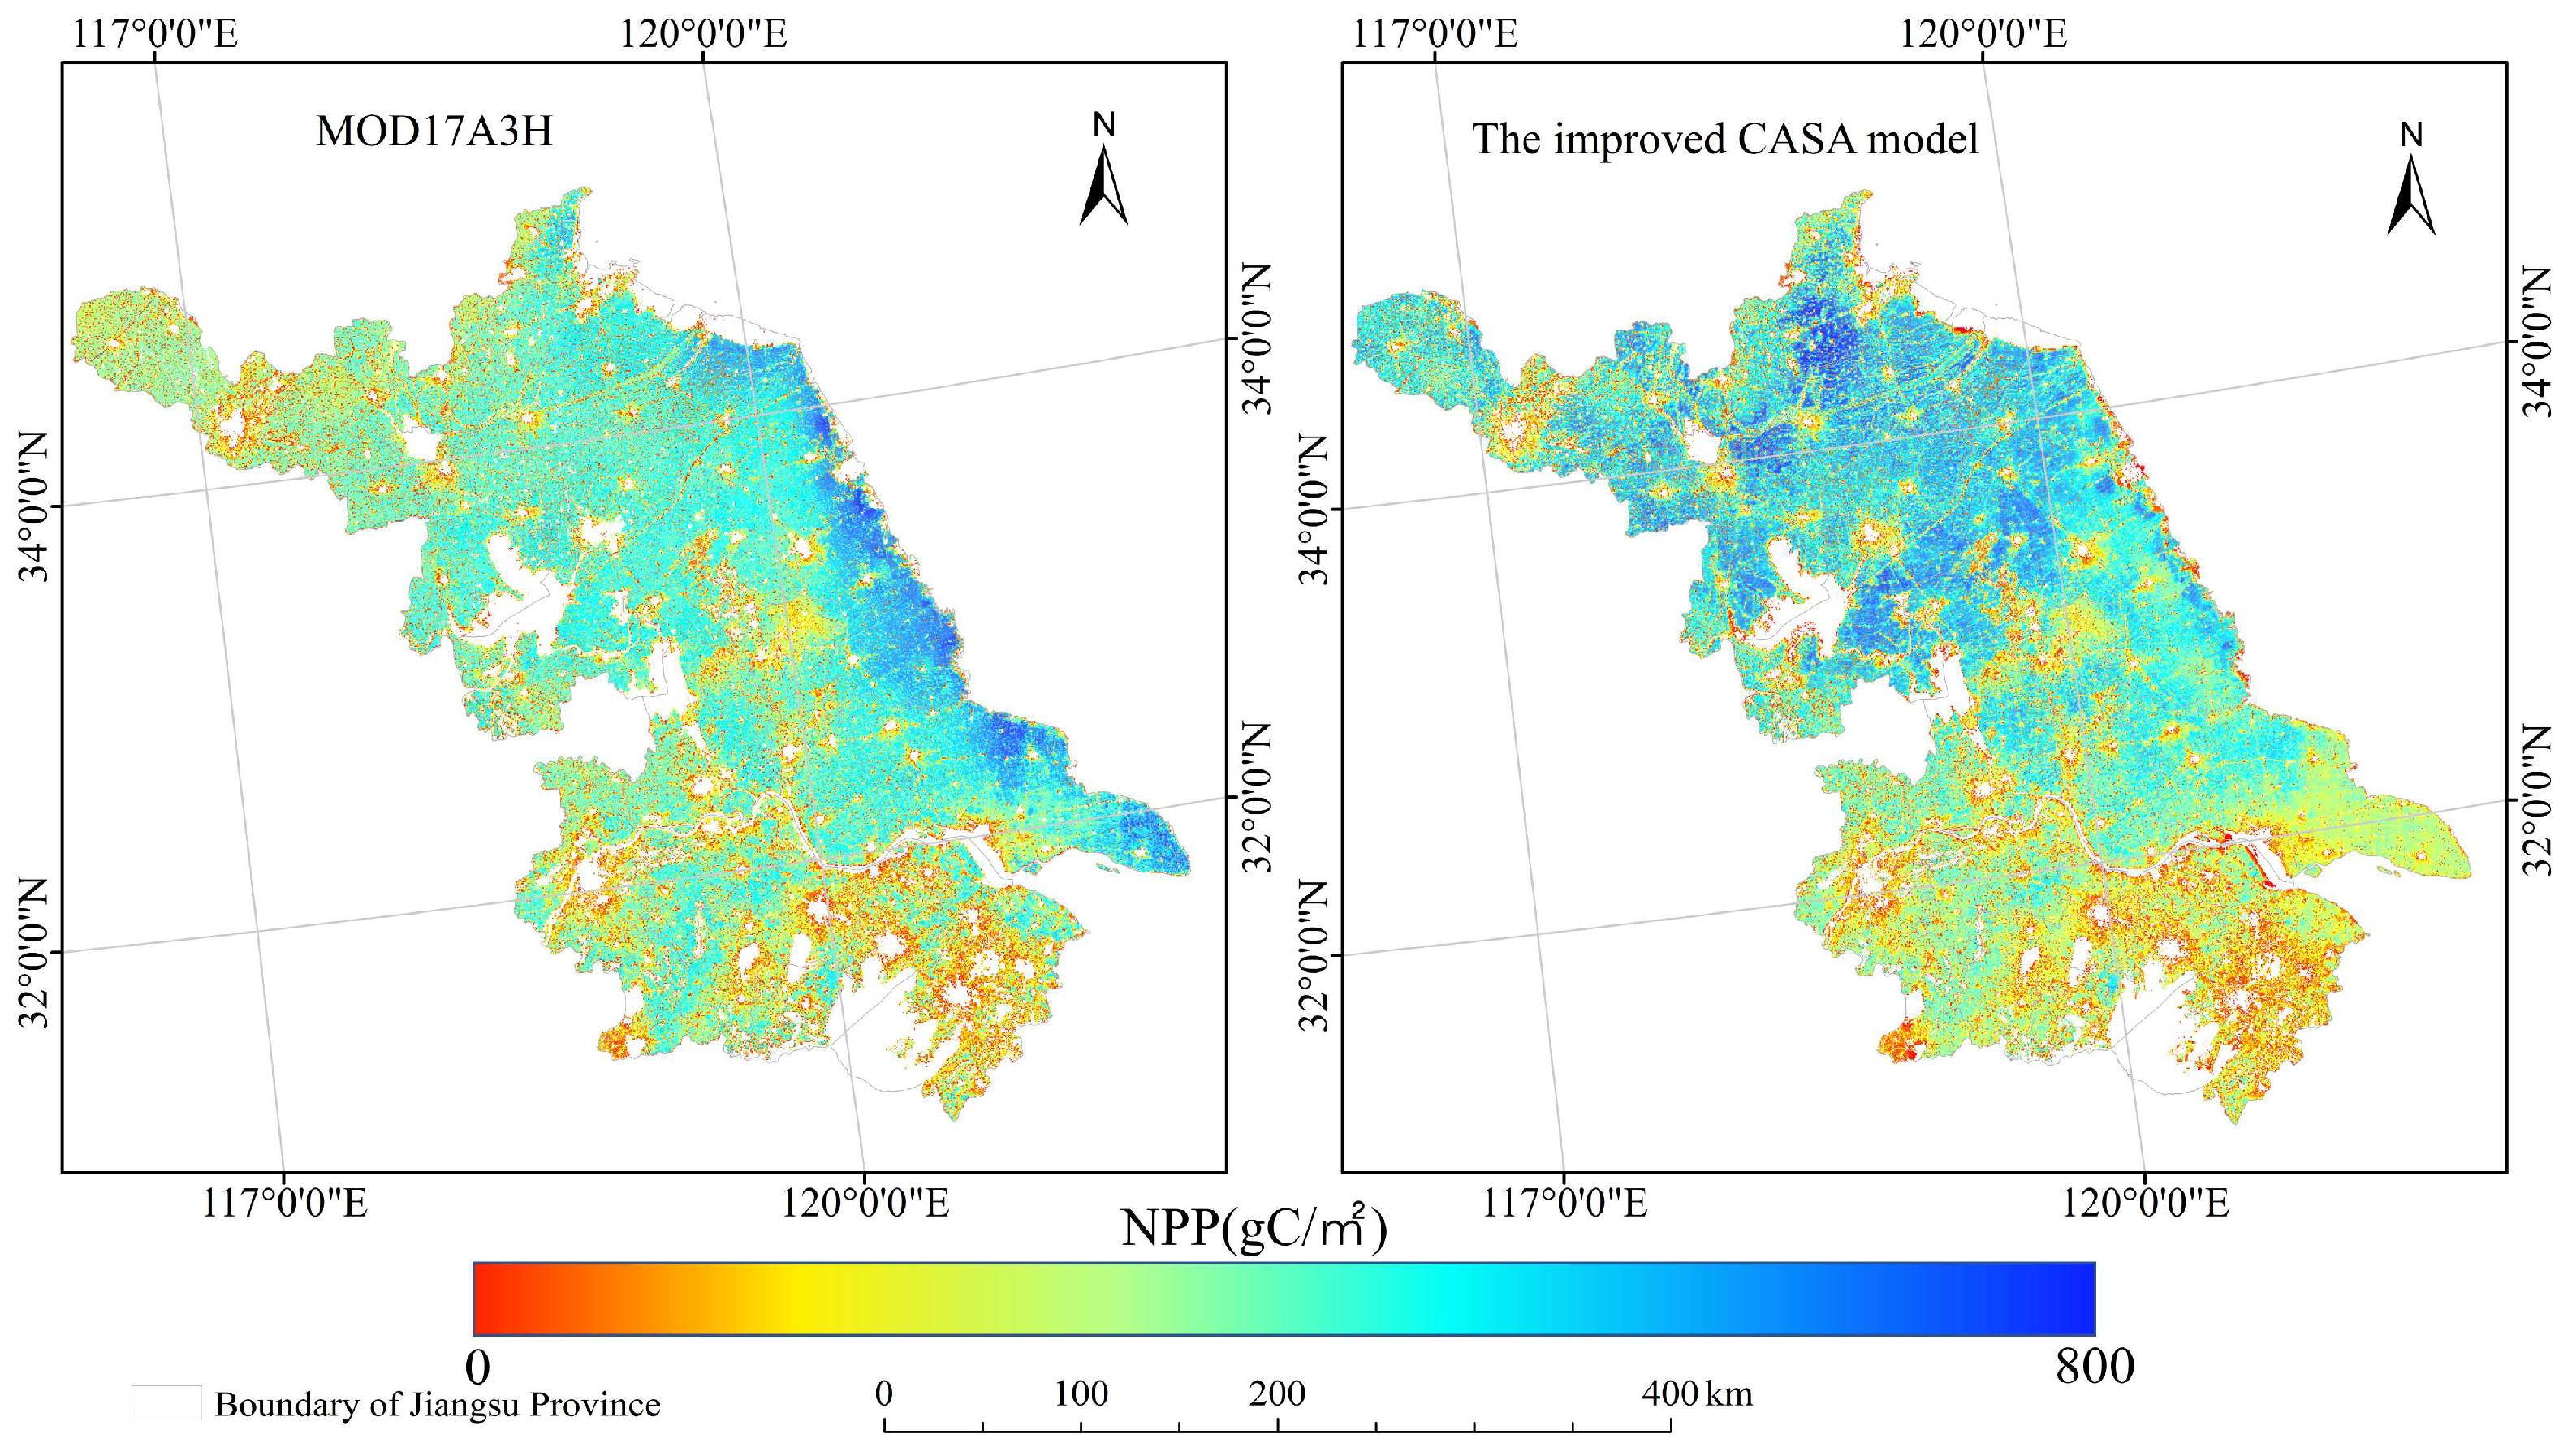
4.1. Reliability Analysis of NPP Estimation Results

The study employed the improved CASA model to obtain annual NPP outcomes, which were utilized to calculate the yearly average NPP. Validation statistical indices for the database were calculated between the estimated NPP and MOD17A3H (Figure 3). A comparison of their spatial distribution is shown in Figure 4.
Figure 3 showed that the values of the correlation coefficient in 2005, 2010, 2015 and 2020 were 0.75, 0.76, 0.78 and 0.70, respectively; the mean absolute errors were 52.62, 48.80, 52.25 and 52.75, respectively; the root mean square error values were 61.24, 57.79, 60.87 and 61.59, respectively.
As can be seen from Figure 4, the trends in the estimation results of the two models were slightly different, with the high values from MOD17A3H mostly distributed in the coastal areas, while the high values from the improved CASA model were distributed in the inner regions and were more evenly distributed. The estimates for the southern Jiangsu region were generally lower than those for the northern and central Jiangsu regions, contrary to the common belief that lower latitudes had higher NPP values than higher latitudes.

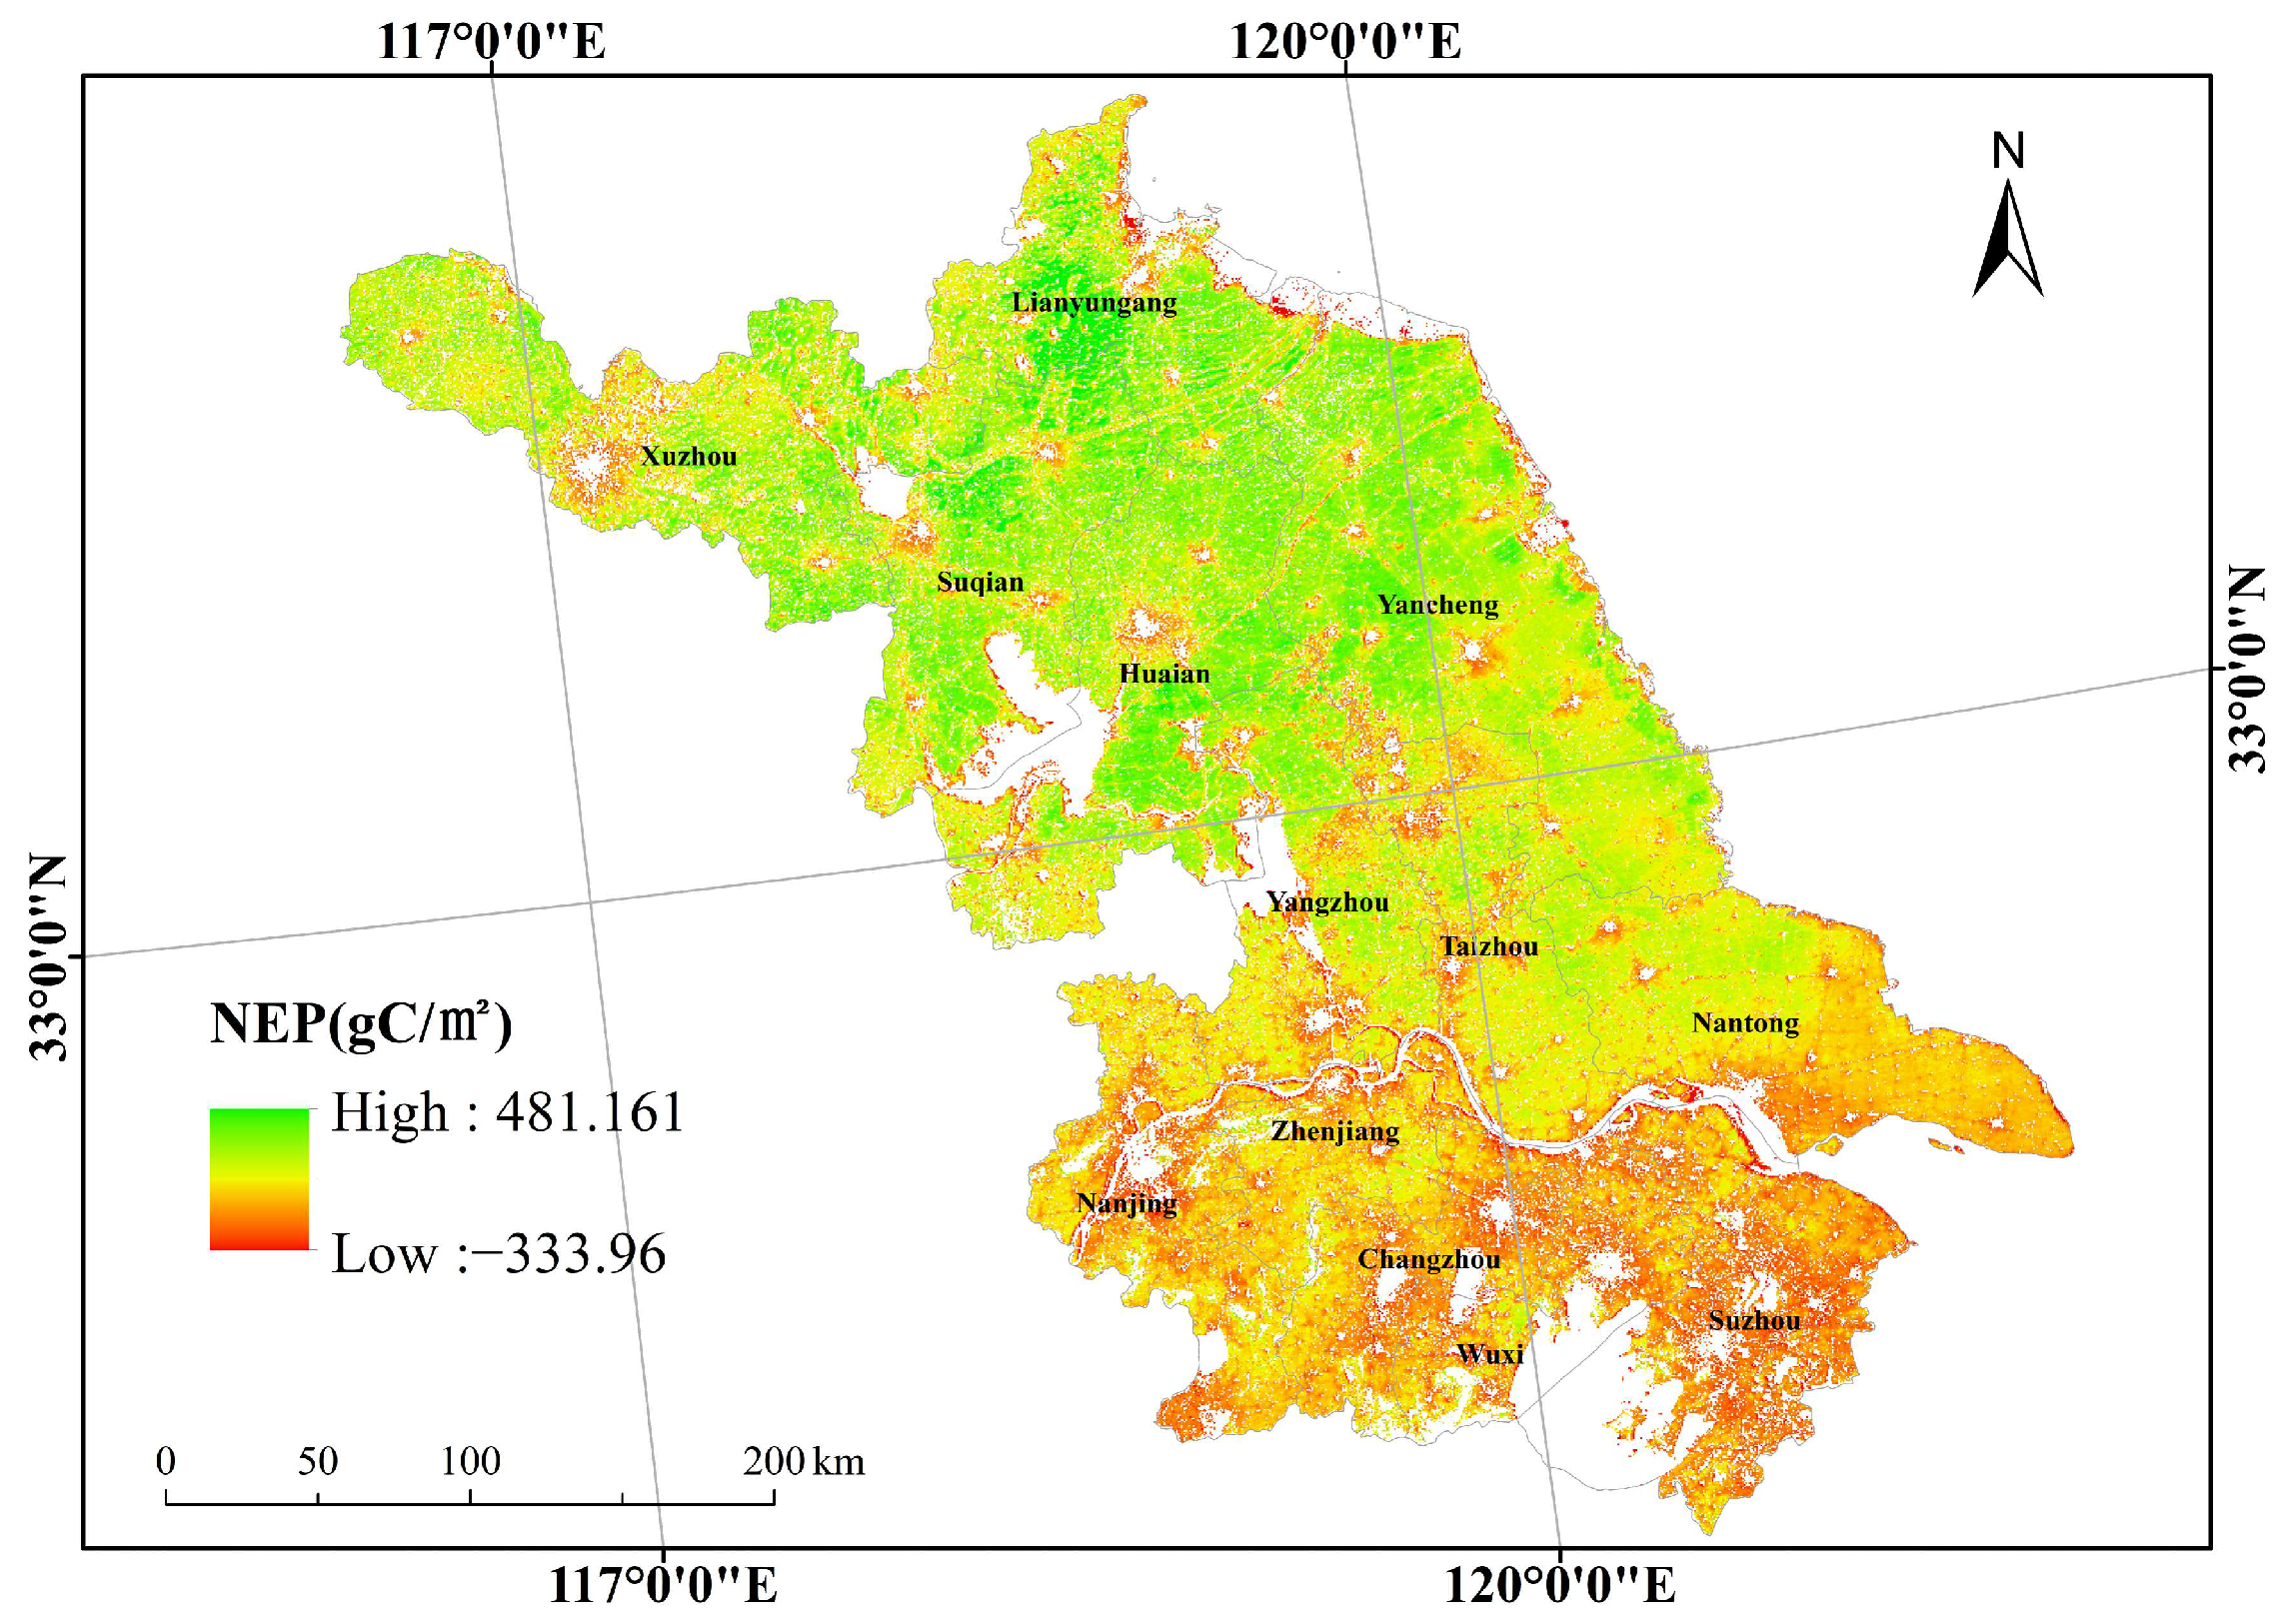
4.2. Spatial Distribution of NEP

Figure 5 displays the yearly mean NEP distribution in the Jiangsu Province over 22 years. Notably, the NEP of crops in the province follows a spatial gradient, with higher levels observed in the north and lower levels in the south, specifically North Jiangsu > Central Jiangsu > South Jiangsu. From 2001 to 2022, the mean NEP of the crops in Jiangsu Province was 163.4 gC/m2, indicating an effective carbon sink performance. Of the examined crops, 93.27% demonstrated a positive NEP, indicating a carbon sink effect. Conversely, 6.73% of the crops exhibited a negative NEP, indicating a carbon source effect, which was primarily concentrated in the southern and central regions of Jiangsu Province.

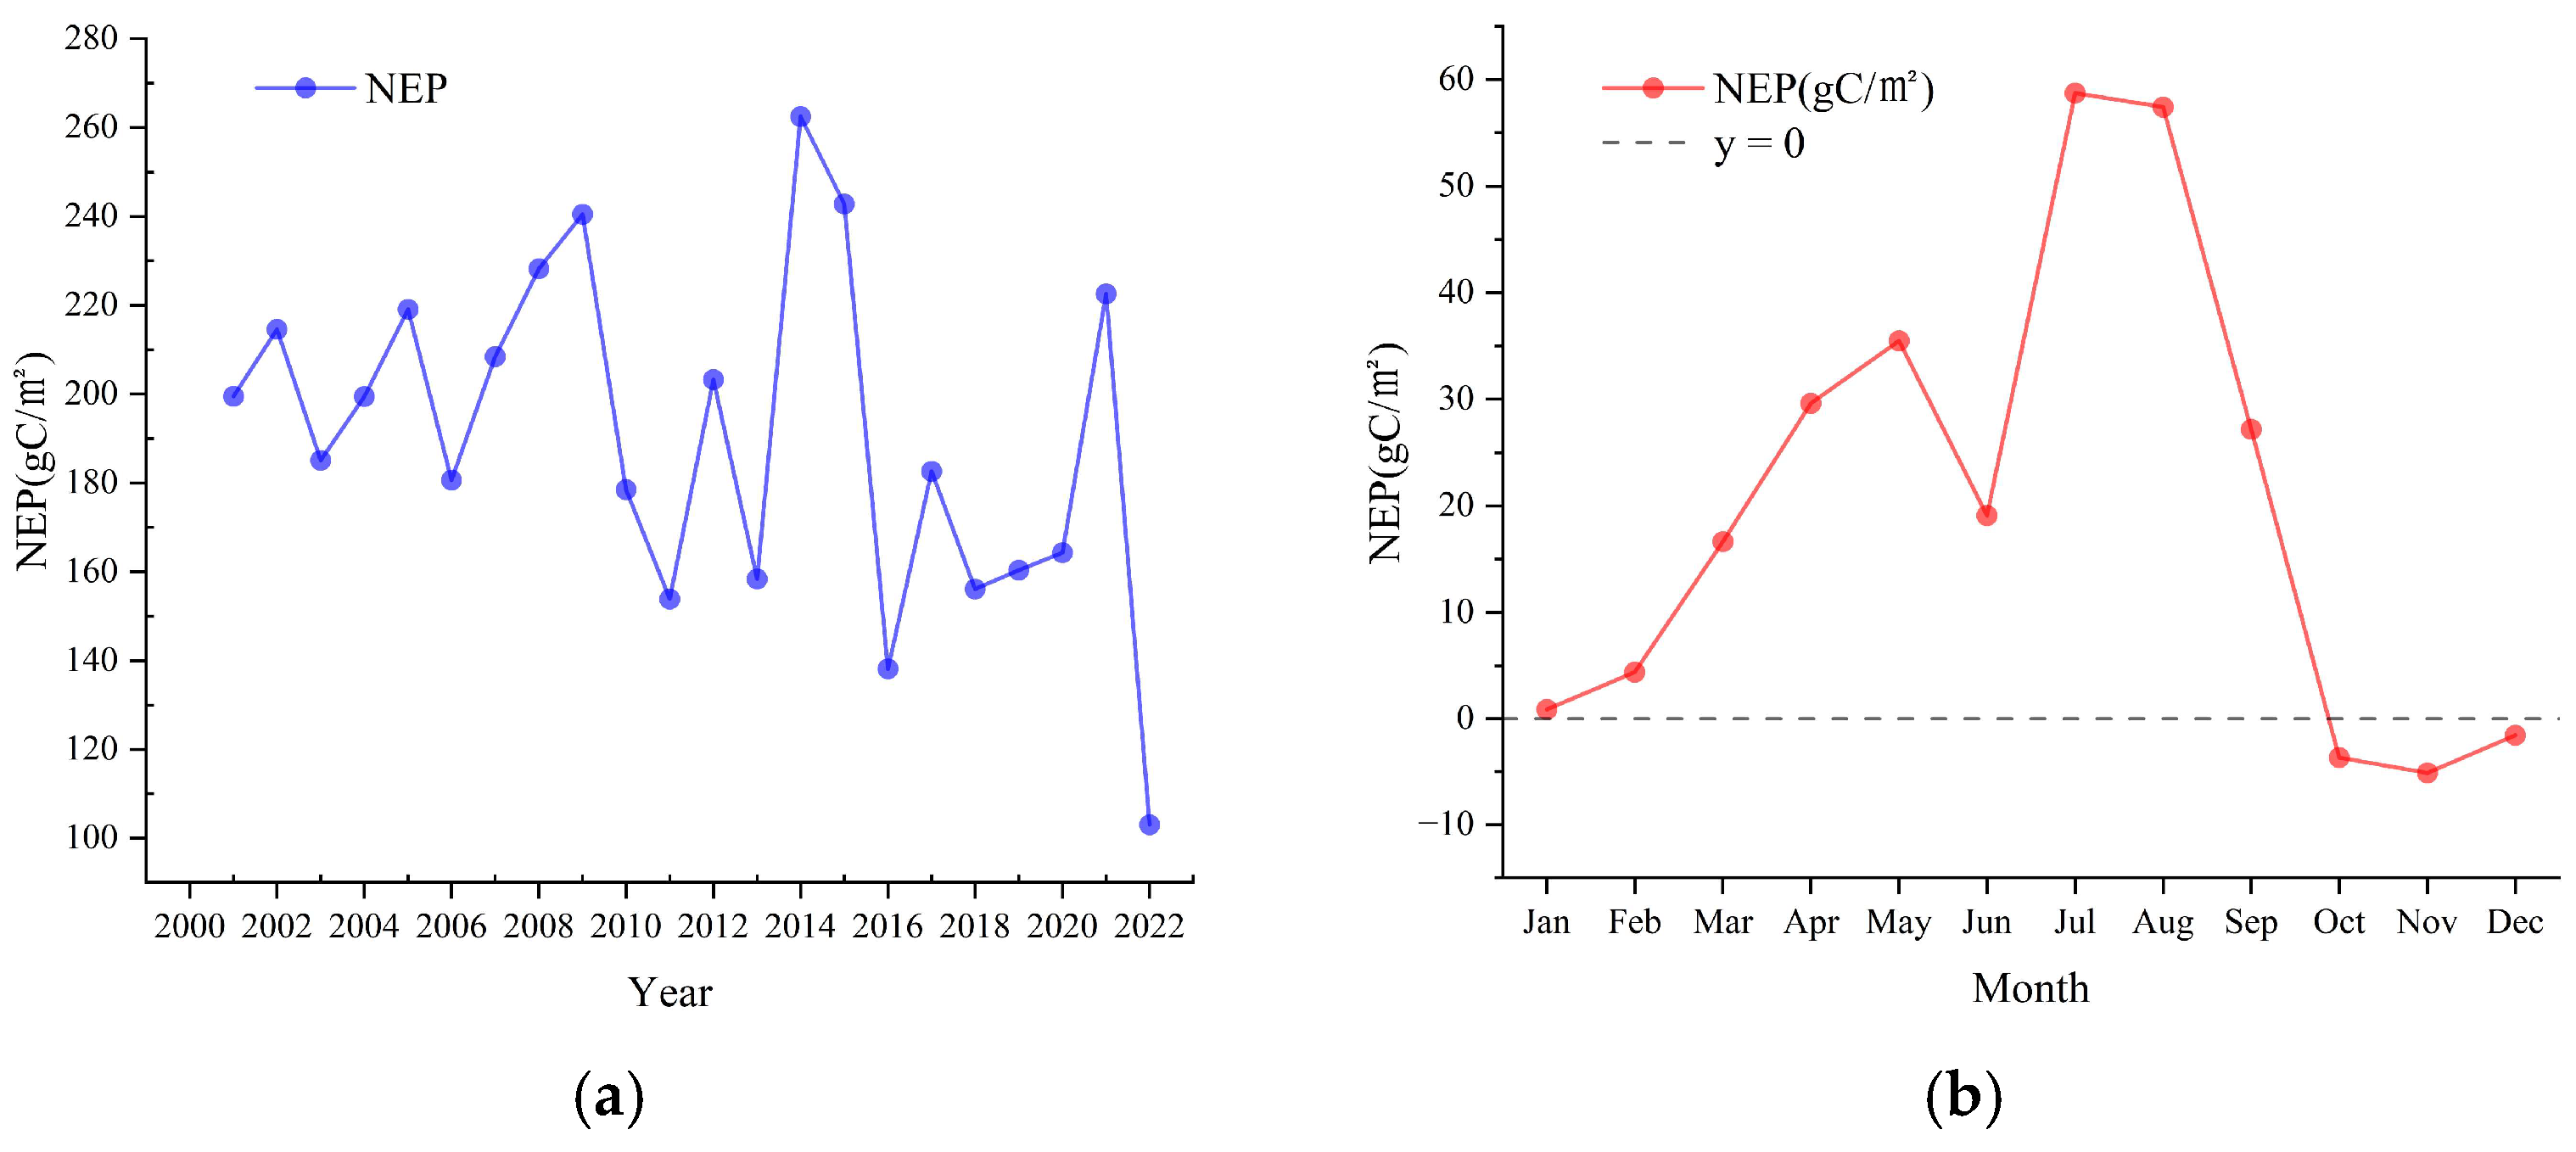
4.3. Temporal Changes in NEP

Figure 6a displays the changes in the yearly mean NEP values of the crops in Jiangsu Province from 2001 to 2022. The NEP values for the crops varied from 103.02 to 262.46 gC/m2, indicating an overall declining trend with a slope of −2.28 gC/m2/year. The highest NEP of the crops was observed in 2014 (262.46 gC/m2), while the lowest was recorded in 2022 (103.02 gC/m2).
Figure 6b shows a double peak in the monthly average NEP ranges from −5.11 to 58.74 gC/m2. During the January to September period, there was a positive trend with a peak value (58.74 gC/m2) in July. This suggested that crop vegetation ecosystems in Jiangsu Province acted as carbon sinks during this nine-month duration. From October to December, the crop vegetation ecosystems in Jiangsu Province demonstrated a carbon source attribute, with the lowest value (−5.11 gC/m2) in November.
The northern Suzhou region of Jiangsu Province boasts a diverse range of perennial crops and a vast planting area. This diversity allows for a clear visualization of the correlation between the crops and the changes in the NEP over time. For this reason, the region was selected for the analysis, with particular attention paid to the unique characteristics of the NEP changes in relation to crop planting. We referenced the national 1 km planting distribution dataset for the three primary food crops from 2000 to 2019. The crop distribution information selected for this study pertained to 2018 (Figure 2). Figure 7 displays the month-by-month NEP results for the same year in the northern region of Jiangsu Province, along with the distribution information for the three major crops.
By combining the crop distribution information (Figure 2), agricultural information (Table 1) and monthly NEP spatial distribution results (Figure 7), the following patterns can be derived from the comprehensive analysis:
In January, during the midst of winter, the primary crops are oilseed rape and winter wheat. There are several factors contributing to the significant carbon sources: (1) With low winter temperatures, crops enter the overwintering phase, where photosynthesis and respiration are hindered. This leads to a lower net photosynthesis uptake as compared to the amount of respiration being consumed by the crops and the soil. (2) In recent years, as per Jiangsu Province’s policy regulations, a portion of the land has been appropriately left fallow or planted after the autumn harvest, leading to a prevalent increase in soil respiration.
Starting in February, the rising temperature and precipitation gradually increase the photosynthesis of planted oilseed rape, winter wheat and vegetables. This results in more carbon fixation than respiration, indicating the status of carbon sinks. Additionally, as we progress into the spring and summer seasons, the amount of carbon sinks steadily increases. It is important to note that technical terms will be explained when first used.
Until June, a significant carbon source is observed in Jiangsu Province due to the summer harvest, which includes a large area for winter wheat cultivation. In that month, photosynthesis fixation is lower than respiratory consumption, resulting in an increased presence of carbon sources. In some wheat-growing regions, the lack of carbon sources may be attributed to various factors: (1) After concluding the winter wheat harvest, crops such as rice, corn, soybeans and vegetables are planted in the summer season. Rice is grown from April to May for seedling, and upon direct transplantation, the leaves are capable of photosynthesis. (2) Farmland planting has become more diverse, leading to mixed images with a resolution of 500 m. As a result, some images depict other crops growing alongside the main crop, creating a carbon sink.
In July and August, the summer months arrived and brought the optimal meteorological conditions and solar radiation of the year. The photosynthesis and respiration of crops planted throughout the region were robust, with considerably more fixed by photosynthesis than consumed by respiration. As a result, most areas showed high carbon sink values. The harvesting of spring maize may be the cause of the carbon source in some of these areas.
In September, crops in various regions start their harvest period at different times. Pizhou City (part of Xuzhou City) acts as a carbon source during this time as it begins harvesting rice in September while other municipalities have not yet reached the harvest stage. From October to November, the autumn harvest takes place in Jiangsu Province. Rice, soybeans, maize and other crops are harvested, and then the autumn planting of winter wheat and oilseed rape commences. In December, vegetable planting continues with the crops having already emerged from their seedlings for photosynthesis. In general, the pattern of carbon sinks–carbon sources–carbon sinks in the north of the Soviet Union follows a changing rule.

4.4. Analysis of Trends

In order to explore the changes in crop carbon sources/sinks in Jiangsu Province, this paper calculated the various trends of annual NEP from 2001 to 2022. The results from a significance test are shown in Figure 8.
A proportion of 11.96% of the crops exhibited a positive trend in the NEP with varying degrees of statistical significance. This suggested that arable lands had improved their capacity to sequester carbon during the 22 years of cultivation. A proportion of 88.04% of the cropland NEP exhibited a gradual weakening of the carbon sequestration capacity between 2001 and 2022, with a decreasing trend of varying degrees. The most significant decreasing trends were observed in the northwestern and southeastern parts of the province, with only a few areas showing increasing trends, primarily in the central part of northern Jiangsu Province and the eastern seaboard, as well as around the Taihu Lake Basin and the Hongze Lake Basin. Overall, the NEP of the arable land in Jiangsu Province has shown a decreasing trend over the past 22 years. This suggested a weakening of the carbon sequestration capacity of arable land or a reduction in the production capacity of arable land.

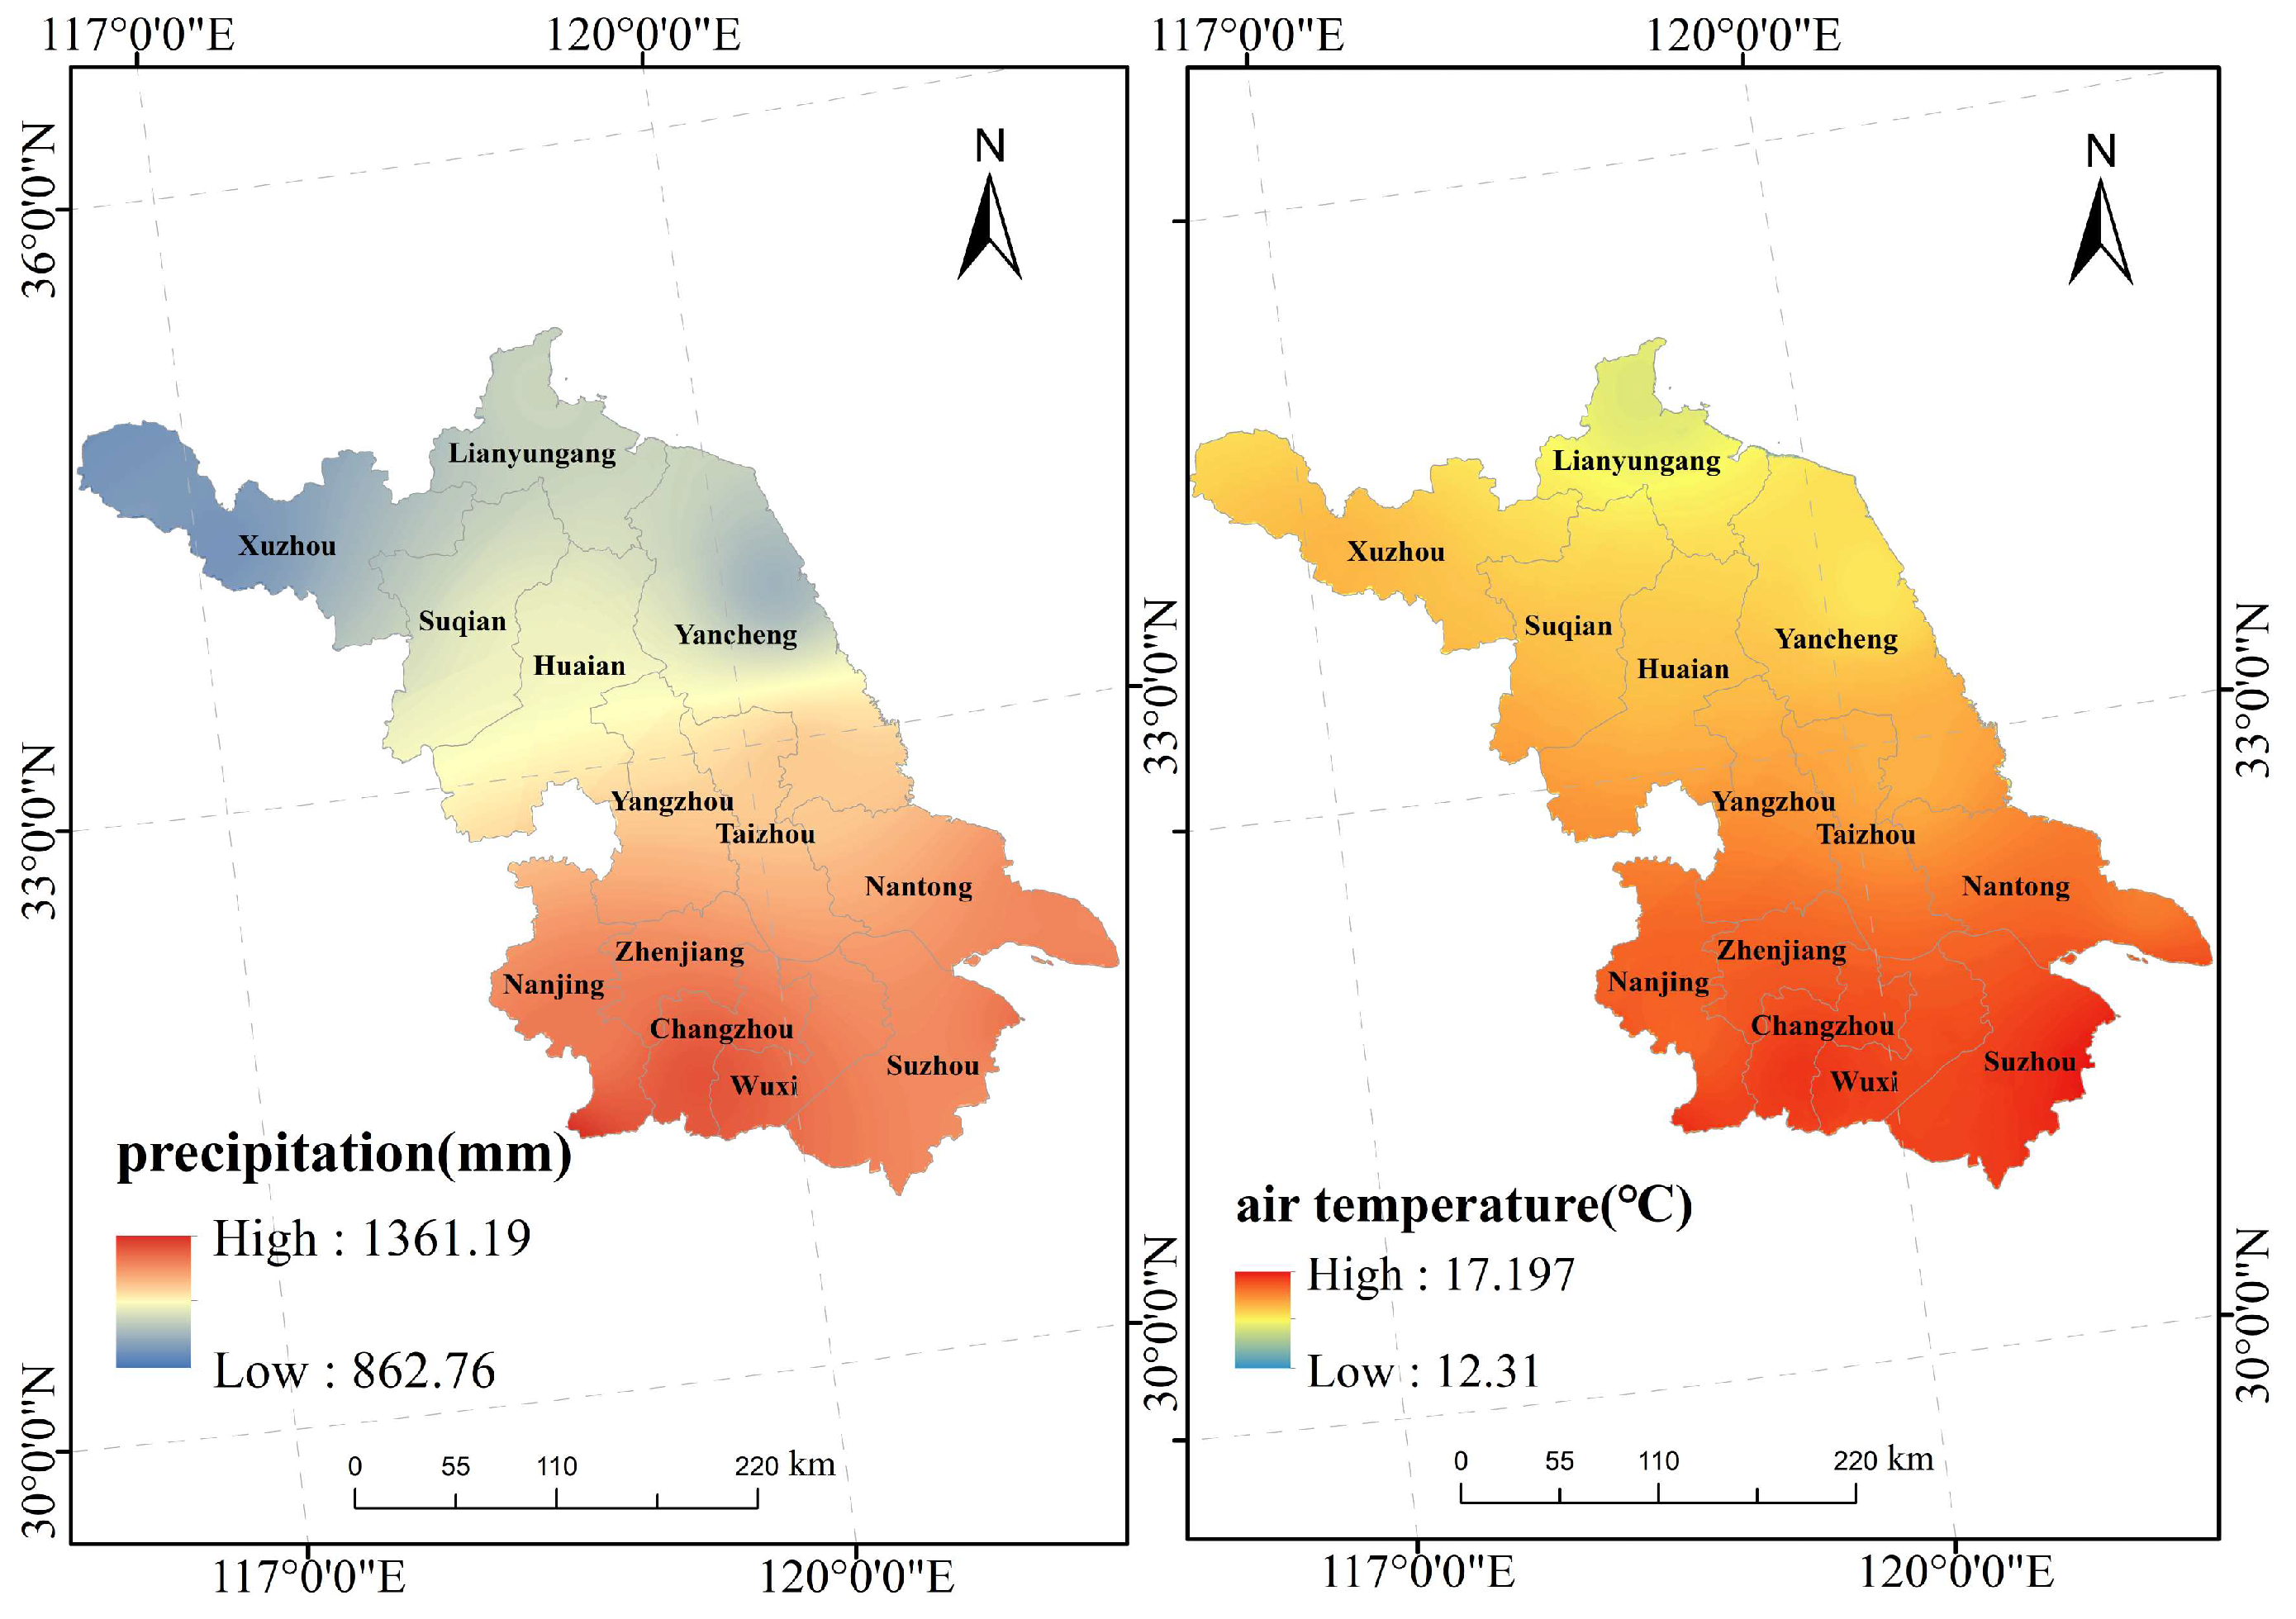
4.5. Partial Correlation Analysis between NEP and Meteorological Factors

Figure 9 shows the average precipitation and air temperature in Jiangsu Province for the 22-year period. There were evident spatial variations between the northern and southern regions of Jiangsu Province. As one moved gradually from the north towards the south, there was an increase in both precipitation and temperature, characterizing the area. The line of the Huaihe River and the General Irrigation Canal of North Jiangsu separates the province into two regions. The northern part experienced a warm temperate humid and semi-humid monsoon climate, while the southern part enjoyed a subtropical humid monsoon climate. When examined alongside the spatial distribution data of the NEP, it became apparent that regions with a high NEP strongly coincided with the North and Central Jiangsu regions. These areas had lower precipitation and cooler temperatures in comparison to the South Jiangsu region.
Figure 10 illustrates the temporal variations of the yearly rainfall and temperature in Jiangsu Province from 2001 to 2022. The yearly precipitation ranged from 806.30 to 1650.50 mm, having an average of 1140.89 mm over 22 years. Throughout this duration, the yearly precipitation depicted a fluctuating and escalating inclination, achieving a pinnacle in 2014 (1650.5 mm) and a nadir in 2020 (806.3 mm). Consequently, floods or droughts could ensue. The annual mean temperature ranged from 13.67 °C (2012) to 16.46 °C (2017), with a 22-year average of 15.80 °C. It exhibited a similar pattern to that of precipitation; nevertheless, years with extreme shifts do not display any substantial correlation.
To examine the correlation between the NEP and climate factors, this study conducted an image-by-image partial correlation analysis. Figure 11 presents the findings from the partial correlation analysis that tested the significance between the annual NEP and the two climate factors.
The results indicated that 34.14% of the crop NEPs exhibited a negative correlation with precipitation, with only 1.23% of these exhibiting a significant negative correlation, and 32.91% exhibiting a non-significant negative correlation. Additionally, 65.86% of the crop NEPs were positively correlated with precipitation, of which 6.83% exhibited a significant positive correlation, while 59.02% exhibited a non-significant positive correlation. The areas with negative correlation were primarily distributed in the central and southern parts of Jiangsu Province, exhibiting a substantial overlap with the high precipitation zones. Conversely, the areas with positive correlation were predominantly found in the northern and northeastern coastal areas of Jiangsu Province, where the precipitation was relatively low.
The correlation between the NEP and temperature was inversely proportional to that of the precipitation. Of the crop NEPs, 78.87% exhibited a negative correlation with the temperature, predominantly in the inland regions, with the level of significance progressively increasing from east to west. Notably, there was a moderate negative correlation of 14%. A proportion of 50% of the observations yielded a non-significant negative correlation of 64.36%. A positive correlation between the crop NEP and temperature was identified in 21.13% of the samples, mainly concentrated in the eastern coastline area. The significant positive correlation was 0.95%, and the proportion of non-significant positive correlation was 20.18%.
In summary, there was a correlation between the NEP of the crops and rainfall from north to south, from a positive correlation to a negative correlation; the correlation with temperature was from east to west, from a positive correlation to a negative correlation.

5. Discussions

5.1. Performance Evaluation

Although this study has the limitation that there is no ground truth data on the NPP and NEP for validation. This experiment compared the NPP estimates with the MOD17A3H product and referred to the results of other scholars’ studies [41,42,43] on crop productivity estimates, which were in a reasonably similar range of values for both the NPP and NEP of crops in this study. From the experimental results, it can be seen that there are differences in the numerical and spatial distribution of the NPP annual means between the MOD17A3H and CASA models. There are two possible reasons for this: (1) MOD17A3H is calculated using the MOD17 algorithm to obtain the GPP and by subtracting the plant maintenance respiration through the Biome-BGC model to obtain the NPP, and respiratory maintenance is calculated using an empirical model [44]. The CASA model is a direct estimation of the NPP, and the part consumed by the vegetation’s own respiration has been excluded from its maximum light energy use. They are calculated very differently and may produce different results [41]. In addition, the Biome-BGC model on which the MOD17A3H product is based does not include the necessary module for estimating crop carbon fluxes, which leads to larger errors in the NPP for agricultural land [9]. (2) There are numerous anthropogenic factors (such as irrigation and fertilizer application) involved in the crop growth process. These factors have a significant influence on the biochemical reactions of crops, resulting in greater uncertainty in the estimation of the NPP. Furthermore, the annual mean NPP values of arable land estimated by the improved CASA model (404.5 gC/m2/year) in this study are very close to the annual mean NPP values of Zhu’s study (426.5 gC/m2/year) [21] and the annual mean values of MOD17A3 (403.1 gC/m2/year). This indirectly confirms the dependability of the improved CASA model for arable land NPP estimation. The spatial distribution of the annual NPP of arable land was also consistent with the results of previous studies [45,46,47]. Due to the influence of multiple factors such as crop type, cropping system, maturity system, farmland management measures, etc., the spatial distribution characteristics of Jiangsu’s farmland in terms of the annual cumulative NPP values differed from the generally accepted law that low latitude areas had higher NPP values than high latitude areas [48]. For example, in the economically developed South Jiangsu region, the low incentive for farmers to farm, ineffective management practices, a large proportion of area under oilseed rape, which has a relatively low yield among summer crops, and the high number of meteorological disasters during the crop ripening period have led to a low annual NPP value of the region’s arable land in recent years. In contrast, the high priority given to agricultural production in the north and center of Jiangsu Province, combined with favorable climatic conditions, the extensive cultivation of high-yielding rice and wheat varieties and effective management practices, has resulted in high NPP values for the arable land.
In summary, the CASA model has been widely used in many regions and in different ecosystems and has proven its applicability. Therefore, the NEP estimates in this study are reliable in terms of the spatial and temporal variability, and their patterns and salient features can effectively reflect the information on crop changes in agricultural production activities.

5.2. Spatiotemporal Pattern of the NEP

The results of the trend (Figure 7) showed that most of the cropland NEP in Jiangsu Province had shown a decreasing trend over the past 22 years, with only a few areas showing an increasing trend. Possible reasons for the increased carbon uptake are as follows: (1) In relation to measures aimed at promoting food production, such as improving local crop varieties and optimizing cropping patterns, as well as implementing rational management measures like returning straw to the fields [49,50] and reducing the use of chemical fertilizers. (2) The salinated land of Jiangsu Province has undergone restoration and treatment in recent years within the eastern region, resulting in the transformation of said land into high-yielding crop fields [51]. (3) The rise in the carbon sequestration capability of soil, adjacent to Hongze Lake, Gaoyou Lake, Taihu Lake as well as watercourses may correlate to the actions applied to defend the lake catchments [52], utilizing fallow crop rotation on cultivable land, which facilitated an increase in soil fertility and crop carbon sequestration capacity.
There are a number of possible reasons for the decline in the carbon sequestration capacity of farmland in other areas. Firstly, owing to long-term overcultivation and irrational agricultural management, continuous crop cultivation, large-scale fertilizer application and excessive irrigation and other measures have led to the loss of soil nutrients in arable land and a reduction in soil fertility. Similarly, soil erosion and soil salinization are significant factors. After the crops are harvested, agricultural land is often left idle or converted for other uses, resulting in the parcels becoming a carbon source for a long period of time. Besides, urbanization leads to the inevitable occupation of arable land for construction, resulting in a continuous reduction of the arable land area [53].
Based on the patterns of change found in Figure 7 and the above analyses, it is suggested that arable land protection measures that have been successfully implemented in the Taihu Lake Basin and the Hongze Lake Basin should be further strengthened and promoted. Additionally, more rational farming systems and arable land management measures should be implemented to improve soil fertility and conditions, as well as to increase the arable land utilization rate. This will help to achieve the desired effect of reducing emissions and increasing remittances.

5.3. Response of NEP to Climate Factors

Agriculture is highly susceptible and vulnerable to the impacts of climate change [54]. Furthermore, the impact of climatic factors, such as temperature and precipitation, on crop growth varies considerably across different regions [55].
In contrast to the central and southern regions of Jiangsu Province, the northern and eastern coastal areas experience lower average annual temperatures and precipitation levels (Figure 9). The primary crops grown in these areas are wheat, maize and rice (Figure 2). High temperatures and high precipitation occur in the south-central region, where rice cultivation is the mainstay. The cropland that shows a positive correlation between precipitation and the NEP is mainly situated in the northern region and along the eastern coast, while most of the cropland with a negative correlation is located in the southern region (Figure 11). The results are consistent with previous studies [55,56]. The northern part of the region is drier and increased rainfall favors NEP growth in wheat and maize, while the southern part of the region is wetter and more rainfall inhibits rice growth, which is detrimental to NEP growth.
Significant zonal differences were observed in the response of the NEP to air temperature. Cropland with a negative correlation between temperature and the NEP is mainly located inland, while those with a positive correlation are mainly located on the coast and closer to water sources. A slight rise in regional temperature is linked to a potential increase in the crop yield, but if the warming exceeds the relevant threshold, it is associated with a decrease in yield [57]. Moreover, at low and mid-latitudes, temperature increases generally shorten the crop growth cycle [58]. The topography, climate and urban density in the interior of Jiangsu Province have led to an increase in temperature and elevation, which in turn affect the NEP of arable land [59,60], whereas in coastal and near-water areas, warming tends to favor crop growth probably due to the influence of the difference between land and water on climate.
Anthropogenic interventions in the agricultural production process reduce the significance of the NEP in correlation analyses with temperature and precipitation. In addition, the combination of climatic factors also has a significant impact on the NEP. Combining Figure 6a with Figure 10, it can be seen that high temperatures and high rainfall, or high temperatures and low rainfall, can lead to low values of the NEP for that year’s crop, which is directly related to droughts and floods caused by climatic factors [61,62].

5.4. Summary and Prospects of the Study

Most of the previous studies on crops have focused on the estimation of the NPP of crops and crop yields; this study makes an attempt to further study the NEP in crops. However, there are still limitations to this study. The limited number of terrestrial agro-ecosystem sites means that the NPP and NEP are still not sufficiently validated at present. The maximum light energy utilization value for crops in this study is based on previous research. However, recent studies [48,63] have shown that this value varies among different crop varieties and is not fixed. It is subject to change due to human activities and climate change. The soil respiration equation used in this experiment has some uncertainty, so it is necessary to optimize the measurement of Rh in order to obtain a more accurate NEP. Furthermore, the current estimation of the crop NPP and NEP through remote sensing does not consider the impact of anthropogenic control measures, such as fertilizer application, irrigation and straw return to the field.
In the future, it is necessary to decrease the uncertainty in the NEP of the crop estimation process and enhance the accuracy of the results. Moreover, further research is required to fully understand the complex multifactorial influences on the response mechanism of the crop NEP and its influencing factors.

6. Conclusions

As a large agricultural province, for Jiangsu Province, under the policy background of carbon peaking and carbon neutrality, it is important to accurately study the carbon sinks of cropland to promote carbon reduction and sequestration in agriculture and rural areas, and the expansion of carbon sequestration in farmland. In this paper, the optimized CASA model is first used to estimate the NPP, and then the empirical model of the soil respiration is used to calculate the NEP. The crop carbon sinks in Jiangsu Province are closely connected to crop varieties and cultivation. The fixation of photosynthesis in the planting process is the source of crop carbon sinks. The short-term window of land after crop harvesting and fallow under the policy causes crop photosynthesis to stop, and soil respiration to release, leading to the formation of carbon sources. In the process of agricultural production, attention needs to be paid to the protection of agricultural land, maintaining soil fertility, reducing the use of chemical fertilizers, and improving the production capacity of the land through measures such as farming fallow, saline land management, etc., which is of great significance in enhancing the carbon sink of crops.

Author Contributions

Conceptualization, Y.X.; Methodology, P.W.; Software, P.W. and B.H.; Validation, P.W., W.Y., B.H. and P.L.; Formal analysis, P.W. and W.Y.; Investigation, Y.X.; Resources, Z.Y., B.H. and P.L.; Data curation, Z.Y.; Writing—original draft, P.W.; Writing—review & editing, Y.X.; Visualization, P.L.; Supervision, Y.X. and Z.Y.; Funding acquisition, Y.X. All authors have read and agreed to the published version of the manuscript.

Funding

This work was supported in part by the National Natural Science Foundation of China (NSFC) under Grant No. 42275147.

Data Availability Statement

The original contributions presented in the study are included in the article, further inquiries can be directed to the corresponding author.

Conflicts of Interest

The authors declare no conflict of interest.

References

  1. Symonds, M.E. Faculty Opinions recommendation of IPCC, 2021: Summary for Policymakers. In Climate Change 2021: The Physical Science Basis. Contribution of Working Group I to the Sixth Assessment Report of the Intergovernmental Panel on Climate Change; Faculty Opinions—Post-Publication Peer Review of the Biomedical Literature; Cambridge University Press: Cambridge, UK, 2021. [Google Scholar]
  2. Kumar, P.; Martino, D.; Smith, P.; Al, E. Agriculture (Chapter 8) in IPCC, 2007: Climate Change 2007: Mitigation of Climate Change. In Contribution of Working Group III to the Fourth Assessment Report of the Intergovernmental Panel on Climate Change; Cambridge University Press: Cambridge, UK, 2007; pp. 497–540. [Google Scholar]
  3. Dachraoui, M.; Sombrero, A. Effect of tillage systems and different rates of nitrogen fertilisation on the carbon footprint of irrigated maize in a semiarid area of Castile and Leon, Spain. Soil Tillage Res. 2020, 196, 104472. [Google Scholar] [CrossRef]
  4. Liu, X.C.; Wang, S.; Zhuang, Q.L.; Jin, X.X.; Bian, Z.X.; Zhou, M.Y.; Meng, Z.; Han, C.L.; Guo, X.Y.; Jin, W.J.; et al. A Review on Carbon Source and Sink in Arable Land Ecosystems. Land 2022, 11, 580. [Google Scholar] [CrossRef]
  5. Zhao, M.Y.; Liu, Y.X.; Zhang, X.Y. A review of research advances on carbon sinks in farmland ecosystems. Acta Ecol. Sin. 2022, 42, 9405–9416. [Google Scholar]
  6. Lal, R. Soil carbon dynamics in cropland and rangeland. Environ. Pollut. 2002, 116, 353–362. [Google Scholar] [CrossRef]
  7. Fang, J.Y.; Ke, J.H.; Tang, Z.Y.; Chen, A.P. The concept, estimation and interrelationship of the “4Ps” of biological productivity. J. Plant Ecol. 2001, 25, 414–419. [Google Scholar]
  8. Huang, Y.T.; Wang, F.; Zhang, L.J.; Zhao, J.F.; Zheng, H.; Zhang, F.; Wang, N.; Gu, J.K.; Zhao, Y.F.; Zhang, W.S. Changes and net ecosystem productivity of terrestrial ecosystems and their influencing factors in China from 2000 to 2019. Front. Plant Sci. 2023, 14, 1120064. [Google Scholar] [CrossRef] [PubMed]
  9. Liang, L.; Geng, D.; Yan, J.; Qiu, S.Y.; Shi, Y.Y.; Wang, S.G.; Wang, L.J.; Zhang, L.P.; Kang, J.R. Remote Sensing Estimation and Spatiotemporal Pattern Analysis of Terrestrial Net Ecosystem Productivity in China. Remote. Sens. 2022, 14, 1902. [Google Scholar] [CrossRef]
  10. Pathak, K.; Malhi, Y.S.; Sileshi, G.; Das, A.K.; Nath, A.J. Net ecosystem productivity and carbon dynamics of the traditionally managed Imperata grasslands of North East India. Sci. Total Environ. 2018, 635, 1124–1131. [Google Scholar] [CrossRef]
  11. Ceschia, E.; Béziat, P.; Dejoux, J.-F.; Aubinet, M.; Bernhofer, C.; Bodson, B.; Buchmann, N.; Carrara, A.; Cellier, P.; Di Tommasi, P. Management effects on net ecosystem carbon and GHG budgets at European crop sites. Agric. Ecosyst. Environ. 2010, 139, 363–383. [Google Scholar] [CrossRef]
  12. Liu, L.; Guan, J.; Zheng, J.; Wang, Y.; Han, W.; Liu, Y. Cumulative effects of drought have an impact on net primary productivity stability in Central Asian grasslands. J. Environ. Manag. 2023, 344, 118734. [Google Scholar] [CrossRef]
  13. Shi, S.; Yu, J.-J.; Wang, F.; Wang, P.; Zhang, Y.; Jin, K. Quantitative contributions of climate change and human activities to vegetation changes over multiple time scales on the Loess Plateau. Sci. Total Environ. 2020, 755 Pt 2, 142419. [Google Scholar] [CrossRef]
  14. Song, S.; Niu, J.; Kumar Singh, S.; Du, T. Projection of Net Primary Production under changing environment in Xinjiang using an improved wCASA model. J. Hydrol. 2023, 620, 129314. [Google Scholar] [CrossRef]
  15. Bandaru, V.; West, T.O.; Ricciuto, D.M.; Izaurralde, R.C. Estimating crop net primary production using national inventory data and MODIS-derived parameters. ISPRS J. Photogramm. Remote Sens. 2013, 80, 61–71. [Google Scholar] [CrossRef]
  16. Bolinder, M.; Janzen, H.; Gregorich, E.; Angers, D.; VandenBygaart, A. An approach for estimating net primary productivity and annual carbon inputs to soil for common agricultural crops in Canada. Agric. Ecosyst. Environ. 2007, 118, 29–42. [Google Scholar] [CrossRef]
  17. Wang, Y.; Xu, X.; Huang, L.; Yang, G.; Fan, L.; Wei, P.; Chen, G. An Improved CASA Model for Estimating Winter Wheat Yield from Remote Sensing Images. Remote Sens. 2019, 11, 1088. [Google Scholar] [CrossRef]
  18. Wu, J.; Gu, Y.; Sun, K.; Xing, X.; Ma, X. Impacts of Climate Change on Winter Wheat Net Primary Production: The Regulatory Role of Crop Management. J. Sci. Food Agric. 2023. [Google Scholar] [CrossRef] [PubMed]
  19. Luo, Y.; Zhang, Z.; Li, Z.; Chen, Y.; Zhang, L.; Cao, J.; Tao, F. Identifying the spatiotemporal changes of annual harvesting areas for three staple crops in China by integrating multi-data sources. Environ. Res. Lett. 2020, 15, 074003. [Google Scholar] [CrossRef]
  20. Yang, J.; Huang, X. The 30 m annual land cover datasets and its dynamics in China from 1985 to 2022. Earth Syst. Sci. Data 2023, 13, 3907–3925. [Google Scholar] [CrossRef]
  21. Zhu, W.Q.; Pan, Y.Z.; Zhang, J.S. Remote sensing estimation of net primary productivity of terrestrial vegetation in China. J. Plant Ecol. 2007, 31, 413–424. [Google Scholar]
  22. Potter, C.; Randerson, J.T.; Field, C.B.; Matson, P.A.; Vitousek, P.M.; Mooney, H.; Klooster, S.A. Terrestrial ecosystem production: A process model based on global satellite and surface data. Glob. Biogeochem. Cycles 1993, 7, 811–841. [Google Scholar] [CrossRef]
  23. Ruimy, A.; Saugier, B.; Dedieu, G. Methodology for the estimation of terrestrial net primary production from remotely sensed data. J. Geophys. Res. 1994, 99, 5263–5283. [Google Scholar] [CrossRef]
  24. Kumar, M.; Monteith, J. Remote Sensing of Plant Growth. In Plants and the Daylight Spectrum; Academic Press: London, UK, 1981; pp. 133–144. [Google Scholar]
  25. Goward, S.N.; Huemmrich, K.F. Vegetation canopy PAR absorptance and the normalized difference vegetation index: An assessment using the SAIL model. Remote Sens. Environ. 1992, 39, 119–140. [Google Scholar] [CrossRef]
  26. Zhu, W.; Pan, Y.; He, H.; Yu, D.; Fu, H. China’s largest light utilization simulation of typical vegetation. Chin. Sci. Bull 2006, 51, 700–706. [Google Scholar]
  27. Los, S.O.; Justice, C.; Tucker, C. A global 1 by 1 NDVI data set for climate studies derived from the GIMMS continental NDVI data. Int. J. Remote Sens. 1994, 15, 3493–3518. [Google Scholar] [CrossRef]
  28. Field, C.B.; Randerson, J.T.; Malmström, C.M. Global net primary production: Combining ecology and remote sensing. Remote Sens. Environ. 1995, 51, 74–88. [Google Scholar] [CrossRef]
  29. Los, S.O. Linkages between Global Vegetation and Climate: An Analysis Based on NOAA Advanced Very High Resolution Radiometer Data; NASA: Washington, DC, USA, 1998. [Google Scholar]
  30. Piao, S.L.; Fang, J.Y.; Guo, Q.H. Estimating the net first productivity of vegetation in China using the CASA model. Chin. J. Plant Ecol. 2001, 25, 603–608. [Google Scholar]
  31. Zhou, G.S.; Zhang, X.S. A preliminary study on the net first productivity of natural vegetation. J. Plant Ecol. 1995, 19, 193–200. [Google Scholar]
  32. Odum, H.T.; Lieth, H.F.H.; Whittaker, R.H. Primary Productivity of the Biosphere. Pedobiologia 1978. [Google Scholar] [CrossRef]
  33. Zhou, G.S.; Zhang, X.S. Net first productivity of natural vegetation in China under global climate change. J. Plant Ecol. 1996, 20, 11–19. [Google Scholar]
  34. Thornthwaite, C.W. An approach toward a rational classification of climate. Geogr. Rev. 1948, 38, 55–94. [Google Scholar] [CrossRef]
  35. Peng, S.L.; Guo, Z.H.; Wang, B.S. Estimation of light energy utilization of vegetation in Guangdong using GIS and RS. J. Ecol. 2000, 20, 903–909. [Google Scholar]
  36. Zhu, W.Q.; Chen, Y.H.; Pan, Y.Z. Estimation of vegetation light utilization rate in China based on GIS and RS. J. Wuhan Univ. (Inf. Sci. Ed.) 2004, 29, 694–698+714. [Google Scholar]
  37. Pei, Z.Y.; Zhou, C.P.; Ouyang, H.; Yang, W.B. Carbon estimation in the alpine grassland region of the Qinghai-Tibet Plateau. Geogr. Res. 2010, 29, 102–110. [Google Scholar]
  38. Zhao, Y.H.; Peng, S.L.; Jin, H.D.; Du, R.; Chen, C.; Peng, S.J. Evaluation of vegetation change characteristics on the Tibetan Plateau based on multi-source remote sensing data. J. Glaciol. Geocryol. 2022, 44, 1216–1230. [Google Scholar]
  39. Fensholt, R.; Langanke, T.; Rasmussen, K.; Reenberg, A.; Prince, S.D.; Tucker, C.J.; Scholes, R.J.; Le, Q.B.; Bondeau, A.; Eastman, R.; et al. Greenness in semi-arid areas across the globe 1981–2007—An Earth Observing Satellite based analysis of trends and drivers. Remote Sens. Environ. 2012, 121, 144–158. [Google Scholar] [CrossRef]
  40. Chen, X.W. Analysis of future trend characteristics of hydrological time series based on R/S and Mann-Kendall methods. J. Water Resour. Water Eng. 2008, 19, 41–44. [Google Scholar]
  41. Gao, Y.; Yu, G.; Zhang, L.; Liu, M.; Huang, M.; Wang, Q. The changes of net primary productivity in Chinese terrestrial ecosystem: Based on process and parameter models. Prog. Geogr. 2012, 31, 109–117. [Google Scholar]
  42. Li, D.; Wang, Z. The characteristics of NPP of terrestrial vegetation in China based on MOD17A3 data. Ecol. Environ. Sci. 2018, 27, 397–405. [Google Scholar]
  43. Wang, Y.H.; Wang, M.Y.; Shi, X.Z.; Chen, L.; Zhao, Y.C.; Yu, D.S. Crop net primary productivity and its spatial distribution pattern in China, 2010. Acta Ecol. Sin. 2016, 36, 6318–6327. [Google Scholar]
  44. Running, S.; Mu, Q.; Zhao, M. MOD17A3H MODIS/terra Net Primary Production Yearly L4 Global 500m SIN Grid V006. NASA EOSDIS Land Processes DAAC. Available online: https://ladsweb.modaps.eosdis.nasa.gov/missions-and-measurements/products/MOD17A3HGF (accessed on 11 January 2023).
  45. Wang, Y.; Huang, Y.; Zhang, W.; Yu, Y.Q.; Wang, P. Simulating net primary production of agricultural vegetation in China(II): Model validation and estimation of net primary production. J. Nat. Resour. Sci. 2006, 21, 916–925. [Google Scholar]
  46. Wang, Y.H.; Shi, X.Z.; Wang, M.Y.; Zhao, Y.C. Characteristics of spatial and temporal evolution of NPP in farmland ecosystems in China, 2001–2010. Acta Pedol. Sin. 2017, 54, 319–330. [Google Scholar]
  47. Yan, H.M.; Liu, J.Y.; Cao, M.K. Spatial pattern and topographic control of China’s agricultural productivity variability. Acta Geogr. Sin. 2007, 62, 171–180. [Google Scholar]
  48. Tang, T.T.; Gao, P.; Ju, W.M.; Huang, J.L. Spatial and temporal characteristics of maximum light energy utilisation of crops in Jiangsu Province and its influencing factors. Acta Ecol. Sin. 2014, 34, 410–420. [Google Scholar]
  49. Quan, S.M. Characteristics of Spatial and Temporal Variability of Organic Matter and Major Nutrient Contents in Agricultural Soils in Jiangsu Province and Their Potential for Enhancement. Ph.D. Thesis, Nanjing Agricultural University, Nanjing, China, 2020. [Google Scholar]
  50. Chen, L.; Ma, X.C.; Tian, B.G.; Liu, S.P. Effects of tillage practices and straw return on soil fertility. J. Anhui Agric. Sci. 2019, 47, 64–66+69. [Google Scholar]
  51. Ma, Z.L.; Dai, Y.X.; Cai, H.H.; Qian, H.Y. Status of saline and alkaline land in Jiangsu coastal area and improvement measures. Xiandai Hortic. 2015, 189–190. [Google Scholar] [CrossRef]
  52. People’s Government of Jiangsu Province. Circular on the Implementation Programme for Promoting Agricultural Farming Rotation and Fallowing for Green Agricultural Development in Southern Jiangsu Province as a Whole. 2018. Available online: https://www.jiangsu.gov.cn/art/2018/11/19/art_64351_7887140.html (accessed on 15 April 2023).
  53. Jiang, D.M.; Xu, G.; Wang, H.Q.; Chen, H.Z. Study on the Dynamic Adjustment Mechanism of Permanent Basic Farmland Protection—Taking Zhonglou District, Changzhou City, Jiangsu Province as an Example. China Land 2023, 58–60. [Google Scholar]
  54. Yin, C.J.; LI, G.C.; Gao, X. Impacts of climate change on China’s grain production-Empirical analysis based on provincial panel data. J. Arid. Land Resour. Environ. 2016, 30, 89–94. [Google Scholar]
  55. Piao, S.; Ciais, P.; Huang, Y.; Shen, Z.; Peng, S.; Li, J.; Zhou, L.; Liu, H.; Ma, Y.; Ding, Y.; et al. The impacts of climate change on water resources and agriculture in China. Nature 2010, 467, 43–51. [Google Scholar] [CrossRef] [PubMed]
  56. Hou, M.Y.; Deng, Y.J.; Yao, S.B. Urbanization, intensive cropland use, and grain production China Popul. Resour. Environ. 2022, 32, 160–171. [Google Scholar]
  57. Ray, D.K.; West, P.C.; Clark, M.A.; Gerber, J.S.; Prishchepov, A.V.; Chatterjee, S. Climate change has likely already affected global food production. PLoS ONE 2019, 14, e0217148. [Google Scholar] [CrossRef]
  58. Ahmed, K.; Shahid, S.; Chung, E.S.; Ismail, T.b.; Wang, X. Spatial distribution of secular trends in annual and seasonal precipitation over Pakistan. Clim. Res. 2017, 74, 95–107. [Google Scholar] [CrossRef]
  59. Su, H.B.; Zhou, Y.; Xiao, M.G.; Chen, K.; Wang, X.M.; Tao, Y. Effects of climate warming on dry matter accumulation and functioning in rice. Jiangsu Agric. Sci. 2020, 48, 81–85. [Google Scholar] [CrossRef]
  60. Zeng, Z.Y. A Review of Studies on the Impact of Climate Change on Rice Production. J. Northeast. Agric. Sci. 2021, 46, 89–93. [Google Scholar]
  61. Ambardekar, A.A.; Siebenmorgen, T.J.; Counce, P.A.; Lanning, S.B.; Mauromoustakos, A. Impact of field-scale nighttime air temperatures during kernel development on rice milling quality. Field Crops Res. 2011, 122, 179–185. [Google Scholar] [CrossRef]
  62. Stern, N. What is the Economics of Climate Change? World Econ. 2006, 7, 1–10. [Google Scholar]
  63. Hong, C.Q.; Jin, X.B.; Chen, C.C.; Wang, S.M.; Yang, Y.H.; Xiang, X.M. A review of modelling studies on the estimation of terrestrial net primary productivity integrating remote sensing data. Prog. Geogr. 2017, 8, 924–939. [Google Scholar]
Figure 1. Geographic information about Jiangsu Province (DEM data from SRTMDEMUTM 90 M resolution digital elevation data product).
Land 13 00155 g001
Figure 2. Spatial distribution data of arable land and three major crops in Jiangsu Province (Cropland distribution data were derived from CLCD 30 m land cover data).
Land 13 00155 g002
Figure 3. Validation statistical indices (r: correlation coefficient, MAE: mean absolute error and RMSE: root mean square error) between the estimated NPP and MOD17A3H in 2005, 2010, 2015 and 2020.
Land 13 00155 g003
Figure 4. Comparison of annual NPP results for MOD17A3H and improved CASA models.
Land 13 00155 g004
Figure 5. Spatial distribution of annual mean values of crop NEP in Jiangsu Province during 22 years.
Land 13 00155 g005
Figure 6. (a) Change in annual mean NEP of crops in Jiangsu Province over 22 years, (b) change in monthly mean NEP of crops in Jiangsu Province over 22 years.
Land 13 00155 g006
Figure 7. Month-by-month results of NEP 2018 in the North Jiangsu region.
Land 13 00155 g007
Figure 8. Trends in the NEP of crops in Jiangsu Province, 2001–2022.
Land 13 00155 g008
Figure 9. Spatial distribution of mean annual precipitation and mean annual temperature in Jiangsu Province, 2001–2022.
Land 13 00155 g009
Figure 10. Temporal changes of annual precipitation and annual mean temperature in Jiangsu Province, 2001–2022.
Land 13 00155 g010
Figure 11. Partial correlation analysis between crop NEP and mean annual air temperature and annual precipitation in Jiangsu Province, 2001–2022.
Land 13 00155 g011
Table 1. Phenological information of major crops in Jiangsu Province.
Phenological PeriodWheatRiceMaizeSoybeansRape
Spring MaizeSummer MaizeSpring SoybeansSummer Soybeans
Seeding stageMid–late October to early NovemberEarly–mid MayLate March to late AprilLate May to early JulyLate April to early MayMid–late JuneLate September to early October
Harvesting stageLate May to mid–late JuneOctober–early NovemberLate July to mid-AugustEarly September to late OctoberLate August to early SeptemberOctoberMay
Table 2. ESRI land cover data classification types.
NameCode
Cropland1
Forest2
Shurb3
Grassland4
Water5
Snow/Ice6
Barren7
Impervious8
Wetland9
Table 3. Mann–Kendall test trend categories.
βZTrend TypeTrend Features
β > 02.58 < Z4Extremely significant increase
1.96 < Z ≤ 2.583Significantly increased
1.65 < Z ≤ 1.962Micro-significantly increased
Z ≤ 1.651Not significantly increased
β = 0Z0No change
β < 0Z ≤ 1.65−1Not significantly reduced
1.65 < Z ≤ 1.96−2Micro-significantly reduced
1.96 < Z ≤ 2.58−3Significantly reduced
2.58 < Z−4Extremely significant reduced
Disclaimer/Publisher’s Note: The statements, opinions and data contained in all publications are solely those of the individual author(s) and contributor(s) and not of MDPI and/or the editor(s). MDPI and/or the editor(s) disclaim responsibility for any injury to people or property resulting from any ideas, methods, instructions or products referred to in the content.

