Article

How Has Land Restriction Policy Influenced Green Total Factor Productivity? Evidence from Chinese Cities

1
School of Economics and Finance, Hohai University, Changzhou 213200, China
2
CNRS, EconomiX, Université Paris Nanterre, 92001 Nanterre, France
*
Authors to whom correspondence should be addressed.
Land 2024, 13(12), 2249; https://doi.org/10.3390/land13122249
Submission received: 8 October 2024 / Revised: 17 December 2024 / Accepted: 19 December 2024 / Published: 22 December 2024
(This article belongs to the Section Land Use, Impact Assessment and Sustainability)

Abstract

:
In 2014, China implemented a policy to limit land supply for new industrial construction in city centers with more than 5 million people to decrease the pollution of urban areas caused by industrialization. We aimed to study whether this land restriction policy (LRP) has been conducive to enhancing urban green total factor productivity (GTFP) with the goal of achieving long-term sustainable urban development. We formulated our hypotheses based on theoretical analysis. We used the difference-in-differences method and the data from prefecture-level cities from 1999 to 2017 for verification. The findings indicate that the LRP has improved the urban GTFP via (1) increasing the allocation efficiency of land transfer; (2) increasing land prices and transforming the industrial structure to tertiary industry; and (3) decreasing newly built firms, investments, patents for inventions, and technological innovation. Consequently, a selected land policy favoring green industry is required to prevent urban deindustrialization and to support the sustainable industrial development of the urban economy throughout the low-carbon transition.

1. Introduction

1.1. Research Background

The rapid industrialization of China has benefited from distinctive land system arrangements and reforms [1]. China operates under a dual land system, where urban land is owned by the state and rural land is held by collective entities. To convert agricultural land into urban construction land, the land must first be nationalized and then publicly auctioned. Local governments are monopolists in the first-tier urban land market under the dual-tiered land system of urban and rural areas. Local governments obtained substantial land transaction revenue from high-priced residential land auctions [2] and attracted investment by offering low-priced industrial land after the legalization of land remuneration through an auction in the Land Management Law of 1986. However, this seeking of development through land in China has resulted in an overexpansion of the construction of industries that pollute urban areas [3], which has caused serious environmental problems [4]. The supply of cheap land in China’s cities has provided space for a substantial number of highly polluting industries, which have been the main causes of China’s environmental pollution [5]. The overexpansion of urban construction has led to increased carbon emissions [6], and inefficient land use has undermined economic development [7]. In 2007, China overtook the United States to become the world’s largest emitter of CO2. The overexpansion and inefficient use of land for urban construction have negatively impacted China’s sustainable economic development.
Therefore, reforming the land use system and optimizing land resource allocation in favor of the environment are top priorities [8]. On 13 February 2014, the Ministry of Land and Resources issued the Notice on Strengthening Controls and Implementing the Strictest Arable Land Protection System (hereinafter referred to as the land restriction policy (LRP)) to restrict new industrial construction land supply in megacities, which emphasized that “in principle, no more new construction land will be arranged for the central urban area of megacities with more than 5 million population, except residential land and public infrastructure land”.
Has this LRP played a role in environmental regulation policies to reorient polluting industrialization to green enterprises in favor of long-term sustainable development? Sustainable development was measured in this study using the GTFP, which incorporates energy and environmental factors [9,10]. This is the main driver of China’s economic transition to sustainable economic development under the constraints of energy efficiency and CO2 reduction requirements [11]. Therefore, the effects of the LRP on the GTFP must be theoretically studied.
Many factors can affect the GTFP in an economy transitioning toward sustainable development such as China [12,13,14], where economic policies and production structures have substantially changed [15]. All of these factors are potentially affected by the LRP. The LRP may increase land prices and production costs and obligate industrial firms, in particular the polluting ones, to move outside cities; the LRP may decrease opportunities for new industrial firms to invest in technological innovation and green industry [16,17]. Thus, land price, industrial structural transformation and upgrading, newly built firms, external investment, patents of inventions, and technological innovation are potential channels through which the LRP exerts its impacts on the GTFP, which we term indirect effects. Moreover, the LRP is created by the central government to modify the behavior of local governments under increasing pressure due to environmental constraints in their management and allocation of land transfer [18]. This impact on the management and land reallocation efficiency is a “direct effect”. Consequently, in this study, we hypothesized that the LPR affects GTFP either through direct effects on the allocation efficiency of land transfer or through indirect effects on intermediary variables that in turn affect GTFP. We then developed a theoretical model of urban GTFP to identify the potential multiple impacts of the LPR.
Empirically, we first measured the urban GTFP based on the Cobb–Douglas production function under environmental constraints using panel data from 1999 to 2017 for 14 megacities and other prefecture-level cities. We then used the difference-in-differences (DID) approach for estimating the theoretical model. The results showed that the LRP has increased urban GTFP by ① increasing the allocation efficiency of land transfer; ② increasing land prices and promoting industrial structural transformation in favor of less-polluting tertiary industry, which has positively influenced GTFP; and ③ reducing newly built firms, investment, patents for inventions, or technological innovation, and such reduction inhibited GTFP. The LRP did not support industrial firms, leading to a risk of urban deindustrialization. Moreover, environmental regulations have a negative impact on newly built firms, investments, patents for inventions, or technological innovations. Consequently, a selective land policy that encourages the setting up of green industries, green investments, green patents, and green technological innovation in cities is necessary to reorient polluting industries towards green urban industries and to create cities with economically sustainable industrial development.

1.2. Literature Review

This section provides a brief review of the literature on GTFP measurement and the impact of environmental regulation and land resource allocation on GTFP.
(1) Study on the GTFP measurement. Total factor productivity (TFP) is an indicator of the quality of economic development and is the driving force for sustained economic growth [19]. TFP is measured using capital, labor inputs, and total output [20,21]. However, sustainability and green development involve different aspects, particularly conserving resources and reducing emissions. The models of economic development quality are inappropriate in these situations [22] as they ignore environmental costs and energy inputs [23,24], which biases the resulting analyses [25]. Many scholars have incorporated energy and environmental costs to calculate GTFP to compensate for the shortcomings of the traditional TFP [9,10]. Environmental cost is a pertinent indicator in analyzing green development and sustainable economic growth [23,26,27]. Environmental costs have been measured for the domestic industrial sector as well as for various nations [28,29]. The determinants of changes in GTFP in individual countries were explored [30]. GTFP has also been studied by many Chinese scholars. The main focus has been on measuring GTFP at the sectoral [31,32,33], regional [34,35,36], and national [37] levels, as well as on exploring the factors influencing GTFP [38]. Furthermore, Xia and Xu [39] used GTFP as an indicator of the quality of China’s economic development. Their findings revealed a notable disparity between TFP and GTFP, which was mainly due to TFP not accounting for environmental costs. In contrast to TFP, GTFP indicates the level of productivity in consideration of environmental standards [40]. The main factors influencing GTFP are green innovation [12,41,42], economic structure [13,43], and economic size [14].
GTFP has mainly been measured using DEA or extended DEA models, which produce unexpected outputs. The results obtained with these methods are strictly affected by the setting of the correlation function, which may bias the results. The OECD recommends the use of the Solow residual method to account for TFP, which is based on the production function. Therefore, we incorporated environmental factors such as land and energy factors into the traditional production function to measure the GTFP of China’s cities.
(2) Study on the impact of environmental regulation on GTFP. The effects of environmental regulation on TFP (GTFP) are not fully understood. First, well-designed environmental regimes may encourage enterprises to innovate and produce strong “innovation compensation” effects, increasing TFP, which is called the “Porter hypothesis” [37,44]. Second, some scholars support the “compliance cost hypothesis”, which states that environmental regulation imposes additional environmental governance costs on firms. The negative effects of compliance costs on environmental regulation outweigh the positive effects of incentivizing innovation. This can hinder investment in production, which has negative effects overall [45]. A third group of views suggests that environmental regulation has an uncertain role in influencing GTFP. Temporal and spatial variations have been found in the impact of different green regulatory policies on GTFP. The costs and effects of environmental regulation vary with the regulation, except for temporal and spatial uncertainty [46].
(3) Study on the impact of land resource allocation on GTFP. Land resources are essential for economic activity and provide the foundation for human sustenance and progress [47]. However, in the 20th century, the population and industrialization rapidly expanded, which led to increased land exploitation and reduced land availability [48]. Sustainable land resource management has been challenged owing to rising human demands coupled with climate uncertainty [49]. Land resource allocation affects GTFP. The misallocation of land resources directly reduces the urban GTFP [50,51], and increases in the intensity and efficiency of land resources increase the urban GTFP [52]. Therefore, scholars are increasingly studying how to increase the efficiency of land resource allocation to achieve sustainable development [53,54].
To summarize, the effects of environmental regulation on TFP (GTFP) are theoretically uncertain, being dependent on which hypothesis (“Porter hypothesis” or “compliance cost hypothesis”) has a stronger impact. How does the LRP influence GTFP? An empirical investigation is thus necessary. Therefore, we analyzed the effects of the LRP on the GTFP of Chinese cities, as well as the mechanisms of this impact. The results provide some insights for the development of policies that promote sustainable urban economic growth throughout the low-carbon transition.
Even though many researchers have measured GTFP measurement and the effects of land resource use and environmental regulation on green development, no studies, to the best of our knowledge, have analyzed the effects of the LRP on GTFP. This study contributes to the literature by filling this gap.
The rest of this article is organized as follows: Section 2 presents the methodology. Section 3 provides the results. Section 4 outlines our discussion. Finally, the conclusions are provided in Section 5.

2. Methodology

2.1. Theoretical Frameworks

Economic principles tell us that people experience trade-offs. Under the premise of “scarcity of resources”, people make decisions regarding resource allocation to maximize their interests [55]. The LRP is an environmental regulation policy that restricts land supply, making land resources “scarce”. Governments and enterprises make decisions to maximize their interests and continuously increase the efficiency of resource allocation to optimize allocation.
Specifically, the LRP restricts the land used for urban construction in cities with a population of more than 5 million, which has a screening effect on green and efficient firms and a positive impact on GTFP. First, the price of land has risen according to the supply and demand theorem as the supply of land is limited and the demand for land for enterprises has not reduced. Local governments, in supplying land, can screen out inefficient enterprises through the price mechanism [56]. These enterprises are often not environmentally friendly enterprises that are polluting and use outdated technology. Second, the government is forced to increase the efficiency of land use and grant land to enterprises with high production efficiency due to the constraints imposed by the land quota. In addition, the tertiary industry has a higher per capita output, and the shortage of land available for construction may force the city to transform its industry from secondary to tertiary.
The LRP can also hurt urban GTFP through the crowding-out effect. According to the compliance cost theory, the LRP has led to higher land costs in land-restricted cities, making them less attractive to new enterprises [57]. Some firms may look for cheaper land and move out of large cities as a result of these higher costs. Firms may reduce their external investments and lower their long-term investments in technology research and development to fill this profit gap due to higher land costs.
In this section, we present our hypotheses, from which we drew models. Guillaumont Jeanneney and Hua [15] analyzed how the real exchange rate directly and indirectly affects labor productivity in Chinese provinces. We followed their analysis method and first checked the effectiveness of the effects of the LRP on land transfers. Second, we examined the impacts of the LRP on GTFP, identified intermediary variables that were influenced by the LRP, and finally determined how to estimate the direct, indirect, and total effects of the LRP on GTFP.

2.1.1. Impact of the LRP on Land Transfer

A DID model was developed to explore whether the LRP has effectively reduced the land supply:
L a n d i , t = α 1 + β 1 L R P i , t + λ 1 X i , t + η i + μ t + ε i , t
where L a n d i , t represents the land transfer of city i in year t , including the total land transfer area and the total added land transfer area. The key explanatory variable is L R P i , t , a dummy variable reflecting the LRP, taking a value of 1 if city i is subjected to the policy in year t and 0 otherwise. The coefficient β 1 captures the impact of the LRP on urban land transfer. X i , t is a set of control variables affecting land transfer in city i in year t . η i are the city’s fixed effects, μ t are the year’s fixed effects, and ε i , t is a random perturbation term.

2.1.2. Impacts of the LRP on GTFP

The LRP, as an environmental regulation measure implemented by the government, aims to reduce the overexploitation of land, optimize the urban land use structure, and promote the sustainable growth of China’s economy. This policy could impact the GTFP by reducing land supply as well as increasing the allocation efficiency of land resources. The LRP could prioritize the assignment of the limited land to emerging high-productivity or technologically advanced enterprises, thus gradually phasing out some highly polluting and energy-consuming firms through increases in land price. We proposed the following hypothesis building upon this premise:
H1: 
The LRP influences urban GTFP.
The following equation was used to test this hypothesis:
G T F P i , t = a 0 + a 1 L R P i , t + η i + μ t + ε i , t
where G T F P i , t represents the GTFP of city i in year t . The coefficient a 1 captures the impact of the LRP on the urban GTFP, which we added to Equation (2) to avoid possible bias due to the lack of control variables:
G T F P i , t = b 0 + b 1 L R P i , t + b 2 X i , t + η i + μ t + ε i , t
where X i , t is a set of control variables affecting the GTFP of city i in year t , including the real GDP per capita, road area per capita, population, capital stock, number of laborers, land area, energy consumption, human capital, fiscal deficit, and FDI. Thus, coefficient b 1 captures the effects of the LRP that are not captured by the control variables.

2.1.3. The LRP, Intermediary Variables, and GTFP

Three potential intermediary variables were identified that were probably influenced by the LRP and exerted an impact on GTFP.
(1) The LRP, land prices, and GTFP.
The flow of resources under the guidance of the price mechanism is regarded as the most reasonable resource allocation mechanism, which was called the “invisible hand” by Adam Smith. Transaction cost theory posits markets and firms as two alternative avenues for resource allocation. The former is a driving factor that flows through the price mechanism, and the latter allocates resources through internal authority relationships [55]. The implementation of the LRP decreases the total land supply; according to the theorem of supply and demand, the price of land rises. Environmental regulations can internalize the external costs of pollution. This has prompted firms to redesign their production methods to reduce pollution emissions, change their production growth rates, and increase their new investments [56]. High-efficiency firms can be screened out through the resource allocation effect of “the highest bidder wins” in the market. The firms that are willing and able to buy land at a higher price tend to be high quality. These high-quality enterprises expand their production after acquiring land, having higher production efficiency and stronger technological research and development capabilities than other firms. Therefore, the LRP is expected to elevate land prices, subsequently enhancing the GTFP via optimizing resource allocation. We developed the following hypothesis by building upon this rationale:
H2: 
The LRP increases the urban GTFP through the price mechanism.
G T F P i , t = c 0 + c 1 L R P i , t + c 2 X i , t + c 3 P r i c e i , t + η i + μ t + ε i , t
The coefficient c 3 is expected to be positive.
(2) The LRP, change in industrial structure, and GTFP.
The LRP could modify industrial structure in favor of less-polluting industry and thus promote GTFP growth. At the micro level, the LRP could reduce the supply of land for polluting enterprises, forcing them to actively change their production methods, adjust their production structure, and increase green production. At the macro level, the LRP could eliminate polluting enterprises in favor of green enterprises. Industrial structure change plays a pivotal role as a “resource converter” and a “pollutant control body” [58], strongly influencing the trajectory of economic development and the efficacy of environmental preservation, thereby emerging as a critical avenue for enhancing GTFP [59]. The upgrading of the industrial structure typically entails the gradual substitution of traditional industries with emerging industries characterized by lower pollution, reduced energy consumption, and higher value-added outputs. This not only enhances production factor efficiency but also mitigates the intensity of energy consumption, thereby positively affecting GTFP [60]. The empirical evidence from major economies worldwide demonstrates a consistent pattern wherein industrial structural upgrades are coupled with the continual release of industrial structural dividends. The gradual phasing-out of obsolete industries in favor of green and high-efficiency industries facilitates the ongoing improvement in resource allocation and production efficiency, consequently increasing the GTFP [4]. Using this rationale, we devised the following hypothesis:
H3: 
The LRP enhances the urban GTFP by promoting industrial structure change in favor of tertiary industry.
This hypothesis was tested by adding the variable Industry into Equation (3) as follows:
G T F P i , t = d 0 + d 1 L R P i , t + d 2 X i , t + d 3 I n d u s t r y i , t + η i + μ t + ε i , t
where I n d u s t r y i , t represents the industrial structure in favor of the tertiary industry. Coefficient d 3 is expected to be positive.
(3) The LRP, technological upgrading and innovation, and GTFP.
The influence of technological innovations on GTFP is uncertain. The environmental paradox posits that technological upgrading and innovation solely geared toward economic expansion might overlook the detrimental impact of technological innovation on natural resources and the environment, thus hindering increases in GTFP [57]. Chinese enterprises have benefited from the weak environmental constraints after the reform and opening up in 1979 via the long-term ignoring of environmental factors during their production. This has led to technological innovation and ecological degradation simultaneously occurring. Moreover, appropriateness theory states that inadequately tailored technological innovations, which fail to correspond to the developmental stage and resource endowment structure of a society, undermine the inherent drive for technological innovation. Consequently, such mismatches are deemed detrimental to the increase in GTFP [61,62]. However, environmentally friendly technological innovations could enhance resource allocation efficiency and decrease energy consumption per unit of output, consequently fostering long-term improvements in GTFP [63,64].
Enterprise technological innovation requires considerable financial support to meet the strict environmental protection regulations and emission reduction constraints on enterprises. However, the implementation of the LRP would result in an increase in urban land prices, reducing the number of new enterprises and weakening external investment. This would inhibit enterprise technological innovation and hinder an increase in GTFP. We developed the following hypothesis by building upon this rationale:
H4: 
The LRP influences urban GTFP via effects on newly built firms, investment, and patents for inventions, which in turn impact firms’ technological innovation.
This hypothesis was tested as follows:
G T F P i , t = e 0 + e 1 L R P i , t + e 2 X i , t + e 3 F i r m s i , t + η i + μ t + ε i , t
G T F P i , t = f 0 + f 1 L R P i , t + f 2 X i , t + f 3 I n v e s t m e n t i , t + η i + μ t + ε i , t
G T F P i , t = g 0 + g 1 L R P i , t + g 2 X i , t + g 3 I n v e n t i o n i , t + η i + μ t + ε i , t
G T F P i , t = h 0 + h 1 L R P i , t + h 2 X i , t + h 3 I R I E C i , t + η i + μ t + ε i , t
where I R I E C i , t is a composite index of F i r m s i , t , I n v e s t m e n t i , t , and I n v e n t i o n i , t . The coefficients e 3 , f 3 , g 3 , and h 3 are expected to be positive if newly built firms, investments, patents for inventions, and technological innovation take environmental constraints into account and negative if otherwise.

2.1.4. Direct, Indirect, and Total Impacts of the LRP on Urban GTFP

We followed the calculation method reported by Guillaumont Jeanneney and Hua [15] to calculate the direct, indirect, and total impacts of the LRP on urban GTFP.
(1) Estimating the direct impacts of the LRP on urban GTFP.
We estimated a GTFP function including LRP, control variables, and intermediary variables to estimate the direct impacts of the LRP. The coefficient of the LRP only measured the effects not captured by the control and intermediary variables because all control and intermediary variables were included in the equation, in particular, its direct effects on land transfer management and reallocation efficiency. Technological innovation is represented by firms, investments, patents for inventions, or by their composite index, called IRIEC. The calculations were performed using the following equations:
G T F P i , t = j 0 + j 1 L R P i , t + j 2 X i , t + j 3 P r i c e i , t + j 4 I n d u s t r y i , t + j 5 F i r m i , t + j 6 I n v e s t m e n t i , t + j 7 I n v e n t i o n i , t + η i + μ t + ε i , t
G T F P i , t = k 0 + k 1 L R P i , t + k 2 X i , t + k 3 P r i c e i , t + k 4 I n d u s t r y i , t + k 5 I R I E C i , t + η i + μ t + ε i , t
where j 1 and k 1 capture the direct impacts of the LRP and are expected to be positive.
(2) Estimating the indirect impacts of the LRP on GTFP.
We aimed to determine the impacts of the LRP on productivity that were indirectly exerted through intermediary variables that we assumed explained GTFP: land price, industry, newly built firms, external investment, and patents for inventions or technological innovation (Table 1). For this reason, we estimated the effects of the LRP on each of these variables using the following equations:
P r i c e i , t = l 0 + l 1 L R P i , t + l 2 X i , t + η i + μ t + ε i , t
I n d u s t r y i , t = m 0 + m 1 L R P i , t + m 2 X i , t + η i + μ t + ε i , t
F i r m i , t = n 0 + n 1 L R P i , t + n 2 X i , t + η i + μ t + ε i , t
I n v e s t m e n t i , t = o 0 + o 1 L R P i , t + o 2 X i , t + η i + μ t + ε i , t
I n v e n t i o n i , t = p 0 + p 1 L R P i , t + p 2 X i , t + η i + μ t + ε i , t
I R I E C i , t = q 0 + q 1 L R P i , t + q 2 X i , t + η i + μ t + ε i , t
Coefficients l 1 and m 1 were expected to be positive and the others negative. Thus, we computed the indirect effects of the LRP on GTFP by multiplying the coefficients of the LRP relative to each intermediary variable in Equations (10) and (11) by their corresponding coefficient relative to the LRP in Equations (12)–(17). We then summed j 3 l 1 + j 4 m 1 + j 5 n 1 + j 6 o 1 + j 7 p 1 or k 3 l 1 + k 4 m 1 + k 5 q 1 . This allowed us to accurately assess each intermediary variable’s contribution to the effects of the LRP on GTFP.
(3) Calculating the total impact of the LRP on GTFP.
Finally, the total effect of the LRP is thus the sum of the direct and indirect effects:
j 1 + j 3 l 1 + j 4 m 1 + j 5 n 1 + j 6 o 1 + j 7 p 1 ,         k 1 + k 3 l 1 + k 4 m 1 + k 5 q 1
Table 1 summarizes the potential multiple impacts of the LRP on GTFP in Chinese cities. In Table 1, the direct impacts of the LRP are separated from those through intermediary variables, which are influenced by the LRP. The effects of the LRP on GTFP are positive either directly via its positive effect on the allocation efficiency of land offer or indirectly via its positive effects on price and transforming the industrial structure in favor of tertiary industry, which in turn positively influence GTFP. Finally, the effects of the LRP on GTFP are varied because the activities of firms, investment, and invention and technological innovation were not consistently environmentally friendly.

2.2. Data Sources and Variable Definitions
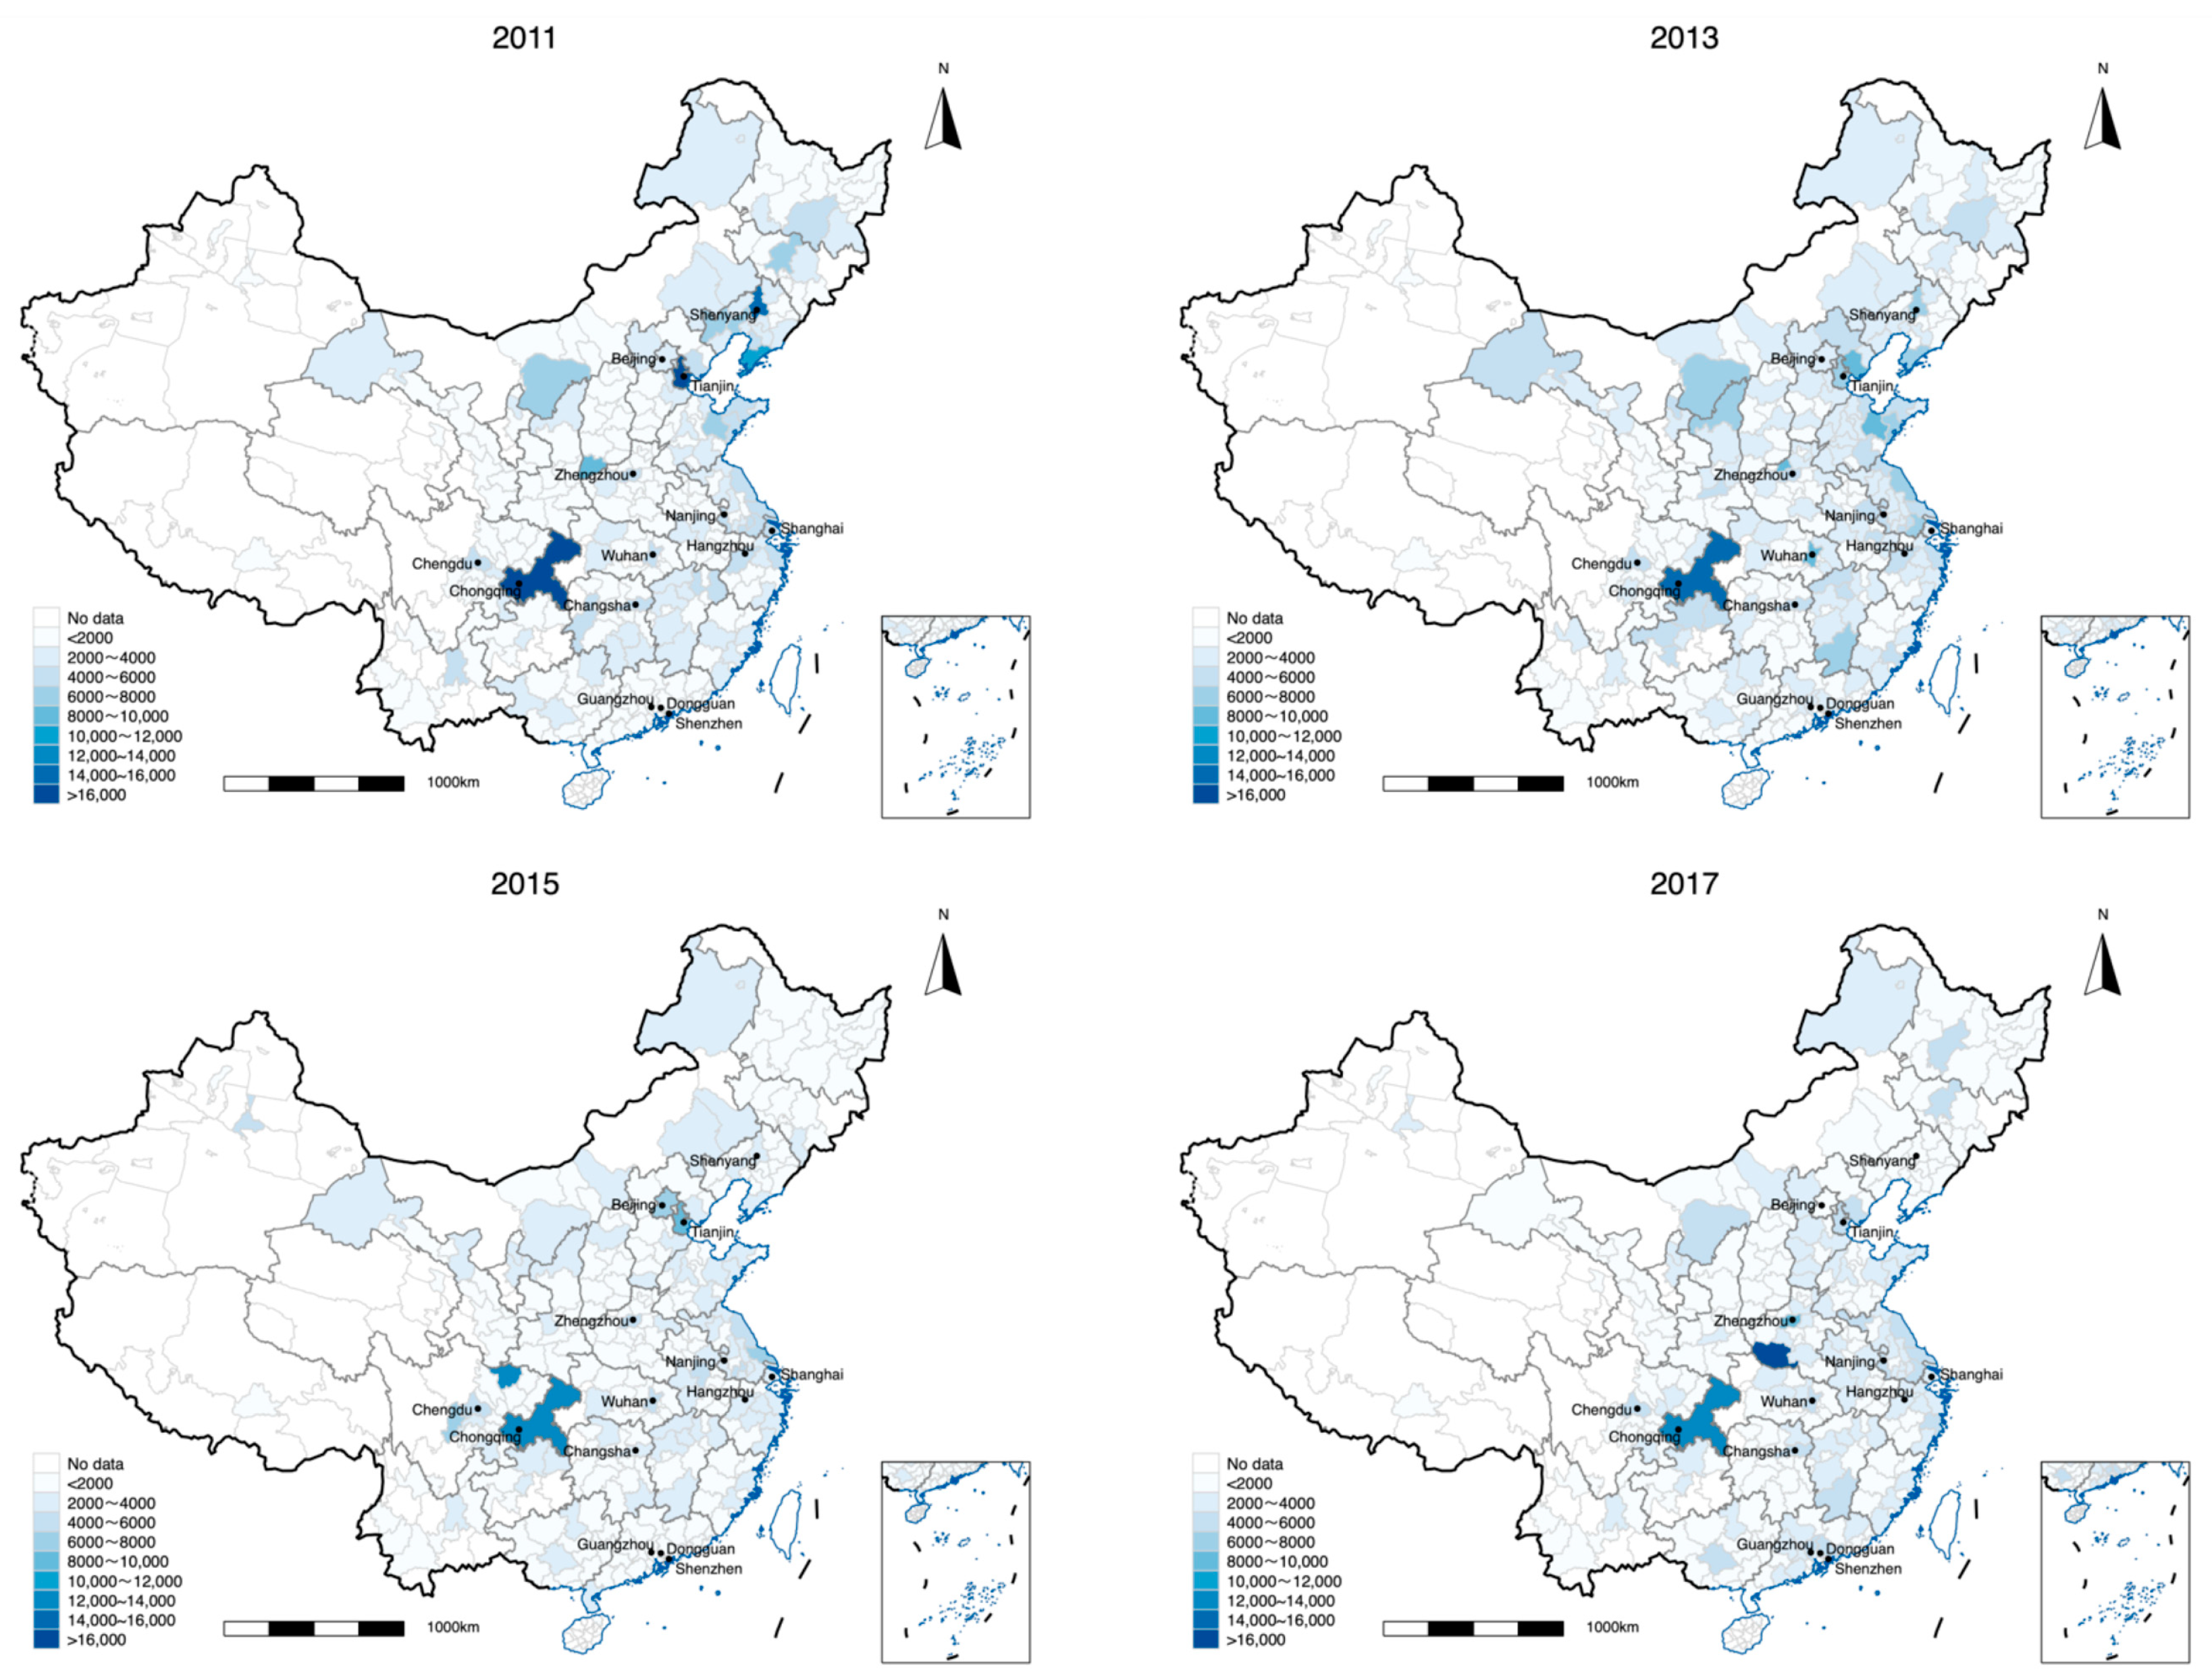
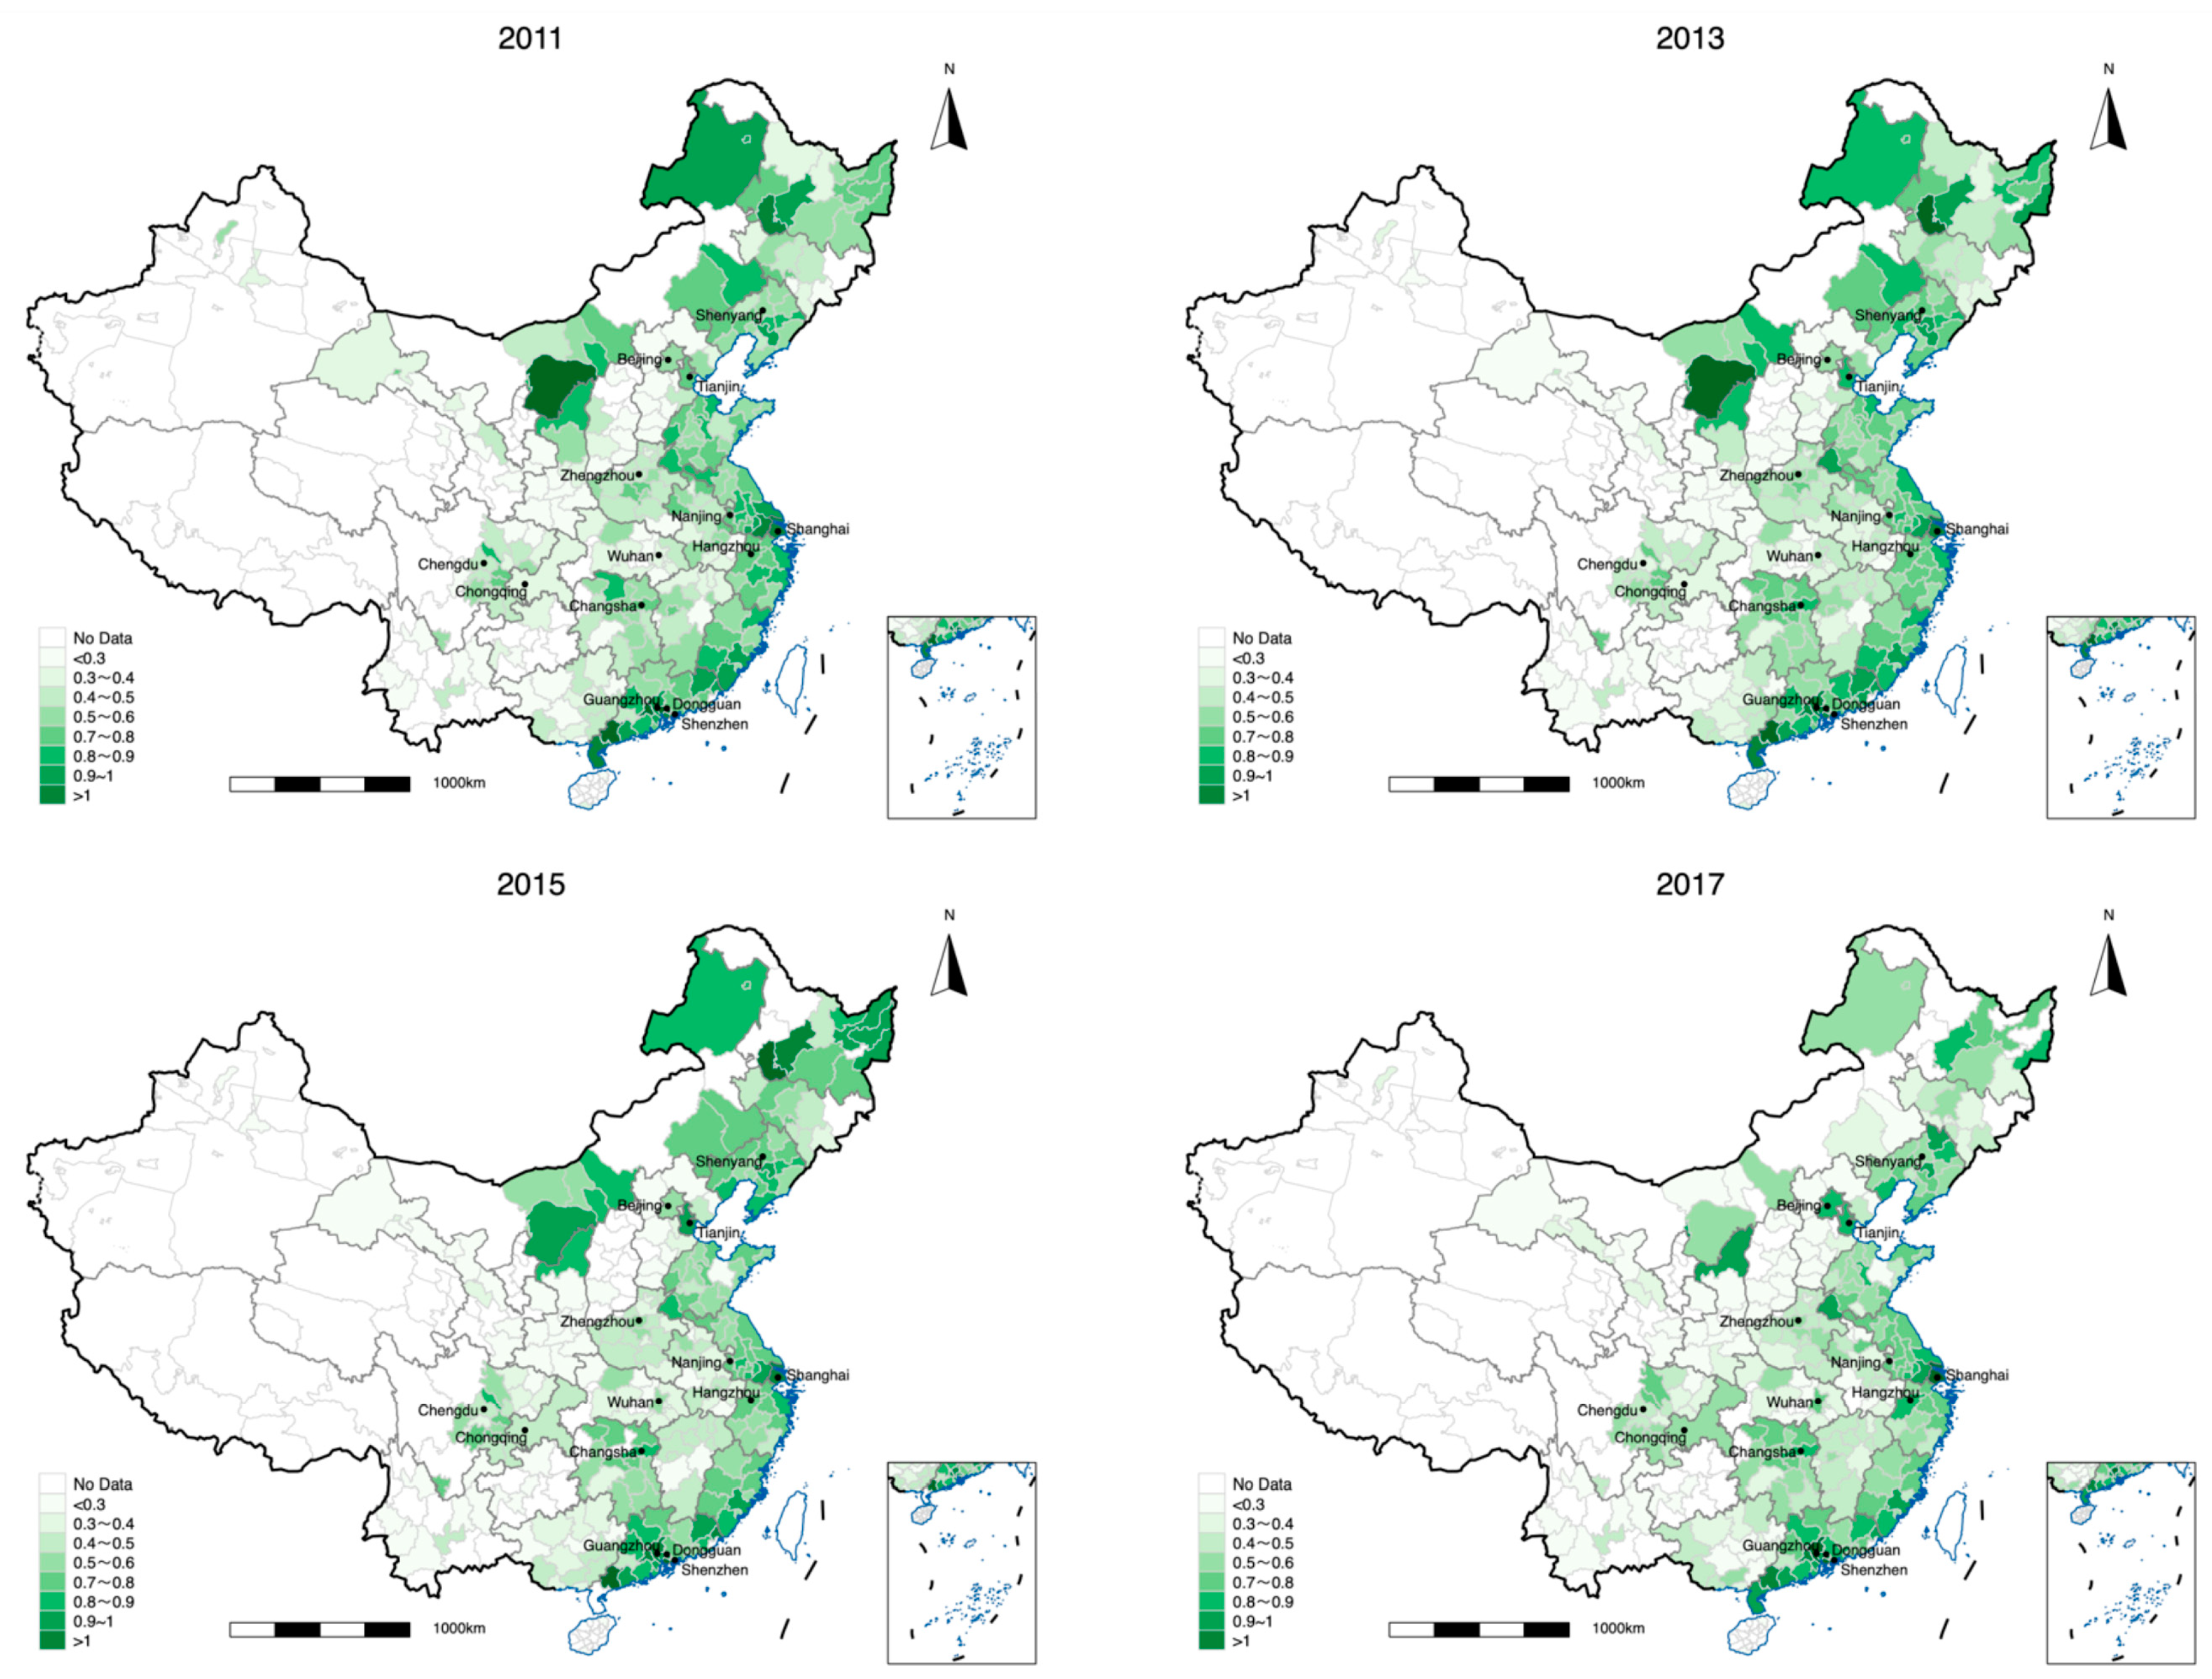
We used the Notice issued by the Ministry of Land and Resources in 2014 as a policy shock to estimate the different impacts of the LRP on GTFP; we considered the LRP as a quasi-natural experiment, based on which we constructed a DID model. The cities with more than 5 million residents after the implementation of the LRP in 2014 were considered as the treatment group, including Beijing, Tianjin, Shenyang, Shanghai, Nanjing, Hangzhou, Zhengzhou, Wuhan, Changsha, Guangzhou, Shenzhen, Dongguan, Chongqing, and Chengdu, for a total of 14 cities. Hangzhou and Changsha were added in 2015 and 2017, respectively, when their population exceeded 5 million. All prefecture-level cities were used as the control group. We defined LRP as a dummy variable, taking a value of 1 if city i was subjected to the policy in year t and 0 otherwise.

2.2.1. Data Sources

The data on land sales in the cities from 1999 to 2017 were compiled from the China Land and Resources Statistical Yearbook. The demographic data used to determine the population of cities with more than 5 million people were obtained from the China Urban Construction Statistical Yearbook as in Cheng, et al. [65]. The annual energy data at the provincial level were obtained from the China Energy Statistical Yearbook and were decomposed to the city level according to GDP share. The technological innovation data were obtained from the Index of Regional Innovation and Entrepreneurship in China (IRIEC), published by the Peking University Enterprise Big Data Research Center in 2021. Finally, the remaining variables were obtained from the China City Statistical Yearbook.

2.2.2. Description of Variables

(1) The dependent variable (GTFP) was measured using the Solow residual method. In addition to capital and labor, land and energy factors were added as inputs into the Cobb–Douglas production function to accurately measure the high-quality development of the urban economy as follows:
Y i ,   t = G F T P i , t × K i ,   t α K i , t × L i , t α L i , t × M i , t α M i , t × E i , t α E i , t
where Y i , t is the total economic output of city i . K i , t α K i , t , L i , t α L i , t , M i , t α M i , t , and E i , t α E i , t are the inputs of capital, labor, land, and energy for city i in year t , respectively. Parameters α K i , t , α L i , t , α M i , t , and α E i , t are, respectively, the proportions of the contribution of capital, labor, land, and energy to the total economic output of city i in year t .
Taking their logarithms, Equation (18) can be written as follows:
l n Y i , t = l n G T F P i , t + α K i , t l n K i , t + α L i , t l n L i , t + α M i , t l n M i , t + α E i , t l n E i , t
Thus, GTFP is the component of economic growth that is not attributable to capital, labor, land, or energy [66,67]. GTFP was used to estimate the influence of the LRP in this study.
The calculation of urban GTFP involved the following variables: ① output variable (Y), measured as the real GDP of a city; ② capital (K), calculated via the perpetual inventory approach using city capital investment data; ③ labor (L), expressed using year-end employment by city, calculated using unit plus private end-of-period labor numbers; ④ land (M), using the urban built-up area to express the number of land factor inputs, using the municipal district data as a proxy; and ⑤ energy (E), which refers to the total consumption of coal, coke, crude oil, gasoline, kerosene, diesel fuel, fuel, natural gas, electricity, etc. We disaggregated the total energy consumption data at the provincial level into cities using a city’s share of the GDP.
(2) The key explanatory variable (LRP) was a dummy variable. The year 2014 was taken as the policy shock year, cities with more than 5 million residents after the implementation of the LRP were selected as the treatment group, and the rest of the cities were used as the control group.
(3) The control variables were as follows: ① GDP per capita (lnPGDP) represents a city’s actual GDP per capita and measured urban economy growth; ② road area per capita (lnRoad) is the year-end actual road area and measured the urban infrastructure level; ③ human capital level (Edu) is calculated as the ratio between the number of general tertiary education students in the city and the urban population; ④ fiscal revenue (lnRr_GDP) is the share of real public revenues of the real GDP to measure urban local government revenue; ⑤ foreign investment (lnFDIK) is the share of the actual use of foreign capital in gross fixed capital formation in that year; and ⑥ capital intensity (lnKL) is the ratio of the real capital stock to the number of laborers.
(4) The other variables were ① land transfer area (lnLand) and area of new land transfers (lnAddland), measured as the total area of land transferred and the total area of added transferred land; ② land price (lnPrice), measured as the transacted price at which land is transferred; ③ upgrading of industrial structure (Industry), measured using the ratio of the tertiary sector’s share in the GRP to the secondary sector’s share in the GRP; ④ newly built firms (Firm), measured using the score for the number of newly built firms in IRIEC; ⑤ attracting external investment (Investment), measured using the score for attracting external investment in IRIEC; ⑥ patents for inventions (Invent), determined using the score for invention patents in IRIEC; and ⑦ technological innovation (IRIEC), measured using the aggregate index score in IRIEC.
All data involving price changes were price-deflated using 1999 as the base year. Descriptive statistics are reported in Table 2.

3. Results

3.1. Results of Benchmark Regressions

(1) Impacts of the LRP on land transfer.
Table 3 reports the estimated results obtained with Equation (1) in Section 3. Column (1) reports the effect of the LRP on the total land area of urban land transfer. The estimated coefficient of the LRP is significantly negative (−0.415) at the 1% level, suggesting that the LRP has significantly reduced the total area of land transfer in megacities by approximately 41.5% on average per year. Column (2) of Table 3 reports the effect of the LRP on the incremental total land area transferred in cities, which was obtained from the indicator of new construction land, which was determined to further test the effect of this policy. The estimated coefficient of the LRP is −0.477 and is statistically significant at the 1% level. This suggests that the LRP has significantly reduced the incremental total land transfer area in megacities by approximately 47.7% on average per year. Figure 1 shows the change in the land transfer area in Chinese cities. The area of land transferred in land-restricted cities decreased after the implementation of the land restriction policy. Thus, the LRP has significantly reduced the land supply in megacities mainly by reducing the land used for new construction.
(2) Impacts of the LRP on urban GTFP.
Table 4 provides the results of benchmark Equations (2) and (3); all regressions were estimated with year and city fixed effects. Column (1) in Table 4 presents the regression results without control variables. The LRP coefficient was estimated as 0.173 (statistically significant), indicating that the LRP has significantly increased the GTFP in the megacities. Column (2) presents the regression results with the control variables. The LRP coefficient is still significantly positive (0.168), indicating that the LRP has increased the GTFP of the megacities by approximately 0.168 units on average per year compared with other cities. Figure 2 shows the change in the GTFP in Chinese cities. The GTFP of land-restricted cities has increased after the implementation of the LRP. The results preliminarily confirm that the LRP has increased the allocation efficiency of urban land resources and has promoted the sustainable development of the urban economy and environment.

3.2. Impacts of the LRP and Intermediary Variables on Urban GTFP

Equations (4)–(9) were estimated to determine if intermediary variables were effective transmission channels through which the LRP influenced GTFP.

3.2.1. Price Mechanism

According to Hypothesis 2, the LRP increases the urban GTFP through the resource allocation effect of the price mechanism. To test this hypothesis, we added the land price (lnPrice) to the benchmark regression using Equation (4). Column (1) in Table 5 reports the effects of the LRP on the urban GTFP through the price mechanism. The estimated coefficient of lnPrice is significantly positive at the 10% level (0.005). Column (1) in Table 6 reports the impact of the LRP on urban land prices. The estimated coefficient of the LRP is 0.416 and significantly positive at the 1% level. This indicates that the LRP has significantly increased the land prices in megacities by approximately 41.6% on average. The results indicate that the LRP can boost the urban GTFP through increasing land prices. A possible explanation for this finding is that the LRP has increased the price of land, which has screened out efficient firms through the resource allocation effect of “the highest bidder wins” in the market. Firms that are willing and able to buy land at higher prices are often high-quality firms. As a result, these high-quality enterprises expand their production after acquiring land; these firms are characterized by higher production efficiency and stronger technological research and development capabilities. The LRP has raised land prices and, via optimizing the allocation of resources, has increased GTFP.

3.2.2. Industrial Structural Change

According to Hypothesis 3, the LRP increases the urban GTFP through industrial structural changes in favor of tertiary industry. To test this hypothesis, we first added industrial structure change (Industry) to the benchmark regression using Equation (5). Column (2) in Table 5 reports the effects of the LRP on the urban GTFP through industrial structure change. The estimated Industry coefficient is significantly positive (0.044). The estimated LRP coefficient on industrial structure change is 0.170, which is statistically significant (Column (2), Table 6). This indicates that the LRP has promoted industrial structure changes by facilitating a transition of the industrial structure from secondary to tertiary industries. This suggests that the LRP has significantly enhanced the cities’ GTFP by changing their industrial structure. A possible reason for this finding is that the LRP has reduced the total land supply so that industrial enterprises have moved to other cities and transitioned to tertiary industry. A reduction in the proportion of the secondary sector along with an increase in the proportion of the tertiary sector in cities could reduce energy consumption and environmental pollution, which could increase GTFP.

3.2.3. Technological Innovation

According to Hypothesis 4, the LRP reduces firms’ technological innovation by decreasing the number of new firms and external investment, which would dampen the GTFP of a city. To test this hypothesis, we separately added newly built firms (Firm), external investment (Investment), patents for inventions (Invention), and technological innovation (IRIEC) to the benchmark regression using Equations (6)–(9). Columns (3) to (6) in Table 5 verify that the LRP has influenced GTFP by affecting newly built firms, external investment, patents for inventions, and technological innovation. The results demonstrate that the coefficient of the urban GTFP is lower than that calculated with the benchmark regression. The coefficients of newly built firms, external investment, patents for inventions, and technological innovation are all significantly negative at the 1% level. Columns (3) to (4) in Table 6 report the results of the estimation of the effects of the LRP on newly built firms and attracting external investment. The LRP’s estimated coefficients are −0.257 and −0.243, respectively, and both pass the significance test at the 1% level. This suggests that the implementation of the LRP has reduced the number of newly built firms and external investment in land-restricted cities. What effect will this have on innovation? Column (5) in Table 6 provides the results on the effects of the LRP on patents for inventions in the cities. The LRP coefficient is −0.187, which passes the significance test at the 1% level, suggesting that the LRP has inhibited the number of patents in the cities. Column (6) of Table 6 verifies the effect of the LRP on urban technological innovation, where the estimated LRP coefficient is −0.245, which is significant at the 1% level. This indicates that the LRP has reduced the level of urban technological innovation.
The results indicate that the LRP has inhibited urban technological innovation, thus suppressing the increase in GTFP. The negative impact of the LRP on technological innovation is one of the mechanisms through which the LRP has affected GTFP. The two reasons for this finding are as follows: First, the reduction in the land supply owing to the LRP has led to reductions in new investments and enterprises. Second, the LRP has resulted in higher land prices, and this increase in cost has prompted the transfer of secondary industry to areas outside the cities. In this case, the implementation of the LRP has led to a decrease in urban innovation levels and has inhibited GTFP growth.

3.3. Direct Impacts of the LRP on the Urban GTFP

We validated the reliability of the intermediary variables in the baseline regression, with the results shown in Table 7. The coefficients of the intermediary variables are significant. The coefficient of the key explanatory variable LRP decreased as we added mechanism variables, but the coefficient was still statistically significant. The obtained results prove that the LRP has increased the allocation efficiency of land resources in the cities and has promoted the sustainable development of the urban economy and environment. This indicates that industrial structure upgrading, newly built firms, attracting external investment, invention patents, technological innovation, and land price are the effective transmission channels through which the LRP has influenced GTFP. Equations (10) and (11) were estimated, and the results are reported in Table 7. The coefficients of LRP in Columns (3) to (4) describe the direct impacts of the LRP on the urban GTFP (j1 = 0.101 or k3 = 0.135). Technological innovation (IREIC) is an aggregate index that includes newly built firms, attracting external investment, and invention patents. IREIC could not be added to both the aggregate index and the subindex in the regression to prevent multiple covariances.

3.4. Indirect Impacts of the LRP on the Urban GTFP

Equations (12)–(17) were estimated to capture the indirect impacts of the LRP on the urban GTFP (Table 6). The statistically significant coefficient for LRP indicates that all the identified intermediary variables, such as lnPrice, Industry, Firm, Investment, Invention, and IRIEC, were transmission channels through which the policy effectively and indirectly affected GTFP. The impact of LRP is positive for lnPrice and Industry, and negative for the others. We calculated the indirect effect of the LRP on the urban GTFP via the mechanism variables using Table 6 and Table 7. For example, the estimated impact of the LRP on GTFP through the price mechanism is approximately 0.003 (0.008 × 0.416). Likewise, the impact is approximately 0.006 (0.034 × 0.170) through industrial structure transformation, approximately 0.0003 (−0.001 × −0.257) through newly built firms, approximately 0.0002 (−0.001 × −0.243) through external investment, approximately 0.0004 (−0.002 × −0.187) through patents for inventions, and approximately 0.0005 (−0.002 × −0.245) through technological innovation. The results of the indirect effects of the LRP on GTFP are presented in Table 8.

3.5. Total Impact of the LRP on GTFP

Table 8 presents the results of the calculation of the total effect of the LRP on GTFP. According to Table 6 and Table 7, the LRP positively affects lnPrice and Industry, which have a positive effect on GTFP, thereby leading to an effect of 0.003 and 0.006 of the LRP on lnPrice and Industry, respectively (Table 8). The LRP exerts a negative effect on Firms, Investment, and Invention and IRIEC, which negatively influence GTFP. Consequently, the indirect effects of the LRP via Firms, Investment, and Invention and IRIEC are positive: 0.0003, 0.0002, 0.0004, and 0.0005, respectively (Table 8). In conclusion, the total effect of the LRP on GTFP is positive via its direct impacts and its intermediary variables. The direct impacts are much stronger than the indirect effects.

3.6. Robustness Tests

The findings of the benchmark regressions revealed a significant effect of the LRP on the urban GTFP. We then checked the validity of the DID model. We first conducted parallel trend and placebo testing. Second, to rule out interference from other unobserved variables on the empirical results, we conducted an array of robustness tests by excluding the interference of other policies and performing propensity score-matching difference-in-differences (PSM-DID) analyses, to prove the reliability of our conclusions. Finally, heterogeneity was analyzed. The results obtained from these robustness tests confirmed the stability of the baseline results.

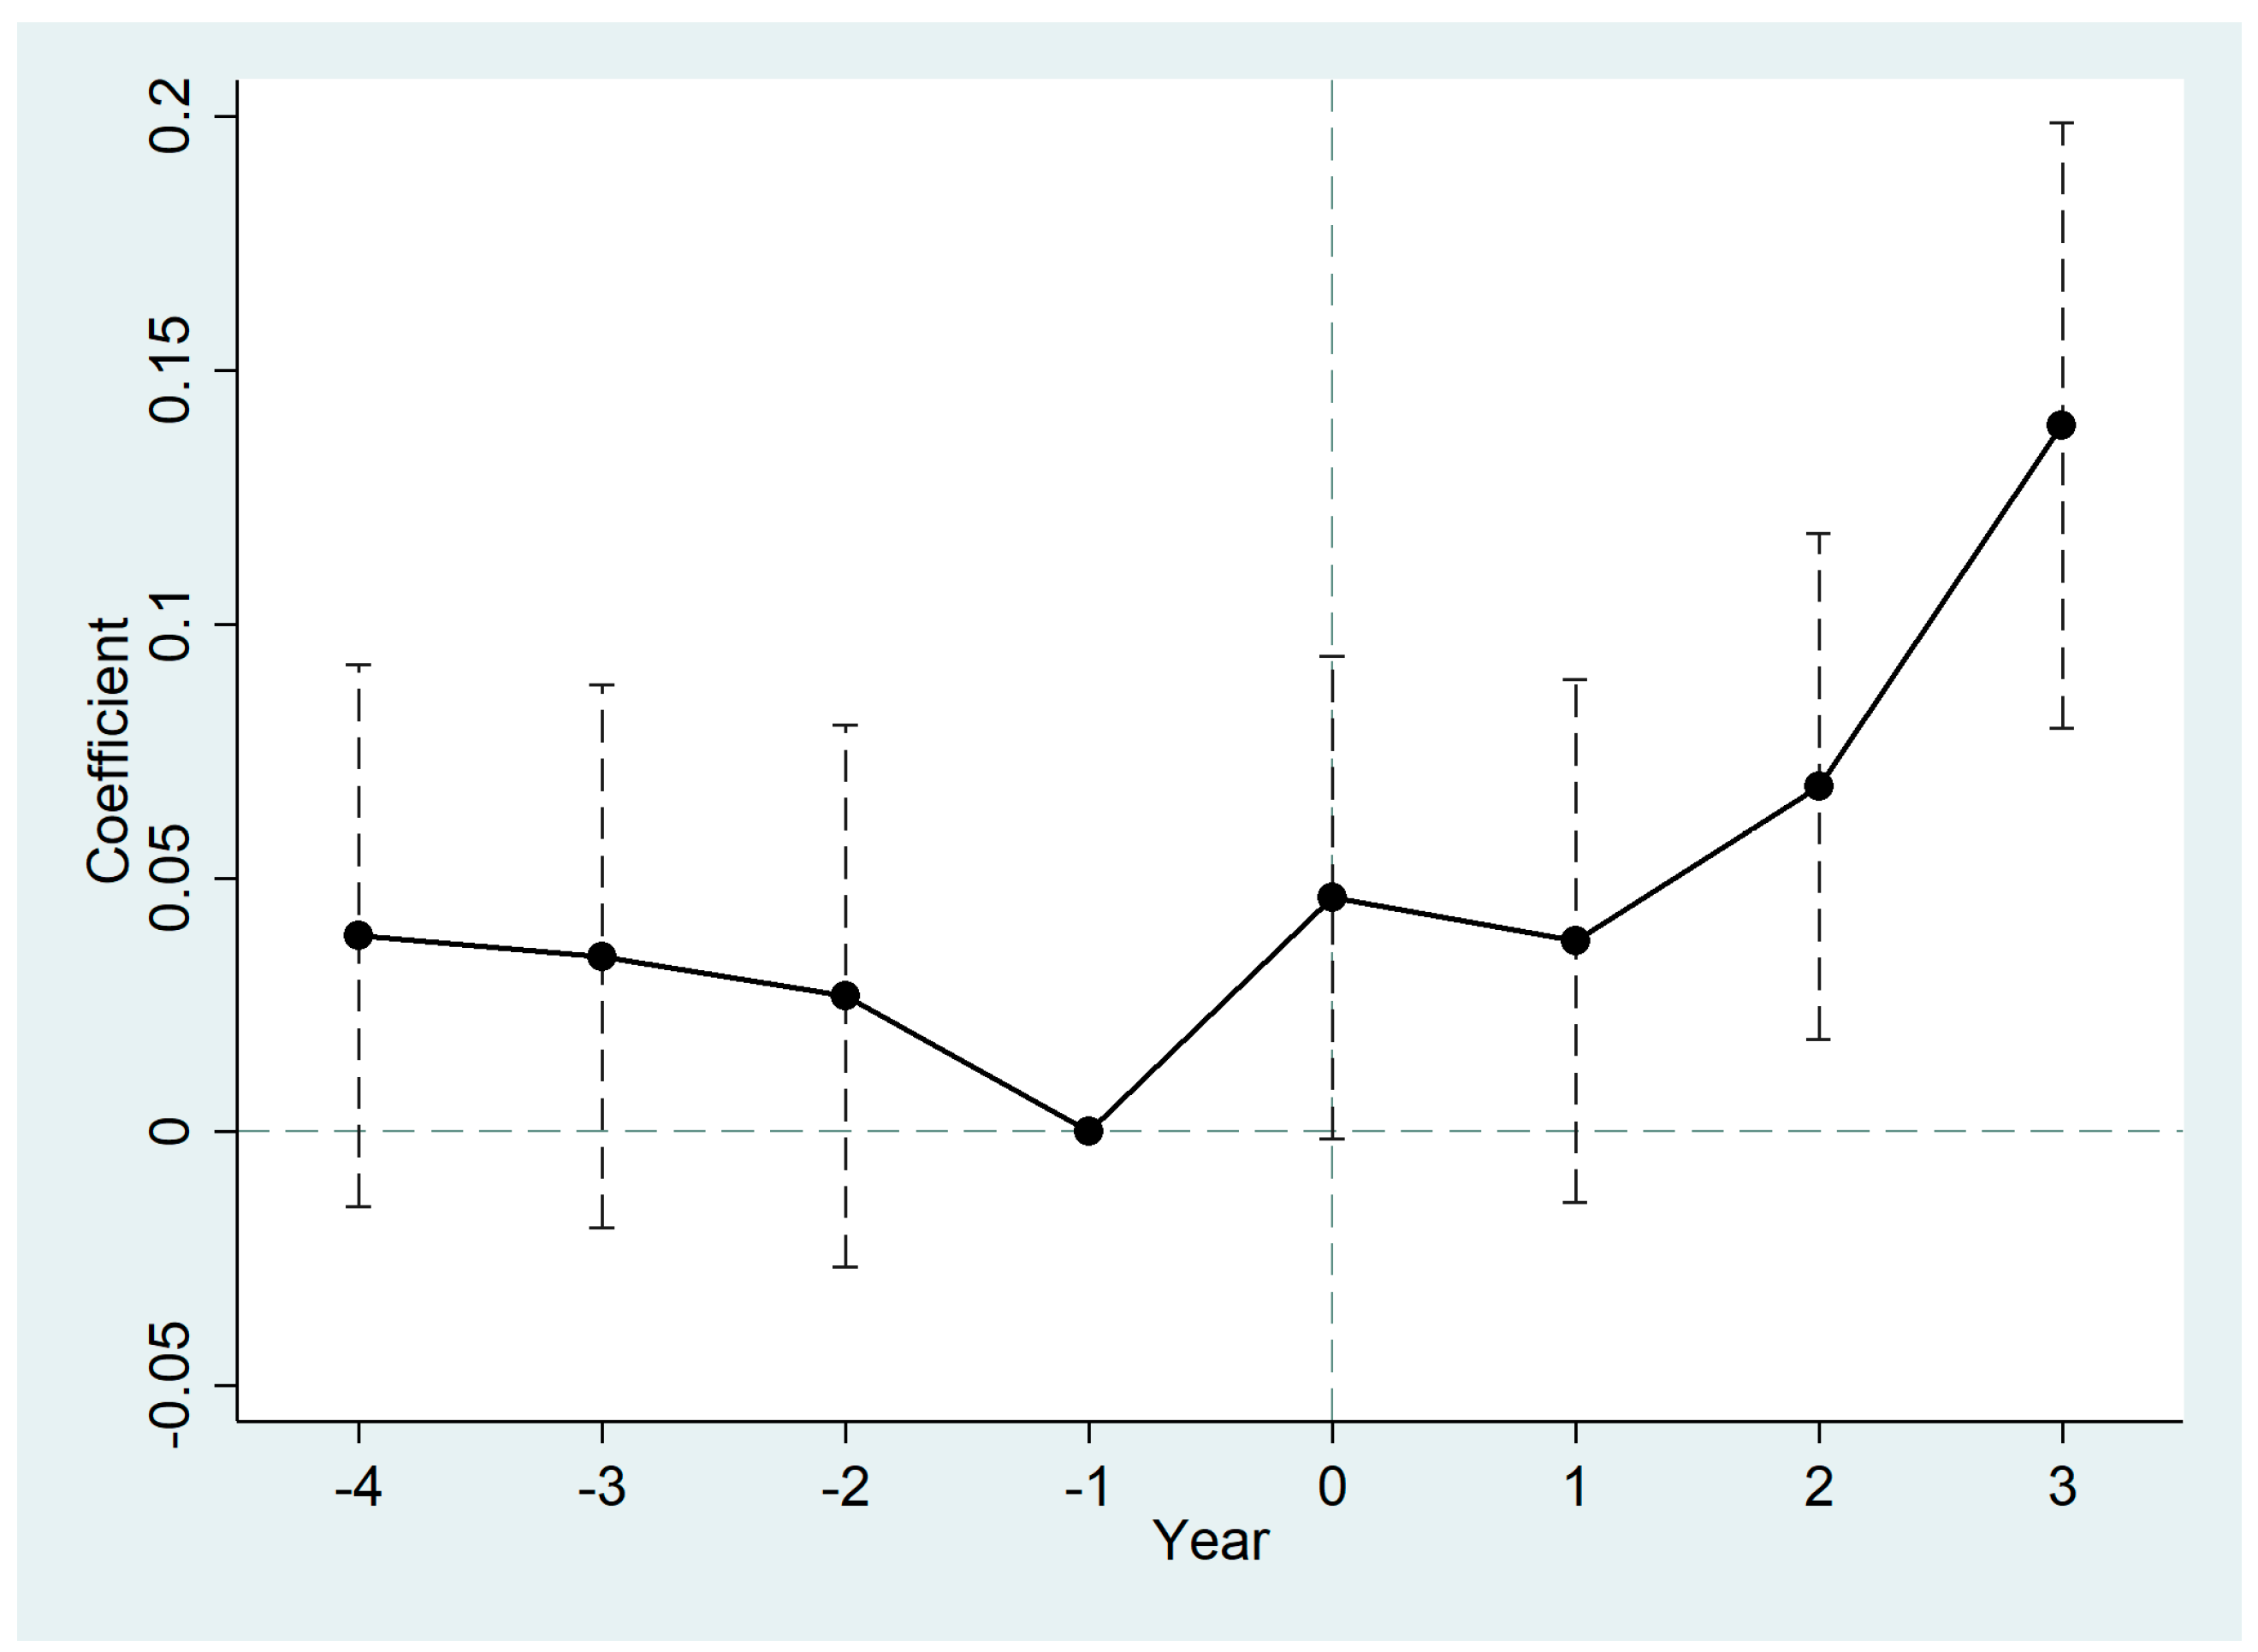
3.6.1. Parallel Trend Test

The parallel trend test must be conducted prior to constructing a DID model. The results of this test verified that the treatment and control groups selected for our empirical study were not significantly different before the policy was implemented. The trend in the two groups over time should be the same if the policy was not implemented. The ideal parallel trend test ensured that the effect obtained after double differencing between the two groups was a net effect from the policy and not an endogenous bias or due to interference from other factors. We thus used the event study method for parallel trend testing as follows:
G T F P i , t = α 2 + t = 4 3 δ t D i , t + λ 2 X i , t + η i + μ t + ε i , t
where D i , t is a dummy variable that is equal to 1 if city i implemented the LRP in year t and 0 otherwise. The control variables were the same as those in Equation (3). In particular, we focused on the coefficient δ t , an indicator of the difference in GTFP between land-restricted and other cities. According to the theory of parallel trend testing, we expected no significant difference between the treatment and control groups before the implementation of the LRP. Figure 1 depicts the parallel trend test plot obtained using the above equation.
We report the results for the four years before the policy as well as the three years after the policy because the LRP started in 2014, and our data were only available up to 2017. We used the year before the policy (2013) as the base period. The results of our parallel trend test in Figure 3 suggest that the coefficients of the periods before the LRP was implemented were around 0. The results indicate that the treatment and control groups were not significantly different before the LRP was implemented: the parallel trend test was passed. In addition, the coefficients of each period were significantly positive starting from the second period after the implementation of the LRP. This indicates that the LRP had a certain lag and effectively increased the GTFP of land-restricted cities after two years.

3.6.2. Placebo Testing

We conducted a time placebo test to verify that the empirically obtained conclusion that the LRP increases the urban GTFP is valid and not due to other unobservable factors. The result was tested to determine if it remained significant via constructing a spurious model that was contrary to the findings. If the result obtained was still significant, the result of the benchmark regression was due to other unobservable factors and could not be proved to be the effect of the LRP. We wanted the results obtained from the placebo test to be insignificant, counter-proving the reliability of the empirical results.
The time placebo test was used to test the reliability of the empirical results by constructing a false policy time. We advanced the implementation time of the LRP by 5, 4, 3, and 2 years to construct the false policy time, denoted with LRPfalse1, LRPfalse2, LRPfalse3, and LRPfalse4, respectively, which we substituted into Equation (3) to conduct the regressions. The findings presented in Table 9 show that the regression coefficients of LRPfalse1, LRPfalse2, LRPfalse3, and LRPfalse4 are not significant, so the placebo test with the false policy time was passed. This indicates that the benchmark regression results were not caused by random time shocks but due to the implementation of the LRP, proving the reliability of the conclusion that the LRP has significantly increased the urban GTFP.

3.6.3. Exclusion of Interference from Other Policies

We identified other relevant policies during the implementation of LRP that may have affected the urban GTFP to exclude the impact of other policies during the sample period on the urban GTFP that could have caused bias in the benchmark regression. The policies included the national dual-control zone policy introduced by the Air Pollution Prevention and Control Law, the National Development and Reform Commission’s Report on the Pilot Work of Promoting National Innovative Cities, and the Announcement on the Implementation of Special Emission Limits for Air Pollutants. We added dummy variables for the above policies to the benchmark regression to exclude the impact of these policies. ShuangKong indicates whether the city was in a dual-control zone in that year, taking a value of 1 if so and 0 otherwise. Innov_Pilot indicates whether the city was an innovation pilot city in that year, taking a value of 1 if it was and 0 otherwise. Atmos indicates whether the city was in an air pollution control zone in that year, taking a value of 1 if it was and 0 otherwise. Lowcarb_Pilot indicates whether the city was a low-carbon pilot city in that year, taking a value of 1 if it was and 0 otherwise.
The results are shown in Table 10, where Columns (1) to (4) demonstrate the regression results excluding the interference of the dual-control policies, innovative city pilots, air pollution control zones, and low-carbon city pilot policy, respectively. The coefficients of the key explanatory variable LRP indicate that, after excluding the disturbances from the four policies mentioned above, the LRP coefficients pass the test of significance at the 1% level. These results are consistent with the results of the benchmark regression, proving that the benchmark regression results are still robust after excluding the interference of other policies. Notably, the coefficient of air pollution control zones is negative in the regressions that include the LRP. This could have been due to overly stringent environmental regulatory policies directly and negatively impacting firm performance and the negative effect of the cost of following environmental regulatory policies outweighing the positive effect indirectly generated by innovation incentives [68]. This also supports the cost of compliance argument.

3.6.4. PSM-DID Model

We further adapted the PSM-DID model to verify that our findings were reliable to confirm the lack of selection bias and endogeneity in the study sample. The PSM-DID model combines the propensity score matching method (PSM) and the DID model, which effectively avoids selectivity bias between the treatment and control groups and endogeneity issues, resulting in credible causal effect estimates.
Table 11 reports the regression results from the PSM-DID model. Columns (1) to (4) report the regression results using nearest neighbor matching, radius matching, kernel matching, and Mahalanobis matching, respectively. The coefficients of the key explanatory variable LRP all pass the significance test at the 1% level, and the results of several matching methods are similar and largely identical to the results of the benchmark regression in Table 4. This finding further suggests that the LRP has significantly contributed to the urban GTFP.

3.7. Heterogeneity Analysis

3.7.1. Economic Regions

We tested the heterogeneity by dividing China into eastern, central, and western regions to explore the possible differences in the effects of the LRP on the urban GTFP according to the cities’ location. The eastern region included nine land-restricted cities, namely Beijing, Tianjin, Shenyang, Shanghai, Nanjing, Hangzhou, Guangzhou, Shenzhen, and Dongguan. The central region included three land-restricted cities, namely Zhengzhou, Wuhan, and Changsha. The western region included two land-restricted cities: Chongqing and Chengdu. The obtained results reported in Columns (1) to (3) of Table 12 show that the coefficients of LRP are all significantly positive. The coefficient of the eastern region is the largest, showing that the LRP has promoted GTFP in the eastern region by 0.167 units. The coefficient for the western region is the smallest and passes the test of significance at the 10% level. The higher level of economic development of the cities in the eastern and central regions makes them more capable of reducing their energy consumption and polluting production through industrial structure upgrading and green technological innovations to increase GTFP.

3.7.2. Levels of Cities

Differences in the city level may also affect the influence of the LRP on the city’s GTFP. For this reason, we divided Chinese cities into municipalities, provincial capitals, and prefecture-level cities according to their city administrative level. The regression results are shown in Columns (4) to (6) in Table 12. The LRP coefficients are all positive and significant. The results indicate that the LRP has most strongly promoted the GTFP in municipalities, followed by prefecture-level cities and provincial capitals. This has occurred because municipalities are the centers of economic activity and their population is highly concentrated. The municipalities also receive preferential treatment in terms of political resources, which help these municipalities upgrade their industrial structure and engage in technological innovation. Moreover, prefecture-level cities have higher development potential than provincial capitals. They are in a crucial stage of industrial structural transition, which, when coupled with the “latecomer’s advantage”, results in the LRP enhancing the GTFP more in these areas than in the provincial capitals.

3.7.3. Resource Endowments

The core purpose of the LRP is to prevent the overexploitation of urban land and to guard the red line of arable land. In practice, resource and non-resource cities are facing various stresses in the implementation of the LRP in different regions due to differences in resource types, endowments, and degrees of use. As such, the outcomes of LRP implementation may widely vary. To identify differences in the effect of the LRP in driving green development between resource and non-resource cities, we further divided the sample cities into resource and non-resource cities based on the divisions of the National Sustainable Development Plan for Resource Cities (2013–2020). The results are given in Table 12, which shows that the coefficient of LRP is positive and passes the test at the 1% significance level for cities with different resource endowments. The coefficient of resource cities is slightly larger than that of non-resource cities. This indicates that the impact of the LRP on GTFP enhancement in resource cities was approximately 43.56% higher than that in non-resource cities during the sample period. This difference may be because the growth of resource cities is dependent on natural resources, and the implementation of the LRP has had a more direct effect on resource cities. This may have forced them to transform their traditional polluting industries, upgrade their green innovation technologies, and increase the GTFP.

4. Discussion

The impact of environmental regulation on GTFP is unclear. The implementation of rational environmental regulation policies to enhance GTFP and promote green development is a common issue in all developing countries. The Chinese government’s green development strategy encourages the rational use of land resources to achieve sustainable development, with special emphasis on the harmonization of economic growth and environmental protection [69]. Our study found that the LRP, as an environmental regulatory policy, has promoted the urban GTFP through the use of land tools.
The LRP has played a positive role in promoting GTFP, indicating that the LRP can be used as an important policy tool for transforming the mode of development and realizing sustainable economic growth. ① The LRP is a policy tool for optimizing resource allocation through the resource allocation effect of the price mechanism, promoting the survival of the fittest and screening out high-efficiency enterprises. ② The LRP has increased the intensive use of urban land, promoted the upgrading of the industrial structure, and promoted green development. However, the transition from secondary to tertiary industries may result in the hollowing out of the manufacturing industry. ③ The overly strict LRP has negatively impacted larger cities. The insufficient land supply in large cities has increased land prices and enterprise costs, reduced the number of new enterprises, and restricted inward investment, thus inhibiting the technological innovation of enterprises and hindering GTFP. This finding suggests that the LRP should differentiate between different types of cities and moderately increase the supply of land in large cities.
International treaties such as the Climate Summit and the Declaration on the Human Environment call on all governments and people to work toward the protection and improvement of the human environment. In China, the LRP has generally positively impacted the urban GTFP, and this experience can provide a reference for other developing countries. The government can provide enterprises with subsidies for technological innovation to better use the land restriction policy to promote green development and reduce its negative impacts while implementing differentiated land restriction policies in different types of cities. For example, enterprises with leading technologies can be prioritized in land transfer and land price subsidies.

5. Conclusions

We selected the LRP implemented in Chinese megacities since 2014 as a quasi-natural experiment to assess its different impacts on the urban GTFP. A DID model was developed using urban panel data over the 1999–2017 period for Chinese cities. A series of robustness tests were conducted.
We found that the LRP has ①significantly reduced the total land transfer area in the megacities by 41.5% on average per year compared with other cities; ② increased the urban GTFP by approximately 0.168 units on average per year compared with other cities; ③indirectly increased the urban GTFP via rising land prices and transforming the industrial structure from secondary to tertiary industry, which themselves have positively affected GTFP; and ④ negatively affected technological innovation by reducing the number of newly built firms, investment, and patents on inventions in land-restricted cities, which have negatively influenced GTFP.
The results suggest that the LRP has promoted the sustainability of the urban economy in favor of the environment but poses a risk of urban green deindustrialization. To mitigate this risk, selective industrial land supply in large cities should be adopted in favor of enterprises in the field of green technological innovation by granting them land and subsidizing the land price, thus enhancing the GTFP.
The contributions of this study are as follows: ① Researchers have paid little attention to the effects of the LRP on GTFP, and this study fills this gap. ② On the basis of a theoretical discussion on the mechanism through which the LRP impacts GTFP, we combined theoretical models and empirical analysis to measure the direct and indirect effects of the LRP on GTFP through land prices, industrial structure upgrading, and enterprise innovation. These conclusions provide a theoretical reference and policy guidance for promoting green development using land policies.
Finally, this study has some limitations. We used macro-level data to discuss the impact of the LRP on the urban GTFP, with the study period ending in 2017 due to data limitations. The China Land Resources Yearbook has not been published since the Ministry of Land and Resources was merged with the Ministry of Natural Resources in 2018, so the sample period for macro-level land auction data in the cities was limited to 2017. Micro-level land supply data could be used to further study the impact in subsequent years. Additionally, we did not examine the detailed impact of the LPR on firms from a micro perspective. Microdata could be used to overcome the issues due to the short period of data available on the LRP from 2014 to 2017 and to explore the specific implications of the LRP for firms.

Author Contributions

S.X.: conceptualization, methodology, original draft writing, and supervision. M.L.: data collection, data curation, and original draft writing. P.H.: methodology, writing. Y.C.: data curation, review, editing. All authors commented on previous versions of the manu-script. All authors have read and agreed to the published version of the manuscript.

Funding

This study was funded by the National Social Science Foundation of China (22BJL052), and the Fundamental Research Funds for the Central Universities (B230207014).

Data Availability Statement

The data can be available upon request.

Conflicts of Interest

The authors declare no conflict of interest.

References

  1. Liu, S. China’s Two-Stage Land Reform. Int. Econ. Rev. 2017, 131, 24+29–56. [Google Scholar]
  2. Han, L.; Kung, J.K.-S. Fiscal incentives and policy choices of local governments: Evidence from China. J. Dev. Econ. 2015, 116, 89–104. [Google Scholar] [CrossRef]
  3. Liu, S.; Wang, Z.; Zhang, W.; Xiong, X. The Exhaustion of China’s “Land-Driven Development” Mode: An Analysis Based on Threshold Regression. J. Manag. World 2020, 36, 80–92+119+246. [Google Scholar] [CrossRef]
  4. Liu, Z.; Ling, Y. Structural Transformation, TFP and High-quality Development. J. Manag. World 2020, 36, 15–29. [Google Scholar] [CrossRef]
  5. Zhou, Y.; Liu, Z.; Liu, S.; Chen, M.; Zhang, X.; Wang, Y. Analysis of industrial eco-efficiency and its influencing factors in China. Clean Technol. Environ. Policy 2020, 22, 2023–2038. [Google Scholar] [CrossRef]
  6. Zhang, W.; Xu, H. Effects of land urbanization and land finance on carbon emissions: A panel data analysis for Chinese provinces. Land Use Policy 2017, 63, 493–500. [Google Scholar] [CrossRef]
  7. Yu, Z.; Deng, X.; Cheshmehzangi, A.; Mangi, E. Structural succession of land resources under the influence of different policies: A case study for Shanxi Province, China. Land Use Policy 2023, 132, 106810. [Google Scholar] [CrossRef]
  8. Du, J.; Thill, J.-C.; Peiser, R.B. Land pricing and its impact on land use efficiency in post-land-reform China: A case study of Beijing. Cities 2016, 50, 68–74. [Google Scholar] [CrossRef]
  9. Sueyoshi, T.; Yuan, Y.; Goto, M. A literature study for DEA applied to energy and environment. Energy Econ. 2017, 62, 104–124. [Google Scholar] [CrossRef]
  10. Song, M.; An, Q.; Zhang, W.; Wang, Z.; Wu, J. Environmental efficiency evaluation based on data envelopment analysis: A review. Renew. Sustain. Energy Rev. 2012, 16, 4465–4469. [Google Scholar] [CrossRef]
  11. Wang, B.; Liu, G. Energy Conservation and Emission Reduction and China’s Green Economic Growth—Based on a Total Factor Productivity Perspective. China Ind. Econ. 2015, 5, 57–69. [Google Scholar] [CrossRef]
  12. Luo, Y.; Lu, Z.; Salman, M.; Song, S. Impacts of heterogenous technological innovations on green productivity: An empirical study from 261 cities in China. J. Clean. Prod. 2022, 334, 130241. [Google Scholar] [CrossRef]
  13. Wu, H.; Ren, S.; Yan, G.; Hao, Y. Does China’s outward direct investment improve green total factor productivity in the “Belt and Road” countries? Evidence from dynamic threshold panel model analysis. J. Environ. Manag. 2020, 275, 111295. [Google Scholar] [CrossRef]
  14. Gao, Y.; Zhang, M.; Zheng, J. Accounting and determinants analysis of China’s provincial total factor productivity considering carbon emissions. China Econ. Rev. 2021, 65, 101576. [Google Scholar] [CrossRef]
  15. Guillaumont Jeanneney, S.; Hua, P. How does real exchange rate influence labour productivity in China? China Econ. Rev. 2011, 22, 628–645. [Google Scholar] [CrossRef]
  16. Zhong, S.; Xiong, Y.; Xiang, G. Environmental regulation benefits for whom? Heterogeneous effects of the intensity of the environmental regulation on employment in China. J. Environ. Manag. 2021, 281, 111877. [Google Scholar] [CrossRef] [PubMed]
  17. Li, R.; Ramanathan, R. Exploring the relationships between different types of environmental regulations and environmental performance: Evidence from China. J. Clean. Prod. 2018, 196, 1329–1340. [Google Scholar] [CrossRef]
  18. Da-ming, Y.; Ya-ling, D.; Sai-lian, X. Research on environmental regulatory behavior strategy of central government and local government under the perspective of competition. China Popul. Resour. Environ. 2018, 28, 120–129. [Google Scholar]
  19. Letta, M.; Tol, R.S.J. Weather, Climate and Total Factor Productivity. Environ. Resour. Econ. 2019, 73, 283–305. [Google Scholar] [CrossRef]
  20. Coelli, T.J.; Rao, D.S.P. Total factor productivity growth in agriculture: A Malmquist index analysis of 93 countries, 1980–2000. Agric. Econ. 2005, 32, 115–134. [Google Scholar] [CrossRef]
  21. Chen, P.-C.; Yu, M.-M.; Chang, C.-C.; Hsu, S.-H. Total factor productivity growth in China’s agricultural sector. China Econ. Rev. 2008, 19, 580–593. [Google Scholar] [CrossRef]
  22. Cheng, Z.; Li, X.; Zhu, Y.; Wang, M. The effects of agglomeration externalities on urban green total-factor productivity in China. Econ. Syst. 2023, 47, 101025. [Google Scholar] [CrossRef]
  23. Feng, C.; Huang, J.-B.; Wang, M. Analysis of green total-factor productivity in China’s regional metal industry: A meta-frontier approach. Resour. Policy 2018, 58, 219–229. [Google Scholar] [CrossRef]
  24. Walker, N.L.; Williams, A.P.; Styles, D. Key performance indicators to explain energy & economic efficiency across water utilities, and identifying suitable proxies. J. Environ. Manag. 2020, 269, 110810. [Google Scholar] [CrossRef]
  25. Chen, S.; Golley, J. ‘Green’ productivity growth in China’s industrial economy. Energy Econ. 2014, 44, 89–98. [Google Scholar] [CrossRef]
  26. Lin, B.; Chen, Z. Does factor market distortion inhibit the green total factor productivity in China? J. Clean. Prod. 2018, 197, 25–33. [Google Scholar] [CrossRef]
  27. Liu, G.; Wang, B.; Cheng, Z.; Zhang, N. The drivers of China’s regional green productivity, 1999–2013. Resour. Conserv. Recycl. 2020, 153, 104561. [Google Scholar] [CrossRef]
  28. Chung, Y.H.; Färe, R.; Grosskopf, S. Productivity and Undesirable Outputs: A Directional Distance Function Approach. J. Environ. Manag. 1997, 51, 229–240. [Google Scholar] [CrossRef]
  29. Kumar, S. Environmentally sensitive productivity growth: A global analysis using Malmquist–Luenberger index. Ecol. Econ. 2006, 56, 280–293. [Google Scholar] [CrossRef]
  30. Mahlberg, B.; Luptacik, M.; Sahoo, B.K. Examining the drivers of total factor productivity change with an illustrative example of 14 EU countries. Ecol. Econ. 2011, 72, 60–69. [Google Scholar] [CrossRef]
  31. Li, K.; Lin, B. Measuring green productivity growth of Chinese industrial sectors during 1998–2011. China Econ. Rev. 2015, 36, 279–295. [Google Scholar] [CrossRef]
  32. Yang, Z.; Fan, M.; Shao, S.; Yang, L. Does carbon intensity constraint policy improve industrial green production performance in China? A quasi-DID analysis. Energy Econ. 2017, 68, 271–282. [Google Scholar] [CrossRef]
  33. Tian, P.; Lin, B. Promoting green productivity growth for China’s industrial exports: Evidence from a hybrid input-output model. Energy Policy 2017, 111, 394–402. [Google Scholar] [CrossRef]
  34. Kuang, Y.; Peng, D. Analysis of Environmental Production Efficiency and Environmental Total Factor Productivity in China. Econ. Res. J. 2012, 47, 62–74. [Google Scholar]
  35. Wang, Z.; Feng, C. Sources of production inefficiency and productivity growth in China: A global data envelopment analysis. Energy Econ. 2015, 49, 380–389. [Google Scholar] [CrossRef]
  36. Li, K.; Lin, B. Impact of energy conservation policies on the green productivity in China’s manufacturing sector: Evidence from a three-stage DEA model. Appl. Energy 2016, 168, 351–363. [Google Scholar] [CrossRef]
  37. Zhang, C.; Liu, H.; Bressers, H.T.A.; Buchanan, K.S. Productivity growth and environmental regulations-accounting for undesirable outputs: Analysis of China’s thirty provincial regions using the Malmquist–Luenberger index. Ecol. Econ. 2011, 70, 2369–2379. [Google Scholar] [CrossRef]
  38. Li, X.; An, Q. A Study of Environmental Regulatory Costs and Environmental Total Factor Productivity. J. World Econ. 2012, 35, 23–40. [Google Scholar] [CrossRef]
  39. Xia, F.; Xu, J. Green total factor productivity: A re-examination of quality of growth for provinces in China. China Econ. Rev. 2020, 62, 101454. [Google Scholar] [CrossRef]
  40. Li, K.; Lin, B. Economic growth model, structural transformation, and green productivity in China. Appl. Energy 2017, 187, 489–500. [Google Scholar] [CrossRef]
  41. Wang, H.; Cui, H.; Zhao, Q. Effect of green technology innovation on green total factor productivity in China: Evidence from spatial durbin model analysis. J. Clean. Prod. 2021, 288, 125624. [Google Scholar] [CrossRef]
  42. Wu, J.; Xia, Q.; Li, Z. Green innovation and enterprise green total factor productivity at a micro level: A perspective of technical distance. J. Clean. Prod. 2022, 344, 131070. [Google Scholar] [CrossRef]
  43. Yuan, H.; Feng, Y.; Lee, C.-C.; Cen, Y. How does manufacturing agglomeration affect green economic efficiency? Energy Econ. 2020, 92, 104944. [Google Scholar] [CrossRef]
  44. Yang, C.-H.; Tseng, Y.-H.; Chen, C.-P. Environmental regulations, induced R&D, and productivity: Evidence from Taiwan’s manufacturing industries. Resour. Energy Econ. 2012, 34, 514–532. [Google Scholar] [CrossRef]
  45. Hancevic, P.I. Environmental regulation and productivity: The case of electricity generation under the CAAA-1990. Energy Econ. 2016, 60, 131–143. [Google Scholar] [CrossRef]
  46. Li, B.; Wu, S. Effects of local and civil environmental regulation on green total factor productivity in China: A spatial Durbin econometric analysis. J. Clean. Prod. 2017, 153, 342–353. [Google Scholar] [CrossRef]
  47. Song, M.; Zhu, S.; Wang, J.; Zhao, J. Share green growth: Regional evaluation of green output performance in China. Int. J. Prod. Econ. 2020, 219, 152–163. [Google Scholar] [CrossRef]
  48. Yang, X.; Wang, W.; Su, X.; Ren, S.; Ran, Q.; Wang, J.; Cao, J. Analysis of the influence of land finance on haze pollution: An empirical study based on 269 prefecture-level cities in China. Growth Change 2023, 54, 101–134. [Google Scholar] [CrossRef]
  49. Bai, Y.; Deng, X.; Cheng, Y.; Hu, Y.; Zhang, L. Exploring regional land use dynamics under shared socioeconomic pathways: A case study in Inner Mongolia, China. Technol. Forecast. Soc. Change 2021, 166, 120606. [Google Scholar] [CrossRef]
  50. Xie, R.; Yao, S.; Han, F.; Zhang, Q. Does misallocation of land resources reduce urban green total factor productivity? An analysis of city-level panel data in China. Land Use Policy 2022, 122, 106353. [Google Scholar] [CrossRef]
  51. Deng, C.; Zhao, H.; Xie, B.; Li, Z.; Li, K. The impacts of land misallocation on urban industrial green total-factor productivity in China. Acta Geogr. Sin. 2021, 76, 1865–1881. [Google Scholar]
  52. Chen, H.; Liu, P.; Xu, P. The study on the evolution mechanism of urban green total factor productivity—From the perspective of urban energy and land factor constraints. China Popul. Resour. Environ. 2020, 30, 93–105. [Google Scholar]
  53. Tang, L.; Wang, D. Optimization of County-Level Land Resource Allocation through the Improvement of Allocation Efficiency from the Perspective of Sustainable Development. Int. J. Environ. Res. Public Health 2018, 15, 2638. [Google Scholar] [CrossRef] [PubMed]
  54. Rao, J.; Zhang, X.; Zhai, D. Does the Upgrading of Development Zones Improve Land Use Efficiency under the Net-Zero Carbon City Goal? Prefectural-Level Evidence from Quasi-Natural Experiments in China. Land 2024, 13, 1245. [Google Scholar] [CrossRef]
  55. Yuan, C.; Xiao, T.; Geng, C.; Sheng, Y. Digital Transformation and Division of Labor between Enterprises: Vertical Specialization or Vertical Integration. China Ind. Econ. 2021, 9, 137–155. [Google Scholar] [CrossRef]
  56. Xiao, X.; Ji, S. Dynamic Impact of Environmental Regulation on Industrial Upgrading Path. Econ. Theory Bus. Manag. 2013, 33, 102–112. [Google Scholar]
  57. Wang, W. The “Embarrassment”of Environmental Philosophy: A Paradox of Technology and Environment. J. Shaanxi Norm. Univ. (Philos. Soc. Sci. Ed.) 2017, 46, 34–41. [Google Scholar] [CrossRef]
  58. Yu, B. How Does Industrial Restructuring Improve Regional Energy Efficiency? An Empirical Study Based on Two Dimensions of Magnitude and Quality. J. Financ. Econ. 2017, 43, 86–97. [Google Scholar] [CrossRef]
  59. Yuan, Y.; Xie, R. FDI, Environmental Regulation and Green Total Factor Productivity Growth of China’s Industry: An Empirical Study Based on Luenberger Index. J. Int. Trade 2015, 8, 84–93. [Google Scholar] [CrossRef]
  60. Liu, Y.; Tian, Y.; Luo, Y. Upgrading of Industrial Structure, Energy Efficiency, Green Total Factor Productivity. Theory Pract. Financ. Econ. 2018, 39, 118–126. [Google Scholar] [CrossRef]
  61. Lin, J.; Zhang, P. Appropriate Technology, Technological Selection, and Economic Growth in Developing Countries. China Econ. Q. 2006, 5, 985–1006. [Google Scholar] [CrossRef]
  62. Kong, X.; Mi, M.; Gao, T. The Suitable Degree of Technology Progress and Innovation Driven Industrial Structure Adjustment—An Empirical Analysis Based on Biased Technology Progress. China Ind. Econ. 2015, 11, 62–77. [Google Scholar] [CrossRef]
  63. Liu, G.; Wang, B.; Zhang, N. A coin has two sides: Which one is driving China’s green TFP growth? Econ. Syst. 2016, 40, 481–498. [Google Scholar] [CrossRef]
  64. Wang, L.; Wang, H.; Dong, Z. Policy Conditions for Compatibility between Economic Growth and Environmental Quality: A Test of Policy Bias Effects from the Perspective of the Direction of Environmental Technological Progress. J. Manag. World 2020, 36, 39–60. [Google Scholar] [CrossRef]
  65. Cheng, Y.; Jia, S.; Meng, H. Fiscal policy choices of local governments in China: Land finance or local government debt? Int. Rev. Econ. Financ. 2022, 80, 294–308. [Google Scholar] [CrossRef]
  66. Liu, X.; Gong, B. New Growth Accounting Framework, TFP Measurement and Drivers for High-quality Development. China Econ. Q. 2022, 22, 613–632. [Google Scholar] [CrossRef]
  67. Del Gatto, M.; Di Liberto, A.; Petraglia, C. Measuring Productivity. J. Econ. Surv. 2011, 25, 952–1008. [Google Scholar] [CrossRef]
  68. Lanoie, P.; Laurent-Lucchetti, J.; Johnstone, N.; Ambec, S. Environmental policy, innovation and performance: New insights on the porter hypothesis. J. Econ. Manag. Strategy 2011, 20, 803–842. [Google Scholar] [CrossRef]
  69. Jin, G.; Chen, K.; Wang, P.; Guo, B.; Dong, Y.; Yang, J. Trade-offs in land-use competition and sustainable land development in the North China Plain. Technol. Forecast. Soc. Chang. 2019, 141, 36–46. [Google Scholar] [CrossRef]
Figure 1. Changes in the area of land transferred in urban areas in China. Note: The black dots indicate land-restricted cities.
Land 13 02249 g001
Figure 2. Changes in urban GTFP in China. Note: The black dots indicate land-restricted cities.
Land 13 02249 g002
Figure 3. Parallel trend test plot. Note: Solid dots indicate the estimated coefficients of δ t in Equation (20), and the short vertical lines indicate the 95% upper and lower confidence intervals corresponding to the robust standard errors clustered to the city level.
Land 13 02249 g003
Table 1. Expected impacts of the LRP on GTFP.
Direct impactsVia land transfer management and allocation efficiency L R P + G T F P
Indirect effects via
intermediary
transmission channels
Impacts of LRP on intermediary variables
(a)
Impacts of intermediary variables on GTFP
(b)
Impact of LRP on GTFP
(c) = a × b
L R P + L a n d   p r i c e L a n d   p r i c e + G T F P L R P + G T F P
L R P + I n d u s t r y I n d u s t r y + G T F P L R P + G T F P
L R P F i r m s F i r m ? G T F P L R P ? G T F P
L R P I n v e s t m e n t I n v e s t m e n t ? G T F P L R P ? G T F P
L R P I n v e n t i o n I n v e n t i o n ? G T F P L R P ? G T F P
L R P I n n o v a t i o n I n n o v a t i o n ? G T F P L R P ? G T F P
Total effects L R P ? G T F P
Table 2. Descriptive statistics.
VariablesObsMeanStd. Dev.MinMax
GTFP52310.4220.270−1.0831.286
LRP53900.0100.0980.0001.000
PGDP479924,106.16563,295.24577.2764,163,697.000
Road47351397.1102022.8541.00021,490.000
Edu51770.0140.0200.0000.131
Rr_RGDP4812622.783401.8498.56416,907.125
FDIK50990.0120.0160.0000.328
KL525930.80922.7950.317197.786
Land6284626.079850.3670.0109086.840
Addland4663432.265530.5240.0305788.560
Price6282563,327.7101,541,074.1001.00027,182,414.000
Industry52970.8730.4540.0949.482
Firm614555.75925.0130.26999.981
Investment614557.67222.8356.35699.981
Invent614563.23718.83540.14099.962
IRIEC614557.40524.2620.24099.942
Table 3. Effects of the LRP on land transfer.
(1)(2)
lnLandlnAddland
LRP−0.415 ***−0.477 ***
(−4.721)(−3.172)
Constant0.561−3.865 ***
(1.053)(−3.647)
Control variablesYesYes
Year fixed effectsYesYes
Urban fixed effectsYesYes
Observations42403830
R-squared0.7960.687
r2_a0.7800.660
F50.3225.50
Note: *** represent significance at the 1% level.
Table 4. Impact of the LRP on urban GTFP.
(1)(2)
GTFPGTFP
LRP0.173 ***0.168 ***
(8.096)(9.930)
lnPGDP 0.129 ***
(13.920)
lnRoad −0.029 ***
(−4.941)
Edu 1.256 ***
(4.912)
lnRr_RGDP −0.080 ***
(−11.957)
lnFDIK 0.007 ***
(3.303)
lnKL 0.034 ***
(5.764)
Constant0.204 ***−0.415 ***
(6.336)(−3.934)
Year fixed effectsYesYes
Urban fixed effectsYesYes
Observations52014103
R-squared0.7670.846
r2_a0.7520.834
F52.9168.69
Note: *** represent significant at the 1% level.
Table 5. Mechanisms through which the LRP impacts increase in GTFP.
(1)(2)(3)(4)(5)(6)
GTFPGTFPGTFPGTFPGTFPGTFP
LRP0.166 ***0.162 ***0.140 ***0.144 ***0.137 ***0.144 ***
(9.786)(9.599)(8.052)(8.395)(8.056)(8.396)
lnPGDP0.127 ***0.141 ***0.138 ***0.134 ***0.127 ***0.135 ***
(13.631)(14.875)(14.786)(14.487)(13.903)(14.582)
lnRoad−0.030 ***−0.027 ***−0.028 ***−0.028 ***−0.024 ***−0.028 ***
(−5.040)(−4.508)(−4.692)(−4.791)(−4.033)(−4.771)
Edu1.249 ***0.990 ***0.982 ***0.973 ***1.093 ***1.009 ***
(4.885)(3.818)(3.801)(3.765)(4.312)(3.925)
lnRr_RGDP−0.082 ***−0.080 ***−0.077 ***−0.077 ***−0.081 ***−0.077 ***
(−12.090)(−11.966)(−11.327)(−11.324)(−12.074)(−11.372)
lnFDIK0.006 ***0.007 ***0.007 ***0.008 ***0.006 ***0.008 ***
(3.227)(3.263)(3.684)(4.192)(2.917)(3.761)
lnKL0.033 ***0.037 ***0.040 ***0.041 ***0.035 ***0.040 ***
(5.651)(6.314)(6.766)(6.823)(6.018)(6.705)
lnPrice0.005*
(1.808)
Industry 0.044 ***
(5.496)
Firm −0.002 ***
(−6.553)
Investment −0.002 ***
(−6.673)
Invention −0.003 ***
(−10.383)
IRIEC −0.002 ***
(−7.217)
Constant−0.453 ***−0.671 ***−0.364 ***−0.346 ***−0.192 *−0.358 ***
(−4.214)(−5.837)(−3.443)(−3.267)(−1.805)(−3.392)
Year fixed effectsYesYesYesYesYesYes
Urban fixed effectsYesYesYesYesYesYes
Observations410341014079407940794079
R-squared0.8460.8470.8480.8480.8500.848
r2_a0.8340.8350.8360.8360.8380.836
F68.5269.0469.4869.5170.8769.67
Note: * and *** represent significant at the 10% and 1% levels, respectively.
Table 6. Estimation of the channels through which the LRP affects GTFP.
(1)(2)(3)(4)(5)(6)
lnPriceIndustryFirmInvestmentInventionIRIEC
LRP0.416 ***0.170 ***−0.257 ***−0.243 ***−0.187 ***−0.245 ***
(4.258)(4.851)(−11.311)(−9.347)(−10.096)(−9.073)
Control variableYesYesYesYesYesYes
Year fixed effectsYesYesYesYesYesYes
Urban fixed effectsYesYesYesYesYesYes
Observations420041984176417641764176
R-squared0.9000.7960.8950.8480.8660.847
r2_a0.8920.7800.8870.8360.8560.835
F114.949.62108.770.8682.3870.59
Note: *** represent significant at the 1% level.
Table 7. Direct impacts of the LRP on GTFP.
(1)(2)(3)(4)
GTFPGTFPGTFPGTFP
LRP0.166 ***0.160 ***0.101 ***0.135 ***
(9.786)(9.440)(5.756)(7.883)
lnPGDP0.127 ***0.139 ***0.143 ***0.144 ***
(13.631)(14.597)(15.179)(15.162)
lnRoad−0.030 ***−0.027 ***−0.022 ***−0.026 ***
(−5.040)(−4.614)(−3.689)(−4.484)
Edu1.249 ***0.980 ***0.552**0.742 ***
(4.885)(3.779)(2.127)(2.851)
lnRr_RGDP−0.082 ***−0.082 ***−0.077 ***−0.078 ***
(−12.090)(−12.120)(−11.572)(−11.596)
lnFDIK0.006 ***0.006 ***0.007 ***0.007 ***
(3.227)(3.180)(3.659)(3.621)
lnKL0.033 ***0.036 ***0.045 ***0.042 ***
(5.651)(6.198)(7.611)(7.085)
lnPrice0.005 *0.006**0.008 ***0.007 **
(1.808)(1.976)(2.959)(2.465)
Industry 0.044 ***0.034 ***0.042 ***
(5.552)(4.316)(5.339)
Firm −0.001 ***
(−3.548)
Investment −0.001 ***
(−4.172)
Invention −0.002 ***
(−8.939)
IRIEC −0.002 ***
(−7.237)
Constant−0.453 ***−0.715 ***−0.415 ***−0.658 ***
(−4.214)(−6.110)(−3.504)(−5.625)
Year fixed effectsYesYesYesYes
Urban fixed effectsYesYesYesYes
Observations4103410140774077
R-squared0.8460.8470.8530.850
r2_a0.8340.8350.8410.837
F68.5268.8871.4169.87
Note: *, **, and *** represent significant at the 10%, 5%, and 1% levels, respectively.
Table 8. Impacts of the LRP on GTFP.
Effect CategoriesCoefficients According to EquationsImpacts
Direct impacts:
- Firms, investment, and inventionj10.101
- IRIECk10.135
Indirect effects:
- Via pricej3l10.008 × 0.416 = 0.003
- Via industryj4m10.034 × 0.17 = 0.006
- Via firmsj5n1−0.001 × (−0.257) = 0.0003
- Via investmentj6o1−0.001 × (−0.243) = 0.0002
- Via inventionj7p1−0.002 × (−0.187) = 0.0004
or
- Via pricek3l10.007 × 0.416 = 0.003
- Via industryk4m10.042 × 0.17 = 0.007
- Via IRIECk5q1−0.002 × (−0.245) = 0.0005
Total effects:
- Firms, investment, and inventionj1 + j3l1 + j4m1 + j5n1 + j6o1 + j7p10.11
- IRIECk1 +k3l1 + k4m1 + k5q10.15
Note: Column (3) of Table 8 was calculated according to Equations (10)–(17).
Table 9. Time placebo test results.
(1)(2)(3)(4)
5 years in advance4 years in advance3 years in advance2 years in advance
GTFPGTFPGTFPGTFP
LRPfalse10.015
(1.016)
LRPfalse2 −0.012
(−0.838)
LRPfalse3 −0.010
(−0.705)
LRPfalse4 −0.010
(−0.684)
Constant−0.059−0.061−0.060−0.061
(−0.299)(−0.309)(−0.303)(−0.305)
Control variablesYesYesYesYes
Year fixed effectsYesYesYesYes
Urban fixed effectsYesYesYesYes
Observations4275427542754275
R-squared0.8980.8980.8980.898
r2_a0.8910.8910.8910.891
F113.2113.2113.2113.2
Table 10. Regression results excluding disturbances from other policies.
(1)(2)(3)(4)
Dual-control zone policyPilot innovative citiesAir pollution control zoneLow-carbon city pilot
GTFPGTFPGTFPGTFP
LRP0.168 ***0.158 ***0.170 ***0.157 ***
(9.930)(9.222)(9.264)(9.280)
ShuangKong0.111 *
(1.779)
Innov_Pilot 0.028 ***
(3.373)
Atmos −0.004
(−0.342)
Lowcarb_Pilot 0.037 ***
(5.552)
Constant−0.526 ***−0.436 ***−0.412 ***−0.418 ***
(−4.566)(−4.129)(−3.899)(−3.981)
Control variablesYesYesYesYes
Year fixed effectsYesYesYesYes
Urban fixed effectsYesYesYesYes
Observations4103410341034103
R-squared0.8460.8470.8460.847
r2_a0.8340.8340.8340.835
F68.6968.6968.4569.10
Note: * and *** represent significant at the 10% and 1% levels, respectively.
Table 11. PSM-DID regression results.
(1)(2)(3)(4)
Nearest neighbor matchingRadius matchingKernel matchingMahalanobis matching
GTFPGTFPGTFPGTFP
LRP0.167 ***0.170 ***0.167 ***0.168 ***
(10.471)(10.595)(10.471)(9.930)
Constant−0.162−0.167−0.162−0.415 ***
(−1.326)(−1.368)(−1.326)(−3.934)
Control variablesYesYesYesYes
Year fixed effectsYesYesYesYes
Urban fixed effectsYesYesYesYes
Observations3162315831624103
R-squared0.8640.8640.8640.846
r2_a0.8510.8500.8510.834
F62.5962.3662.5968.69
Note: *** represent significant at the 1% levels.
Table 12. Heterogeneity analysis.
(1)(2)(3)(4)(5)(6)(7)(8)
EasternCentralWesternMunicipalitiesProvincial capitalsPrefecture-level citiesResource citiesNon-resource cities
GTFPGTFPGTFPGTFPGTFPGTFPGTFPGTFP
LRP0.167 ***0.150 ***0.089 *0.809 ***0.084 ***0.183 ***0.145 ***0.101 ***
(8.645)(3.997)(1.720)(10.210)(3.981)(4.129)(3.306)(9.648)
Constant0.576 ***−1.394 ***−1.012 ***5.712 ***−1.391 ***−0.499 ***0.4210.057
(3.324)(−7.295)(−5.375)(6.014)(−4.138)(−4.833)(1.534)(0.315)
Control variablesYesYesYesYesYesYesYesYes
Year fixed effectsYesYesYesYesYesYesYesYes
Urban fixed effectsYesYesYesYesYesYesYesYes
Observations15601513103063400364016342489
R-squared0.8260.7930.8190.9810.9370.8280.9210.950
r2_a0.8110.7750.7990.9690.9290.8140.9130.946
F55.9843.7541.0982.53111.459.24121.2221.9
Note: * and *** represent significant at the 10% and 1% levels, respectively.
Disclaimer/Publisher’s Note: The statements, opinions and data contained in all publications are solely those of the individual author(s) and contributor(s) and not of MDPI and/or the editor(s). MDPI and/or the editor(s) disclaim responsibility for any injury to people or property resulting from any ideas, methods, instructions or products referred to in the content.

