Article

Prioritizing Urban River Restoration Management Practices: A Cross-Evaluation Using the Criticality Index for Watershed Restoration (CIWR) and Opportunity Layers

by
Andressa Ferreira Lima
1,
Giulia Figueiredo Ferreira
2,
Aline Pires Veról
2 and
Marcelo Gomes Miguez
1,3,4,*
1
Instituto Alberto Luiz Coimbra de Pós-Graduação e Pesquisa em Engenharia, Universidade Federal do Rio de Janeiro, Av. Horácio Macedo, 2030, Rio de Janeiro 21941-914, Brazil
2
Programa de Pós-Graduação em Arquitetura, Universidade Federal do Rio de Janeiro, Av. Pedro Calmon, 550, Sala 433, Rio de Janeiro 21941-596, Brazil
3
Programa de Engenharia Ambiental, Universidade Federal do Rio de Janeiro, Av. Athos da Silveira Ramos, 149, Sala I-206, Rio de Janeiro 21941-909, Brazil
4
Programa de Engenharia Urbana, Universidade Federal do Rio de Janeiro, Av. Athos da Silveira Ramos, 149, Sala I-206, Rio de Janeiro 21941-909, Brazil
*
Author to whom correspondence should be addressed.
Land 2024, 13(12), 2244; https://doi.org/10.3390/land13122244
Submission received: 31 October 2024 / Revised: 7 December 2024 / Accepted: 18 December 2024 / Published: 21 December 2024
(This article belongs to the Special Issue Water Resources and Land Use Planning II)

Abstract

:
Urbanization exerts significant stress on urban river ecosystems, leading to their degradation and the loss of environmental functions. Several studies have focused on restoring these urban rivers to enhance environmental quality and contribute to overall city well-being. However, such restoration efforts encounter economic, environmental, and social challenges. This study proposes a methodological framework to aid public managers in prioritizing areas for urban river restoration. The approach integrates the concept of environmental services with urban development opportunities to address these dual demands. Central to this framework is the introduction of the criticality index for watershed restoration (CIWR), which categorizes watershed areas based on environmental quality indicators, using river restoration as a guiding principle. Additionally, legally protected environmental areas were considered as opportunity layers. This study used geographic information systems (GIS) to manage and overlay datasets for a case study in the João Mendes Watershed in Niterói, southeast Brazil, which illustrated the use of the CIWR. By intersecting this framework with the opportunity layers, priority locations were identified for potential river restoration management practices. The results indicated that the overall criticality condition of this watershed for river restoration is low. The study further discusses potential measures for river restoration in the identified priority areas, underscoring the importance of strategic planning in urban environmental management. The CIWR proved to be an easily applicable and replicable management decision tool for comparing watersheds and assessing deficient environmental services, with both numerical and spatial results. Its use, combined with the “opportunity” layer, enables public managers to define priority areas for river restoration practices based on clear and objective criteria.

1. Introduction

1.1. Urbanization and Its Impacts in Urban Rivers

Throughout history, many civilizations have faced challenges in managing and restoring watersheds, leading to significant socio-environmental consequences [1]. Under natural conditions, rivers perform essential geomorphological, hydrological, and ecological functions, such as water transport and storage, along with sediment transport [2]. However, poor land use and occupation practices in a watershed can harm these processes. Urbanization encompasses a series of anthropogenic actions that modify the hydrological cycle, the pattern of surface water runoff, as well as river systems’ responses to the built environment, resulting in a range of environmental, economic, and social impacts on the territory that accumulate over time [3].
Watercourses have gradually lost their role as elements in the landscape, becoming less perceived by the population, and there has been a loss in the potential for water resource use in cities due to declines in both quality and quantity [4]. Urban rivers have been particularly harmed by human activities, and the recovery of these ecosystems is now motivated by several ecological and social factors, such as legal requirements and citizens’ needs for a better quality of life [5].

1.2. The Urban River Restoration Approach and Its Challenges

From a new perspective on urban rivers and streams, which considers the integration of these natural assets into the urban fabric as spaces with environmental, social, recreational, cultural, and economic potential, river restoration is presented as an attempt to reverse the degradation of highly modified ecosystems [4]. In this sense, river restoration practices appear as a great opportunity for the “resurgence” of water in the city, enhancing the local microclimate by increasing moisture levels and lowering temperatures in the ecosystem, as well as creating urban green areas combined with leisure and tourism areas and multifunctional landscapes, which are capable of adding hydrological and hydraulic functions to urban structures and public spaces, such as parks and plazas [6]. River parks can also add environmental functions to the built environment, enabling increases in urban biodiversity, in order to provide economic viability for the implementation and maintenance of these areas, and not just as an urban drainage solution [7].
By aligning urban planning with watershed management principles, improvements in urban infrastructure can be achieved, significantly enhancing urban quality of life and addressing the negative environmental externalities of urbanization. For this reason, river restoration projects, by leveraging these interconnected benefits, have garnered growing interest due to their potential to simultaneously restore environment health and improve well-being [8].
Angelopoulos et al. [9] proposed an integrated project planning framework for restoration projects based on project management techniques. This framework is divided into four stages:
  • Project identification: This stage aims to locate and prioritize reach-scale restoration projects, in the way that smaller scale projects work with a catchment approach. It is comprised of a (i) review of the current ecological status of the water body and/or other aquatic resources; (ii) identification of water body goals and specific objectives; (iii) identification of regional policy objectives; and (iv) catchment scale planning to locate and prioritize reach-scale restoration.
  • Project formulation: At this stage, the identified projects and their initial estimates and indicators are further explored, refined, and more thoroughly detailed. It is comprised of a (i) comparison of ecological status with objectives; (ii) identification of issues affecting the water body (directly and indirectly) and appropriate actions; (iii) review and selection of appropriate techniques; (iv) justification of the prioritization of restoration projects; (v) monitoring design and definition of key indicators.
  • Project implementation: This is the stage of the implementation itself.
  • Project monitoring and evaluation: The objective of this stage is to evaluate river health and assess benefits. It is comprised of (i) monitoring and evaluation; and (ii) the updating of goals and restoration management actions.
However, to achieve all these stages, river restoration projects face challenges. Restoring rivers is often an expensive and lengthy process [10], especially in areas of heavily degraded and artificialized rivers with higher added value [11]. In addition to planning and design costs, some restoration projects may involve, for example, the construction costs of relocating or extending dikes, land acquisition costs, bank stabilization costs, and other construction or investment costs [12]. Land acquisition may also necessitate complex negotiations with multiple landowners, resulting in adapted or only partially implemented restoration projects [13]. All these issues demonstrate the importance of prioritizing areas for river restoration management practices. Even if major interventions may not be feasible, any effort towards river restoration, even partial, can be beneficial to the urban environment [11].

1.3. Environamental Services as an Ally of Urban River Restoration

Some efforts have been made to try to justify investments in urban river restoration projects [10] and thus convince different stakeholders about their implementation. Kumar et al. [14] demonstrated the effectiveness of river restoration by considering the environmental, social, and economic impacts of the project (although, a lack of social inclusion in participatory processes for long-term water management was emphasized).
Historically, urban planning and watershed management decision-making have often overlooked the diverse environmental services provided by aquatic and terrestrial ecosystems, leading to missed opportunities for addressing broader urban challenges [15,16]. Environmental services in urban areas can provide numerous benefits, such as supporting food security, increasing urban resilience, regulating the water flow, reducing surface runoff, and mitigating urban flooding, as well as community benefits, such as access to green spaces and recreation. These services also contribute to decreasing the urban heat island effect and improving air and water quality [17].
In recent years, various studies have been conducted to assess the success of river restoration projects, considering the implications for the watershed and focusing on impacts such as flood mitigation and water quality improvement. Vermaat et al. [18] indicated that human population density influences the provision of environmental services, emphasizing the relationship between landscape appreciation and flood risk reduction.
Environmental services can effectively engage stakeholders in urban river restoration: they can enhance the appreciation and comprehension of nature and its conservation and support justifications for conservation funding. Nonetheless, identifying and demonstrating environmental services may not be an easy task, due to the difficulty of converting existing scientific insights on environmental services into actionable strategies and empirical arguments. This also presents a challenge when determining or prioritizing suitable management actions or communicating environmental services to the public [19].
The present work investigates new methods for improving urban river management by recognizing the environmental services they provide, considering the limits on achieving this objective, especially in an urban environment. A methodological procedure is proposed to the stage of project identification, in order to assist public managers in making decisions about the hierarchization of areas for urban river restoration, based on the environmental services approach, through a set of supporting indicators to measure the environmental condition of a watershed. In Brazil, river intervention projects often focus on isolated issues, without adopting a systemic approach that encompasses the entire watershed. Traditional management alternatives have proven insufficient, frequently exacerbating impacts, particularly in urban areas [20]. Therefore, the methodology proposed in this research aims to address a significant gap in urban planning for Brazilian cities. Its dynamic and adaptable framework allows for replication in new studies by tailoring interpretations to specific applications in areas with distinct characteristics.
As a case study, this paper presents a cross-evaluation methodology applying a critically index developed for restoration and spatially explicit planning opportunity layers to demonstrate how environmental services can be incorporated into urban watershed management. The case study used an urban watershed in the city of Niterói, in Rio de Janeiro metropolitan area, Brazil, which was chosen due to its recognition as a national and international reference for urban sustainability projects. Notably, since the implementation of the Parque Orla Piratininga (POP) project, the city has been recognized as a pioneer in the application of nature-based solutions (NbS) in Brazil [21].

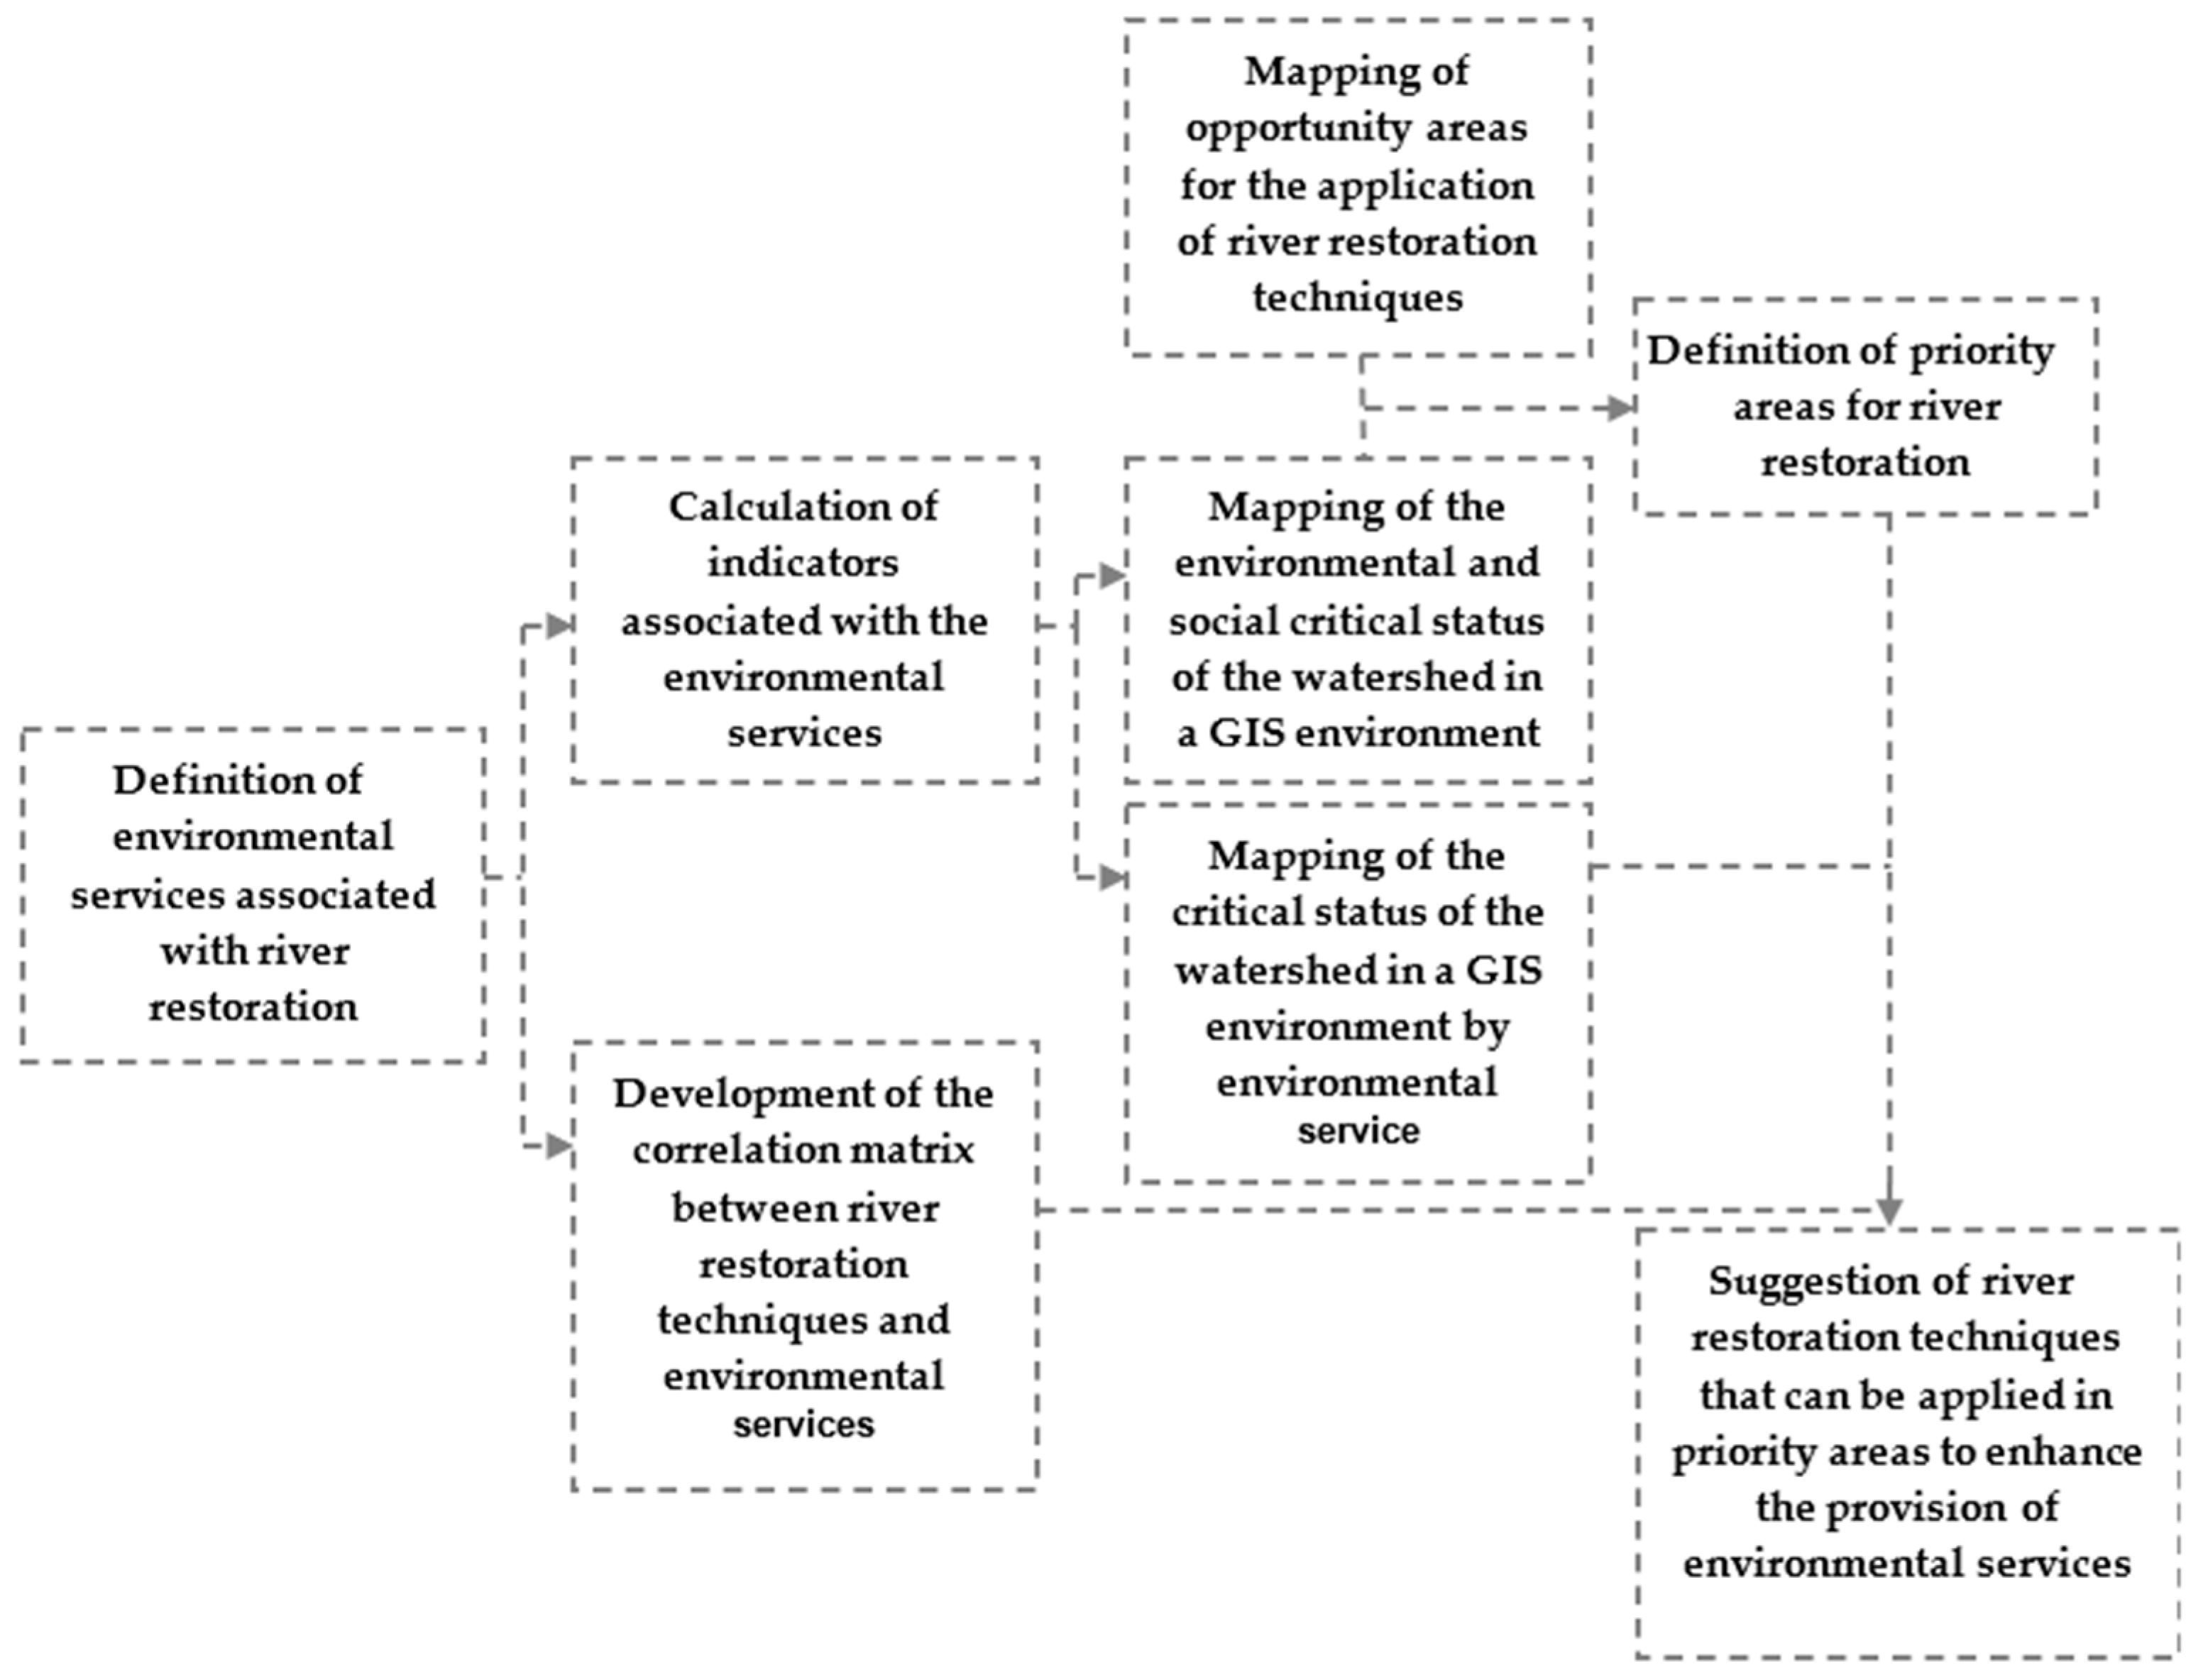
2. Materials and Methods

Improving the ecological condition of a river depends on adopting a holistic perspective that considers the management of the watershed as a whole [3]. Therefore, we considered the watershed as the foundational unit for planning and design, as its ecological health directly influences the range and quality of environmental services it can provide.
This study sought to demonstrate the conceptual framework and explore ways to measure and support river restoration projects in urban watersheds, where environmental services help identify the most suitable areas—with better outcomes—for implementing this type of management practice. The methodological procedures involved three different stages.
The first stage entailed a literature review to identify the main objectives pursued in river restoration projects around the world, with an approach centered on the analysis of these objectives. For this purpose, articles were consulted, as well as manuals about river restoration techniques developed by river restoration centers in various countries, as presented in Appendix A. Based on this survey, it was possible to relate river restoration projects worldwide with environmental services, highlighting the integration of these concepts and bringing into the discussion aspects that are typically overlooked in decision-making about the feasibility of investments in environmental projects. Thus, an inference was made about the category and environmental service identified for each objective found. Subsequently, based on an analysis of the bibliographic research, a correlation matrix was created for certain river restoration techniques and their associated environmental services, based on the Methodological Guide for Implementing Green Infrastructure presented by the Technological Research Institute of the State of São Paulo (Brazil) [22].
The second stage consisted of identifying representative indicators of environmental services related to river restoration. Methodologies, criteria, and indicators for river restoration in general were analyzed, as well as indicators of other methodologies that employed an environmental services approach. After identifying indicators deemed suitable for this methodology, it was then necessary to establish criteria for classifying the values of these indicators on a common scale. In order to maintain simplicity and allow a more qualitative assessment, a scale ranging from high, medium, to low criticality conditions was adopted for the area assessed for the river restoration. The term “criticality condition” adopted in the methodology proposed here addresses a general diagnosis of a watershed based on environmental and social indicators, considering the relevant aspects for the restoration of a river. It is important to highlight that the environmental and social diagnosis of a watershed may involve the use of several indicators. However, the focus of this research was the search for indicators that refer to river restoration, even at the watershed scale. Based on the overlap of the selected indicators, the criticality index for watershed restoration (CIWR) was proposed.
To determine priority areas for the application of river restoration techniques, the third stage was inspired by the “spatial constraints on the selection of reserves” stage of the systematic conservation planning methodology [23] used to identify priority areas for conservation and/or restoration. According to this methodology, these priority areas are defined by considering spatial constraints. These spatial constraints may include (i) the costs (for example, areas available for commercial uses or infrastructure implementation, areas with high/low acquisition costs, areas with high/low ongoing costs associated with management and maintenance); (ii) commitments (areas that must be selected regardless of their contribution to targets, such as existing reserves); (iii) masks (areas to be excluded from selection, for example, areas used intensively for agriculture); and (iv) preferences (areas with preferred characteristics for conservation over others, such as areas with low human population density). Thus, areas with desirable characteristics that have less spatial constraints are prioritized by the system over those with more spatial constraints [20]. In this way, the classification of priority areas for the application of river restoration techniques was defined based on an “opportunity” layer, as a spatial constraint, which identifies areas that are more or less favorable for implementing river restoration management practices. The “opportunity” layer can be defined in a workshop with experts and should reflect the reality of each study region.
The proposed set of indicators, discussed further in specific sections, were applied to the João Mendes watershed in the Oceanic Region of Niterói, southeast Brazil. This river is the main contributor to the Itaipu Lagoon. Aiming to allocate river restoration techniques, the study adopted a spatial analysis, using geoprocessing techniques as a tool, specifically employing the QGIS software. For each selected indicator, a map was created listing areas with low, medium, and high criticality for management practices aimed at river restoration, thereby increasing the provision of environmental services through this practice. By overlaying all maps and the “opportunity layer”, it was possible to identify priority locations for implementing river restoration techniques.
Using a correlation matrix between environmental services and river restoration techniques, the method is expected to provide guidance to public managers on which techniques to use, as well as providing information to garner support from the various actors involved in the urban context.
In summary, the methodology proposed in this study includes five steps for selecting areas and river restoration techniques for watersheds, as described below:
  • Understanding river restoration techniques and their associated environmental services;
  • Assessing the current environmental and social criticality condition of the watershed under study through indicators;
  • Assessing the current criticality condition of the watershed under study regarding the environmental services, through indicators and definition of the objectives of the restoration project considering the most deficient environmental service;
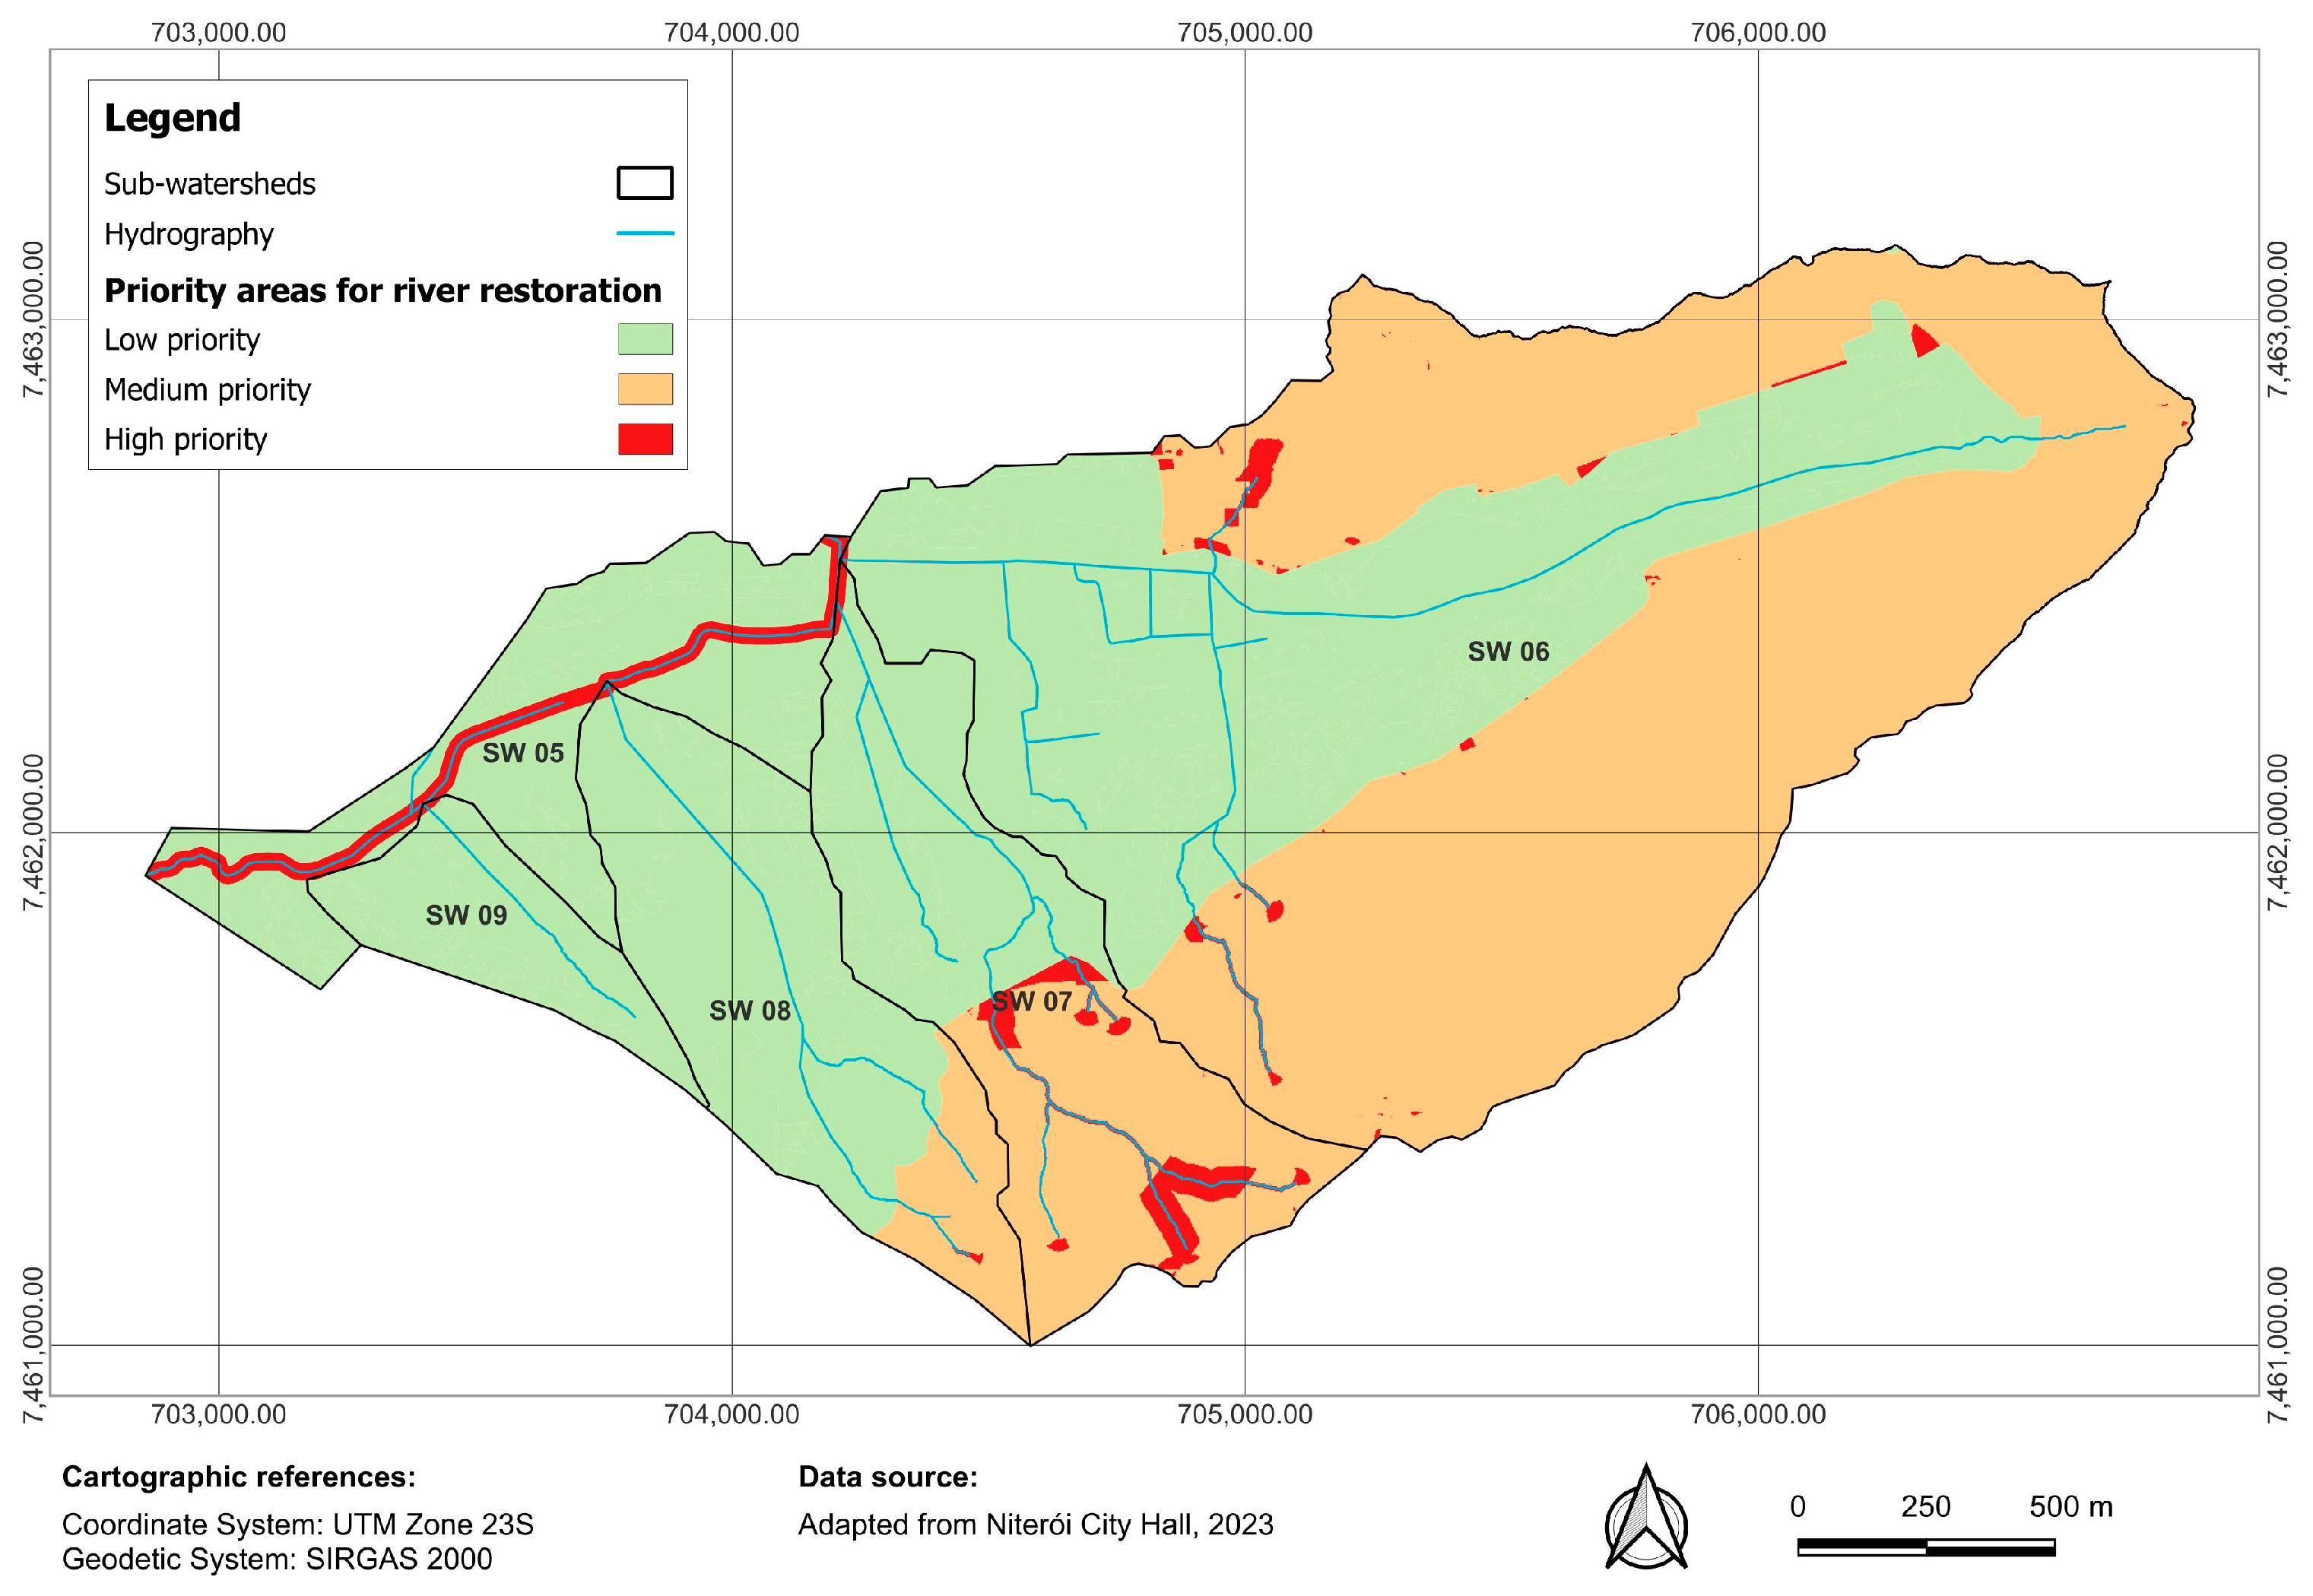
  • Defining priority areas to enhance the provision of environmental services by implementing river restoration techniques;
  • Selecting appropriate river restoration techniques for the watershed.
The schematic diagram presented in Figure 1 illustrates the steps to be followed for the application of the methodology.

3. Correlation Matrix Between Environmental Services and River Restoration Techniques

For the development of a matrix tool for urban river restoration, considering the potential of river restoration techniques to enhance environmental functions, the following categories of ecosystem services presented by the Common International Classification of Ecosystem Services (CICES) [24] were used as a basis: provisioning, regulating, and cultural. The supporting category was not included in this work, as this classification aimed to identify final services related to the goods and benefits valued by people, while the supporting category represents the services that contribute to the production of other services.
Furthermore, this study adopted the term “environmental services”, as it is understood to better fit the context of urban river restoration, where human intervention occurs. Thus, based on the bibliographic analysis conducted, it was possible to consolidate the main objectives highlighted in river restoration projects practiced worldwide. It was noted that these objectives can be translated into the terms of environmental services related to the practice of river restoration.
The primary environmental services associated with urban river restoration were selected and a correlation matrix tool of these environmental services with the river restoration techniques adopted in various projects around the world was developed to illustrate the approach. This list of techniques is not exhaustive, as each site has specific characteristics that must be taken into account when choosing the most appropriate river restoration technique to adopt.
The matrix presented in Table 1 shows the main environmental services related to river restoration and some examples of associated techniques. This association was divided into three categories: (i) direct—when the literature on river restoration documented the technique for a specific purpose, in this case, the environmental service in question; (ii) indirect—when there was no direct documentation of the purpose (environmental service) in the literature on river restoration, but the relationship could be inferred (as described in Table 2); (iii) no relationship was identified, whether direct or indirect. Over time, and with the development of urban river restoration projects, it is possible that some items in the matrix where “no relationship was identified” or “an indirect relationship was identified” may eventually be classified as having a direct relationship with a specific environmental service. Therefore, this matrix has a dynamic and adaptable character, which can be updated with new studies.
Knowing which environmental services are most deficient in a given mapped area, it is possible, through consultation of the correlation matrix between river restoration techniques and environmental services, to identify the group of techniques most suitable for implementation in the area, taking into account, of course, the available resources. The identification of the most deficient environmental services in a given study area will be presented in the following items.
Based on the key environmental services identified, a study of indicators was conducted to assess priority locations for the implementation of river restoration techniques within a given watershed.

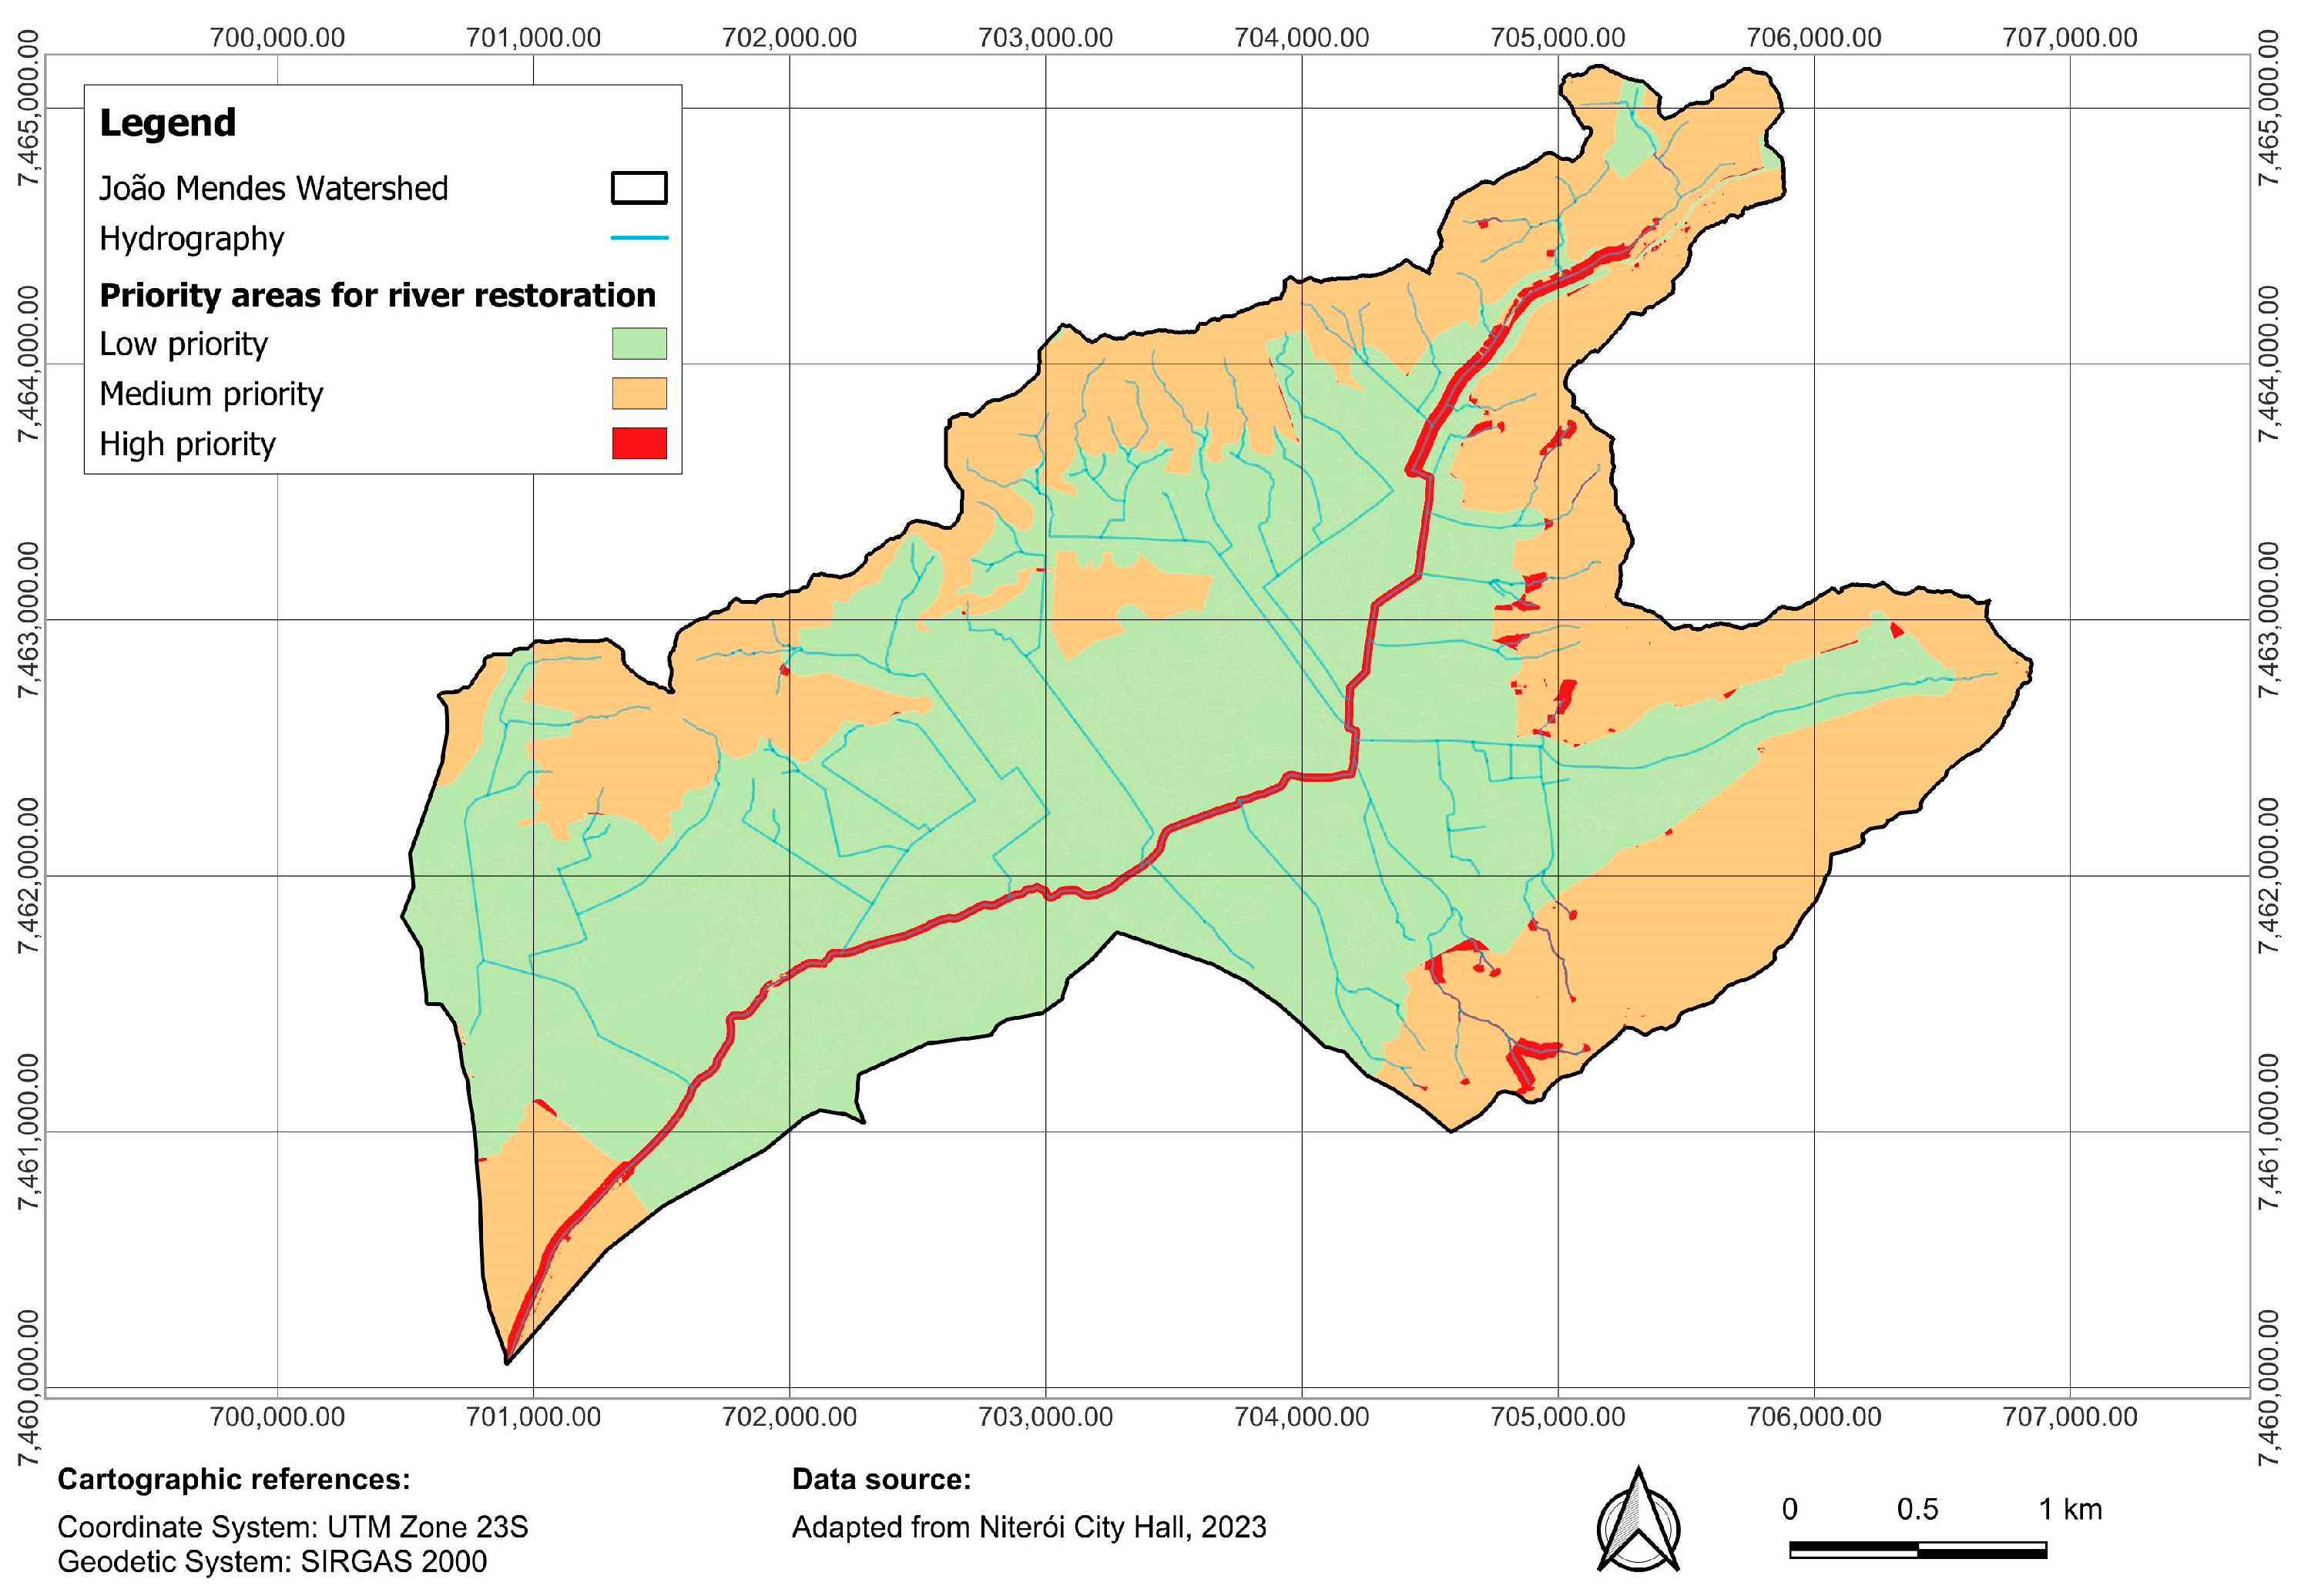
4. Urban River Restoration Indicators and Definition of Priority Areas for Urban River Management Practices

Based on the correlation matrix presented above for studies on urban river restoration, the selection of indicators related to the environmental services outlined was carried out to characterize the criticality condition of watersheds, drawing from a literature review of studies related to urban river restoration and environmental services.
This work recommends the use of nine indicators. Table 3 presents the indicators, their references, the methodology for obtaining them, and parameters for classifying criticality. To classify the values of the indicators on a common scale, a grading system was adopted that ranges from high, medium, to low criticality, along with a score for each classification: 3 for high, 2 for medium, and 1 for low criticality.
Criticality index for watershed restoration (CIWR) maps can be generated by combining the nine indicators described above. The values must be assigned as presented above for each pixel in every map of each indicator. It is also possible to establish weights for each indicator by multiplying the value of each pixel by the assigned weight. Thus, the CIWR is given by Equation (1):
CIWR = p1 × I1 + p2 × I2 + p3 × I3 + p4 × I4 + p5 × I5 + p6 × I6 + p7 × I7 + p8 × I8 + p9 × I9
where pn is the weight of the nth indicator; and In is the indicator according to Table 3. The final criticality classification is given as follows: low for 0 ≤ CIWR ≤ 1; medium for 1 ≤ CIWR ≤ 2; and high for 2 ≤ CIWR ≤ 3.
The calculation of the CIWR allows for two different analysis paths, depending on the interests of the specialists involved in applying the methodology. The first path refers to assessing the critical condition of different watersheds in a specific area (such as the boundaries of a municipality, state, or geographic region, for example) to identify one or more watersheds in the worst condition, where efforts for river restoration are desired. Thus, it is possible to classify the watersheds based on the CIWR results, which proves to be a useful management tool. Within this same context, the involved stakeholders may also choose not to select a specific watershed, but rather to implement measures across the different watersheds evaluated, according to the critical condition classifications and the mapped priority areas, as will be explained in the following paragraphs. The second path that can be followed is when a watershed has already been chosen, based on some specific interest or other prior studies, and the goal is simply to select priority areas for river restoration within this specific watershed. In this case, it is necessary to evaluate the scale of the chosen watershed, the critical condition results, and the priority areas obtained, which may require dividing the watershed into smaller territorial units. This aspect will be illustrated in the case study presented next.
The CIWR provides an overview of the conditions of each part of the territory, regarding its environmental and social status. However, urban river restoration faces one of its main challenges: the availability of land for implementing river restoration techniques, considering the current land occupation within urban watersheds. Therefore, strategies must be developed to prioritize areas for river restoration.
On the one hand, areas with a high CIWR are more environmentally degraded and provide fewer environmental services to the population; thus, implementing river restoration techniques in these areas could improve this critical scenario. However, these areas tend to present greater obstacles, especially financial and social challenges, as they may require expropriations and significant investments. On the other hand, areas with a low CIWR are already in better environmental health and provide more environmental services to the population. Nonetheless, they are not densely urbanized, which may facilitate the application of river restoration techniques. Additionally, these areas should be conserved to prevent them from becoming areas with medium or high CIWR.
To present a simple and easily applicable methodology, this study does not propose the use of a cost layer. For defining priority areas for river restoration, it is proposed to overlay a new layer onto the criticality condition map of the watersheds under study, referred to as the “opportunity” layer. This layer may vary from case to case, depending on the characteristics of the watershed being studied and could include, for example, areas with economic potential for tourism, public domain areas, and legally protected areas, among others.
Thus, the classification of priority areas for the application of river restoration techniques is provided by the following matrix, as shown in Table 4:

5. Definition of the Criticality Condition of Watershed Areas by Environmental Service

The methodology proposed here also allows for mapping the criticality condition of watersheds in relation to each of the considered environmental services. The calculations of the criticality condition indicators for each environmental service are shown below (Equations (2)–(10)) in Table 5, assuming equal weights and simply averaging the indicator values, as this study focuses on a methodological proposal rather than the definition of the most appropriate weights. Each indicator for each environmental service was constructed from the sub-indicators that most influence that environmental service.

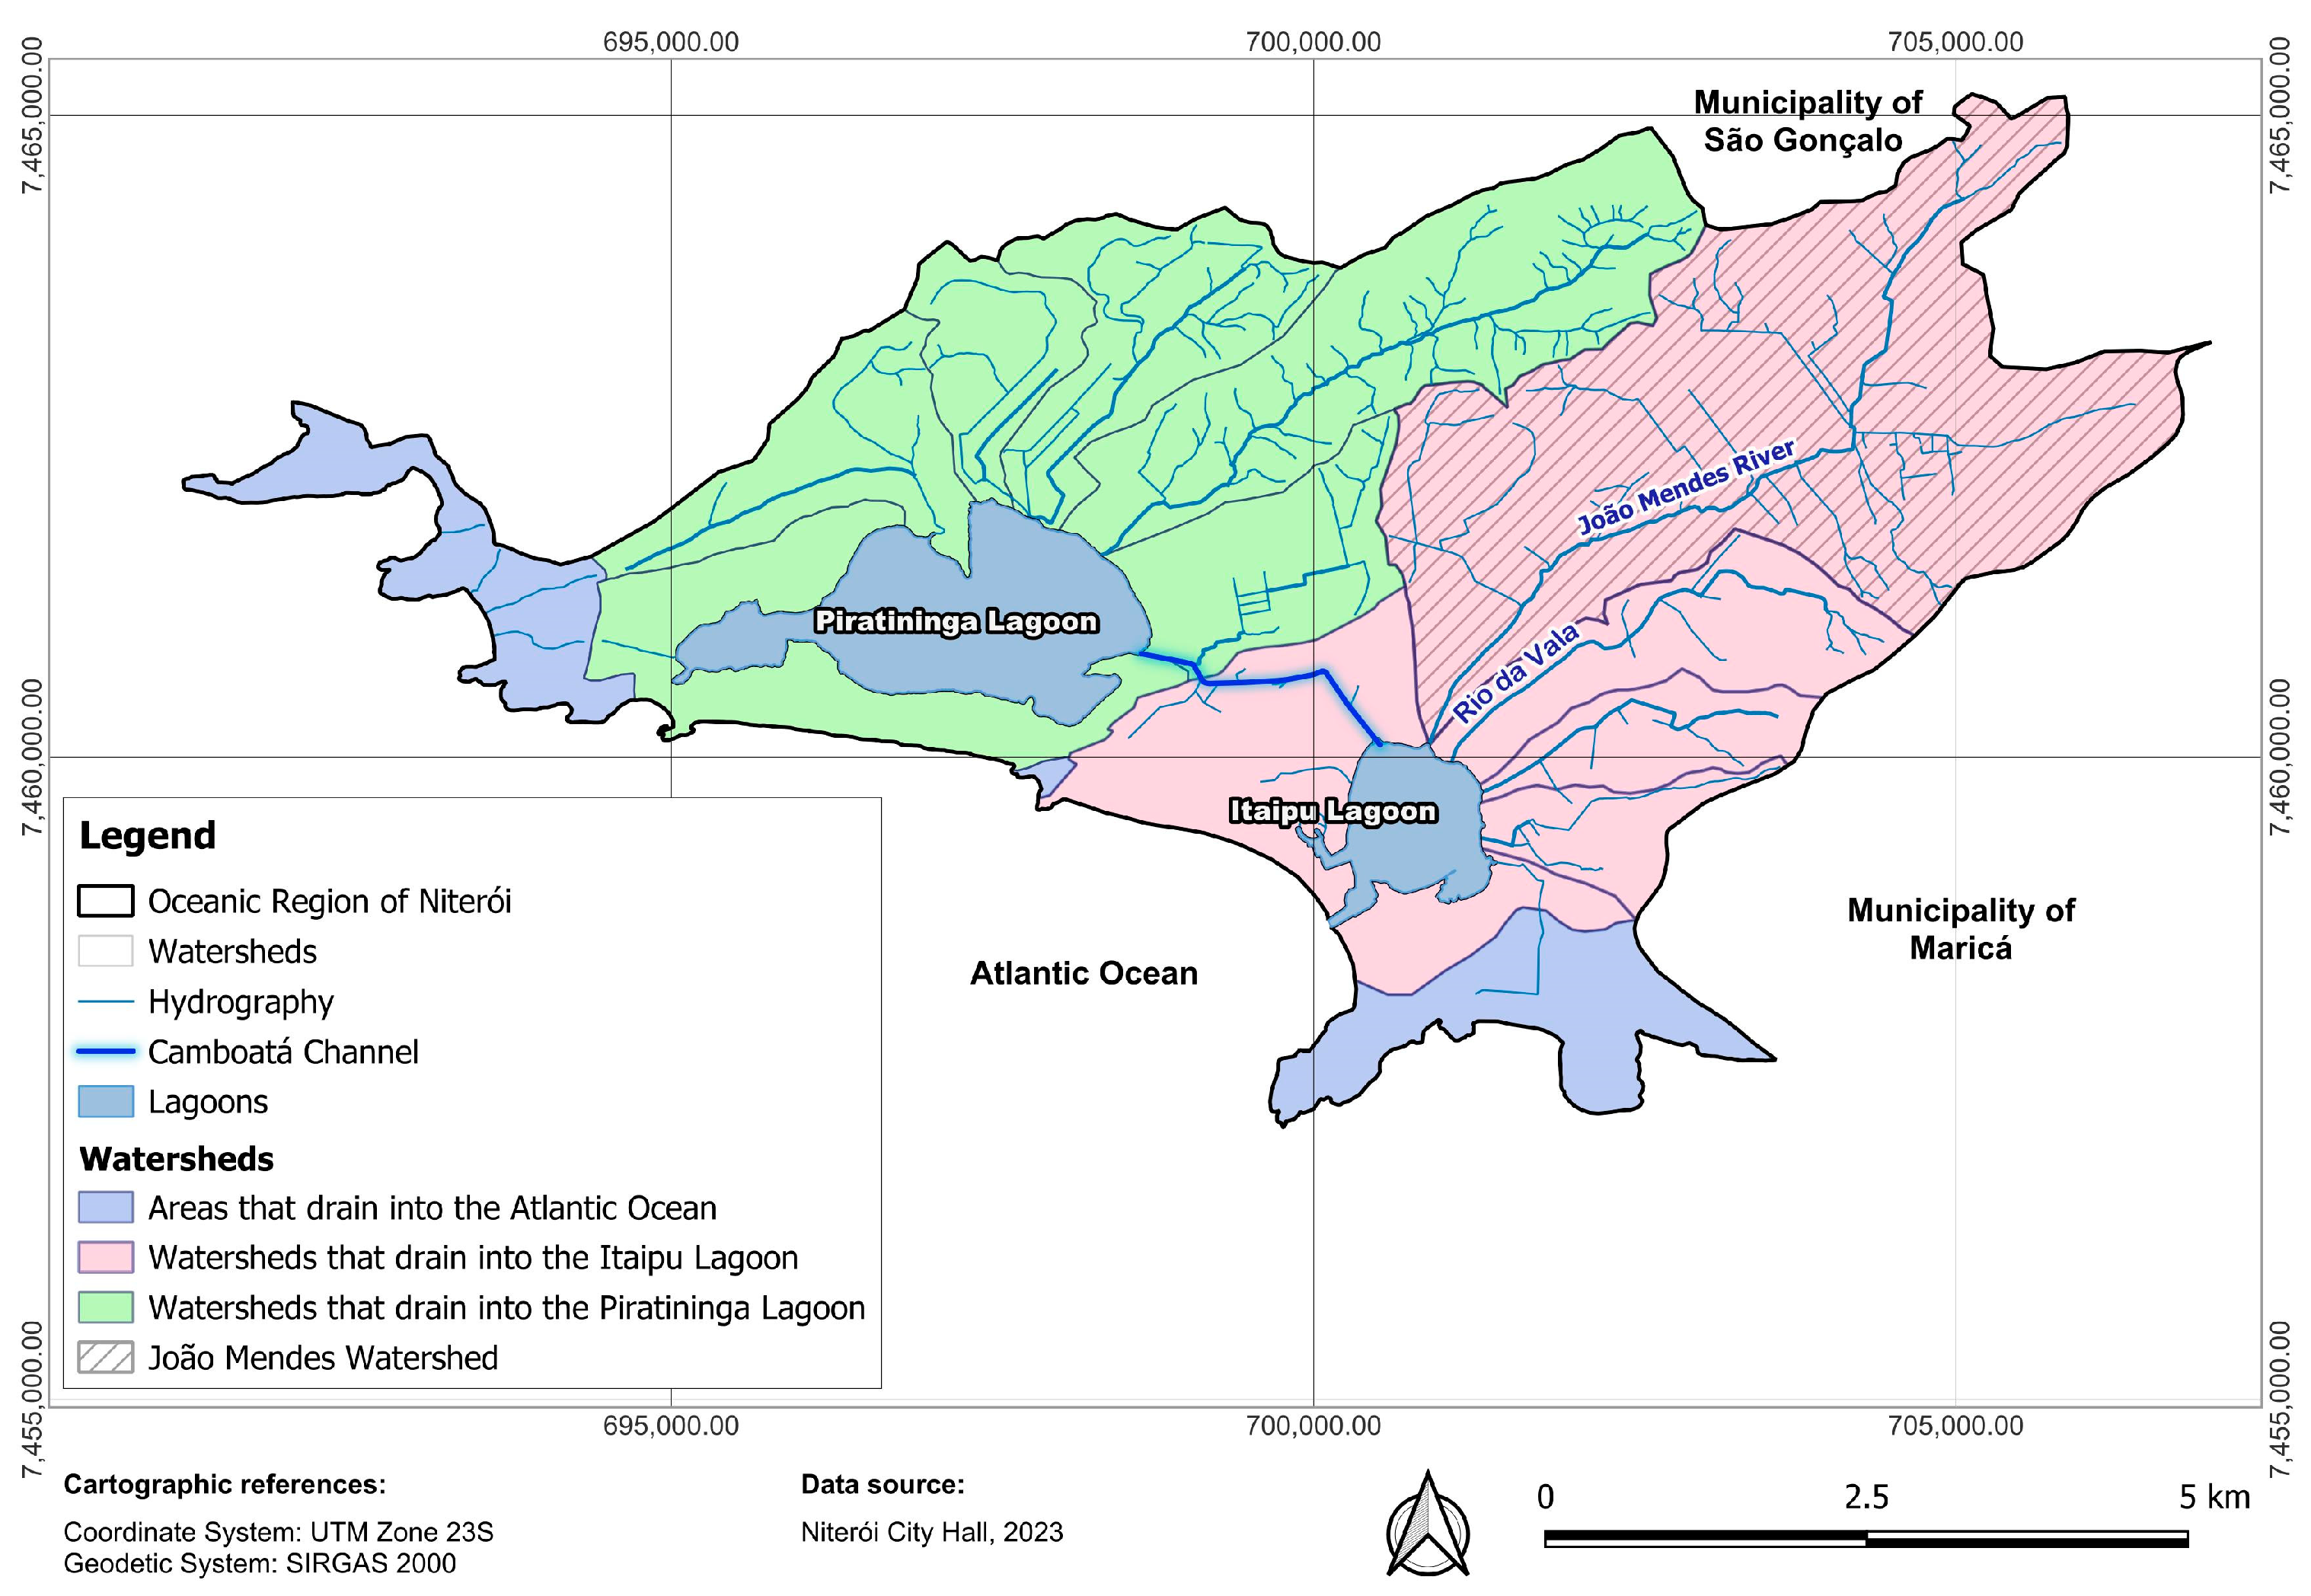
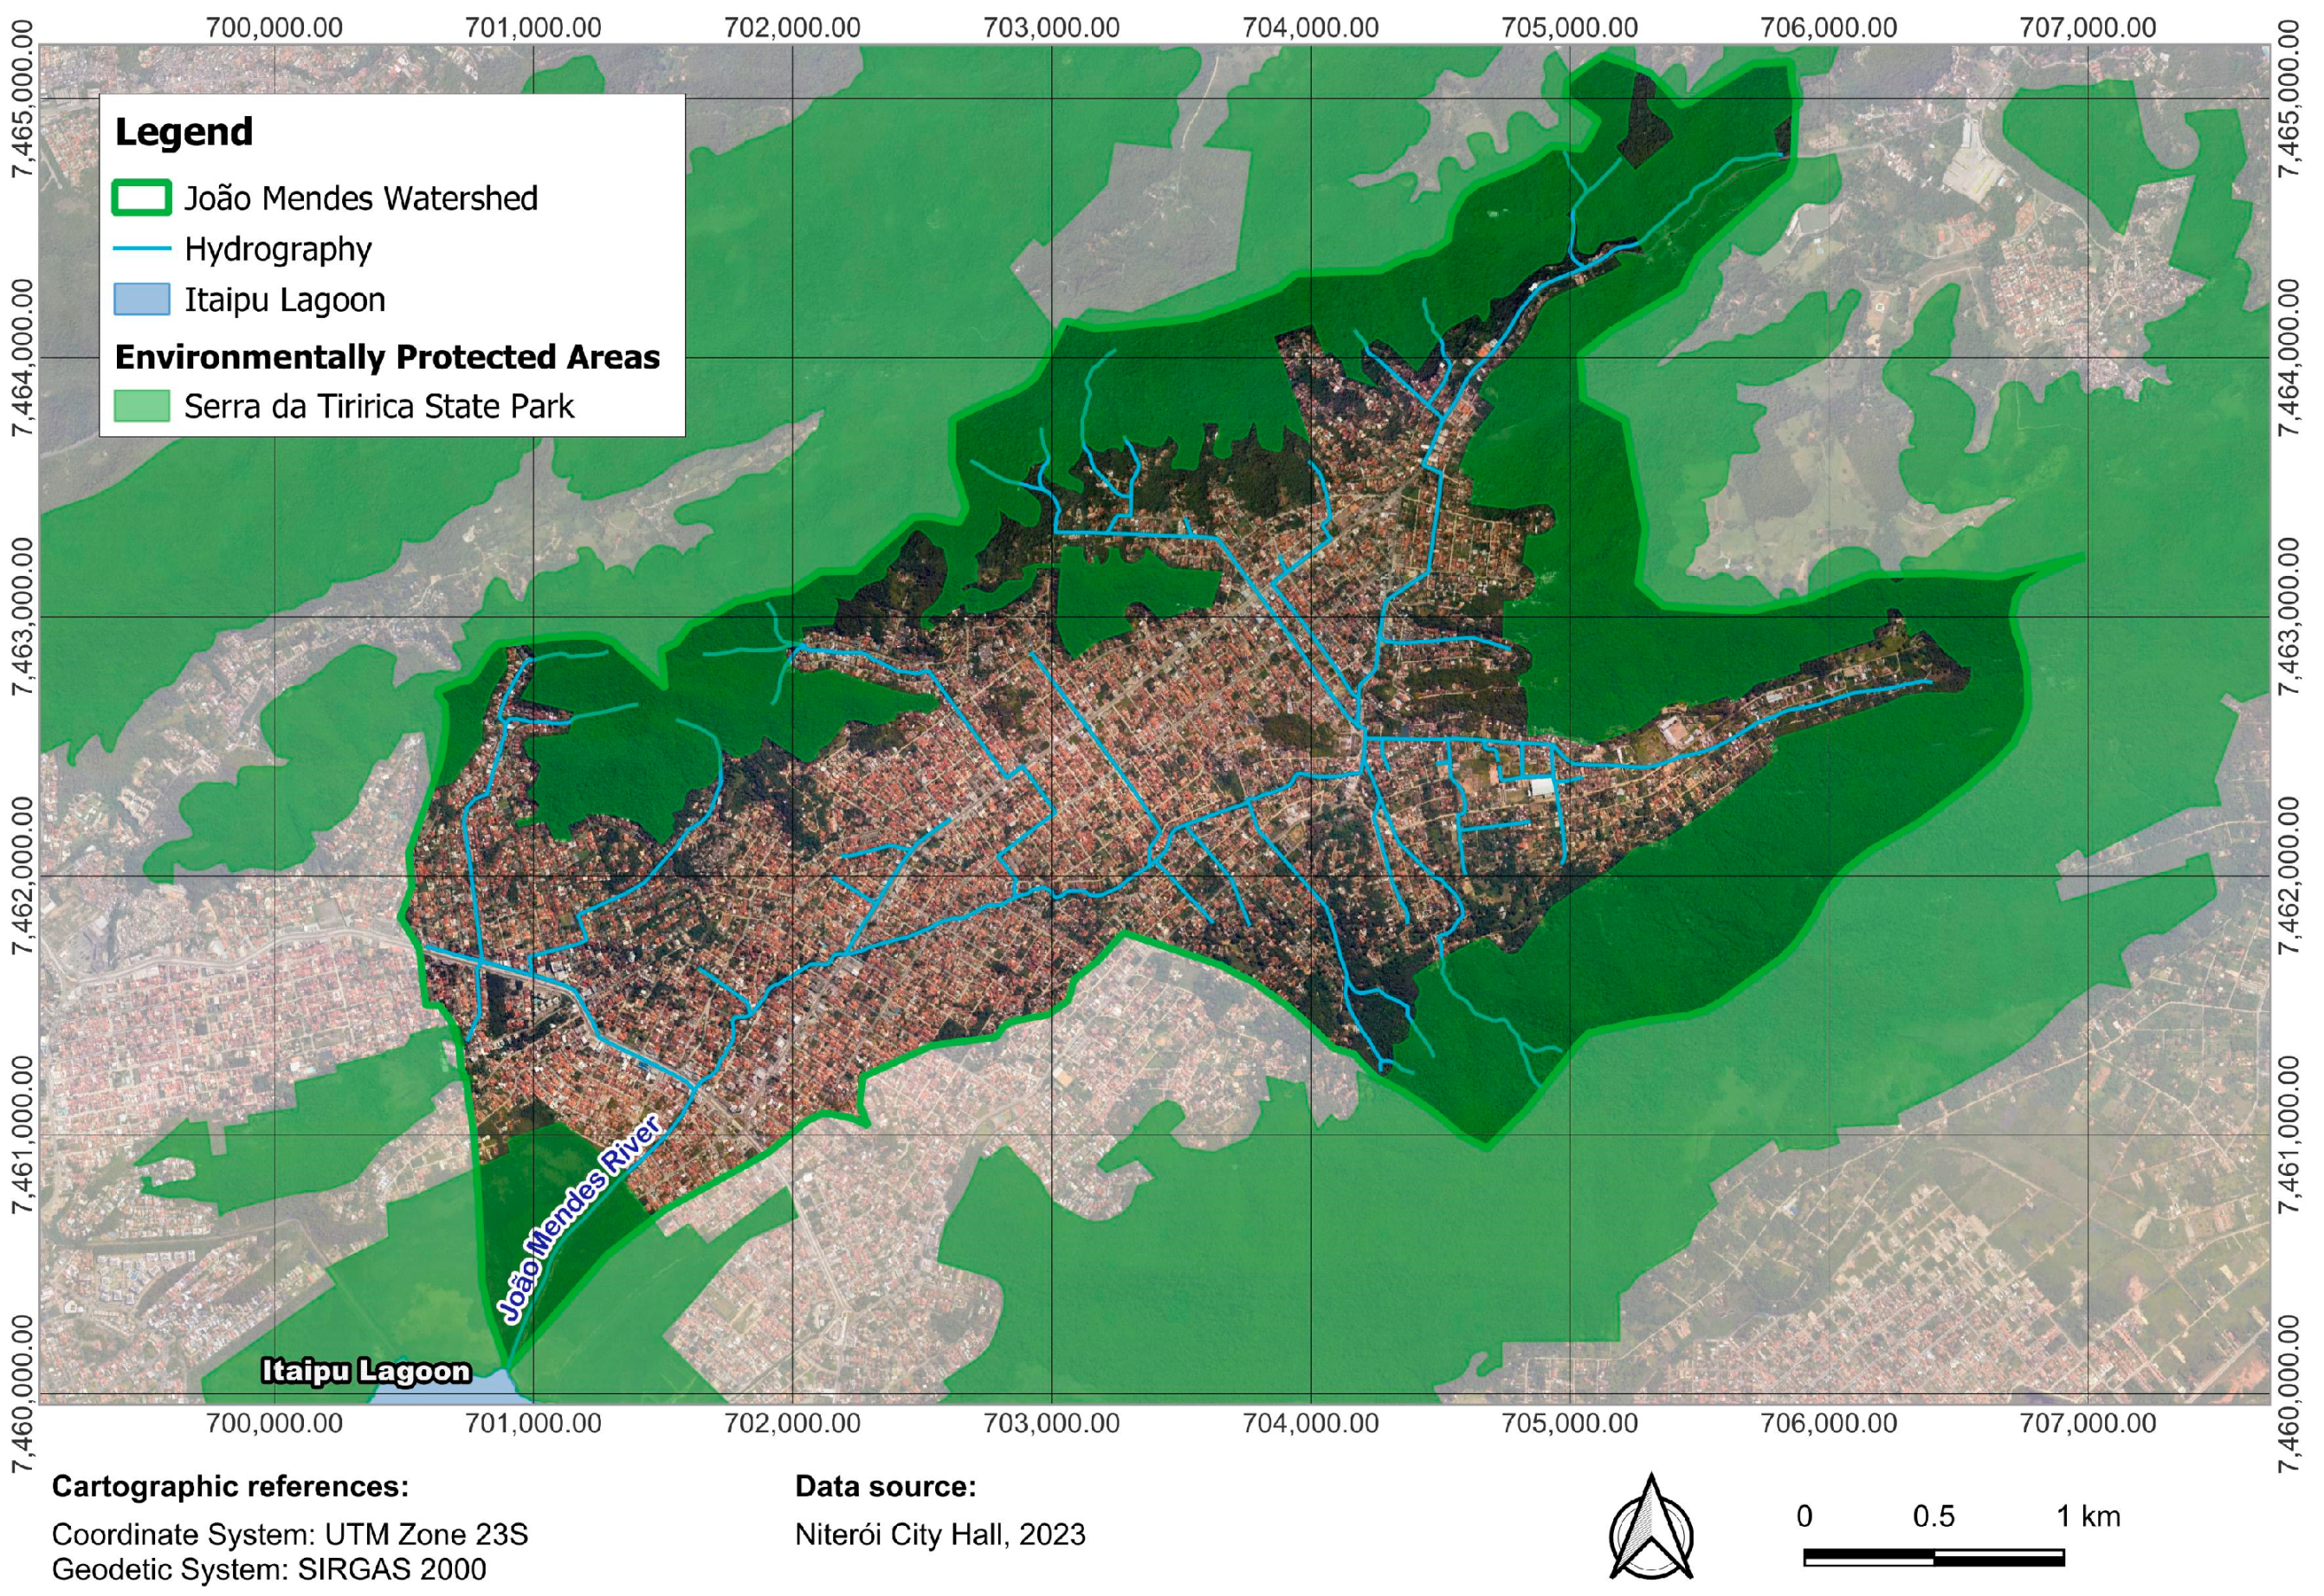
6. João Mendes Watershed: A Case Study in Niterói, Southeast Brazil

The municipality of Niterói is located in the State of Rio de Janeiro, southeast Brazil. It has three major watersheds: the Guanabara Bay Watershed, the Alcântara and Aldeia Rivers Watershed, and the Oceanic Region Watershed. The Itaipu-Piratininga Lagoon System is a coastal environment located in the Oceanic Region of Niterói and consists of two lagoons connected to the sea and interconnected by an artificial channel, the Camboatá Channel, as shown in Figure 2.
Most rivers and streams in the Oceanic Region of Niterói originate in well-preserved forest areas. However, in their lower sections, their natural courses have been altered and channeled due to the intense urbanization that has occurred over the years. This urbanization has led to significant settlement along their banks, disregarding their legally protected environmental buffers [47]. The rapid influx of water drained from the slopes tends to worsen with the sealing of low-lying areas that are naturally prone to flooding, causing the rectified rivers and channels to overflow [48]. During the dry season, another common characteristic among these water bodies is the low flow observed. Additionally, a significant portion of this flow consists of illegally discharged domestic sewage. Studies show that the watersheds of the Itaipu Lagoon are the primary contributors to the pollution of the Itaipu-Piratininga Lagoon System, particularly the João Mendes Watershed, which is its main contributor [49]. Figure 3 shows the Oceanic Region of Niterói and its watersheds.
In addition to the degraded state of most water resources in the Oceanic Region of Niterói, the area has received significant investments in urban infrastructure, which tends to attract the real estate market and result in increased urban pressure on the region. Thus, it is urgent to adopt measures to protect the region’s water resources, preventing further deterioration, which could potentially hinder future restoration efforts.
Considering this situation, the Itaipu-Piratininga Lagoon System Subcommittee proposed the environmental restoration of the region’s rivers, emphasizing the preservation of wetlands to enable residents and visitors to engage in sustainable development in the Oceanic Region, while maintaining direct contact with nature. It further specified that the waters of the rivers can be used for (i) protecting aquatic communities; (ii) enhancing landscape harmony; (iii) primary contact recreation, at least in the upstream sections, and secondary contact in other areas; (iv) fishing; (v) providing water for animals without degrading the legally protected environmental buffers of the rivers; (vi) irrigating gardens, tree crops, and forage plants [50].
Given the interest of the Itaipu-Piratininga Lagoon System Subcomitte in the restoration of urban rivers of the region and taking into account that the João Mendes River is the main contributor to the Itaipu Lagoon and also the main contributor to the water pollution of the Itaipu-Piratininga Lagoon System, as mentioned above, its watershed was chosen as a case study. This river has a total length of approximately 7.4 km and its watershed covers an area of about 14 km2 [51]. Figure 4 shows the João Mendes River, its tributaries, and its watershed, based on data provided by the Municipal Government of Niterói.
In the upper course of the João Mendes River, there is substantial forest cover and significant slopes. This area includes an environmentally protected area named Serra da Tiririca State Park, also displayed in Figure 4. In the middle and lower courses, the river has fully occupied banks and minimal slopes. In this section of the watershed, urbanization ranges from sparse to dense as it approaches the main access roads [52]. In addition, along the lower course, near the Itaipu Lagoon, there is a protected area of the lagoon that remains undeveloped.
The next section presents how data were processed for obtaining the indicator values for the João Mendes Watershed.

7. Data Processing for Obtaining Each Indicator for the João Mendes Watershed

The study of the João Mendes Watershed began with the definition of data regarding its official boundaries and hydrology, obtained from the Municipal Government of Niterói. Topographic maps with a contour interval of 0.5 m were also acquired from the municipality.
Using this topography, a digital terrain model (DTM) of the area was generated through the TIN interpolation tool in QGIS. Subsequently, improbable depressions were filled from the generated raster file, eliminating discontinuities in the drainage layout. Based on the processed DTM, the watershed boundary was generated through geoprocessing and then adjusted. In the urban area, the official boundary set by the Municipal Government of Niterói was maintained due to anthropogenic changes in the region. The final hydrology layout considered in this study was also adapted from that presented by the Municipal Government of Niterói. In the upper course of the watershed, the watercourses presented by Galvão [52] from the years 1996 and 1976 were also considered as references. In the middle and lower courses of the João Mendes River, the hydrology provided by Municipal Government of Niterói was used, due to macro-drainage works conducted along certain sections of the river.
The processing of data for obtaining each indicator are described in Table 6:

8. Results

The results are presented in the following items, first considering the CIWR and the priority areas for river restoration interventions for the João Mendes Watershed as a whole, then presenting the criticality condition of the watershed from the perspective of the environmental services.
The same application is then shown for the João Mendes sub-watersheds. This path was chosen in this case study, given that the restoration of the João Mendes Watershed is already supported by local actors. Urban watersheds may or may not present homogeneous characteristics in their various stretches. When studying watersheds with very different characteristics, it may be necessary to reevaluate the boundaries of the studies, as negative results in a certain stretch may be neutralized by positive results in another specific stretch. As outlined during the description of the methods, the numerical result of the CIWR for a given watershed can be used as a tool for comparison purposes with other watersheds, for example, when there is interest in defining which watershed presents the greatest deficit in environmental services. This can be a criterion for choosing where to direct investments in further studies, projects, and, finally, in the implementation of river restoration techniques. However, when a certain watershed has been previously chosen for intervention, depending on its extent and characteristics, it might be a good alternative to divide it into sub-watersheds. That is the case of the João Mendes Watershed. Furthermore, given the practicality of working with GIS tools, it becomes easier to carry out a broader assessment, that is, to consider a major watershed and, from there, verify the need or not to analyze the CIWR results of smaller watersheds—as long as the scale of the data utilized is compatible with the scale of the watersheds under analysis.

8.1. The Criticality Index for Watershed Restoration for the João Mendes Watershed

Figure 5 shows the integrated CIWR map for the João Mendes Watershed. In this analysis, equal weights were assigned to all nine indicators, each equivalent to 1/9. This was a straightforward choice aimed merely at testing, without using the option of weighting to highlight the key local processes, as should be done practically through discussions with stakeholders, users, and local communities.
The CIWR of the João Mendes Watershed is 0.97. Therefore, it is a watershed with a low criticality condition according to the river restoration criteria, but it is very close to the medium criticality condition, which represents a point of attention for this watershed. If local actors, aiming to improve the environmental and social quality of the Itaipu-Piratininga Lagoon System, had not yet chosen or did not have enough information to choose in which watershed river restoration techniques should be best implemented, the CIWR could be a tool to facilitate this choice, by comparing the results of all watersheds of the system. That is not the case of the João Mendes Watershed, since the Municipality of Niterói had already carried out other studies and had identified that this watershed has the greatest impacts on the water pollution of the system. For this reason, in the next sections, the CIWR will be applied to the João Mendes sub-watersheds.
Another possible use for the CIWR would be to compare their values, considering the same watershed, before and after the application of river restoration measures. This applicability was not developed here, as it was not the initial objective of the proposed methodology.
Following on to the next step of the methodology, the opportunity layer was represented solely by areas protected by law enforcement: the Serra da Tiririca State Park and the protected riparian zones of the João Mendes River and the Itaipu Lagoon. This choice implies using these areas as immediate resources already reserved as environmental assets.
Figure 6 presents the single opportunity layer tested for the João Mendes Watershed in this case study. By overlapping this layer with the CIWR results layer, according to the criteria indicated on Table 4, the priority areas for urban river restoration were obtained. These categorized areas are illustrated in Figure 7.
The results show that areas located in the upper portion of the territory have a medium priority for intervention, although they were mostly classified with a low CIWR, as they are part of the Serra da Tiririca State Park and represent a significant opportunity for intervention. The same occurred near the river’s mouth, in the protected area of the riparian zones of the Itaipu Lagoon.
Additionally, it can be noted that almost the entire protected riparian zone of the main course of the João Mendes River was classified as high priority for river restoration, as this watercourse has significant development along its banks. In this case, considering the main course of the João Mendes River and analyzing only the general results of priority areas for the application of river restoration techniques, this prioritization may not be effective. Given this, some alternatives could be adopted to choose areas for applying the river restoration techniques: (i) defining and using another “opportunities” layer, which takes into account, for example, the existence of free areas throughout the watershed or even close to the watercourse; (ii) separately identifying the most deficient environmental services, as well as the locations in the watershed where they occur, according to the equations presented in Table 5; (iii) analyzing the CIWR results by sub-watershed, identifying those in the worst criticality condition.
To maintain the analysis from the perspective of the legally protected areas, in this case study, it was decided to calculate the CIWR and the most deficient environmental services by sub-watersheds, as demonstrated below.

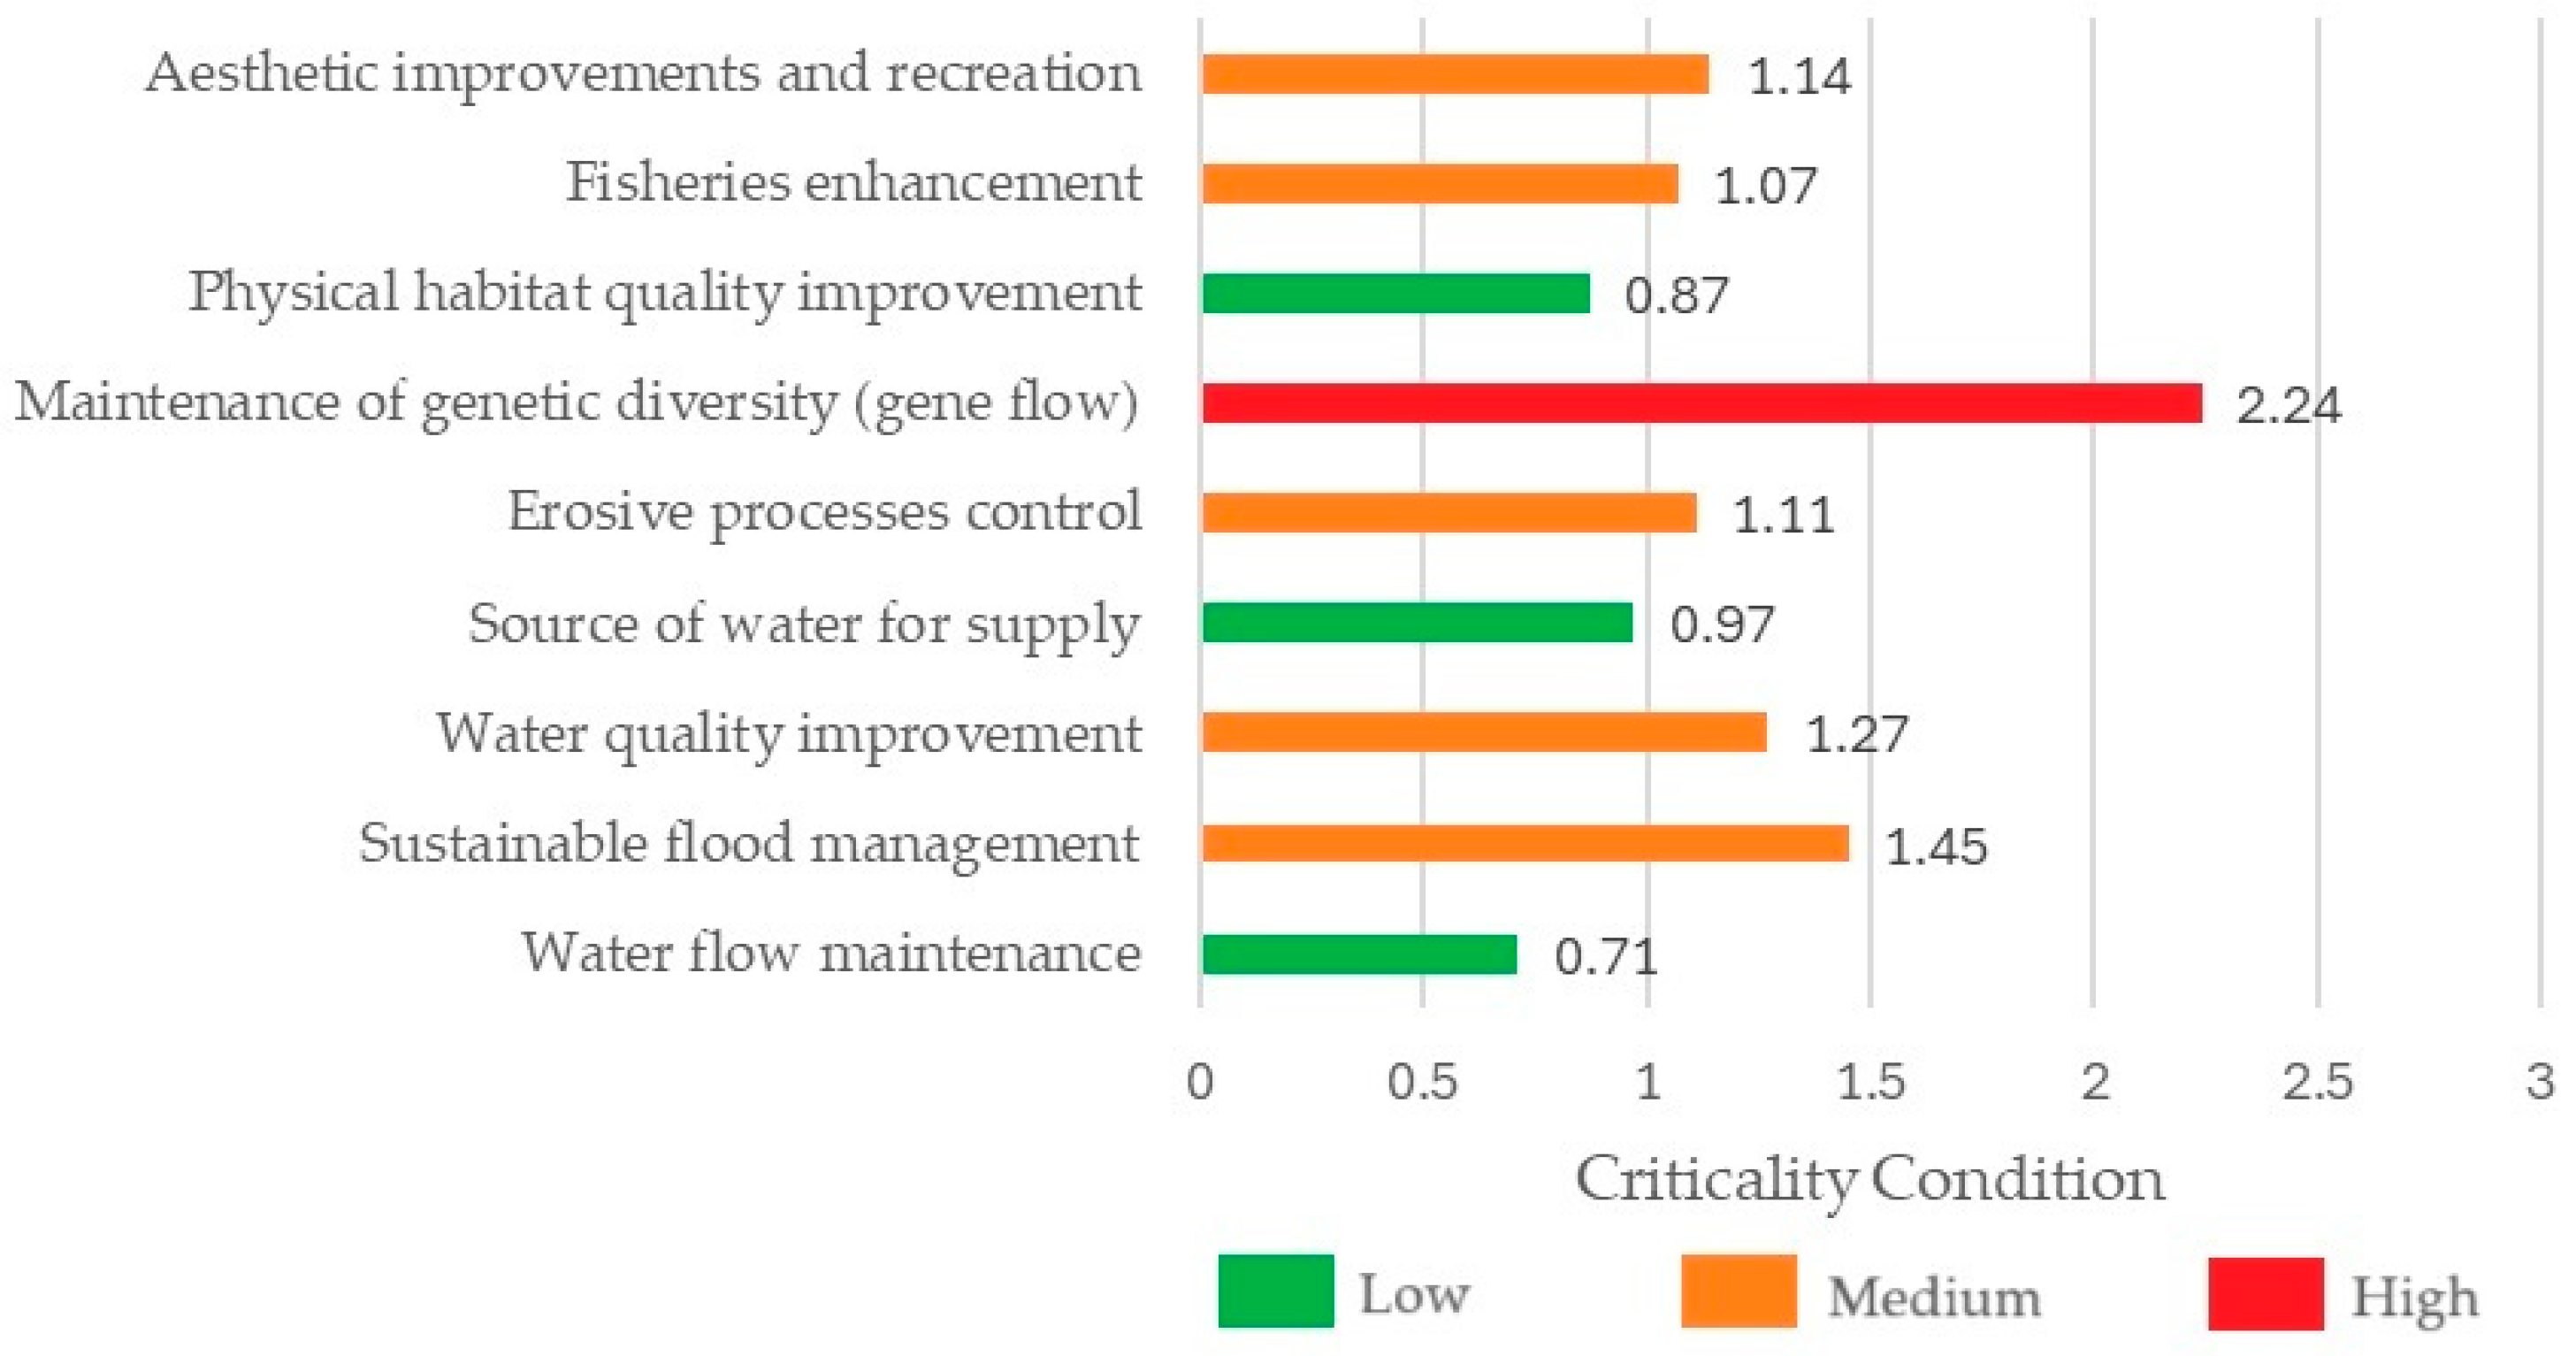
8.2. Criticality Condition of the João Mendes Watershed by Environmental Service

Based on the application of Equations (2)–(10), it was possible to analyze the criticality condition of the João Mendes Watershed from the perspective of the environmental services. Figure 8 presents the criticality condition values by environmental service.
The environmental service with the worst criticality condition in the João Mendes Watershed was the maintenance of genetic diversity, with a value of 2.24, classified as having a high criticality condition. This was due to the fact that most sections of the watercourses in this watershed lack riparian vegetation, and many stretches are paved. Following this, the environmental services with medium criticality condition were as follows: sustainable flood management, water quality improvement, erosion control, fisheries enhancement, and aesthetic and recreational improvements. These results show that when the watershed was analyzed from the perspective of the environmental services, most of them were classified as of medium criticality condition.
From these obtained results, management decisions can be made by applying restoration practices in order to improve those environmental services in the worst condition (those in medium or high criticality conditions). Managers can also make use of these results to justify to the community actions that are being taken with a view to improving environmental quality in the city.

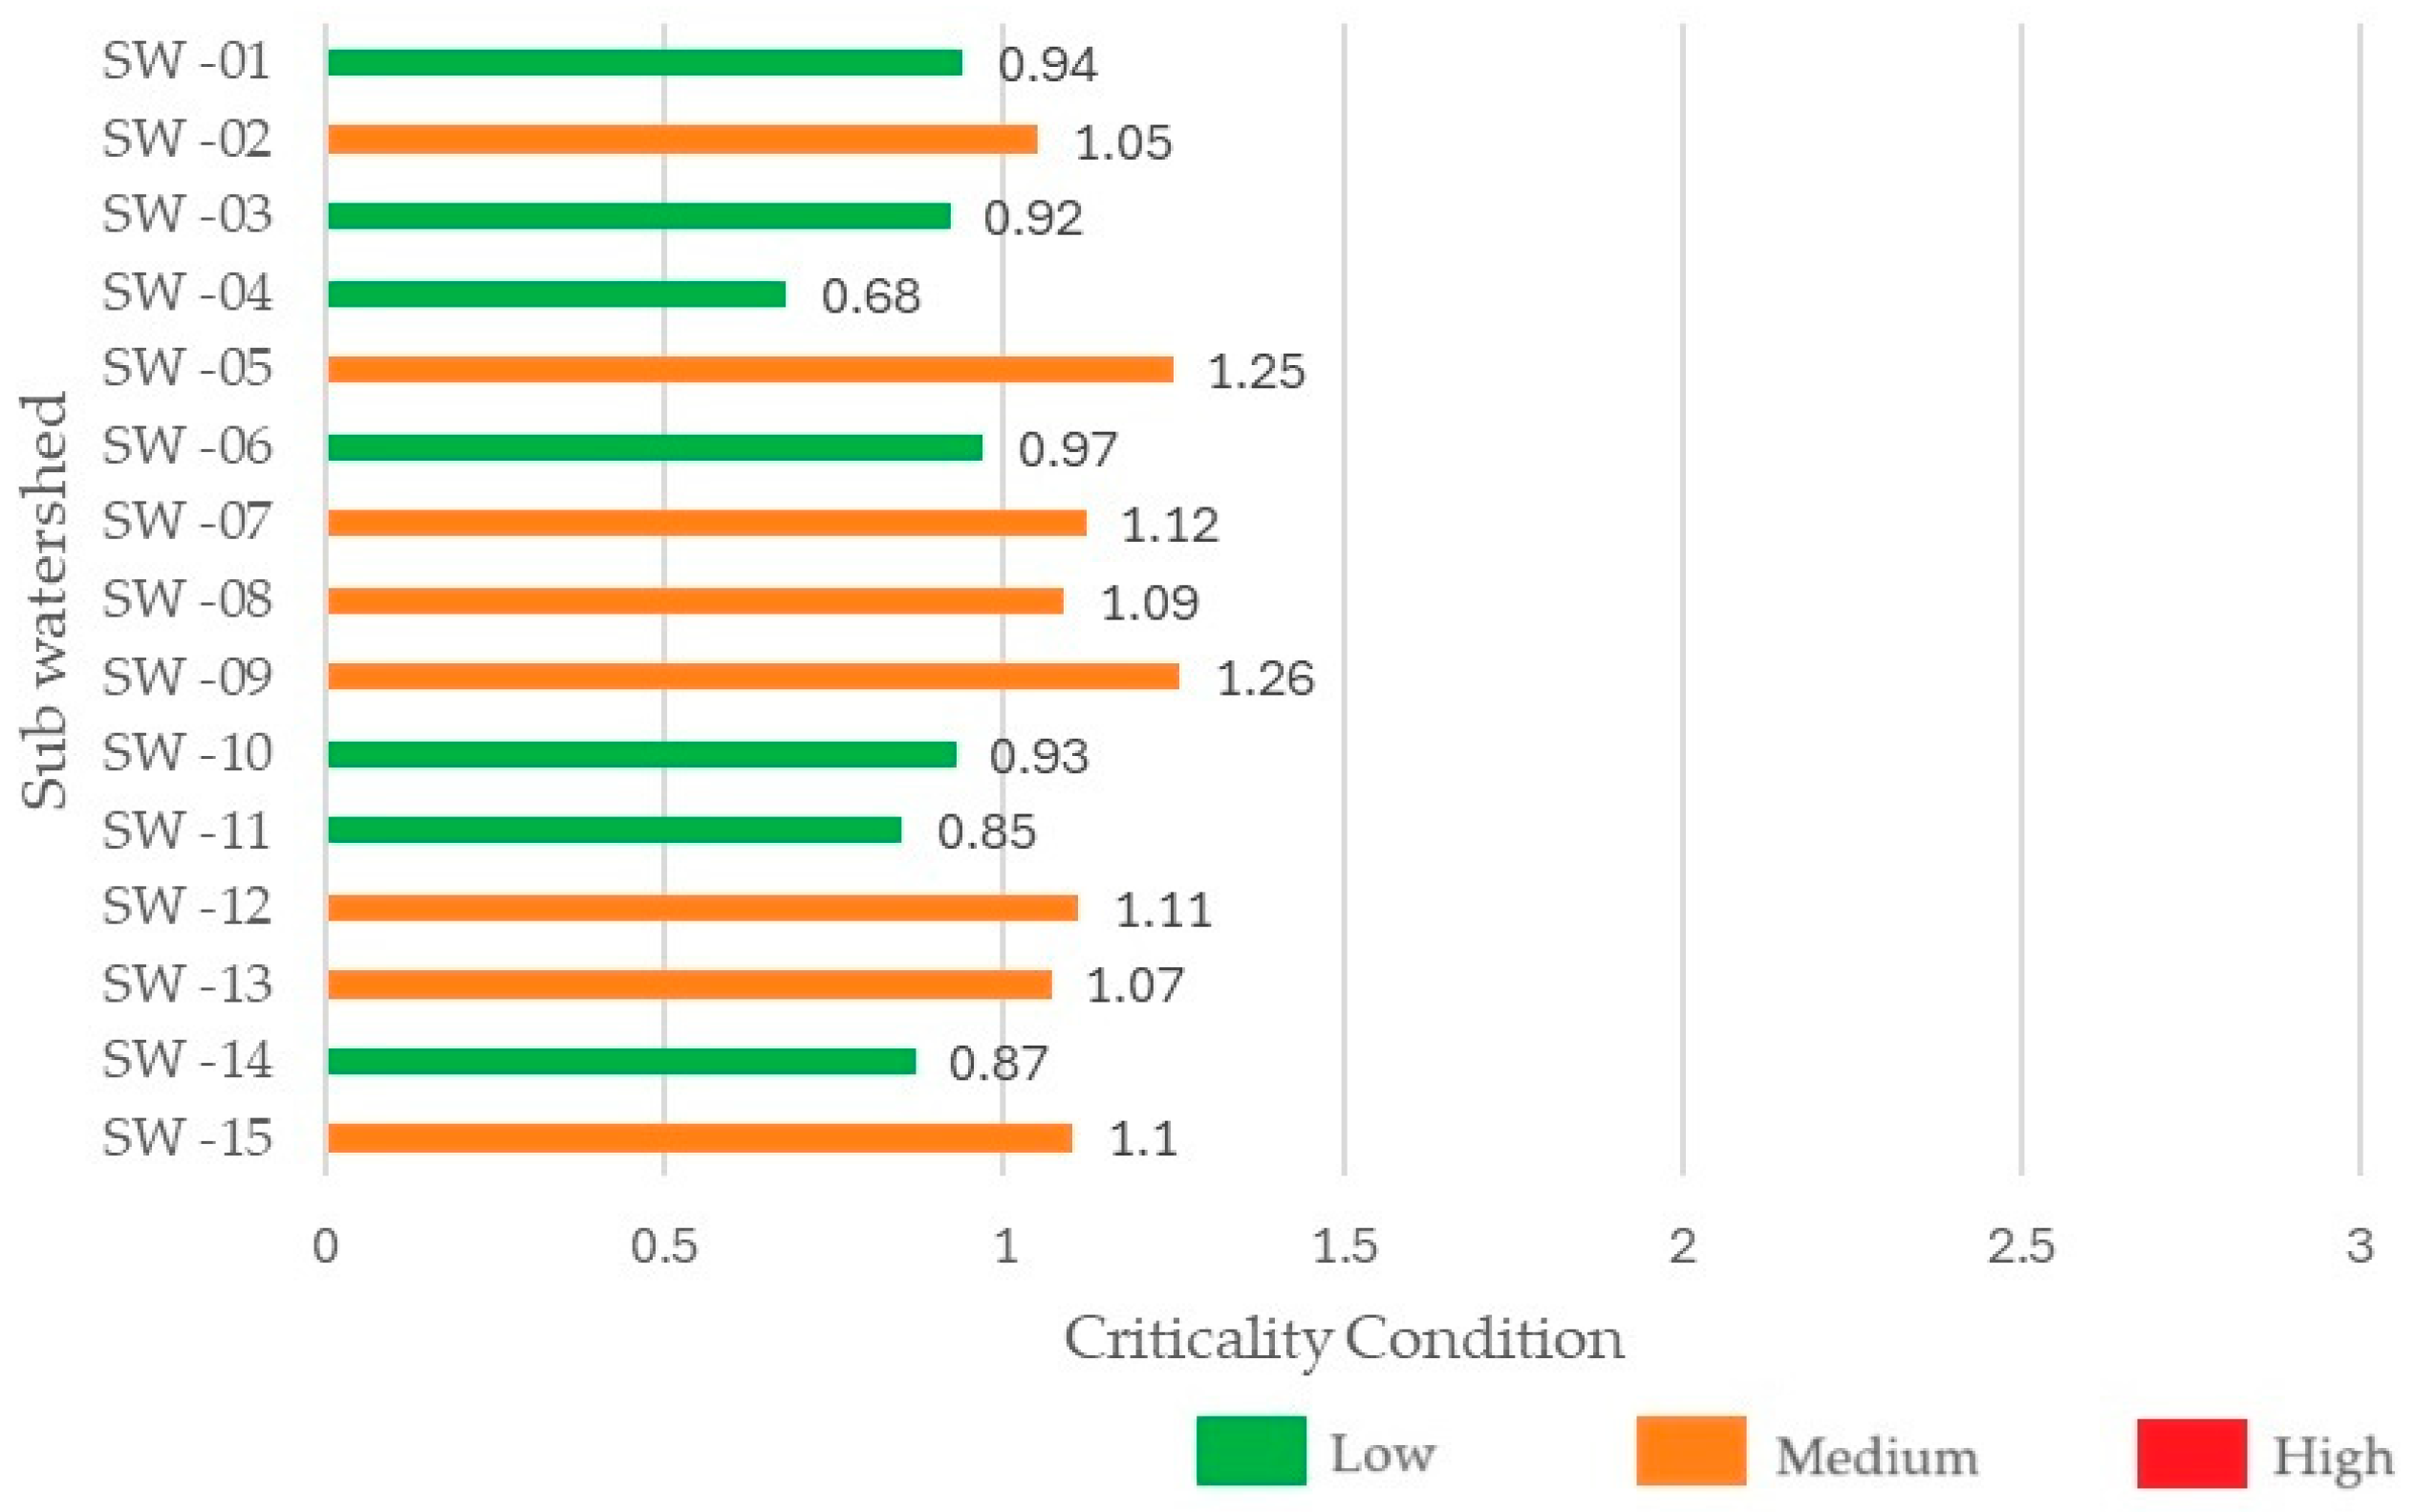
8.3. The Criticality Index for Watershed Restoration for the João Mendes Sub-Watersheds

The methodology proposed in this study also enables the application of the CIWR to smaller areas, such as sub-watersheds. This alternative is useful for further facilitating the identification of priority areas for river restoration interventions.
Figure 9 shows the division of the João Mendes Watershed into sub-watersheds, while Figure 10 presents the respective CIWR values for each sub-watershed. According to the results obtained, the sub-watersheds in the most criticality condition were SW-05 and SW-09, with values of 1.25 and 1.26, respectively. The sub-watershed in the best criticality condition was SW-04.
Despite being a small watershed, the João Mendes Watershed presents different occupation characteristics in its different stretches, as seen in Section 6. The João Mendes River and its tributaries originate, for the most part, in well-preserved forest areas, such as the Serra da Tiririca State Park, and the main river flows into the Itaipu Lagoon, where there is still a preserved green area. This scenario changes in its medium stretches, where its natural course has been altered and channeled due to the intense urbanization. This characteristic resulted in a final CIWR for the entire watershed of less than 1, that is, a watershed with a low criticality condition. But by dividing this into sub-watersheds, it is possible to better represent the criticality condition of the medium stretches, discounting the other stretches positive effects, with results that better matched the reality in the urban areas of the João Mendes Watershed and enabling more assertive river restoration actions.
With the results of the CIWR by sub-watershed, it is possible for managers to make decisions about the prioritization of areas for restoration practices. In this case, it is possible, for example, to hierarchize watersheds for restoration practices, considering short-, medium-, and long-term watersheds, according to the CIWR value.

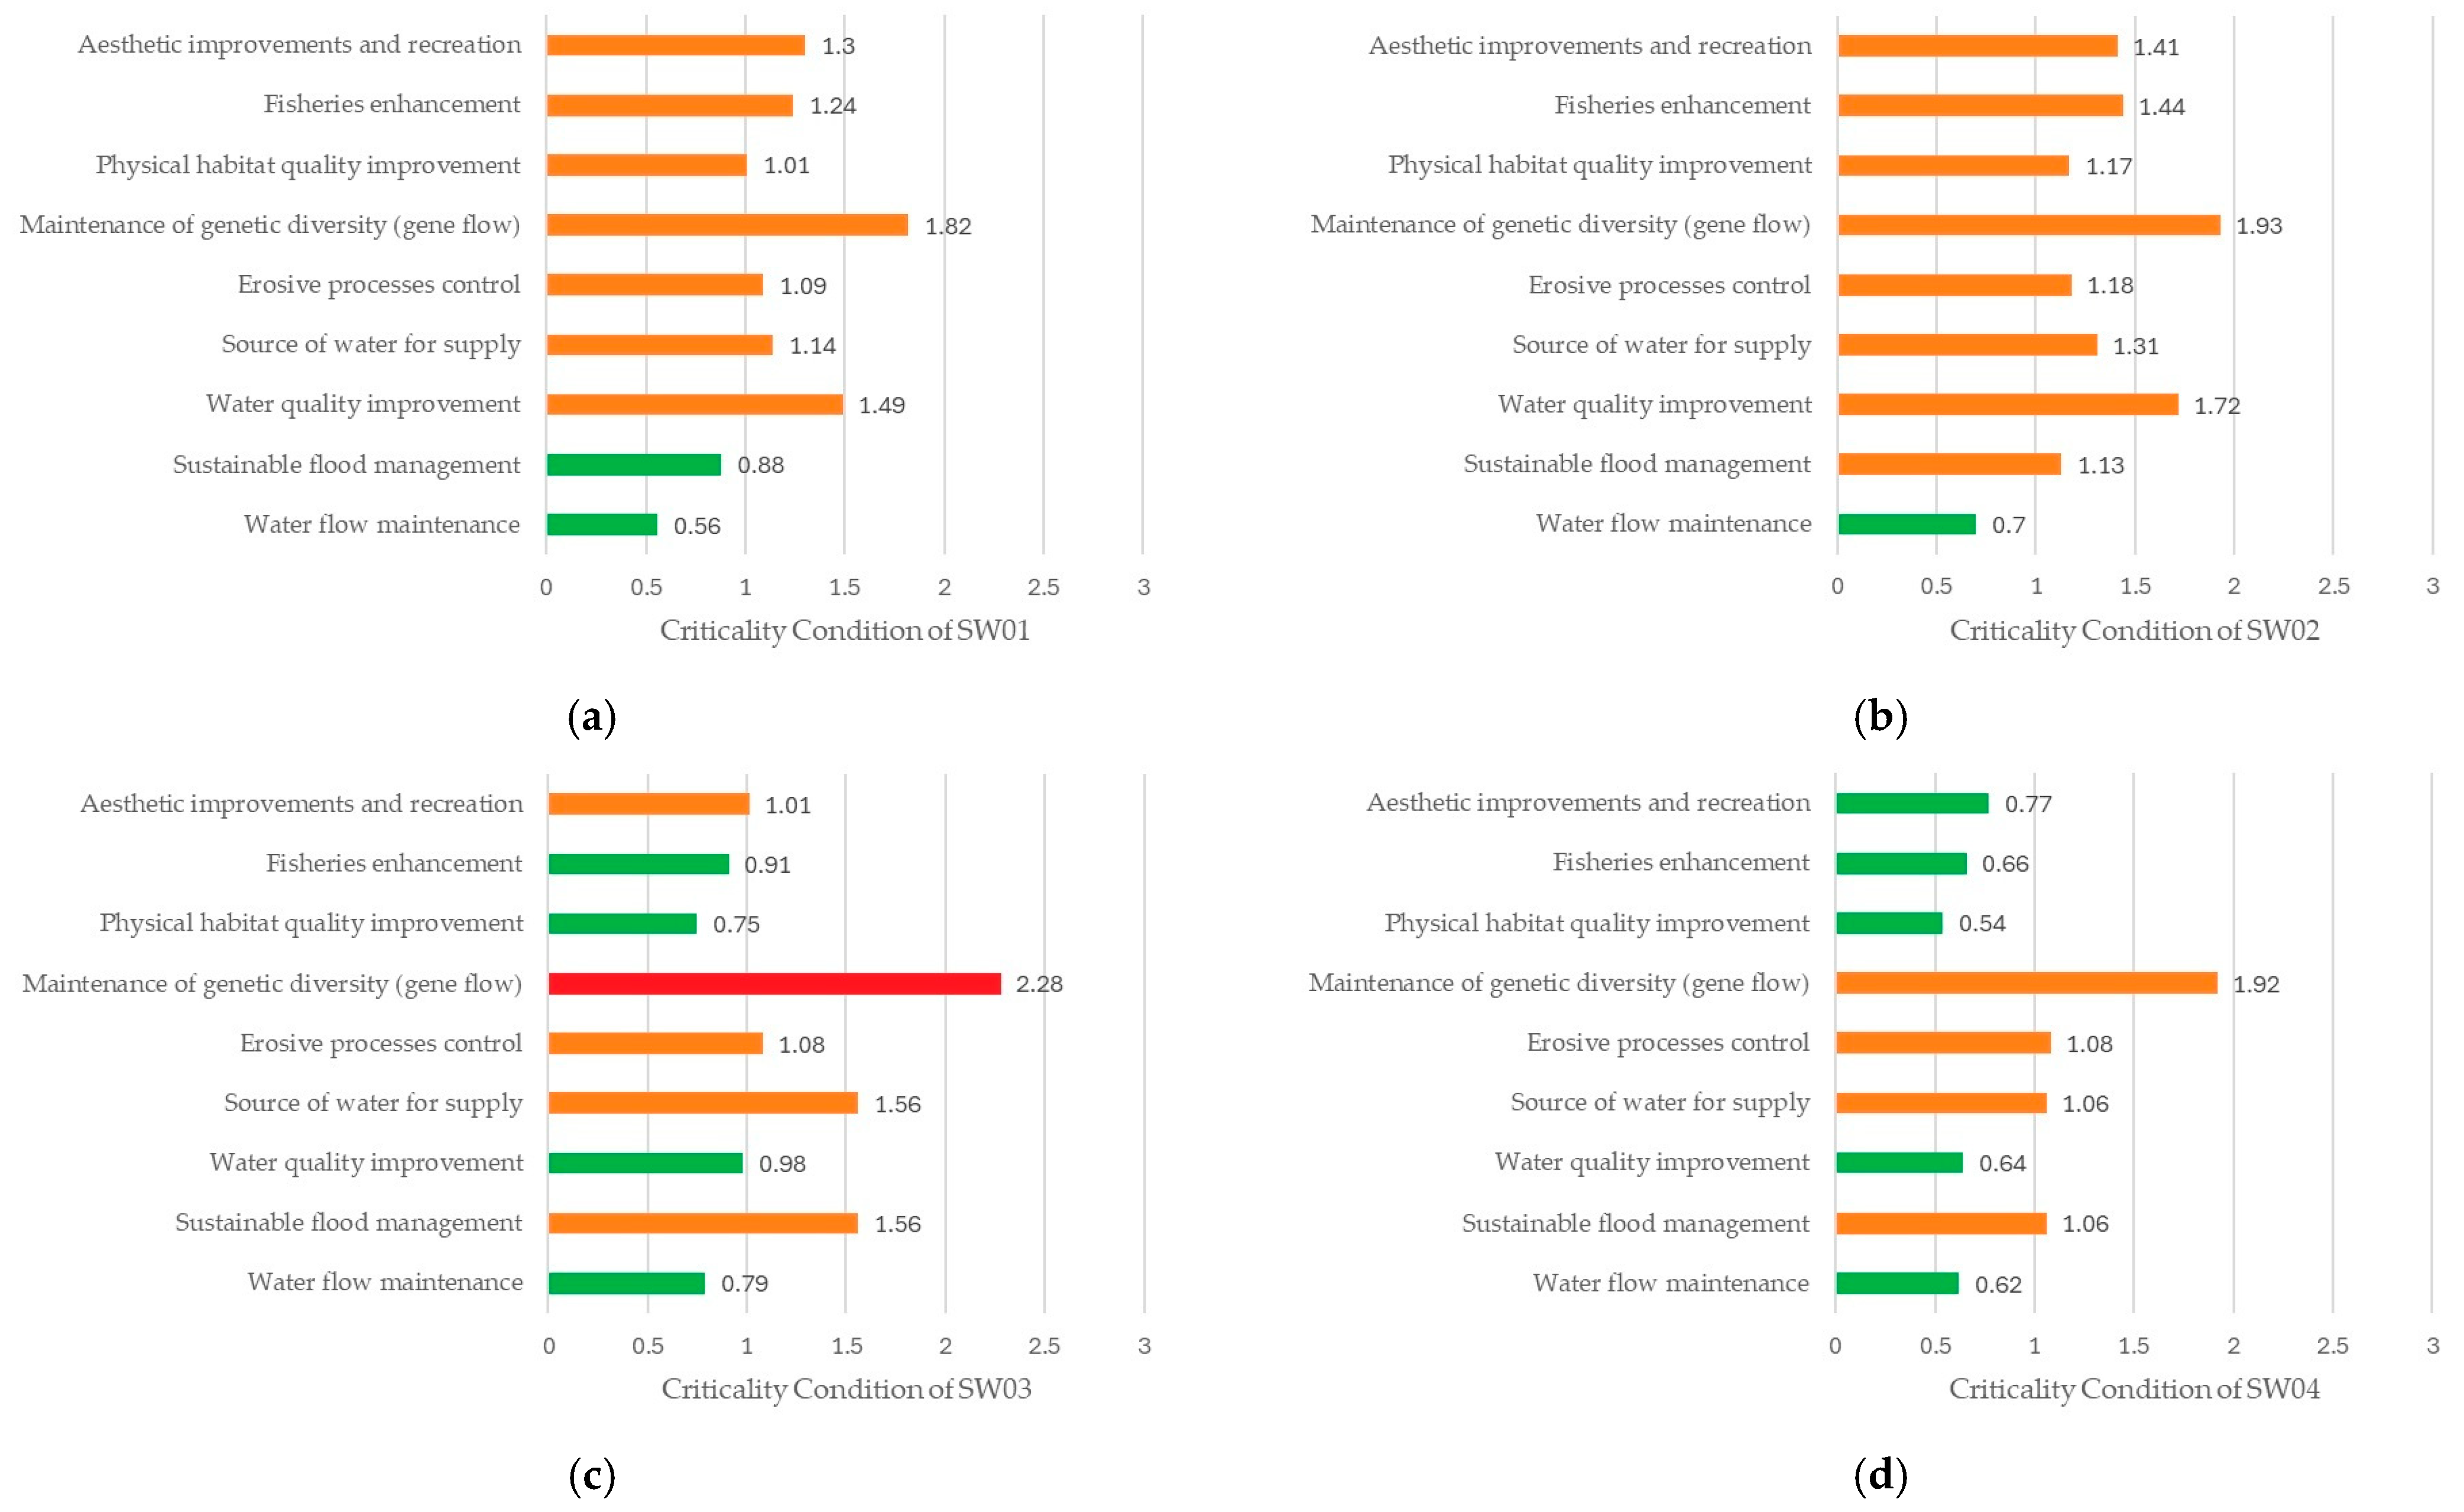
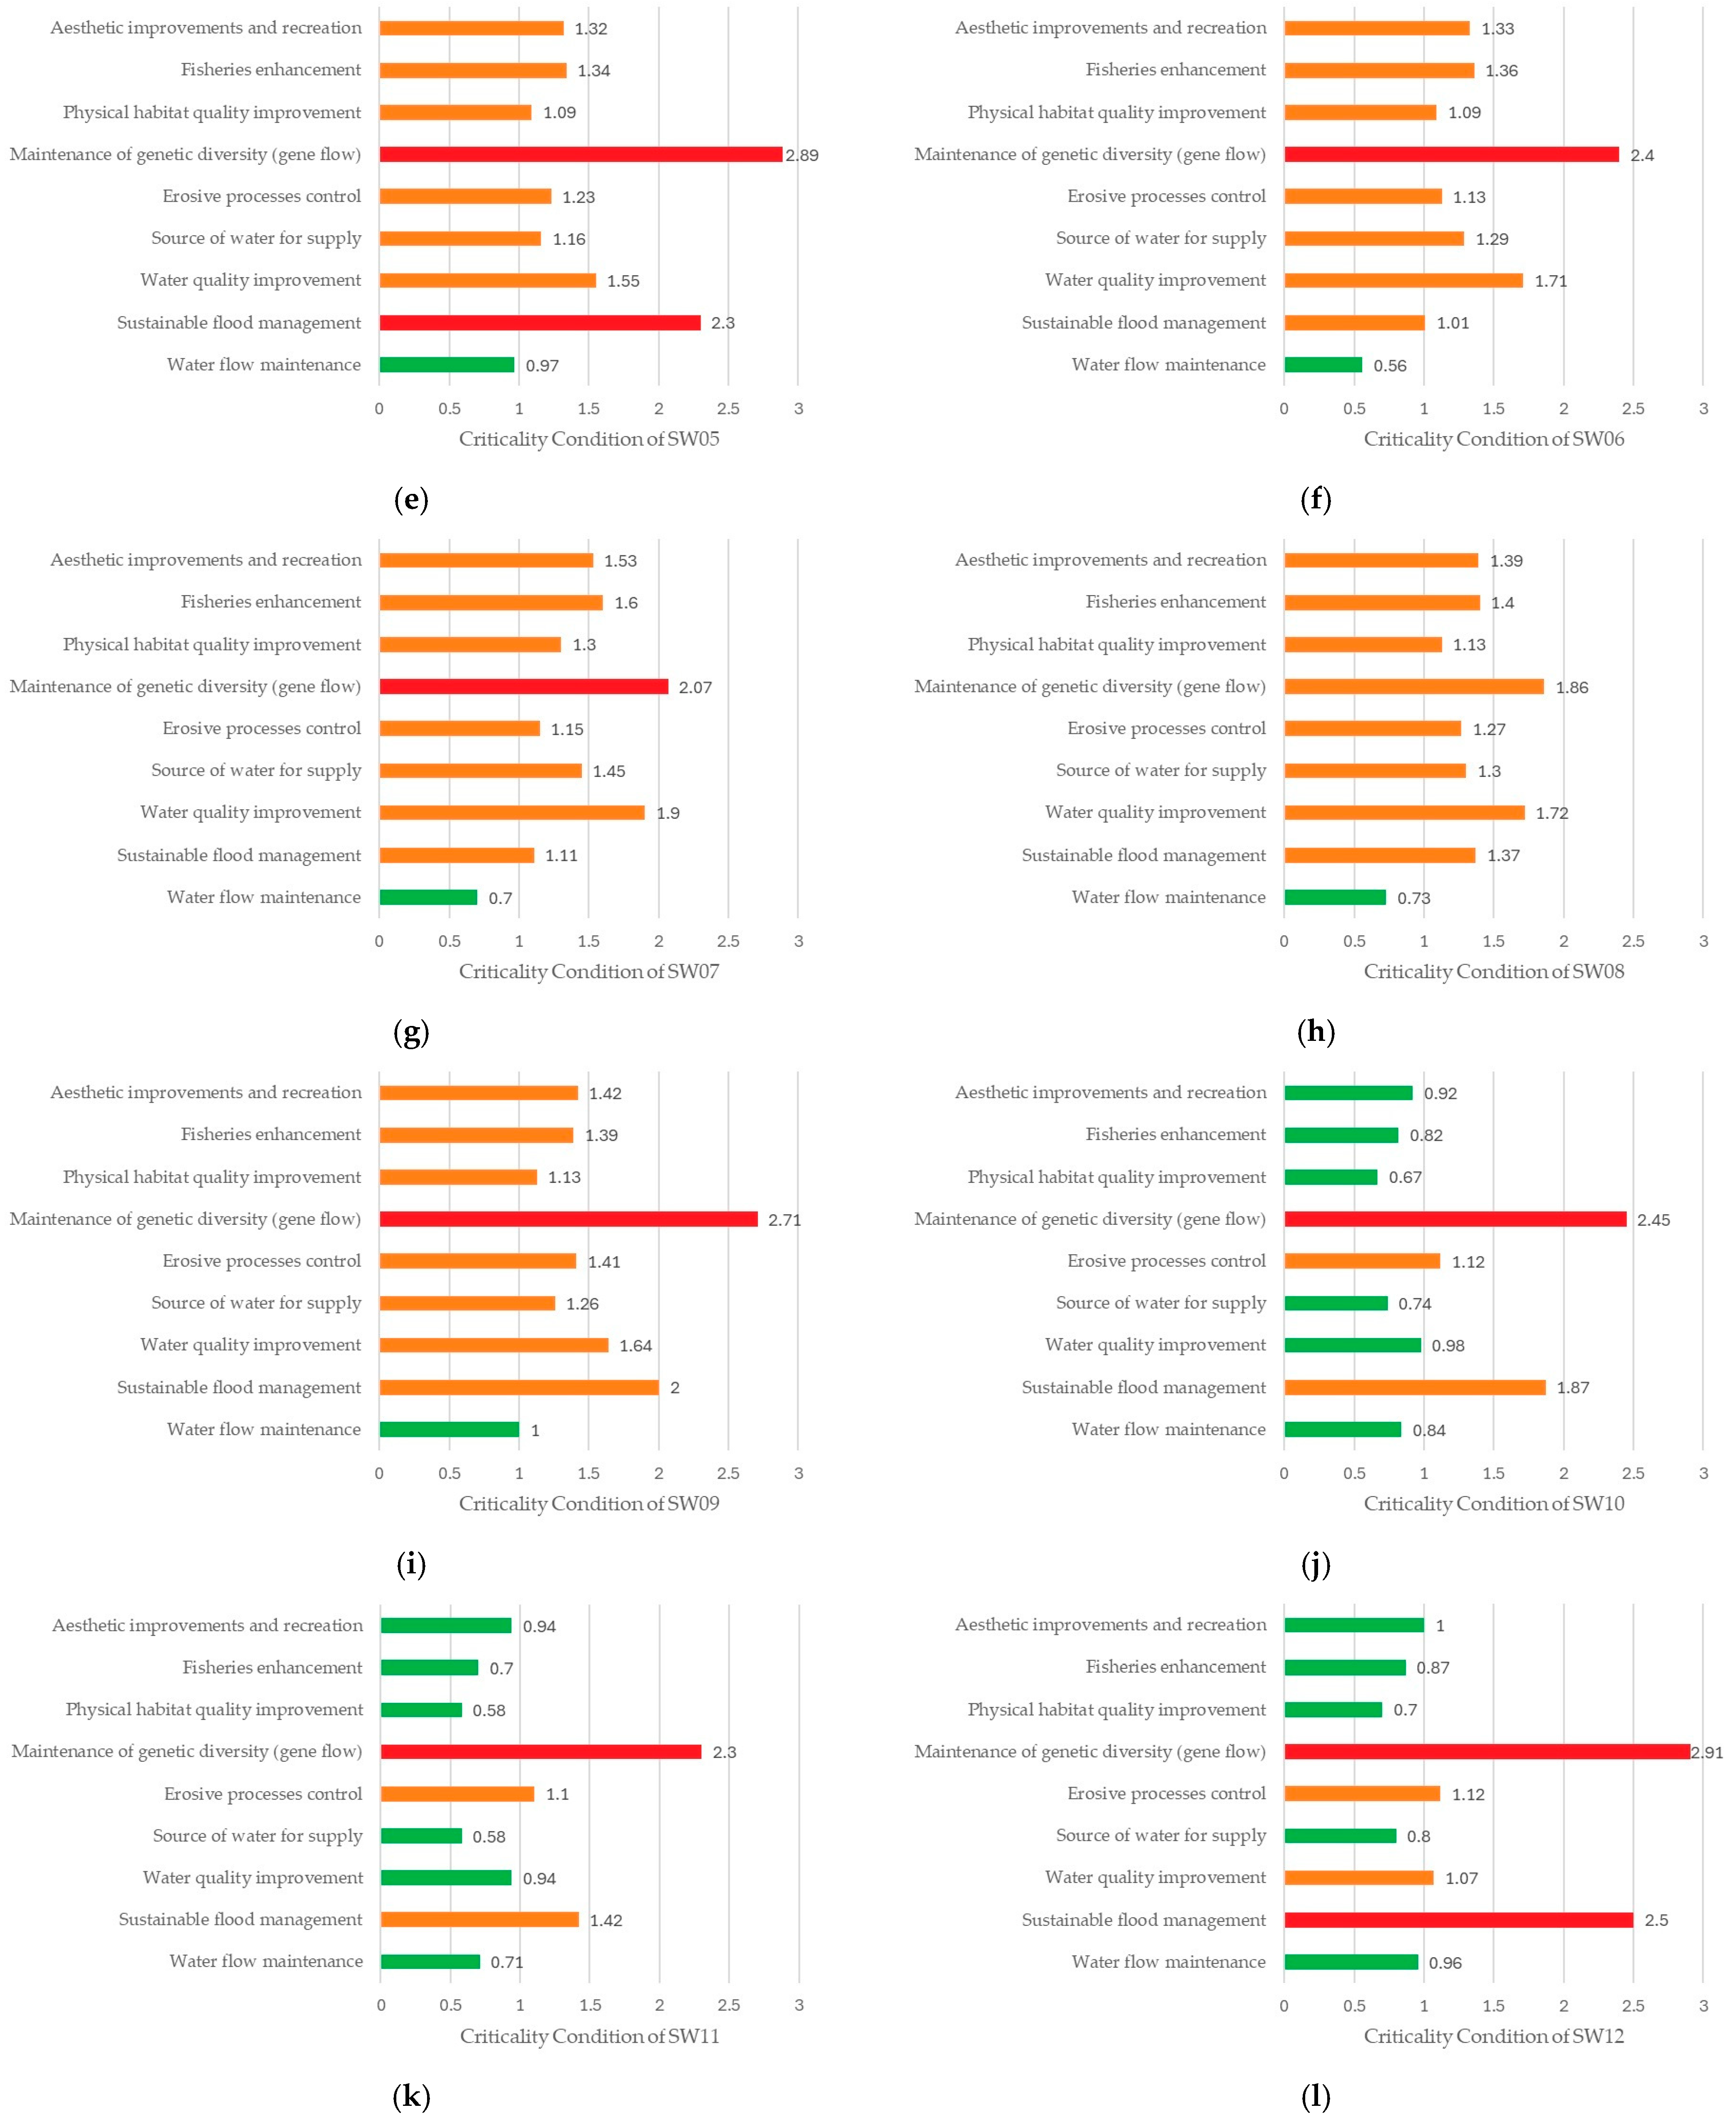
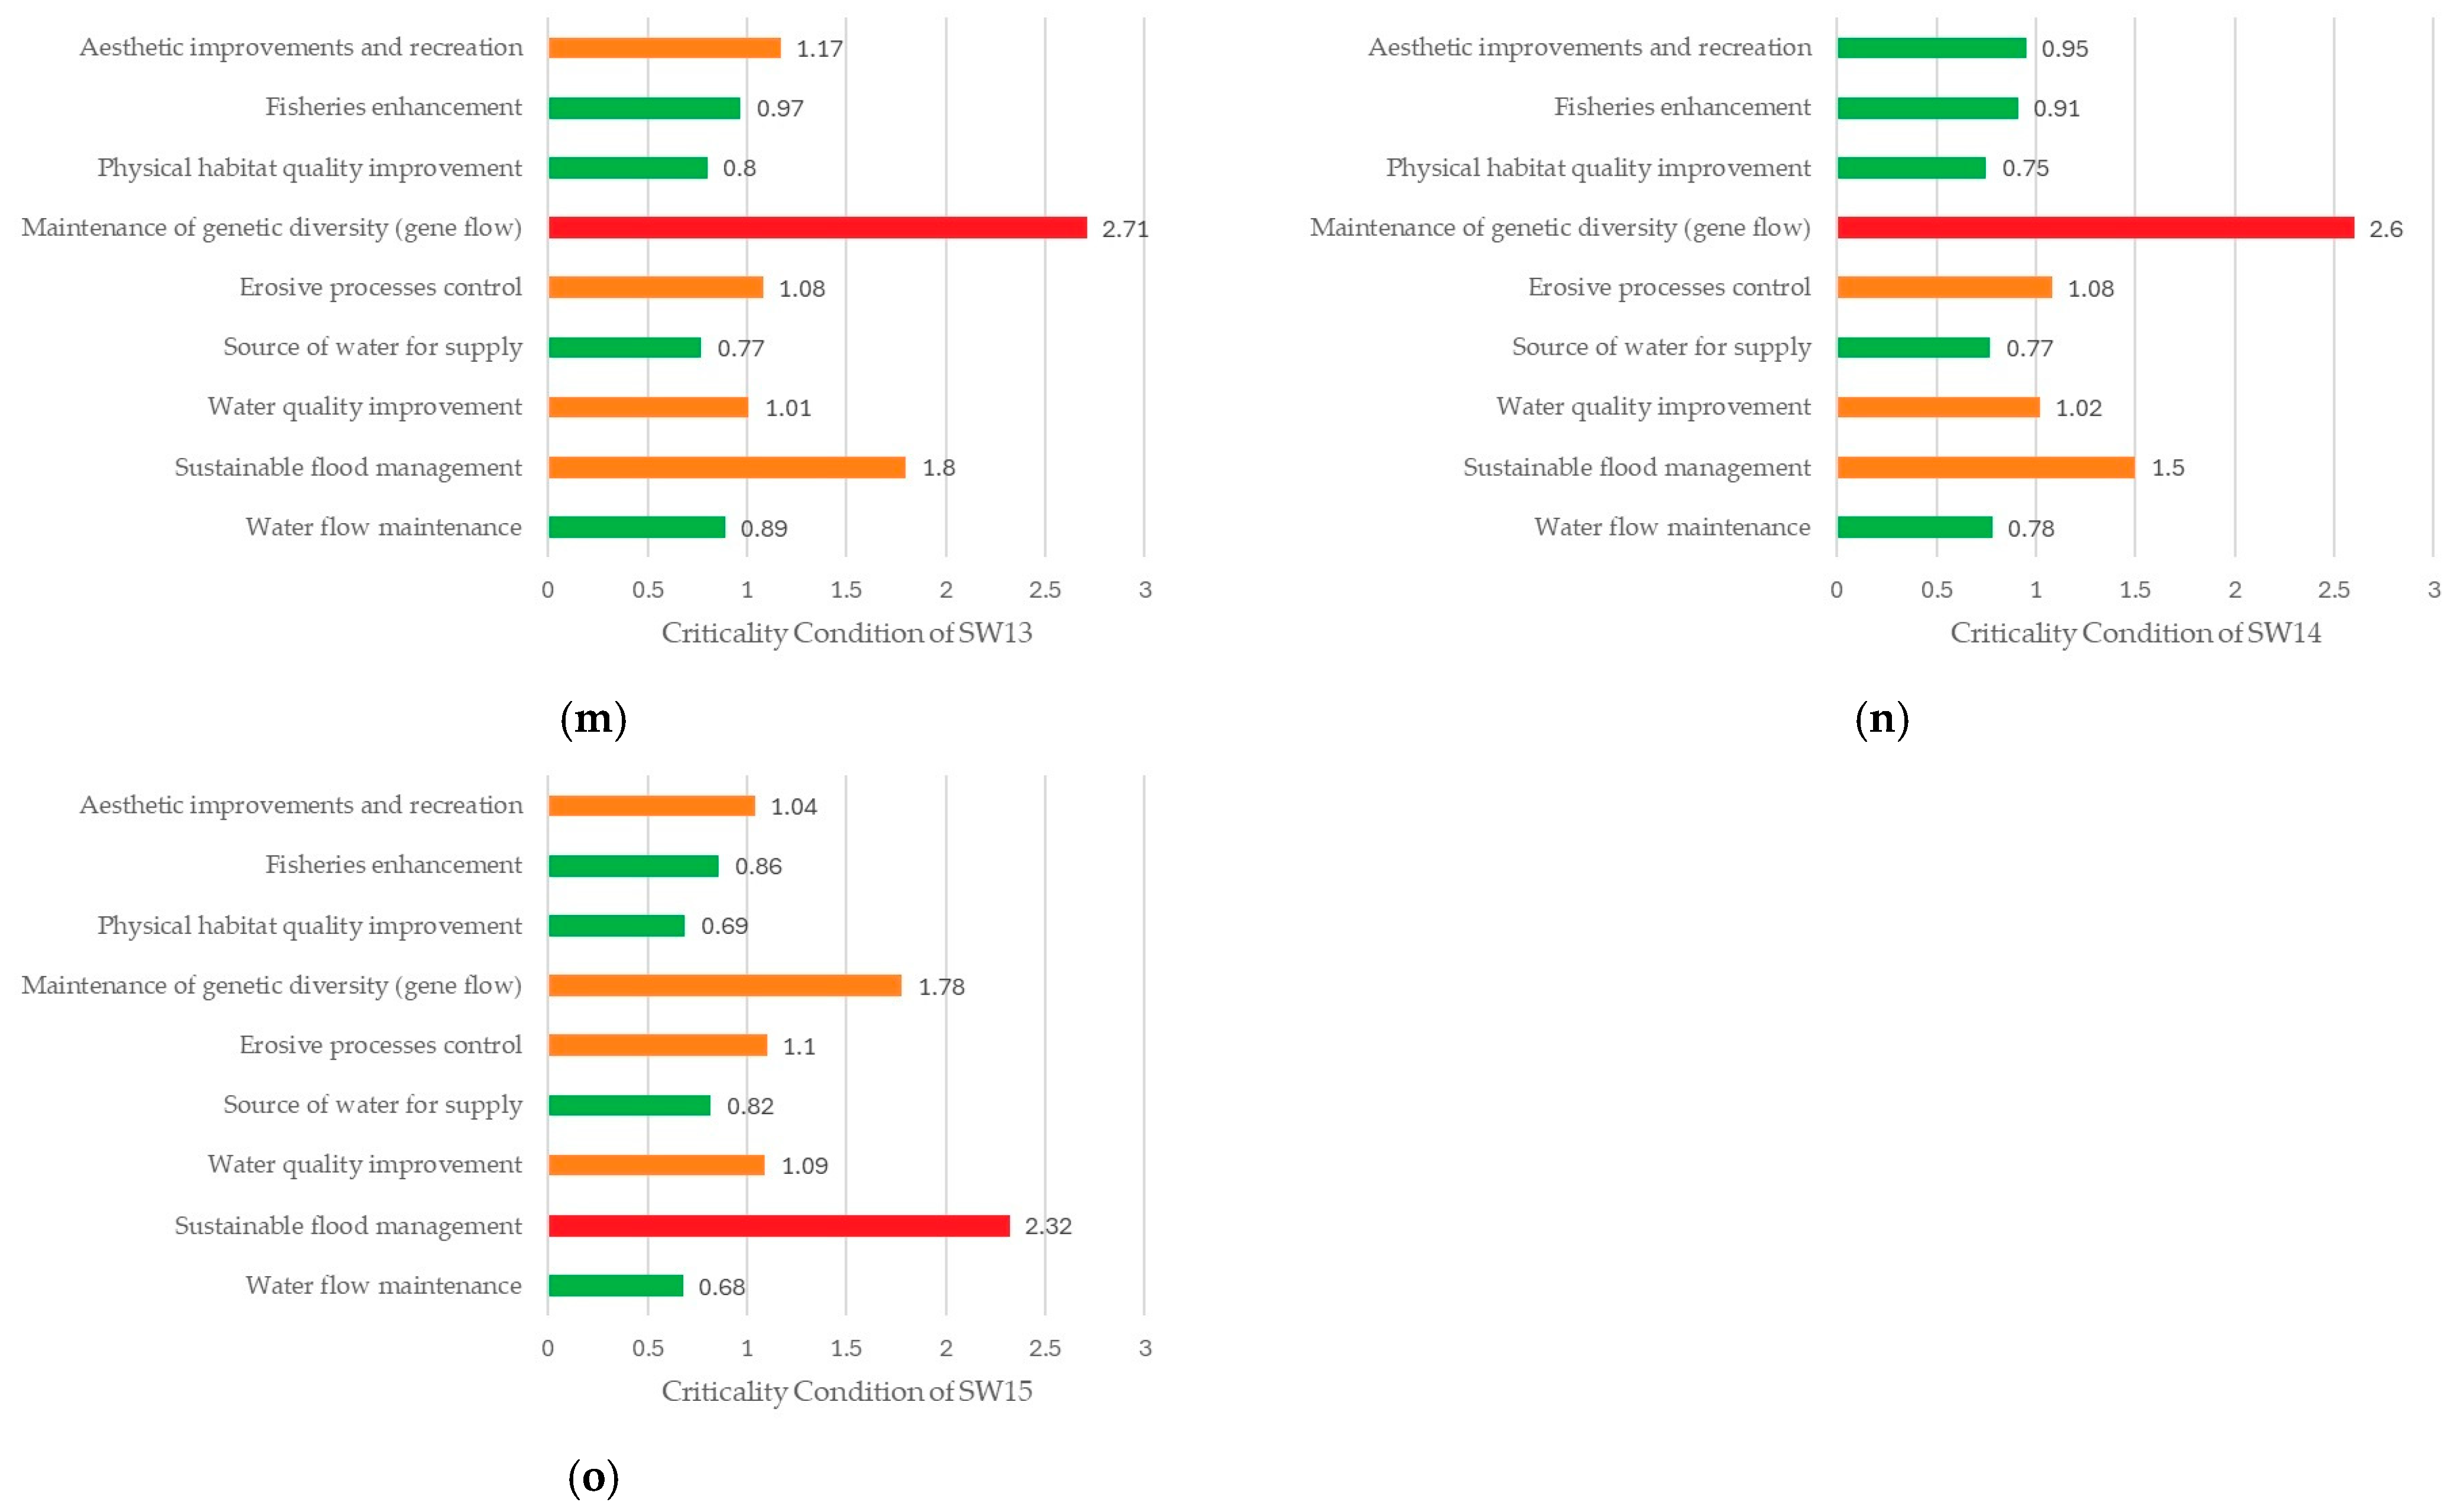
8.4. Criticality Condition of the João Mendes Watershed by Ecosystem Service and by Sub-Watershed

Delving deeper into the analyses regarding the criticality condition of the João Mendes watershed, it was possible to calculate the criticality indicators for each environmental service within each sub-watershed.
Figure 11 shows the criticality condition results of the João Mendes sub-watersheds by environmental service.
Regarding the environmental services, the sub-watershed with the highest criticality condition was SW-05, followed by sub-watersheds SW-06, SW-07, SW-08, and SW-09. Moreover, there were sub-watersheds with a high criticality condition concerning the sustainable flood management service—specifically SW-05, SW-12, and SW-15—and regarding the maintenance of genetic diversity service, which included SW-03 and SW-05 to SW-14. The latter environmental service was the most deficient, with a high criticality condition in eleven sub-watersheds. The sub-watershed in the best condition was SW-11, followed by SW-12, with most environmental services classified with a low criticality condition.

8.5. Selection of River Restoration Techniques for Implementation in the Mapped Priority Areas of the João Mendes Watershed

Considering that the sub-watersheds SW-05, SW-06, SW-07, SW-08, and SW-09 exhibited the poorest conditions in providing environmental services, they were selected for the next step of the methodology: consulting the correlation matrix between river restoration techniques and environmental services to identify the most suitable typologies for implementation in each territory segment according to the deficient environmental service identified. Figure 12 presents the priority areas mapped for the application of river restoration techniques in these sub-watersheds.
In the SW-05 sub-watershed, one of the most deficient environmental services was sustainable flood management. According to the correlation matrix between river restoration techniques and environmental services (Table 1), some potential techniques that could be considered for implementation in high-priority areas of this sub-watershed, specifically along the river course, include the following: the creation of green corridors/revegetation, channel and riparian zone widening, establishing wetlands, developing a linear park, river re-meandering, removing barriers and using bioengineering techniques for slope stabilization. This section of the João Mendes River has almost entirely occupied banks, although the riverbed remains natural. One possibility for river restoration in this area would be to prioritize it for expropriation.
The environmental service of maintenance of genetic diversity was the most deficient service in the SW-05, SW-06, SW-07, SW-08, and SW-09 sub-watersheds, as previously shown in Figure 11. In this case, some potential techniques that could be studied for implementation in high or medium priority areas include the creation of green corridors/revegetation, expansion of the channel and riparian zones, channel daylighting, removing concrete from the riverbed, establishing wetlands, developing linear parks, removing barriers, river re-meandering, and using bioengineering for slope stabilization.
The next most deficient environmental service in these five sub-watersheds was water quality improvement. These sub-watersheds were in areas with high criticality condition concerning the indicator I-6 Sanitary Sewage. The sub-watershed SW-07 still had part of its territory classified as medium criticality concerning the indicator I-5 Solid Waste. Some of the techniques suggested in the correlation matrix between river restoration techniques and environmental services may help improve this environmental service, such as the creation of wetlands and green corridors. However, it is essential to adopt actions aimed at enhancing sanitary sewage collection and solid waste management in these areas.

9. Discussion

Regarding the area studied in this work, despite Niterói having densely urbanized areas, it still has a significant portion of its territory covered by green spaces, with more than 50% consisting of protected areas. Thus, even though there are densely occupied areas and modified river stretches, its watersheds still contain regions with better environmental conditions, particularly in the Oceanic Region of Niterói, which remains an expanding area. In this context, it is crucial to consider future land use in this region over the medium and long term, given the adverse effects of urbanization on these watersheds. This is particularly significant for the remaining permeable areas, as such a scenario could exacerbate the current environmental conditions. Potential consequences include the loss of vegetation cover, alterations to urban river courses due to the expansion of the urban fabric, increased surface runoff, and the deterioration of fluvial water quality. The possibility of dividing the watersheds into sub-watersheds through the methodology proposed here is a viable strategy for identifying and categorizing areas with poorer environmental and social conditions.
Urbanization has a series of impacts on watersheds, affecting their physical, biological, and socio-economic components. As outlined, the social, economic, and environmental impacts are numerous, including the exacerbation of socio-economic inequalities, as reflected in the distribution of open spaces and recreational areas throughout the watershed, as well as the availability of urban infrastructure and services; the loss of biodiversity, along with reduced infiltration and, consequently, a decline in aquifer recharge; the intensification of the urban heat island effect and diffuse pollution, which in turn result in public health issues, with increased vulnerability of the population to respiratory diseases and waterborne illnesses; the weakening of local cultural traditions, and, eventually, the displacement of more vulnerable social groups. Considering the Oceanic Region of Niterói, it was already known that the João Mendes Watershed exerts a great influence when it comes to the negative impact of urbanization on the Itaipu-Piratininga Lagoon System, as commented in Section 6. If previous studies in the area had not existed, one possibility could have been to work at the level of the watersheds that drain into the Piratininga Lagoon and Itaipu Lagoon.
In relation to the step of defining priority areas, when comparing it to the Systematic Conservation Planning Methodology, which inspired the adoption of an “opportunity” layer, the case study considered environmentally legally protected areas. This layer resembles the spatial constraint of “commitments,” which represents areas that must be selected regardless of their contribution to the targets, such as existing reserves. For the layer of environmentally legally protected areas, in the case of the João Mendes Watershed and its main stream, almost the entire riverine protected strip was classified as high priority for the implementation of river restoration techniques. This area is not only an existing reserve, but it actually represents an area with significant contribution to restoring the environmental health of the river. However, when it comes to urban river restoration, the riverine protected strips are often not respected and are densely occupied. An immediate alternative for defining priority areas in this situation would be to adopt other opportunity layers, such as urban open spaces, physical environment susceptibility to flooding, urban retrofit, areas with a low cost of acquisition, etc. The definition of the best or most suitable opportunity layers to adopt depends on the intrinsic characteristics of each location and should be selected through consultation with local stakeholders, according to the interests of the local community. Since this research aimed only to test the initially proposed methodology, such a consultation was not conducted, but it is considered a point for improvement in future studies. A more in-depth study focusing on the opportunity layer definition could include the overlap of different aspects to build a final opportunity layer, potentially considering different weights for each aspect.
Nevertheless, it is important to emphasize that legally protected areas should not be excluded from the analysis of priority areas for river restoration. Non-structural measures, different from those presented in Table 1 (the correlation matrix between river restoration techniques and environmental services), could be adopted for more heavily modified watersheds. Raising environmental awareness in the local community to ensure the success of the river restoration process and its outcomes should also be adopted.
Structural measures for these areas are also possible. Since many of the areas occupied along riverbanks—especially due to their informal nature—lack adequate sanitation infrastructure, measures to prevent households from discharging sewage directly into the river could be applied. Indeed, in developing countries, water quality is often a very basic issue and also correlated with a lack of adequate sanitation, which makes it one of the first river restoration objectives [32,54].
Considering the lack of resources and the social difficulties involved in expropriations, structural measures aimed at local scale could also be considered. The Methodological Guide for Implementing Green Infrastructure presents several examples of green and blue infrastructure that can be adopted at the building level to improve the environmental quality of a watershed, such as vertical gardens, green roofs, cisterns, and private green spaces. Thus, an improvement point for this methodology could be expanding the river restoration techniques from Table 1 (the correlation matrix between river restoration techniques and environmental services) to the “individual” scale, as Machado et al. [22] did for selecting locations for green and blue infrastructure implementation, already considering the environmental services involved.
Regarding the high priority areas defined for river restoration in the João Mendes sub-watersheds, many of them are located in densely populated areas, requiring expropriations, which makes restoration practices more challenging to implement. However, by identifying these areas, it is possible to establish short-, medium-, and long-term measures for river restoration. Short-term measures can consider the use of the structural measures discussed above, or other measures can be implemented in priority areas that are already unoccupied, thus preventing future occupation. For the other areas, planning can be undertaken for the implementation of medium- to long-term measures, seeking potential sources of funding.
Regarding the medium priority areas, they are mainly located in the headwaters area, in the upper portion of the watershed. This is an area with good vegetation cover—and where the Serra da Tiririca State Park was established—and little urbanization. This is due to the relief of the area, with high slopes, which prevented, even before the State Park, urban occupation from developing in the area. Because of that, these areas resulted as medium priority and not high priority for river restoration. Since they are not densely urbanized, this may facilitate the application of river restoration techniques. Additionally, these areas should be conserved to prevent them from becoming areas with high CIWR.
In the presentation of the calculation of the CIWR (Equation (1)), the possibility of using different weights for the indicators was demonstrated. This possibility was not addressed in this case study, because its purpose was to test the methodology. In developing countries, many projects involving restoration practices in urban rivers are related to flood control or sanitation. Considering that these are the primary concerns of stakeholders, greater weights can be assigned to indicators related to the environmental service of sustainable flood management or water quality improvement. The weight assigned to each indicator in the calculation of the CIWR can be defined through public participation and consulting experts and professionals involved in governmental management. In the case of the João Mendes River, as already identified, one of the greatest concerns in the Oceanic Region of Niterói is the use of the lagoons, and the João Mendes Watershed is the main contributor to the system pollution. Therefore, it could be feasible to assign a higher weight to indicators related to the environmental service of water quality improvement.
Finally, it is important to highlight that during the development of this methodology, some existing references on the topic were consulted. The selected indicators were based on those presented in those methodologies (as shown in Table 3—indicators proposed for the implementation of river restoration techniques analysis). The three main innovations of this methodology compared to others are as follows: (i) the creation of a numerical index that is also spatially explicit, enabling both quantitative analysis—which can be used for comparison purposes—and visual analysis, allowing for the identification of priority areas for river restoration; (ii) the use of environmental services as a tool to convince stakeholders about the benefits of implementing river restoration; and (iii) the analysis of river restoration at the watershed level. The methodologies consulted generally addressed only one or two of these aspects. It is also important to emphasize that these methodologies had different purposes or were intended for use at different stages of the public policy process (from agenda-setting to monitoring the implemented policy).

10. Conclusions

This research aimed to develop a simple method for identifying priority areas for river restoration using geoprocessing tools, which are increasingly being developed with the advancement of computational technologies. However, the topic itself is very complex and encompasses a series of related variables, which make final quantification challenging. Moreover, the development of a method is influenced by professional judgment, to choose the most relevant indicators and to classify categories and criticality classes. This all depends on global cultures, terrain, and current restoration practices.
Initially, a literature review was conducted on river restoration worldwide, focusing on the main objectives, methodologies, criteria, and evaluation indicators for river restoration, as well as indicators for assessing environmental services. This survey enabled the development of a correlation matrix linking various river restoration techniques with associated environmental services. It also allowed for the proposal of representative indicators for the main environmental services identified in relation to river restoration practices. Despite the wide variety of indicators found in the literature, the indicators selected for the methodology proposed here were those considered representative, easily applicable, and obtainable, as well as spatially representable. Ultimately, the goal is to achieve results that are easily visualized and understood by the different stakeholders involved in an urban river restoration process.
It is important to emphasize that the purpose of this methodology is to be used for initial studies of river restoration, providing a general understanding of the criticality condition of a watershed, the deficient environmental services, the areas in poorer condition, and the locations with the highest priority for restoration practices, based on objective criteria. The consideration of an “economic” criterion for defining priority areas for river restoration was addressed here through the use of the opportunity layer, which is readily obtainable. Once the priority areas have been selected and the possible river restoration techniques for the improvement of environmental services provision in these areas are known, field research should be conducted to obtain primary data. Considering the limitations of resources available for the implementation of river restoration projects, when knowing priority areas for this purpose, the use of this methodology allows better directing the resources to be invested in the process. This identification process is crucial for allocating resources effectively and ensuring that restoration efforts are focused on areas with the greatest need and potential for impact.
Considering the environmental services, this research emphasized the importance of considering them in urban river restoration. By linking urban river restoration techniques with associated environmental services, the study provides a clear rationale for why certain areas should be prioritized. This approach can be useful to the development of policies that integrate ecological considerations into urban planning. It also allows clear communication and collaboration among government agencies, community groups, and other interested parties, which is essential for successful restoration initiatives.
One recommendation for future studies and research refers to further development of the criteria for prioritizing areas for river restoration. As stated before, there is an opportunity to improve this method with the addition of other layers, also considering a multi-criteria assessment, for example, by measuring the investment cost, the financial valuation of the area (before and after interventions), or even the valuation of environmental services.
Another recommendation is related to the correlation matrix between river restoration techniques and environmental services. The current framework could be improved by including new river restoration techniques that encompass a wider range of approaches for different contexts and restoration objectives. The central idea of the matrix is to connect different environmental services with the most effective river restoration techniques, allowing managers to identify the most appropriate approaches according to the specific characteristics of each watershed. Expanding the correlation matrix to include other river restoration measures could improve the relevance of the methodology, allowing for a more personalized approach to each watershed.

Author Contributions

Conceptualization, A.F.L., A.P.V. and M.G.M.; methodology, A.F.L., A.P.V. and M.G.M.; validation, A.F.L.; formal analysis, A.F.L.; investigation, A.F.L.; resources, A.F.L., A.P.V. and M.G.M.; data curation, A.F.L.; writing—original draft preparation, A.F.L., G.F.F., A.P.V. and M.G.M.; writing—review and editing, A.F.L., G.F.F., A.P.V. and M.G.M.; visualization, A.F.L., G.F.F., A.P.V. and M.G.M.; supervision, A.P.V. and M.G.M.; project administration, A.P.V. and M.G.M.; funding acquisition, A.P.V. and M.G.M. All authors have read and agreed to the published version of the manuscript.

Funding

This work was funded by the Conselho Nacional de Desenvolvimento Científico e Tecnológico (CNPq) [303862/2020-3]; Fundação Carlos Chagas Filho de Amparo à Pesquisa do Estado do Rio de Janeiro (FAPERJ) [E-26/204.443/2024]; Coordenação de Aperfeiçoamento de Pessoal de Nível Superior- Brasil (CAPES) [Finance Code 001; 88887.965743/2024-00].

Data Availability Statement

The raw data supporting the conclusions of this article will be made available by the authors upon request.

Acknowledgments

We acknowledge the UNESCO Chair on Urban Drainage in Regions of Coastal Lowlands settled at the Universidade Federal do Rio de Janeiro.

Conflicts of Interest

The authors declare no conflicts of interest. The funders had no role in the design of the study; in the collection, analysis, or interpretation of data; in the writing of the manuscript; or in the decision to publish the results.

Appendix A

Based on a bibliographic review, it was possible to consolidate Table A1, which highlights the main objectives identified in river restoration projects practiced worldwide. It was observed that these objectives can be translated into environmental services provided by the practice of river restoration, as shown in the table. Therefore, for each identified objective, a category and environmental services were associated.
Table A1. Environmental services identified in urban river restoration practices.
Urban River Restoration ObjectiveReferenceLocationEnvironmental Service CategoryAssociated Environmental Service
Aesthetic improvements, landscaping, and recreation[26,27,32,33,39]USA, United Kingdom, France, Germany, South Korea, Latin AmericaCulturalAesthetic improvements and recreation
Development of parks and open spaces[32,55]USA, Spain, Latin AmericaCulturalAesthetic improvements and recreation
Fish migration[25,26,27,33,39]USA, Sweden, France, Germany, Iberian Peninsula, JapanProvisioningFisheries enhancement
RegulatingMaintenance of genetic
diversity (gene flow)
Improvement of water quality[26,27,28,29,32,35,38]USA, United Kingdom, Germany, Spain, China, Latin AmericaRegulatingWater quality improvement
ProvisioningSource of water supply
Modification of flow/reduction in flow velocities[26,28]USARegulatingErosive processes control
Physical habitat quality improvement
Regulation/restoration of hydrological flows[27,39]Germany, FranceRegulatingWater flow maintenance
Increase in infiltration[28]USARegulatingWater flow maintenance
Sustainable flood management
Improvement of sedimentation processes[28,39]USA, FranceRegulatingSustainable flood management
RegulatingPhysical habitat quality improvement
Restoration and/or reconnection of floodplains[26,28,36]USA, Netherlands, ChinaRegulatingMaintenance of genetic
diversity (gene flow)
RegulatingSustainable flood management
Creation of wetlands[28,35]USA, United KingdomRegulatingSustainable flood management
RegulatingPhysical habitat quality improvement
RegulatingWater quality improvement
Reconfiguration of stream and river channels or restoration of meanders for rectified rivers[25,26,33,35,37,38]USA, United Kingdom, Spain, Iberian Peninsula, Japan, AustraliaRegulatingSustainable flood management
RegulatingPhysical habitat quality improvement
Reduction in nutrient input[30,38,56]Sweden, Denmark, SpainRegulatingWater quality improvement
ProvisioningSource of water supply
Flood management; Flood control[32,33,35,36]United Kingdom, Japan, China, Latin AmericaRegulatingSustainable flood management
Elimination of obsolete infrastructures/removal of barriers[25,35]United Kingdom, Iberian PeninsulaRegulatingSustainable flood management
RegulatingMaintenance of genetic
diversity (gene flow)
Management of riparian zones; Management of riparian vegetation[26,27,29,35,37,39]USA, France, Australia, GermanyRegulatingWater quality improvement
RegulatingPhysical habitat quality improvement
Management of invasive species[25,27,33]Germany, Iberian Peninsula, JapanRegulatingPhysical habitat quality improvement
Improvement of aquatic habitats or restoration of wetland habitats[25,26,37,39]USA, Denmark, Iberian Peninsula, AustraliaRegulatingPhysical habitat quality improvement
Increase in biodiversity and connectivity between habitats[28]USARegulatingMaintenance of genetic
diversity (gene flow)
Slope stabilization or protection[26,29,35,36,37]USA, United Kingdom, China, AustraliaRegulatingPhysical habitat quality improvement
RegulatingErosive processes control
RegulatingSustainable flood management
Improvement of channel morphology/morphological changes[27,35]United Kingdom, GermanyRegulatingSustainable flood management
RegulatingErosive processes control
RegulatingPhysical habitat quality improvement
Dredging[25,33]Iberian Peninsula, JapanRegulatingErosive processes control
RegulatingSustainable flood management
RegulatingWater flow maintenance

References

  1. Riley, A.L. Restoring Streams in Cities: A Guide for Planners, Policymakers, and Citizens, 2nd ed.; Island Press: Washington, DC, USA, 1998. [Google Scholar]
  2. Perini, K.; Sabbion, P. Urban Sustainability and River Restoration—Green and Blue Infrastructure, 1st ed.; John Wiley & Sons Ltd.: Hoboken, NJ, USA, 2016. [Google Scholar]
  3. Veról, A.P.; Lourenço, I.B.; Fraga, J.P.R.; Battemarco, B.P.; Merlo, M.L.; de Magalhães, P.C.; Miguez, M.G. River Restoration Integrated with Sustainable Urban Water Management for Resilient Cities. Sustainability 2020, 12, 4677. [Google Scholar] [CrossRef]
  4. Baptista, M.B.; Cardoso, A.S. Rios e Cidades: Uma longa e sinuosa história. Rev. UFMG 2013, 20, 124–153. [Google Scholar]
  5. Zingraff-Hamed, A.; Greulich, S.; Wantzen, K.; Pauleit, S. Societal Drivers of European Water Governance: A Comparison of Urban River Restoration Practices in France and Germany. Water 2017, 9, 206. [Google Scholar] [CrossRef]
  6. Miguez, M.G.; Veról, A.P.; Rezende, O.M. Drenagem Urbana: Do Projeto Tradicional à Sustentabilidade, 1st ed.; Elsevier: Rio de Janeiro, Brazil, 2016. [Google Scholar]
  7. Brocaneli, P.F.; Stuermer, M.M. Renaturalização de rios e córregos no município de São Paulo. Exacta 2009, 6, 147–156. [Google Scholar] [CrossRef]
  8. Lemons, J.; Victor, R. Uncertainty in River Restoration. In River Restoration: Managing the Uncertainty in Restoring Physical Habitat, 1st ed.; Darby, S., Sear, D., Eds.; John Wiley & Sons Ltd.: Hoboken, NJ, USA, 2008; pp. 1–13. Available online: https://onlinelibrary.wiley.com/doi/10.1002/9780470867082.ch1 (accessed on 1 October 2024).
  9. Angelopoulos, N.V.; Cowx, I.G.; Buijse, A.D. Integrated planning framework for successful river restoration projects: Upscaling lessons learnt from European case studies. Env. Sci. Policy 2017, 76, 12–22. [Google Scholar] [CrossRef]
  10. Bergstrom, J.C.; Loomis, J.B. Economic Valuation of River Restoration: An Analysis of the Valuation Literature and its Uses in Decision-Making. Water Resour. Econ. 2017, 17, 9–19. [Google Scholar] [CrossRef]
  11. Guimarães, L.; Teixeira, F.; Pereira, J.; Becker, B.; Oliveira, A.; Lima, A.; Veról, A.; Miguez, M. The challenges of urban river restoration and the proposition of a framework towards river restoration goals. J. Clean. Prod. 2021, 316, 128330. [Google Scholar] [CrossRef]
  12. Logar, I.; Brouwer, R.; Paillex, A. Do the societal benefits of river restoration outweigh their costs? A cost-benefit analysis. J. Env. Manag. 2019, 232, 1075–1085. [Google Scholar] [CrossRef]
  13. Bernhardt, E.S.; Palmer, M.A. Restoring streams in an urbanizing world. Freshw. Biol. 2007, 52, 738–751. [Google Scholar] [CrossRef]
  14. Kumar, B.; Mizunoya, T. Assessment Model of the Buriganga River Restoration Project in Bangladesh: A System Dynamics and Inclusive Wealth Study. Sustainability 2022, 14, 873. [Google Scholar] [CrossRef]
  15. Poff, N.L.; Allan, J.D.; Bain, M.B.; Karr, J.R.; Prestegaard, K.L.; Richter, B.D.; Sparks, R.E.; Stromberg, J.C. The Natural Flow Regime. BioScience 1997, 47, 769–784. [Google Scholar] [CrossRef]
  16. Gilvear, D.J.; Spray, C.J.; Casas-Mulet, R. River rehabilitation for the delivery of multiple ecosystem services at the river network scale. J. Environ. Manag. 2013, 126, 30–43. [Google Scholar] [CrossRef]
  17. Gómez-Baggethun, E.; Barton, D.N. Classifying and valuing ecosystem services for urban planning. Ecol. Econ. 2013, 86, 235–245. [Google Scholar] [CrossRef]
  18. Vermaat, J.E.; Wagtendonk, A.J.; Brouwer, R.; Sheremet, O.; Ansink, E.; Brockhoff, T.; Plug, M.; Hellsten, S.; Aroviita, J.; Tylec, L.; et al. Assessing the societal benefits of river restoration using the ecosystem services approach. Hydrobiologia 2016, 769, 121–135. [Google Scholar] [CrossRef]
  19. van der Sluis, T. Co-Benefits (Ecosystem Services) of Measures to Consolidate the Natura 2000 Network. In Scientific Support for Successful Implementation of the Natura 2000 Network, 1st ed.; Ecologic Institute: Berlin, Germany, 2021; pp. 79–99. Available online: https://www.ecologic.eu/sites/default/files/publication/2021/B_EBind_Handbook.pdf (accessed on 1 December 2024).
  20. Cardoso, A.; Baptista, M. Metodologia para Avaliação de Alternativas de Intervenção em Cursos de Água em Áreas Urbanas. Rev. Bras. Recur. Hídricos 2011, 16, 129–139. [Google Scholar] [CrossRef]
  21. Vellozo, L.D.; Santos, L.C.D.O.; Weins, N.W. Disseminação de ideias de Soluções Baseadas na Natureza: Uma análise da implementação do Parque Orla de Piratininga, Niterói (RJ). Rev. Labverde 2022, 12, 100–128. [Google Scholar] [CrossRef]
  22. Machado, A.R.; Cavani, A.C.M.; Souza, C.A.; Solera, M.L.; Longo, M.H.C.; Velasco, G.D.N.; Ikematsu, P.; Amaral, R.D.A.M. Guia Metodológico Para Implantação de Infraestrutura Verde; Fundação de Apoio ao Instituto de Pesquisas Tecnológicas—FIPT: São Paulo, Brazil, 2020; Available online: https://ipt.br/wp-content/uploads/2024/08/Guia-para-infraestrutura-verde.pdf (accessed on 10 September 2020).
  23. Margules, C.R.; Pressey, R.L. Systematic conservation planning. Nature 2000, 405, 243–253. [Google Scholar] [CrossRef]
  24. Haines-Young, R.; Potschin-Young, M.B. Revision of the Common International Classification for Ecosystem Services (CICES V5.1): A Policy Brief. One Ecosyst. 2018, 3, e27108. [Google Scholar] [CrossRef]
  25. Corominas, P. Estudio y Análisis de Las Propuestas de Restauración Fluvial en Los Planes Hidrológicos del Segundo Ciclo de La Península Ibérica; J.R & Martínez; Fundación Nueva Cultura del Agua: Zaragoza, Spain, 2020. [Google Scholar]
  26. Bernhardt, E.S.; Palmer, M.A.; Allan, J.D.; Alexander, G.; Barnas, K.; Brooks, S.; Carr, J.; Clayton, S.; Dahm, C.; Follstad-Shah, J.; et al. Synthesizing, U.S. River Restoration Efforts. Science 2005, 308, 636–637. [Google Scholar] [CrossRef]
  27. Kail, J.; Wolter, C. Analysis and evaluation of large-scale river restoration planning in Germany to better link river research and management. River Res. Appl. 2011, 27, 985–999. [Google Scholar] [CrossRef]
  28. IFRFIFR Reader’s Guide for the LA River Ecosystem Restoration Project—A Document by the Local Sponsor, the City of Los Angeles, California; Los Angeles River Revitalization: Los Angeles, CA, USA, 2016.
  29. Kondolf, G.M.; Anderson, S.; Lave, R.; Pagano, L.; Merenlender, A.; Bernhardt, E.S. Two Decades of River Restoration in California: What Can We Learn? Restor. Ecol. 2007, 15, 516–523. [Google Scholar] [CrossRef]
  30. Hagen, D.; Svavarsdottir, K.; Nilsson, C.; Tolvanen, A.K.; Raulund-Rasmussen, K.; Aradòttir, L.; Fosaa, A.M.; Halldorsson, G. Ecological and Social Dimensions of Ecosystem Restoration in the Nordic Countries. Ecol. Soc. 2013, 18, art34. [Google Scholar] [CrossRef]
  31. Tramontin, V.; Feltran-Barbieri, R.; Barbosa, L.; Oliveira, M.; Matsumoto, M.M.; Caccia, L.; Alves, L.; Rüsche, R.; Ferraz, V. Natural Infrastructure in Campinas’ Water System, São Paulo State; WRI Brasil and ICLEI: São Paulo, Brazil, 2022; p. 72. [Google Scholar]
  32. Mondragón-Monroy, R.; Honey-Rosés, J. Urban River Restoration and Planning in Latin America: A Systematic Review; The University of British Columbia: Vancouver, BC, Canada, 2016; p. 30. [Google Scholar]
  33. Nakamura, K.; Tockner, K.; Amano, K. River and Wetland Restoration: Lessons from Japan. BioScience 2006, 56, 419. [Google Scholar] [CrossRef]
  34. ARRN, Asian River Restoration Network. Reference Guideline for Restoration by Eco-Compatible Approach in River Basin of Asia; Foundation for Riverfront Improvement and Restoration (RFC): Tokyo, Japan, 2012; Volume 2. [Google Scholar]
  35. RRC, River Restoration Centre. The Manual of River Restoration Techniques. 2019. Available online: https://www.therrc.co.uk/manual-river-restoration-techniques (accessed on 22 March 2021).
  36. Tullos, D.D. River Restoration in China: A Review of Local Efforts to Improve the Quality of Lotic Life. Ecol. Restor. 2006, 24, 165–172. [Google Scholar] [CrossRef]
  37. Brooks, S.S.; Lake, P.S. River Restoration in Victoria, Australia: Change is in the Wind, and None too Soon. Restor. Ecol. 2007, 15, 584–591. [Google Scholar] [CrossRef]
  38. Martín-Vide, J.P. Restoration of an urban river in Barcelona, Spain. Env. Eng. Policy 1999, 2, 113–119. [Google Scholar] [CrossRef]
  39. Morandi, B. Restauration de Cours D’eau en France: Comment les Définitions et Les Pratiques Ont-Elles Évolué Dans le Temps et Dans L’espace, Quelles Pistes D’action Pour le Futur? Agence française pour la biodiversité: Paris, France, 2017. [Google Scholar]
  40. Vasconcelos, E. Zona Ripária e sua Função Hidrológica. Logic Ambiental. 2016. Available online: http://www.logicambiental.com.br/zona-riparia-e-sua-funcao-hidrologica (accessed on 11 June 2023).
  41. Ministério do Meio Ambiente e Mudança do Clima. Áreas Úmidas. Gov.br. 2021. Available online: https://www.gov.br/mma/pt-br/assuntos/ecossistemas-1/areas-umidas (accessed on 11 June 2023).
  42. Ziller, S.R. O Processo de Degradação Ambiental Originado por Plantas Exóticas Invasoras. Ambiente Brasil. Available online: https://ambientes.ambientebrasil.com.br/florestal/artigos/o_processo_de_degradacao_ambiental_originado_por_plantas_exoticas_invasoras.html (accessed on 11 June 2023).
  43. Secretaria de estado do Meio Ambiente, Departamento de Proteção da Biodiversidade. Cadernos da Mata Ciliar—Preservação e Recuperação das Nascentes de Água e Vida; SMA: São Paulo, Brazil, 2009.
  44. Cometti, J.L.S.; Cabral, J.J.D.S.P.; Lima, H.P.D. Environmental conservation index of urban streams of Cavouco and Parnamirim streams, Brazil. Rev. Bras. Ciênc Ambient. 2022, 57, 531–541. [Google Scholar] [CrossRef]
  45. Miranda, F.; Franco, A.B.; Rezende, O.; da Costa, B.B.F.; Najjar, M.; Haddad, A.N.; Miguez, M. A GIS-Based Index of Physical Susceptibility to Flooding as a Tool for Flood Risk Management. Land 2023, 12, 1408. [Google Scholar] [CrossRef]
  46. Rodrigues, A.L.M.; Da Silva, D.D.; De Menezes Filho, F.C.M. Methodology for Allocation of Best Management Practices Integrated with the Urban Landscape. Water Resour. Manag. 2021, 35, 1353–1371. [Google Scholar] [CrossRef]
  47. PMN, Prefeitura Municipal de Niterói. Projeto Conceitual—Parque Orla Piratininga (Volume I). Available online: http://www.niteroi.rj.gov.br/licitacao/sma/2018/cp-01-18-an1.pdf (accessed on 15 February 2019).
  48. PMN, Prefeitura Municipal de Niterói. PMSB—Plano Municipal de Saneamento Básico. In Diagnóstico, Descrição e Análise Crítica do Sistema de Drenagem e Manejo das Águas Pluvias Urbanas; Prefeitura Municipal de Niterói: Niterói, Brazil, 2015. [Google Scholar]
  49. Hydroscience. Modelagem de Qualidade de Água do Sistema Lagunar Piratininga-Itaipu: Fase III—Simulação de Cenários Adicionais com Vistas as Ações de Recuperação do Sistema Lagunar Piratininga-Itaipu; PMN—Prefeitura Municipal de Niterói: Niterói, Brazil, 2021.
  50. CLIP, Subcomitê do Sistema Lagunar Itaipu-Piratininga. Estratégia para Gerenciamento Ambiental Compartilhado dos Ecossistemas Lagunares de Itaipu e Piratininga e da Região Hidrográfica; Governo do Estado do Rio de Janeiro: Rio de Janeiro, Brazil, 2015.
  51. Hydroscience. 1o Relatório de Hidrologia: Caracterização das Vazões e dos Aportes de Cargas Contribuintes ao Sistema Perilagunar Piratininga-Itaipu, Niterói; Prefeitura Municipal de Niterói: Niterói, Brazil, 2018.
  52. Galvão, R.D.S. Drenagem Urbana e Planejamento Ambiental: Vale do Rio João Mendes. Master’s Thesis, Universidade Federal Fluminense, Niterói, Brazil, 2008. [Google Scholar]
  53. IBGE, Instituto Brasileiro de Geografia e Estatística. Censo Demográfico de 2010. 2010. Available online: https://www.ibge.gov.br/estatisticas/multidominio/cultura-recreacao-e-esporte/9662-censo-demografico-2010.html (accessed on 20 March 2023).
  54. AHWS Department. Nairobi Rivers Basin Rehabilitation and Restoration Program: Sewerage Improvement Project; AHWS Department: Abidjan, Côte d’Ivoire, 2017. [Google Scholar]
  55. Environmental Management Group, Department Of Public Works Bureau Of Engineering. Findings and Statement of Overriding Considerations—Los Angeles River Revitalization Master Plan; The Office of the City Clerk: Los Angeles, CA, USA, 2007.
  56. Lindahl, T.; Söderqvist, T. Building a Catchment-Based Environmental Programme: A Stakeholder Analysis of Wetland Creation in Scania, Sweden. Reg. Environ. Chang. 2004, 4, 132–144. Available online: http://link.springer.com/10.1007/s10113-004-0072-0 (accessed on 1 December 2024). [CrossRef]
Figure 1. Steps for selecting river restoration techniques for a watershed.
Land 13 02244 g001
Figure 2. Location of Niterói and its major watersheds.
Land 13 02244 g002
Figure 3. The Oceanic Region of Niterói and its watersheds.
Land 13 02244 g003
Figure 4. João Mendes Watershed.
Land 13 02244 g004
Figure 5. João Mendes Watershed criticality index for watershed restoration.
Land 13 02244 g005
Figure 6. Areas with opportunities for the application of river restoration techniques in the João Mendes Watershed.
Land 13 02244 g006
Figure 7. Priority areas for the application of river restoration techniques in the João Mendes Watershed.
Land 13 02244 g007
Figure 8. Criticality condition of the João Mendes Watershed by environmental service.
Land 13 02244 g008
Figure 9. João Mendes Watershed criticality index for watershed restoration and its division into sub-watersheds.
Land 13 02244 g009
Figure 10. Criticality index for watershed restoration for the João Mendes sub-watersheds.
Land 13 02244 g010
Figure 11. Criticality condition results of the João Mendes sub-watersheds by environmental service: (a) SW01; (b) SW02; (c) SW03; (d) SW04; (e) SW05; (f) SW06; (g) SW07; (h) SW08; (i) SW09; (j) SW010; (k) SW11; (l) SW12; (m) SW13; (n) SW14; (o) SW15.
Land 13 02244 g011aLand 13 02244 g011bLand 13 02244 g011c
Figure 12. Priority areas for the implementation of river restoration techniques in the SW-05, SW-06, SW-07, SW-08, and SW-09 sub-watersheds of the João Mendes River.
Land 13 02244 g012
Table 1. Correlation matrix between river restoration techniques and environmental services.
CategoriesRegulatingProvisioningCultural
Environmental
Services
Water Flow MaintenanceSustainable Flood
Management
Water Quality
Improvement
Physical
Habitat
Quality
Improvement
Maintenance of Genetic
Diversity (Gene Flow)
Erosive Processes ControlFisheries
Enhancement
Source of Water for SupplyAesthetic
Improvements and Recreation
Examples of
River Restoration
Techniques
Creation of green
corridors/revegetation
(a)[25][26,27][22,25,27,28,29], [22,28][25,26,30] (b)[31][22,25,30,32,33]
Expansion of the
channel and riparian zones
(c)[28,34,35] (d)[28,35][28](e)(b) (f)
Channel daylighting [28][28] (g) [28,36]
Removal of concrete from the riverbed(c) [36][28,36][28] (h) [28,30,36]
Creation of wetlands(i)[26,28,37][22,34,35,36,38][28,30][28] [33] (f)
Creation of linear parks [34] [26,28,33,38]
Remeandering[35,38][16,25] [16,35,38] [34](j)[16] [16]
Removal of barriers[25][25,32] [16,33][16,34] [16,25,34,35], (k)
Removal of invasive species(l) [22,34](m)[25] [25]
Creation of aquatic habitats (addition of gravel and pieces of wood) [39] [39]
Recovery and
protection of springs
[22] (n)(n) (o)(o)
Soil bioengineering for slope stabilization [25,28,36][36][22,28,33][22][22,29,35,36] [22](p)(q)
Legend
A direct association was identified An indirect association was identified No relation was identified
Table 2. Descriptions of restoration practices and their associated environmental services as summarized in Table 1.
Reference in Table 1Description of the Indirect Relation Between Restoration Practices and the Environmental Service
(a)The creation of green corridors involves the protection and/or recovery of vegetation along the river, thereby increasing the vegetated area of the watershed. The presence of vegetation ensures the availability of permeable areas, allowing water to infiltrate the soil during rainfall events, contributing to the recharge of the groundwater table and consequently maintaining river flow during dry periods. At the same time, it reduces surface runoff from rainwater due to the interception of rainfall by the leaves of the vegetation, which subsequently aids in sustainable flood management. The presence of vegetation along the riverbanks also provides shading, reducing water evaporation and helping maintain water flow, in addition to supporting riparian ecosystems and acting as a filter for sediments, solid waste, and pollution from the watershed.
(b)The vegetation in green corridors/riparian zones supplies organic matter to the aquatic ecosystem through branches, fruits, and trunks that fall into the river, thus providing nutrients for aquatic biota. Additionally, this material can create micro-habitat zones for certain species [40], such as fish, contributing to their reproduction and enhancing fishing opportunities.
(c)The removal of concrete from riverbeds, along with the widening of the river channel and riparian zones, increases the permeability of the river and its surroundings, allowing for greater transverse and vertical connectivity of the river, contributing to the recharge of the groundwater table and maintaining water flow.
(d)Riparian zones, through their vegetation, contribute to improving water quality by retaining sediments and filtering nutrients [40].
(e)The roots of vegetation present in the riparian zone help stabilize soil margins, preventing slippage and sedimentation in the river [40].
(f)The widening of the channel and riparian zones, as well as the creation of wetlands, increases green areas in urban environments, creating spaces for walking, contemplation, and public engagement with nature. They also serve as temporary storage areas for floodwaters.
(g)Channel daylighting allows for public access to the river, creating opportunities for recreational activities and fishing. It also facilitates the maintenance and hydraulic function of the river.
(h)The natural dynamics of the river are a function of its flow and sedimentation regimes, which interact with the physiographic characteristics and vegetation of the landscape [33]. The removal of concrete from the riverbed allows for the return of natural sedimentation processes, creating a suitable environment for the development of fish habitats.
(i)Wetlands store large volumes of water. Additionally, they allow water to infiltrate the soil and both supply and are supplied by groundwater [41]. Thus, they contribute to maintaining river flow.
(j)River meandering results in a decrease in channel gradient [16], helping to mitigate erosive processes along the riverbed.
(k)The removal of barriers can lead to either an increase or a decrease in certain environmental services. For example, there may be cases where barriers represent obsolete and unused man-made structures that act as obstacles to the proper flow of water. Their removal can alleviate flooding and improve the aesthetic quality of the river environment. However, there may be instances where barriers are created to accumulate water for supply during dry periods, to create lakes for recreational activities, or for hydroelectric power generation, among other purposes. In such cases, this river restoration technique may negatively impact on environmental services.
(l)Invasive exotic species can alter the hydrological cycle of the areas they inhabit. Different species may cause greater water loss through evapotranspiration and hinder replenishment of groundwater [42]. Thus, they can negatively impact the maintenance of water flow in the watershed.
(m)Invasive exotic species modify natural systems and occupy the space of native species. They cause loss of biodiversity, alteration of the cycles and natural characteristics of affected ecosystems, and morphological changes in the natural landscape [42]. Thus, by causing the loss of local biodiversity, they also contribute to a decrease in genetic diversity.
(n)The protection and recovery of springs involves measures that prevent, for example, the proximity of animals and anthropogenic activities, contributing to improvements in water quality. Additionally, the protection or recovery of surrounding vegetation is also important, as it helps improve the physical quality of habitats.
(o)Springs can be used for human and animal consumption, as well as for recreation [43].
(p)The use of soil bioengineering techniques protects the banks of watercourses. This protection prevents the presence of exposed soils, shielding them from the erosive processes caused by surface runoff from rainwater and reducing the input of sediments directly into the watercourse, decreasing its turbidity and contributing to better water quality. In cases where the watercourse is used for water supply, soil bioengineering techniques indirectly contribute to improving water treatment processes.
(q)Slope stabilization and soil bioengineering techniques enable the stabilization and restoration of riverbanks, potentially combining vegetation with inert materials [22], thus enhancing the aesthetic quality of riverbanks. It is important to note that some scholars on the subject do not consider the use of bioengineering techniques as measures of river restoration.
Table 3. Indicators proposed for the implementation of river restoration technique analysis.
IndicatorReferencesMethodology for Obtaining DataCriticality Classification
I1 Conservation of springs[22]Percentage of the impermeable area of the spring’s contribution catchmentLow: <20%; Medium: between 20% and 60%; High: >60%
I2 Riverbed permeability[3,44]Qualitative analysis of the lining of the banks and the riverbedLow: Permeable riverbanks and bottom; Medium: Impermeable riverbanks and natural bottom; High: Impermeable riverbanks and bottom
I3 Surface runoff generation[3,45,46]Quantitative analysis of the surface runoff coefficientLow: <0.3; Medium: between 0.3 and 0.7; High: > 0.7
I4 Surface runoff accumulation[45,46]Quantitative analysis of the slope indicator for drainage proposed by Miranda (2016)Low: 0.25; Medium: 0.50 or 0.75; High: 1
I5 Solid waste[3,44]Percentage of households where there is no garbage accumulated in public spacesLow: >70; Medium: between 70% and 30%; High: <30%
I6 Sewage[3,44]Percentage of sanitary sewage collection and treatment given by SSCT = C x T/100, where C is the sewage collection percentage and T is the percentage of sanitary sewage treatmentLow: >70%; Medium: between 70% and 30%; High: <30%
I7 Conservation status of the banks[3,44]Quantitative analysis of the banks indicator given by: B = NOB0.5x VC0.5/100, where NOB is the percentage of non-occupied banks and VC is the percentage of vegetal coverLow: >0.66; Medium: between 0.66 and 0.33; High: <0.33
I8 Sediment generation[22]Determination of the erosion susceptibility of the area through pedological and slope information and determination of the potential classification for sediment generation through the erosion susceptibility and soil use and occupation of the areaLow: low sediment generation potential; Medium: medium sediment generation potential; High: high or very high sediment generation potential
I9 Recreational areas and number of inhabitants[22]Mapping of recreational areas and the areas within 400 m distance from their limits. The areas within this range are classified as low priority and the others are classified according to the number of inhabitants: more inhabitants indicates a higher priorityLow: Areas within a 400 m radius of recreational areas; Medium: Areas outside a 400 m radius of recreational areas and with less than 150 Ihab/ha; High: Areas outside a 400 m radius of recreational areas and with more than 150 Ihab/ha
Table 4. Matrix for crossing criticality information and areas of opportunity to determine priority areas for river restoration.
Criticality Condition/
Location
Within the Opportunity AreaOutside the Opportunity Area
LowMedium priorityLow priority
MediumHigh priorityLow priority
HighHigh priorityMedium priority
Table 5. Criticality condition of watersheds by environmental service.
Environmental ServiceEquation
Water flow maintenanceCS1 = (I1 + I2 + I3)/3(2)
Sustainable flood managementCS2 = (I3 + I4)/2(3)
Water quality improvementCS3 = (I5 + I6 + I8)/3(4)
Source of water for supplyCS4 = (I1 + I5 + I6 + I8)/4(5)
Erosive processes controlCS5 = I8(6)
Maintenance of genetic diversity (gene flow)CS6 = I7(7)
Physical habitat quality improvementCS7 = (I2 + I5 + I6 + I7 + I8)/5(8)
Fisheries enhancementCS8 = (I5 + I6 + I7 + I8)/4(9)
Aesthetic improvements and recreationCS9 = (I5 + I6 + I7 + I8 + I9)/5(10)
Table 6. Data processing for obtaining the indicators for João Mendes Watershed.
IndicatorProcessing of Data for Obtaining the Indicator
I1 Conservation of SpringsBased on the hydrology database generated for this study, potential springs were also identified—for future confirmation—and their watersheds were delineated using geoprocessing tools. The classification of permeable and impermeable areas in the study region was obtained using satellite imagery from the CBERS-4A/WPM Sensor taken in April 2022.
I2 Riverbed PermeabilityFor the calculation of the permeability indicator of the João Mendes Riverbed, an average width of 4 m was considered, based on the hydrology database. Analyzing the 2019 orthophoto provided by the Municipal Government of Niterói, the land covers along the river course were examined using Street View images, along with several field visits conducted by the authors in the area.
I3 Surface Runoff GenerationThe calculation of the surface runoff generation indicator used the land use and occupation categorization data provided by the Municipal Government of Niterói.
I4 Surface Runoff AccumulationThe slopes were obtained through geoprocessing using the digital terrain model (DTM) of the João Mendes River Watershed. Subsequently, the slopes were reclassified according to the categories presented by Miranda et al. [45].
I5 Solid Waste and I6 SewageThe study of solid waste and sanitary sewage conditions in the João Mendes Watershed utilized as a data source the demographic census conducted by the Brazilian Institute of Geography and Statistics in 2010 [53]. Regarding the treatment of collected sewage, in the neighborhoods located within the João Mendes Watershed, the sewage is directed to the Itaipu Treatment Station. Therefore, it was assumed for the calculation of the CTE in this watershed that 100% of the collected sewage has adequate final disposal.
I7 Conservation Status of the BanksThe assessment of riverbank conditions in the João Mendes Watershed involved delineating 30 m wide strips based on the hydrology database. For the calculation of the sub-indicator NOB, an analysis of riverbank and riverbed occupancy was conducted using the land use and occupation data provided by the Municipal Government of Niterói. For the calculation of the sub-indicator VC, the land use classification obtained through geoprocessing using the CBERS-4A/WPM Sensor satellite image from April 2022 was utilized, considering the categories of dense vegetation, grass, and urban areas.
I8 Sediment GenerationTo determine soil erosion susceptibility in the João Mendes Watershed, the surface slope was obtained from its DTM, along with the soil classification database from the Brazilian Agricultural Research Corporation (Embrapa) for the state of Rio de Janeiro. To assess the potential for sediment generation, the land use and land cover data provided by the Municipal Government of Niterói were utilized.
I9 Recreational Areas and Number of InhabitantsFor mapping recreational areas in the João Mendes River Watershed, areas categorized as “recreation” were obtained from the land use and occupation database of Niterói, as well as park areas from the municipal squares database provided by the Municipal Government. Additionally, tourist and cultural heritage areas available on the Municipal Government website were included. Data on trails from both the Municipal Government of Niterói and the Serra da Tiririca State Park, as well as from the Wikiloc trail platform, were also utilized. Finally, recreational areas identified through the analysis of the municipality’s 2019 orthophoto were included, along with others known to the authors that were not mapped in the mentioned databases. The number of inhabitants was obtained from the Brazilian Institute of Geography and Statistics database, from the year 2010 [53].
Disclaimer/Publisher’s Note: The statements, opinions and data contained in all publications are solely those of the individual author(s) and contributor(s) and not of MDPI and/or the editor(s). MDPI and/or the editor(s) disclaim responsibility for any injury to people or property resulting from any ideas, methods, instructions or products referred to in the content.

