Abstract
Optimizing land use and management are pivotal for mitigating land use-related carbon emissions. Current studies are less focused on the influence of development policies and spatial planning on carbon emissions from land use. This research employs the future land use simulation (FLUS) model to project land-use alterations under the business-as-usual (BAU) and low-carbon ecological security (LCES) scenarios. It assesses and predicts spatiotemporal characteristics of land-use carbon emissions in the Beijing-Tianjin-Hebei (BTH) region across urban agglomerations, cities, counties, and grids from 2000 to 2030. The influence of low-carbon policy is assessed by comparing the land-use carbon emissions between scenarios. The findings demonstrate that: (1) Urban agglomeration-wise, Beijing’s land-use carbon emissions and intensities peaked and declined, while Tianjin and Hebei’s continued to rise. (2) City-wise, central urban areas generally have higher carbon emissions intensities than non-central areas. (3) County-wise, in 2030, high carbon-intensity counties cluster near development axes. Still, the BAU scenario has a larger carbon emission intensity and a greater range of higher intensities. (4) Grid-wise, in 2030, the BAU scenario shows a clear substitution of heavy carbon emission zones for medium ones, and the LCES scenario shows a clear substitution of carbon sequestration zones for light carbon emission zones. Our methodology and findings can optimize spatial planning and carbon reduction policies in the BTH urban agglomeration and similar contexts.
1. Introduction
Global climate change, primarily manifested through global warming, poses one of the most formidable problems to human society during the twenty-first century [1]. The ramifications of global warming encompass a multitude of adverse effects on natural systems, such as the thawing of snow and ice caps, the escalation of sea levels, and alterations in precipitation patterns [2]. These phenomena directly or indirectly jeopardize both natural and human systems, impacting water resources, marine and coastal environments, terrestrial ecosystems, agriculture, and human health, among others [3,4]. For example, climate change has resulted in increased evapotranspiration in the Mediterranean region, resulting in a marked decline in freshwater availability [5]. From 1979 to 2012, the Arctic sea ice area experienced an annual decline, averaging between 3.5% and 4.1% per year [6]. Additionally, China’s boreal forests are dwindling, and the productivity of Inner Mongolian grasslands is in decline [3]. Carbon emissions originating from fossil fuel consumption and land-use alterations are widely acknowledged as significant contributors to global warming [7]. According to relevant researchers’ research estimations, between 1850 and 1990, direct carbon emissions caused by land use and associated alterations constituted more than one-third of overall emissions of human activities [8]. The IPCC special study Climate Change and Land examines the connections underlying climate change and land use, arguing that sustainable land management policies facilitate the Sustainable Development Goals (SDGs). According to studies, land-use optimization and land management are essential strategies for mitigating carbon emissions [9,10,11,12,13].
Many countries have devised various strategies aimed at curbing carbon emissions; among them are land-use optimization and land management. The Kyoto Protocol and the Paris Agreement successively identified the importance of afforestation and reforestation activities in climate governance, recognized forest carbon sinks as an important measure for reducing carbon emissions, and encouraged parties to take positive action and provide incentives to reduce deforestation and forest degradation [14]. China has devised and executed many policies and projects to advance low-carbon and ecological development. Some of these policies and projects are aimed at ecological protection, such as the Natural Forest Resources Protection Project and the Returning Cultivated Land to Forests. The execution of these initiatives has expanded the expanse of ecological land and markedly enhanced the ecosystem’s carbon sink [15,16]. Other policies and projects aimed at protecting farmland include the farmland occupancy compensation balance policy and the permanent basic farmland protection policy. The implementation of the above-mentioned policies has mitigated the rapid decrease in farmland area. The synchronization between farmland resource protection and economic development has been partially accomplished [17]. The implementation of these policies and projects has regulated land-use change and increased ecosystem carbon sinks, but it still faces the problem of sustainability of implementation. Therefore, to support the realization of sustainable development further, the policy mechanism should be strengthened to connect carbon emission curbing through land-use optimization and management with other policies.
The prevailing research content about land-use carbon emissions primarily looks into the spatiotemporal characteristics [18], driving mechanisms [19], low-carbon optimization strategies [20], simulation predictions [21], and so on. The study scale involves countries [22], key regions [23], provinces [24], cities [25], etc. The primary techniques for quantifying carbon sources and sinks in terrestrial ecosystems involve top-down atmospheric inversion models [26], bottom-up ground surveys [27], process-based ecosystem models [28], bookkeeping models [29], etc. Based on the bookkeeping model, the IPCC Guidelines for National Greenhouse Gas Inventories proposed the carbon emission coefficient [30] and provided detailed accounting formulas and a database of emission factors, which offers a simple and practical approach for calculating carbon emissions from land use that is currently widely utilized globally [31]. So this research utilizes the carbon emission coefficient for assessing the carbon emissions linked to various land-use categories.
Three types of land use simulation models now in use are non-spatial models [32], spatial models [33], and comprehensive models [34]. The primary use of non-spatial models is the quantitative features and rate of predicted changes in land use using previous data or samples of training with adjusted parameters [20], which include Markov chain models [35], system dynamics models [36], linear programming models [37], gray models [38], etc. Spatial models express the attributes of spatial patterns of land-use alterations [39], which include the cellular automata model (CA) [40], the agent-based model [41], etc. Comprehensive models synthesize non-spatial and spatial models, which usually start by predicting the overall rate and quantity characteristics of land use at the macro scale, thereafter allocating these macro-scale alterations incrementally in total land-use demand to micro-spatial units [42]. Such models mainly include the CLUE-S model [43], the FLUS model [44], etc. The FLUS model couples a spatial model (modified CA model) and a non-spatial model (Markov chain model), which enables the land-use requirements and drivers in each simulated time series to feedback to each other [21]. So the FLUS model is employed for modeling prospective land-use alterations in this study.
Previous research has thoroughly examined variations in carbon emissions from land use, along with the factors that govern them. Jiang et al. (2017) investigated the alterations in carbon sequestration within the Changsha-Zhuzhou-Xiangtan region across diverse scenarios, including natural growth, agricultural protection, and ecological conservation, spanning the period from 2014 to 2030 [45]. Liu et al. (2019) further examined the implications of urbanization on land-use carbon emissions, using the Beijing-Tianjin-Hebei, Yangtze River Delta, and Pearl River Delta as illustrative cases [46]. Meng et al. (2023) identified economic scale and population size as the primary drivers of land-use carbon emissions in the Yellow River Basin [47]. However, previous studies have insufficiently highlighted and explored the ramifications of development policies and spatial planning on land-use changes [48]. This lack of perspective will likely lead to certain inaccuracies and limitations in land use simulation. Therefore, this study integrates low-carbon and eco-civilization policies and spatial planning into land use simulation and designs two development scenarios, business-as-usual (BAU) and low-carbon ecological security (LCES). It aims to reveal the potential impacts of policy and planning on land-use carbon emissions and offer insights for attaining carbon neutrality. In addition, most of the existing research scales are national, regional, and provincial, which makes it difficult to operationalize policies to smaller administrative units and spatial grids. Therefore, this study evaluates the alterations in carbon emissions caused by land use under alternative development scenarios at multiple scales of urban agglomeration, city, county, and grid. Policy recommendations applicable to multi-level administrative units and grids are also proposed.
The research examines the historical land-use changes and multi-scale land-use carbon emission alterations in the BTH region between 2000 and 2020. We also simulated land-use alterations between 2020 and 2030 under the BAU and LCES scenarios. The multi-scale carbon emission alterations from land use of urban agglomeration, city, county, and 3 km × 3 km grid under the influence of different policies are discussed. The study assesses the effects of the low-carbon policies by comparing the outcomes of land-use carbon emissions across two scenarios. Based on this, policy recommendations applicable to different levels of administrative units and grids are offered.
2. Materials and Methods
2.1. Study Area
The BTH region, located in northern China, spans roughly 218,000 square kilometers (Figure 1). This region displays a temperate climate with semi-humid to semi-arid characteristics, governed by a continental monsoon system. Winter conditions in this area are typically characterized by cold temperatures accompanied by minimal snowfall, whereas summers are distinguished by intense heat waves and substantial rainfall. The region comprises the municipalities of Beijing and Tianjin, along with 11 prefecture-level cities in Hebei Province, totaling 199 districts and counties. The BTH urban agglomeration, ranking among China’s three world-class urban agglomerations, functions as the country’s center of politics, culture, international exchanges, and science and technology innovation [49]. The BTH region will launch a carbon-neutrality demonstration zone and assume a leadership role in investigating pathways for carbon neutrality in accordance with national carbon-neutrality targets and implementation strategies [50]. In terms of physical geography, the region has a complex topography and distinctive climatic characteristics [51], and in terms of socioeconomic aspects, there are large spatial differences in population density and economic development in the region [52]. Consequently, there is a certain typicality to the research object selection—the BTH region—and the research findings have some guiding relevance for encouraging China’s advancement in low-carbon development.
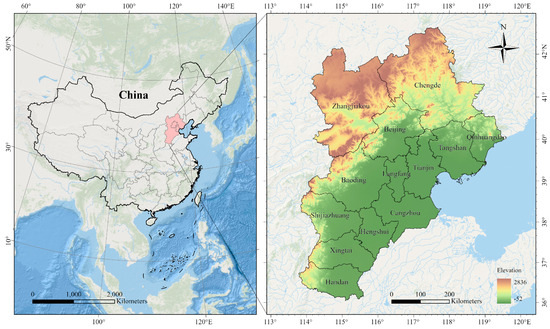
Figure 1.
Location and topography of the research area.
2.2. Research Framework
In this research, two scenarios, BAU and LCES, are first set up, and a Markov chain and linear programming model are used for land-use demand prediction. The second step involves simulating the space patterns of land-use alteration across various scenarios using the FLUS model. The third phase involves estimating and analyzing carbon emissions of land use under muti-scales, including urban agglomerations, cities, counties, and 3 × 3 kmgrids, using the carbon emission coefficient method (Figure 2).
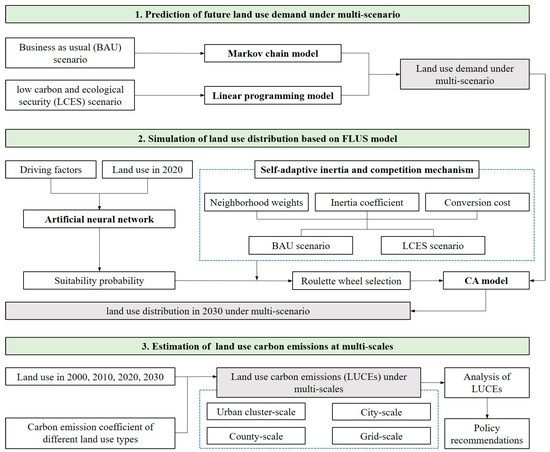
Figure 2.
Research method and flow.
2.3. Methodology
In this work, the space patterns of land-use alteration across multiple scenarios are simulated using the FLUS_V2.4 software model. Land-use carbon emissions are calculated using the carbon emission coefficient approach. Under the BAU scenario, the Markov chain model is utilized to model the prospective land-use requirements. In the LCES scenario, a linear programming model is employed to establish restrictions and construct an objective function for determining land-use requirements following a low-carbon objective.
2.3.1. Design of Different Scenarios
Two scenarios were proposed: the BAU scenario and the LCES scenario, based on relevant research [37,49,53] and current development situations and future development planning of the BTH region. The BAU scenarios were modeled with a Markov chain model using the 2010 to 2020 land-use transition matrix orthogonalized to obtain the transfer probability for land use through 2020 to 2030. The land-use requirement in the LCES scenario should take into account both the attainment of carbon-reduction objectives and adherence to national and local land-use policies and spatial planning regulations. A linear planning model is used to set the objective function, and the constraint requirements are set regarding the latest regional spatial planning and land-use policies of the BTH region to create the land-use demand in the LCES scenario from 2020 to 2030.
2.3.2. Markov Chain Model
The Markov chain model assumes that the probability of the system occupying a specific condition at the given moment can be calculated using an existing condition from a previous phase [54]. It is commonly utilized in predicting land-use alteration [55]. This study employed the Markov chain transition matrix to evaluate the interconversion connections among the different land-use category grids for the years 2010 to 2020. The land-use demand of the 2030 BAU scenario is obtained using the land-use distribution and transition matrix P orthogonalized from the years 2010 to 2020. This matrix is calculated using Equation (1), n represents the number of land-use grids, and Pij denotes the likelihood of conversion from category i to j (0 ≤ Pij ≤ 1).
2.3.3. Linear Programming Model
The foundation of the linear programming model is the establishment of objective functions and constraints upon which the optimal values of the decision variables are determined [56,57]. Equations (2) and (3) display the aim function for minimum land-use carbon emissions and restrictions for each category of land use.
In this equation, αi denotes s as a carbon emission coefficient corresponding to every land-use category, and S represents the area of the BTH region. Si1 and Si2 represent the lowest and highest points of the area for every land-use category. The area for every land-use category, denoted by xi, is measured in hectare (hm2).
Setting the maximum and minimum intervals for an area of the six land-use categories based on the Beijing City Master Plan (2016–2035), Spatial Planning of National Land in Hebei Province (2021–2035), Spatial Planning of National Land in Tianjin (2021–2035), and historical trends. Considering the requirement of quantity of cultivated land, it is installed that the cultivated land area in the LCES scenario in 2030 is greater than 97% of the 2020 level and greater than the cultivated area in the BAU scenario (S11 = 9,675,969, S12 = 9,875,473). To increase carbon sequestration and meet the requirements of the ecological red line, the area of forest land under the LCES scenario in 2030 is set to be larger than that in 2020 and exceed that under the BAU scenario (S21 = 4,599,870, S22 = 5,237,476). To mitigate carbon emissions and meet the requirements of the expansion multiplier of the urban development boundary, we need to limit the unlimited expansion in urban land. Therefore, the urban land area is set to be less than 1.1 times that in 2020 and inferior to the urban land area in the BAU scenario (S51 = 2,766,272, S52 = 2,913,388). Setting the amount of grassland, water area, and unused land derived from historical trends and associated studies [53] (S31 = 3,437,549, S32 = 3,914,041, S41 = 646,705, S42 = 736,347, S61 = 149,356, S62 = 164,292).
2.3.4. FLUS Model
The FLUS model is a modified CA model [21]. The likelihood for every land-use category occurring inside a grid unit is first calculated using an artificial neural network (ANN) algorithm informed by historical land use and driving elements. Then the adaptive inertia competition mechanism is also informed by historical land use, combining conversion costs, neighborhood impacts, and suitability probabilities to achieve a reasonable space allocation for the overall amount of each land category [34,58]. The equation works as follows:
represents the likelihood of converting a grid unit through the initial category c to the prospective objective category k at iterative time t. Pi,k, which is determined by an ANN model, is the land-use category’s probability of occurring on grid unit i. represents the neighborhood impact of category k on grid unit i at iterative time t, while conc→k represents the transformation matrix of the initial category c to the prospective objective category k.
This study utilized land-use alterations in the BTH region from 2000 to 2010 to predict land-use alterations in 2020, combined with drivers and constraints. To validate the simulation results for 2020, we employed actual land-use data from 2020 to compute the Kappa and FoM coefficients. The Kappa coefficient for the simulated outcome was found to be 0.8518, and the FoM coefficient was 0.0509, both of which fulfill the accuracy criteria. The validation results demonstrate that this methodology is capable of accurately estimating future land-use changes.
Additionally, in the LCES scenario, aside from the differing land-use requirements compared to the BAU scenario, neighborhood weights would need to be adjusted to adjust the expansion capacity for each land-use category. The neighborhood impact factor reflects the relationship among different land categories and land grids within the surrounding area. It takes a value between 0 and 1, with proximity to 1 indicating a higher expansion potential for the category. Considering the previous expansion index of each category between 2010 and 2020, referring to related studies [59,60] and after several tests and adjustments, the neighborhood weights are finally determined (Table 1).

Table 1.
Neighborhood weights of land-use categories.
2.3.5. Carbon Emission Coefficient
The carbon emission coefficient for non-construction land can be acquired through the IPCC and prior studies in analogous study regions [23,27,61,62,63,64]. The carbon emission coefficient for urban land is derived by dividing total carbon emissions from fossil fuel usage in the BTH region by total urban land area. The formulae are presented in Equation (5). Table 2 presents the carbon emission coefficients for land-use categories.
Table 2.
Carbon emission coefficient for land-use categories (t·hm−2·a−1).
Ce denotes the aggregate carbon emissions (ton). Si (hm2) denotes the area of land in category i. The carbon emission coefficient (t/hm2) for the ith land-use category is represented by αi. The construction land is represented by . The coefficient for construction land is denoted as . The extent of non-construction land is denoted by . The coefficient for non-construction land is denoted as .
2.4. Data Sources
The main sources of data for this research are land-use data, data on land-use drivers and constraints, and energy data. Natural elements (DEM, slope, aspect, temperature, and precipitation), transportation location elements (distance from the city center, railroads, and highways), and social and economic elements (population and GDP) are the spatial elements that influence shifts in land use in our research. Constraints include data about the boundaries of national nature reserves. The land use and DEM data are sourced from the Geospatial Data Cloud (http://www.gscloud.cn). GDP and population spatial interpolation data, temperature and precipitation spatial interpolation data, and national nature reserve boundary data are obtained from the Resource and Environmental Science and Data Center of the Chinese Academy of Sciences (https://www.resdc.cn/). Road data is obtained from Open Street Map (https://www.openstreetmap.org/). The resolution of all raster data is uniformly 100 × 100 m2, and all raster extent remains consistent.
3. Results
3.1. Historical Land Use and Land-Use Carbon Emission Alterations
3.1.1. Land-Use Changes Between 2000 and 2020
Table 3 shows the land-use transition matrix for the years 2000 to 2020. Table 4 shows the alterations that happened in each land-use category during that time. In terms of total change, cultivated land and urban land have experienced greater change, making up 10.42% and 8.09% of the entire area, respectively. This is followed by grassland, forest land, and water areas, which account for 4.30%, 3.29%, and 2.36%, respectively. The total change in unused land is relatively small at 0.99%. In addition, the composition of change is different for each land-use category. Among them, the main changes in forest land, grassland, water area, and unused land are exchange changes, i.e., the main form of change is the shift of spatial location, and the amount of exchange change reaches over 80% of the overall alteration in each of them. Cultivated land showed a net decrease and some exchange change, where the net change was 42% of the total change. Urban land showed a net increase and some exchange change, with the net change accounting for 57.2% of the total change. In terms of inter-category change, the migration of cultivated land into urban land is the predominant trend in land-use alteration between 2000 and 2020, particularly near built areas of Beijing, Tianjin, and other cities (Figure 3 and Figure 4).
Table 3.
Land-use transformation matrix in BTH between 2000 and 2020 (%).
Table 4.
Land-use change information in BTH between 2000 and 2020 (%).
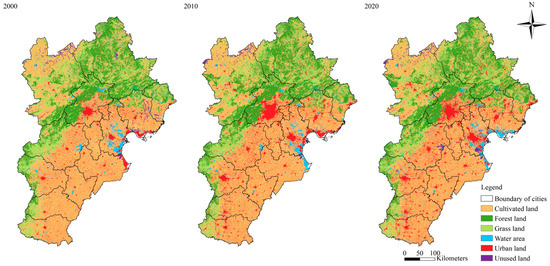
Figure 3.
Land use between 2000 and 2020.
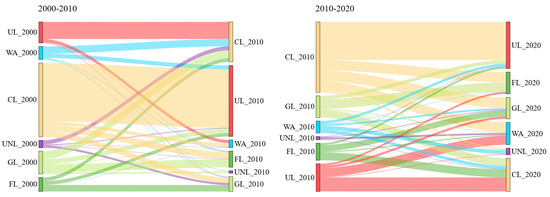
Figure 4.
Sankey diagram of conversion between land-use types between 2000 and 2020.
Beijing, the capital of China, is rich in forest land resources, with more than 45% of the overall area of forested land, predominantly located in the mountainous regions in the northwestern part of the city. From 2000 to 2020, Beijing’s urban land area expanded and subsequently fell, with an overall increasing tendency. In 2000, 2010, and 2020, Beijing’s urban land area was 13.68%, 23.41%, and 21.71%, respectively. Tianjin is rich in cultivated land and water areas, cultivated land constitutes roughly 51% of the entire area, and water area comprises around 13%, predominantly situated in the eastern coastal regions, major reservoirs, and river systems. In Tianjin, the area under cultivation decreased while the area under urbanization increased between 2000 and 2020, with the proportion rising from 15.58% to 26.46%. The primary land-use categories in Hebei Province are cultivated land, forest land, and grassland. Cultivated land, mostly in the southeast of the province, makes up more than 48% of the province’s entire area. Forest land accounts for more than 20% of the land and grassland for more than 17%, and they are mostly found in the mountainous regions of the northwest. In Hebei Province, the area under cultivation diminished while the area under urbanization expanded between 2000 and 2020, with the percentage of urban land rising from 7.18% to 11.13%.
3.1.2. Land-Use Carbon Emission Changes Between 2000 and 2020
(1) Historical land-use carbon emission changes at the urban agglomeration level
At the urban agglomeration scale, historical land-use carbon emissions have increased dramatically, from 15,971.28 × 104 tons in 2000 to 24,925.72 × 104 tons in 2020. However, compared to 2000 to 2010, there has been a notable deceleration in the increased rate of carbon emissions of land utilization between 2010 and 2020. Between 2000 and 2020, Beijing’s land-use carbon emissions and intensity increased initially before declining, whereas Tianjin and Hebei Province both continued to climb (Figure 5).
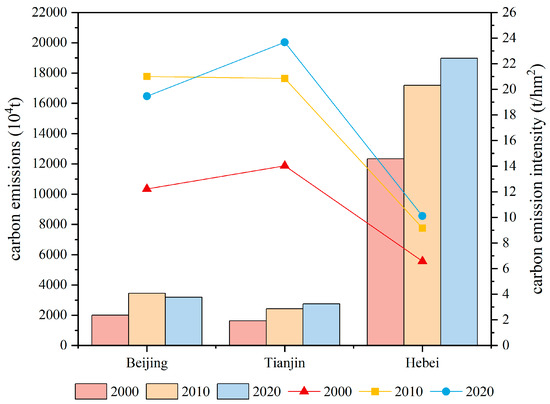
Figure 5.
Land-use carbon emissions (104t) and carbon emission intensity (t/hm2) at urban agglomeration scale.
(2) Historical land-use carbon emission changes at city, county, and grid levels
At the city scale, between 2000 and 2020, carbon emissions from land utilization in most cities increased, and only one city, Cangzhou, showed a small reduction in land-use carbon emissions (Figure 6). Cities exhibiting larger carbon emission intensity (t/hm2) were centered in the central urban areas of most cities in 2000, in the central cluster in 2010, and in the central cluster and the southern cluster in 2020 (Figure 7). We also investigated the connection between carbon intensity and whether a region is a central urban area or not to elucidate the characteristics of carbon intensity across different areas. As shown in Figure 7, except for Xingtai, the carbon emission intensity in the central urban area exceeds that of the non-central urban area in all other cities. Therefore, measures for zonal land-use optimization should be designed to reduce carbon emissions.
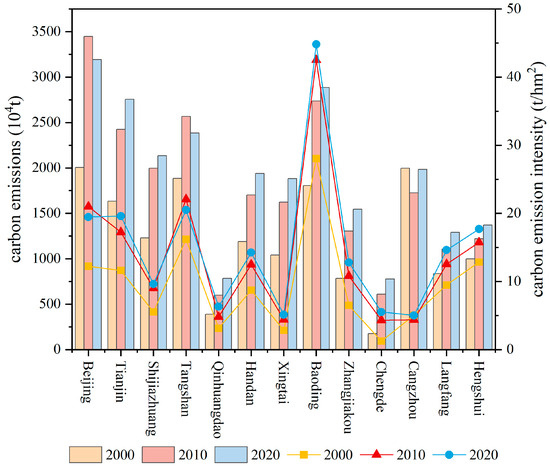
Figure 6.
Land-use carbon emissions (104t) and carbon emission intensity (t/hm2) at city scale.
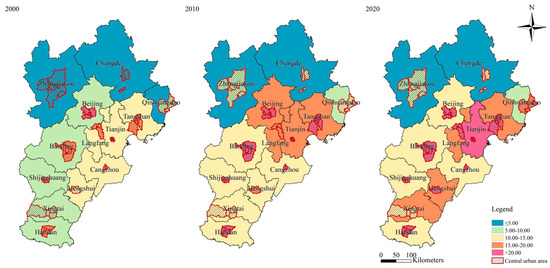
Figure 7.
Carbon emission intensity of central and non-central urban areas of different cities from 2000 to 2020.
At the county scale, counties with greater carbon intensity (t/hm2) in 2000 were dispersed near the central urban areas within the south-central cities. In 2010, they were concentrated around the “Beijing-Tianjin”, “Beijing-Longfang-Baoding-Shijiazhuang-Handan”, and “Zhangjiakou-Beijing-Tangshan-Qinhuangdao” development axes. In 2020, both the carbon emission intensity and the range of higher intensities increased near the development axis (Figure 8). From 2000 to 2020, most counties show an upward trend in land-use carbon emission intensity. Counties with decreasing or unchanged land-use carbon emission intensity are concentrated in Cangzhou City between 2000 and 2010, while from 2010 to 2020, such counties are primarily found in Beijing and the coastal regions of Tianjin and Tangshan City.
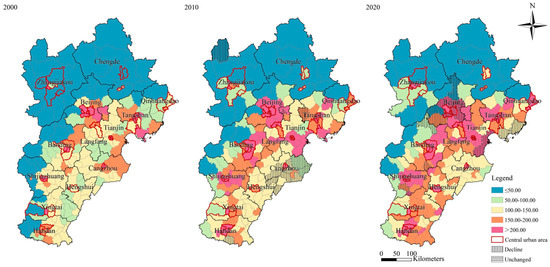
Figure 8.
Land-use carbon emissions at the county scale between 2000 and 2020.
At the 3 × 3 km grid scale, carbon emissions from land utilization could be categorized into four kinds: carbon sequestration (≤0 tons), light carbon emissions (0–5,000 tons), medium carbon emissions (5,000–20,000 tons), and heavy carbon emissions (≥20,000 tons) (Figure 9). Between 2000 and 2020, in total, the area of carbon sequestration areas decreases significantly, the area of heavy carbon emission areas increases significantly, and the regions of light and medium carbon emissions remain basically stable. In terms of transformation trend, there is a stepped transformation trend, i.e., the light carbon emission area replaces the carbon sequestration area, the medium carbon emission area replaces the light carbon emission area, and the heavy carbon emission area replaces the medium carbon emission area. Regarding spatial distribution, heavy carbon emission areas are constantly spreading to the periphery with the central urban areas and the development axis as the center, but the area of heavy carbon emission areas within coastal regions has decreased.
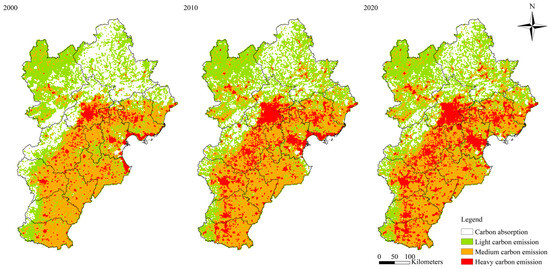
Figure 9.
Land-use carbon emissions at grid scale between 2000 and 2020.
3.2. Future Land Use and Land-Use Carbon Emission Alterations in Various Scenarios
3.2.1. Future Land-Use Changes in Various Scenarios
The land-use requirements for the BAU and LCES scenarios are shown in Table 5. Compared with 2020, cultivated land in both scenarios in 2030 shows a significant declining tendency (Figure 10), and forest land, grassland, water area, and urban land all show a growing tendency. The BAU scenario exhibits the most prominent shift of cultivated land toward urban land (Figure 11). The LCES scenario shows the most notable transfer of cultivated land into forest land and grassland. The rise in forest land and the fall in the transformation of cultivated land to urban land are the primary distinctions between the LCES scenario and the BAU scenario. The interface between cultivated and urban land is where the two scenarios’ spatial differences are most obvious.
Table 5.
Estimated land-use area under muti-scenarios (hm2).
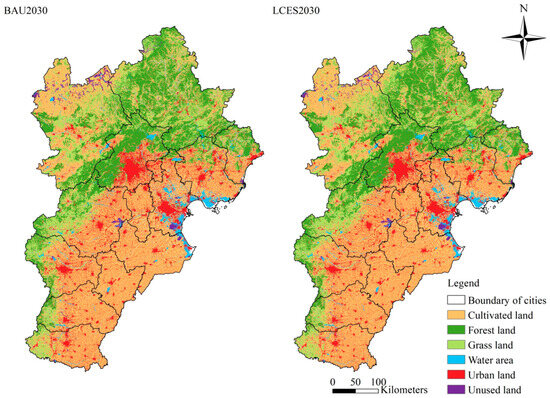
Figure 10.
Land use in 2030 under muti-scenarios.
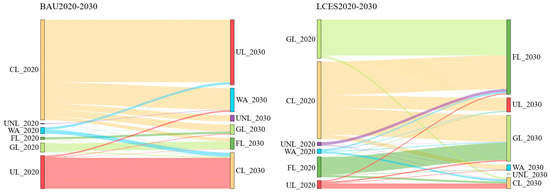
Figure 11.
Sankey diagram of conversion between land-use categories from 2020 to 2030 under muti-scenarios.
3.2.2. Future Land-Use Carbon Emission Changes in Various Scenarios
(1) Future land-use carbon emission changes at the urban agglomeration level
At the urban agglomeration scale, both land-use carbon emissions and growth rate in 2030 in the LCES scenario are significantly smaller than those under the BAU scenario, demonstrating the efficacy of the LCES scenario in reducing carbon emissions from land utilization. According to the BAU scenario and the LCES scenario, the carbon emissions from land utilization in 2030 will be 26,485.40 × 104 tons and 25,146.87 × 104 tons, respectively. In the LCES scenario, Beijing, Tianjin, and Hebei have less carbon emissions from land utilization and intensities compared to the BAU scenario (Figure 12).
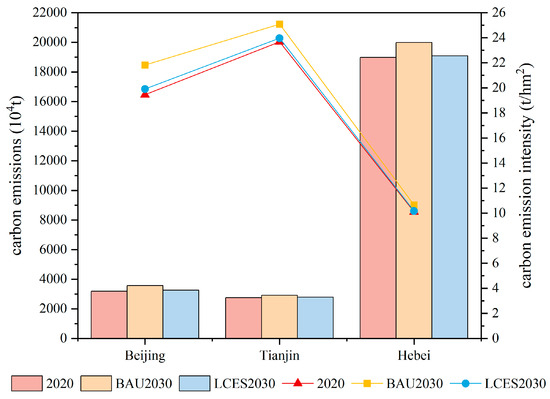
Figure 12.
Future land-use carbon emissions (104t) and carbon emission intensity (t/hm2) at urban agglomeration scale.
(2) Future land-use carbon emission changes at city, county, and grid levels
At the city level, in the LCES scenario, carbon emissions of land utilization are reduced compared to the BAU scenario for all 11 cities except Chengde and Zhangjiakou (Figure 13). The cities with larger carbon emission intensities (t/hm2) in both scenarios continue the 2020 trend and are concentrated in the central and southern cities (Figure 14). However, both the carbon emission intensity and the range of higher intensities are larger in the BAU scenario than in the LCES scenario. All cities, except Xingtai, have central urban areas with higher carbon emission intensities than non-central urban areas in both scenarios.
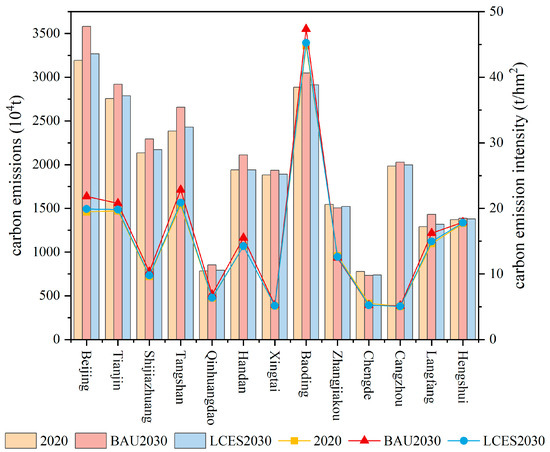
Figure 13.
Future land-use carbon emissions (104t) and carbon emission intensity (t/hm2) at city scale.
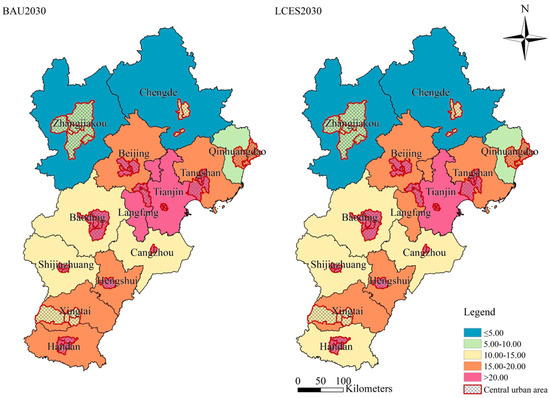
Figure 14.
Carbon emission intensity of central and non-central urban areas of different cities under muti-scenarios.
At the county scale, under the LCES scenario, 158 of 199 counties exhibit reduced carbon emissions from land utilization compared to the BAU scenario. Under both scenarios, the counties with larger carbon emission intensity (t/hm2) continue the distribution trend of 2020 and are concentrated near the development axes of “Beijing-Tianjin”, “Beijing-Longfang-Baoding-Shijiazhuang-Handan”, and “Zhangjiakou-Beijing-Tangshan-Qinhuangdao.” However, the BAU scenario exhibits greater carbon emission intensity and higher intensity range than the LCES scenario (Figure 15). Compared to 2020, 51 counties in the BAU scenario and 75 counties in the LCES scenario show decreasing or unchanged trends in land-use carbon intensity. Most of the counties with decreasing or unchanged intensity are concentrated in the northwest ecological conservation area. The LCES scenario has a larger range of declining or unchanged counties than the BAU scenario.
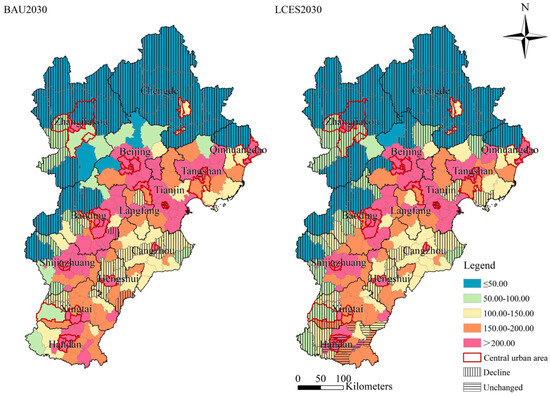
Figure 15.
Land-use carbon emissions at county scale under muti-scenarios.
At the 3 × 3 km grid scale, land-use carbon emissions were similarly divided into four types: carbon sequestration (≤0 tons), light carbon emissions (0–5,000 tons), medium carbon emissions (5,000–20,000 tons), and heavy carbon emissions (≥20,000 tons) (Figure 16). In terms of total area, both scenarios show an increase in heavy carbon emission zones in 2030 compared to 2020, but the area of light and medium carbon emission zones decreases, and the area of carbon sequestration zones increases. In terms of conversion trends, the BAU scenario shows a clear substitution of heavy carbon sequestration zones for medium carbon sequestration zones, and the LCES scenario shows a clear substitution of carbon sequestration zones for light carbon emission zones. Regarding spatial allocation, the LCES scenario has a smaller area of heavy carbon emission zones than the BAU scenario; this difference is particularly noticeable near the development axis and a larger area of carbon sequestration zones than the BAU scenario, which is particularly noticeable near the northwestern ecological conservation region.
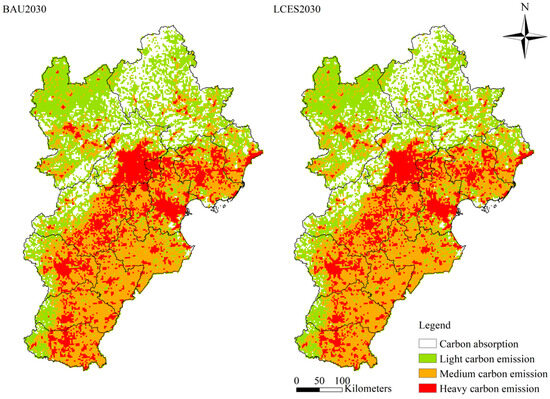
Figure 16.
Land-use carbon emissions at grid scale under muti-scenarios.
We identified two representative counties in each of the four types of functional areas of the BTH region—the central core functional area, the southern functional expansion area, the eastern coastal development area, and the northwestern ecological conservation area [65,66]—and analyzed the detailed differences in land-use carbon emissions between 2020 and 2030 under two scenarios (Figure 17). The representative counties in the southern functional expansion area and the central core functional area have less heavy carbon emission zones in the LCES scenario compared to the BAU scenario, as can be shown. The representative counties in the eastern coastal development area show little difference between the two scenarios. Relative to the BAU scenario, the representative counties in the northwestern ecological conservation area have bigger carbon sequestration zones under the LCES scenario. Land-use optimization by zoning can therefore be done concerning the LCES scenario.
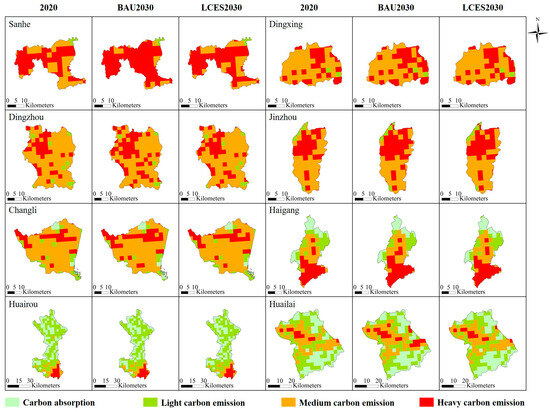
Figure 17.
Land-use carbon emissions of eight representative counties at grid scale.
4. Discussion
4.1. Factors Influencing Land-Use Carbon Emissions
4.1.1. Impact of Urbanization on Carbon Emissions from Land Use
The growth of urban land resulting from rapid urbanization, coupled with the decline of cultivated and ecological land, will result in heightened regional land-use carbon emissions. Since China acceded to the WTO, the nation has witnessed a significant increase in industrialization and urbanization. Between 2000 and 2010, the population of the BTH region rose from 91.27 to 104.55 million, while the GDP increased from 920.708 to 4373.23 billion yuan. This rapid growth drove a substantial increase in carbon emissions from land utilization [67]. Other research has echoed these findings. For instance, Li et al. (2023) observed a declining trend in carbon sequestration in Liaoning Province from 2000 to 2020 due to extensive urban expansion [68]. Xiang et al. (2022) noted that the swift urbanization and industrialization in the central urban area of Chongqing over the past two decades resulted in the transformation of extensive farmland into urban land, leading to a reduction in regional carbon sequestration [69]. Still, post-2010, the pace of urban land expansion in the BTH region markedly slowed down due to the deceleration of urbanization and the implementation of the National Planning for Development Priority Zones [70]. Consequently, the pace of growth in carbon emissions from urban land use also has notably diminished.
4.1.2. Impact of Development Policies and Spatial Planning on Carbon Emissions from Land Use
Socioeconomic development policies constitute a pivotal factor shaping the spatial allocation of land-use carbon emissions. The three development axes outlined in the Beijing-Tianjin-Hebei Cooperative Development Plan have a notable impact on the spatial configuration of this region. Their objective is to foster the concentration of industrial components along these axes, thereby fostering the creation of industrial development corridors and urban-rural development belts. Consequently, counties exhibiting higher carbon emission intensities also exhibit clustering along these development axes, a phenomenon corroborated by the findings of other scholars. Fang et al., for instance, revealed that post-2010, under the influence of strategies such as The Development of the Western Region in China and The Rise of Central China, areas with significant carbon emissions in the Yangtze River Economic Belt expanded into the central and upper segments of the Yangtze River [71].
Active farmland conservation and ecological protection policies can markedly diminish the land-use carbon emission intensity. In Cangzhou City, land improvement initiatives from 2000 to 2010 led to a reduction in non-essential urban land [72], ultimately leading to a decline in land-use carbon emission intensity in 2010 compared to 2000. Furthermore, the Bohai Sea Comprehensive Management Action Plan, introduced in 2018, advocates for a halt to coastal reclamation and the rectification of illegally occupied ecological protection zones [73]. Consequently, the intensity of land-use carbon emissions in the coastal areas of Tianjin and Tangshan decreased from 2010 to 2020. Comparable findings have been found in previous research. Gong et al. (2023), for instance, discovered that between 1990 and 2000, Hainan Province transferred the greatest amount of carbon storage from farmland to forest land (2.59 × 10⁵ tons) due to the enforcement of ecological policies, such as the “return of grain plots to forestry” initiative [74].
4.2. Recommendations for Low-Carbon Development at Various Scales
According to the above research, it is proposed to implement low-carbon solutions in land-use restructuring at multiple scales of urban agglomeration, city, county, and grid to furnish a robust reference for carbon emission reduction and sink enhancement.
At the urban agglomeration scale, ecological protection and farmland conservation policies should continue to be implemented. Beijing’s non-capital functions should be relieved, and the coordinated development of Beijing-Tianjin-Hebei should be promoted. The ecological security barrier in the northwestern part of the region should be strengthened, and linked development should be carried out along the development axis. Exploring a cross-regional compensation mechanism for carbon emissions to safeguard the high-quality development of core functional regions such as Beijing and Tianjin and to encourage the sustainable development of ecological conservation areas such as Chengde City and Zhangjiakou City.
At the city scale, promote the progression of the BTH region from a single core to dual and multiple cores. Strategies for optimizing land use in central urban areas and non-central urban areas should be set up in zones. The entire quantity of urban land and new increments should be controlled, the revival and usage of urban land inventory in the central urban area should be promoted, and ecological land and cultivated land in non-central urban areas should be protected. Quantitative restrictions and spatial allocation of land-use categories can be made concerning the LCES scenarios. It can be combined with energy emission reduction, industrial emission reduction, and other ways to reduce unit urban land carbon emissions.
At the county scale, land-use optimization plans for reducing carbon emissions should be formulated differently based on the functional positioning of different counties, taking into account elements like the level of development, resource endowment, and potential for emission reduction. For example, for counties located in the vicinity of the development axis, the policy of controlling their urban land is appropriately relaxed. For low-carbon emission counties located in ecological conservation areas, their existing land-use structure can be maintained, and the areas of forest land, grassland, and water area should be strictly controlled. For high-carbon emission counties located in core functional and functional expansion areas, the urban land-use policies can be reasonably tightened. For high-carbon emission counties located in coastal development areas, coastal ecological protection and restoration policies should be implemented. For counties located between the development axis and the ecological conservation area, their land-use carbon emissions under the LCES scenario have decreased compared to 2020, and they have a higher potential to mitigate carbon emissions, which could be identified as a priority development area for carbon reduction. It might also refer to the LCES scenario for improving land-use configuration and executing land remediation policies.
At the grid scale, land-use control should be enhanced, and multiple land-use scales and land-use carbon emission zone classifications should call for diverse approaches. Particular attention should be paid to areas transformed from medium to heavy carbon emission zones and from carbon sequestration to low carbon emission zones in the BAU scenario, and the allocation of land-use categories can be made concerning the LCES scenario. For carbon sequestration zones mostly constituted of forest land and grassland, the existing ecological land should be strictly protected. For low-carbon emission zones mostly constituted of cultivated land and secondarily composed of grassland and forest land, the preservation of ecological land and cultivated land should be prioritized in carbon emission reduction efforts. For medium-carbon emission zones mainly composed of cultivated land and secondarily composed of urban land, the protection of cultivated land should be prioritized. For heavy-carbon emission zones mainly composed of urban land and secondarily composed of cultivated land, the increase of additional urban land should be curtailed, and the utilization efficiency of urban land should be improved to reduce unit urban land carbon emissions.
4.3. Limitations and Future Research
First, the LCES scenario is predicated on the objective function setting of land-use requirements informed by spatial planning and other constraints. Due to the problem of data accessibility, areas such as prime reserve farmland were not set as restricted conversion areas, and more improvement is required for future LCES scenarios.
Secondly, this study employs the carbon emission coefficient approach to quantify land-use carbon emissions. Owing to the scarcity of early energy statistics, the indirect carbon emission coefficients utilized in this research were obtained from the average total energy consumption and urban land area in the BTH region spanning from 2000 to 2020. Future endeavors should account for variations in the temporal and regional scope of indirect carbon emission coefficients. The direct carbon emission coefficients referenced in this research are based on IPCC and existing studies conducted in comparable regions of China. However, it should be noted that, due to the absence of a ground survey in this study, the accuracy of these coefficients in the BTH region remains unverified. Future research should endeavor to enhance estimation accuracy by integrating carbon emission coefficients with ground survey methodologies.
Finally, this research offers valuable insights into achieving low-carbon development through land-use management. However, efforts to combat climate change from the land can partly solve the problem, but they also have limitations and do not completely solve the problem [75]. Future research could explore carbon neutrality in conjunction with other areas, such as energy reduction and industrial reduction.
Notwithstanding the aforementioned limitations, our research advances the theory of land-use optimization as well as land management. Our methodology and findings can be applied to improve carbon reduction policies and spatial planning in the BTH urban agglomeration and other places encountering analogous difficulties.
5. Conclusions
This research assesses and simulates alterations in land-use carbon emissions within the BTH region under two distinct scenarios, utilizing the FLUS model alongside the carbon emission coefficient approach. It examines the characteristics of land-use carbon emissions across multiple spatial scales, including urban agglomerations, cities, counties, and grids. Furthermore, it delves into the impact of urbanization, development strategies, and spatial planning of land-use carbon emissions. The findings provide insights for policymakers to formulate optimized land-use strategies in pursuit of carbon-neutrality goals.
The research findings indicate that the transformation of cultivated land to urban land was most significant between 2000 and 2020. From 2000 to 2020, land-use carbon emissions in the BTH region increased from 15,971.28 × 104 tons to 24,925.72 × 104 tons. The land-use carbon emissions under the BAU and LCES scenarios in 2030 are 26,485.40 × 104 and 25,146.87 × 104 tons, respectively. City-wise, the central urban areas of most cities exhibit higher carbon emission intensities. County-wise, counties with elevated carbon emissions are found near the development axis. Urbanization significantly contributes to the rise of carbon emissions from land use, while socioeconomic development policy is a crucial determinant of the spatial distribution of land-use carbon emissions. Proactive policies aimed at preserving cultivated and ecological lands can effectively mitigate the land-use carbon emission intensity. Consequently, policymakers should strive to enhance land use across various scales to improve the efficacy of land-use planning in attaining carbon-neutrality targets.
This study introduces a methodology for estimating land-use carbon emissions within the context of carbon-neutrality targets. The results of this research hold significant implications for optimizing land-use practices and reducing carbon emissions in the BTH region, as well as in other comparable regions globally. Furthermore, the study offers insights for advancing sustainable development goals and mitigating the impacts of climate change. Future efforts should concentrate on improving the accuracy of carbon emission coefficients to furnish more accurate predictions of land-use carbon emissions.
Author Contributions
Conceptualization, W.L. and Y.X.; methodology, W.L., Y.X. and P.Z.; software, W.L.; validation, W.L. and Y.X.; formal analysis, W.L.; data curation, W.L.; writing—original draft, W.L.; writing—review and editing, Y.X. and P.Z.; visualization, W.L.; supervision, Y.X. and P.Z.; funding acquisition, Y.X. All authors have read and agreed to the published version of the manuscript.
Funding
This study is supported by the 2022 Annual Project of Tianjin Philosophy and Social Sciences Planning (TJGL22-012).
Data Availability Statement
The data presented in this study are available on request from the corresponding author. The data are not publicly available because research is ongoing.
Conflicts of Interest
The authors declare no conflicts of interest.
References
- JingYun, F.; JiangLing, Z.; ShaoPeng, W.; Chao, Y.; HaiHua, S. Global Warming, Human-Induced Carbon Emissions, and Their Uncertainties. Sci. China Earth Sci. 2011, 54, 1458–1468. [Google Scholar]
- Solomon, S.; Plattner, G.-K.; Knutti, R.; Friedlingstein, P. Irreversible Climate Change Due to Carbon Dioxide Emissions. Enrivon. Sci. 2009, 106, 1704–1709. [Google Scholar] [CrossRef] [PubMed]
- Wu, S. Research Progress in Climate Change Impact, Risk, and Adaptation: An Interpretation of Part 2 of China’s Fourth National Assessment Report on Climate Change. China Popul. Resour. Environ. 2023, 33, 80–86. [Google Scholar]
- Cramer, W. Climate Change and Interconnected Risks to Sustainable Development in the Mediterranean. Nat. Clim. Chang. 2018, 8, 972–980. [Google Scholar] [CrossRef]
- Field, C.; Barros, V.R.; Dokken, D.J.; Mach, K.J.; Mastrandrea, M.D.; Bilir, T.E.; Chatterjhee, M.; Ebi, K.L.; Estrada, Y.O.; Genova, R.C.; et al. Climate Change 2014: Impacts, Adaptation, and Vulnerability. Part A: Global and Sectoral Aspects. Contribution of Working Group II to the Fifth Assessment Report of the Intergovernmental Panel on Climate Change; Cambridge Univeristy Press: New York, NY, USA, 2014. [Google Scholar]
- Hoegh-Guldberg, O.; Jacob, D.; Taylor, M.; Guillén Bolaños, T.; Bindi, M.; Brown, S.; Camilloni, I.A.; Diedhiou, A.; Djalante, R.; Ebi, K.; et al. The Human Imperative of Stabilizing Global Climate Change at 1.5 °C. Science 2019, 365, eaaw6974. [Google Scholar] [CrossRef] [PubMed]
- Gleick, P.H.; Adams, R.M.; Amasino, R.M.; Anders, E.; Anderson, D.J.; Anderson, W.W.; Anselin, L.E.; Arroyo, M.K.; Asfaw, B.; Ayala, F.J.; et al. Climate Change and the Integrity of Science. Science 2010, 328, 689–690. [Google Scholar] [CrossRef]
- Houghton, R.A.; House, J.I.; Pongratz, J.; Van Der Werf, G.R.; DeFries, R.S.; Hansen, M.C.; Le Quéré, C.; Ramankutty, N. Carbon Emissions from Land Use and Land-Cover Change. Biogeosciences 2012, 9, 5125–5142. [Google Scholar] [CrossRef]
- Harper, A.B.; Powell, T.; Cox, P.M.; House, J.; Huntingford, C.; Lenton, T.M.; Sitch, S.; Burke, E.; Chadburn, S.E.; Collins, W.J.; et al. Land-Use Emissions Play a Critical Role in Land-Based Mitigation for Paris Climate Targets. Nat. Commun. 2018, 9, 2938. [Google Scholar] [CrossRef] [PubMed]
- Chuai, X.; Huang, X.; Qi, X.; Li, J.; Zuo, T.; Lu, Q.; Li, J.; Wu, C.; Zhao, R. A Preliminary Study of the Carbon Emissions Reduction Effects of Land Use Control. Sci. Rep. 2016, 6, 36901. [Google Scholar] [CrossRef]
- Fan, X.; Ma, Z.; Yang, Q.; Han, Y.; Mahmood, R.; Zheng, Z. Land Use/Land Cover Changes and Regional Climate over the Loess Plateau during 2001–2009. Part I: Observational Evidence. Clim. Chang. 2015, 129, 427–440. [Google Scholar] [CrossRef]
- Luyssaert, S.; Jammet, M.; Stoy, P.C.; Estel, S.; Pongratz, J.; Ceschia, E.; Churkina, G.; Don, A.; Erb, K.; Ferlicoq, M.; et al. Land Management and Land-Cover Change Have Impacts of Similar Magnitude on Surface Temperature. Nat. Clim. Chang. 2014, 4, 389–393. [Google Scholar] [CrossRef]
- Zhao, R.; Huang, X.; Zhong, T.; Chuai, X. Carbon Effect Evaluation and Low-Carbon Optimization of Regional Land Use. Trans. Chin. Soc. Agric. Eng. 2013, 29, 220–229. [Google Scholar]
- Ma, X.; Wang, Y.; Liu, C.; Zhu, Y.; Wang, Z.; Yu, F. Effect of Carbon Tax Policy on Agricultural Land Use Change and Its Carbon Emission. Acta Ecol. Sin. 2019, 39, 1815–1828. [Google Scholar]
- Zhu, J.; Zheng, X. The Prospects of Development of the Three-North Afforestation Program (TNAP): On the Basis of the Results of the 40-Year Construction General Assessment of the TNAP. Chin. J. Ecol. 2019, 38, 1600–1610. [Google Scholar] [CrossRef]
- Liu, Y.; Yang, L.; Zhang, J.; Zhang, J.; Li, X.; Zhu, N.; Zhou, M. Evolution and Assessment of Forest Carbon Sink Policy over the Past 20 Years. Acta Ecol. Sin. 2023, 43, 3430–3441. [Google Scholar]
- Jiang, Y.; Pu, L.; Zhu, M.; Huang, S.; Liu, R. Progress and Review of the Research of Farmland Requisition-Compensation Balance in China. Resour. Sci. 2019, 41, 2342–2355. [Google Scholar] [CrossRef]
- Yao, Y.; Sun, Z.; Li, L.; Cheng, T.; Chen, D.; Zhou, G.; Liu, C.; Kou, S.; Chen, Z.; Guan, Q. CarbonVCA: A Cadastral Parcel-Scale Carbon Emission Forecasting Framework for Peak Carbon Emissions. Cities 2023, 138, 104354. [Google Scholar] [CrossRef]
- Zhao, C. Effects of Land-Use Change on Carbon Emission and Its Driving Factors in Shaanxi Province from 2000 to 2020. Environ. Sci. Pollut. Res. 2023, 30, 68313–68326. [Google Scholar] [CrossRef] [PubMed]
- Li, W.; Chen, Z.; Li, M.; Zhang, H.; Li, M.; Qiu, X.; Zhou, C. Carbon Emission and Economic Development Trade-Offs for Optimizing Land-Use Allocation in the Yangtze River Delta, China. Ecol. Indic. 2023, 147, 109950. [Google Scholar] [CrossRef]
- Liu, X.; Liang, X.; Li, X.; Xu, X.; Ou, J.; Chen, Y.; Li, S.; Wang, S.; Pei, F. A Future Land Use Simulation Model (FLUS) for Simulating Multiple Land Use Scenarios by Coupling Human and Natural Effects. Landsc. Urban Plan. 2017, 168, 94–116. [Google Scholar] [CrossRef]
- Rong, T.; Zhang, P.; Zhu, H.; Jiang, L.; Li, Y.; Liu, Z. Spatial Correlation Evolution and Prediction Scenario of Land Use Carbon Emissions in China. Ecol. Inform. 2022, 71, 101802. [Google Scholar] [CrossRef]
- Zhang, C.; Zhao, L.; Zhang, H.; Chen, M.; Fang, R.; Yao, Y.; Zhang, Q.; Wang, Q. Spatial-Temporal Characteristics of Carbon Emissions from Land Use Change in Yellow River Delta Region, China. Ecol. Indic. 2022, 136, 108623. [Google Scholar] [CrossRef]
- Rahaman, Z.A.; Kafy, A.-A.; Saha, M.; Rahim, A.A.; Almulhim, A.I.; Rahaman, S.N.; Fattah, M.A.; Rahman, M.T.; Kalaivani, S.; Faisal, A.-A.; et al. Assessing the Impacts of Vegetation Cover Loss on Surface Temperature, Urban Heat Island and Carbon Emission in Penang City, Malaysia. Build. Environ. 2022, 222, 109335. [Google Scholar] [CrossRef]
- Zhang, M.; Kafy, A.-A.; Xiao, P.; Han, S.; Zou, S.; Saha, M.; Zhang, C.; Tan, S. Impact of Urban Expansion on Land Surface Temperature and Carbon Emissions Using Machine Learning Algorithms in Wuhan, China. Urban Clim. 2023, 47, 101347. [Google Scholar] [CrossRef]
- White, E.D.; Rigby, M.; Lunt, M.F.; Smallman, T.L.; Comyn-Platt, E.; Manning, A.J.; Ganesan, A.L.; O’Doherty, S.; Stavert, A.R.; Stanley, K.; et al. Quantifying the UK’s Carbon Dioxide Flux: An Atmospheric Inverse Modelling Approach Using a Regional Measurement Network. Atmos. Chem. Phys. 2019, 19, 4345–4365. [Google Scholar] [CrossRef]
- Fang, J.; Guo, Z.; Piao, S.; Chen, A. Estimation of Carbon Sinks of Terrestrial Vegetation in China from 1981 to 2000. Sci. Sin. (Terrae) 2007, 37, 804–812. [Google Scholar]
- Piao, S.; Fang, J.; Ciais, P.; Peylin, P.; Huang, Y.; Sitch, S.; Wang, T. The Carbon Balance of Terrestrial Ecosystems in China. Nature 2009, 458, 1009–1013. [Google Scholar] [CrossRef] [PubMed]
- Houghton, R.A.; Nassikas, A.A. Global and Regional Fluxes of Carbon from Land Use and Land Cover Change 1850–2015. Glob. Biogeochem. Cycles 2017, 31, 456–472. [Google Scholar] [CrossRef]
- Grassi, G.; Schwingshackl, C.; Gasser, T.; Houghton, R.A.; Sitch, S.; Canadell, J.G.; Cescatti, A.; Ciais, P.; Federici, S.; Friedlingstein, P.; et al. Harmonising the Land-Use Flux Estimates of Global Models and National Inventories for 2000–2020. Earth Syst. Sci. Data 2023, 15, 1093–1114. [Google Scholar] [CrossRef]
- Chuai, X.; Huang, X.; Wang, W.; Zhao, R.; Zhang, M.; Wu, C. Land Use, Total Carbon Emissions Change and Low Carbon Land Management in Coastal Jiangsu, China. J. Clean. Prod. 2015, 103, 77–86. [Google Scholar] [CrossRef]
- Muller, M.R.; Middleton, J. A Markov Model of Land-Use Change Dynamics in the Niagara Region, Ontario, Canada. Landsc. Ecol. 1994, 9, 151–157. [Google Scholar] [CrossRef]
- Wang, J.; Bretz, M.; Dewan, M.A.A.; Delavar, M.A. Machine Learning in Modelling Land-Use and Land Cover-Change (LULCC): Current Status, Challenges and Prospects. Sci. Total Environ. 2022, 822, 153559. [Google Scholar] [CrossRef] [PubMed]
- Liang, X.; Liu, X.; Li, X.; Chen, Y.; Tian, H.; Yao, Y. Delineating Multi-Scenario Urban Growth Boundaries with a CA-Based FLUS Model and Morphological Method. Landsc. Urban Plan. 2018, 177, 47–63. [Google Scholar] [CrossRef]
- Fu, F.; Deng, S.; Wu, D.; Liu, W.; Bai, Z. Research on the Spatiotemporal Evolution of Land Use Landscape Pattern in a County Area Based on CA-Markov Model. Sustain. Cities Soc. 2022, 80, 103760. [Google Scholar] [CrossRef]
- Shen, Q.; Chen, Q.; Tang, B.; Yeung, S.; Hu, Y.; Cheung, G. A System Dynamics Model for the Sustainable Land Use Planning and Development. Habitat Int. 2009, 33, 15–25. [Google Scholar] [CrossRef]
- Liu, J.; Peng, K.; Zuo, C.; Li, Q. Spatiotemporal Variation of Land-Use Carbon Emissions and Its Implications for Low Carbon and Ecological Civilization Strategies: Evidence from Xiamen-Zhangzhou-Quanzhou Metropolitan Circle, China. Sustain. Cities Soc. 2022, 86, 104083. [Google Scholar] [CrossRef]
- Ding, S.; Xu, N.; Ye, J.; Zhou, W.; Zhang, X. Estimating Chinese Energy-Related CO2 Emissions by Employing a Novel Discrete Grey Prediction Model. J. Clean. Prod. 2020, 259, 120793. [Google Scholar] [CrossRef]
- Tang, H.J.; Wu, W.B.; Yang, P.; Chen, Y.Q.; Verburg, P.H. Recent Progresses of Land Use and Land Cover Change (LUCC) Models. Acta Geogr. Sin. 2009, 64, 456–468. [Google Scholar]
- Li, X.; Chen, Y.; Liu, X.; Li, D.; He, J. Concepts, Methodologies, and Tools of an Integrated Geographical Simulation and Optimization System. Int. J. Geogr. Inf. Sci. 2011, 25, 633–655. [Google Scholar] [CrossRef]
- Zhao, X.; Ma, X.; Tang, W.; Liu, D. An Adaptive Agent-Based Optimization Model for Spatial Planning: A Case Study of Anyue County, China. Sustain. Cities Soc. 2019, 51, 101733. [Google Scholar] [CrossRef]
- He, C.; Zhang, J.; Liu, Z.; Huang, Q. Characteristics and Progress of Land Use/Cover Change Research during 1990–2018. J. Geogr. Sci. 2022, 32, 537–559. [Google Scholar] [CrossRef]
- Peng, K.; Jiang, W.; Ling, Z.; Hou, P.; Deng, Y. Evaluating the Potential Impacts of Land Use Changes on Ecosystem Service Value under Multiple Scenarios in Support of SDG Reporting: A Case Study of the Wuhan Urban Agglomeration. J. Clean. Prod. 2021, 307, 127321. [Google Scholar] [CrossRef]
- Wu, J.; Luo, J.; Zhang, H.; Qin, S.; Yu, M. Projections of Land Use Change and Habitat Quality Assessment by Coupling Climate Change and Development Patterns. Sci. Total Environ. 2022, 847, 157491. [Google Scholar] [CrossRef]
- Jiang, W.; Deng, Y.; Tang, Z.; Lei, X.; Chen, Z. Modelling the Potential Impacts of Urban Ecosystem Changes on Carbon Storage under Different Scenarios by Linking the CLUE-S and the InVEST Models. Ecol. Model. 2017, 345, 30–40. [Google Scholar] [CrossRef]
- Liu, X.; Wang, S.; Wu, P.; Feng, K.; Hubacek, K.; Li, X.; Sun, L. Impacts of Urban Expansion on Terrestrial Carbon Storage in China. Environ. Sci. Technol. 2019, 53, 6834–6844. [Google Scholar] [CrossRef] [PubMed]
- Meng, Q.; Zheng, Y.; Liu, Q.; Li, B.; Wei, H. Analysis of Spatiotemporal Variation and Influencing Factors of Land-Use Carbon Emissions in Nine Provinces of the Yellow River Basin Based on the LMDI Model. Land 2023, 12, 437. [Google Scholar] [CrossRef]
- Liang, X. Urban Growth Simulation by Incorporating Planning Policies into a CA-Based Future Land-Use Simulation Model. Int. J. Geogr. Inf. Sci. 2018, 32, 2294–2316. [Google Scholar] [CrossRef]
- Ren, Y.; Liu, X.; Xu, X.; Sun, S.; Zhao, L.; Liang, X.; Zeng, L. Multi-Scenario Simulation of Land Use Change and Its Impact on Ecosystem Services in Beijing-Tianjin-Hebei Region Based on the FLUS-InVEST Model. Acta Ecol. Sin. 2023, 43, 4473–4487. [Google Scholar]
- Wu, A.; Zhao, Y.; Guo, X.; Fan, B. Spatio-Temporal Differentiation of Carbon Emissions in the Beijing-Tianjin-Hebei Region Based on Land Use and Night Time Light Data. Geogr. Geo-Inf. Sci. 2022, 38, 36–42. [Google Scholar]
- Zhou, Y.; Chen, M.; Tang, Z.; Mei, Z. Urbanization, Land Use Change, and Carbon Emissions: Quantitative Assessments for City-Level Carbon Emissions in Beijing-Tianjin-Hebei Region. Sustain. Cities Soc. 2021, 66, 102701. [Google Scholar] [CrossRef]
- Zhang, H.; He, J.; Yang, X.; Peng, Q. Zoning and Governance of County Ecological Space for the Increase of Carbon Sinks: A Case Study of the Beijing-Tianjin-Hebei Region. Planners 2022, 38, 32–40. [Google Scholar]
- Li, L.; Huang, X.; Yang, H. Optimizing Land Use Patterns to Improve the Contribution of Land Use Planning to Carbon Neutrality Target. Land Use Policy 2023, 135, 106959. [Google Scholar] [CrossRef]
- Bell, E.J.; Hinojosa, R. Markov Analysis of Land Use Change: Continuous Time and Stationary Processes. Socio-Econ. Plan. Sci. 1977, 11, 13–17. [Google Scholar] [CrossRef]
- Arsanjani, J.J.; Helbich, M.; Kainz, W.; Boloorani, A.D. Integration of Logistic Regression, Markov Chain and Cellular Automata Models to Simulate Urban Expansion. Int. J. Appl. Earth Obs. Geoinf. 2013, 21, 265–275. [Google Scholar] [CrossRef]
- Wu, R.; Lan, H.; Cao, Y.; Li, P. Optimization of Low-Carbon Land Use in Chengdu Based on Multi-Objective Linear Programming and the Future Land Use Simulation Model. Front. Environ. Sci. 2022, 10, 989747. [Google Scholar] [CrossRef]
- Xia, C.; Zhang, J.; Zhao, J.; Xue, F.; Li, Q.; Fang, K.; Shao, Z.; Zhang, J.; Li, S.; Zhou, J. Exploring Potential of Urban Land-Use Management on Carbon Emissions—A Case of Hangzhou, China. Ecol. Indic. 2023, 146, 109902. [Google Scholar] [CrossRef]
- Lin, W.; Sun, Y.; Nijhuis, S.; Wang, Z. Scenario-Based Flood Risk Assessment for Urbanizing Deltas Using Future Land-Use Simulation (FLUS): Guangzhou Metropolitan Area as a Case Study. Sci. Total Environ. 2020, 739, 139899. [Google Scholar] [CrossRef] [PubMed]
- Li, W. Huanhuan Song Pattern of Spatial Evolution of Rural Settlements in the Jizhou District of China during 1962–2030. Appl. Geogr. 2020, 122, 102247. [Google Scholar] [CrossRef]
- Zheng, F.; Hu, Y. Assessing Temporal-Spatial Land Use Simulation Effects with CLUE-S and Markov-CA Models in Beijing. Environ. Sci. Pollut. Res. 2018, 25, 32231–32245. [Google Scholar] [CrossRef] [PubMed]
- Zhang, R.; Pu, L.; Wen, J.; Xu, Y. Hypothesis and Validation on the Kuznets Curve of Construction Land Expansion and Carbon Emission Effect. J. Nat. Resour. 2012, 27, 723–733. [Google Scholar]
- Duan, X.; Wang, X.; Lu, F.; Ouyang, Z. Carbon Sequestration and Its Potential by Wetland Ecosystems in China. Acta Ecol. Sin. 2008, 463–469. [Google Scholar]
- Li, Y.; Wei, W.; Zhou, J.; Hao, R.; Chen, D. Changes in Land Use Carbon Emissions and Coordinated Zoning in China. Environ. Sci. 2023, 44, 1267–1276. [Google Scholar] [CrossRef]
- Sun, H.; Liang, H.; Chang, X.; Cui, Q.; Tao, Y. Land Use Patterns on Carbon Emission and Spatial Association in China. Econ. Geogr. 2015, 35, 154–162. [Google Scholar] [CrossRef]
- Shi, C.; Zhu, X.; Wu, H.; Li, Z. Urbanization Impact on Regional Sustainable Development: Through the Lens of Urban-Rural Resilience. Int. J. Environ. Res. Public Health 2022, 19, 15407. [Google Scholar] [CrossRef] [PubMed]
- Xu, M.; Zhang, Z. Farmers’ Knowledge, Attitude, and Practice of Rural Industrial Land Changes and Their Influencing Factors: Evidences from the Beijing-Tianjin-Hebei Region, China. J. Rural Stud. 2021, 86, 440–451. [Google Scholar] [CrossRef]
- Li, X.; Kuang, W. Spatio-Temporal Trajectories of Urban Land Use Change During 1980–2015 and Future Scenario Simulation in Beijing-Tianjin-Hebei Urban Agglomeration. Econ. Geogr. 2019, 39, 187–194+200. [Google Scholar] [CrossRef]
- Li, P.; Chen, J.; Li, Y.; Wu, W. Using the InVEST-PLUS Model to Predict and Analyze the Pattern of Ecosystem Carbon Storage in Liaoning Province, China. Remote Sens. 2023, 15, 4050. [Google Scholar] [CrossRef]
- Xiang, S.; Wang, Y.; Deng, H.; Yang, C.; Wang, Z.; Gao, M. Response and Multi-Scenario Prediction of Carbon Storage to Land Use/Cover Change in the Main Urban Area of Chongqing, China. Ecol. Indic. 2022, 142, 109205. [Google Scholar] [CrossRef]
- Kuang, W.; Liu, J.; Dong, J.; Chi, W.; Zhang, C. The Rapid and Massive Urban and Industrial Land Expansions in China between 1990 and 2010: A CLUD-Based Analysis of Their Trajectories, Patterns, and Drivers. Landsc. Urban Plan. 2016, 145, 21–33. [Google Scholar] [CrossRef]
- Fang, L.; Li, C.; Li, H.; Liu, Y. Analysis of the Spatiotemporal Effects and Driving Factors of Land Use Carbon Emissions in the Yangtze River Economic Belt. Pratacult. Sci. 2022, 39, 2539–2553. [Google Scholar]
- Liu, Q.; Wu, K.; Wang, H.; Qiao, Y. Study of Integrated Land Consolidation Strategy: A Case Study of Cangzhou City, Hebei Province. Sci. Technol. Manag. Land Resour. 2013, 30, 7–13. [Google Scholar]
- Cheng, L.; Tian, H.; Wu, A.; Liu, X.; Wang, Y. Spatiotemporal Changes and the Drivers of Coastal Land Use in Hebei and Tianjin in Recent 40 Years. Mar. Sci. 2021, 45, 135–146. [Google Scholar]
- Gong, W.; Duan, X.; Sun, Y.; Zhang, Y.; Ji, P.; Tong, X.; Qiu, Z.; Liu, T. Multi-Scenario Simulation of Land Use/Cover Change and Carbon Storage Assessment in Hainan Coastal Zone from Perspective of Free Trade Port Construction. J. Clean. Prod. 2023, 385, 135630. [Google Scholar] [CrossRef]
- Gen-Suo, J. New Understanding of Land-Climate Interactions from IPCC Special Report on Climate Change and Land. Adv. Clim. Change Res. 2020, 16, 9. [Google Scholar]
Disclaimer/Publisher’s Note: The statements, opinions and data contained in all publications are solely those of the individual author(s) and contributor(s) and not of MDPI and/or the editor(s). MDPI and/or the editor(s) disclaim responsibility for any injury to people or property resulting from any ideas, methods, instructions or products referred to in the content. |
© 2024 by the authors. Licensee MDPI, Basel, Switzerland. This article is an open access article distributed under the terms and conditions of the Creative Commons Attribution (CC BY) license (https://creativecommons.org/licenses/by/4.0/).