Abstract
Proximal sensing has become increasingly popular due to developments in soil observation technologies and the demands of timely information gathering through contemporary methods. By utilizing the morphological, physical, and chemical characteristics of representative pedogenetic profiles established in various soils of the Sohag governorate, Egypt, the current research addresses the characterization of surface reflectance spectra and links them with the corresponding soil classification. Three primary areas were identified: recently cultivated, old cultivated, and bare soils. For morphological analysis, a total of 25 soil profiles were chosen and made visible. In the dark room, an ASD Fieldspec portable spectroradiometer (350–2500 nm) was used to measure the spectrum. Based on how similar their surface spectra were, related soils were categorized. Ward’s method served as the basis for the grouping. Despite the fact that the VIS–NIR spectra of the surface soils from various land uses have a similar reflectance shape, it is still possible to compare the soil reflectance curves and the effects of the surface soils. As a result, three groups of soil curves representing various land uses were observed. Cluster analysis was performed on the reflectance data in four ranges (350–750, 751–1150, 1151–1850, and 1851–2500 nm). The groups derived from the soil surface ranges of 350–750 nm and 751–1150 nm were not the same as those derived from the ranges of 1151–1850 nm and 1851–2500 nm. The last two categories are strikingly comparable to various land uses with marginally similar features. Based on the ranges of 1151–1850 nm and 1851–2500 nm in surface spectral data, the dendrogram effectively separated and combined the profiles into two separate clusters. These clusters matched different land uses exactly. The results can be used to promote the widespread usage of in situ hyperspectral data sets for the investigation of various soil characteristics.
1. Introduction
Agriculture and natural resources are under tremendous pressure due to mismanagement of land resources, rising population growth, and rising food consumption (OECD/FAO, 2016). Numerous detrimental effects of this evolution can be linked to the growth and intensification of agriculture [1]. Given these developments, it is imperative to improve our knowledge of soil and determine which types are most suited for farming, a task that can only be accomplished by precise mapping. Soil has a direct impact on human health and is crucial for the safety of food [2]. Differentiating and characterizing the physicochemical properties of soils is the most crucial phase. However, it has been shown that the conventional laboratory techniques for conducting soil surveys are costly, time-consuming, and require the use of specialized researchers. Although the method offers comprehensive details on particular places, it has limitations in terms of data volume, number, and spatial coverage [3]. Currently, a different approach to soil examination and quantification is visible and near-infrared (VIS–NIR) spectroscopy. According to [4], this method offers a repeatable analytical technique, is quicker, non-destructive, environmentally benign, and requires little sample preparation. A promising technique for soil analysis is soil spectroscopy, which has the ability to predict several soil parameters from a single spectral measurement, speed in acquiring data from large numbers of samples, and no need for chemicals or extractions [5]. Additionally, measurements can be carried out in a completely non-destructive manner—without contact when necessary, or with minimal intrusion in the case of taking soil cores or modifying sample presentation on-site without removing samples—and handling is straightforward and flexible thanks to modern instrumentation [6]. Hence, spectral measurements provide a quick and effective technique to determine certain characteristics of materials and objects, like soil, without causing damage or invasiveness.
Spectral reflectance studies can be used to identify changes in the physical and chemical characteristics of soil. This is useful for creating algorithms for each parameter based on the statistical correlations between the data from the remotely sensed lab and its spectral reflectance [7]. Chemometric analysis, which predicts various soil properties using the visible, near-infrared, and shortwave infrared reflectance domains, is one of the most promising techniques for quickly making conclusions about the qualities of soil. The technique is becoming more and more popular because of its capacity to do rapid, non-destructive examination with little to no sample preparation. It provides a chemical-free, real-time assessment of soil quality that may be applied immediately at a field location, thereby overcoming the limitations of wet chemistry. It produces a fingerprint of the sample in response to an infrared (IR) source that is strongly associated with its physicochemical composition [8,9,10,11]. This technique has gained popularity for a number of nutrients, including soil organic carbon, nitrogen, phosphorus, potassium, and other nutrients [11], because of its rapid predictability when combined with statistical multivariate modeling. In comparison to more labor-intensive procedures, spectroscopic techniques for evaluating soil parameters are a desirable option because they minimize laboratory effort and are quick to perform. Furthermore, spectroscopic methods offer constant high density spatial and temporal information. However, when soil spectral reflectance interferes with other targets, the precision of predictions made using spectroscopic approaches declines [7].
These soil surface reflectance spectra may be connected to conventional soil classification schemes, which are based on the morphological, physical, and chemical characteristics of typical pedogenetic profiles. By using it in both the lab and the field, measurements may be repeated and the ranges of different soil parameters, including CaCO3, soil texture, and organic carbon content, can be estimated [12,13]. Numerous studies have attested to the great potential of VIS–NIR spectroscopy in identifying and differentiating across soil profiles, as well as offering insights into the impact of soil parameters on soil reflectance [14]. Poppiel et al. [15] discovered that, because the two methods created similar groups, the surface reflectance data were related to the soil surface and subsurface parameters found by conventional soil sample studies. The best bands for differentiating between different types of soil, according to El-Zeiny et al. [10] are the infrared bands, spectral reflectance, and statistical analysis. Additionally, for use in future applications, they created a hyperspectral library for the topsoil of several sub-great groups of soil. Lazaar et al. [16] assessed the ability of VIS–NIR spectroscopy to distinguish between the topsoil of various soil types located in the Triffa plain and to determine the impact of soil OM and CaCO3 levels on topsoil reflectance curves. They came to the conclusion that there was a noticeable and distinct effect of soil OM content on the reflectance curves of the topsoil in the Triffa plain in the visible spectrum, specifically in the range of 580 to 750 nm. In the meantime, there was a noticeable fluctuation across the whole 350–2500 nm spectral range in the reflectance intensity curves as a function of CaCO3 content. Using the CovSel technique, linear discriminant analysis, and spectral data from VIS–NIR spectroscopy, it is possible to distinguish between topsoil of different soil types. It was proven that the Triffa plain’s topsoil of various soil types could be distinguished using the spectral bands 1999, 686, 1280, 2340, and 1951 nm. According to Demattê et al. [17] soil reflectance is a cumulative attribute that results from the naturally diverse composition of soils. This includes differences in their chemical composition, organic matter content, particle distribution, and mineralogical constitution. Soil spectral curves can be used to illustrate this composition, which is the consequence of pedogenetic processes and causes. According to Nocita et al. [18] these signatures are kept as references in soil spectral libraries, where they can be utilized for a range of soil research. Significant connections between soil surface and subsurface were also found when the parameters of the soil were determined using reflectance spectroscopic techniques [18,19,20,21]. Reflectance spectroscopy can also be used to infer soil classification, as it can link the reflectance spectra of each horizon in a profile to the corresponding classification. Processes can be rationalized by this technique; however subsurface soil data are needed. Accordingly, a few researchers [14,22,23,24,25,26,27] revealed a close association between their surface spectra and categorized profiles. The amount of crop residue cover is a critical factor in determining the degree of soil tillage. It is closely related to managing crop systems and adapting to crop rotations, tillage practices, and harvesting methods. Based on the characteristics of their spectrum absorption, crop residues can be distinguished from other materials and vegetation by their reflectance spectra. Their main constituents, cellulose and lignin, have absorption characteristics in the 2100 to 2300 nm range [28]. It was shown that the Normalized Difference Tillage Index (NDTI) was the best of the Landsat-based tillage indices for estimating residue cover, using the difference in reflectance between the two Landsat shortwave infra-red (SWIR) bands centered at 1600 nm and 2300 nm [29].
Chemical analyses performed in the laboratory can be used to determine various soil characteristics. While this approach has the benefit of great precision, it has drawbacks such as requiring a lot of time, possibly resulting in harmful pollutants, and producing results that are delayed [30]. Recent advances in visible and near-infrared (VIS–NIR) technology have made it widely used in classification and quantitative analysis. These advances are due to the technology’s strong wavelength continuity, high spectral resolution, and nondestructive nature [31]. The overtones and combinations of fundamental molecular vibrations, such as pronounced reactions to functional groups like C=O, N=H, and O=H, can be reflected by VIS–NIR. The physical and chemical properties of soil and the composition of minerals, such as total nitrogen (TN) [32], SOM [33], soil moisture [34], organic carbon [35], soil exchangeable cations [11,36], and the soil adsorption coefficient of glyphosate [37], have been studied by many researchers with positive results [34]. Due to variations in surface cover, climate, soil physicochemical characteristics, and soil types, VIS–NIR prediction models vary by region. The accuracy of predictions made using different models and treatments for the same soil parameter can vary [38]. Although Wang and Wang [39] discovered that the limit learning machine outperformed the others in the research of lime-cured black soil. El-Sayed et al. [40] reported that PLSRs were the best model when using VIS–NIR to predict the pH and salinity in arid agricultural areas of Egypt. Comparably, for the hyperspectral prediction of the same parameters (SOM), there are frequent variations in preprocessing and modeling techniques [41,42] et al., 2022. In this context, the current work discusses surface reflectance spectrum characterization and its relationship to the corresponding soil classification using the morphological, physical, and chemical characteristics of representative pedogenetic profiles that were developed in a few soils in the Egyptian governorate of Sohag. The main objectives of this research are to: (1) characterize the surface reflectance spectra of the soils being studied; (2) relate the spectra to the corresponding morphological, physical, and chemical properties of representative pedogenetic profiles; (3) investigate the VIS–NIR spectral range’s potential for soil classification; and (4) ascertain whether cluster analysis can effectively group the soils based on spectral reflectance. Using remote sensing technologies from various sensors and platforms—both imaging and non-imaging; broadband multispectral or narrow-band hyper-spectral data acquisition—helps to understand the properties of the soil. Additionally, data was acquired from various platforms, including ground-based field and laboratory sensors, airborne sensors aboard manned and unmanned aircraft, and space-borne satellite-based sensors.
2. Materials and Methods
2.1. Description of Study Area
The research region spans 715.14 km2 and is located between 26.51° and 26.9° N and 31.24° and 31.57° E (Figure 1). It is a portion of the Sohag Governorate in Egypt, which stretches from the southern border of Assiut Governorate at latitude 26°57′ N to the northern border of Qena Governorate at latitude 26°07′ N. Elevation variations are seen, ranging from roughly 0 to 425 m above mean sea level (Figure 2). The research location is located in an arid region of North Africa, which is typically defined by scorching summers and mild winters with little precipitation. The summer temperature ranges from 36.5 °C (summer) to 15.5 °C (winter), whereas the winter relative humidity ranges from 51% to 61%, the spring relative humidity ranges from 33% to 41%, and the summer relative humudity ranges from 35% to 42%. Rainfall often occurs infrequently and sporadically throughout the region. The Nile River, irrigation canals, and drains hydrologically constitute the surface water of the Sohag region. The alluvial deposits of the Nile created the Quaternary aquifer system in the research area, which is divided into two strata with different hydraulic characteristics. The clay–silt component, which is the top layer, has little permeability both vertically and horizontally. High permeability, both vertically and horizontally, is found in the major aquifer, which is the graded sand component at the bottom [43].
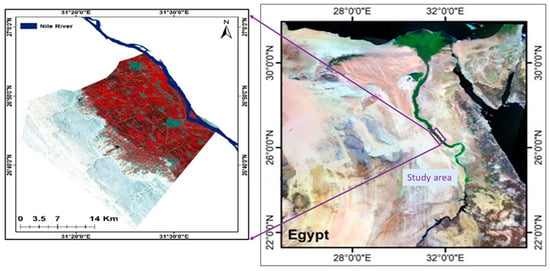
Figure 1.
Location map of the study area.
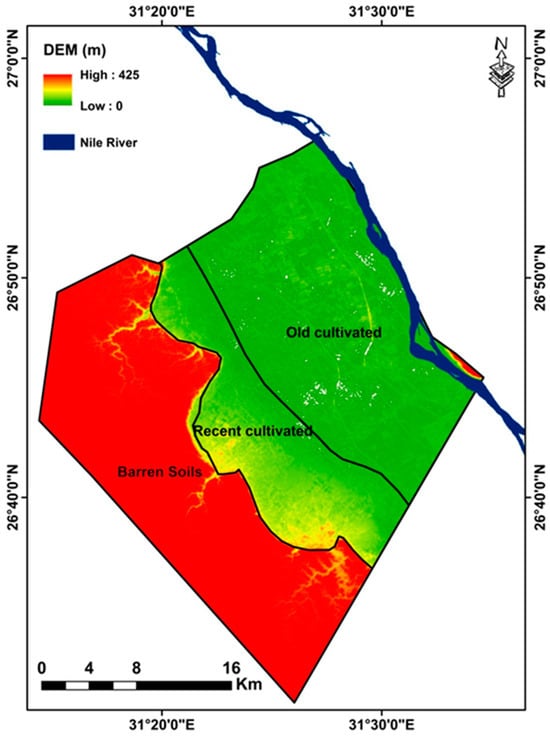
Figure 2.
DEM of the study area extracted from Advanced Spaceborne Thermal Emission and Reflection Radiometer (ASTER).
The research area’s soils include those from recently reclaimed land, old farmed land, and barren land. The farmed lands have loam, sandy clay, clay, and sandy loam soils. While alluvium soils have been added to the surface of freshly reclaimed soils in varying proportions to enhance their qualities, the soils of the recently reclaimed fields include sandy clay, sandy loam, clay loam, sandy, and clay. In the barren regions, sandy and sandy loam were ultimately discovered [44]. Soil conditions in the study area facilitate the transport of contaminants through the soil profile, which affects groundwater quality. The Sohag region’s economy is based primarily on agriculture. Except for populated areas, the whole surface area of the Nile Valley is utilized for agricultural purposes. Newly planted margins delineate the valley’s east and west flanks. Winter, summer, and Nilotic (fall) crops are grown in a two- or three-year crop cycle. The conventional flooding method, also known as basin irrigation, is used to apply irrigation water twice or three times every month. The main landforms observed were Nile alluvium (NA), low recent river terraces (LR), high recent river terraces (HR), and wadi bottom (WB). Soil fertility limitations and condition modifiers characterizing different units were identified. The fertility of the NA and LR soils was good with fewer limitations. Meanwhile, both HR and WB soils have many limitations that render them under either poor or very poor fertility capability [45]. Three regions were identified based on the soil quality index (SQI) of the study area: the first region, which is primarily found in old cultivated soils and some new ones, has a fair quality index; the second region is found in some newly reclaimed soils and desert soils that have low values of favorable properties, which negatively affect the SQI that is defined as poor; and the third region, which is mostly found in barren lands, has very poor quality [46].
2.2. Remote Sensing Data
For identifying and understanding the dynamic causes of land-use land-cover change (LULC) on any terrain, remotely sensed and spatial data are reliable sources of information [47]. The geocoded digital data without any cloud storage was acquired from the United States Geological Survey’s (USGS) Landsat OLI (operational land imager) sensor repository (https://earthexplorer.usgs.gov, accessed on 20 March 2024). Landsat data is stored more often than other forms of remote sensing data and has been available for a longer period of time [48,49]. Table 1 displays the main attributes of the image that were utilized.

Table 1.
The principal specifications of the used remotely sensed Landsat satellite imagery.
2.2.1. Pre-Processing of Satellite Image
Remotely sensed data must be pre-processed to minimize noise, make the data more suitable for subsequent analysis, and increase its preparation. Initially, all spectral bands were layer-stacked in the ENVI 4.8 software [50] after the multi-temporal Landsat image was imported. In terms of the geometric correction procedure, all of the used datasets were resampled and projected with a root mean square error (RMSE) of less than 0.5 pixels onto the Universal Transverse Mercator (UTM) using the World Geodetic System 1984 (WGS84) [51,52]. Throughout the geometric rectification process, the image of interest was represented using a standard geographic coordinate system. Additionally, for geometric rectification, selecting ground control points (GCPs) is essential. Using 50 GCPs that were clearly distinguishable on satellite and ground images, the digital data for 2024 were registered (map-to-image registration). Furthermore, the pixel size for image registration was chosen at 30 m using the nearest neighborhood resampling technique and the first polynomial order methods. In addition, the closest neighborhood approach was used to resample the image while maintaining the original pixel brightness magnitudes. The temporal image needs to be radiometrically corrected to normalize brightness changes brought on by shifting atmospheric conditions before image classification can begin. Pseudo-invariant features (PIFs) are spatially well-defined, spectrally stable, and radiometrically stable features that were used to perform radiometric normalization on the image.
2.2.2. Image Classification and Accuracy Assessment
Under the ENVI 4.8 software environment, support vector machines (SVM) were used for supervised image categorization. According to Lin et al. [53], accuracy evaluation procedures determine the validity of the spatial information derived from remote sensing photos for precise image categorization. When utilized in conjunction with ground control points that act as references, remotely sensed spatial data is accurate and dependable [54]. For evaluating accuracy, a variety of statistical techniques involving the error matrix can be applied [14]. As a result, using Equations (1)–(4) [54], the correctness of the categorized image was ascertained and assessed by computing the producer’s accuracy, user’s accuracy, overall accuracy, and Kappa coefficient values.
where: k is the kappa coefficient, Ao is the overall accuracy, Ap is the producer’s accuracy, and Au is the accuracy user. Zones categorized and reference categories make up pii, while zones categorized and ground truth categories make up p+i = pi+ = .
2.3. Field and Laboratory Activities
Using the guidelines provided in the Soil Survey Manual [55], 25 representative soil profiles (Figure 3) were chosen and exposed for morphological analysis. After inspection, soil samples were gathered and prepared for analysis. A handheld GPS device captured every profile’s location (Germin e-trix Lenexa, Kansas, MA, USA). The soil samples were allowed to air dry at room temperature; subsequently, the dried soil samples were crushed using a wooden mortar and then sieved through a 2 mm sieve. Particle size distribution [56] was conducted using sodium hexametaphosphate for dispersion in case of calcareous soils [57], calcium carbonate, cation exchange capacity (CEC) and exchangeable sodium [58], (ECe) with an EC meter (Orion, Model 150, USA); the soil pH with a pH meter was supplied from HANNA Instruments (Leighton Buzzard, UK) for organic matter content [59].
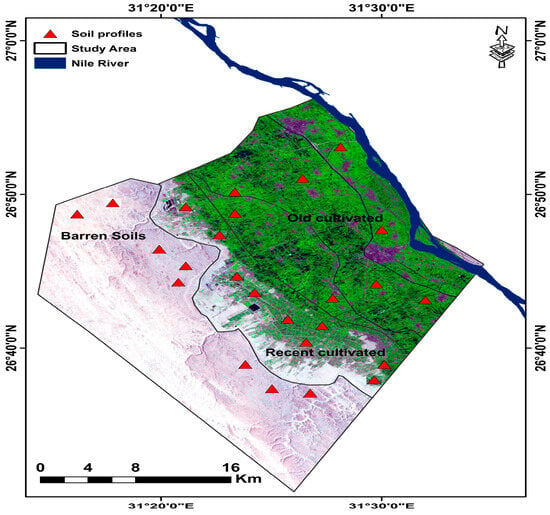
Figure 3.
Soil sample locations laid spreading out over the study area.
2.4. Spectroscopic Analyses
Using an ASD Spectro radiometer contact probe in a dark room, the spectral reflectance patterns of the topsoil of the samples under investigation were recorded. Two calibrated tungsten quartz halogen lamps were used in the dark to collect the VIS–NIR laboratory-based spectral measurements using the ASD FieldSpec 3 (ASD-Analytical Spectral Devices, Boulder, CO, USA), which has a spectral range of 350 to 2500 nm and a spectral resolution of 10 nm, with 1 nm intervals for all spectral ranges. Soil samples were put onto Petri dishes containing around 95 cm3 of soil. An average of 100 scans was determined by the equipment for each soil sample. A white Spectralon with 100% reflectance (LabSphere, North Sutton, NH, USA) was used to calibrate the spectroradiometer before it was scanned [60].
2.5. Grouping Soil Profiles from Surface Reflectance
Using surface spectra as a guide, comparable soils were grouped together. The relationship between soil class-specific changes in the underlying horizons and throughout the soil profile, and the patterns of the soil surface made this possible. Accordingly, as Demattê et al. [61,62,63] and Nanni et al. [23,24] have shown, it is conceivable to connect surface spectral curves with soil classes. These correlations should be carefully considered, though, as the soil surface data may not always be enough to classify the soil. Hierarchical agglomerative clustering (HCA) is a grouping approach that relies on the Euclidean distance between every observation using Statistica V10 software. Principal component analysis (PCA) and HCA had been used widely in soil studies such as [64,65,66,67]. The Euclidean distance between the groups is negatively correlated with the similarity in spectral behaviors of samples belonging to different soil classes. Using Ward’s approach [68], a variance method, clusters are created in an effort to reduce within-cluster variance. The means of all the variables are calculated for every cluster. The squared Euclidean distance to the cluster means is then determined for each object. All of the objects’ distances are added together. The two clusters that increase in the overall sum of squares, within cluster distances, the least at each stage are joined [69]. Ward’s approach was used in this study to categorize the varied spectral responses of the various soils since it provided a more accurate grouping.
2.6. Generation of Thematic Maps
Using the Inverse Distance Weighted (IDW) interpolation feature of ArcGIS 10.8 software, thematic soil maps were produced for every soil characteristic. By combining a set of sample points in a linearly weighted manner, inverse distance weighted interpolation (IDW) calculates cell values. The significance of known points on the interpolated values can be adjusted by the user using the IDW technique, taking into account their distance from the output point. Furthermore, the following Equation (5)—which uses weights of the measured surrounding points—is how the IDW predicts unknown values for every geographic point:
where:
Z(x,y): is the predicted value of variable z at point i.
Zi = The measured value at point i.
dij: is the distance between point i and j.
n: The number of points used in the predictions.
p: power parameter.
3. Results and Discussion
3.1. Land Use/Land Cover (LULC) of the Study Area
In the study area, four LULC categories were identified: the Nile River; cultivated fields (old and recently cultivated soils); barren soils (bare lands, sand sheets, and rocky land); and urban areas (residential, commercial, industrial, and road constructions). These results are consistent with previous research [70,71,72,73,74], which discovered the same LULC categories in other regions of Egypt, including the Nile Delta and the Northwestern Coast. The data gathered for each of the four LULC groups is shown in Table 2. Additionally, the spatial distribution of LULC types (classified maps) for the analyzed date of 2024 is depicted in Figure 4. The percentages of LULC classes across the whole study area indicated that cultivated and barren soils were consistently the most extensively represented at 56.37, and 31.63% of the study area, respectively, with urban soils (10.28) and Nile River (1.72%) being far less extensive (Table 2). Urban areas had the lowest user accuracy (57.34%) among the land cover and land use classes, whereas all other units showed higher than 90%. Every class achieved a producer accuracy level above 90%. According to Cohen [75], there is nearly perfect agreement between fieldwork and remote sensing data, with an overall accuracy of 95.49% and a kappa value of 0.94 (Table 3).

Table 2.
LULC classification for 2024.
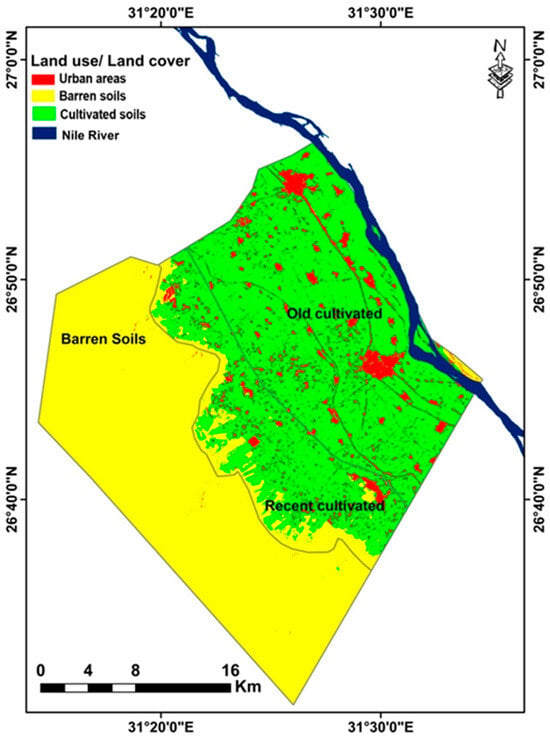
Figure 4.
LULC of the investigated area.

Table 3.
Accuracy assessment of each classified image 2024.
3.2. Soil Characteristics Within Study Area
3.2.1. Barren Soils
Table S1 provided the morphological properties of the different profiles. According to the results, moist samples ranged in color from yellowish brown (10YR 5/6) to very light brown (10YR 7/4), while dry samples ranged in color from greyish brown (10YR 5/2) to very pale brown (10YR 7/4). Less mottles, varying in size, amount, and contrast, were seen in the substratum of some profiles in comparison to older cultivated soils. Furthermore, larger-sized calcium carbonate concretions were seen, particularly in the subsurface horizons, exhibiting strong effervescence when diluted HCl was added. Every profile is well-drained and deep. The soil structure was single-grain except for the subsurface of profile 3 and all of profile 5′s layers, which were subangular blocky of extremely fine to medium size and of a weak grade. This is because the majority of these soils have low clay and organic carbon contents. The soils range in consistency from loose to highly friable (moist), soft to somewhat hard (dry), and not sticky to not plastic (wet). All profiles’ low levels of clay and organic carbon were the cause of their consistency. While the soils exhibited a sandy texture class, the subsurface of profile 3 and all of profile 5′s horizons had loamy sand and sandy loam texture classes. Every profile has a boundary that varies from distinct to gradual and from smooth to wavy in topography. Nearly every profile’s horizon displayed less growth in terms of uniformity, texture, and structure. Observations of sporadic natural vegetation have resulted in the presence of very small and sparse roots. Although these soils have not yet been farmed, they could be a potential site for farming. When compared to the soils that were previously mentioned, these soils have the coarsest components (the sandy texture class is prominent). The range of the clay content was shown by the particle size distribution, which was between 3% and 15%. Table S2 shows that the silt and sand contents ranged from 2% to 19% and 66% to 94%, respectively. The dominate soil texture is sandy (Figure 5a).
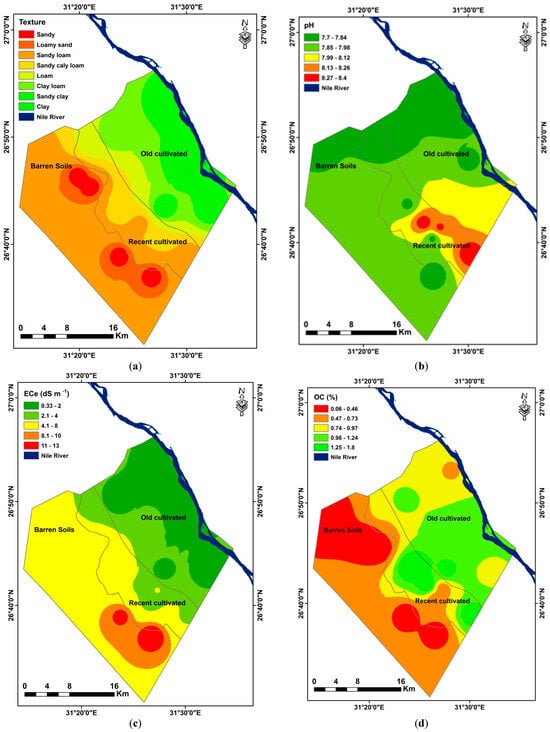
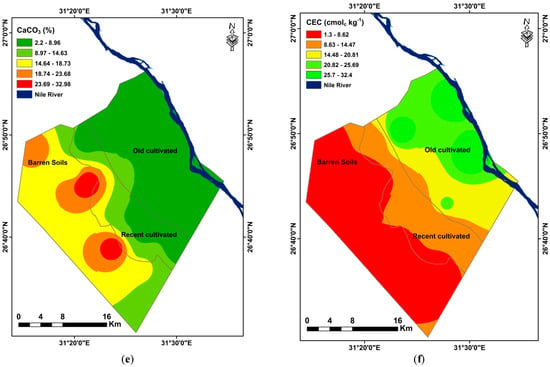
Figure 5.
Interpolation map of selected soil variables (a) Texture, (b) pH, (c) ECe (dS m−1), (d) OC%, (e) CaCO3, and (f) CEC (cmolc Kg−1).
The pH range of the moderately alkaline soils was from 7.7 to 8.3 (Figure 5b). High pH soils are prevalent in semi-arid and arid regions [76]. One of the most crucial parameters in plant growth is the pH of the soil. Numerous interactions exist between soil pH, such as those involving ion exchange capacity and nutrient availability. For instance, the solubility of iron compounds decreases with rising pH; hence, high soil pH (soil alkalinity) sometimes results in an iron deficit that is detrimental to plant growth. The main effects of decreased infiltration brought on by dispersion caused by sodium are lower plant water availability, increased runoff, and soil erosion. In addition to lowering the amount of water that penetrates the soil, soil dispersion also modifies the soil’s hydraulic conductivity [77]. The rate at which water percolates through soil is known as hydraulic conductivity. Hydraulic conductivity also decreases when soil dispersion brought on by sodium leads the soil to lose structure [77]. These soils range in salinity from 6.4 to 13.4 dS m−1, which is extremely high (Figure 5c). Plant productivity is restricted by salinity, a common abiotic stressor. Important plant functions are slowed down or stopped as a result of ionic toxicity and water deficiency in plants. Salinity causes an increase in the synthesis of active oxygen species and a decrease in chlorophyll, which in turn causes an accumulation of osmotic solutes and an increase in both enzymatic and nonenzymatic antioxidants [78]. Furthermore, there is relatively little organic carbon in the mixture (Figure 5d). These soils have a calcium carbonate level that ranges from 14.8% to 36.5%, making them calcic. Addition of P fertilizer to calcareous soils can cause extremely hard layers that are impervious to water and crop roots [79] (Figure 5e). Table S2 illustrates the poor cation exchange capacity, which ranges from 1.1 to 4.1 cmolc kg−1. Since clay and organic matter have a substantial positive correlation with CEC, the results of CEC are dependent on the amount of these two substances in the soil (Figure 5f) [80].
3.2.2. Recently Cultivated Soils
These soils occurred in between the old cultivated and Barren soils. In addition, these soils are subjected to different reclamation processes. Hence, the soils exhibit both characteristics of the aforesaid soils. Morphological features of various profiles were given in Table S3. The data indicated that the color of dry samples varied from dark gray (10YR 4/1) to yellow (10YR 7/6) while the color of moist samples varied from very dark gray (10YR 3/1) to yellow (10YR 7/8). As compared to previously mentioned soils, abundant mottles, which differ in quantity, size and contrast, were observed in the surface and substratum of some profiles. In addition, calcium carbonate concretions in various sizes were observed that gave strong to violent effervescence with diluted HCl. The decrease of CaCO3 may be due to the effect of reclamation processes that include the addition of organic and bio-fertilizers, organic amendments, and different agricultural activities in these soils that lead them to solubilize the existing insoluble fraction of CaCO3 and improve some of the bad properties of these soils [81,82]. All profiles are deep and well drained. Various amounts of alluvium soils and shale was added to the topsoil to enhance the soil’s characteristics and increase its productivity. The soil structure was single-grain to subangular blocky, with a very fine to coarse size and weak to strong grade. The consistency of the soil varied from soft to slightly hard (dry), loose to slightly firm (moist), not sticky to sticky and not plastic to plastic (wet). These wide variations in consistency were due to variations in agricultural activities that occurred in these soils. The soil showed wide textural variation, i.e., sandy, sandy clay loam, sandy loam, loam, and loamy sand. The boundary of all profiles is clear in distinctness and smooth to wavy in topography. Almost all horizon profiles showed less development in structure, texture, or consistency. As different crops were cultivated, some horizons of profiles contain some roots that are very fine to medium in size and few to very few in quantity. Granulometric data (Table S4) revealed that the percentage of sand, silt, and clay varied from 43% to 94%, 3% to 32% and 2% to 30%. The sandy texture dominated followed by sandy loam, loamy sand, and loam. Sandy clay loam texture class, however, occurred in the surface layers of P10 and P12. These soils are slightly saline to moderately saline and varied from 1.4 to 6.3 dS m−1. The pH values ranged from 7.5 to 8.6, indicating slight to moderate alkalinity. The cation exchange capacity of these soils is moderate and varied from 8.5 to 11.6 cmolc kg−1. The organic carbon content of these soils ranges from very low to moderately high in some soils that received different amounts of alluvium soils and organic amendments. These soils are calcic, and calcium carbonate content ranges from low to high, which ranges from 3.1% to 11.6% (Table S4).
3.2.3. Old Cultivated Soils
Table S5 provided the morphological properties of the different profiles. According to the results, the color of the moist samples ranged from extremely dark grey (10YR 3/1) to dark greyish brown (10YR 4/2). The color of the dry samples varied from dark yellowish brown (10YR 4/6) to brown (10YR 5/3). According to Ibáñez Asensio et al. [83], the chemical and mineralogical composition, soil texture, and moisture regime all seem to affect the color of the soil. Additionally, certain profiles’ substratum revealed some mottles that varied in size, number, and contrast. Particularly in the subsurface horizon, different-sized calcium carbonate concretions were seen. Every profile is well-drained and ranges from modest to deep. The amount of clay contained in the soil determines its structure, which can range from massive to subangular with medium size, and from moderate to strong grade. The soils range in consistency from somewhat sticky to very sticky, slightly plastic to very plastic (wet), firm to very firm (moist), and slightly hard to very hard (dry). The significant differences in consistency were caused by variances in the profiles’ clay content. A wide range of textures, including clay, clay loam, loam, sandy clay, and sandy clay loam, were present in the soils. The age of the soils, in situ weathering, translocation of clay, and parent material composition are the main causes of this large diversity in soil texture [84]. Every profile has a recognizable boundary that is topographically smooth. When compared to surface horizons, every profile’s subsurface horizon displayed development in terms of uniformity, texture, and structure. The subsurfaces met the criteria for the cambic (Bw) diagnostic subsurface horizon, as a result. The roots varied in size from extremely fine to coarse and in abundance from few to numerous in the various profile horizons. Moreover, the number of roots dropped with depth and was greater in the surface layer. Table S6 displays the specific soil particle size distribution. The data show that the percentage of clay ranged from 27% to 55%. Variability in the parent material’s in situ weathering and the vertical migration or translocation of clay may be the main causes of the rise in clay content [85]. The silt content varied from 3% to 38% and showed an uneven pattern with depth in all pedons. Generally, subterranean horizons have larger concentrations of silt and clay than surface horizons, which might be explained by the illuviation process that takes place throughout soil development. The percentage of sand varied between 20% and 67%. The dominant texture was clay, which was followed by clay loam, sandy clay, and clay loam. However, the P18 subsurface layers were of the loam texture class
Regarding chemical features, Table S6 shows that a variety of soil chemical parameters can affect soil pH, which can vary seasonally based on pedogenic processes and external inputs employed [86]. The pH of the somewhat alkaline soils ranged from 7.5 to 8.2. The data on soil EC of saturated extract ranged from 0.27 to 1.34 dSm−1, suggesting that there are no salinity problems. Between 17.4 and 32.4 cmolc kg−1 was the range of the cation exchange capacity in the profiles. There is low calcium carbonate present—between 0.8 and 3.6%. The distribution of calcium carbonate in the soil profile consistently displayed an increasing pattern with soil depth, suggesting that a high pH level may be the cause of calcium leaching down and subsequent precipitation at lower depths [87]. The organic carbon content of the soil was found to be low, with a range of 0.1 to 1.4%. The research area’s organic matter (OM) content is comparatively low because of the adverse effects of the dry and semi-arid climate, which include high temperatures that accelerate the pace at which organic matter decomposes in the soil [88,89].
3.3. Effects of Different Land Uses on Soil Reflectance
Different methods of land management have an impact on soil parameters including moisture content, organic matter, and organic fertilizers, among others, which in turn has an impact on the spectral fingerprints of different soils. Higher soil organic matter content and smaller particle sizes [90,91], intense mineral fertilization, increased microbial activity, and lower soil pH [92] could be the cause of the reduced reflectance of soils. Compared to soils with lower OC level, those with higher OC content are darker and have lower spectral reflectance [93]. Soil reflectance is highly influenced by OM, and it decreases as OM content rises [94]. Similarly, soils seem darker as soil moisture levels rise because incoming visible light reflectance steadily decreases with soil moisture [94,95]. Red soils have more iron oxides and less organic matter than black soils. Thus, soils with higher iron content exhibit higher reflectance than soils with lower organic carbon content [94]. Throughout the spectrum, sandy loam soils had the highest reflectance, followed by clay soils at 400–1000 nm and loam soils at 1000–2400 nm. Smaller soil particles, therefore, have a higher reflectivity. This conclusion is in line with the findings [94] which showed that clay soils had lower reflectance and sandy soils had higher reflectance. These all have an impact on the sustainability and health of the soil.
Figure 6 displays the spectra of soil sample measurements made using the ASD Fieldspec spectroradiometer. Surface soils with varying land uses often show comparable VIS–NIR spectra, with decreased reflectance in the VIS range (350–700 nm) and higher reflectance in the NIR range (701–2500 nm). That visible region’s spectra did not considerably alter in form, and the reason for this is most likely due to variations in water content. Around 1400, 1900, and 2200 nm, the water absorption from –OH bonds is apparent. According to Stenberg et al. [20], reflectance in the visible range (350–780 nm) is mostly linked to iron from minerals and soil chromophores from organic materials. Around 2200 and 2300 nm are a few tiny peaks that may be seen; these are connected to clay minerals with ratios of 1:1 and 2:1 [96,97]. The principal causes of the variations in the baselines and peak intensity were the type and primary features of the soil samples, including their texture, CaCO3 content, and OM content [16]. Upon initial glance at Figure 6, it was easy to compare the soil reflectance curves and assess the impact of the surface soils. As a result, three sets of curves were observed.
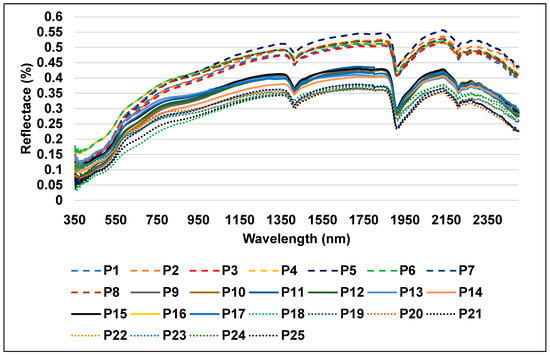
Figure 6.
Reflectance spectra of the examined soil samples.
The first group (Figure 7) is made up of eight profiles: P1, P2, P3, P4, P5, P6, P7, and P8. These profiles are connected with desert and less developed soils, and they had higher intensity reflectance than other soil types, with a maximum of 0.56 in the NIR region at 2135 nm.
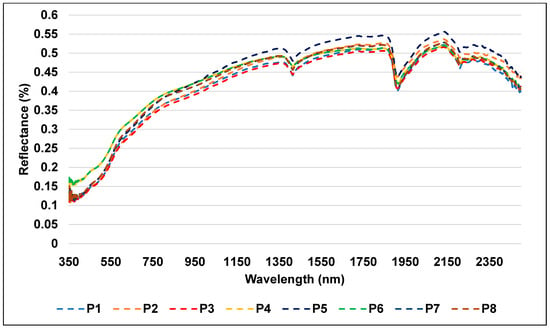
Figure 7.
Reflectance spectra of the desert soil samples.
The soil types in this zone are characterized by four factors: (1) a high content of calcium carbonates due to their development from calcareous rocks, which facilitated the enrichment of the soil with calcium carbonates; (2) coarse fractions in the textures (dominantly sandy texture class); (3) high salinity level; and (4) low organic matter (OM) content. The latter may be attributed to reduced agricultural activities and the high content of calcium carbonate (CaCO3), which slows down the processes of alteration and thus accelerates the decomposition of soil OM and prevents the process of humification [16]. It is important to note that there was a strong correlation between the predominant salt type found in the soils and their reflectivity. The soils with the highest levels of red and near-infrared reflectance are those that have white salt crust. Dark hydrated salts work to absorb water molecules from the atmosphere to the chemical composition of the salt, making it appear darker. In addition, salts have the ability to form complexes with organic compounds that were already present in the soil, which is why the lowest reflectance values were found in these soils. Because of this, the soil becomes darker, and the soil surface absorbs the majority of incident light on the soil. On the other hand, white salt crusts like NaCl, MgCl2, and Na2SO4 have a pale appearance and function to reflect incident light, increasing their reflectance in comparison to absorbed light [98], which causes the soil’s surface to absorb the majority of incident light.
Between the first and third groups and comprising nine profiles taken from recently cultivated soils (P9, P10, P11, P12, P13, P14, P15, P16, and P17), is the second group (Figure 8). At 1805 nm, these soils’ moderate intensity reflectance peaked at 0.43 in the near-infrared spectrum. The results show that these soils’ moderate reflectance is caused by their medium soil texture, higher organic carbon content, and lower CaCO3 concentration than arid soils. The reflectance curves of several topsoils revealed that those with high OM content had low reflectance intensities over the visible spectrum, and if their OM level was more than 2%, they might have masked other soil elements. Nonetheless, the high-intensity reflection in the VIS band was a characteristic of the topsoils with low OM concentration. Furthermore, the change in topsoil reflectance with respect to CaCO3 content demonstrated that all spectral domains between 350 and 2500 nm had higher reflectance in the reflectance curves of the topsoil with higher CaCO3 content. On the other hand, reflectance decreased when topsoil CaCO3 content was low [98,99]. According to Asgari et al. [60], the group with the highest carbonate content showed the highest reflectance intensity. They stated that the incidence of soil carbonates was indicated by a specific absorption wavelength of 2338 nm, which increased with the number of carbonates present. This was consistent with the concave feature’s ascent. This wavelength was utilized by Rossel et al. [100] and Shahrayini et al. [101] as the carbonate’s unique characteristic.
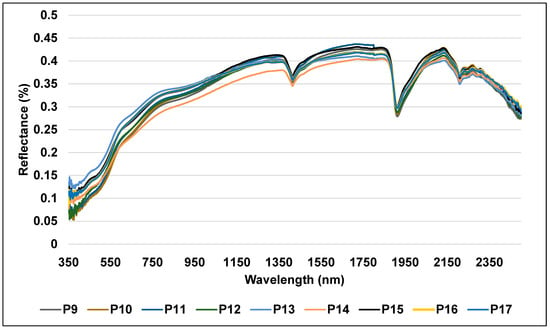
Figure 8.
Reflectance spectra of the recently cultivated soil samples.
The third group (Figure 9) is linked to eight profiles (P18, P19, P20, P21, P22, P23, P24, and P25), one of which is an alluvial plain made of historically farmed agricultural soil. These soils displayed reduced intensity reflectance, peaking at 0.37 in the NIR region at 2136 nm, due to their higher concentration of OM and clay and lower CaCO3 content. In actuality, samples with lower OM contents typically had greater reflectance intensity than those with higher OM contents, and the reflectance of the soil decreased as OM concentration increased. Two absorption characteristics at 850–900 and 2320–2370 nm that are associated with OM were identified by Asgari et al. [60] in their investigation.
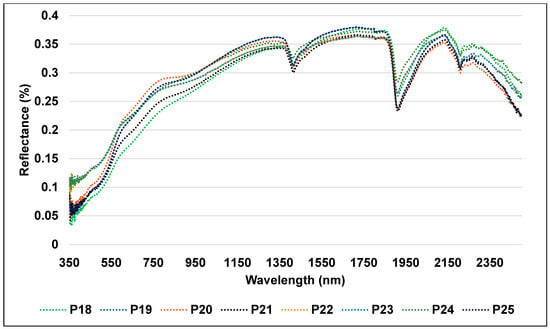
Figure 9.
Reflectance spectra of the old cultivated soil samples.
3.4. Grouping Soils Based on Surface Spectra
Based on the Euclidean distance (Figure 10a–d), cluster analysis was applied to the reflectance data in four ranges (350–750, 751–1150, 1151–1850, and 1851–2500 nm). The main objective is to observe the best range that discriminates between different soils and group them based on surface reflectance. The groups obtained from the ranges (350–750 nm and 751–1150 nm) of the soil surface differed from those based on the ranges 1151–1850 nm and 1851–2500 nm). The latter two ranges are very similar to different land uses that are slightly similar in their characteristics. The cluster based on the ranges (650–750 nm) failed in correctly grouping the soils profiles as presented in Figure 10a. On the other hand, the clustering based on the 751–1150 nm range is far superior to the previous one. Only profile 144 (which belongs to recently cultivated soils but was clustered under old cultivated soils in the clustering analysis) was not successfully placed in its proper category by this cluster analysis (Figure 10b).
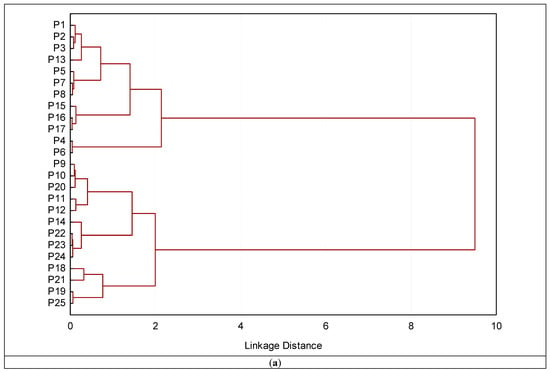
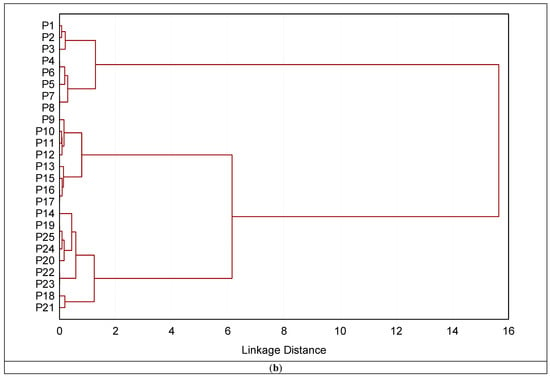
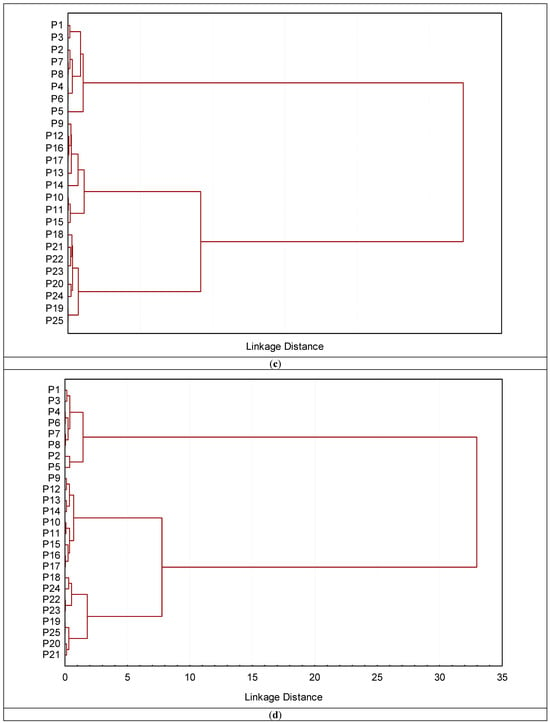
Figure 10.
Dendrograms produced by clustering 16 profiles for definition of groups based on soil surface spectra in four ranges (a) 350–750; (b) 751–1150; (c) 1151–1850; and (d) 1851–2500 nm.
The dendrogram obtained from surface spectral data based on the ranges (1151–1850 nm and 1851–2500 nm) successfully classified and merged the profiles into two distinct clusters. These clusters completely corresponded to various land uses, e.g., old cultivated, recently cultivated soils, and desert soils. The profiles from 1 to 8 that correspond to barren soils make up the single cluster that makes up the first cluster. In contrast, the second cluster is made up of two subclusters, one of which included profiles P6 through P17, that were gathered from recently cultivated soils. The profiles P18–P125 that were taken from old cultivated soils are linked to the second subcluster. The various land uses are well-aligned with the analysis results. Given that the two methods produced comparable groupings, it is notable that the surface reflectance data were connected to the soil surface characteristics identified by the conventional analysis of the soil samples.
Spectroscopic data of the soil surface horizons can be used to classify individual soils with an accuracy of more than 75%, according to Zeng et al. [14,102]. This is consistent with Xie et al. [103], who found that surface reflectance could identify between five soil classifications with 92.2% accuracy. Nanni et al. [24] reported that an overall accuracy of 52–70% was achieved in the discrimination of soil classes using spectral information of the soil surface as indicators. Furthermore, using soil surface reflectance as a basis [15] effectively clustered oxisols, entisols, and incisols. Since the two methods created similar groups, the surface reflectance data were connected to the subsurface and surface attributes of the soil, as determined by conventional examinations of soil samples.
4. Conclusions
Accurate mapping is the only way to address the pressing need to better understand soil and determine which types are most suited for agriculture. Differentiating and characterizing the physicochemical properties of soils is the most crucial phase. However, it has been shown that the conventional laboratory techniques for conducting soil surveys are costly, time-consuming, and require the use of specialized researchers. Currently, a different approach to soil examination and quantification is visible and near-infrared (VIS–NIR) spectroscopy. Three groups of surface soils representing various land uses were studied, as the study demonstrated that the VIS–NIR spectra of the various land uses produced distinct reflectance curves. The eight profiles that comprise the first group are P1, P2, P3, P4, P5, P6, P7, and P8. These profiles were associated with less developed and bare soils; they also exhibited higher intensity reflectance (maximum of 0.55 in the NIR region at 2155 nm) than other soil types. The second group consists of nine profiles (P9, P10, P11, P12, P13, P14, P15, P16, and P17) derived from recently cultivated soils and is situated between the first and third groups. In the near-infrared spectrum, the moderate intensity reflectance of these soils peaked at 0.42 at 2137 nm. Finally, eight profiles (P18, P19, P20, P21, P22, P23, P24, and P25) are associated with the third group, one of which is an alluvial plain composed of agricultural soil that has historically been cultivated. Reduced intensity reflectance was seen in these soils, with a peak at 0.36 in the near-infrared spectrum at 2132 nm. Additionally, the outcomes amply demonstrated the usefulness and efficiency of the clustering strategy. Furthermore, it proved effective to identify soil groups with comparable characteristics by clustering data based on soil surface reflectance. The profiles were effectively categorized and combined into two separate clusters using the dendrogram created from surface spectral data based on the ranges (1151–1850 nm and 1851–2500 nm). The different land uses, such as recently cultivated soils, old cultivated soils, and barren soils, were all fully correlated with these clusters. Meanwhile, information pertinent to soil genesis may be ignored by soil spectral data. Understanding and differentiating between the true reasons of the trend of changing soil properties can be facilitated by knowing if the parent material’s homology or heterogeneity is evident in the study of soil genesis. Parent material discontinuity is universal for the soil genesis process. Determining the discontinuity of parent material is not simple, though. Distinguishing the discontinuity of parent material becomes simpler when there are noticeable variations in the soil texture and structure in the profile morphology. But, if the profile features are all the same, it is hard to spot. Overall, due to its limitations, soil spectroscopy cannot fully replace conventional soil classification, but it has a high potential to aid soil classification once the soil spectral libraries are well established. It also should be noted that the prediction of soil classification based on soil spectra still remains an academic research topic and more efforts should be pursued for its practical use in decision making for farmers and stakeholders. More investigations are still needed on this subject in the future and recent work will build upon this research with the addition of spatial environmental variables and the incorporation of stratification into the modeling framework.
Supplementary Materials
The following supporting information can be downloaded at: https://www.mdpi.com/article/10.3390/land13122056/s1, Table S1. Morphological characteristics of barren soils; Table S2. Physiochemical characteristics of barren soils; Table S3. Morphological characteristics of recent cultivated soils; Table S4. Physiochemical characteristics of recent cultivated soils; Table S5. Morphological characteristics of old cultivated soils; Table S6. Physiochemical characteristics of old cultivated soils.
Author Contributions
Conceptualization, M.S.S., A.-r.A.M., J.E.M.d.L. and E.A.A.; Methodology, M.S.S., A.-r.A.M. and E.A.A.; Software, M.S.S., A.-r.A.M., J.E.M.d.L. and E.A.A.; Validation, M.S.S., A.-r.A.M. and E.A.A.; Formal analysis, M.S.S., A.-r.A.M. and E.A.A.; Investigation, M.S.S., A.-r.A.M. and E.A.A.; Resources, A.-r.A.M. and E.A.A.; Data curation, A.-r.A.M.; Writing—original draft, A.-r.A.M., T.A., J.E.M.d.L., A.S.E.-S. and K.A.-K.; Writing—review & editing, M.S.S., A.-r.A.M., A.S.E.-S. and K.A.-K.; Supervision, T.A., A.S.E.-S. and K.A.-K.; Project administration, T.A., A.S.E.-S. and K.A.-K. All authors have read and agreed to the published version of the manuscript.
Funding
Researchers Supporting Project number (RSPD2024R1044), King Saud University, Riyadh, Saudi Arabia.
Data Availability Statement
All data are included in the manuscript and Supplementary Material.
Acknowledgments
The authors thank Researchers Supporting Project number (RSPD2024R1044), King Saud University, Riyadh, Saudi Arabia.
Conflicts of Interest
The authors declare no conflicts of interest.
References
- Foley, J.A.; Ramankutty, N.; Brauman, K.A.; Cassidy, E.S.; Gerber, J.S.; Johnston, M.; Mueller, N.D.; O’Connell, C.; Ray, D.K.; West, P.C. Solutions for a cultivated planet. Nature 2011, 478, 337–342. [Google Scholar] [CrossRef] [PubMed]
- Alarifi, S.S.; El-Sorogy, A.S.; Al-Kahtany, K.; Alotaibi, M. Contamination and environmental risk assessment of potentially toxic elements in soils of palm farms in Northwest Riyadh, Saudi Arabia. Sustainability 2022, 14, 15402. [Google Scholar] [CrossRef]
- Adamchuk, V.; Allred, B.; Doolittle, J.; Grote, K.; Viscarra Rossel, R. Tools for proximal soil sensing. In Soil Survey Manual: Soil Science Division Staff; United States Department of Agriculture: Washington, DC, USA, 2017; pp. 355–356. [Google Scholar]
- Gholizadeh, A.; Carmon, N.; Klement, A.; Ben-Dor, E.; Borůvka, L. Agricultural soil spectral response and properties assessment: Effects of measurement protocol and data mining technique. Remote Sens. 2017, 9, 1078. [Google Scholar] [CrossRef]
- Metzger, K.; Liebisch, F.; Herrera, J.M.; Guillaume, T.; Walder, F.; Bragazza, L. The use of visible and near–infrared spectroscopy for in–situ characterization of agricultural soil fertility: A proposition of best practice by comparing scanning positions and spectrometers. Soil Use Manag. 2024, 40, e12952. [Google Scholar] [CrossRef]
- Rossel, R.V.; Behrens, T. Using data mining to model and interpret soil diffuse reflectance spectra. Geoderma 2010, 158, 46–54. [Google Scholar] [CrossRef]
- Khdery, G.; Gad, A.-A.; El-Zeiny, A.M. Spectroscopic Characterization of Plant Cover in El-Fayoum Governorate, Egypt. Egypt. J. Soil Sci. 2020, 60, 397–408. [Google Scholar] [CrossRef]
- Nocita, M.; Stevens, A.; Noon, C.; van Wesemael, B. Prediction of soil organic carbon for different levels of soil moisture using Vis-NIR spectroscopy. Geoderma 2013, 199, 37–42. [Google Scholar] [CrossRef]
- Gad, A. Qualitative and quantitative assessment of land degradation and desertification in egypt based on satellite remote sensing: Urbanization, salinization and wind erosion. In Environmental Remote Sensing in Egypt; Springer: Berlin/Heidelberg, Germany, 2020; pp. 443–497. [Google Scholar]
- El-Zeiny, A.M.; Khdery, G.; Gad, A.-A.; Science, S. Hyperspectral based approach to investigate topsoil characteristics of different taxonomic units of El-fayoum depression. Egypt. J. Remote Sens. 2022, 25, 405–415. [Google Scholar] [CrossRef]
- Mustafa, A.-r.A.; Abdelsamie, E.A.; Mohamed, E.S.; Rebouh, N.Y.; Shokr, M.S. Modeling of Soil Cation Exchange Capacity Based on Chemometrics, Various Spectral Transformations, and Multivariate Approaches in Some Soils of Arid Zones. Sustainability 2024, 16, 7002. [Google Scholar] [CrossRef]
- Lagacherie, P.; Baret, F.; Feret, J.-B.; Netto, J.M.; Robbez-Masson, J.M. Estimation of soil clay and calcium carbonate using laboratory, field and airborne hyperspectral measurements. Remote Sens. Environ. 2008, 112, 825–835. [Google Scholar] [CrossRef]
- Liu, L.; Ji, M.; Buchroithner, M. Combining partial least squares and the gradient-boosting method for soil property retrieval using visible near-infrared shortwave infrared spectra. Remote Sens. 2017, 9, 1299. [Google Scholar] [CrossRef]
- Zeng, R.; Zhang, G.-L.; Li, D.-C.; Rossiter, D.G.; Zhao, Y.-G. How well can VNIR spectroscopy distinguish soil classes? Biosyst. Eng. 2016, 152, 117–125. [Google Scholar] [CrossRef]
- Poppiel, R.R.; Lacerda, M.P.C.; Oliveira, M.P.d.; Demattê, J.A.M.; Romero, D.J.; Sato, M.V.; Almeida, L.R.d.; Cassol, L.F.M. Surface spectroscopy of Oxisols, Entisols and Inceptisol and relationships with selected soil properties. Rev. Bras. De Ciência Do Solo 2018, 42, e0160519. [Google Scholar] [CrossRef]
- Lazaar, A.; Mahyou, H.; Gholizadeh, A.; Elhammouti, K.; Bilal, M.; Andich, K.; Roger, J.M.; Monir, A.; Kouotou, D. Potential of VIS-NIR spectroscopy to characterize and discriminate topsoils of different soil types in the Triffa plain (Morocco). Soil Sci. Annu. 2019, 70, 54–63. [Google Scholar] [CrossRef]
- Demattê, J.A.M.; Terra, F.d.S.; Quartaroli, C.F. Spectral behavior of some modal soil profiles from São Paulo State, Brazil. Bragantia 2012, 71, 413–423. [Google Scholar] [CrossRef]
- Nocita, M.; Stevens, A.; van Wesemael, B.; Aitkenhead, M.; Bachmann, M.; Barthès, B.; Dor, E.B.; Brown, D.J.; Clairotte, M.; Csorba, A. Soil spectroscopy: An alternative to wet chemistry for soil monitoring. Adv. Agron. 2015, 132, 139–159. [Google Scholar]
- Mouazen, A.; Kuang, B.; De Baerdemaeker, J.; Ramon, H. Comparison among principal component, partial least squares and back propagation neural network analyses for accuracy of measurement of selected soil properties with visible and near infrared spectroscopy. Geoderma 2010, 158, 23–31. [Google Scholar] [CrossRef]
- Stenberg, B.; Rossel, R.A.V.; Mouazen, A.M.; Wetterlind, J. Visible and near infrared spectroscopy in soil science. Adv. Agron. 2010, 107, 163–215. [Google Scholar]
- Mohamed, E.; Saleh, A.; Belal, A.; Gad, A.A.; Science, S. Application of near-infrared reflectance for quantitative assessment of soil properties. Egypt. J. Remote Sens. 2018, 21, 1–14. [Google Scholar] [CrossRef]
- Viscarra Rossel, R.; Webster, R. Discrimination of Australian soil horizons and classes from their visible–near infrared spectra. Eur. J. Soil Sci. 2011, 62, 637–647. [Google Scholar] [CrossRef]
- Nanni, M.R.; Demattê, J.A.M.; Chicati, M.L.; Oliveira, R.d.; Cézar, E. Spectroradiometric data as support to soil classification. Int. Res. J. Agric. Sci. Soil Sci. 2011, 1, 109–117. [Google Scholar]
- Nanni, M.R.; Demattê, J.A.M.; Chicati, M.L.; Fiorio, P.R.; Cézar, E.; Oliveira, R.B.d. Informações espectrais de imagens landsat da superfície do solo como indicativo na discriminação de classes de solos. Acta Scientiarum. Agronomy 2012, 34, 103–112. [Google Scholar]
- Cezar, E.; Nanni, M.R.; Chicati, M.L.; de Oliveira, R.B.; Demattê, J.A.M. Discriminação entre solos formados em região transicional por meio de sua resposta espectral. Biosci. J. 2013, 29, 644–654. [Google Scholar]
- Vasques, G.; Demattê, J.A.M.; Rossel, R.A.V.; Ramírez-López, L.; Terra, F. Soil classification using visible/near-infrared diffuse reflectance spectra from multiple depths. Geoderma 2014, 223, 73–78. [Google Scholar] [CrossRef]
- Chicati, M.; Nanni, M.; Cézar, E.; Oliveira, R.; Chicati, M. Diffuse reflectance spectroscopy to estimate soil properties of Brazilian wetlands. Int. J. Environ. Agric. Res. 2016, 2, 62–66. [Google Scholar]
- Workman Jr, J.; Weyer, L. Practical Guide to Interpretive Near-Infrared Spectroscopy; CRC Press: Boca Raton, FL, USA, 2007. [Google Scholar]
- Quemada, M.; Daughtry, C.S. Spectral indices to improve crop residue cover estimation under varying moisture conditions. Remote Sens. 2016, 8, 660. [Google Scholar] [CrossRef]
- Kawamura, K.; Nishigaki, T.; Andriamananjara, A.; Rakotonindrina, H.; Tsujimoto, Y.; Moritsuka, N.; Rabenarivo, M.; Razafimbelo, T. Using a one-dimensional convolutional neural network on visible and near-infrared spectroscopy to improve soil phosphorus prediction in Madagascar. Remote Sens. 2021, 13, 1519. [Google Scholar] [CrossRef]
- Wang, L.; Wang, R.; Spectroscopy, B. Determination of soil pH from Vis-NIR spectroscopy by extreme learning machine and variable selection: A case study in lime concretion black soil. Spectrochim. Acta Part A Mol. 2022, 283, 121707. [Google Scholar] [CrossRef]
- Jiang, C.; Zhao, J.; Li, G. Integration of Vis–NIR Spectroscopy and Machine Learning Techniques to Predict Eight Soil Parameters in Alpine Regions. Agronomy 2023, 13, 2816. [Google Scholar] [CrossRef]
- Wang, Y.; Li, M.; Ji, R.; Wang, M.; Zheng, L. Comparison of soil total nitrogen content prediction models based on Vis-NIR spectroscopy. Sensors 2020, 20, 7078. [Google Scholar] [CrossRef]
- Zhong, H.; Li, X.; Zhai, H.; Zhou, Y. Hyper-spectral indirect estimation model of soil organic matter content in plough layer. J. Geomat. Sci. Technol. 2019, 36, 74–78. [Google Scholar]
- Morellos, A.; Pantazi, X.-E.; Moshou, D.; Alexandridis, T.; Whetton, R.; Tziotzios, G.; Wiebensohn, J.; Bill, R.; Mouazen, A.M. Machine learning based prediction of soil total nitrogen, organic carbon and moisture content by using VIS-NIR spectroscopy. Biosyst. Eng. 2016, 152, 104–116. [Google Scholar] [CrossRef]
- Peng, Y.; Wang, T.; Xie, S.; Liu, Z.; Lin, C.; Hu, Y.; Wang, J.; Mao, X. Estimation of Soil Cations Based on Visible and Near-Infrared Spectroscopy and Machine Learning. Agriculture 2023, 13, 1237. [Google Scholar] [CrossRef]
- Akter, S.; de Jonge, L.W.; Møldrup, P.; Greve, M.H.; Nørgaard, T.; Weber, P.L.; Hermansen, C.; Mouazen, A.M.; Knadel, M. Visible Near-Infrared Spectroscopy and Pedotransfer Function Well Predict Soil Sorption Coefficient of Glyphosate. Remote Sens. 2023, 15, 1712. [Google Scholar] [CrossRef]
- Zhang, J.; Wei, Q.; Xiong, S.; Shi, L.; Ma, X.; Du, P.; Guo, J. A spectral parameter for the estimation of soil total nitrogen and nitrate nitrogen of winter wheat growth period. Soil Use Manag. 2021, 37, 698–711. [Google Scholar] [CrossRef]
- Wang, X.; Liu, G.; Xiang, A.; Xiao, S.; Lin, D.; Lin, Y.; Lu, Y. Terrain gradient response of landscape ecological environment to land use and land cover change in the hilly watershed in South China. Ecol. Indic. 2023, 146, 109797. [Google Scholar] [CrossRef]
- El-Sayed, M.A.; Abd-Elazem, A.H.; Moursy, A.R.; Mohamed, E.S.; Kucher, D.E.; Fadl, M.E. Integration vis-NIR spectroscopy and artificial intelligence to predict some soil parameters in arid region: A case study of Wadi Elkobaneyya, South Egypt. Agronomy 2023, 13, 935. [Google Scholar] [CrossRef]
- Zhou, P.; Sudduth, K.A.; Veum, K.S.; Li, M. Extraction of reflectance spectra features for estimation of surface, subsurface, and profile soil properties. Comput. Electron. Agric. 2022, 196, 106845. [Google Scholar] [CrossRef]
- Yuh, Y.G.; Tracz, W.; Matthews, H.D.; Turner, S.E. Application of machine learning approaches for land cover monitoring in northern Cameroon. Ecol. Inform. 2023, 74, 101955. [Google Scholar] [CrossRef]
- MPWWR (Ministry of Public Works and Water Resources). Rehabilitation and improvement of water delivery systems in old lands. Proj. No. EGY/85/012. Final Report. 1988. Available online: https://eprints.soas.ac.uk/9235/1/water_control_in_egypts_canal_irrigation_a_discus-wageningen_university_and_research_76386.pdf (accessed on 1 January 2024).
- Mustafa, A. Utilizing of principal component analysis and geographic information system approach for assessing soil quality index under different land uses: Case study. SVU-Int. J. Agric. Sci. 2023, 5, 41–53. [Google Scholar] [CrossRef]
- Mustafa, A.; Engineering, A. Incorporate the Fertility Capability Classification and Geo-informatics for Assessing Soil: A Case Study on Some Soils of Sohag Governorate, Egypt. J. Soil Sci. 2023, 14, 187–193. [Google Scholar] [CrossRef]
- Mustafa, A.-R.A.-W.; Nutrition, P. Integration of TOPSIS and Geostatistical Technique for Soil Quality Assessment under Different Land Uses: A Case Study. Asian J. Soil Sci. 2023, 9, 16–32. [Google Scholar] [CrossRef]
- Hansen, M.C.; DeFries, R.S.; Townshend, J.R.; Sohlberg, R. Global land cover classification at 1 km spatial resolution using a classification tree approach. Int. J. Remote Sens. 2000, 21, 1331–1364. [Google Scholar] [CrossRef]
- Hansen, M.C.; Potapov, P.V.; Pickens, A.H.; Tyukavina, A.; Hernandez-Serna, A.; Zalles, V.; Turubanova, S.; Kommareddy, I.; Stehman, S.V.; Song, X.-P. Global land use extent and dispersion within natural land cover using Landsat data. Environ. Res. Lett. 2022, 17, 034050. [Google Scholar] [CrossRef]
- Alharbi, T.; El-Sorogy, A.S. Risk assessment of potentially toxic elements in Agricultural soils of Al-Ahsa Oasis, Saudi Arabia. Sustainability 2022, 15, 659. [Google Scholar] [CrossRef]
- ENVI 4.8 Exelis Visual Information Solutions. 2010. Available online: https://www.nv5geospatialsoftware.com/portals/0/pdfs/envi/10-10_ENVI48_Slick.pdf (accessed on 1 January 2024).
- Liping, C.; Yujun, S.; Saeed, S. Monitoring and predicting land use and land cover changes using remote sensing and GIS techniques—A case study of a hilly area, Jiangle, China. PLoS ONE 2018, 13, e0200493. [Google Scholar] [CrossRef]
- Jensen, J.R. Introductory Digital Image Processing, 3rd ed.; Prentice Hall: Upper Saddle River, NJ, USA, 2005. [Google Scholar]
- Lin, C.; Wu, C.-C.; Tsogt, K.; Ouyang, Y.-C.; Chang, C.-I. Effects of atmospheric correction and pansharpening on LULC classification accuracy using WorldView-2 imagery. Inf. Process. Agric. 2015, 2, 25–36. [Google Scholar] [CrossRef]
- Congalton, R.G.; Green, K. Assessing the Accuracy of Remotely Sensed Data; CRC Press: Boca Raton, FL, USA, 2009; ISBN 0-87-37198-67. [Google Scholar]
- FAO. Guidelines for Soil Description, Fourth edition; Food and Agriculture Organization of the United Nations: Rome, Italy, 2006. [Google Scholar]
- Piper, C. Soil and Plant Analysis; Hassel Press: Adelaide, Australia, 1950; 368p. [Google Scholar]
- Richards, L.A. Diagnosis and Improvement of Saline and Alkali Soils; US Government Printing Office: Washington, DC, USA, 1954. [Google Scholar]
- Black, C.A.; Evans, D.; Ensminger, L.; White, J.; CLARK, F. Methods of Soil Analysis; ASA: Monroe, MI, USA, 1983. [Google Scholar]
- Jackson, M. Soil Chemical Analysis. Pentice Hall India 1973, 498, 151–154. [Google Scholar]
- Asgari, N.; Ayoubi, S.; Demattê, J.A.; Jafari, A.; Safanelli, J.L.; Da Silveira, A.F.D. Digital mapping of soil drainage using remote sensing, DEM and soil color in a semiarid region of Central Iran. Geoderma Reg. 2020, 22, e00302. [Google Scholar] [CrossRef]
- Demattê, J.A.M.; Galdos, M.; Guimarães, R.; Genú, A.; Nanni, M.; Zullo, J., Jr. Quantification of tropical soil attributes from ETM+/LANDSAT-7 data. Int. J. Remote Sens. 2007, 28, 3813–3829. [Google Scholar] [CrossRef]
- Demattê, J.A.; Huete, A.R.; Ferreira, L.G.; Nanni, M.R.; Alves, M.C.; Fiorio, P.R. Methodology for bare soil detection and discrimination by Landsat TM Image. Open Remote Sens. J. 2009, 2, 24–35. [Google Scholar] [CrossRef]
- Demattê, J.A.; Ramirez-Lopez, L.; Rizzo, R.; Nanni, M.R.; Fiorio, P.R.; Fongaro, C.T.; Medeiros Neto, L.G.; Safanelli, J.L.; da S. Barros, P.P. Remote sensing from ground to space platforms associated with terrain attributes as a hybrid strategy on the development of a pedological map. Remote Sens. 2016, 8, 826. [Google Scholar] [CrossRef]
- El-Sorogy, A.S.; Al Khathlan, M.H. Assessment of potentially toxic elements and health risks of agricultural soil in Southwest Riyadh, Saudi Arabia. Open Chem. 2024, 22, 20240017. [Google Scholar] [CrossRef]
- Mohamed, E.S.; Jalhoum, M.E.; Hendawy, E.; El-Adly, A.M.; Nawar, S.; Rebouh, N.Y.; Saleh, A.; Shokr, M.S. Geospatial evaluation and bio-remediation of heavy metal-contaminated soils in arid zones. Front. Environ. Sci. 2024, 12, 1381409. [Google Scholar] [CrossRef]
- Jalhoum, M.E.; Abdellatif, M.A.; Mohamed, E.S.; Kucher, D.E.; Shokr, M. Multivariate analysis and GIS approaches for modeling and mapping soil quality and land suitability in arid zones. Heliyon 2024, 10, e27577. [Google Scholar] [CrossRef]
- Hammam, A.A.; Mohamed, W.S.; Sayed, S.E.-E.; Kucher, D.E.; Mohamed, E.S. Assessment of soil contamination using gis and multi-variate analysis: A case study in El-Minia Governorate, Egypt. Agronomy 2022, 12, 1197. [Google Scholar] [CrossRef]
- Ward, J.H., Jr. Hierarchical grouping to optimize an objective function. J. Am. Stat. Assoc. 1963, 58, 236–244. [Google Scholar] [CrossRef]
- De Amorim, R.C.; Hennig, C. Recovering the number of clusters in data sets with noise features using feature rescaling factors. Inf. Sci. 2015, 324, 126–145. [Google Scholar] [CrossRef]
- Abd El-Hamid, H.T.; El-Alfy, M.A.; Elnaggar, A.A. Prediction of future situation of land use/cover change and modeling sensitivity to pollution in Edku Lake, Egypt based on geospatial analyses. GeoJournal 2021, 86, 1895–1913. [Google Scholar] [CrossRef]
- Abd El-Kawy, O.; Rød, J.K.; Ismail, H.; Suliman, A.S. Land use and land cover change detection in the western Nile delta of Egypt using remote sensing data. Appl. Geogr. 2011, 31, 483–494. [Google Scholar] [CrossRef]
- Elagouz, M.; Abou-Shleel, S.; Belal, A.; El-Mohandes, M.; Science, S. Detection of land use/cover change in Egyptian Nile Delta using remote sensing. Egypt. J. Remote Sens. 2020, 23, 57–62. [Google Scholar] [CrossRef]
- El-Zeiny, A.M.; Effat, H.A. Environmental monitoring of spatiotemporal change in land use/land cover and its impact on land surface temperature in El-Fayoum governorate, Egypt. Remote Sens. Appl. Soc. Environ. 2017, 8, 266–277. [Google Scholar] [CrossRef]
- Said, M.E.S.; Ali, A.M.; Borin, M.; Abd-Elmabod, S.K.; Aldosari, A.A.; Khalil, M.M.; Abdel-Fattah, M.K. On the use of multivariate analysis and land evaluation for potential agricultural development of the northwestern coast of Egypt. Agronomy 2020, 10, 1318. [Google Scholar] [CrossRef]
- Cohen, J. Coefficient of agreement for nominal scales. Educ. Psychol. Meas. 1960, 20, 37–46. [Google Scholar] [CrossRef]
- George, E.; Horst, W.J.; Neumann, E. Adaptation of plants to adverse chemical soil conditions. In Marschner’s Mineral Nutrition of Higher Plants; Elsevier: Amsterdam, The Netherlands, 2012; pp. 409–472. [Google Scholar]
- Zewd, I.; Siban, M. The effects of alkalinity on physical and chemical properties of soil. J. Plant Biol. Agric. Sci 2021, 3, 1–5. [Google Scholar]
- Al Otaibi, F.A.; Alghamdi, S.A.; Abo-Elyousr, K.A. The Influence of Salinity on Plant Growth and Amendment Strategies. Sohag J. Sci. 2024, 9, 261–267. [Google Scholar] [CrossRef]
- Von Wandruszka, R. Phosphorus retention in calcareous soils and the effect of organic matter on its mobility. Geochem. Trans. 2006, 7, 6. [Google Scholar] [CrossRef]
- Abdel-Fattah, M.K.; Mohamed, E.S.; Wagdi, E.M.; Shahin, S.A.; Aldosari, A.A.; Lasaponara, R.; Alnaimy, M.A. Quantitative evaluation of soil quality using Principal Component Analysis: The case study of El-Fayoum depression Egypt. Sustainability 2021, 13, 1824. [Google Scholar] [CrossRef]
- Abo-Baker, A.; Sciences, A. Successive application impact of some organic amendments combined with acid producing bacteria on soil properties, NPK availability and uptake by some plants. Int. J. Curr. Microbiol. 2017, 6, 2394–2413. [Google Scholar] [CrossRef][Green Version]
- Aboukila, E.F.; Nassar, I.N.; Rashad, M.; Hafez, M.; Norton, J.B. Reclamation of calcareous soil and improvement of squash growth using brewers’ spent grain and compost. J. Saudi Soc. Agric. Sci. 2018, 17, 390–397. [Google Scholar] [CrossRef]
- Ibáñez-Asensio, S.; Marques-Mateu, A.; Moreno-Ramón, H.; Balasch, S. Statistical relationships between soil colour and soil attributes in semiarid areas. Biosyst. Eng. 2013, 116, 120–129. [Google Scholar] [CrossRef]
- Drewnik, M.; Skiba, M.; Szymański, W.; Żyła, M. Mineral composition vs. soil forming processes in loess soils—A case study from Kraków (Southern Poland). Catena 2014, 119, 166–173. [Google Scholar] [CrossRef]
- Sarkar, P.K.; Haque, M.S.; Karim, M.A. Growth analysis of soybean as influenced by GA3 and IAA and their frequency of application. Pak. J. Agronomy 2002, 1, 123–126. [Google Scholar]
- Chauhan, R.; Singh, A.; Bisen, J.; Singh, M.; Bera, B. Establishment and bringing up of replanted tea: An organic approach to improve productivity and fertility of soil. Int. J. Agric. Sci. 2016, 7, 43–51. [Google Scholar]
- Pakhre, D.; Karthikeyan, K.; Kumar, N.; Tiwary, P.; Chandran, P. Characterization and Evaluation of Cotton-growing Soils of Ghatanji Tehsil, Yavatmal District, Maharashtra. Agropedology 2021, 31, 1–11. [Google Scholar] [CrossRef]
- Conant, R.T.; Ryan, M.G.; Ågren, G.I.; Birge, H.E.; Davidson, E.A.; Eliasson, P.E.; Evans, S.E.; Frey, S.D.; Giardina, C.P.; Hopkins, F.M. Temperature and soil organic matter decomposition rates–synthesis of current knowledge and a way forward. Glob. Change Biol. 2011, 17, 3392–3404. [Google Scholar] [CrossRef]
- Moinet, G.Y.; Moinet, M.; Hunt, J.E.; Rumpel, C.; Chabbi, A.; Millard, P. Temperature sensitivity of decomposition decreases with increasing soil organic matter stability. Sci. Total Environ. 2020, 704, 135460. [Google Scholar] [CrossRef]
- Ben-Dor, E.; Chabrillat, S.; Demattê, J.A.M.; Taylor, G.; Hill, J.; Whiting, M.; Sommer, S. Using imaging spectroscopy to study soil properties. Remote Sens. Environ. 2009, 113, S38–S55. [Google Scholar] [CrossRef]
- Conforti, M.; Froio, R.; Matteucci, G.; Buttafuoco, G. Visible and near infrared spectroscopy for predicting texture in forest soil: An application in southern Italy. Iforest-Biogeosci. For. 2015, 8, 339. [Google Scholar] [CrossRef]
- Mitran, T.; Ravisankar, T.; Fyzee, M.; Suresh, J.R.; Sujatha, G.; Sreenivas, K. Retrieval of soil physicochemical properties towards assessing salt-affected soils using Hyperspectral Data. Geocarto Int. 2015, 30, 701–721. [Google Scholar] [CrossRef]
- Rossel, R.V.; Walvoort, D.; McBratney, A.; Janik, L.J.; Skjemstad, J. Visible, near infrared, mid infrared or combined diffuse reflectance spectroscopy for simultaneous assessment of various soil properties. Geoderma 2006, 131, 59–75. [Google Scholar] [CrossRef]
- Tiruneh, G.A.; Meshesha, D.T.; Adgo, E.; Tsunekawa, A.; Haregeweyn, N.; Fenta, A.A.; Belay, A.W.; Tadesse, N.; Fekadu, G.; Reichert, J.M. Use of soil spectral reflectance to estimate texture and fertility affected by land management practices in Ethiopian tropical highland. PLoS ONE 2022, 17, e0270629. [Google Scholar] [CrossRef] [PubMed]
- Weidong, L.; Baret, F.; Xingfa, G.; Qingxi, T.; Lanfen, Z.; Bing, Z. Relating soil surface moisture to reflectance. Remote Sens. Environ. 2002, 81, 238–246. [Google Scholar] [CrossRef]
- Ben-Dor, E.; Heller, D.; Chudnovsky, A. A novel method of classifying soil profiles in the field using optical means. Soil Sci. Soc. Am. J. 2008, 72, 1113–1123. [Google Scholar] [CrossRef]
- Demattê, J.A.; Morgan, C.L.; Chabrillat, S.; Rizzo, R.; Franceschini, M.H.; Terra, F.d.S.; Vasques, G.M.; Wetterlind, J. Spectral sensing from ground to space in soil science: State of the art, applications, potential, and perspectives. In Land Resources Monitoring, Modeling, and Mapping with Remote Sensing, 1st ed.; CRC Press: Boca Raton, FL, USA, 2015. [Google Scholar]
- Al-Jubouri, A.K.; Wheib, K.A. Effect of soil salinity on spectral reflectance of red and NIR wavelengths in AL-Salamiyat project. Plant Arch. 2020, 20, 1359–1365. [Google Scholar]
- Cierniewski, J.; Kuśnierek, K. Influence of several size properties on soil surface reflectance. Quaest. Geogr. 2010, 29, 13–25. [Google Scholar] [CrossRef]
- Rossel, R.V.; Cattle, S.; Ortega, A.; Fouad, Y. In situ measurements of soil colour, mineral composition and clay content by vis–NIR spectroscopy. Geoderma 2009, 150, 253–266. [Google Scholar] [CrossRef]
- Shahrayini, E.; Noroozi, A.; Eghbal, M.K. Prediction of soil properties by visible and near-infrared reflectance spectroscopy. Eurasian Soil Sci. 2020, 53, 1760–1772. [Google Scholar] [CrossRef]
- Zeng, R.; Rossiter, D.G.; Yang, F.; Li, D.-C.; Zhao, Y.-G.; Zhang, G.-L. How accurately can soil classes be allocated based on spectrally predicted physio-chemical properties? Geoderma 2017, 303, 78–84. [Google Scholar] [CrossRef]
- Xie, H.; Zhao, J.; Wang, Q.; Sui, Y.; Wang, J.; Yang, X.; Zhang, X.; Liang, C. Soil type recognition as improved by genetic algorithm-based variable selection using near infrared spectroscopy and partial least squares discriminant analysis. Sci. Rep. 2015, 5, 10930. [Google Scholar] [CrossRef]
Disclaimer/Publisher’s Note: The statements, opinions and data contained in all publications are solely those of the individual author(s) and contributor(s) and not of MDPI and/or the editor(s). MDPI and/or the editor(s) disclaim responsibility for any injury to people or property resulting from any ideas, methods, instructions or products referred to in the content. |
© 2024 by the authors. Licensee MDPI, Basel, Switzerland. This article is an open access article distributed under the terms and conditions of the Creative Commons Attribution (CC BY) license (https://creativecommons.org/licenses/by/4.0/).