Article

Climate Change Effects on Land Use and Land Cover Suitability in the Southern Brazilian Semiarid Region

by
Lucas Augusto Pereira da Silva
1,2,*,
Edson Eyji Sano
3,
Taya Cristo Parreiras
4,
Édson Luis Bolfe
4,5,
Mário Marcos Espírito-Santo
6,
Roberto Filgueiras
7,
Cristiano Marcelo Pereira de Souza
8,
Claudionor Ribeiro da Silva
1 and
Marcos Esdras Leite
2
1
Institute of Geography, Federal University of Uberlândia (UFU), Uberlândia 38408-100, Brazil
2
Department of Geosciences, State University of Montes Claros, Montes Claros 39401-089, Brazil
3
Brazilian Agricultural Research Corporation (Embrapa Cerrados), Planaltina 73301-970, Brazil
4
Institute of Geosciences, State University of Campinas (Unicamp), Campinas 13083-855, Brazil
5
Brazilian Agricultural Research Corporation (Embrapa Agricultura Digital), Campinas 13083-886, Brazil
6
Department of General Biology, State University of Montes Claros, Montes Claros 39401-089, Brazil
7
Department of Agricultural Engineering, Federal University of Viçosa (UFV), Viçosa 36570-900, Brazil
8
Geology Board, Federal University of Vale do São Francisco, Senhor do Bonfim 48970 000, Brazil
*
Author to whom correspondence should be addressed.
Land 2024, 13(12), 2008; https://doi.org/10.3390/land13122008
Submission received: 2 October 2024 / Revised: 4 November 2024 / Accepted: 5 November 2024 / Published: 25 November 2024
(This article belongs to the Special Issue Global Savanna Variation in Form and Function: Theory & Practice)

Abstract

:
Climate change is expected to alter the environmental suitability of land use and land cover (LULC) classes globally. In this study, we investigated the potential impacts of climate change on the environmental suitability of the most representative LULC classes in the southern Brazilian semiarid region. We employed the Random Forest algorithm trained with climatic, soil, and topographic data to project future LULC suitability under the Representative Concentration Pathway RCP 2.6 (optimistic) and 8.5 (pessimistic) scenarios. The climate data included the mean annual air temperature and precipitation from the WorldClim2 platform for historical (1970–2000) and future (2061–2080) scenarios. Soil data were obtained from the SoilGrids 2.1 digital soil mapping platform, while topographic data were produced by NASA’s Shuttle Radar Topography Mission (SRTM). Our model achieved an overall accuracy of 60%. Under the worst-case scenario (RCP 8.5), croplands may lose approximately 8% of their suitable area, while pastures are expected to expand by up to 30%. Areas suitable for savannas are expected to increase under both RCP scenarios, potentially expanding into lands historically occupied by forests, grasslands, and eucalyptus plantations. These projected changes may lead to biodiversity loss and socioeconomic disruptions in the study area.

1. Introduction

Climate change presents a significant threat to global environmental sustainability, with more amplified impacts on semiarid regions [1]. These regions, characterized by low water availability, are projected to experience substantial increases in air temperature and decreases in precipitation by the end of the century [2,3]. These climate variables can increase aridity and alter the environmental suitability dynamics of different land use and land cover (LULC) classes [4]. Environmental suitability refers to the most suitable conditions for maintaining a given class of LULC, considering factors such as soil properties, topography, water availability, and climatic conditions [5].
In the Brazilian semiarid region, characterized by the occurrence of high levels of endemism and a wide diversity of plant species in the Caatinga biome (xerophytic vegetation) [6,7], the implications of climate change on LULC suitability are evident. Previous studies suggest that this region presents a persistent trend in the intensification of aridification [8,9] drives ecological succession processes, especially the gradual loss of suitability of species less adapted to these arid conditions [10,11,12]. Furthermore, a decline in suitability for anthropogenic land uses, such as the contraction of agricultural lands, is also expected [13,14].
While trends in changes in LULC environmental suitability due to climate change are well-documented in the central part of the Brazilian semiarid region, peripheral areas, such as northern Minas Gerais, have often been neglected. Therefore, investigations into the impacts of climate change in the North of Minas Gerais are essential, as it is a representative ecotone region in Brazil, that is, an area sensitive to disturbances in climatic variables such as rising temperatures and decrease in precipitation levels [15,16]. This becomes even more imperative considering the ecological diversity of this ecotonal zone, with vegetation ranging from open fields and tropical savannas to evergreen and deciduous forests [17]. These ecosystems harbor high levels of endemism and a variety of species [18,19], which classifies the North of Minas Gerais as a biodiversity hotspot as part of Brazilian Cerrado [20]. Additionally, this region has broad environmental potential for croplands, planted pastures, and eucalyptus, land uses that play an important role in national and international socioeconomic dynamism. For example, the region stands out in exports of fruits and fibers to several countries [21], in addition to supplying the steel industry at a national level through charcoal from eucalyptus reforestation [22].
Therefore, quantifying the impacts of future climate change on the suitability of LULC classes in the North of Minas Gerais is essential for maintaining ecological services and socioeconomic stability. This assessment must consider multiple predictors that determine the most appropriate environments for both natural ecosystems and anthropogenic uses [5]. In addition to climatic variables such as temperature and precipitation, it is pertinent to include factors such as pedological and topographic attributes, as they are fundamental for the establishment of plant species and agricultural practices [10,19,23]. This approach is particularly important for the North of Minas Gerais, a region with great pedodiversity and varied landforms.
Considering the complexity of LULC and environmental attributes, it is necessary to use methodological structures that capture these relationships. In this context, previous studies [10,24,25] have suggested the use of machine learning algorithms, as they allow the use of multiple covariates, in addition to distinguishing non-linear patterns essential for discriminating different LULC classes. Among these algorithms, Random Forest (RF) has gain prominence in environmental modeling [23,24,26]. RF is an algorithm based on decision tree logic and the bootstrap method, which ensures a robust mapping of LULC classes based on the principle of randomness [27,28].
Herein, we assess the potential impacts of future climate change (2061–2080) on the environmental suitability of LULC classes in North of Minas Gerais, using the RF algorithm. To the best of our knowledge, this is the first study to employ this approach in the Brazilian semiarid region. The results of this research could guide important public policy instruments on LULC. For example, the improvement of agro-environmental zoning, guiding decision-making considering the vulnerability of lands to future climate change, allowing the expansion of conservation areas, and the definition of priority zones for agricultural productivity.

2. Materials and Methods

2.1. Study Area

The study area is located in the north of the state of Minas Gerais, corresponding to the southern part of the Brazilian semiarid region (latitude: 15° S to 18° S; longitude: 42° W to 46° W) (Figure 1). This area was defined as the administrative mesoregion of Northern Minas Gerais by the Brazilian Institute of Geography and Statistics (IBGE) [29]. The study area encompasses 89 municipalities, of which 60 belong to the limit of the Brazilian Semiarid region, as defined by the Superintendence for the Development of the Northeast (SUDENE) [30]. Most of the Brazilian government’s decisions regarding the semiarid region (such as financial credits to combat desertification) are based on this classification.
The region is characterized by a diverse range of LULC classes, including forests, savannas, grasslands, pastures, croplands, and eucalyptus plantations. The distribution and suitability of these LULC classes are influenced by a combination of biophysical factors such as climate, topography, and soil, along with public policies aimed at fostering regional economic development [31,32].
The predominant climate in the region is tropical with dry winter (Aw) and dry summer (As), according to the Köppen classification [33]. Annual precipitation is irregular, varying between 600 mm and 1300 mm. The region exhibits pronounced climatic seasonality, with eight dry months from March to October, followed by four rainy months from November to February [32]. Elevation ranges from 300 m to 1800 m, with an average of 700 m, reflecting the geomorphological heterogeneity of the region. In the western part of the study area, the landscape is characterized by flattened surfaces such as tablelands, depressions, terraces, and plains. These geomorphological features have led to the development of well-drained, highly weathered soils, predominantly Ferralsols [32]. This soil diversity supports the coexistence of the Caatinga and Cerrado biomes, characterized by seasonal phytophysiognomies, mainly the savannic formations of the Cerrado, characterized by a grass layer, abundant shrub species, and sparse, short trees.
The landscape heterogeneity in the western portion of the study area, coupled with public investments from the SUDENE, has facilitated the expansion of pastures and croplands [34]. Pastures (brachiaria; African genus Urochloa) are the predominant land use type in the region, covering approximately 38,000 km2 (~30% of the area). In general, livestock farming in the region follows the extensive model, with pastures with some degree of environmental degradation [35], which leads to a low animal carrying capacity, around 0.47 animal units per hectare [36]. Perennial and annual crops represent 2% of the study area, distributed among bananas, grapes, lemons, mangoes, corn, and beans, among others. The North of Minas Gerais is a crucial region for the production of agricultural commodities for international markets, particularly through the Jaíba Project, one of the largest irrigated perimeters in the world [34].
The eastern part of the study area includes the Espinhaço mountain range, characterized primarily by rocky outcrops mostly covered with grasslands, known as rupestrian Cerrado [32]. This region is interspersed with plateaus that feature patches of humid Atlantic Forest and Cerrado. The relatively gentle terrain of these plateaus facilitates mechanization, making them attractive for the establishment of exotic eucalyptus plantations. Consequently, significant government incentives have been directed toward promoting theses plantations in the region [22]. The Eucalyptus grandis species is the most cultivated in the region, essentially due to its rapid growth, which is attractive for timber production.

2.2. Methodological Approach

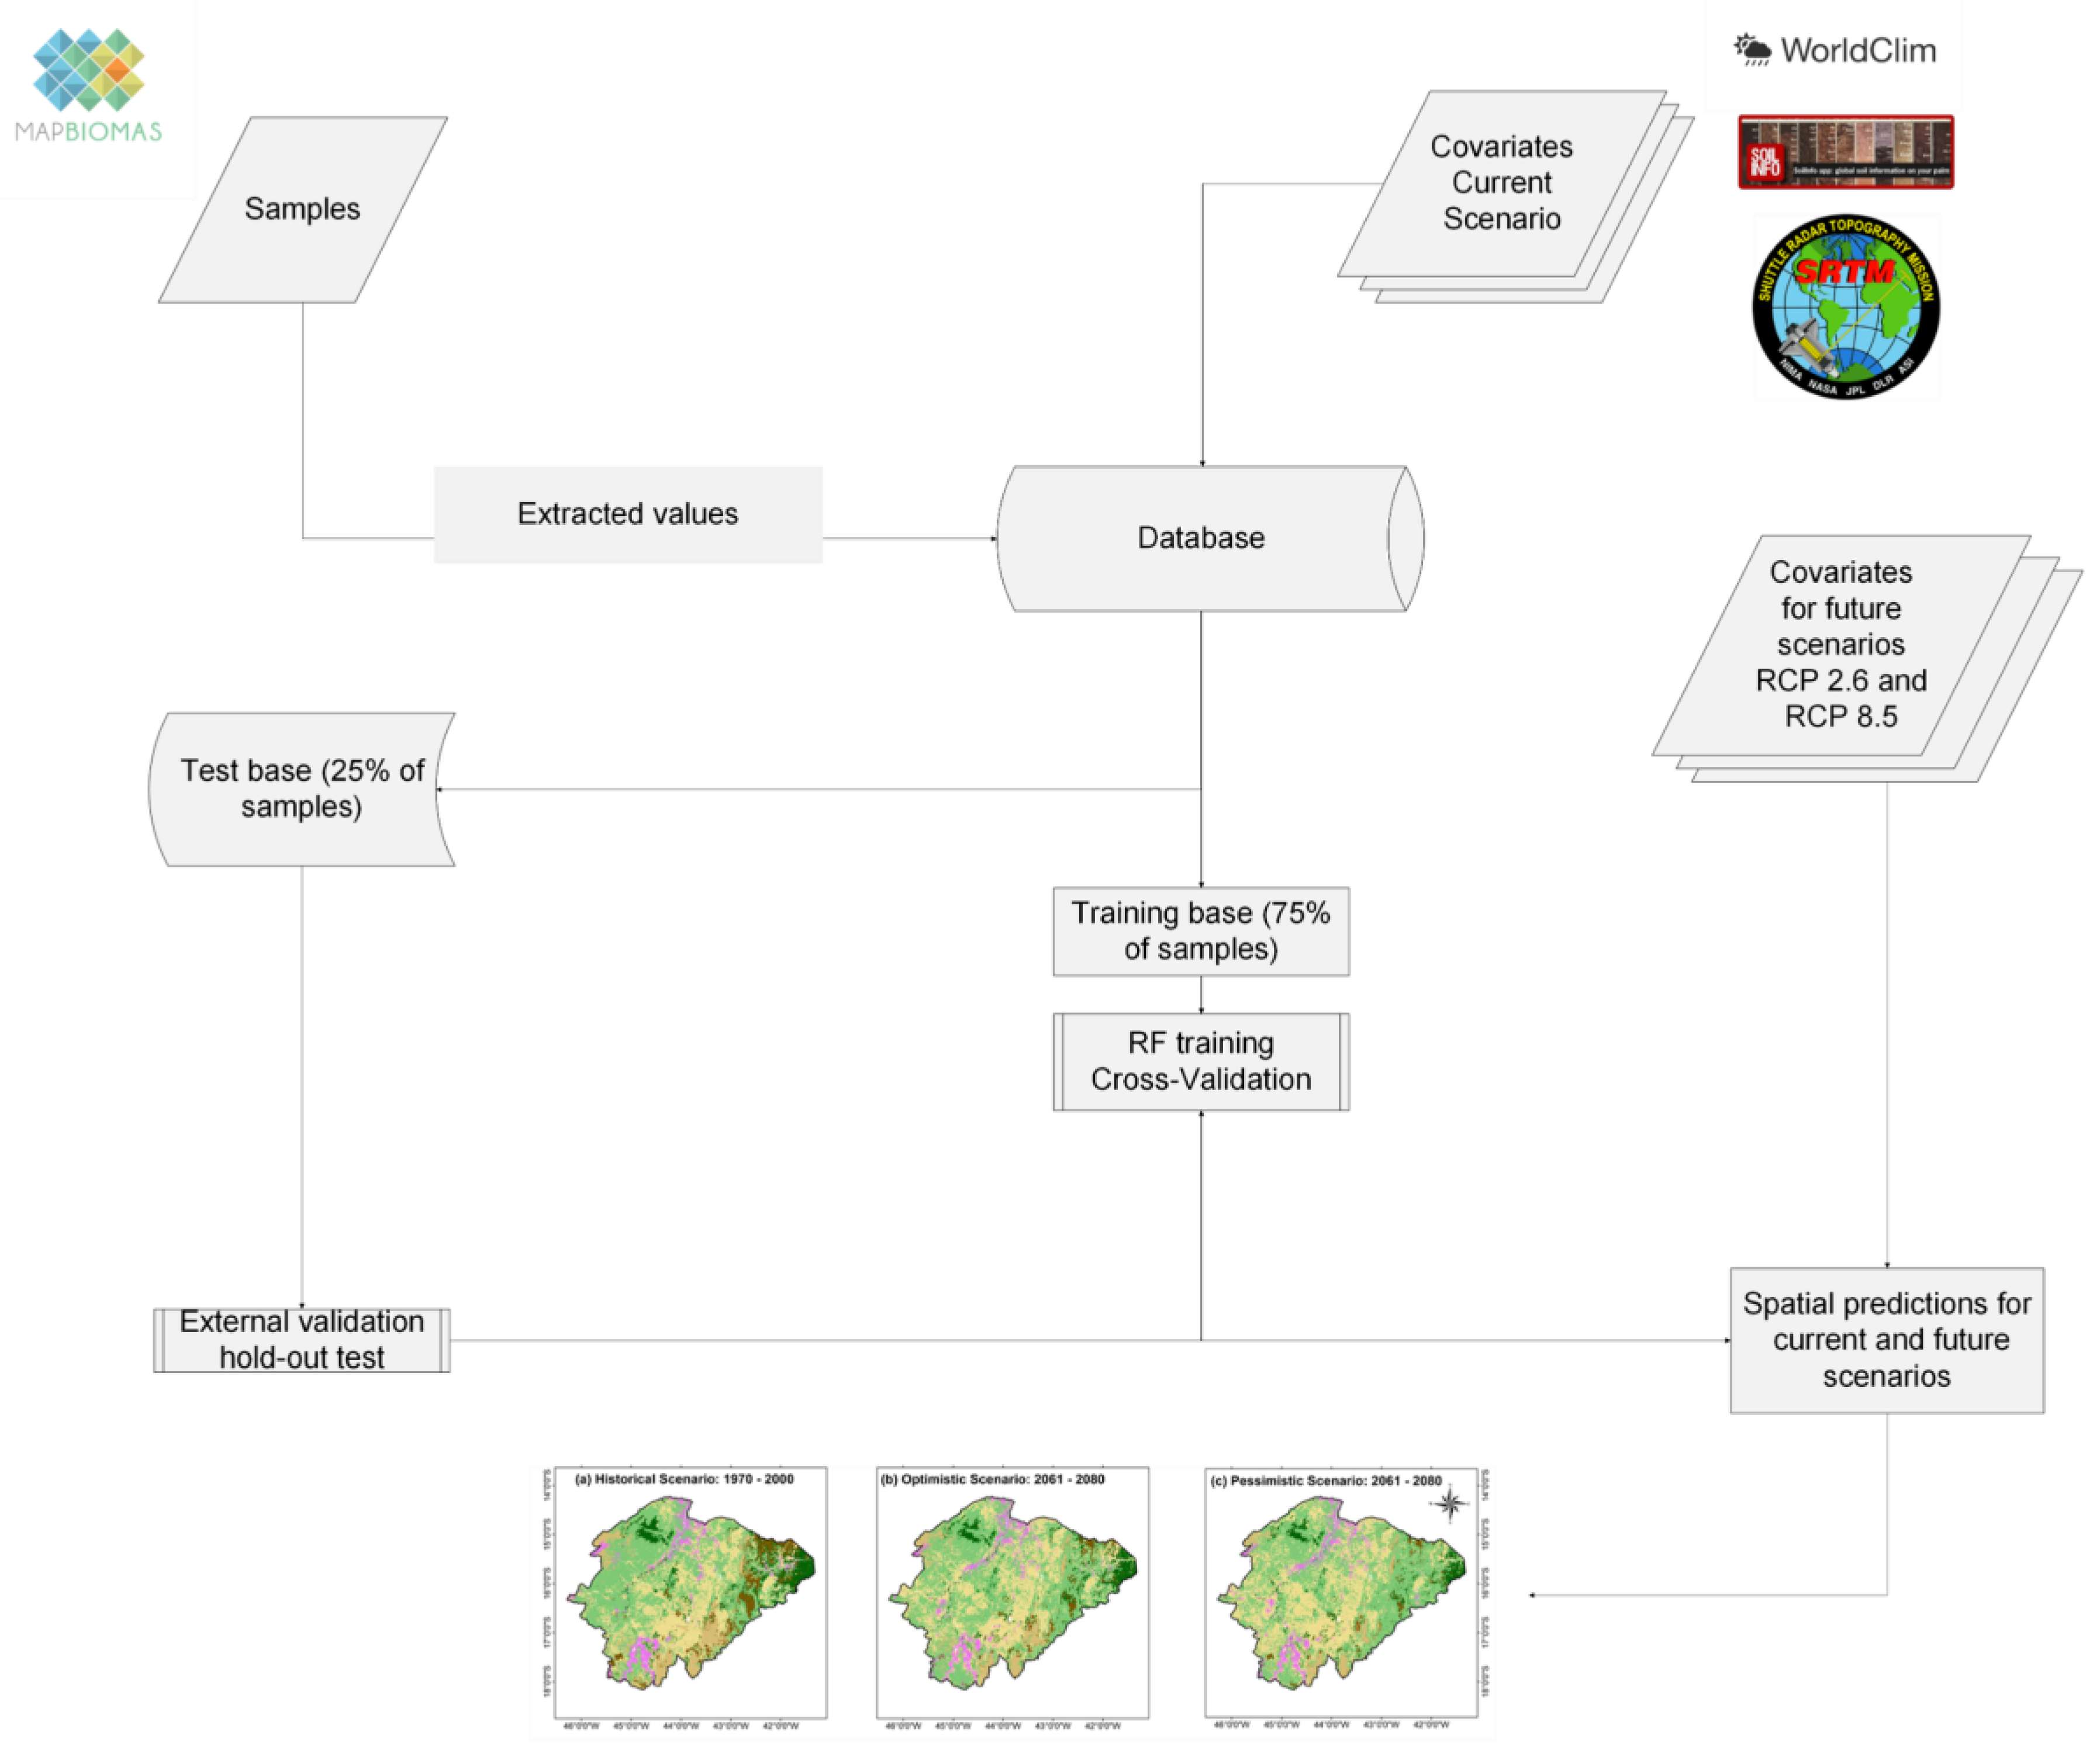
This study was based on the following key steps: (i) assembling a comprehensive database that includes climate, soil, and topographic data; (ii) acquiring and refining LULC samples; (iii) training and validating the RF algorithm; and (iv) predicting LULC dynamics under future climate change scenarios (Figure 2).

2.3. Covariates

We selected a set of 13 covariates, which included climate, soil, and topographic data (Table 1). The climate database comprised mean air temperature and mean annual precipitation for both historical (1970–2000) and future (2061–2080) climate scenarios. For historical data, we used the WorldClim 2.1 platform, while data for the future scenario were obtained from the WorldClim 1.4 platform [37,38].
Future climate data were obtained from the Intergovernmental Panel on Climate Change (IPCC), made available through the Coupled Model Intercomparison Project (CMIP) Global Climate Models (GCMs). These models are based on the scenarios outlined in the IPCC’s Assessment Reports, categorized as Representative Concentration Pathways (RCPs), defined by their respective radiative forcing levels: 2.6, 4.5, 6.0, and 8.5 W m−2 [39]. RCPs consider different factors affecting CO2 emissions such as demographic changes, socioeconomic development, and technological advances [39]. Increased CO2 concentration alters the radiative forcing of the atmosphere, leading to an increase in global temperatures [40]. This temperature rise due to an increase in the atmospheric CO2 concentration is known as Equilibrium Climate Sensitivity (ECS) [39]. Previous IPCC reports indicate that ECS ranges from 1.5 °C to 4.5 °C. However, the most recent IPCC Assessment Report 6 indicates a higher sensitivity to climate change, with the ECS ranging from 1.8 °C to 5.6 °C, suggesting a stronger warming [37,38,39,40].
Previous studies using models from the sixth Assessment Report (AR6) have observed that these models could exhibit more extreme behaviors, often overestimating or underestimating the representations of natural ecosystems and biophysical properties of LULC classes, such as leaf area index and gross primary productivity [41,42,43,44,45,46,47,48,49,50,51]. Consequently, we adopted a more conservative approach by using models from the fifth Assessment Report (AR5), a choice that has also been made in other global studies [10,23,25,52,53,54]. AR5 models have been extensively tested and validated in various parts of Brazil [10,11,23,52,55,56], facilitating comparisons and supporting the consistency of our results. Therefore, we selected three GCMs known for their strong performance in Brazil: the Community Climate System Model version 4 (CCSM4) [57], the Max Planck Institute Earth System Model (MPI-ESM-P) [58], and the Model for Interdisciplinary Research on Climate (MIROC-ESM) [59].
These models were selected to represent both the RCP 2.6 (optimistic) and RCP 8.5 (pessimistic) scenarios. The RCP 2.6 scenario is consistent with the goals of the Paris Agreement, aiming to limit the global temperature rise to 1.5–2 °C. In contrast, the RCP 8.5 scenario projects a potential global temperature increase of up to 4.5 °C by the end of the century [39]. Given the specific characteristics of each model´s climate projections, we created an ensemble model by averaging annual air temperature and precipitation data from the three CGMs. This ensemble approach, designed to reduce the uncertainties of estimates, has been employed in other studies [25,60,61].
The soil database was obtained from the SoilGrids platform (Table 1) [62], considering covariates that represent the physical and chemical properties of soils at 0–5 cm depth. The inclusion of soil data has great potential for distinguishing different LULC classes because they directly influence the development of various LULC classes [24]. The selected covariates included the water-holding capacity, essential nutrients, and acidity. Previous studies have demonstrated that incorporating soil data significantly enhances LULC classifications [10,63,64].
The elevation data were obtained from the Shuttle Radar Topography Mission (SRTM) [65] and accessed through the Google Earth Engine platform. Elevation plays a critical factor in the spatial distribution of LULC classes, as it interacts with other key attributes that affect the suitability of LULC classes, such as climate [66], soil type [67], and water availability [68]. Integrating soil and elevation data allows for the production of more accurate LULC maps [10]. In this study, we resampled the soil and elevation covariates to a 1 km spatial resolution using the bilinear interpolation method.

2.4. Dataset

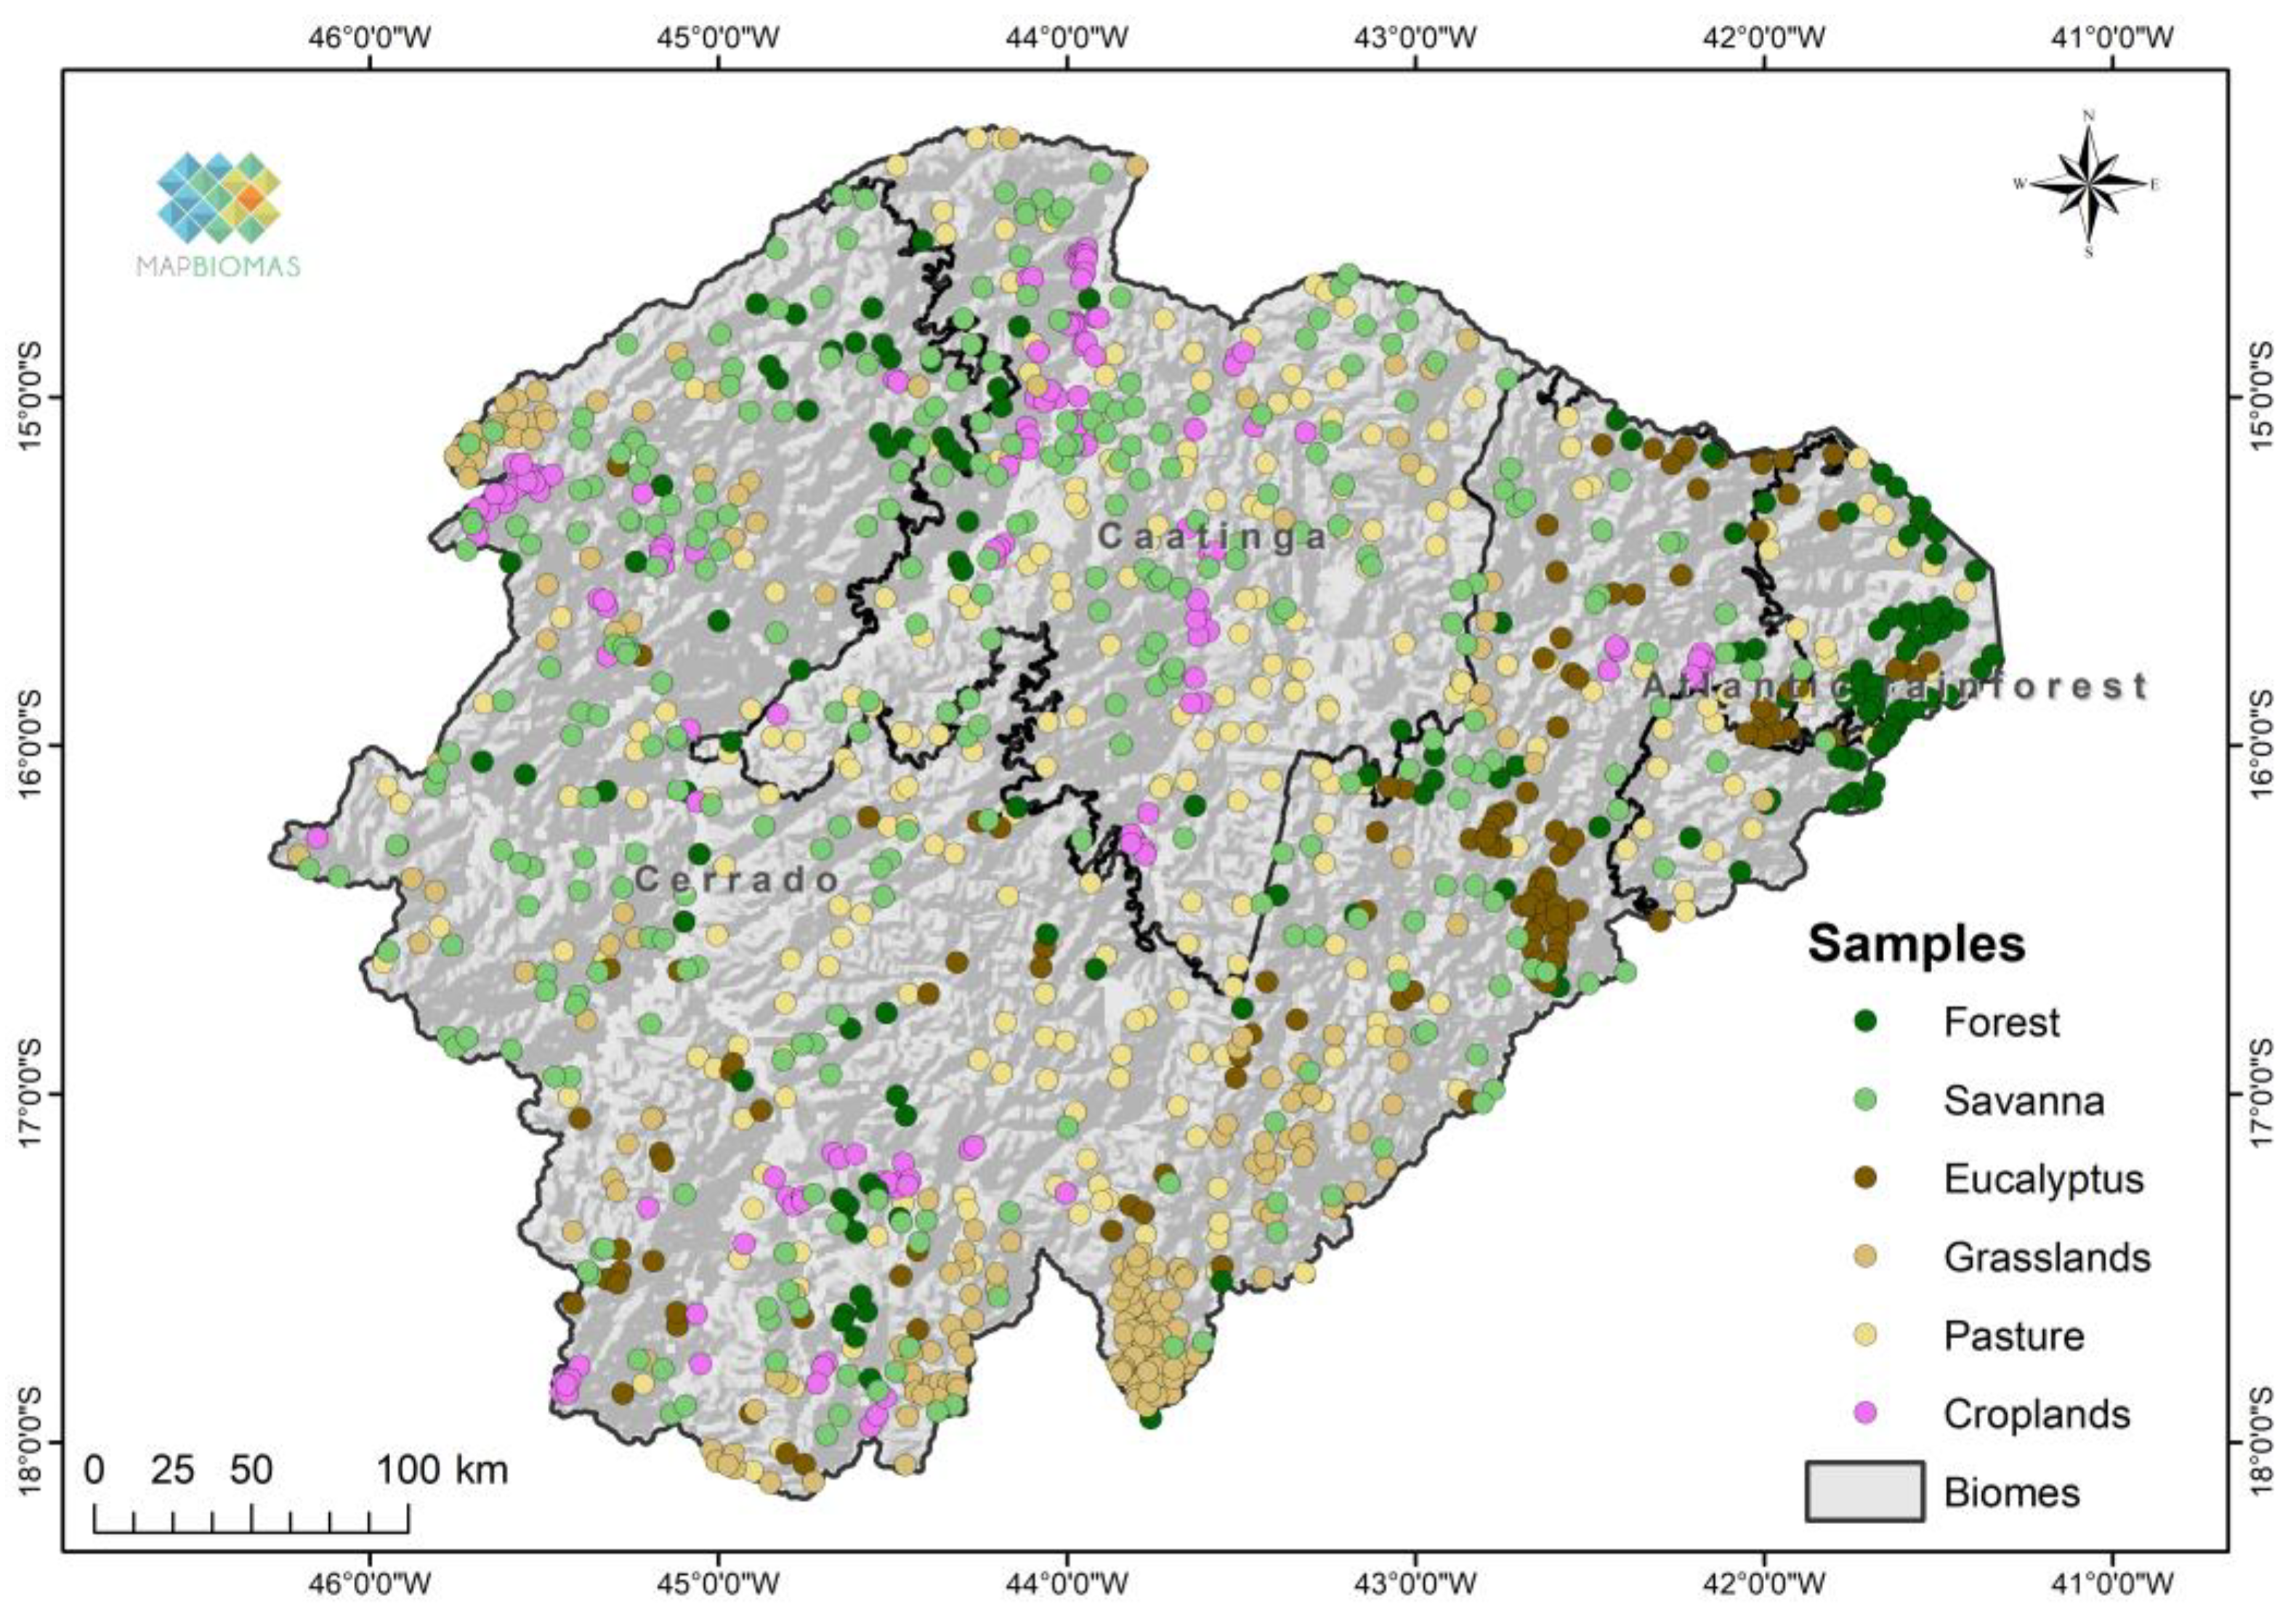
The dataset comprised 1209 training and validation samples of six representative LULC classes of the study area: croplands (n = 148), eucalyptus plantations (n = 134), forests (n = 146), native grasslands (n = 222), pastures (n = 252), and savannas (n = 307) (Figure 3; Table 2). These samples were obtained from the MapBiomas platform for the period between 1985 and 2022. The samples were produced through visual interpretation of Landsat satellite images by analysts and subsequently validated by trained specialists [69,70]. For the historical scenario (1970–2000), we used the statistical mode value of each pixel from the MapBiomas platform as the representative LULC class. To further enhance the reliability of these samples, we visually inspected and adjusted the LULC labels using QGIS software [71].

2.5. Training and Validation

The sampling set was used to extract covariate values from the historical scenario, with 75% of the samples allocated for training the model and 25% allocated for validation. We used the Random Forest (RF) algorithm to map LULC classes. RF was chosen based on its high performance in LULC classifications in other regions of the planet [72]. RF stands out for its statistical robustness and ability to distinguish non-linear behaviors, such as the relationship between LULC classes and edaphoclimatic conditions [23,25].
The RF algorithm is based on the bootstrap method, where multiple decision trees are generated using different subsets of environmental covariates during the training process [27]. This approach reduces the correlation between individual trees, thereby preventing model overfitting [73]. Each uncorrelated tree predicts the LULC class, and the final map is generated by considering the classes most voted across all trees in the forest [27]. The RF hyperparameters are ntree, which represents the number of trees created during training, and mtry, that is, the number of covariates selected for splitting each tree [27].
We trained the RF model using 75% of the samples and considered a 10-fold cross-validation method with five replications. The database was divided into 10 subsets (k-folds) and submitted to an iterative training process repeated five times to ensure that the model was free from overfitting. This training phase was automatically prepared using the Caret R 4.3.2 package [74]. In our study, the best performance was obtained by ntree = 500 and mtry = 7. Furthermore, during training, we obtained a ranking with the most important covariates for classification using varImp [74].
Next, we evaluated classification performance using the holdout test on the remaining 25% of the samples. We evaluated the performance of our method using the framework proposed by Pontius and Millones [75]. This involved constructing a confusion matrix and calculating several metrics, including overall accuracy (OA), quantity disagreement (QD), allocation disagreement (AD), producer’s accuracy (PA), and user’s accuracy (UA). OA is the probability of samples being correctly classified by the algorithm; QD corresponds to the proportion of incorrectly classified samples; AD represents the spatial proportion of samples incorrectly distributed in the classes; PA is related to the model’s omission error, i.e., it measures which samples were correctly distributed by the classifier for their real class; and UA comprises the commission error rate, i.e., it estimates the proportion of samples that belong to a given class. All analyses were carried out using R [76].

2.6. Prediction Scenarios

In the training phase, the RF algorithm was adjusted based on climate covariates from the historical scenario (1970–2000), along with pedological aspects and altitude. To model changes in LULC for future scenarios, we replaced the historical climate covariate layers with the IPCC ensemble model projections for both optimistic and pessimistic scenarios. We retained the soil and altitude data in the future prediction, based on the assumption that these landscape attributes will not significantly change over the approximately 70-year interval. This assumption has been frequently used in previous studies [10,23,25]. Spatial predictions were made using the predict function of the raster package [77].

3. Results

3.1. Climate Projections

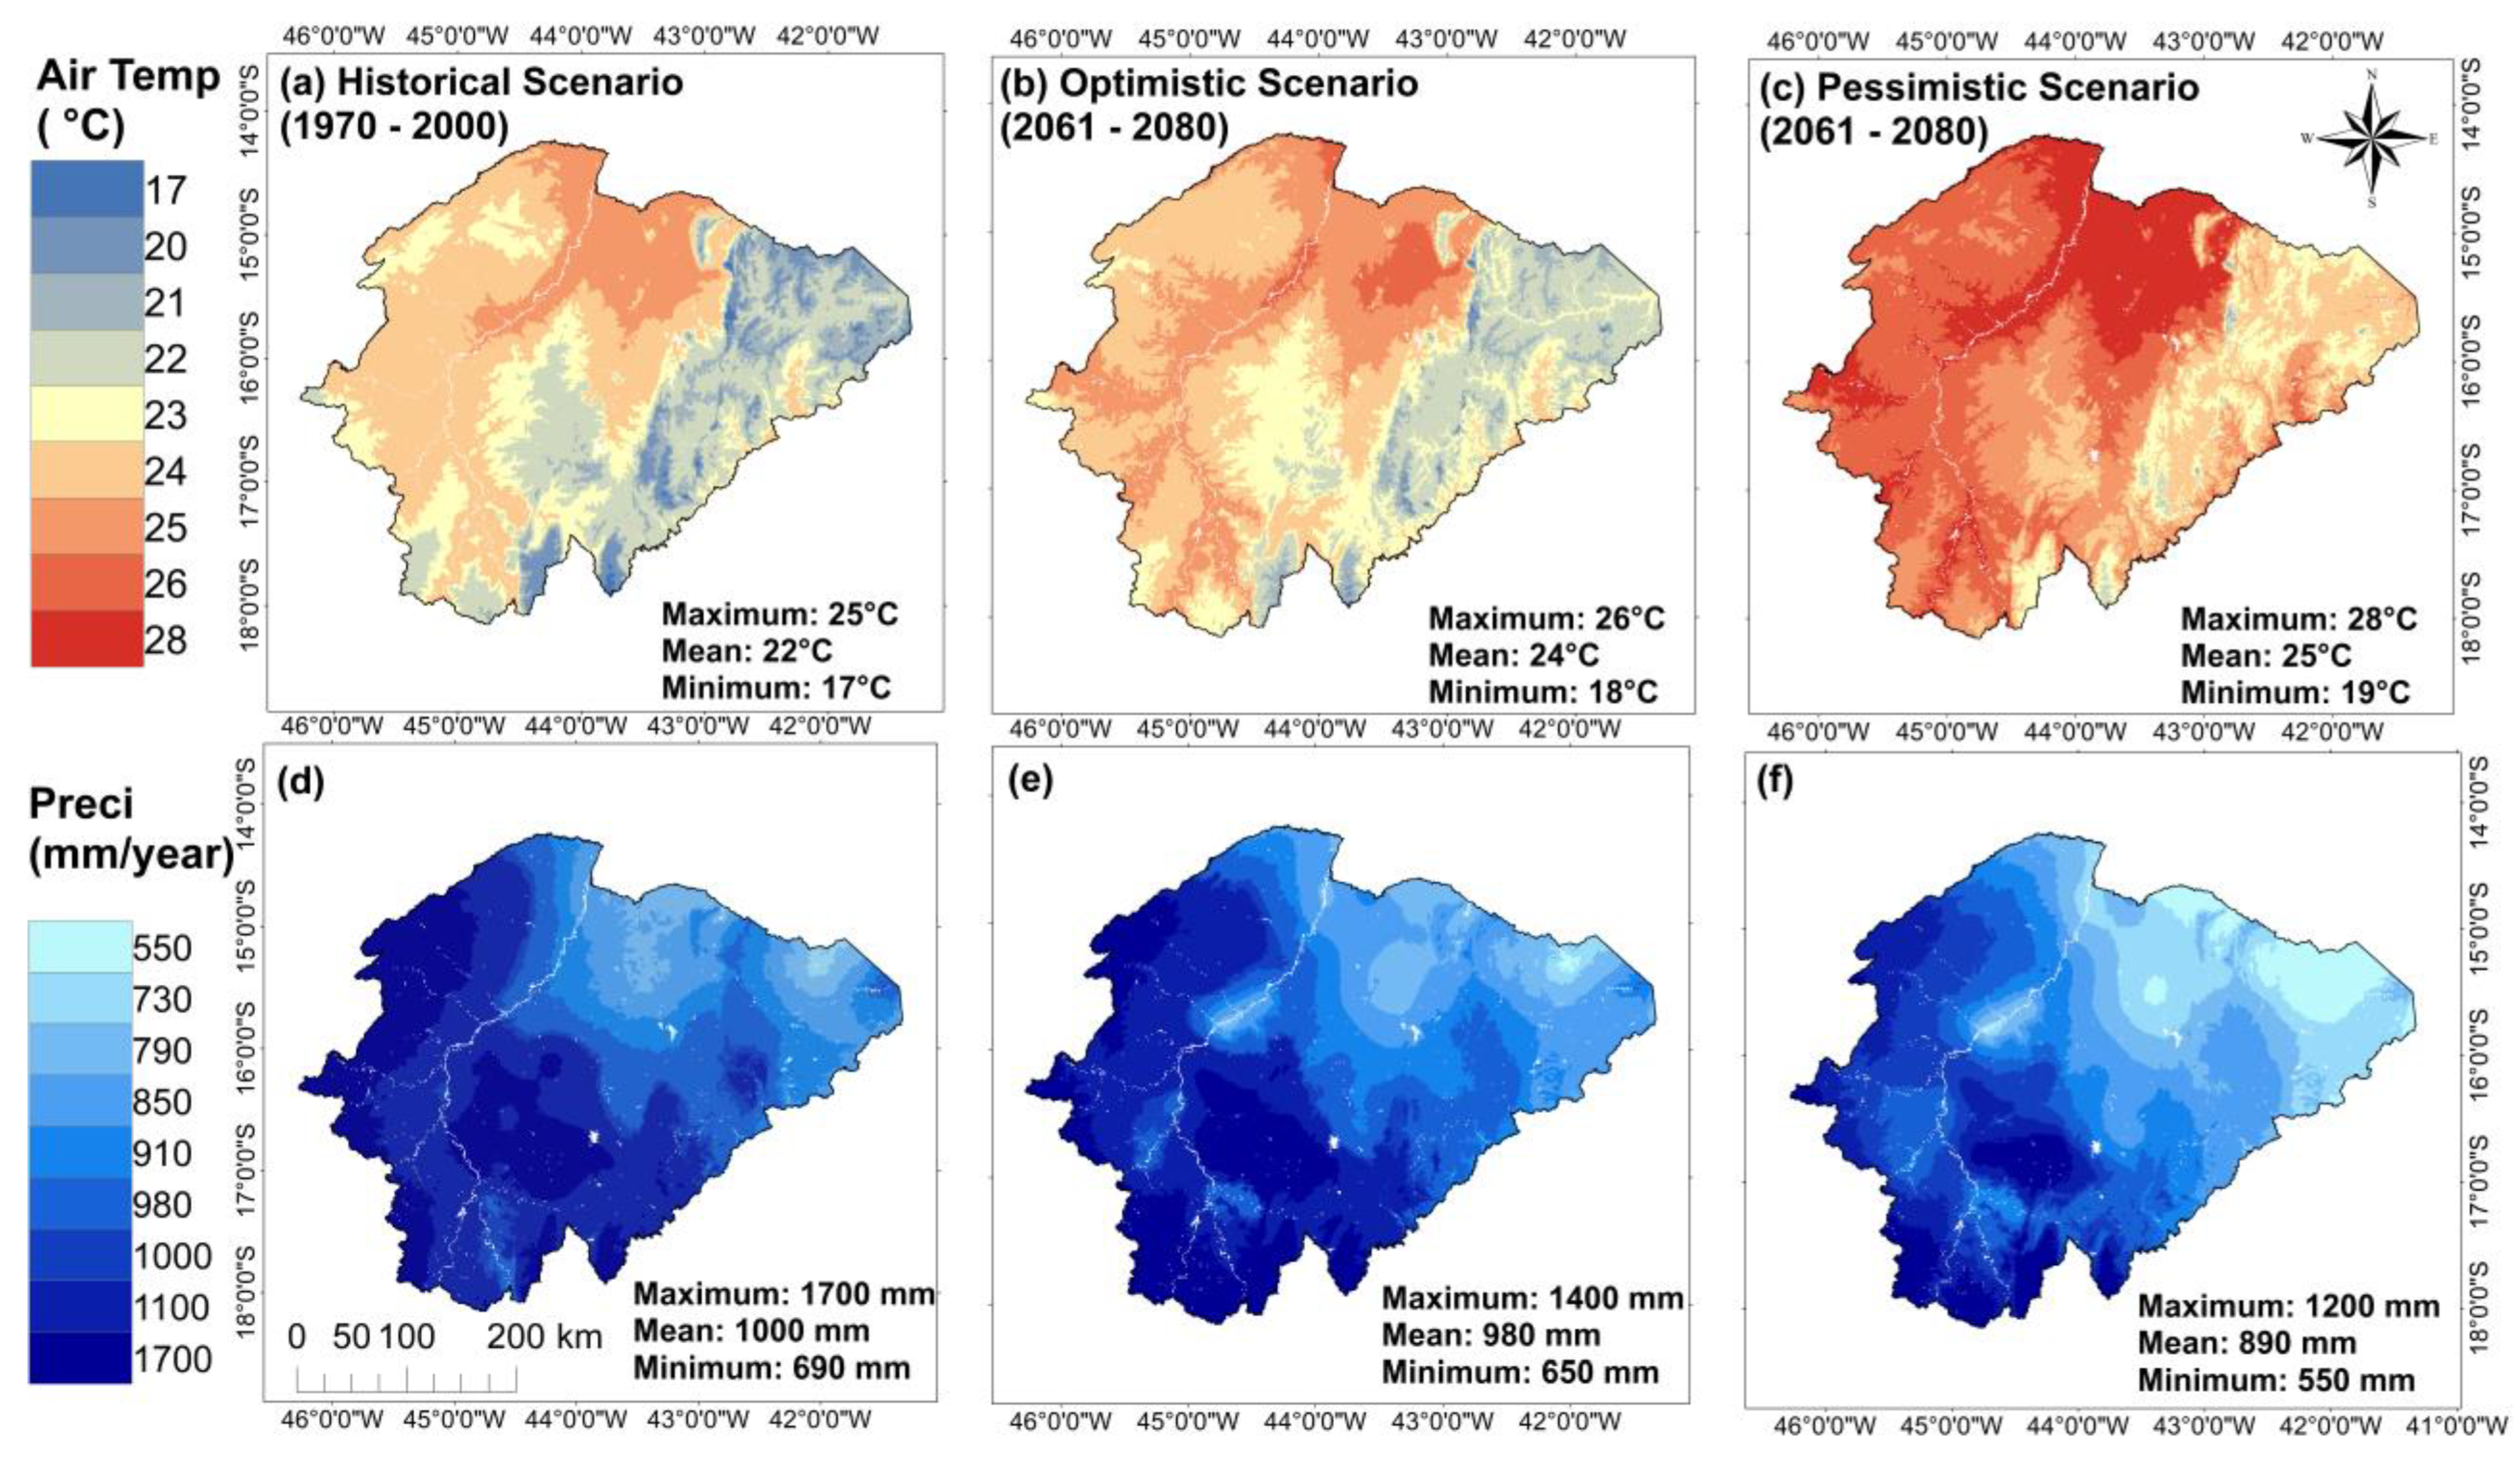
The historical scenario revealed a mean annual air temperature of 22 °C in the North of Minas Gerais (Figure 4). The ensemble model predicted an increase of 2 °C in mean air temperature under the most optimistic scenario (RCP 2.6), while the pessimistic scenario (RCP 8.5) suggested a more pronounced increase of 3° C. Additionally, the climate change models projected a pronounced decline in mean annual precipitation of up to 110 mm year−1.
In the historical scenario, the lowest mean temperature values (19 °C to 20 °C) covered 7276 km2 (~5%) of the study area, predominantly in the eastern portion where elevated areas of the Espinhaço mountain chain are located. In future scenarios (2061–2080), due to the projected expansion of temperature range between 23 °C and 26 °C, the areas with minimum air temperatures are expected to decrease drastically, covering only 4 km2. The maximum temperature in the historical scenario was 25 °C, distributed over 17,272 km2 (13%) of the region, predominantly in the extreme north. Under climate change conditions, the highest average temperatures (25 °C to 28 °C) are projected to cover up to 72% of the North of Minas Gerais in the most pessimistic scenario (RCP 8.5).
Currently, relatively high annual precipitation levels (>1000 mm yr−1) occur over a substantial portion of the study area, covering 69,349 km2 (51%), mostly in the western region. However, future climate models project a significant reduction in these high-precipitation areas. Under the pessimistic scenario, a 34% decrease in these areas is expected. On the other hand, areas with low precipitation (<690 mm year−1 to 790 mm year−1) are projected to expand. Historically, this precipitation range encompassed only 5% of the study area, but future projections indicate an increase of 7% to 29%.

3.2. Mapping LULC for the Historical Scenario (1970–2000) and Future Trends (2061–2080)

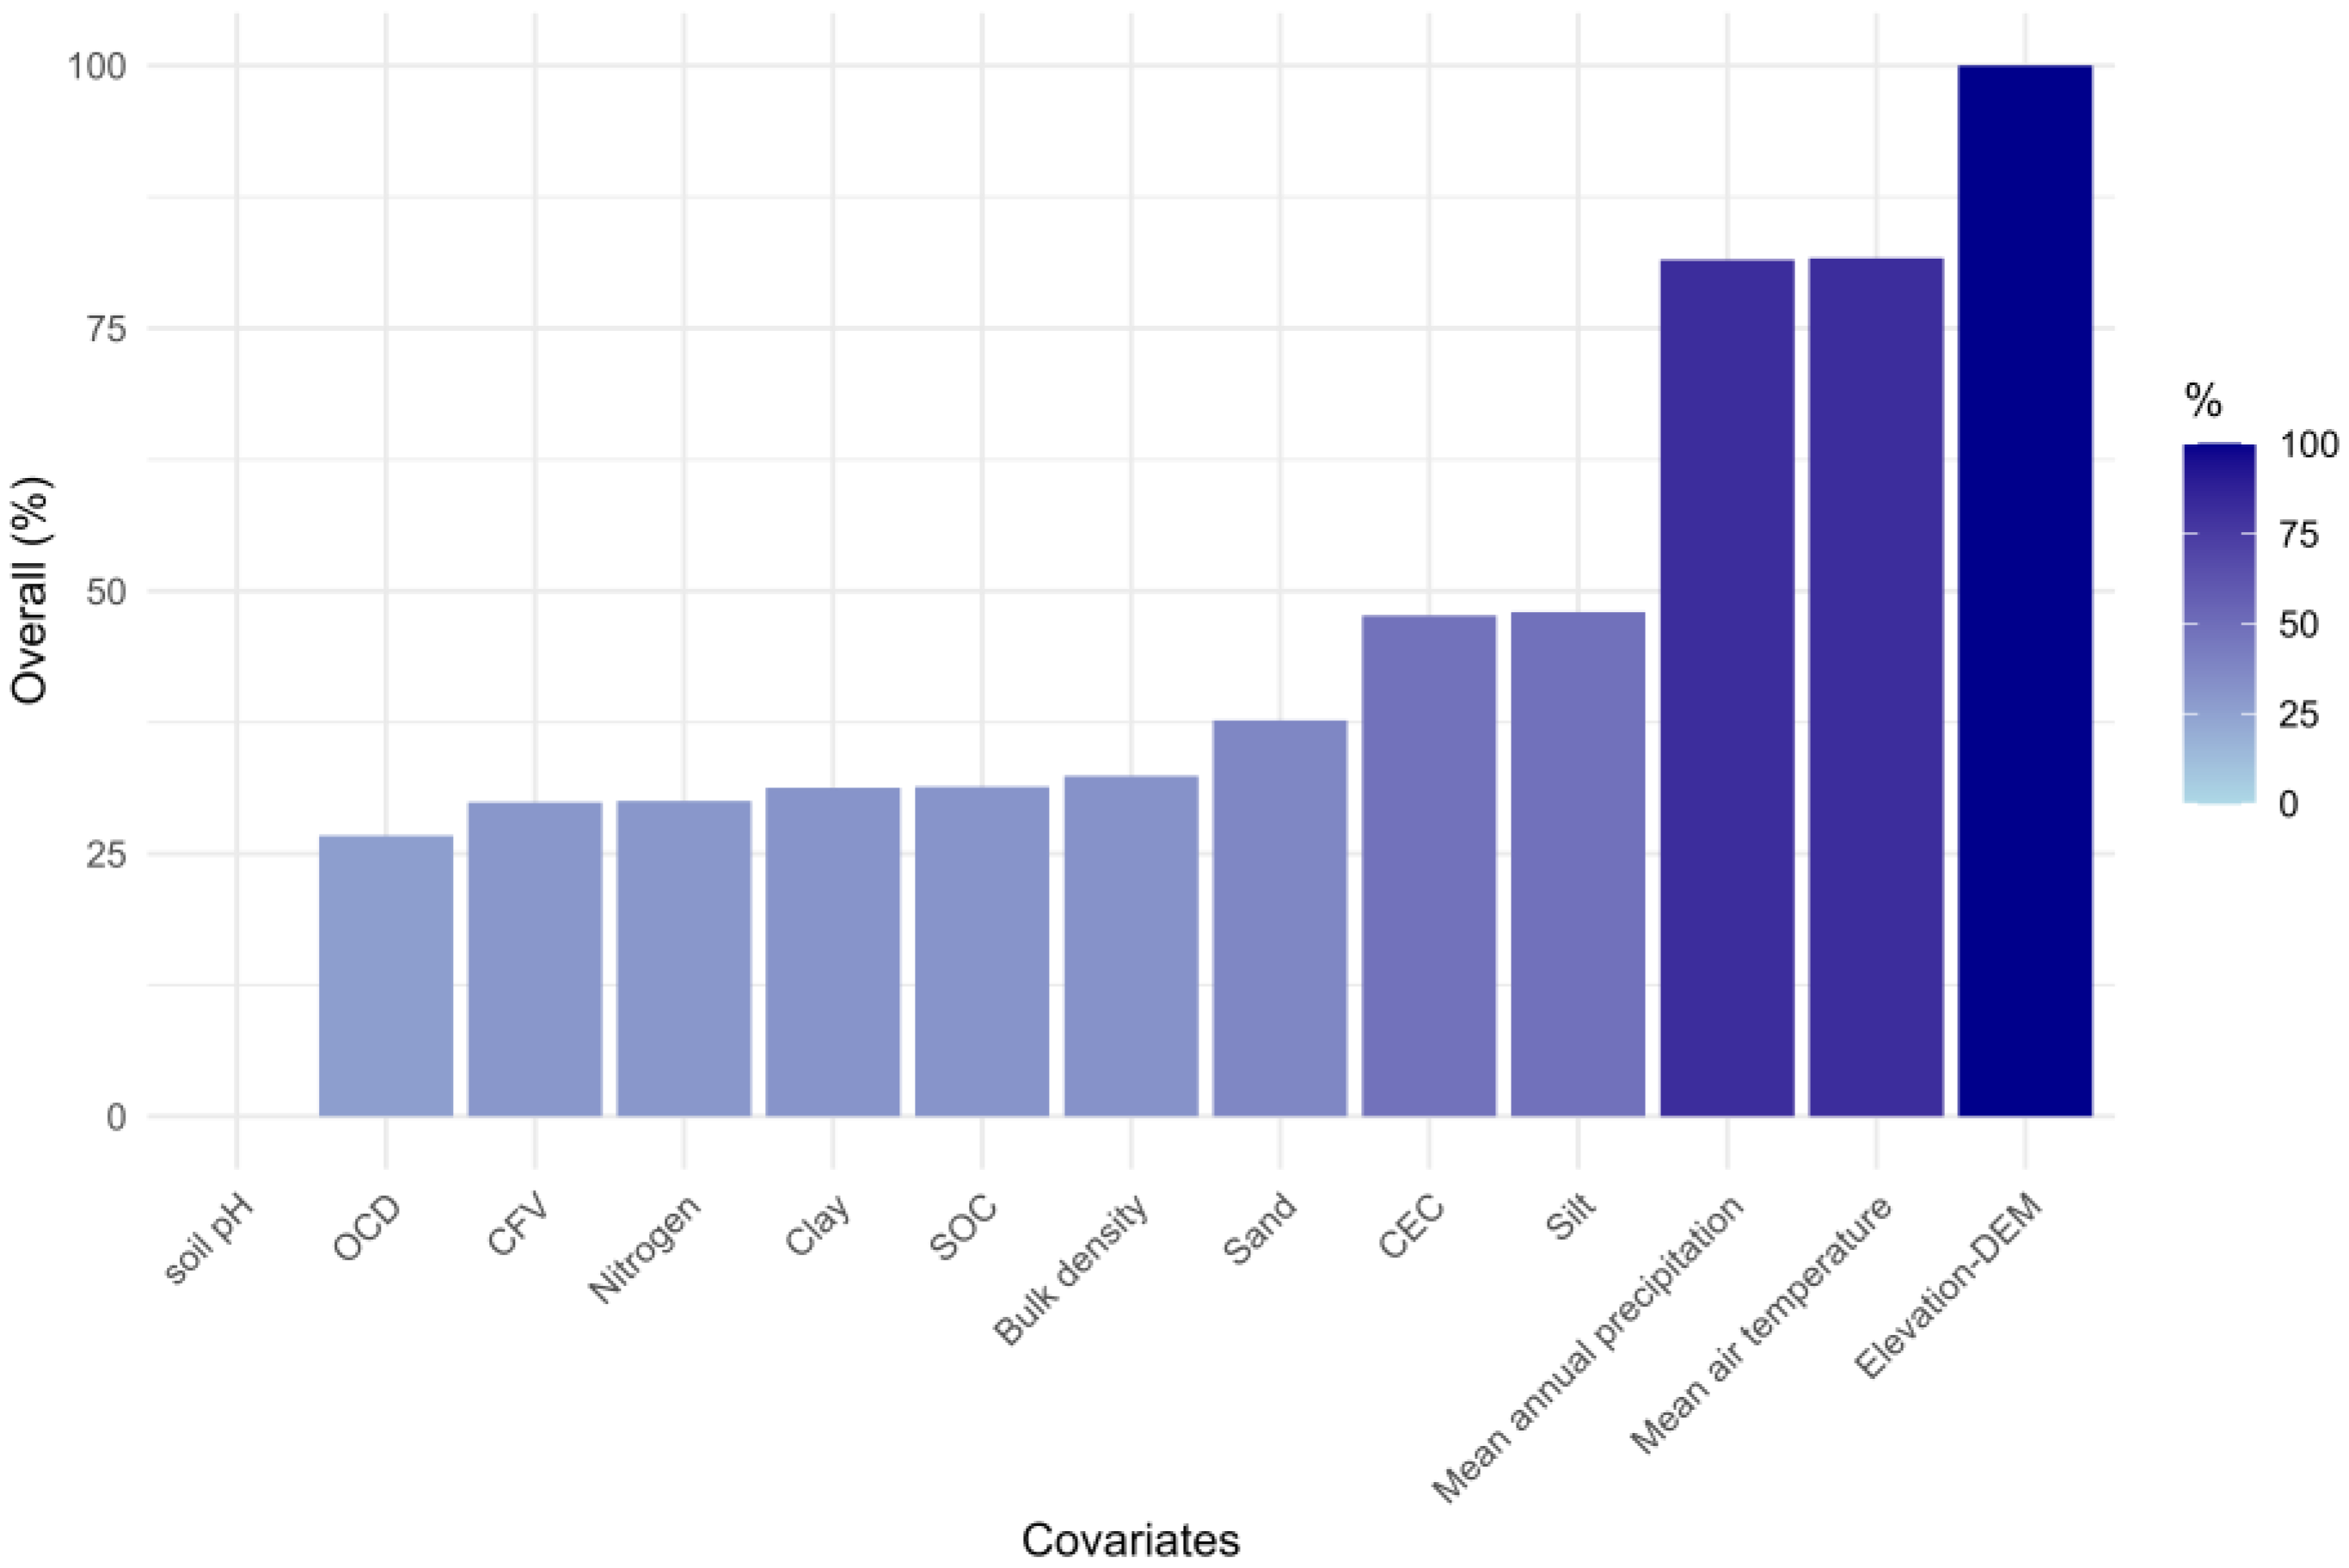
The LULC map generated using the RF algorithm, trained with climatic, soil, and topographic covariates, obtained reasonable metrics. The overall accuracy was 60%, with 65% disagreement in allocation and 15% disagreement in quantity. Specific metrics also confirm the challenges in mapping the environmental suitability of LULC, with producer accuracy ranging from 39.68% to 75.47% and user accuracy ranging from 46,15% to 81.48% (Table 3). Among the selected covariates, the three most important were elevation (100%), mean annual air temperature (82%), and mean annual precipitation (81%) (Figure 5).
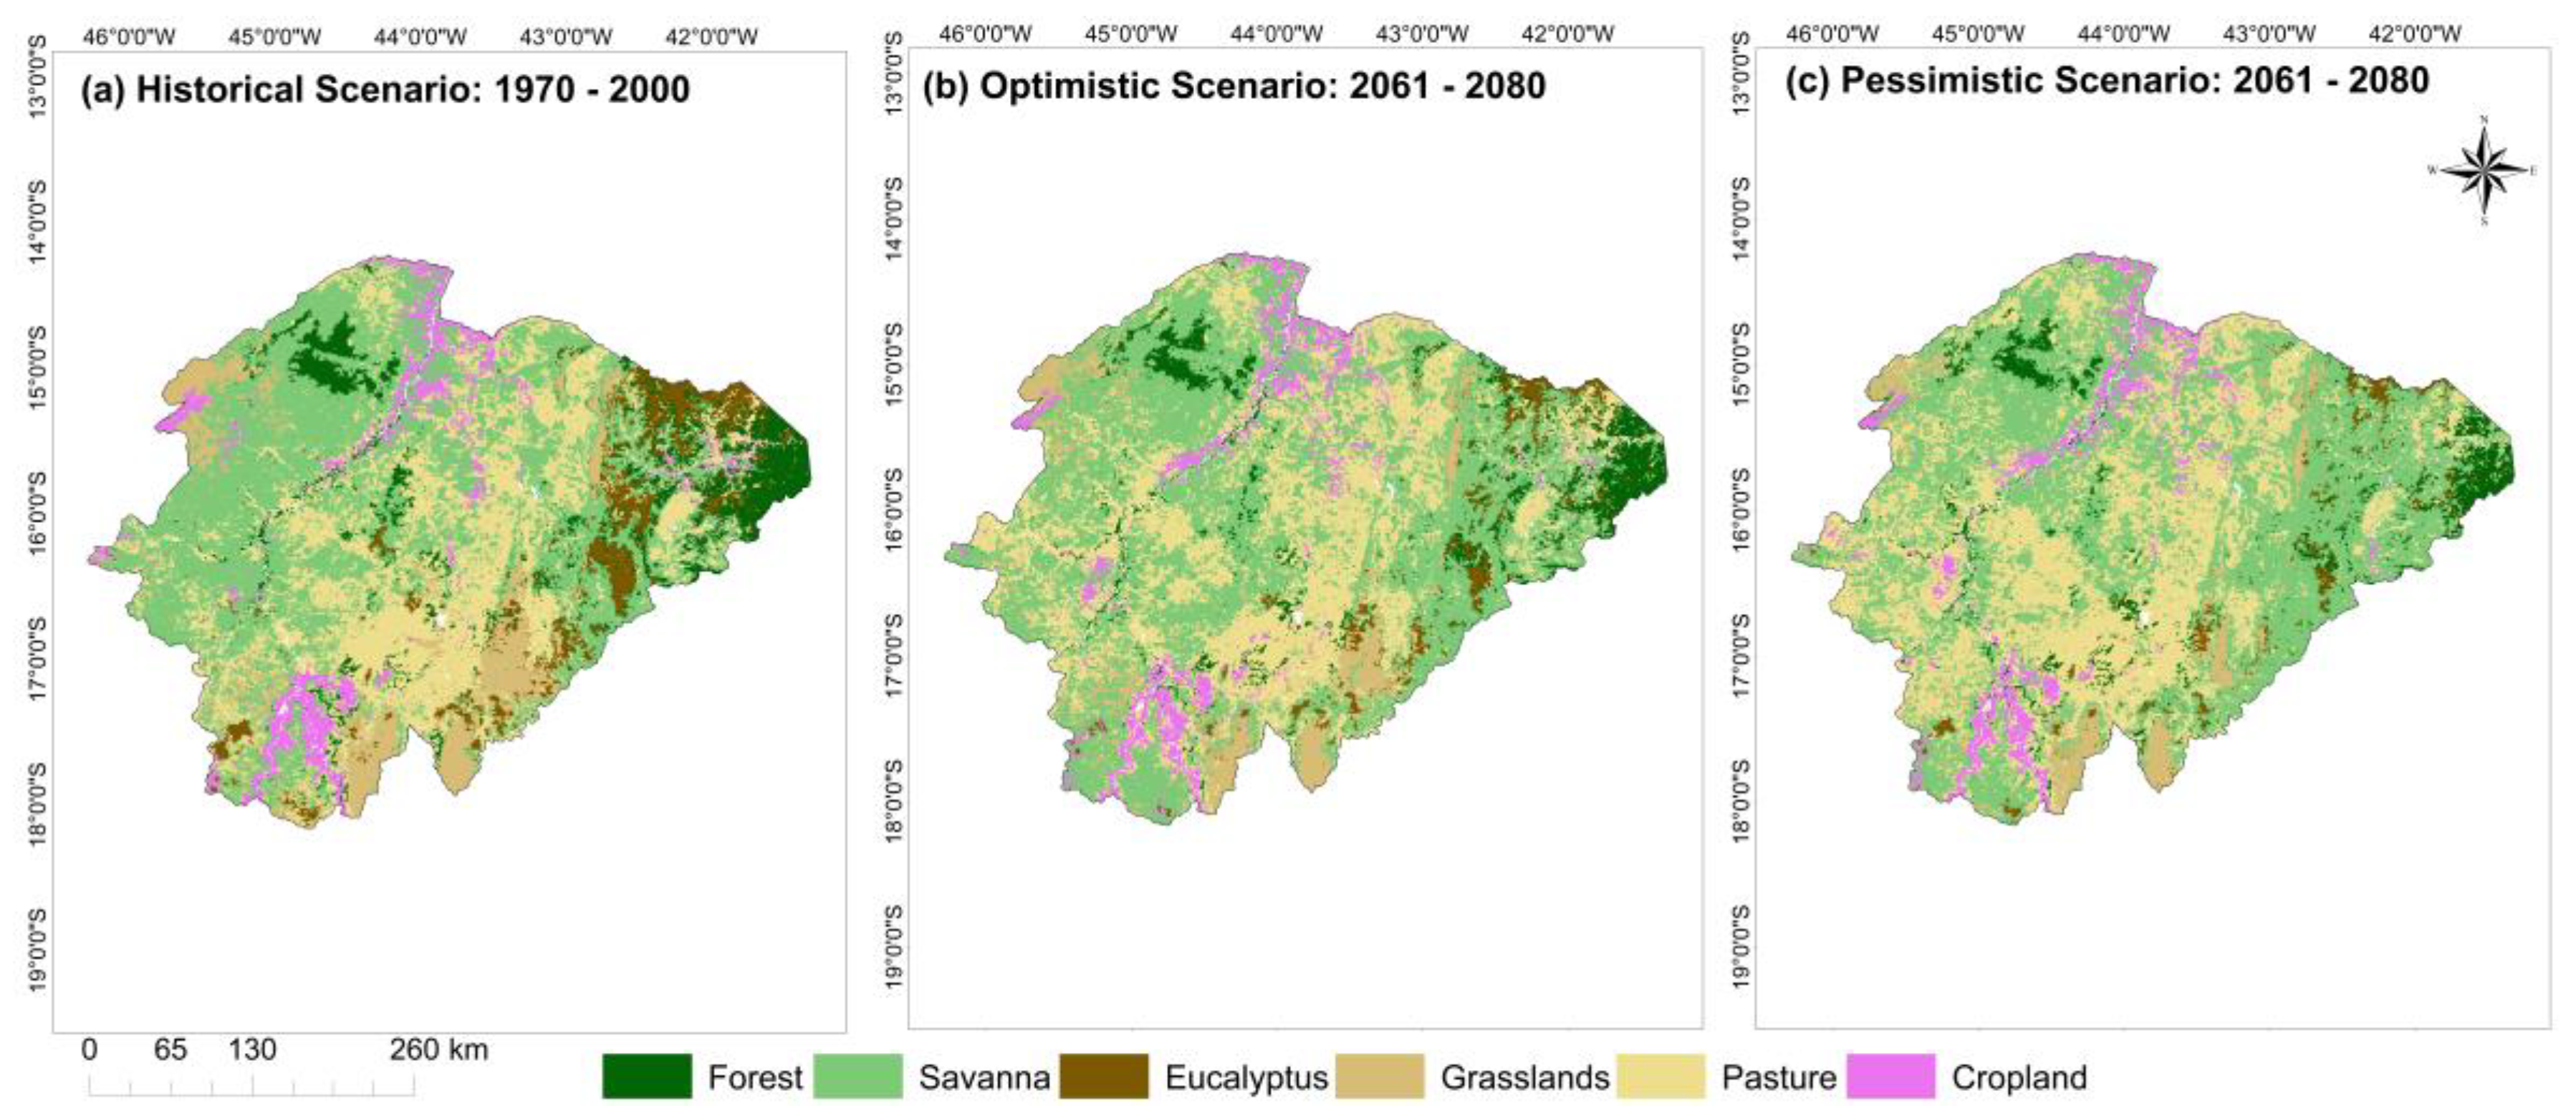
Climate change will substantially transform all LULC classes in the study area (Figure 6, Figure 7 and Figure 8 and Table 4). These spatial changes coincide with the mean air temperature increase and annual precipitation level decline under future IPCC projections (Figure 7). For example, croplands were suitable for use over an area of 7800 km2 in the historical scenario (1970–2000), with an average temperature of 23.43 °C and precipitation of 978.68 mm yr−1. However, with an increase of up to 2.9 °C in mean air temperature and a reduction of up to 97 mm yr−1 in annual precipitation, croplands are expected to experience a decline of up to 8% in their suitability in future scenarios (2061–2080).
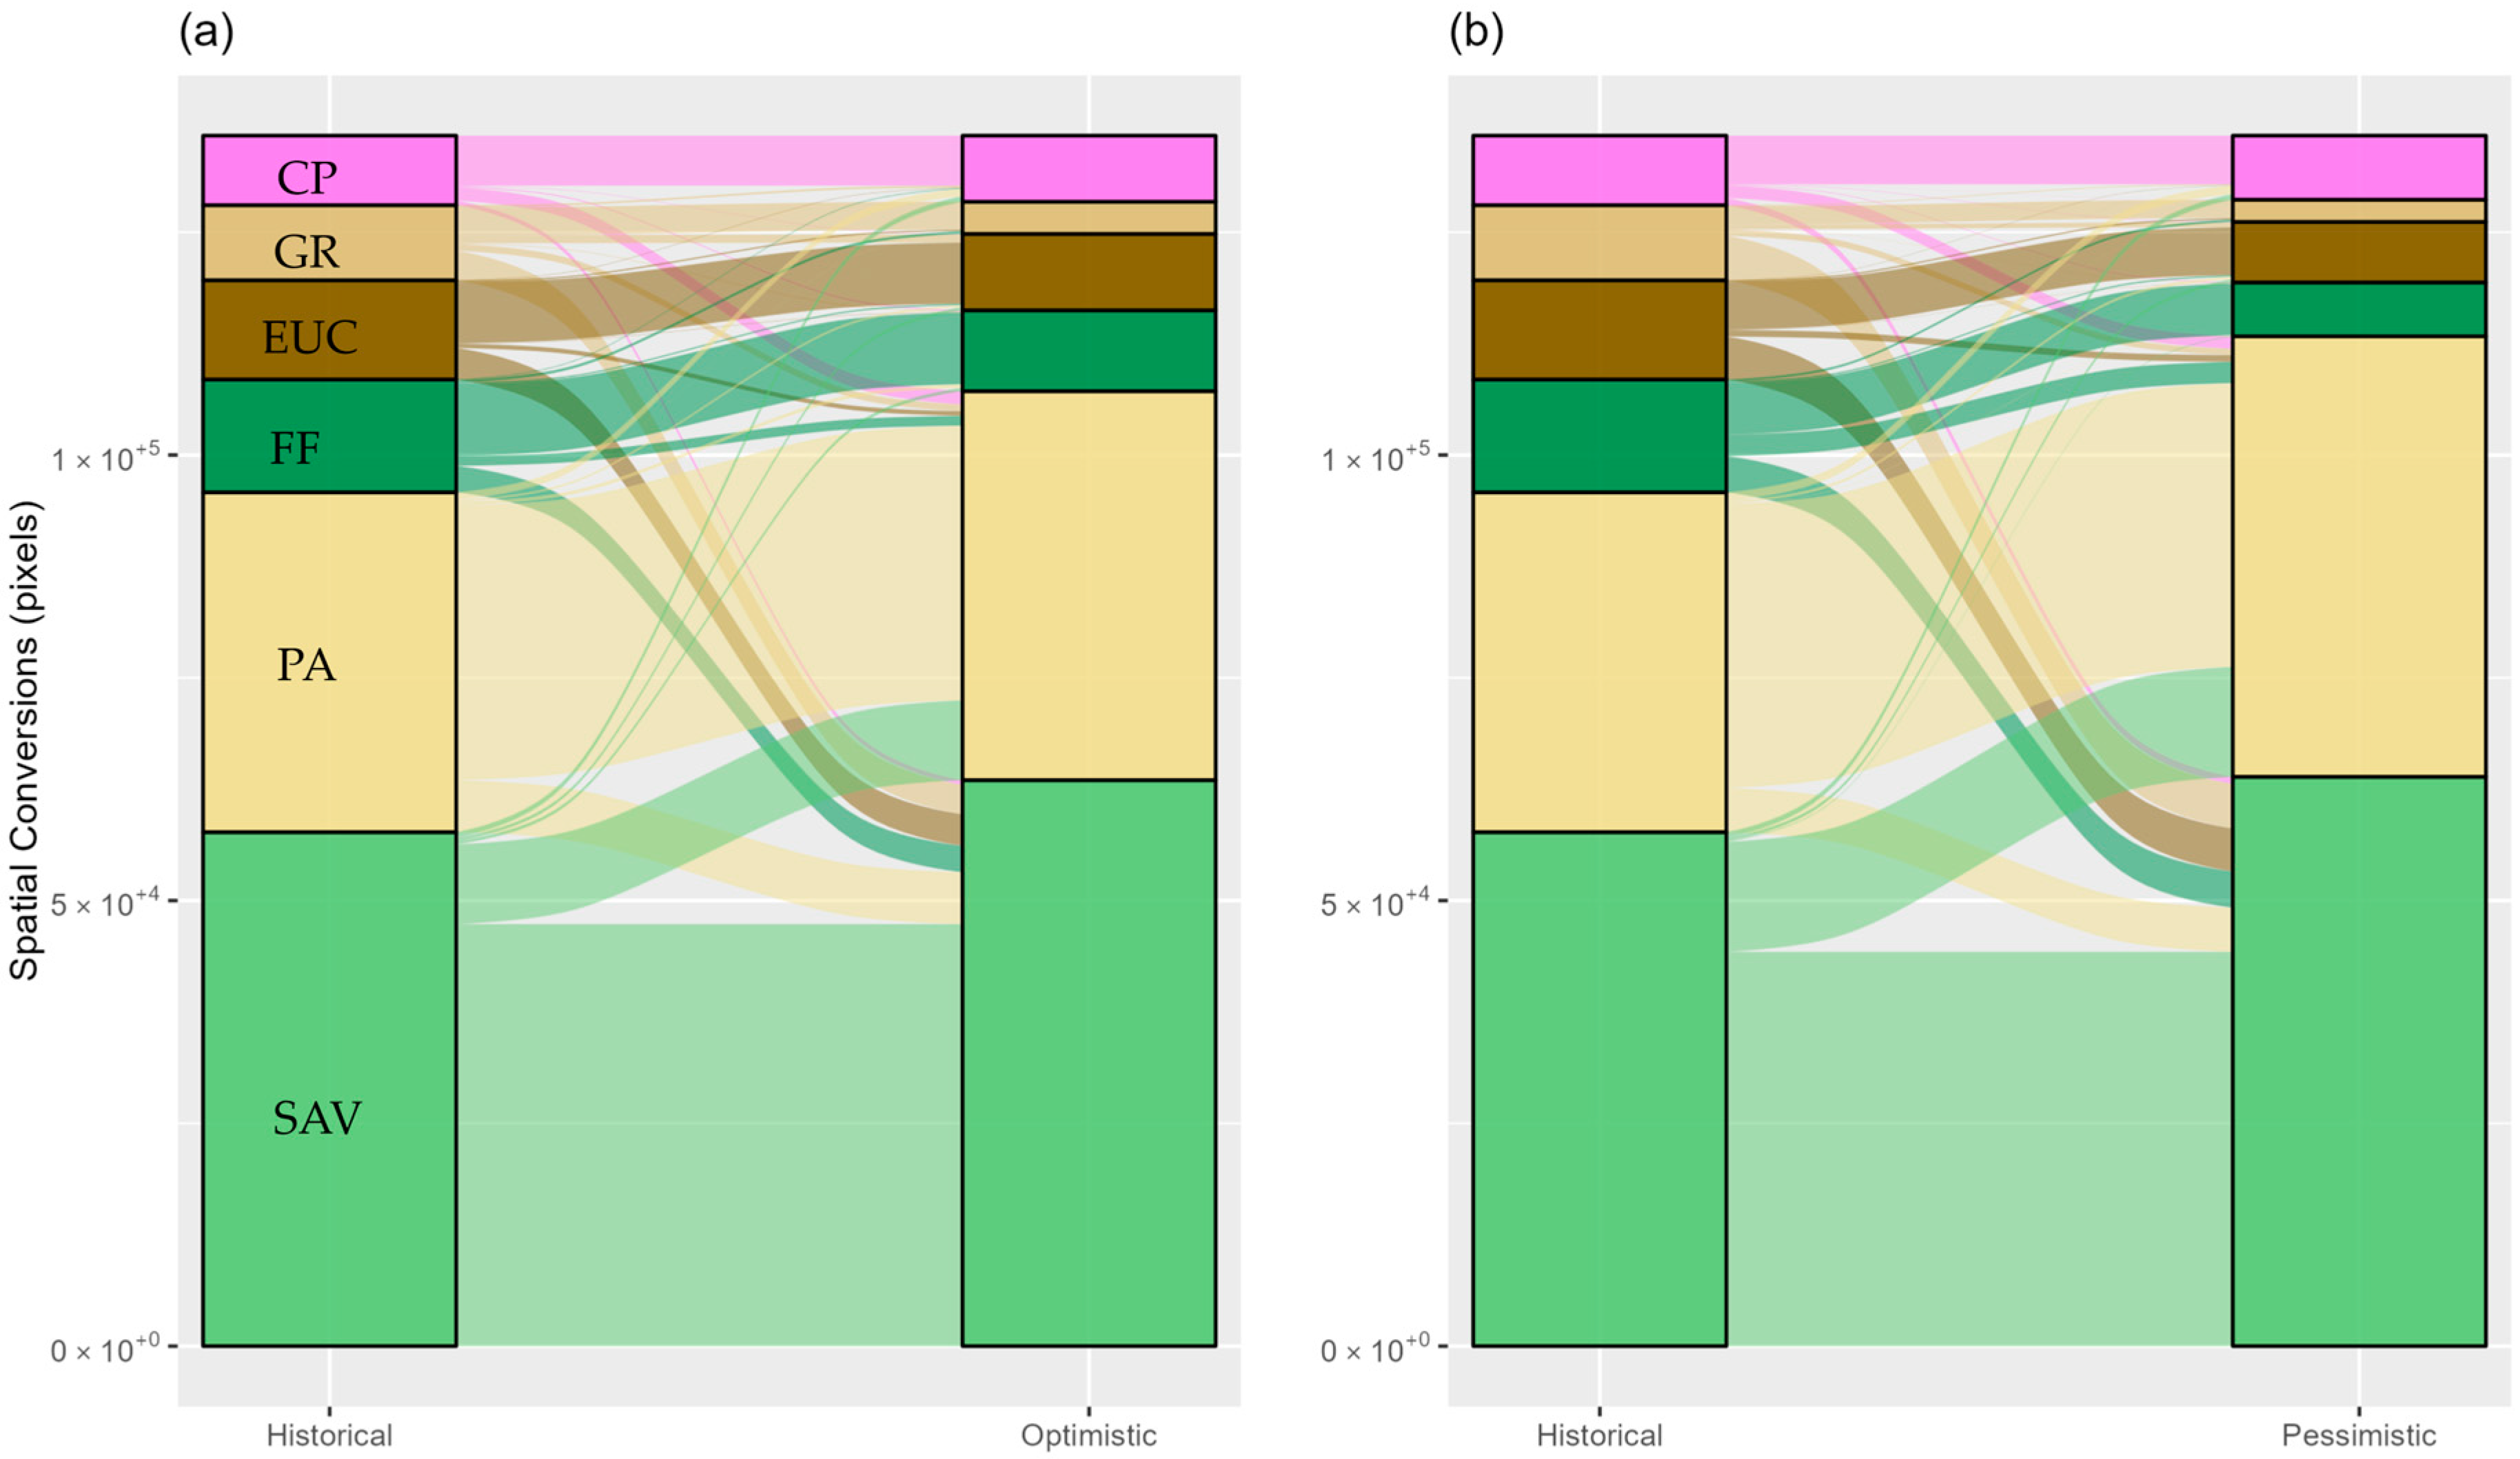
In contrast, pasture suitability is projected to increase in the coming decades (Figure 6 and Table 4). In the historical scenario, the area suitable for pasture cultivation occupied 25% of the study region (38,130 km2), showing adaptability in the western portion of the North of Minas Gerais, in areas with relatively high average temperatures (24.07 °C) and low precipitation levels (993.97 mm yr−1). In the future, pasture suitability is expected to increase by up to 29% (+11,291 km2), mainly due to increases between 1.43 °C and 2.96 °C in the historical thermal average and decreases of 28 mm yr−1 to 82.77 mm yr−1 in precipitation for the period 2061 to 2080. This gain in pasture suitability is expected to occur on lands previously occupied by savannas and forests (Figure 8).
Despite some pasture overlap, savannas are expected to gain considerable environmental suitability in the coming decades. This class had suitability in approximately 70% (57,681 km2) of the lands in the study area in the historical scenario, essentially in zones with an average air temperature of 22.79 °C and precipitation levels of 1010 mm yr−1. However, also, after an increase in thermal averages between 0.84 °C and 2.45 °C and a decline in precipitation to 138.01 mm yr−1 in the future scenarios, a 10% expansion of lands suitable for savannas is projected. This suggests that savannas are well adapted to future climate changes. The expansion of savannas’ suitability should occur in lands previously favorable for forests, grasslands, and eucalyptus plantations (Figure 8).
The land suitable for forests in the North of Minas Gerais was concentrated in the eastern sector of the region, with an area of 11,142 km2, under relatively low average temperatures (21.45 °C) and low precipitation rates (938 mm yr−1). However, areas suitable for maintaining forests are expected to lose space in future scenarios, with a decline of up to 39.02% in the most pessimistic scenario (RCP 8.5). This decline is conditioned by an increase of 2.99 °C in the historical thermal average and a decline of 130.90 mm yr−1 in precipitation. These trends reveal the vulnerability of forest formations to climate disturbances.
Grasslands also lose their environmental suitability in the North of Minas Gerais, mainly due to climate-favoring savannas in the coming decades. Grassland lands covered 12,659 km2 in the historical scenario, with a projected decline in the future of between 29% and 59% in the optimistic and pessimistic perspectives, respectively. This reduction will present distinct spatial patterns. A more pronounced decrease is expected to occur in the northwest portion, under flat surfaces and deep soils. On the other hand, stability is expected in the grasslands located on the eastern edge on rocky outcrops of the Espinhaço mountain chain. These patterns indicate that lithopedological factors are key to the reconfiguration of grasslands in the coming decades.
Eucalyptus plantations are expected to experience the greatest suitability losses among all LULC classes due to the expansion of more suitable climatic conditions for savannas. Eucalyptus suitability was 8424 km2 in the historical scenario, concentrated in the eastern portion, with a predominance of an average temperature of 20.72 °C and low rainfall rates. However, a reduction of 43% to 79% in land suitable for eucalyptus is expected. This abrupt decline coincides, again, with an increase of up to 2.89 °C in the historical average temperature and a reduction of up to 134.64 mm yr−1 in precipitation levels for the areas where these plantations have been concentrated in recent decades.

4. Discussion

4.1. Mapping Performance and the Covariate Influences

Our LULC map, using the RF classifier, was trained with climate, soil, and elevation data for the historical period (1970–2000) and achieved reasonable performance. RF was able to map about 60% of the suitability of the LULC classes (overall accuracy = 60%). The 65% allocation disagreement and 15% quantity disagreement and specific metrics revealed that the model also exhibited considerable confusion in class distinction. Our accuracy rates are comparable to previous studies at global and continental scales [25,26,78,79]. This accuracy is lower than that of traditional techniques based solely on remote sensing data, which typically generate highly accurate outputs based on spectral signatures [72]. In our methodological framework, we assessed the potential occurrence of specific LULC classes by considering climatic, soil, and topographic attributes. This added complexity to the modeling, which, in turn, decreased the performance of the classifier [24]. Another drawback is the spatial resolution of our maps, which was set at 1 km. This resolution complicates the differentiation of various LULC classes, making it more challenging to separate them effectively. However, a key advantage of this approach is its ability to extrapolate mapping procedures considering climate change, thereby serving as a valuable tool for guiding management and conservation strategies across different scenarios.
Elevation was the most influential covariate in the LULC classification, strongly impacting the suitability of croplands, pastures, and eucalyptus plantations. Croplands and pastures are mainly found in the lowlands of the western region, while eucalyptus plantations and grasslands are more prevalent in the eastern highlands [80]. Mean air temperature and annual precipitation also emerged as important covariates in our LULC classification, corroborating previous research that demonstrated the effectiveness of climate data in distinguishing various ecosystems [24,81,82]. These climatic factors influence water availability [83], leading to significant differences in seasonality, crop cycles, and phenological stages. In transitional regions such as North of Minas Gerais, where the Cerrado, Caatinga, and Atlantic Forest biomes coexist, the varying responses of ecosystems to climate fluctuations enhance the differentiation of LULC classes.
Pedological covariates (soil characteristics) had a relatively weak influence on the LULC classification compared to elevation and climate data. This limited influence can be partially attributed to the inherent functioning of the RF algorithm, which tends to prioritize covariates with a broader range of values during the selection process [84]. In our model, the soil data exhibited relatively low variation, resulting in lower importance in the ranking procedure [10]. However, it is important to note that even though these covariates were not ranked as highly influential, they likely play a significant role in discriminating LULC classes strongly associated with specific soil properties. For example, riparian forests along the São Francisco River and grasslands on the rocky outcrops of the Espinhaço mountain chain depend on unique soil characteristics that are not fully captured by the overall low variations observed in the dataset used in this study.

4.2. Impacts of Climate Change on LULC Classes

We expect a decrease in cropland suitability of up to 611 km2 in the study area. Our findings are consistent with regional and global modeling studies that have projected a decline in cropland suitability under future climate change scenarios [14,85,86,87,88,89,90,91,92]. This decline in agricultural productivity is likely driven by a combination of rising temperatures and decreasing precipitation, which increases evapotranspiration and leads to increased water stress, thereby limiting crop growth and productivity [52].
The reduction in areas suitable for croplands can affect the export chain on a national and international scale and, consequently, generate economic losses, since the North of Minas Gerais is an irrigated fruit-growing hub responsible for supplying food to national and international markets [21]. Therefore, there is an urgent need to develop climate change adaptation strategies to enhance the resilience of croplands. Integrated systems, which combine crops, livestock, and forests within the same environment, offer a promising approach to mitigating climate change [93]. The insertion of trees next to crops promotes air humidification through evapotranspiration, improves the rate of water infiltration into the soil, and reduces water stress. These benefits contribute to making croplands more resilient to climate change [94,95].
Pasture suitability in the North of Minas Gerais is projected to increase by up to 22,500 ha per year in the period 2061–2080. Historically, pastures in this region are adapted to high mean air temperatures and low precipitation [35]. Future IPCC scenarios (RCPs 2.6 and 8.5) indicate that these conditions will not only persist but also expand, creating more lands suitable for pasture in the coming decades. From an economic perspective, this trend may offer a favorable outlook by theoretically increasing cattle carrying capacity, boosting beef production [96]. However, these lands suitable for pasture will grow at the expense of areas previously occupied by savannas and forests. These native vegetations provide important ecosystem services, including carbon sequestration, air humidification, and water resource regulation [97,98,99]. Thus, their replacement by pastures may compromise these environmental benefits. In this context, public policies are needed to protect native forests from anthropogenic and climatic pressures. Previous studies highlight the effectiveness of environmental Protection Areas (PAs) and compliance with the Native Vegetation Protection Law (Federal Law 12727/2012) in reducing deforestation rates in the North of Minas Gerais in recent decades [100,101]. Therefore, expanding these instruments is a prominent measure for forest conservation.
Additionally, studies have indicated that high temperatures and low precipitation are drivers of pasture degradation in the North of Minas Gerais in the historical context [35]. As these conditions are projected to persist in future scenarios, the anticipated expansion of pastures may be accompanied by increased levels of degradation, as evidenced in other regions such as in parts of Africa [102], followed by land abandonment and desertification [103,104]. Therefore, decision-making toward more sustainable livestock farming is crucial. Previous studies suggest the adoption of rotation practices and the recovery of already degraded pastures, which increases the production of dry biomass for cattle herds, reducing the need for further deforestation [105].
While some areas suitable for savannas may be lost, this is offset by an anticipated gain of up to 6207 km2 in the period 2061–2080. This increased suitability of savannas is expected mainly due to the transition from forests, grasslands, and eucalyptus plantations. Savannas are well-adapted to seasonally dry climates with low rainfall because of several mechanisms to cope with water scarcity: the shedding of leaves during the dry season by deciduous and semi-deciduous species [106], which avoids excessive water consumption during periods of deficit [106,107]; a deep root system [108]; and sclerophyllous leaf traits that facilitate a conservative water-use strategy [109]. In contrast, forest ecosystems have significantly higher water demands [110,111]. Under future scenarios projecting reduced water availability, forest tree species are likely to experience physiological stress, leading to increased tree mortality [112]. This process could facilitate the predicted expansion of savannas over existing forests, a trend reported in other studies [23,25,107,113].
Up to 52% of the land currently suitable for grasslands may present favorable conditions for the expansion of savannas in the region. This transition is likely influenced by the high pedodiversity of the North of Minas Gerais. Mapping indicates that savannas are expected to gain greater suitability in the northwest region of the study area, characterized by landscapes with highly weathered and deep soils (Ferralsols). These soil properties favor the development of deep root systems in savannas, enabling more effective access to water, an essential factor in conditions of water restriction [106]. On the other hand, the eastern portion of the study area faces greater limitations for the re-establishment of savannas. This region is dominated by quartzite outcrops associated with the Espinhaço mountain chain [32,114], featuring a shallow substrate that likely hinders the growth of deep-rooted savanna formations. As a result, grasslands are expected to maintain their suitability in this area under future climate change scenarios.
These patches of grasslands, adapted to the unique lithological context of the Espinhaço mountain chain, are among the most biodiverse and endemic mountainous areas in the world [18]. Their stability in the face of climate change reinforces their importance for biodiversity and characterizes them as a climate refuge [115]. However, the region´s great mining potential poses a considerable threat to this rich biodiversity [116]. In this sense, conserving this grassland in the face of existing anthropogenic pressures and future climate changes is essential for maintaining ecological integrity.
The suitability for eucalyptus plantations is expected to decline by up to 79% under future climate change scenarios. Increasing temperatures and water restrictions are likely to lead to stomatal closure in eucalyptus trees, a physiological response that reduces water loss and limits carbon uptake [117,118]. This restriction can negatively affect the trees´ metabolic activity and their ability to defend against pathogens [117,118]. Previous studies have documented similar negative impacts of climate change on eucalyptus plantations in Brazil and other parts of South America [119,120,121]. In contrast, Elli et al. [122] evaluated the productivity (annual increase) of eucalyptus in Brazil and observed that plantations in a specific site in our study area will see an increase in the annual increase rate. This is because they will remain in the optimum temperature range, that is, 18 °C and 23 °C, tolerating changes in climate. However, even given the resilience of eucalyptus, our modeling showed a trend previously observed in the region: the advance of savannas over these plantations. In general, since eucalyptus is historically planted on lands previously covered by savannas in the North of Minas Gerais [80], when this crop is cut and the land is abandoned, the natural regeneration of savanna vegetation occurs [123,124].
If the projections come true, the potential loss of eucalyptus suitability could affect the region’s socioeconomic context. The state of Minas Gerais is one of the largest producers of eucalyptus in Brazil, playing a central role in supplying timber to the steel industry [22]. The reforestation sector has a significant influence on the socioeconomic indicators of the municipalities of Minas Gerais, including increases in per capita income and reductions in poverty rates [125]. Therefore, the decline in suitability for eucalyptus may lead to decreased employment opportunities and reduced incomes.

5. Conclusions

Our RF classification modeling indicates that the expected increase in mean air temperature and decrease in annual precipitation will drive significant changes in the environmental suitability of various LULC classes in the North of Minas Gerais for the period 2061–2080. We estimate that approximately 30% of the study area may undergo some LULC transition due to these climatic changes. From an economic perspective, these projections are concerning, as the suitability for croplands and eucalyptus plantations is expected to decline, altering regional socioeconomic dynamics. Furthermore, there is a high likelihood of increased pasture degradation, leading to severe losses in biodiversity and ecosystem services and potentially accelerating desertification—a process already observed in parts of the North of Minas Gerais.
From an ecological perspective, an optimistic scenario suggests that the abandonment of croplands, pastures, and eucalyptus plantations could create opportunities for natural regeneration and restoration programs, particularly benefiting savanna species adapted to drier conditions. The success of these natural regeneration or active restoration efforts depends on factors such as the presence of natural vegetation remnants in the landscape to provide a pool of species for recolonization. In a pessimistic scenario, land abandonment may lead to the expansion of deforestation frontiers to compensate for the loss of productive areas, exacerbating the degradation of the North of Minas Gerais.
Overall, the projected land use transitions, including the replacement of native vegetation types (e.g., forests by savannas), can have direct impacts on regional sustainability. These changes may affect agricultural productivity, livelihoods, and regional economic activities.
The generated LULC map and the projected changes in environmental suitability can serve as a basis for developing action plans to optimize agro-environmental monitoring in the region. Based on our results, we suggest the following strategies to planners and decision-makers: (i) expansion of protected areas of grasslands and forests, considering the lands with stable environmental suitability indicated in our mapping, ensuring crucial ecosystem services; (ii) promoting the natural regeneration of savannas, considering the predicted suitability for the coming decades; and (iii) introducing adaptation strategies for croplands and eucalyptus plantations in the face of climate change, such as the selection of more resilient species and improvement of water conservation techniques.
We encourage future research to address some limitations stated in this study, including historical and future deforestation patterns, since it is essential to determine the recolonization potential of native species, inserting drivers of deforestation such as distance from rivers and roads, and land use policies, in the LULC analyses.

Author Contributions

Conceptualization, L.A.P.d.S. and C.R.d.S.; methodology, L.A.P.d.S. and T.C.P.; software, L.A.P.d.S.; validation, L.A.P.d.S., E.E.S., and T.C.P.; formal analysis, all authors; writing—original draft preparation, L.A.P.d.S.; writing—review and editing, E.E.S., T.C.P., M.M.E.-S., É.L.B., R.F., C.R.d.S., C.M.P.d.S., and M.E.L.; visualization, L.A.P.d.S. All authors have read and agreed to the published version of the manuscript.

Funding

This study was funded by the Graduate Program in Geography of the Federal University of Uberlândia (PPGEO/UFU), Office of the Vice-Rector for Research and Graduate Studies/UFU, and by the Minas Gerais Research Foundation (FAPEMIG, project #APQ-00427-24). It was also partially funded by the São Paulo Research Foundation (FAPESP) in the form of a doctoral scholarship for the third author (grant number 2024/13150-5).

Data Availability Statement

The data presented in this study are available upon request to the corresponding author.

Conflicts of Interest

Authors Edson Eyji Sano and Édson Luis Bolfe were employed by the company Brazilian Agricultural Research Corporation, and author Roberto Filgueiras was employed by the company 4intelligence, 4I. The remaining authors declare that the research was conducted in the absence of any commercial or financial relationships that could be construed as a potential conflict of interest.

References

  1. Burrell, A.L.; Evans, J.P.; De Kauwe, M.G. Anthropogenic Climate Change Has Driven over 5 Million Km2 of Drylands Towards Desertification. Nat. Commun. 2020, 11, 3853. [Google Scholar] [CrossRef] [PubMed]
  2. Huang, J.; Yu, H.; Guan, X.; Wang, G.; Guo, R. Accelerated Dryland Expansion under Climate Change. Nat. Clim. Change 2016, 6, 166–171. [Google Scholar] [CrossRef]
  3. Huang, J.; Li, Y.; Fu, C.; Chen, F.; Fu, Q.; Dai, A.; Shinoda, M.; Ma, Z.; Guo, W.; Li, Z.; et al. Dryland Climate Change: Recent Progress and Challenges. Rev. Geophys. 2017, 55, 719–778. [Google Scholar] [CrossRef]
  4. Dale, V.H. The Relationship Between Land-Use Change and Climate Change. Ecol. Appl. 1997, 7, 753–769. [Google Scholar] [CrossRef]
  5. Malczewski, J. GIS-Based Land-Use Suitability Analysis: A Critical Overview. Prog. Plan. 2004, 62, 3–65. [Google Scholar] [CrossRef]
  6. Fernandes, M.F.; Cardoso, D.; de Queiroz, L.P. An Updated Plant Checklist of the Brazilian Caatinga Seasonally Dry Forests and Woodlands Reveals High Species Richness and Endemism. J. Arid Environ. 2020, 174, 104079. [Google Scholar] [CrossRef]
  7. Guillory, W.X.; de Medeiros Magalhães, F.; Coelho, F.E.A.; Bonatelli, I.A.S.; Palma-Silva, C.; Moraes, E.M.; Garda, A.A.; Burbrink, F.T.; Gehara, M. Geoclimatic Drivers of Diversification in the Largest Arid and Semi-Arid Environment of the Neotropics: Perspectives from Phylogeography. Mol. Ecol. 2024, 33, e17431. [Google Scholar] [CrossRef]
  8. Marengo, J.A.; Cunha, A.P.M.A.; Nobre, C.A.; Ribeiro Neto, G.G.; Magalhaes, A.R.; Torres, R.R.; Sampaio, G.; Alexandre, F.; Alves, L.M.; Cuartas, L.A.; et al. Assessing Drought in the Drylands of Northeast Brazil under Regional Warming Exceeding 4 °C. Nat. Hazards 2020, 103, 2589–2611. [Google Scholar] [CrossRef]
  9. Tomasella, J.; de Amaral Cunha, A.P.; Marengo, J.A. Nota Técnica: Elaboração Dos Mapas de Índice de Aridez e Precipitação Total Acumulada Para o Brasil. Brasília Minist. Ciênc. Tecnol. E Inov. 2023. Available online: https://www.gov.br/cemaden/pt-br/assuntos/noticias-cemaden/estudo-do-cemaden-e-do-inpe-identifica-pela-primeira-vez-a-ocorrencia-de-uma-regiao-arida-no-pais/nota-tecnica_aridas.pdf (accessed on 4 November 2024).
  10. de Castro Oliveira, G.; Arruda, D.M.; Fernandes Filho, E.I.; Veloso, G.V.; Francelino, M.R.; Schaefer, C.E.G.R. Soil Predictors Are Crucial for Modelling Vegetation Distribution and Its Responses to Climate Change. Sci. Total Environ. 2021, 780, 146680. [Google Scholar] [CrossRef]
  11. Maksic, J.; Venancio, I.M.; Shimizu, M.H.; Chiessi, C.M.; Piacsek, P.; Sampaio, G.; Cruz, F.W.; Alexandre, F.F. Brazilian Biomes Distribution: Past and Future. Palaeogeogr. Palaeoclimatol. Palaeoecol. 2022, 585, 110717. [Google Scholar] [CrossRef]
  12. Oliveira, A.C.P.; Nunes, A.; Oliveira, M.A.; Rodrigues, R.G.; Branquinho, C. How Do Taxonomic and Functional Diversity Metrics Change Along an Aridity Gradient in a Tropical Dry Forest? Front. Plant Sci. 2022, 13, 923219. [Google Scholar] [CrossRef] [PubMed]
  13. Burney, J.; Cesano, D.; Russell, J.; La Rovere, E.L.; Corral, T.; Coelho, N.S.; Santos, L. Climate Change Adaptation Strategies for Smallholder Farmers in the Brazilian Sertão. Clim. Change 2014, 126, 45–59. [Google Scholar] [CrossRef]
  14. Bigolin, T.; Talamini, E. Impacts of Climate Change Scenarios on the Corn and Soybean Double-Cropping System in Brazil. Climate 2024, 12, 42. [Google Scholar] [CrossRef]
  15. Noble, I.R. A Model of the Responses of Ecotones to Climate Change. Ecol. Appl. 1993, 3, 396–403. [Google Scholar] [CrossRef]
  16. Smith, A.J.; Goetz, E.M. Climate Change Drives Increased Directional Movement of Landscape Ecotones. Landsc. Ecol. 2021, 36, 3105–3116. [Google Scholar] [CrossRef]
  17. Arruda, D.M.; Ferreira-Júnior, W.G.; Duque-Brasil, R.; Schaefer, C.E.R. Phytogeographical Patterns of Dry Forests Sensu Stricto in Northern Minas Gerais State, Brazil. An. Acad. Bras. Ciênc. 2013, 85, 623–634. [Google Scholar] [CrossRef]
  18. Echternacht, L.; Trovó, M.; Oliveira, C.T.; Pirani, J.R. Areas of Endemism in the Espinhaço Range in Minas Gerais, Brazil. Flora-Morphol. Distrib. Funct. Ecol. Plants 2011, 206, 782–791. [Google Scholar] [CrossRef]
  19. Souza, A.P.; Corrêa, G.R.; Arruda, D.M.; Fonseca, R.S.; Candido, H.G.; Rosa, G.P.; Koch, V.A.; Rodrigues, A.P.D.; Xavier, M.V.B. Edaphic Gradient Shapes the Structure and Composition of Vegetation in the Forest-Cerrado Ecotone in North of Minas Gerais, Brazil. Braz. J. Bot. 2024. [Google Scholar] [CrossRef]
  20. Myers, N.; Mittermeier, R.A.; Mittermeier, C.G.; Da Fonseca, G.A.; Kent, J. Biodiversity Hotspots for Conservation Priorities. Nature 2000, 403, 853–858. [Google Scholar] [CrossRef]
  21. Oliveira, I.M.; Pereira, L.A.G. Geografia das Exportações de Frutas no Projeto Jaíba–MG: Transportes e interconexões com os mercados globais. Cad. Geogr. 2020, 30, 34–64. [Google Scholar] [CrossRef]
  22. Leite, M.E.; Almeida, J.W.L.; Silva, R.F. da Análise espaço-temporal do eucalipto no Norte de Minas Gerais nos anos de 1986, 1996 e 2010. GeoTextos 2012, 8, 59–74. [Google Scholar] [CrossRef]
  23. Arruda, D.M.; Schaefer, C.E.G.R.; Fonseca, R.S.; Fernandes-Filho, E.I.; Veloso, G.V.; Gomes, L.C.; Oliveira, F.S.; Corrêa, G.R.; Espírito-Santo, M.M.; Oliveira, G.C.; et al. Amazonian Vegetation Types and Indigenous Lands Threatened by Upcoming Climate Change: Forecast Impact for Brazilian Biomes. Austral Ecol. 2024, 49, e13369. [Google Scholar] [CrossRef]
  24. Zeferino, L.B.; de Souza, L.F.T.; do Amaral, C.H.; Fernandes Filho, E.I.; de Oliveira, T.S. Does Environmental Data Increase the Accuracy of Land Use and Land Cover Classification? Int. J. Appl. Earth Obs. Geoinf. 2020, 91, 102128. [Google Scholar] [CrossRef]
  25. Bonannella, C.; Hengl, T.; Parente, L.; Bruin, S. de Biomes of the World under Climate Change Scenarios: Increasing Aridity and Higher Temperatures Lead to Significant Shifts in Natural Vegetation. PeerJ 2023, 11, e15593. [Google Scholar] [CrossRef]
  26. Hengl, T.; Walsh, M.G.; Sanderman, J.; Wheeler, I.; Harrison, S.P.; Prentice, I.C. Global Mapping of Potential Natural Vegetation: An Assessment of Machine Learning Algorithms for Estimating Land Potential. PeerJ 2018, 6, e5457. [Google Scholar] [CrossRef]
  27. Breiman, L. Random Forests. Mach. Learn. 2001, 45, 5–32. [Google Scholar] [CrossRef]
  28. Liaw, A.; Wiener, M. Classification and Regression by randomForest. R News 2002, 2, 18–22. [Google Scholar]
  29. IBGE. Censo Demográfico; IBGE: Rio de Janeiro, Brasil, 2010. [Google Scholar]
  30. Menezes, J.A.; Madureira, A.P.; dos Santos, R.B.; de Brito Duval, I.; Regoto, P.; Margonari, C.; de Lima Barata, M.M.; Confalonieri, U. Analyzing Spatial Patterns of Health Vulnerability to Drought in the Brazilian Semiarid Region. Int. J. Environ. Res. Public. Health 2021, 18, 6262. [Google Scholar] [CrossRef]
  31. Dupin, M.G.V.; Espírito-Santo, M.M.; Leite, M.E.; Silva, J.O.; Rocha, A.M.; Barbosa, R.S.; Anaya, F.C. Land Use Policies and Deforestation in Brazilian Tropical Dry Forests between 2000 and 2015. Environ. Res. Lett. 2018, 13, 035008. [Google Scholar] [CrossRef]
  32. Souza, C.M.P.; Almeida, M.I.S. Distribuição Geográfica Dos Solos e Relação Com Paisagens Do Norte de Minas Gerais. In A Geografia do Norte de Minas Gerais: Reflexões e Proposições; Entremares: São Paulo, Brasil, 2022; Volume 1, pp. 231–241. ISBN 978-65-87702-03-2. [Google Scholar]
  33. Alvares, C.A.; Stape, J.L.; Sentelhas, P.C.; de Moraes Gonçalves, J.L.; Sparovek, G. Köppen’s Climate Classification Map for Brazil. Meteorol. Z. 2013, 22, 711–728. [Google Scholar] [CrossRef] [PubMed]
  34. Espírito-Santo, M.M.; Sevilha, A.C.; Anaya, F.C.; Barbosa, R.; Fernandes, G.W.; Sanchez-Azofeifa, G.A.; Scariot, A.; de Noronha, S.E.; Sampaio, C.A. Sustainability of Tropical Dry Forests: Two Case Studies in Southeastern and Central Brazil. For. Ecol. Manag. 2009, 258, 922–930. [Google Scholar] [CrossRef]
  35. Silva, L.A.P.; Sena-Souza, J.P.; Souza, C.M.P.; Silva, C.R.; Bolfe, É.L.; Chagas-Reis, C.C.; Leite, M.E. Drivers of Degradation of Pastures in the Cerrado North of Minas Gerais-BR. RAEGA-O Espaço Geográfico Em Análise 2023, 57, 66–80. [Google Scholar] [CrossRef]
  36. Silva, L.A.P.; Bolfe, É.L.; Ferreira, M.E.; Veloso, G.A.; de Moura Laurentino, C.M.; Da Silva, C.R. Modelling the Pastureland Productivity in Areas of Savanna in Northern Minas Gerais. Caminhos Geogr. 2022, 23, 124–134. [Google Scholar] [CrossRef]
  37. Hijmans, R.J.; Cameron, S.E.; Parra, J.L.; Jones, P.G.; Jarvis, A. Very High Resolution Interpolated Climate Surfaces for Global Land Areas. Int. J. Climatol. J. R. Meteorol. Soc. 2005, 25, 1965–1978. [Google Scholar] [CrossRef]
  38. Fick, S.E.; Hijmans, R.J. WorldClim 2: New 1-Km Spatial Resolution Climate Surfaces for Global Land Areas. Int. J. Climatol. 2017, 37, 4302–4315. [Google Scholar] [CrossRef]
  39. IPCC. Climate Change 2014: Synthesis Report. In Contribution of Working Groups I, II and III to the Fifth Assessment Report of the Intergovernmental Panel on Climate Change; Pachauri, R.K., Meyer, L.A., Eds.; IPCC: Geneva, Switzerland, 2014. [Google Scholar]
  40. Zelinka, M.D.; Myers, T.A.; McCoy, D.T.; Po-Chedley, S.; Caldwell, P.M.; Ceppi, P.; Klein, S.A.; Taylor, K.E. Causes of Higher Climate Sensitivity in CMIP6 Models. Geophys. Res. Lett. 2020, 47, e2019GL085782. [Google Scholar] [CrossRef]
  41. Hofer, S.; Lang, C.; Amory, C.; Kittel, C.; Delhasse, A.; Tedstone, A.; Fettweis, X. Greater Greenland Ice Sheet Contribution to Global Sea Level Rise in CMIP6. Nat. Commun. 2020, 11, 6289. [Google Scholar] [CrossRef]
  42. Hausfather, Z.; Marvel, K.; Schmidt, G.A.; Nielsen-Gammon, J.W.; Zelinka, M. Climate Simulations: Recognize the ‘Hot Model’ Problem. Nature 2022, 605, 26–29. [Google Scholar] [CrossRef]
  43. Voosen, P. ‘Hot’ Climate Models Exaggerate Earth Impacts. Science 2022, 376, 685. [Google Scholar] [CrossRef]
  44. Zhao, Q.; Zhu, Z.; Zeng, H.; Zhao, W.; Myneni, R.B. Future Greening of the Earth May Not Be as Large as Previously Predicted. Agric. For. Meteorol. 2020, 292–293, 108111. [Google Scholar] [CrossRef]
  45. Müller, C.; Franke, J.; Jägermeyr, J.; Ruane, A.C.; Elliott, J.; Moyer, E.; Heinke, J.; Falloon, P.D.; Folberth, C.; Francois, L.; et al. Exploring Uncertainties in Global Crop Yield Projections in a Large Ensemble of Crop Models and CMIP5 and CMIP6 Climate Scenarios. Environ. Res. Lett. 2021, 16, 034040. [Google Scholar] [CrossRef]
  46. Song, X.; Wang, D.-Y.; Li, F.; Zeng, X.-D. Evaluating the Performance of CMIP6 Earth System Models in Simulating Global Vegetation Structure and Distribution. Adv. Clim. Change Res. 2021, 12, 584–595. [Google Scholar] [CrossRef]
  47. Yuan, W.; Wu, S.-Y.; Hou, S.; Xu, Z.; Pang, H.; Lu, H. Projecting Future Vegetation Change for Northeast China Using CMIP6 Model. Remote Sens. 2021, 13, 3531. [Google Scholar] [CrossRef]
  48. Liu, J.; Lu, Y. How Well Do CMIP6 Models Simulate the Greening of the Tibetan Plateau? Remote Sens. 2022, 14, 4633. [Google Scholar] [CrossRef]
  49. Santos, J.F.; Schickhoff, U.; ul Hasson, S.; Böhner, J. Biogeophysical Effects of Land-Use and Land-Cover Changes in South Asia: An Analysis of CMIP6 Models. Land 2023, 12, 880. [Google Scholar] [CrossRef]
  50. Navarro, A.; Lee, G.; Martín, R.; Tapiador, F.J. Uncertainties in Measuring Precipitation Hinders Precise Evaluation of Loss of Diversity in Biomes and Ecotones. Npj Clim. Atmos. Sci. 2024, 7, 35. [Google Scholar] [CrossRef]
  51. Xiao, Y.; Chen, T.; Chen, X.; Yang, Y.; Wang, S.; Zhou, S. CMIP6 ESMs Overestimate Greening and the Photosynthesis Trends in Dryland East Asia. Sci. Total Environ. 2024, 937, 173432. [Google Scholar] [CrossRef]
  52. Zilli, M.; Scarabello, M.; Soterroni, A.C.; Valin, H.; Mosnier, A.; Leclère, D.; Havlík, P.; Kraxner, F.; Lopes, M.A.; Ramos, F.M. The Impact of Climate Change on Brazil’s Agriculture. Sci. Total Environ. 2020, 740, 139384. [Google Scholar] [CrossRef]
  53. Allen, B.J.; Hill, D.J.; Burke, A.M.; Clark, M.; Marchant, R.; Stringer, L.C.; Williams, D.R.; Lyon, C. Projected Future Climatic Forcing on the Global Distribution of Vegetation Types. Philos. Trans. R. Soc. B Biol. Sci. 2024, 379, 20230011. [Google Scholar] [CrossRef]
  54. Tovar, C.; Carril, A.F.; Gutiérrez, A.G.; Ahrends, A.; Fita, L.; Zaninelli, P.; Flombaum, P.; Abarzúa, A.M.; Alarcón, D.; Aschero, V.; et al. Understanding Climate Change Impacts on Biome and Plant Distributions in the Andes: Challenges and Opportunities. J. Biogeogr. 2022, 49, 1420–1442. [Google Scholar] [CrossRef] [PubMed]
  55. Leão, T.C.C.; Reinhardt, J.R.; Nic Lughadha, E.; Reich, P.B. Projected Impacts of Climate and Land Use Changes on the Habitat of Atlantic Forest Plants in Brazil. Glob. Ecol. Biogeogr. 2021, 30, 2016–2028. [Google Scholar] [CrossRef]
  56. Costa, T.R.; Da Silva, L.A.; De Moura, C.C.; De Souto Azevedo, C.H.; Bueno, M.L.; Mucida, D.P.; Santos, T.; Gonzaga, A.P.D. Vulnerability of the Cerrado–Atlantic Forest Ecotone in the Espinhaço Range Biosphere Reserve to Climate Change. Theor. Appl. Climatol. 2023, 151, 1151–1170. [Google Scholar] [CrossRef]
  57. Gent, P.R.; Danabasoglu, G.; Donner, L.J.; Holland, M.M.; Hunke, E.C.; Jayne, S.R.; Lawrence, D.M.; Neale, R.B.; Rasch, P.J.; Vertenstein, M.; et al. The Community Climate System Model Version 4. J. Clim. 2011, 24, 4973–4991. [Google Scholar] [CrossRef]
  58. Gutjahr, O.; Putrasahan, D.; Lohmann, K.; Jungclaus, J.H.; von Storch, J.-S.; Brüggemann, N.; Haak, H.; Stössel, A. Max Planck Institute Earth System Model (MPI-ESM1.2) for the High-Resolution Model Intercomparison Project (HighResMIP). Geosci. Model Dev. 2019, 12, 3241–3281. [Google Scholar] [CrossRef]
  59. Watanabe, S.; Hajima, T.; Sudo, K.; Nagashima, T.; Takemura, T.; Okajima, H.; Nozawa, T.; Kawase, H.; Abe, M.; Yokohata, T.; et al. MIROC-ESM 2010: Model Description and Basic Results of CMIP5-20c3m Experiments. Geosci. Model Dev. 2011, 4, 845–872. [Google Scholar] [CrossRef]
  60. Anjos, L.J.S.; Barreiros de Souza, E.; Amaral, C.T.; Igawa, T.K.; Mann de Toledo, P. Future Projections for Terrestrial Biomes Indicate Widespread Warming and Moisture Reduction in Forests up to 2100 in South America. Glob. Ecol. Conserv. 2021, 25, e01441. [Google Scholar] [CrossRef]
  61. Beigaitė, R.; Tang, H.; Bryn, A.; Skarpaas, O.; Stordal, F.; Bjerke, J.W.; Žliobaitė, I. Identifying Climate Thresholds for Dominant Natural Vegetation Types at the Global Scale Using Machine Learning: Average Climate versus Extremes. Glob. Change Biol. 2022, 28, 3557–3579. [Google Scholar] [CrossRef]
  62. Poggio, L.; Sousa, L.M.D.; Batjes, N.H.; Heuvelink, G.B.M.; Kempen, B.; Ribeiro, E.; Rossiter, D. SoilGrids 2.0: Producing Soil Information for the Globe with Quantified Spatial Uncertainty. SOIL 2021, 7, 217–240. [Google Scholar] [CrossRef]
  63. de Castro Oliveira, G.; Francelino, M.R.; Arruda, D.M.; Fernandes-Filho, E.I.; Schaefer, C.E.G.R. Climate and Soils at the Brazilian Semiarid and the Forest-Caatinga Problem: New Insights and Implications for Conservation. Environ. Res. Lett. 2019, 14, 104007. [Google Scholar] [CrossRef]
  64. Silva, R.C.; Corrêa, G.R.; Arruda, D.M.; Veloso, G.V.; Fernandes-Filho, E.I.; Cândido, H.G.; de Oliveira, F.S.; Rosa, G.P.; Behling, H.; Schaefer, C.E.G.R. The Brazilian Semiarid Region over the Past 21,000 Years: Vegetation Dynamics in Small Pulses of Higher Humidity. Ecol. Inform. 2023, 77, 102259. [Google Scholar] [CrossRef]
  65. Van Zyl, J.J. The Shuttle Radar Topography Mission (SRTM): A Breakthrough in Remote Sensing of Topography. Acta Astronaut. 2001, 48, 559–565. [Google Scholar] [CrossRef]
  66. Burnett, B.N.; Meyer, G.A.; McFadden, L.D. Aspect-Related Microclimatic Influences on Slope Forms and Processes, Northeastern Arizona. J. Geophys. Res. Earth Surf. 2008, 113, 002, F03002. [Google Scholar] [CrossRef]
  67. Huang, Y.-M.; Liu, D.; An, S.-S. Effects of Slope Aspect on Soil Nitrogen and Microbial Properties in the Chinese Loess Region. CATENA 2015, 125, 135–145. [Google Scholar] [CrossRef]
  68. Casanova, M.; Messing, I.; Joel, A. Influence of Aspect and Slope Gradient on Hydraulic Conductivity Measured by Tension Infiltrometer. Hydrol. Process. 2000, 14, 155–164. [Google Scholar] [CrossRef]
  69. Souza, C.M., Jr.; Shimbo, J.Z.; Rosa, M.R.; Parente, L.L.; Alencar, A.A.; Rudorff, B.F.T.; Hasenack, H.; Matsumoto, M.; Ferreira, L.G.; Souza-Filho, P.W.M.; et al. Reconstructing Three Decades of Land Use and Land Cover Changes in Brazilian Biomes with Landsat Archive and Earth Engine. Remote Sens. 2020, 12, 2735. [Google Scholar] [CrossRef]
  70. Projeto Mapbiomas. Pontos de Validação. 2023. Available online: https://brasil.mapbiomas.org/pontos-de-validacao/ (accessed on 4 November 2024).
  71. QGIS Spatial Without Compromise · QGIS Web Site. Available online: https://www.qgis.org/ (accessed on 20 August 2024).
  72. Rodriguez-Galiano, V.F.; Ghimire, B.; Rogan, J.; Chica-Olmo, M.; Rigol-Sanchez, J.P. An Assessment of the Effectiveness of a Random Forest Classifier for Land-Cover Classification. ISPRS J. Photogramm. Remote Sens. 2012, 67, 93–104. [Google Scholar] [CrossRef]
  73. Probst, P.; Wright, M.N.; Boulesteix, A.-L. Hyperparameters and Tuning Strategies for Random Forest. WIREs Data Min. Knowl. Discov. 2019, 9, e1301. [Google Scholar] [CrossRef]
  74. Kuhn, M.; Wing, J.; Weston, S.; Williams, A.; Keefer, C.; Engelhardt, A.; Cooper, T.; Mayer, Z.; Kenkel, B.; Team, R.C. Package ‘Caret’. R J. 2020, 223, 7. [Google Scholar]
  75. Pontius, R.G.; Millones, M. Death to Kappa: Birth of Quantity Disagreement and Allocation Disagreement for Accuracy Assessment. Int. J. Remote Sens. 2011, 32, 4407–4429. [Google Scholar] [CrossRef]
  76. Team, R.C. R: A Language and Environment for Statistical Computing; R Foundation for Statistical Computing: Vienna, Austria, 2022; Available online: https://www.r-project.org/ (accessed on 4 November 2024).
  77. Hijmans, R.J.; Van Etten, J.; Cheng, J.; Mattiuzzi, M.; Sumner, M.; Greenberg, J.A.; Lamigueiro, O.P.; Bevan, A.; Racine, E.B.; Shortridge, A. Package ‘Raster’. R Package 2015, 734, 473. [Google Scholar]
  78. Vaca, R.A.; Golicher, D.J.; Cayuela, L. Using Climatically Based Random Forests to Downscale Coarse-Grained Potential Natural Vegetation Maps in Tropical Mexico. Appl. Veg. Sci. 2011, 14, 388–401. [Google Scholar] [CrossRef]
  79. Keane, R.E.; Holsinger, L.M.; Loehman, R. Bioclimatic Modeling of Potential Vegetation Types as an Alternative to Species Distribution Models for Projecting Plant Species Shifts Under Changing Climates. For. Ecol. Manag. 2020, 477, 118498. [Google Scholar] [CrossRef]
  80. Leite, M.E.; Souza, C.M.P.; Silva, L.A.P. Dinâmica de Uso Da Terra No Norte de Minas—Sudeste Do Brasil. In A Geografia do Norte de Minas Gerais: Reflexões e Proposições; Entremares: São Paulo, Brasil, 2022; pp. 165–177. ISBN 978-65-87702-03-2. [Google Scholar]
  81. Hurskainen, P.; Adhikari, H.; Siljander, M.; Pellikka, P.K.E.; Hemp, A. Auxiliary Datasets Improve Accuracy of Object-Based Land Use/Land Cover Classification in Heterogeneous Savanna Landscapes. Remote Sens. Environ. 2019, 233, 111354. [Google Scholar] [CrossRef]
  82. Yi, S.; Zhou, J.; Lai, L.; Du, H.; Sun, Q.; Yang, L.; Liu, X.; Liu, B.; Zheng, Y. Simulating Highly Disturbed Vegetation Distribution: The Case of China’s Jing-Jin-Ji Region. PeerJ 2020, 8, e9839. [Google Scholar] [CrossRef]
  83. Konapala, G.; Mishra, A.K.; Wada, Y.; Mann, M.E. Climate Change Will Affect Global Water Availability through Compounding Changes in Seasonal Precipitation and Evaporation. Nat. Commun. 2020, 11, 3044. [Google Scholar] [CrossRef]
  84. Kuhn, M.; Johnson, K. Applied Predictive Modeling; Springer: New York, NY, USA, 2013; Volume 26. [Google Scholar]
  85. Liu, Y.; Geng, X.; Hao, Z.; Zheng, J. Changes in Climate Extremes in Central Asia under 1.5 and 2 °C Global Warming and Their Impacts on Agricultural Productions. Atmosphere 2020, 11, 1076. [Google Scholar] [CrossRef]
  86. Lopez, G.; Gaiser, T.; Ewert, F.; Srivastava, A. Effects of Recent Climate Change on Maize Yield in Southwest Ecuador. Atmosphere 2021, 12, 299. [Google Scholar] [CrossRef]
  87. Emam, A.R.; Kappas, M.; Hosseini, S.Z. Assessing the Impact of Climate Change on Water Resources, Crop Production and Land Degradation in a Semi-Arid River Basin. Hydrol. Res. 2015, 46, 854–870. [Google Scholar] [CrossRef]
  88. Tan, L.; Feng, P.; Li, B.; Huang, F.; Liu, D.L.; Ren, P.; Liu, H.; Srinivasan, R.; Chen, Y. Climate Change Impacts on Crop Water Productivity and Net Groundwater Use Under a Double-Cropping System with Intensive Irrigation in the Haihe River Basin, China. Agric. Water Manag. 2022, 266, 107560. [Google Scholar] [CrossRef]
  89. Worqlul, A.W.; Dile, Y.T.; Jeong, J.; Adimassu, Z.; Lefore, N.; Gerik, T.; Srinivasan, R.; Clarke, N. Effect of Climate Change on Land Suitability for Surface Irrigation and Irrigation Potential of the Shallow Groundwater in Ghana. Comput. Electron. Agric. 2019, 157, 110–125. [Google Scholar] [CrossRef]
  90. Gao, Y.; Zhang, A.; Yue, Y.; Wang, J.; Su, P. Predicting Shifts in Land Suitability for Maize Cultivation Worldwide Due to Climate Change: A Modeling Approach. Land 2021, 10, 295. [Google Scholar] [CrossRef]
  91. Akpoti, K.; Groen, T.; Dossou-Yovo, E.; Kabo-bah, A.T.; Zwart, S.J. Climate Change-Induced Reduction in Agricultural Land Suitability of West-Africa’s Inland Valley Landscapes. Agric. Syst. 2022, 200, 103429. [Google Scholar] [CrossRef]
  92. Mogonong, B.P.; Twine, W.; Feig, G.T.; Van der Merwe, H.; Fisher, J.T. Influences of Climate Variability on Land Use and Land Cover Change in Rural South Africa. Remote Sens. 2024, 16, 1200. [Google Scholar] [CrossRef]
  93. Oliveira, D.M.S.; Santos, R.S.; Chizzotti, F.H.M.; Bretas, I.L.; Franco, A.L.C.; Lima, R.P.; Freitas, D.A.F.; Cherubin, M.R.; Cerri, C.E.P. Crop, Livestock, and Forestry Integration to Reconcile Soil Health, Food Production, and Climate Change Mitigation in the Brazilian Cerrado: A Review. Geoderma Reg. 2024, 37, e00796. [Google Scholar] [CrossRef]
  94. Sone, J.S.; Sanches de Oliveira, P.T.; Pereira Zamboni, P.A.; Motta Vieira, N.O.; Altrão Carvalho, G.; Motta Macedo, M.C.; Romeiro de Araujo, A.; Baptaglin Montagner, D.; Alves Sobrinho, T. Effects of Long-Term Crop-Livestock-Forestry Systems on Soil Erosion and Water Infiltration in a Brazilian Cerrado Site. Sustainability 2019, 11, 5339. [Google Scholar] [CrossRef]
  95. Assad, E.D.; Calmon, M.; Lopes-Assad, M.L.; Feltran-Barbieri, R.; Pompeu, J.; Domingues, L.M.; Nobre, C.A. Adaptation and Resilience of Agricultural Systems to Local Climate Change and Extreme Events: An Integrative Review. Pesqui. Agropecuária Trop. 2022, 52, e72899. [Google Scholar] [CrossRef]
  96. Godde, C.M.; Garnett, T.; Thornton, P.K.; Ash, A.J.; Herrero, M. Grazing Systems Expansion and Intensification: Drivers, Dynamics, and Trade-Offs. Glob. Food Secur. 2018, 16, 93–105. [Google Scholar] [CrossRef]
  97. Nunes, F.S.M.; Soares-Filho, B.S.; Rajão, R.; Merry, F. Enabling Large-Scale Forest Restoration in Minas Gerais State, Brazil. Environ. Res. Lett. 2017, 12, 044022. [Google Scholar] [CrossRef]
  98. Fernandes, G.W.; Arantes-Garcia, L.; Barbosa, M.; Barbosa, N.P.U.; Batista, E.K.L.; Beiroz, W.; Resende, F.M.; Abrahão, A.; Almada, E.D.; Alves, E.; et al. Biodiversity and Ecosystem Services in the Campo Rupestre: A Road Map for the Sustainability of the Hottest Brazilian Biodiversity Hotspot. Perspect. Ecol. Conserv. 2020, 18, 213–222. [Google Scholar] [CrossRef]
  99. da Silva, L.A.P.; Rocha, A.M.; da Silva, C.R. Surface Temperature Behavior in View of the Conversion of Tropical Dry Forest into Anthropic Uses, Northern Minas Gerais–Brazil. PLoS ONE 2022, 17, e0270991. [Google Scholar] [CrossRef] [PubMed]
  100. Clemente, C.M.S.; do Espírito-Santo, M.M.; Leite, M.E. Estimates of Deforestation Avoided by Protected Areas: A Case Study in Brazilian Tropical Dry Forests and Cerrado. Landsc. Res. 2020, 45, 470–483. [Google Scholar] [CrossRef]
  101. do Espírito-Santo, M.M.; Rocha, A.M.; Leite, M.E.; Silva, J.O.; Silva, L.A.P.; Sanchez-Azofeifa, G.A. Biophysical and Socioeconomic Factors Associated to Deforestation and Forest Recovery in Brazilian Tropical Dry Forests. Front. For. Glob. Change 2020, 3, 569184. [Google Scholar] [CrossRef]
  102. Simpkin, P.; Cramer, L.K.; Ericksen, P.J.; Thornton, P.K. Current Situation and Plausible Future Scenarios for Livestock Management Systems under Climate Change in Africa. CGIAR Res. Program Clim. Change Agric. Food Secur. CCAFS 2020, 307, 3–71. [Google Scholar]
  103. Sousa, F.P.; Ferreira, T.O.; Mendonça, E.S.; Romero, R.E.; Oliveira, J.G.B. Carbon and Nitrogen in Degraded Brazilian Semi-Arid Soils Undergoing Desertification. Agric. Ecosyst. Environ. 2012, 148, 11–21. [Google Scholar] [CrossRef]
  104. Espírito-Santo, M.M.; Leite, M.E.; Silva, J.O.; Barbosa, R.S.; Rocha, A.M.; Anaya, F.C.; Dupin, M.G.V. Understanding Patterns of Land-Cover Change in the Brazilian Cerrado from 2000 to 2015. Philos. Trans. R. Soc. B Biol. Sci. 2016, 371, 20150435. [Google Scholar] [CrossRef]
  105. Strassburg, B.B.N.; Latawiec, A.E.; Barioni, L.G.; Nobre, C.A.; da Silva, V.P.; Valentim, J.F.; Vianna, M.; Assad, E.D. When Enough Should Be Enough: Improving the Use of Current Agricultural Lands Could Meet Production Demands and Spare Natural Habitats in Brazil. Glob. Environ. Change 2014, 28, 84–97. [Google Scholar] [CrossRef]
  106. Ribeiro, J.F.; Walter, B.M.T. Fitofisionomias do bioma cerrado. In Cerrado Ecologia e Flora, 1; Sano, S.M., Almeida, S.P., Ribeiro, J.F., Eds.; Embrapa: Planaltina, Brazil, 2008; pp. 152–212. [Google Scholar]
  107. Salazar, L.F.; Nobre, C.A.; Oyama, M.D. Climate Change Consequences on the Biome Distribution in Tropical South America. Geophys. Res. Lett. 2007, 34, L09708. [Google Scholar] [CrossRef]
  108. Terra, M.C.N.S.; Nunes, M.H.; Souza, C.R.; Ferreira, G.W.D.; do Prado-Junior, J.A.; Rezende, V.L.; Maciel, R.; Mantovani, V.; Rodrigues, A.; Morais, V.A.; et al. The Inverted Forest: Aboveground and Notably Large Belowground Carbon Stocks and Their Drivers in Brazilian Savannas. Sci. Total Environ. 2023, 867, 161320. [Google Scholar] [CrossRef]
  109. Araújo, I.; Marimon, B.S.; Scalon, M.C.; Cruz, W.J.A.; Fauset, S.; Vieira, T.C.S.; Galbraith, D.R.; Gloor, M.U. Intraspecific Variation in Leaf Traits Facilitates the Occurrence of Trees at the Amazonia–Cerrado Transition. Flora 2021, 279, 151829. [Google Scholar] [CrossRef]
  110. de Castro Nunes Santos Terra, M.; dos Santos, R.M.; do Prado Júnior, J.A.; de Mello, J.M.; Scolforo, J.R.S.; Fontes, M.A.L.; Schiavini, I.; dos Reis, A.A.; Bueno, I.T.; Magnago, L.F.S.; et al. Water Availability Drives Gradients of Tree Diversity, Structure and Functional Traits in the Atlantic–Cerrado–Caatinga Transition, Brazil. J. Plant Ecol. 2018, 11, 803–814. [Google Scholar] [CrossRef]
  111. Silva, L.A.; de Souza, C.M.P.; Leite, M.E.; Filgueiras, R. Estimativa da Perda de Água Na APA do Rio Pandeiros, Minas Gerais. Cad. Geogr. 2020, 30, 768–787. [Google Scholar] [CrossRef]
  112. Williams, A.P.; Allen, C.D.; Millar, C.I.; Swetnam, T.W.; Michaelsen, J.; Still, C.J.; Leavitt, S.W. Forest Responses to Increasing Aridity and Warmth in the Southwestern United States. Proc. Natl. Acad. Sci. USA 2010, 107, 21289–21294. [Google Scholar] [CrossRef] [PubMed]
  113. Anadón, J.D.; Sala, O.E.; Maestre, F.T. Climate Change Will Increase Savannas at the Expense of Forests and Treeless Vegetation in Tropical and Subtropical Americas. J. Ecol. 2014, 102, 1363–1373. [Google Scholar] [CrossRef]
  114. Costa, L.R.F.D. Considerações sobre as Macrounidades Geomorfológicas do estado de Minas Gerais–Brasil. William Morris Davis-Rev. Geomorfol. 2021, 2, 1–9. [Google Scholar] [CrossRef]
  115. Sales, L.P.; Pires, M.M. Identifying Climate Change Refugia for South American Biodiversity. Conserv. Biol. 2023, 37, e14087. [Google Scholar] [CrossRef]
  116. Fernandes, G.W.; Barbosa, N.P.U.; Negreiros, D.; Paglia, A.P. Challenges for the Conservation of Vanishing Megadiverse Rupestrian Grasslands. Perspect. Ecol. Conserv. 2014, 12, 162–165. [Google Scholar] [CrossRef]
  117. McDowell, N.G.; Beerling, D.J.; Breshears, D.D.; Fisher, R.A.; Raffa, K.F.; Stitt, M. The Interdependence of Mechanisms Underlying Climate-Driven Vegetation Mortality. Trends Ecol. Evol. 2011, 26, 523–532. [Google Scholar] [CrossRef]
  118. Hatfield, J.L.; Prueger, J.H. Temperature Extremes: Effect on Plant Growth and Development. Weather Clim. Extrem. 2015, 10, 4–10. [Google Scholar] [CrossRef]
  119. Florêncio, G.W.L.; Martins, F.B.; Fagundes, F.F.A. Climate Change on Eucalyptus Plantations and Adaptive Measures for Sustainable Forestry Development across Brazil. Ind. Crops Prod. 2022, 188, 115538. [Google Scholar] [CrossRef]
  120. Sondermann, M.; Chou, S.C.; Lyra, A.; Latinovic, D.; Siqueira, G.C.; Junior, W.C.; Giornes, E.; Leite, F.P. Climate Change Projections and Impacts on the Eucalyptus Plantation around the Doce River Basin, in Minas Gerais, Brazil. Clim. Serv. 2022, 28, 100327. [Google Scholar] [CrossRef]
  121. Resquin, F.; Duque-Lazo, J.; Acosta-Muñoz, C.; Rachid-Casnati, C.; Carrasco-Letelier, L.; Navarro-Cerrillo, R.M. Modelling Current and Future Potential Habitats for Plantations of Eucalyptus Grandis Hill Ex Maiden and E. Dunnii Maiden in Uruguay. Forests 2020, 11, 948. [Google Scholar] [CrossRef]
  122. Elli, E.F.; Sentelhas, P.C.; Bender, F.D. Impacts and Uncertainties of Climate Change Projections on Eucalyptus Plantations Productivity across Brazil. For. Ecol. Manag. 2020, 474, 118365. [Google Scholar] [CrossRef]
  123. Soares, M.P.; Nunes, Y.R.F. Regeneração natural de cerrado sob plantio de Eucalyptus camaldulensis Dehn. no norte de Minas Gerais, Brasil. Rev. Ceres 2013, 60, 205–214. [Google Scholar] [CrossRef]
  124. de Almeida, J.W.L.; Leite, M.E.; Figueiredo, L.H.A.; Figueiredo, M.A.P. Unidade de Conservação No Semiárido Mineiro e Seu Papel Na Preservação Ambiental. Cad. Geogr. 2023, 33, 1257–1276. [Google Scholar] [CrossRef]
  125. Afonso, R.; Miller, D.C. Forest Plantations and Local Economic Development: Evidence from Minas Gerais, Brazil. For. Policy Econ. 2021, 133, 102618. [Google Scholar] [CrossRef]
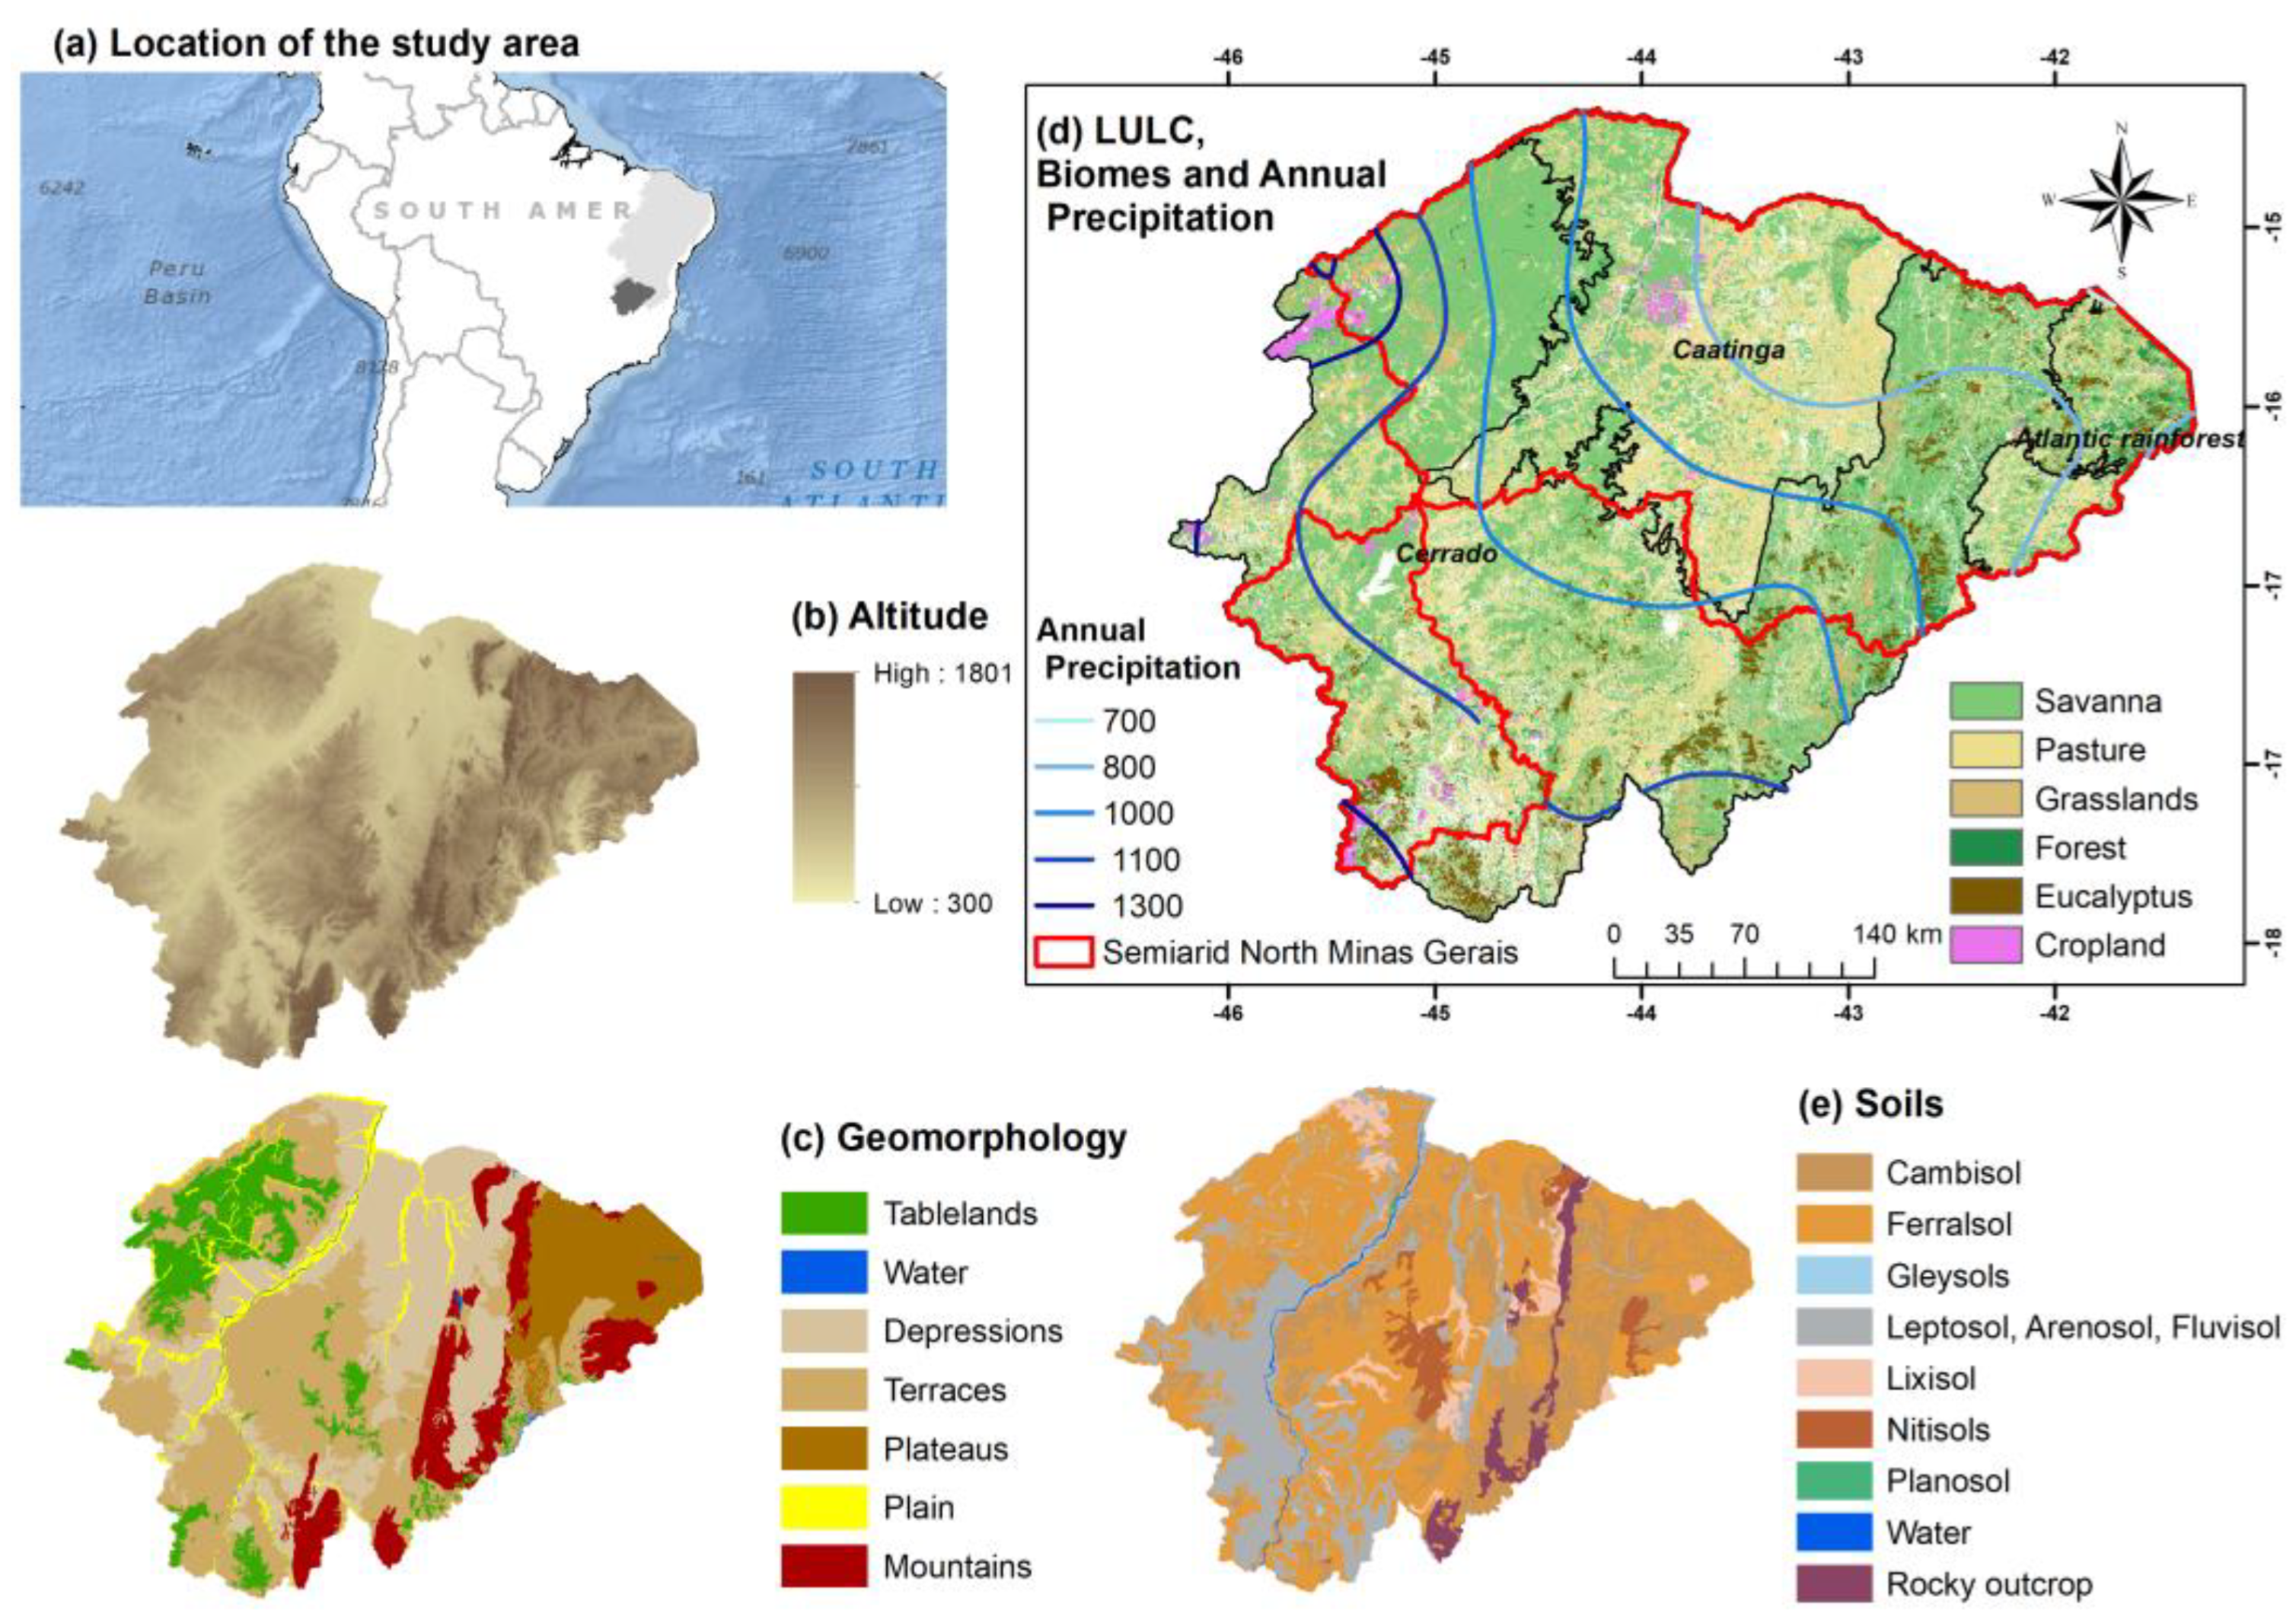
Figure 1. Characterization of the study area. (a) North of Minas Gerais State in the global context: (b) altitude; (c) geomorphology; (d) land use and cover (LULC) classes, biomes, and mean annual precipitation distribution; and (e) soil types.
Land 13 02008 g001
Figure 2. Overview of the main steps of the methodological framework. RF = Random Forest; RCP = Representative Concentration Pathway.
Land 13 02008 g002
Figure 3. Samples of representative land use and land cover classes of the North of Minas Gerais made available by the MapBiomas project and selected to train and validate the Random Forest machine learning algorithm.
Land 13 02008 g003
Figure 4. Climate change scenarios in the North of Minas Gerais State, Brazil, for historical (1970–2000) and future (2061–2080) scenarios based on the ensemble model of three general circulation models (GCMs): CCSM4, MPI-ESM-P, and MIROC-ESM. Where: (a) spatial distribution of mean air temperature in the historical scenario recorded between 1970 and 2000 in Northern Minas Gerais (NMG); (b) projected mean air temperature for 2061–2080 in the optimistic scenario (RCP 2.6); (c) projected mean air temperature for 2061–2080 in the pessimistic scenario (RCP 8.5). The remaining figures show the spatial distribution of annual accumulated precipitation in the historical scenario (d) and estimates for the RCP 2.6 (e) and RCP 8.5 (f) scenarios.
Land 13 02008 g004
Figure 5. Ranking of the most important variables selected by the Random Forest algorithm in the training process. OCD = organic carbon density; CFV = volumetric coarse fragment; SOC = soil organic carbon; CEC = cation exchange capacity.
Land 13 02008 g005
Figure 6. Spatial distribution of land use and land cover classes in the North of Minas Gerais State in the historical (a), optimistic climate change scenario (RCP2.6, 2061–2080) (b), and pessimistic climate change scenario (RCP 8.5, 2061–2080) (c).
Land 13 02008 g006
Figure 7. Quantitative comparison between changes in LULC and climate variables in the North of Minas Gerais. Suitability in km2 of LULC classes (a); mean air temperature for the extent of each LULC class (b); annual precipitation for the extent of each LULC class (c). All variables are for the historical (1970–2000), optimistic, and pessimistic scenarios (2061–2080).
Land 13 02008 g007
Figure 8. Sankey diagram showing the conversions of land use and land cover classes considering historical data (a) and future climate change scenarios under the optimistic and pessimistic scenarios (b). CP = cropland; GR = grasslands; EUC = eucalyptus; FF = forest; PA = pasture; and SAV = savanna.
Land 13 02008 g008
Table 1. Covariates used in the land use and land cover classification.
CovariatesResolution (m)Period
Mean air temperature10001970–2000 and 2061–2080
Annual precipitation10001970–2000 and 2061–2080
Bulk density2501970–2000
Cation exchange capacity2501970–2000
Volumetric coarse fragment2501970–2000
Organic carbon density2501970–2000
Soil pH2501970–2000
Nitrogen2501970–2000
Soil organic carbon2501970–2000
Sand2501970–2000
Silt2501970–2000
Clay2501970–2000
Elevation301970–2000
Table 2. Description of LULC classes and the number of samples.
LULCDescriptionNumber of Samples
ForestVegetation with a predominance of tree species, with continuous canopy formation, and seasonal deciduous forests146
SavannaSavanna formations with trees, shrubs, and herbaceous strata307
EucalyptusTree species planted for commercial purposes. The typical planting space of eucalyptus (2 to 3 m between planting lines and 1 to 2 m between trees)134
GrasslandsNatural formations with a predominance of a herbaceous layer and some shrubs222
PasturePlanted pastures, related to livestock activity (brachiaria; African genus Urochloa)252
CroplandsAreas cultivated with perennial and temporary crops (bananas, grapes, lemons, mangoes, corn, and beans, among others)148
Table 3. Metrics of evaluating the performance of the model developed using the Random Forest (RF) algorithm. Note: PA—producer’s accuracy; UA—user accuracy; OA—overall accuracy; AD—allocation disagreement; QD—quantity disagreement.
ClassesForestSavannaEucalyptusGrasslandsPastureCroplandTotalUA (%)
Forest185411013946.15
Savanna351652189454.26
Eucalyptus03220202781.48
Grasslands112140205671.43
Pasture29362544951.02
Cropland27013243764.86
Total268736536337
PA (%)69.2358.6261.1175.4739.6864.86
OA (%)59.60
AD (%)65.56
QD (%)15.23
Table 4. Area gain and loss for each class of land use and land cover (LULC) considering the historical data and optimistic (RCP 2.6) and pessimistic (RCP 8.5) climate change scenarios.
LULCHistorical Data (km2)RCP 2.6 (km2)RCP 8.5 (km2)Historical Data to RCP
2.6 (km2)8.5 (km2)2.6 (%)8.5 (%)
Croplands780374177192−386−611−4.95−7.83
Eucalyptus842436162490−4808−5934−57.08−70.44
Forest11,14285726794−2570−4348−23.07−39.02
Grasslands12,65990706054−3589−6605−28.35−52.18
Pasture38,13043,65049,421552011,29114.4829.61
Savanna57,68163,51463,8885833620710.1110.76
Disclaimer/Publisher’s Note: The statements, opinions and data contained in all publications are solely those of the individual author(s) and contributor(s) and not of MDPI and/or the editor(s). MDPI and/or the editor(s) disclaim responsibility for any injury to people or property resulting from any ideas, methods, instructions or products referred to in the content.