Article

Multi-Criteria Decision-Making Scenario Insights into Spatial Responses and Promotion Under Ecosystem Services

1
Institute of Geographical Sciences and Natural Resources Research, Chinese Academy of Sciences, Beijing 100101, China
2
Key Laboratory of Coastal Science and Integrated Management, Ministry of Natural Resources, Qingdao 266061, China
3
University of the Chinese Academy of Sciences, Beijing 100049, China
*
Author to whom correspondence should be addressed.
Land 2024, 13(11), 1964; https://doi.org/10.3390/land13111964
Submission received: 17 September 2024 / Revised: 6 November 2024 / Accepted: 11 November 2024 / Published: 20 November 2024

Abstract

:
The Blue Economic Zone of the Shandong Peninsula is located in the transitional zone between land and sea, with a complex ecological environment. The determination of hot and cold spots in various ecosystem services is crucial for the coordinated development of ecosystem services and the optimization of the spatial pattern of the ecological environment. This study, based on natural and socio-economic data, utilizes various ecological models to simulate water yield (provisioning service), carbon sequestration (regulating service), biodiversity (supporting service), and aesthetic and scientific research values (cultural service). Using a multi-criteria decision-making approach, it identifies hot and cold spots of ecosystem services in different development–conservation scenarios. Combining the protection efficiency of different areas, it proposes a spatial pattern promotion scheme. The research indicates significant spatial differences in ecosystem services without clear trade-offs and synergies. Changes in the weights of ecosystem services in 11 scenarios result in significant differences in hot and cold spots. Compared to the neutral scenario (S6), the distribution of hot and cold spots in protection scenarios (S1–S5) is relatively scattered, while in development scenarios (S7–S11), hot spots show an increasing trend of concentration in the southeast, with cold spots scattered in the west and northwest. Four spatial pattern promotion schemes are proposed based on protection efficiency and policy preferences. Promotion areas should focus on ecological restoration and improvement to raise local ecosystem service levels. Protection areas should emphasize maintaining their existing high-level ecosystem services to achieve a synergistic enhancement of various ecosystem services.

1. Introduction

Ecosystem services refer to the benefits provided directly or indirectly to humans through ecological functions [1,2]. In the Millennium Ecosystem Assessment (MA), these services are categorized into four major types: provisioning, regulating, supporting, and cultural services [3,4]. The concept of ecosystem services emphasizes the relationship between the supply and demand sides [5,6], effectively integrating natural ecosystems with socio-economic systems [7,8]. This addresses the shortcomings of traditional ecosystem assessments that tend to focus more on the supply side, such as species diversity and richness, while overlooking the coupling of human–environment relationships [9]. This approach allows for a more effective evaluation of the ecological sustainability of a region and has been widely applied in recent years [10,11].
Currently, research on the interrelationships of various ecosystem services has made significant progress [12,13]. Thomas et al. conducted an in-depth analysis of the synergistic relationship between carbon sequestration and biodiversity [14]. Rodriguez et al. explored the trade-off relationships between carbon sequestration, water yield, and biodiversity from the perspective of the impact of increasing forest land on runoff [15]. Qin et al. studied the coordinated relationships among five ecosystem services: water yield, water interception, soil conservation, carbon sequestration, and agricultural production [16]. They considered future scenarios, combining past and future assessments to comprehensively evaluate the interrelationships between ecosystem services. Cultural services, due to their challenging quantification, have seen relatively slower development [17]. However, with the increasing demand for ecosystem services by humans [18,19], cultural ecosystem services have gained more attention [20,21,22]. While research on the synergistic relationships of ecosystem services has matured [23,24,25], there is a relative lack of studies on how to comprehensively enhance ecosystem services from the perspective of all four major types: provisioning, regulating, supporting, and cultural services.
The optimization of the spatial pattern of ecosystem services has attracted increasing attention from scholars [26,27,28]. Scholars have begun to explore this field using different models and methods [25,29]. Currently, most spatial optimization research is based on land use spatial patterns, aiming to achieve specific scale demands and planning goals [30,31,32]. In practical ecological conservation, considering the limited financial, material, and human resources, the effectiveness of protection needs to be taken into account [33]. From the perspective of ecological protection efficiency, conservation actions should have clear goals. Therefore, the identification of regions with high and low levels of ecosystem services has become important.
In the 1980s, Myers introduced the concept of “hotspots,” referring to regions with superior biodiversity [34]. This concept was initially applied in research related to biodiversity conservation areas. Gos et al. suggest that in the study of ecosystem services, regions with high clusters of ecosystem services or regions with a high level of a single ecosystem service can be considered hotspots [35]. Spano et al. propose that regions with lower ecosystem services, opposite to hotspots, can be considered cold spots [36]. With the in-depth research of domestic and international scholars on ecosystem services [37], although there are various definitions of hotspots and cold spots, overall, in the study of ecosystem services, hotspots can be defined as areas with high values of ecosystem services [38], while cold spots can be understood as areas with low values of ecosystem services [39]. Identifying hotspots and cold spots for various ecosystem services is fundamental for enhancing the spatial pattern optimization of ecosystems. It holds great significance for effectively coordinating the improvement of regional ecosystem services, establishing sustainable human–environment relationships.
This study aims to evaluate the status of key ecosystem services in the Shandong Peninsula Blue Economic Zone in China, identify hotspots and cold spots, and provide scientific guidance for enhancing the spatial pattern of ecological conservation areas of the study area. Specifically, we comprehensively consider four types of ecosystem services: provisioning, regulating, supporting, and cultural services. Hotspots and cold spots of ecosystem services were assessed using the ordered weighted average multi-attribute decision-making method. This study also proposes optimized spatial patterns of green space to support ecological balance and sustainable development in the study area. This study proposes strategies for optimizing the pattern of ecological conservation areas to support ecological balance and sustainable development in the study area. These optimization strategies are not only applicable to the Shandong Peninsula Blue Economic Zone but also serve as a reference for optimizing the spatial pattern of ecosystem services in other cities. By adopting the spatial pattern optimization strategies proposed in this study, ecological managers and planners can allocate resources more effectively, enhance the overall level of ecosystem services, and promote sustainable urban development.

2. Materials and Methods

2.1. Study Area

The Blue Economic Zone of the Shandong Peninsula has a warm, temperate, humid, monsoon climate, with approximately 60% of the annual precipitation concentrated in the summer, characterized by intense and frequent heavy rainfall. The annual relative variability in precipitation is about 20%. The average annual relative humidity is above 70%. Key seaports in the economic zone include Qingdao, Yantai, Weihai, Longkou, Shijiu Port, and Rizhao Port. The planned core area encompasses all the sea areas of Shandong and the land areas of six cities, namely, Qingdao, Yantai, Weihai, Weifang, Dongying, Rizhao, and two coastal counties, Wudi and Zhanhua, belonging to Binzhou (Figure 1). The sea area covers 159,500 square kilometers, and the land area covers 64,000 square kilometers. The cropland in the study accounts for the largest area, followed by urban land. The distribution of forest land, grassland, water area, and unused land accounts for a relatively low proportion of the total area.

2.2. Methods

2.2.1. Ecosystem Services Assessment

Ecosystem services refer to the various benefits and well-being that ecosystems provide to humanity, either directly or indirectly, through their structures and functions. These services constitute vital connections between human society and the natural environment, serving as the cornerstone for maintaining the Earth’s life support system. According to the classification framework of the Millennium Ecosystem Assessment (MA), ecosystem services are categorized into four major types: provisioning services, regulating services, supporting services, and cultural services [3].
Provisioning services involve the direct provision of material resources to humans by ecosystems, such as food, water, and wood. In this study, considering the water scarcity issue faced by the Shandong Peninsula Blue Economic Zone, we specifically focus on water yield. The quantification of water yield is based on the Budyko curve and annual average precipitation [34,37].
Regulating services pertain to the regulatory functions of ecosystems on the natural environment, including climate regulation, air purification, and water purification. In light of China’s goals for carbon peaking and carbon neutrality, carbon sequestration is selected as a representative of regulating services. The quantification of carbon sequestration services is achieved by converting the net primary productivity (NPP) calculated using the CASA model [23].
Cultural services refer to the non-material benefits provided by ecosystems to humans, such as aesthetic enjoyment, spiritual fulfillment, and scientific research value. The Shandong Peninsula Blue Economic Zone possesses prominent aesthetic and scientific research value due to its unique natural landscapes and rich cultural heritage. Therefore, aesthetic and scientific research value are chosen as the assessment indicators for cultural services, and the SolVES 3.0 model is employed for simulation. The SolVES model integrates multiple environmental index raster layers, such as the land use type elevation, slope, hillshade, distance to the nearest road, and distance to the nearest water body of year 2022, with people’s perception of the local area obtained through questionnaire surveys (questionnaire design and details are provided in Supplementary Information S1 and S2) to comprehensively reflect the cultural service value of the region [22].
Supporting services are the foundational functions provided by ecosystems to support other services, such as soil formation, nutrient cycling, and biodiversity maintenance. Biodiversity, as a crucial supporting service, is vital for ecosystem stability and resilience. Biodiversity is assessed using the habitat quality model within the InVEST framework, which calculates habitat quality based on land use and land cover (LULC) data and the degree of threats to biodiversity [38,39].
The required data and data sources for the types of ecosystem services involved in this paper are shown in Table 1 below:

2.2.2. Multi-Scenario Analysis Based on Ordered Weighted Averaging

(1)
Ordered weight averaging
Spatial multicriteria evaluation refers to the complex spatial operations of multiple evaluation criteria in accordance with certain decision-making rules, combined with geographic information system technology, to effectively balance different decision-making objectives and ensure optimal decision-making [40]. In 1988, Ronald R. Yager of the United States first proposed a multi-criteria decision-making algorithm based on ordered weighted averaging (OWA). The definition is as follows [22,41]
f :   R n R ,   if   f a 1 , a 2 , , a i , , a n = i = 1 n ω j b j
Here, ω = ( ω 1 , ω 2 , , ω n ) T is the weighted vector associated with f , ω j [ 0,1 ] , j = 1 n ω j = 1 , j 1,2 , , n , and b j is the j th largest element in a set of data. The function is then referred to as an OWA operator, which stands for ordered weighted averaging operator.
For the ordered weighted averaging (OWA) operator, the first step is to sort the existing set of data a 1 , a 2 , , a i , , a n in descending order, obtaining a new ordered set of data b 1 , b 2 , , b i , , b n . Then, the data b 1 , b 2 , , b i , , b n are aggregated in combination with the associated weights.
Based on geographic information system (GIS) technology, the ordered weighted averaging (OWA) approach involves first rasterizing the existing criterion layers using GIS techniques and then applying the OWA method for aggregation within the GIS environment. For a set of raster criterion layers, the OWA can be defined as [42]:
O W A x i j = i n ω i s i j , ω i 0,1   a n d   i n ω i = 1 , f o r   i   a n d   j = 1,2 , 3 , , n
Here, x i j represents a set of attribute values at the ith location on the jth raster map after standardization. s i j is the set of four ecosystem service raster values, corresponding to x i j after standardization and then arranged in descending order, resulting in four new datasets. ω i is the ordered weight for the four new dataset s i j .
(2)
Risk and Trade-Offs
OWA can provide a set of continuous decision sets for decision-makers by fully considering the trade-off effects between different criteria and simulating different decision risks or scenarios [43]. The formulas for calculating risks and trade-offs under different ordered weight choices are as follows [44]:
r i s k = n 1 1 i n n i ω i 0 r i s k 1
t r a d e o f f = 1 n i n ω i 1 n 2 n 1 ( 0 t r a d e o f f 1 )
Here, n is the total number of all ecosystem service raster datasets, and ω i is the weight of the ith grid. Theoretically, by altering the risk and trade-off levels within the range of OWA decision strategies, an infinite number of scenarios can be obtained.
If decision-makers assign high weight values to lower-valued ecosystem services, they are more likely to achieve low-risk (risk-averse) values; if they tend to allocate high weight values to higher-valued ecosystem services, they will obtain high-risk (risk-seeking) values. If decision-makers allocate equal weight values to each ecosystem service, they are more likely to achieve the maximum trade-off value of 1, which means that each ecosystem service is given an exactly equal distribution of weights ( ω i = 1 n ). If the highest- or lowest-valued ecosystem service is assigned the maximum weight value of 1, they will receive the minimum trade-off value of 0 [44]. The higher the risk value of a scenario, the greater the risk of losing ecosystem services. The higher the trade-off value of a scenario, the more evenly the values from each ecosystem service are distributed in the final OWA (ordered weighted averaging) result.
Combining the definitions of risk and weights, the optimal ordered weights (i.e., scenarios) can be obtained by solving the following three nonlinear mathematical equations [45]:
m a x i m i z e   t r a d e o f f = 1 n i n ω i 1 n 2 n 1 ( 0 t r a d e o f f 1 ) ,
ω i 0,1 ,   i n ω i = 1
i n ω i = 1 , i , j = 1,2 , 3 , , n .
In this formula, the meanings of the parameters are as defined in the above formula. This formula determines the maximum level of trade-off for a given level of risk.
(3)
Different policy scenarios
OWA (ordered weighted averaging) provides a tool that allows for exploring a range of aggregation rules using different levels of risk coefficients and trade-off degrees. On this basis, decision-makers can evaluate all decision scenarios and select the one that best suits their needs and expectations. When α = 0.5, all ordinal weights are equal, indicating no preference in decision-making by the decision-maker, and the trade-off degree under this risk coefficient is 1; when α < 0.5, the lower the average evaluation metric, the greater the weight, indicating a pessimistic attitude of the decision-maker towards the metric attributes; when α > 0.5, the higher the average evaluation metric, the greater the weight, indicating an optimistic attitude of the decision-maker towards the metric attributes (Table 2).
Using the OWA operator for selection, theoretically, any scenario can be established within the risk range of 0 to 1. Considering practical research conditions and computational complexity, this study selects intervals of 0.1 to establish scenarios, resulting in a total of 11 scenarios. Based on the definitions of risk and trade-off, an optimal set of order weights (scenarios) can be obtained by solving a nonlinear mathematical programming problem consisting of four equations, namely, Equations (3) and (5)–(7). The optimal ordered weights calculated for 11 scenarios set with risk varying from 0 to 1 in increments of 0.1 are shown in Table 2. S1 to S11 represent 11 scenarios where the risk varies from 0 to 1 in increments of 0.1. The layers extracted by the OWA algorithm are w1 through w4, where w1 to w4 represent the new grid ranking from highest to lowest for the four types of ecosystem services at the same grid location. As the risk increases from 0 to 1, the change trajectory of the trade-off approaches a parabola, reaching the maximum trade-off value of 1 at a risk value of 0.5, with symmetry on both sides of the peak. As the risk value increases from 0 to 0.5, scenarios 1 to 6 imply that the six ecosystem services transition from being allocated the highest weight to grids with the smallest values after ranking, gradually shifting towards an equalization where each grid has a weight of 0.25. The situation is reversed when the risk increases from 0.5 to 1.

2.2.3. Hotspot/Cold Spot Region Identification

By multiplying the four weight values under each scenario with the four ecosystem service quantities, we can calculate 11 ordered weighted average result raster maps for the 11 scenarios. To effectively and intensively protect the multiple ecosystem service functions in the Blue Economic Zone of the Shandong Peninsula, we select a certain area of the study area as hotspot regions and cold spot regions for the various ecosystem services in the Shandong Peninsula Blue Economy.
After numerous data analysis experiments, we found that setting the threshold for delineating hotspot and cold spot areas at 10% of the total area results in these areas being excessively scattered and lacking necessary continuity, thus making it difficult to form effective conservation strategies and hindering the implementation and application of practical policies. Conversely, when the selected area exceeds 30% of the total area of the study region, it becomes detrimental to focusing limited resources and efforts on implementing targeted protection for the most ecologically valuable or vulnerable areas. The results from multiple experiments demonstrate that choosing 20% of the study area as the threshold for hotspot and cold spot areas offers multiple advantages, including highlighting extreme values, facilitating comparison and classification, and enhancing the targeted nature of management decisions.

2.2.4. Protection Efficiency Quantification

The protection efficiency is defined as the ratio of the average value of a particular ecosystem service in the hotspot or cold spot region to the average value of that ecosystem service across the entire area. By comparing the protection efficiencies of various ecosystem services under different scenarios, spatial pattern optimization strategies can be proposed for different policy preferences. The protection efficiency calculation formula is as follows:
E = E S ¯ c E S ¯ o ,
where E is the protection efficiency of a specific ecosystem service in a certain area, E S ¯ c is the average value of a specific ecosystem service in that area, and E S ¯ o is the average value of that specific ecosystem service across the entire study area.

3. Results

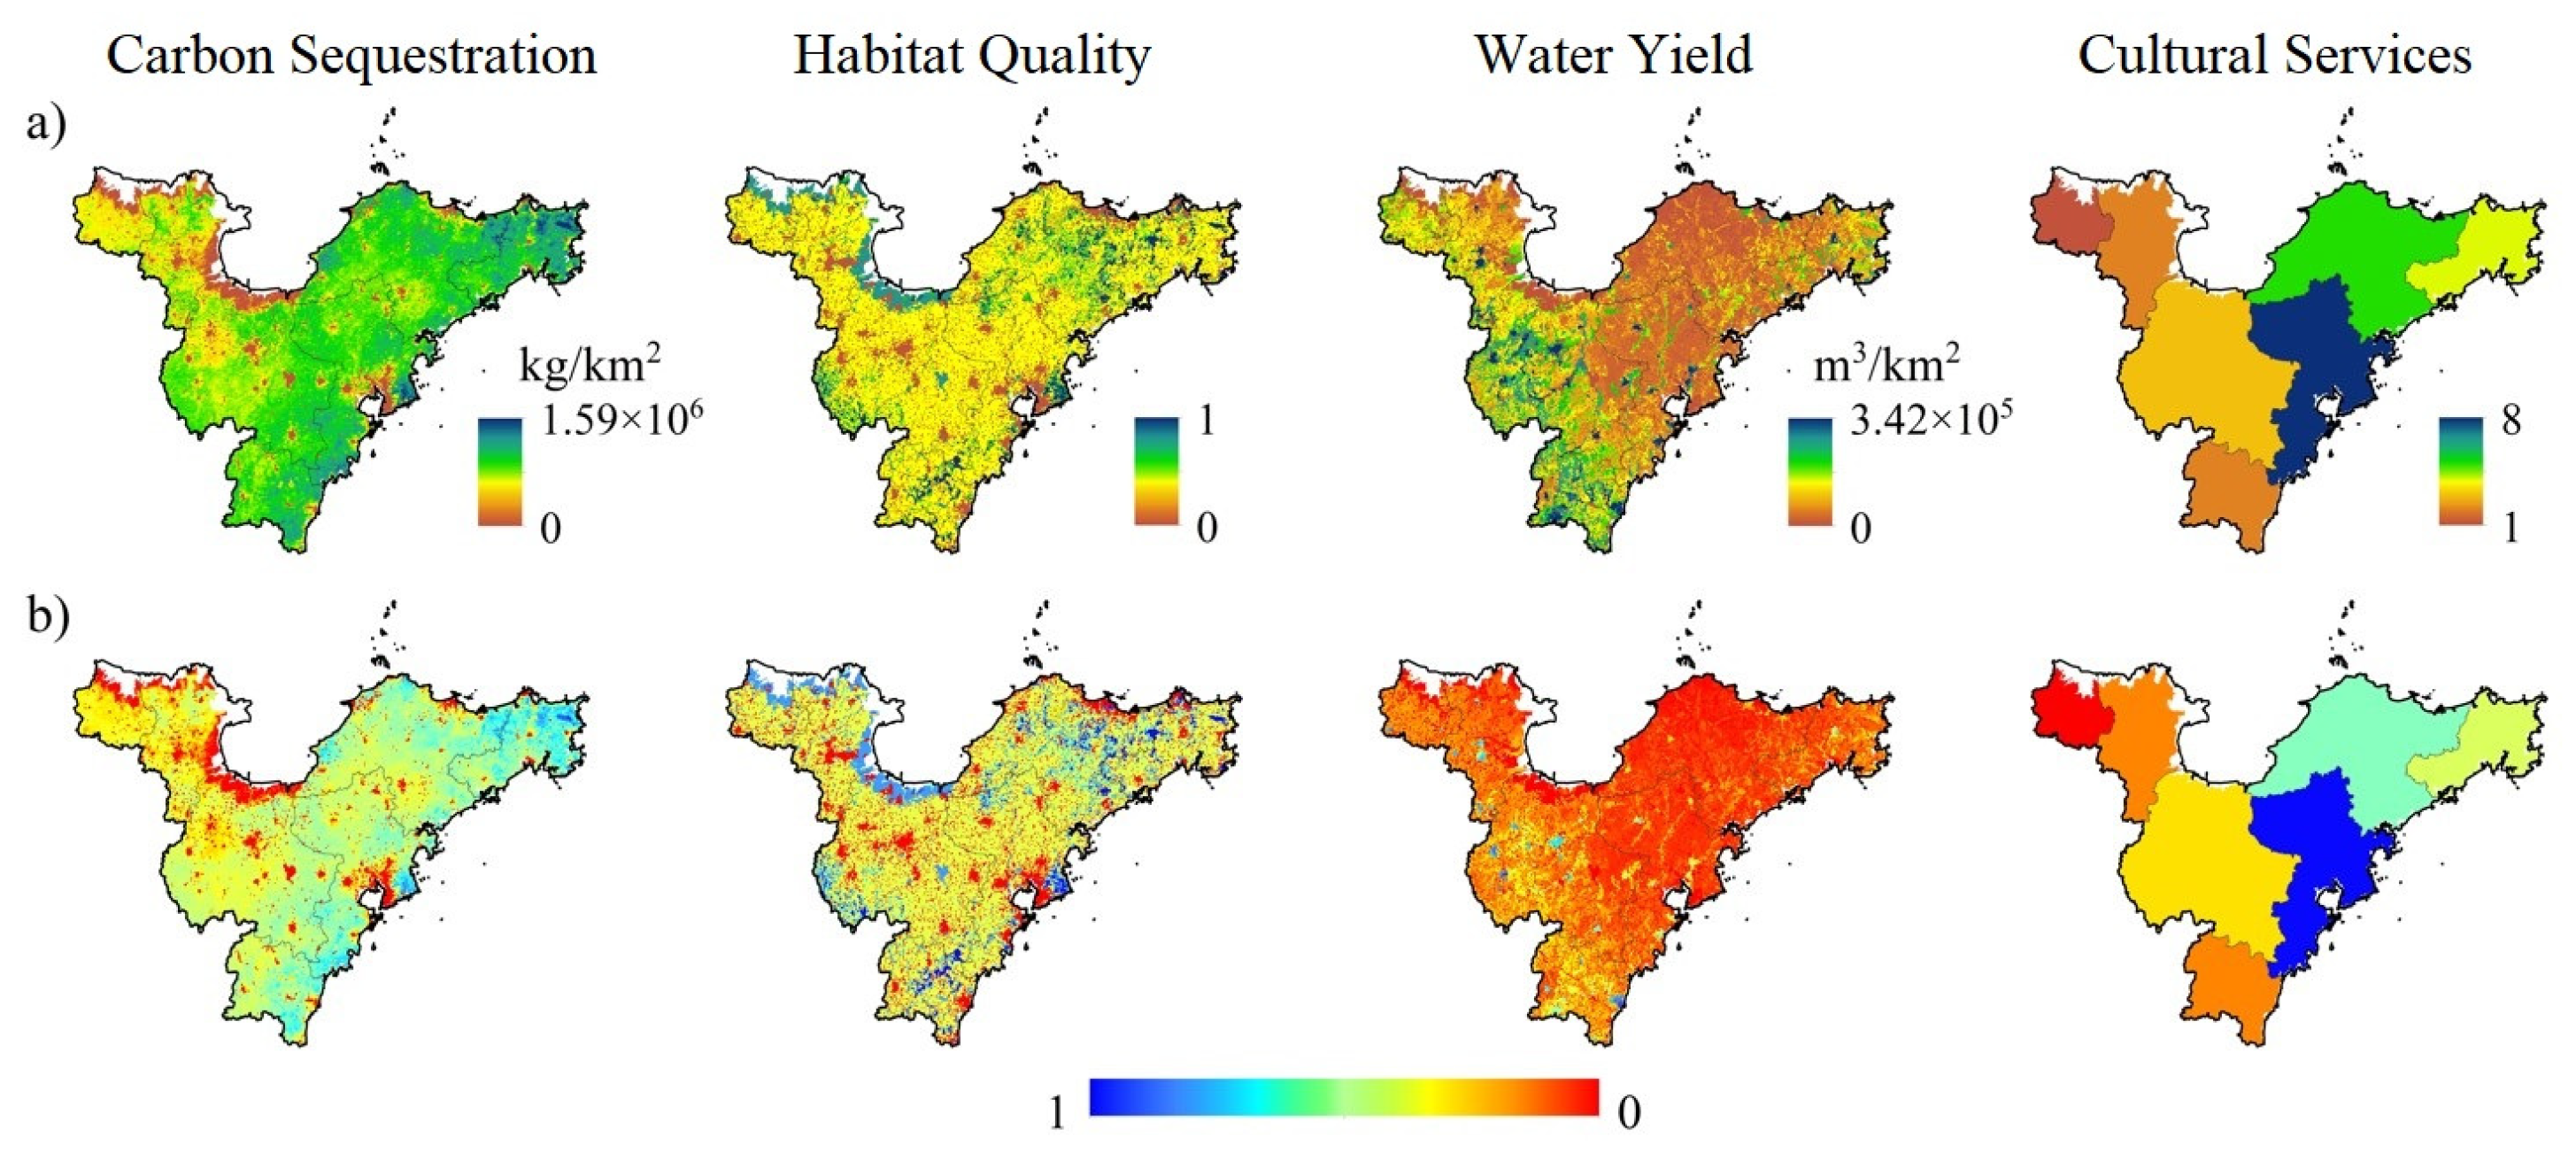
3.1. Multiple Ecosystem Services Assessment

Spatially, there is a significant difference in the distribution of each service, without clear patterns of trade-offs or synergies. The water yield service level shows considerable regional differences, generally exhibiting a spatial distribution that is higher in the west and lower in the east. Carbon sequestration service levels also show large regional differences, with a spatial distribution that is higher in the east and lower in the west. Habitat quality levels exhibit considerable regional differences, with better habitat quality in coastal areas and relatively little spatial variation in other areas. Cultural service levels also show large regional differences, with a spatial distribution that is higher in the east and lower in the west (Figure 2a).
When performing an OWA operation, it is necessary to ensure that all values involved in the calculation have the same units and range. If the units of quantification for different ecosystem services are not unified, then directly performing weighted average calculations will be meaningless, as the values of different units cannot accurately reflect their relative importance during the weighting process. Through standardization, it can be ensured that all the values involved in the calculation have the same units and ranges, making the weighted average calculation more accurate and meaningful. Figure 2b shows the spatial distribution patterns of four ecosystem services after standardization processing. Although the spatial distribution of individual ecosystem services does not change after standardization, the relative high and low levels of the four services do change.

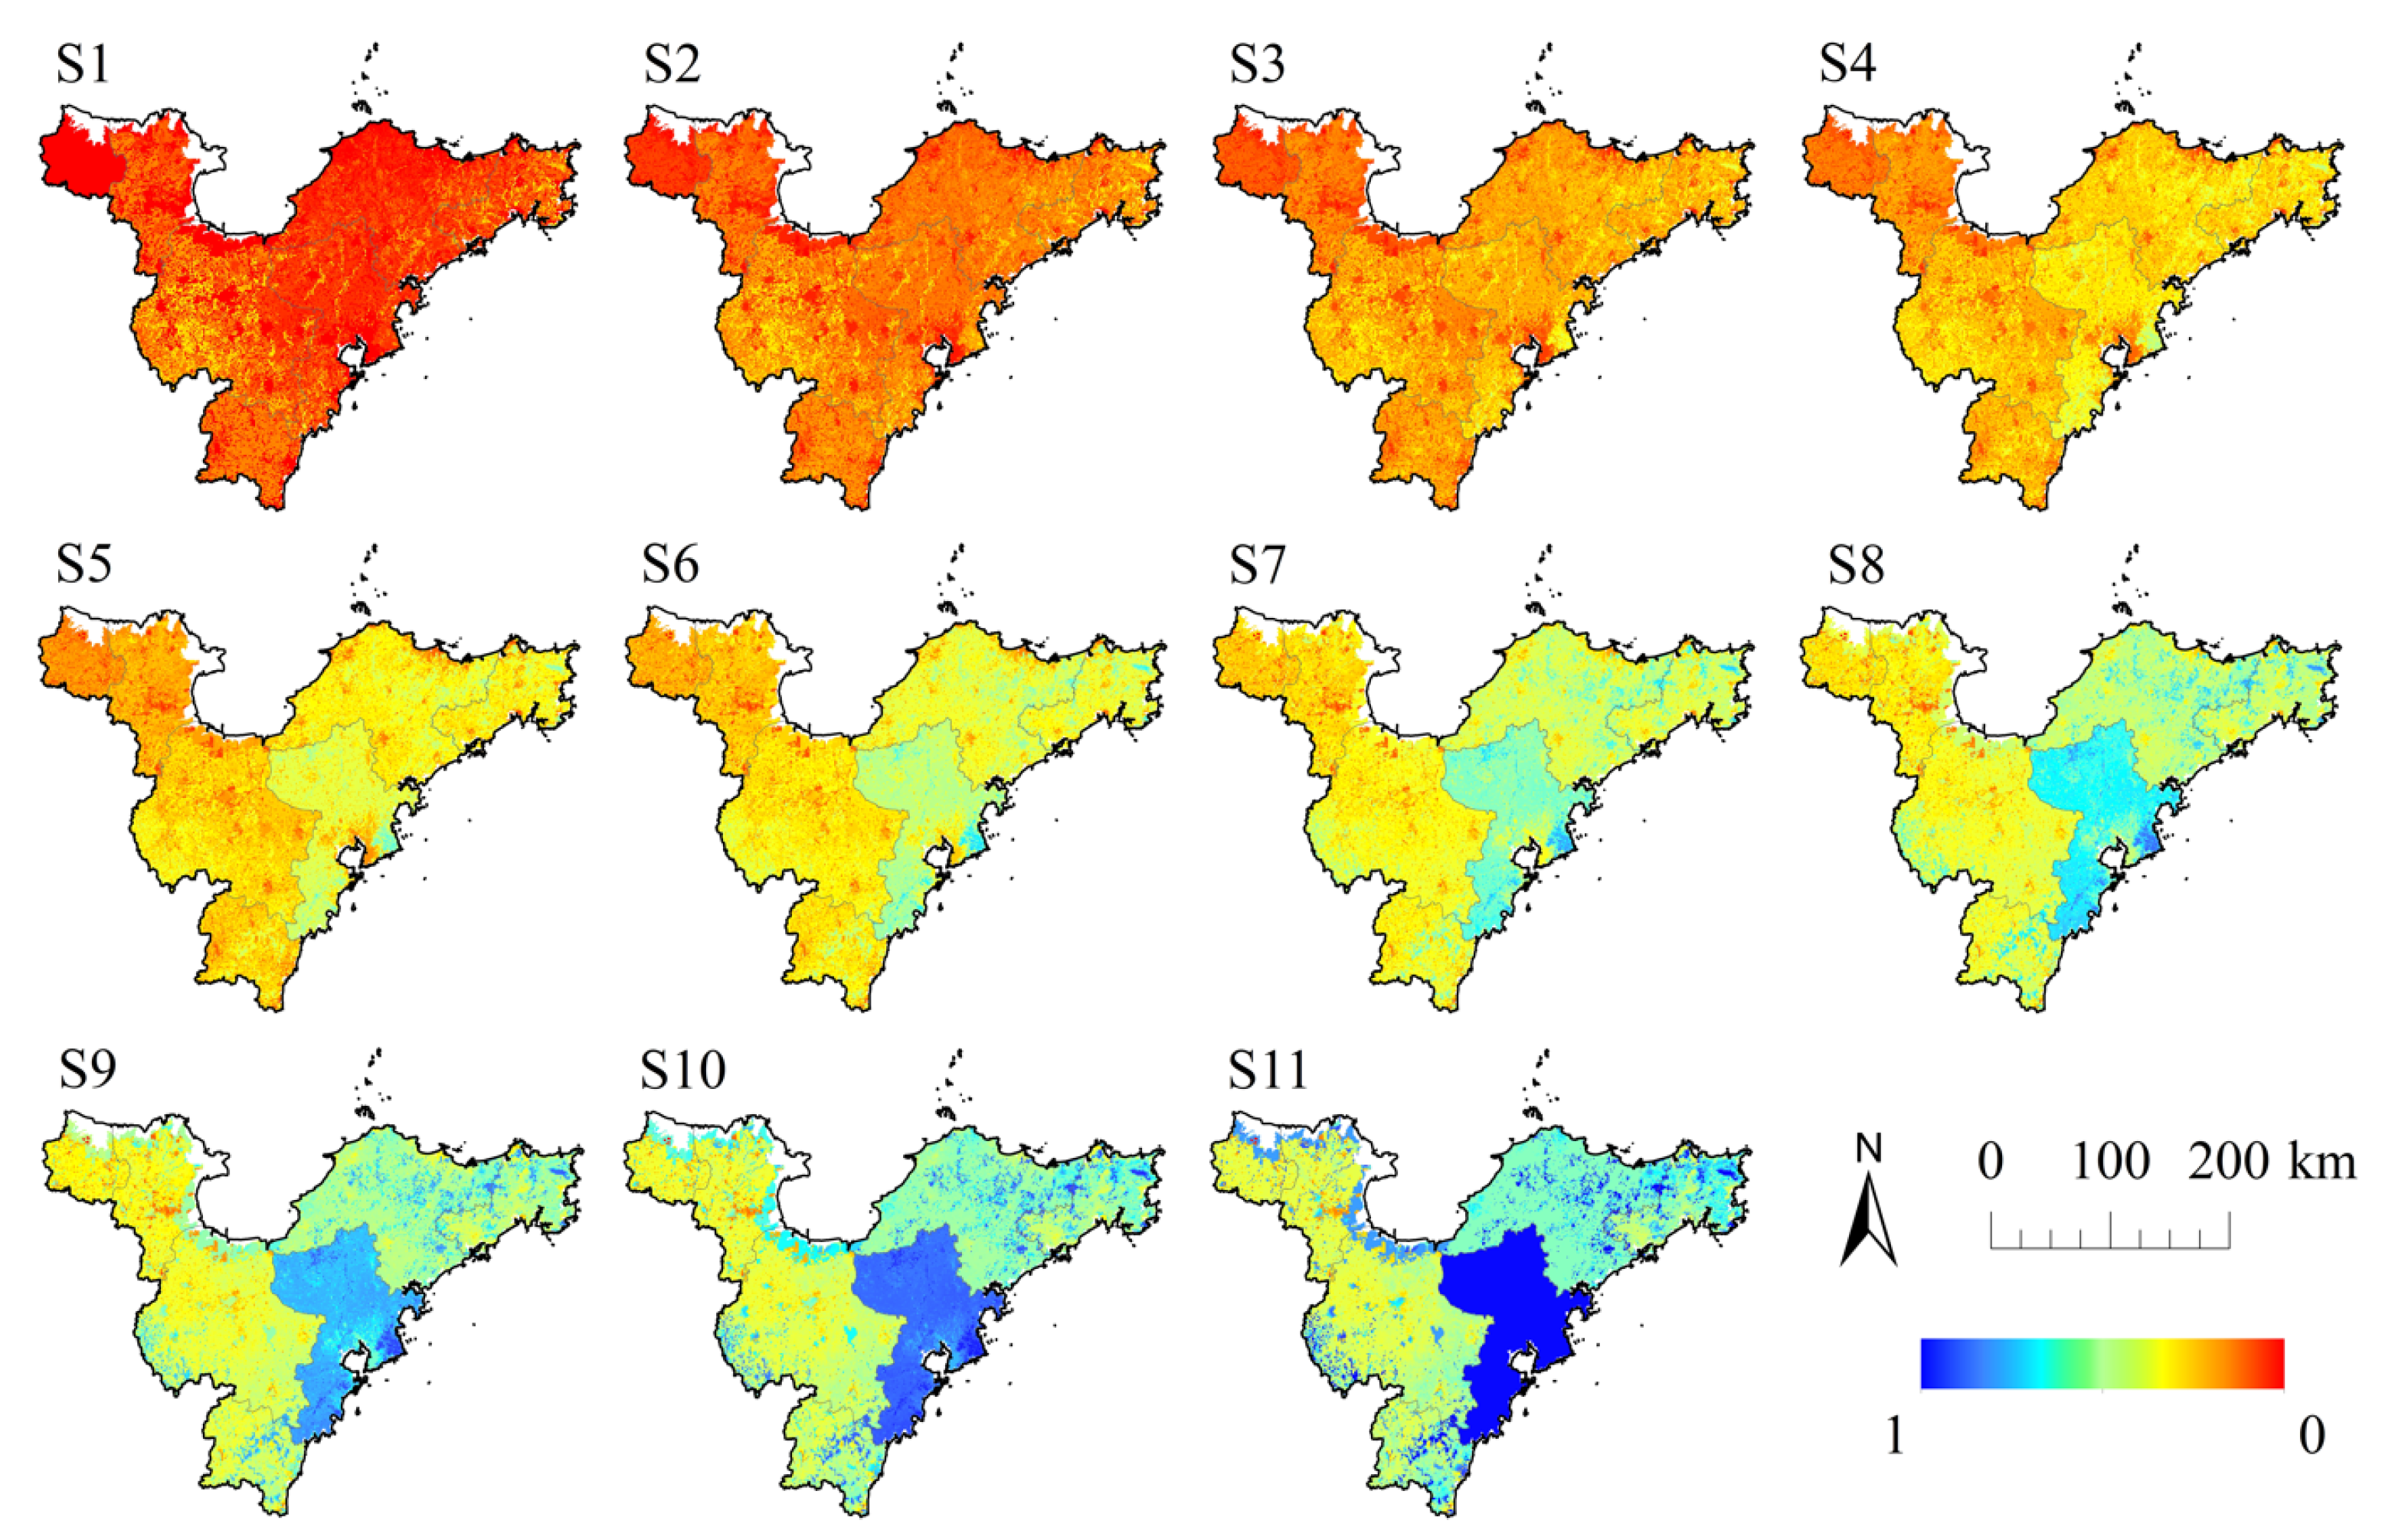
3.2. Spatial Patterns of Ecosystem Services Under Multiple Policy Scenarios

By sequentially applying the four weight values to the four new grid rankings (arranged from highest to lowest for the four types of standardized ecosystem services at the same grid location) and summing them up under each scenario, we can obtain 11 scenarios of the spatial patterns of the weighted average values (Figure 3). In Scenario S1, the weight value for the minimum value of the four service grids is 1, and the others are 0, indicating that only the ecosystem service with the lowest standardized value at a given grid location is considered. Therefore, under this scenario, attention is solely focused on the lowest services, i.e., the lowest service type among the ecosystem services. Conversely, scenario S11 is the opposite, focusing only on the highest service value, i.e., the highest service type among the ecosystem services. It is significant that S1 is very pessimistic, focusing only on the worst service values, leading to policies that are primarily geared towards protection. S11 is very optimistic, focusing only on the highest service values, leading to policies that are primarily geared towards development.

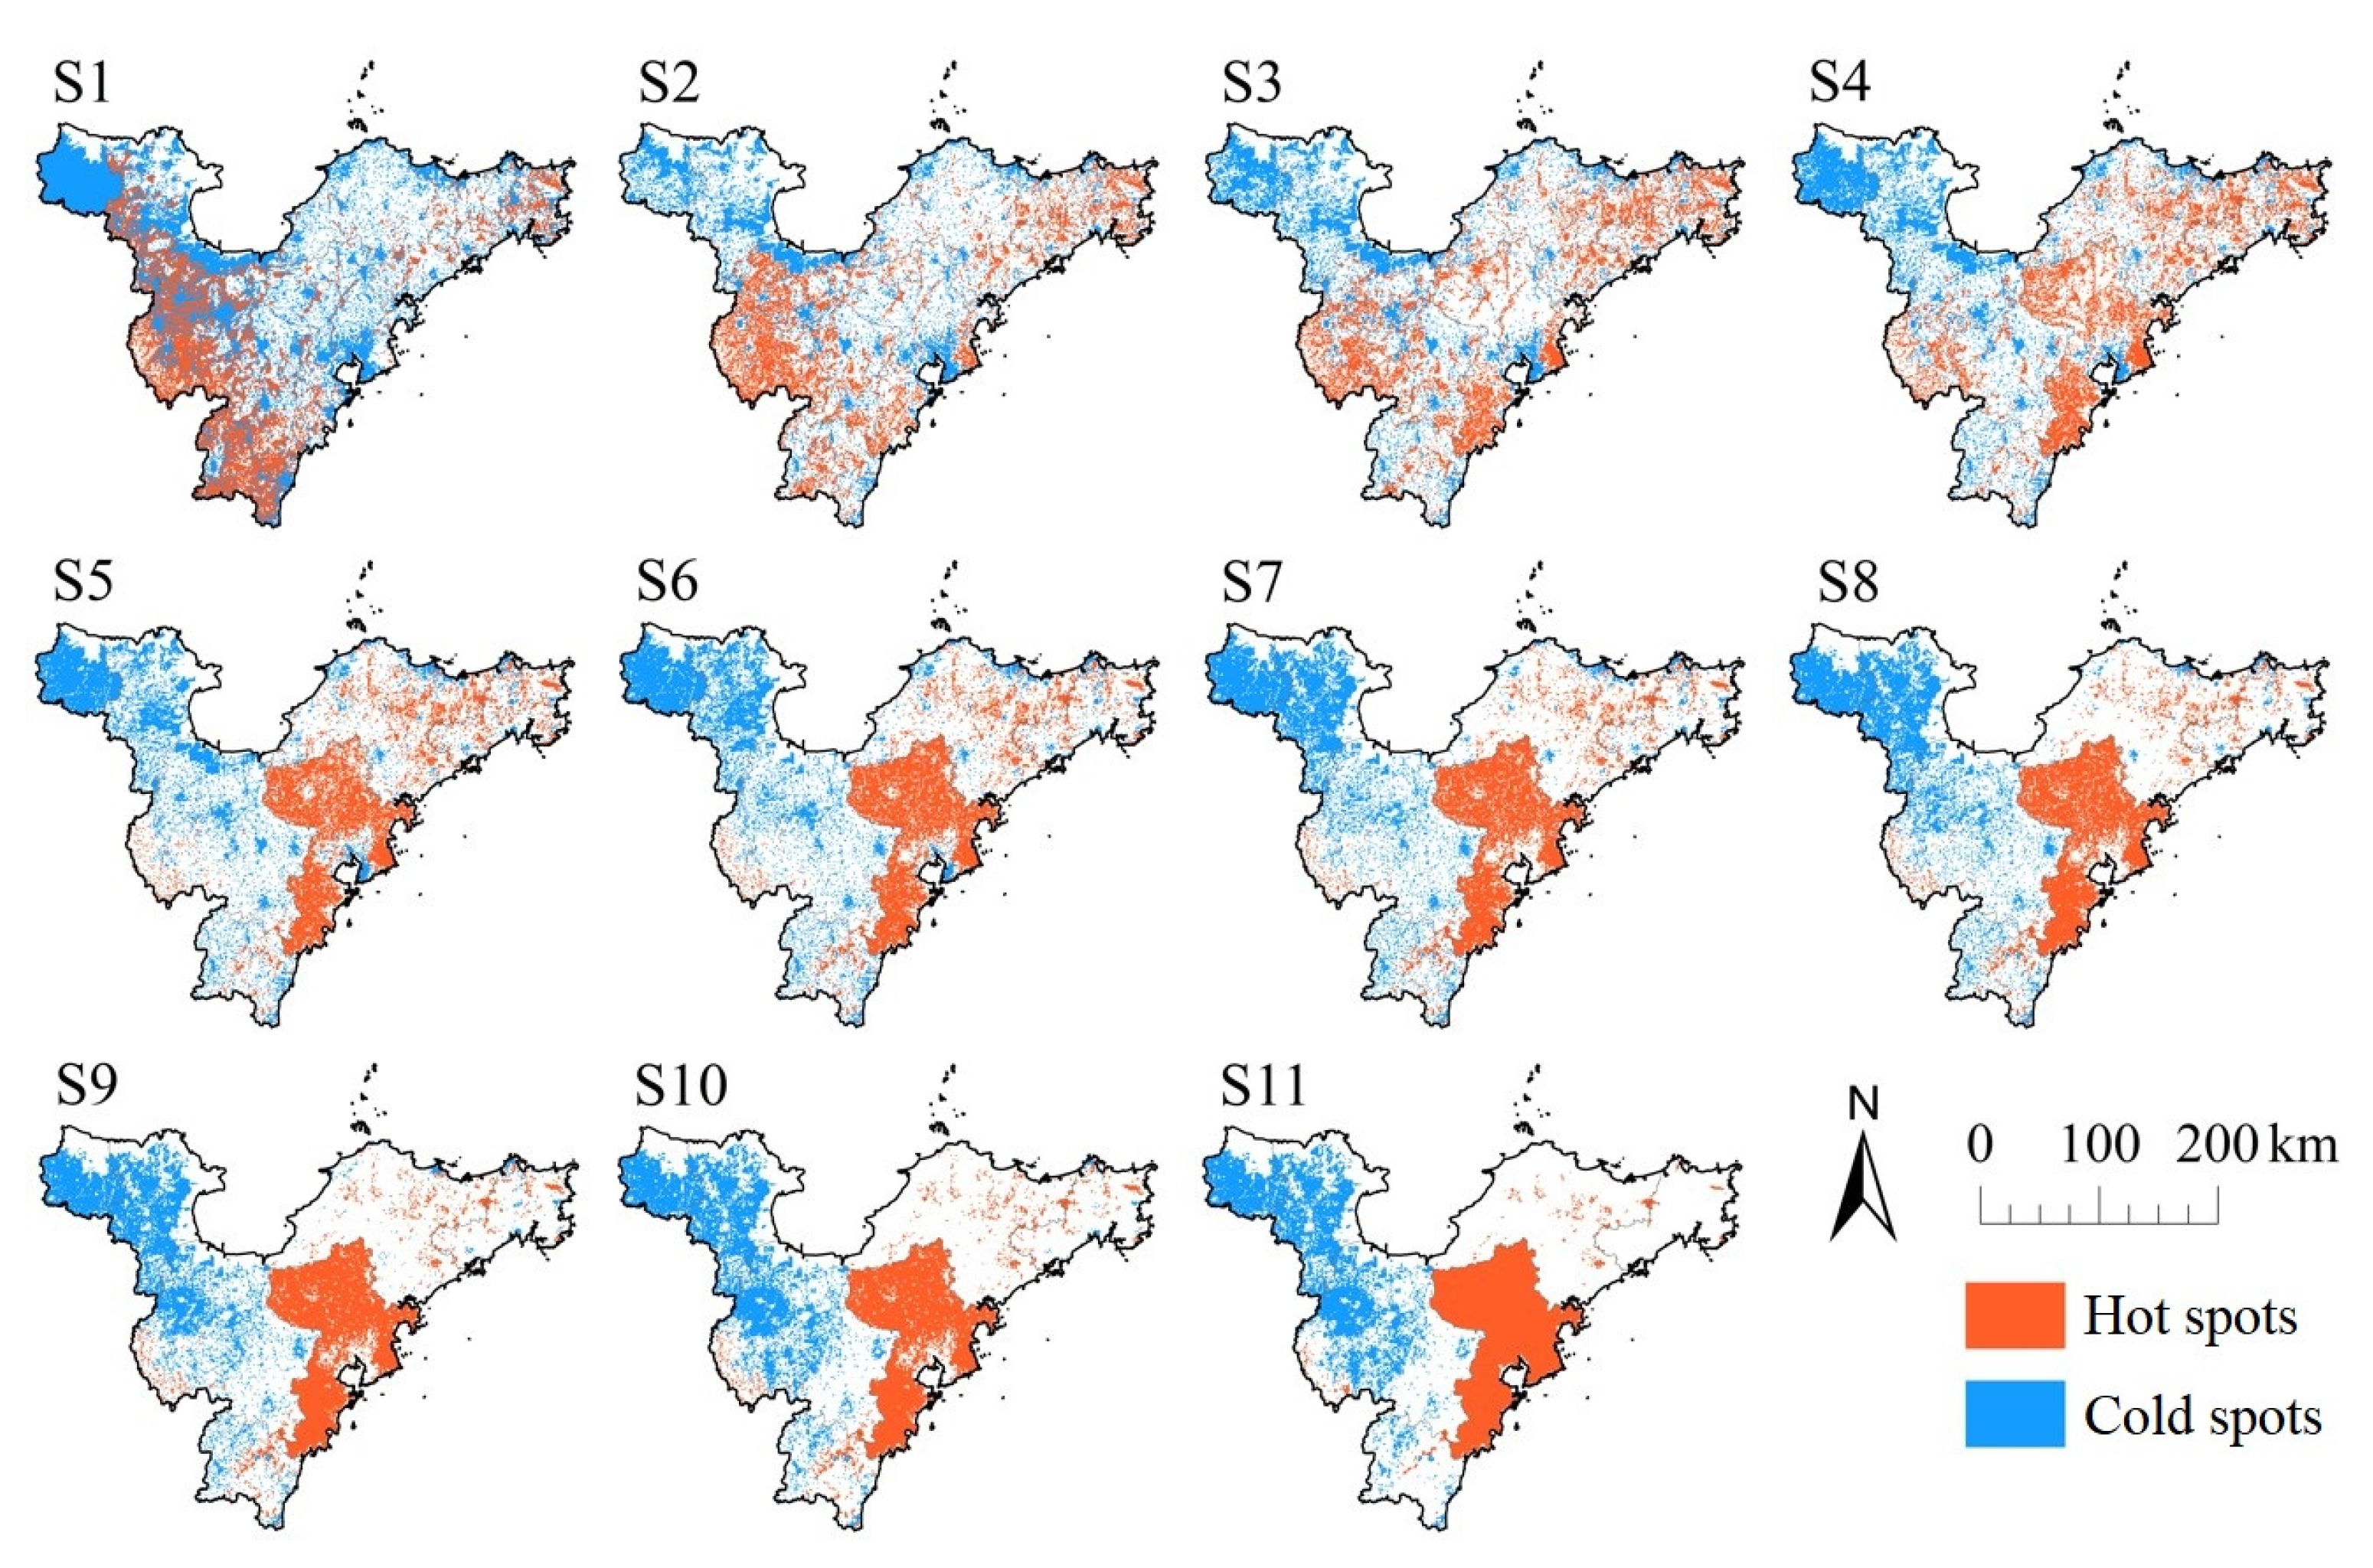
3.3. Identification of Cold Spot and Hotspot Regions Under Each Scenario

As shown in Figure 4, due to the changing weights given to the four types of services in the same region, the spatial distribution of the identified cold spot and hotspot regions under the 11 scenarios varies significantly based on the rule of selecting 20%. For example, under scenario S1, the condition of ecosystem services in the study area focuses solely on the poorest service type. Comparing this to the spatial distribution of normalized ecosystem services, the water yield values are generally lower, and cultural services have the lowest values in the northwest. Therefore, in the ecosystem service ranking under scenario S1, a higher proportion of grids related to water yield and some cultural services is selected. Similarly, the values chosen for ecological assets in the same location will change according to the weights in different scenarios. Under scenario S1, the distribution of cold spot and hotspot regions is the most scattered, with hotspots relatively concentrated in the southwest and cold spots partly clustered in the northwest, closely related to the high values of water yield services in the southwest and low values of cultural services in the northwest. Using the neutral scenario S6 as a reference, the distribution of cold spot and hotspot regions under scenarios S1 to S5 is relatively scattered, while under scenarios S7 to S11, the hotspots show a trend of increasing concentration in the southeast, and the cold spots are sparsely distributed in the western and northwest regions.
From the perspective of each city, the cold spot regions of Weifang City and Dongying City occupy a higher proportion across the scenarios, showing a gradual increase from S1 to S11; the cold spot regions of Qingdao City, Rizhao City, and Weihai City occupy a smaller proportion, showing a gradual decrease from S1 to S11. Qingdao City has an absolute advantage in the proportion of hotspot regions, which shows a gradual increase from S1 to S11; apart from Qingdao, Weifang City also has a relatively high proportion under scenarios S1 to S4, but the proportion of hotspot regions is not optimistic under scenarios S5 to S11. The hotspot regions of Rizhao City, Weihai City, and Dongying City overall occupy a smaller proportion.

3.4. Ecosystem Service Efficiency Assessment

As seen in Table 3, there are significant differences in the protection efficiency of ecosystem services in the cold spot and hotspot regions under each scenario. In the 11 scenarios, the cold spot regions have above-average protection efficiency for water yield services only under the development scenarios (S7–S11), while the protection efficiency for other services under other scenarios is less than 1, meaning it is below the average value of ecosystem services in the study area. This is related to the fact that the low-value areas of water yield services are less likely to be selected under the development scenarios (S7–S11). Among them, the average protection efficiency of the cold spot regions under scenario S3 is the lowest, at just 0.67, indicating that ecosystem services are far below those in other regions, and therefore, the cold spot regions under this scenario should receive special attention.
Under the 11 scenarios, the hotspot regions have good protection efficiency for one or several ecosystem services. Within each hotspot region, carbon sequestration and biodiversity services are higher than the average values of these ecosystem services in the study area. Among these, the best protection efficiency for carbon sequestration services is in scenario 5, with a protection efficiency of 1.27; the highest protection efficiency for water yield services is in scenario 1, with a protection efficiency of 2.02; the highest protection efficiency for biodiversity services is in scenarios 5 and 6, with a protection efficiency of 1.43; and the highest protection efficiency for cultural services is in scenario 11, with a protection efficiency of 1.76. Overall, scenario S3 has the highest average protection efficiency, with S3 corresponding to a risk coefficient of 0.2. Under this scenario, the average protection efficiency in the hotspot regions is 1.35. The hotspot regions under this scenario are mostly located in areas with higher water yield, which is related to the fact that water yield services contribute the most to the total ecosystem services as provisioning services. Under this scenario, the protection efficiencies for water yield, carbon sequestration, biodiversity, and cultural services in the hotspot regions are 1.70, 1.21, 1.35, and 1.15, respectively, all of which are greater than 1, indicating that the hotspot regions for ecosystem services under this scenario have multiple ecosystem services exceeding the average values of multiple ecosystem services in the study area, with high protection efficiencies, thus achieving the effect of co-protection of multiple ecosystem services.

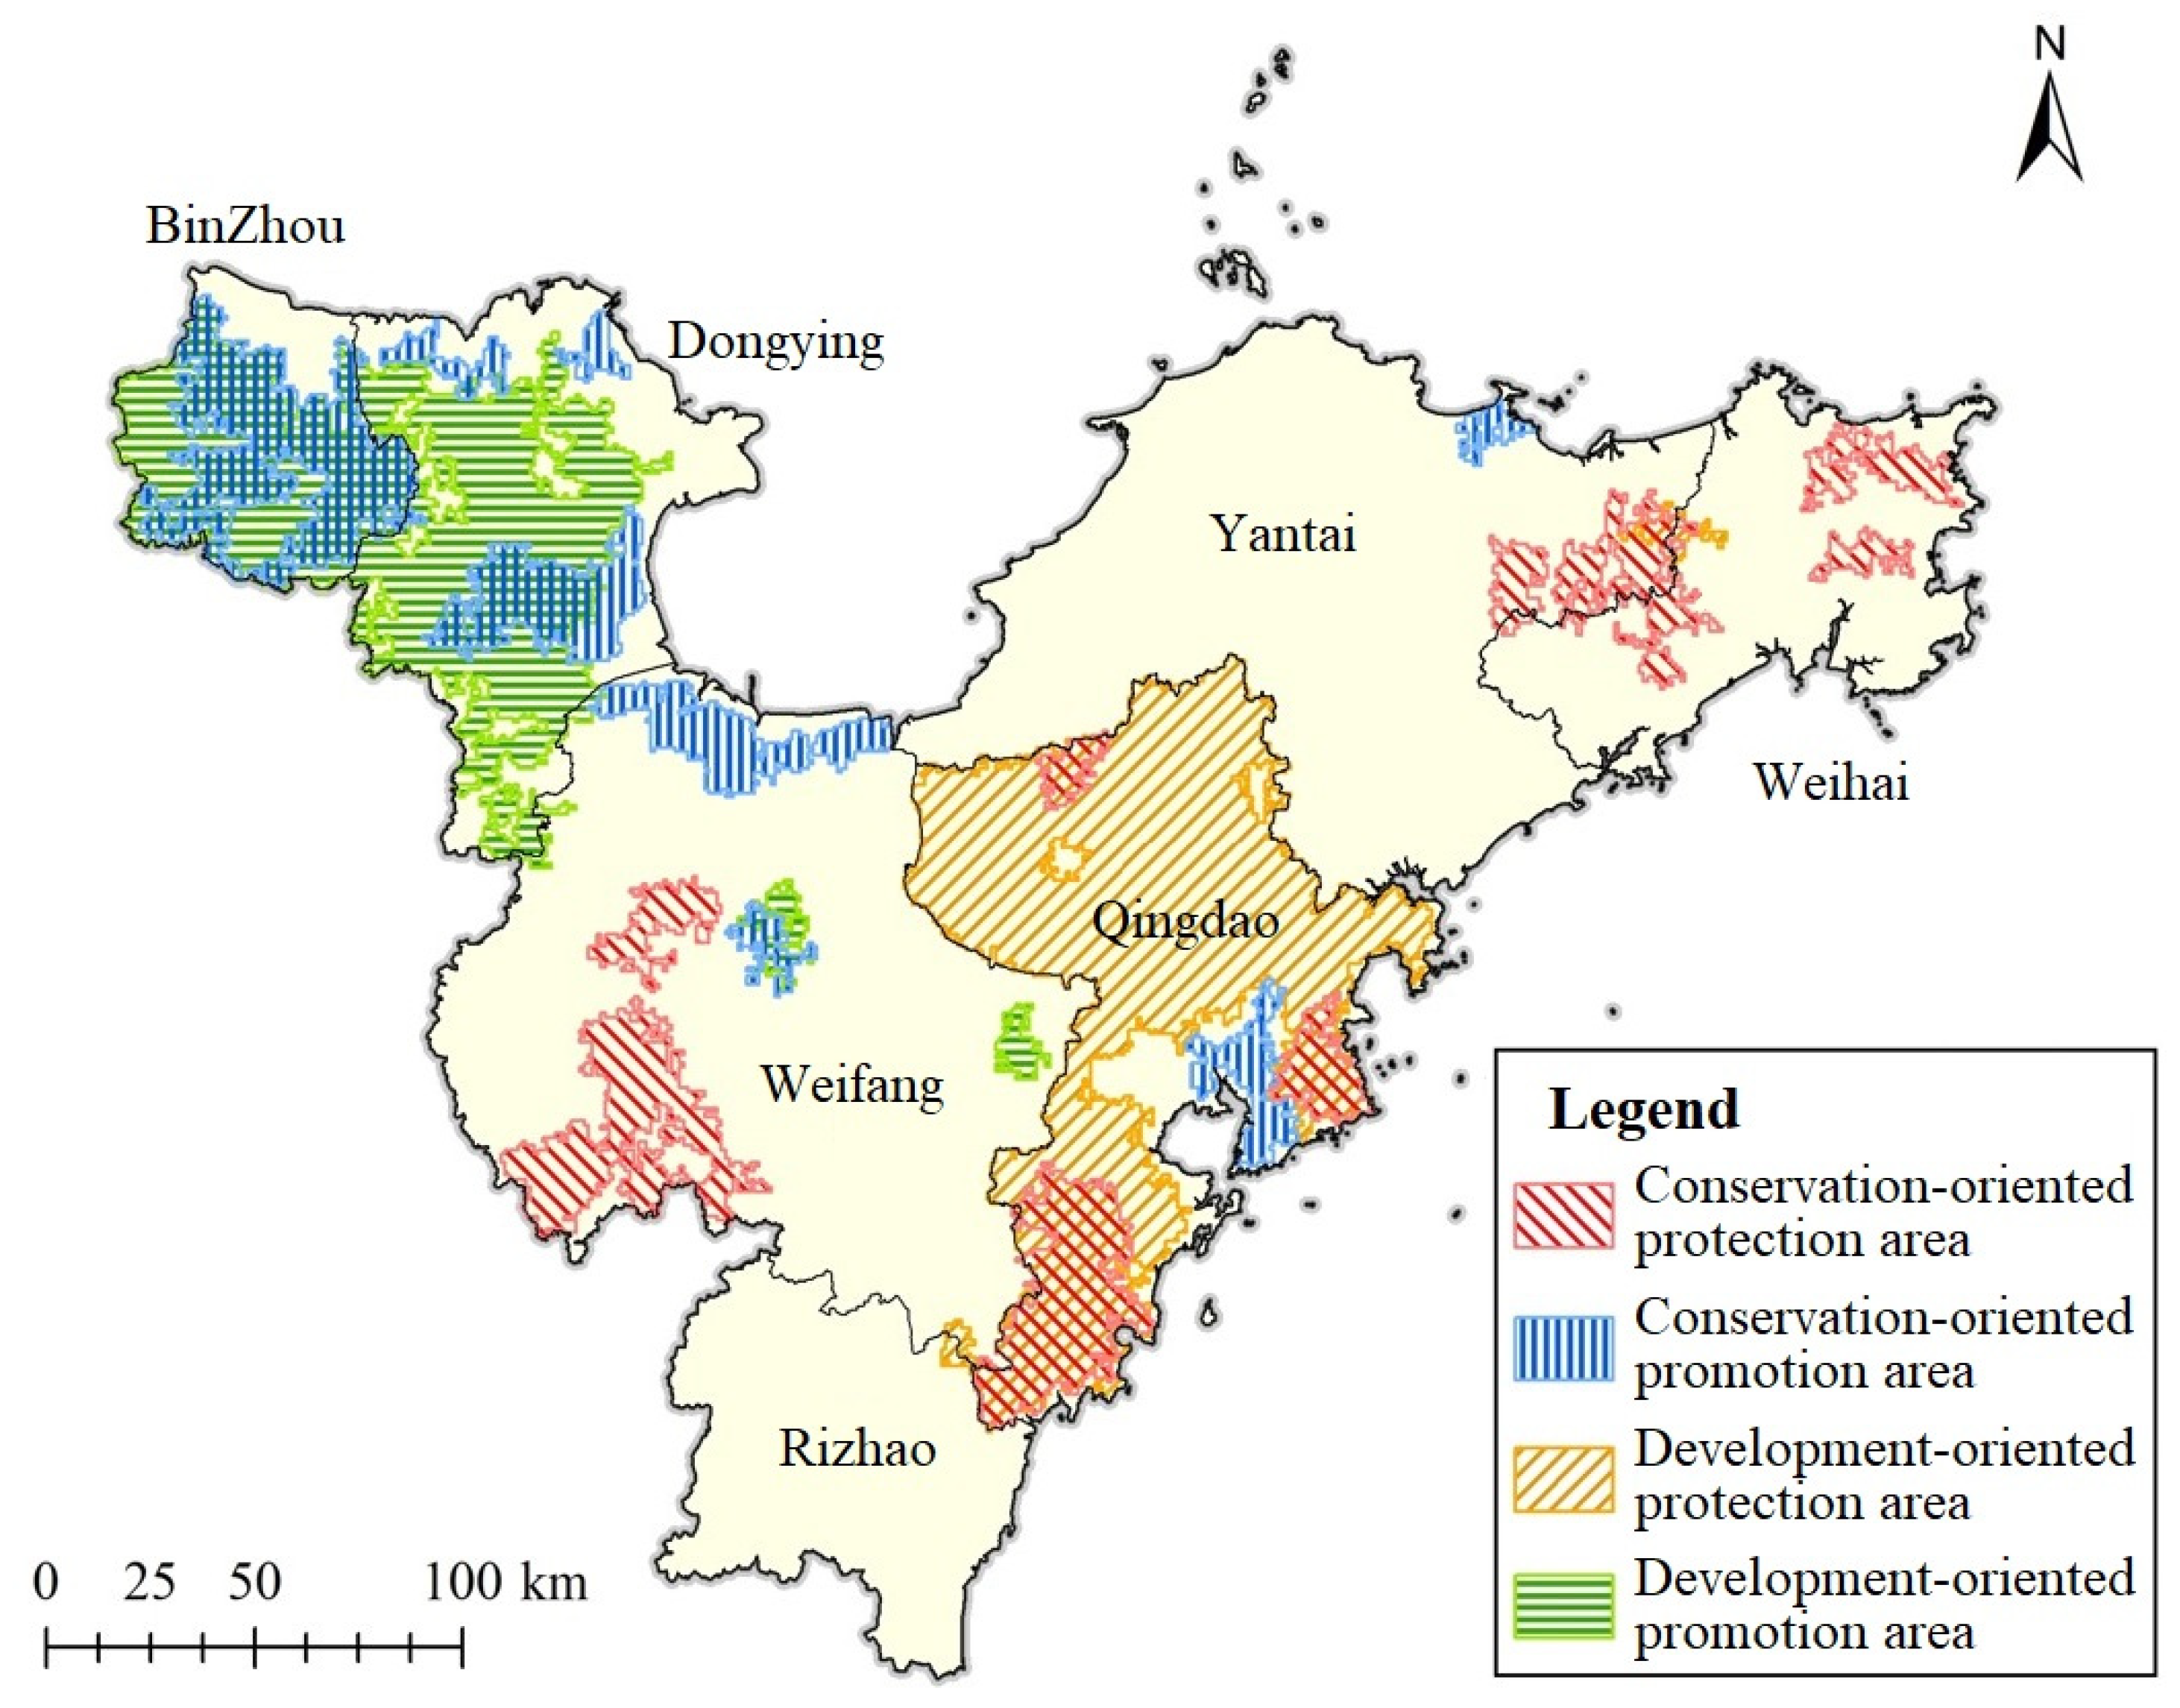
3.5. Spatial Pattern Optimization

To address the varying needs of different decision-makers, this study categorizes decision-making types into conservation-oriented (scenarios S1–S5, low-risk scenarios allowing for the protection of areas with a relatively low level of ecosystem services to the fullest extent possible, which contributes to the overall enhancement of ecosystem services) and development-oriented (scenarios S6–S11, high-risk scenarios necessitating focusing solely on the protection of areas with an already high level of ecosystem services, thereby maximizing the fulfillment of economic development and land development needs), and analyzes the protection efficiency of hotspot and cold spot regions under different decision-making orientations. For the conservation-oriented scenarios, the contiguous grid patches with the highest protection efficiency in the hotspot regions are designated as the conservation-oriented protected areas, which are the regions that decision-makers should focus on managing when they are more inclined towards conservation. For the development-oriented scenarios, the contiguous grid patches with the highest protection efficiency in the hotspot regions are designated as the development-oriented protected areas, which are the regions that decision-makers should focus on managing when they are more inclined towards development. For the conservation-oriented scenarios, the contiguous grid patches with the lowest protection efficiency in the cold spot regions are designated as the conservation-oriented improvement areas, which are the regions that decision-makers should focus on restoring and improving when they are more inclined towards conservation. For the development-oriented scenarios, the contiguous grid patches with the lowest protection efficiency in the cold spot regions are designated as the development-oriented improvement areas, which are the regions that decision-makers should focus on restoring and improving when they are more inclined towards development.
As shown in Figure 5, the conservation-oriented protection area (scenario S3) is mainly distributed in the western part of Weifang City, the southern and eastern coastal areas of Qingdao City, as well as the boundary areas between Weihai City and Yantai City (red part in Figure 5). The main land use type is cropland, with a focus on protecting the higher carbon sequestration, habitat, and cultural services provided by cropland. The development-oriented protection area (scenario S7) is mainly distributed in non-urban areas of Qingdao City, with a focus on protecting the higher cultural services provided by Qingdao City (yellow part in Figure 5). The conservation-oriented promotion area (scenario S3) is mainly distributed in Binzhou City, the southern part of Dongying City, the northern part of Weifang City, and the central area of Qingdao City (blue part in Figure 5). The main land use types are urban, cropland, and water bodies. The development-oriented promotion area (scenario S7) is mainly distributed in the central–western and southern parts of Dongying City (green part in Figure 5), with the main land use types being cropland and urban areas. When decision-makers opt for a conservation or development orientation, these regions should consider ecological restoration and enhancement to reach the average local ecosystem service levels.
A detailed analysis of the land use classification results for both cold spot and hotspot regions is conducted under different scenarios. The findings show that protecting cropland and forest land within the study area, as well as promoting the land use structure, play crucial roles in enhancing ecosystem services. Specifically, the land use classification results for the cold spot regions under different scenarios (Figure 6) indicate that urban and cropland use have the largest proportions. In the cold spot regions across the scenarios, the proportions of urban land and water bodies decrease gradually from scenario S2 to S11, while the proportion of cropland increases gradually from scenario S2 to S11. Forest land, grassland, and unused land have small proportions in the cold spot regions under each scenario. According to the land use classification results for the hotspot regions under different scenarios, cropland has the largest proportion, followed by forest land, except in scenario S11. The land use statistics also indicate that under various scenarios, cropland and forest land can provide higher ecosystem services, whereas unused land and urban land are less likely to provide a high level of ecosystem services.

4. Discussion

Multi-criteria decision-making is an essential component of the decision problems faced by policymakers in today’s socio-economic environment [40]. Its theories and methods span a wide range of fields, including economics, engineering, management, and evaluation. Multi-criteria decision-making uses existing necessary information to rationally select and rank limited options. The ordered weighted averaging (OWA) decision method is one of the commonly used methods in multi-criteria decision-making. OWA provides a tool that allows for exploring a range of aggregation rules using different levels of risk coefficients and trade-off degrees. On this basis, decision-makers can evaluate all decision scenarios and select the one that best suits their needs and expectations. Using the OWA operator for selection, theoretically, any scenario can be established, demonstrating significant flexibility and comprehensiveness. Generally, a decision-maker’s absolute protective stance or absolute developmental stance is rarely adopted in actual policymaking, but the spatial patterns and protection efficiencies of the cold spot and hotspot regions identified under these extreme scenarios can provide important references for policy formulation under absolute conditions.
This paper uses a high protection efficiency goal orientation as an example to select cold spot and hotspot regions, where the hotspot regions can typically serve as a reference for optimal protected area locations, and the cold spot regions can serve as a reference for improvement areas. Multi-criteria decision-making, based on multiple scenario settings, not only provides cold spot and hotspot identification, a reference for protected area locations, and improvement in area selections, but is also widely applied in simulating regional ecological security patterns and ecological risk assessments. Some scholars have used multi-criteria decision-making methods to identify the spatial distribution of development priority areas under different scenarios, with the results based on the criteria aggregation results when risk = 0.3, 0.5, and 0.7, dividing the area into three different types representing protection, neutrality, and development as dominant policies. In summary, the multi-criteria decision-making method can provide scientific data references under different decision-making objectives, offering comparative analyses and reflecting decision-making attitudes. Therefore, it is a fairly viable research method when choosing policies for regulating ecosystem services and ecological assets.

5. Conclusions

With the deepening of research on human–land relationships, ecosystem services are increasingly used in regional sustainability assessments. Establishing the Blue Economic Zone of the Shandong Peninsula is a significant national strategy. As a marine–terrestrial ecosystem, the study area is complex, making its ecosystem services, which integrate human and natural elements, particularly important. This study employed multiple data sources and methods, including software analysis and survey questionnaires, to conduct a basic assessment of the ecosystem services in the study area. To provide a stronger scientific basis for relevant policies, 11 scenarios were delineated, and multi-criteria decision-making methods were used to identify cold spot and hotspot regions in the study area, thereby enabling judgments about high ecological efficiency-oriented cold spot and hotspot regions. Hotspot regions, due to their ability to have high protection efficiency for multiple ecosystem services, are more suitable for establishing protected areas, achieving the co-protection of multiple services while conserving human and material resources. Cold spot regions, due to their low protection efficiency for multiple ecosystem services, are areas where ecosystem services are relatively weak. In addition to protection, they may require artificial intervention to enhance the capacity of ecosystem services in these areas and prevent deterioration. The outcomes of this study can provide strategic support for the ecological sustainability of the Blue Economic Zone of the Shandong Peninsula, and the methods adopted can also serve as a useful reference for related research.

Supplementary Materials

The following supporting information can be downloaded at: https://www.mdpi.com/article/10.3390/land13111964/s1, S1: Questionnaire design and processing; S2: Questionnaire used to investigate cultural services.

Author Contributions

Conceptualization, J.L. and G.X.; methodology, J.L. and K.Q.; software, K.Q.; validation, G.X. and Y.X.; writing—original draft preparation, J.L.; writing—review and editing, K.Q. and Y.X.; funding acquisition, J.L. and K.Q. All authors have read and agreed to the published version of the manuscript.

Funding

This research was funded by National Natural Science Foundation of China, grant number 42101312, and the Open Research Fund of the Key Laboratory of Coastal Science and Integrated Management, Ministry of Natural Resources, grant number 2021COSIMQ003.

Data Availability Statement

The data presented in this study are available on request from the corresponding author.

Conflicts of Interest

The authors declare no conflicts of interest.

Abbreviations

MAMillennium Ecosystem Assessment
OWAOrdered weighted average
DEMDigital elevation model
NPPNet primary productivity
CASACarnegie–Ames–Stanford approach
APARAbsorbed photosynthetically active radiation
InVESTIntegrated Valuation of Ecosystem Services and Trade-offs
SolVESSocial Values for Ecosystem Services
GISGeographic information system

References

  1. Bukhard, B.; Kroll, F.; Nedkov, S.; Müller, F. Mapping ecosystem services supply, demand and budgets. Ecol. Indic. 2012, 21, 17–29. [Google Scholar] [CrossRef]
  2. Metzger, J.P.; Villarreal-Rosas, J.; Suárez-Castro, A.F.; López-Cubillos, S.; González-Chaves, A.; Runting, R.K.; Hohlenwerger, C.; Rhodes, J.R. Considering landscape-level processes in ecosystem service assessments. Sci. Total Environ. 2021, 796, 149028. [Google Scholar] [CrossRef] [PubMed]
  3. The Millennium Ecosystem Assessment. Millennium Ecosystem Assessment: Ecosystems and Human Well-Being; World Resources Institute: Washington, DC, USA, 2005. [Google Scholar]
  4. Costanza, R. Ecosystem services: Multiple classification systems are needed. Biol. Conserv. 2008, 141, 350–352. [Google Scholar] [CrossRef]
  5. Xie, G.; Liu, J.; Xu, J.; Xiao, Y.; Zhen, L.; Zhang, C.; Wang, Y.; Qin, K.; Gan, S.; Jiang, Y. A spatio-temporal delineation of trans-boundary ecosystem service flows from Inner Mongolia. Environ. Res. Lett. 2019, 14, 065002. [Google Scholar] [CrossRef]
  6. Liu, J.; Qin, K.; Xie, G.; Xiao, Y.; Huang, M.; Gan, S. Is the ‘water tower’reassuring? Viewing water security of Qinghai-Tibet Plateau from the perspective of ecosystem services ‘supply-flow-demand’. Environ. Res. Lett. 2022, 17, 094043. [Google Scholar] [CrossRef]
  7. Liu, J.; Qin, K.; Zhen, L.; Xiao, Y.; Xie, G. How to allocate interbasin water resources? A method based on water flow in water-deficient areas. Environ. Dev. 2020, 34, 100460. [Google Scholar] [CrossRef]
  8. Mandle, L.; Shields-Estrada, A.; Chaplin-Kramer, R.; Mitchell, M.G.E.; Bremer, L.L.; Gourevitch, J.D.; Hawthorne, P.; Johnson, J.A.; Robinson, B.E.; Smith, J.R.; et al. Increasing decision relevance of ecosystem service science. Nat. Sustain. 2021, 4, 161–169. [Google Scholar] [CrossRef]
  9. Liu, J.; Qin, K.; Xie, G. The effects and influencing variables based on “supply-direction-demand” flow processing: Water provisioning services of Inner Mongolia’s ecological shelters. Land Degrad. Dev. 2024, 35, 3490–3505. [Google Scholar] [CrossRef]
  10. Loomes, R.; O’Neill, K. Nature’s Services: Societal Dependence on Natural Ecosystems. Pac. Conserv. Biol. 1997, 6, 220–221. [Google Scholar] [CrossRef]
  11. Gómez-Baggethun, E.; Barton, D.N. Classifying and valuing ecosystem services for urban planning. Ecol. Econ. 2013, 86, 235–245. [Google Scholar] [CrossRef]
  12. Liu, J.; Li, J.; Qin, K.; Zhou, Z.; Yang, X.; Li, T. Changes in land-uses and ecosystem services under multi-scenarios simulation. Sci. Total Environ. 2017, 586, 522–526. [Google Scholar] [CrossRef] [PubMed]
  13. Hou, Y.; Lü, Y.; Chen, W.; Fu, B. Temporal variation and spatial scale dependency of ecosystem service interactions: A case study on the central Loess Plateau of China. Landsc. Ecol. 2017, 32, 1201–1217. [Google Scholar] [CrossRef]
  14. Thomas, C.D.; Anderson, B.J.; Moilanen, A.; Eigenbrod, F.; Heinemeyer, A.; Quaife, T.; Roy, D.B.; Gillings, S.; Armsworth, P.R.; Gaston, K.J. Reconciling biodiversity and carbon conservation. Ecol. Lett. 2012, 16, 39–47. [Google Scholar] [CrossRef] [PubMed]
  15. Rodríguez, N.; Armenteras, D.; Retana, J. National ecosystems services priorities for planning carbon and water resource man-agement in Colombia. Land Use Policy 2015, 42, 609–618. [Google Scholar] [CrossRef]
  16. Qin, K.; Li, J.; Yang, X. Trade-Off and Synergy among Ecosystem Services in the Guanzhong-Tianshui Economic Region of China. Int. J. Environ. Res. Public Health 2015, 12, 14094–14113. [Google Scholar] [CrossRef]
  17. Barrena, J.; Nahuelhual, L.; Báez, A.; Schiappacasse, I.; Cerda, C. Valuing cultural ecosystem services: Agricultural heritage in Chiloe island, southern Chile. Ecosyst. Serv. 2014, 2014, 66–75. [Google Scholar] [CrossRef]
  18. Malinga, R.; Gordon, L.J.; Jewitt, G.; Lindborg, R. Mapping ecosystem services across scales and continents—A review. Ecosyst. Serv. 2015, 13, 57–63. [Google Scholar] [CrossRef]
  19. Lyu, R.; Clarke, K.C.; Zhang, J.; Feng, J.; Jia, X.; Li, J. Dynamics of spatial relationships among ecosystem services and their determinants: Implications for land use system reform in Northwestern China. Land Use Policy 2021, 102, 105231. [Google Scholar] [CrossRef]
  20. Iniesta-Arandia, I.; García-Llorente, M.; Aguilera, P.A.; Montes, C.; Martín-López, B. Socio-cultural valuation of ecosystem services: Uncovering the links between values, drivers of change, and human well-being. Ecol. Econ. 2014, 108, 36–48. [Google Scholar] [CrossRef]
  21. Pleasant, M.M.; Gray, S.A.; Lepczyk, C.; Fernandes, A.; Hunter, N.; Ford, D. Managing cultural ecosystem services. Ecosyst. Serv. 2014, 8, 141–147. [Google Scholar] [CrossRef]
  22. Sherrouse, B.C.; Semmens, D.J.; Clement, J.M. An application of Social Values for Ecosystem Services (SolVES) to three national forests in Colorado and Wyoming. Ecol. Indic. 2014, 36, 68–79. [Google Scholar] [CrossRef]
  23. Zhao, Y.; Wang, M.; Lan, T.; Xu, Z.; Wu, J.; Liu, Q.; Peng, J. Distinguishing the effects of land use policies on ecosystem services and their trade-offs based on multi-scenario simulations. Appl. Geogr. 2023, 151, 102864. [Google Scholar] [CrossRef]
  24. Ding, X.; Jian, S. Synergies and trade-offs of ecosystem services affected by land use structures of small watershed in the Loess Plateau. J. Environ. Manag. 2024, 350, 119589. [Google Scholar] [CrossRef] [PubMed]
  25. Feng, Q.; Zhao, W.; Hu, X.; Liu, Y.; Daryanto, S.; Cherubini, F. Trading-off ecosystem services for better ecological restoration: A case study in the Loess Plateau of China. J. Clean. Prod. 2020, 257, 120469. [Google Scholar] [CrossRef]
  26. Qin, K.; Li, J.; Liu, J.; Yan, L.; Huang, H. Setting conservation priorities based on ecosystem services—A case study of the Guanzhong-Tianshui Economic Region. Sci. Total Environ. 2019, 650, 3062–3074. [Google Scholar] [CrossRef] [PubMed]
  27. Pan, J.; Wei, S.; Li, Z. Spatiotemporal pattern of trade-offs and synergistic relationships among multiple ecosystem services in an arid inland river basin in NW China. Ecol. Indic. 2020, 114, 106345. [Google Scholar] [CrossRef]
  28. Yohannes, H.; Soromessa, T.; Argaw, M.; Dewan, A. Impact of landscape pattern changes on hydrological ecosystem services in the Beressa watershed of the Blue Nile Basin in Ethiopia. Sci. Total. Environ. 2021, 793, 148559. [Google Scholar] [CrossRef] [PubMed]
  29. Syrbe, R.-U.; Walz, U. Spatial indicators for the assessment of ecosystem services: Providing, benefiting and connecting areas and landscape metrics. Ecol. Indic. 2012, 21, 80–88. [Google Scholar] [CrossRef]
  30. Yan, X.; Huang, M.; Tang, Y.; Guo, Q.; Wu, X.; Zhang, G. Study on the Dynamic Change of Land Use in Megacities and Its Impact on Ecosystem Services and Modeling Prediction. Sustainability 2024, 16, 5364. [Google Scholar] [CrossRef]
  31. Jiang, W.; Gao, G.; Wu, X.; Lv, Y. Assessing Temporal Trade-Offs of Ecosystem Services by Production Possibility Frontiers. Remote Sens. 2023, 15, 749. [Google Scholar] [CrossRef]
  32. Luo, Y.; Guo, X.; Lü, Y.; Zhang, L.; Li, T. Combining spatiotemporal interactions of ecosystem services with land patterns and processes can benefit sensible land-scape management in dryland regions. Sci. Total Environ. 2024, 909, 168485. [Google Scholar] [CrossRef] [PubMed]
  33. Peng, L.; Chen, T.; Deng, W.; Liu, Y. Exploring ecosystem services trade-offs using the Bayesian belief network model for ecological restoration decision-making: A case study in Guizhou Province, China. Ecol. Indic. 2022, 135, 108569. [Google Scholar] [CrossRef]
  34. Myers, N. Threatened biotas: “Hot spots” in tropical forests. Environmentalist 1988, 8, 187–208. [Google Scholar] [CrossRef] [PubMed]
  35. Gos, P.; Lavorel, S. Stakeholders’ expectations on ecosystem services affect the assessment of ecosystem services hotspots and their congruence with biodiversity. Ecosyst. People 2012, 8, 93–106. [Google Scholar] [CrossRef]
  36. Spanò, M.; Leronni, V.; Lafortezza, R.; Gentile, F. Are ecosystem service hotspots located in protected areas? Results from a study in Southern Italy. Environ. Sci. Policy 2017, 73, 52–60. [Google Scholar] [CrossRef]
  37. Schröter, M.; Remme, R.P. Spatial prioritisation for conserving ecosystem services: Comparing hotspots with heuristic optimisation. Landsc. Ecol. 2016, 31, 431–450. [Google Scholar] [CrossRef]
  38. Zhou, G.; Huan, Y.; Wang, L.; Zhang, R.; Liang, T.; Zhang, C.; Wang, S. Identifying synergies and hotspots of ecosystem services for the conservation priorities in the Asian Water Tower region. Reg. Environ. Chang. 2023, 23, 1–12. [Google Scholar] [CrossRef]
  39. Schröter, M.; Kraemer, R.; Ceauşu, S.; Rusch, G.M. Incorporating threat in hotspots and coldspots of biodiversity and ecosystem services. Ambio 2017, 46, 756–768. [Google Scholar] [CrossRef]
  40. Yager, R. On ordered weighted averaging aggregation operators in multicriteria decision making. IEEE Trans. Syst. Man Cybern. 1988, 18, 183–190. [Google Scholar] [CrossRef]
  41. Li, H.; Ma, Z.; Zhu, Y.; Liu, Y.; Yang, X. Planning and prioritizing forest landscape restoration within megacities using the ordered weighted averaging operator. Ecol. Indic. 2020, 116, 106499. [Google Scholar] [CrossRef]
  42. Malczewski, J.; Chapman, T.; Flegel, C.; Walters, D.; Shrubsole, D.; Healy, M.A. GIS—Multicriteria Evaluation with Ordered Weighted Averaging (OWA): Case Study of Developing Watershed Management Strategies. Environ. Plan. A Econ. Space 2003, 35, 1769–1784. [Google Scholar] [CrossRef]
  43. Kiker, G.A.; Bridges, T.S.; Varghese, A.; Seager, T.P.; Linkov, I. Application of multicriteria decision analysis in environmental decision making. Integr. Environ. Assess. Manag. 2005, 1, 95–108. [Google Scholar] [CrossRef] [PubMed]
  44. Tsonkova, P.; Quinkenstein, A.; Böhm, C.; Freese, D.; Schaller, E. Ecosystem services assessment tool for agroforestry (ESAT-A): An approach to assess selected ecosystem services provided by alley cropping systems. Ecol. Indic. 2014, 45, 285–299. [Google Scholar] [CrossRef]
  45. Wang, J.; Xing, Y.; Chang, X.; Yang, H.; Yang, C.; Xue, G.; Li, C. Identification of priority conservation areas for Natural Forest Protection Project in Northeastern China based on OWA-GIS. Ecol. Indic. 2024, 160, 111718. [Google Scholar] [CrossRef]
Figure 1. Study area.
Land 13 01964 g001
Figure 2. Spatial distribution of various ecosystem services. Note: (a) represents the actual evaluation value, and (b) represents the standardized evaluation value.
Land 13 01964 g002
Figure 3. Spatial distribution of ecosystem services under different decision-making scenarios.
Land 13 01964 g003
Figure 4. Spatial distribution of cold spots and hotspots under multiple scenarios.
Land 13 01964 g004
Figure 5. Protection and promotion of regional distribution under different decision-making tendencies.
Land 13 01964 g005
Figure 6. Classification of land use in cold spots and hotspots.
Land 13 01964 g006
Table 1. Required data and data sources.
Service TypesWater Yield
(mm)
Carbon
Sequestration
(kg/km2)
Biodiversity
(Dimensionless)
Aesthetics and Scientific
Research
(Dimensionless)
Data Sources
Remote sensing
imagery
Landsat 8
DEM Shuttle Radar Topography Mission
Land use Resources and Environmental Science Data Center
Soil type World Soil Database
Evapotranspiration China Meteorological Data Service Centre
Temperature China Meteorological Data Service Centre
Precipitation China Meteorological Data Service Centre
Solar radiation China Meteorological Data Service Centre
Slope DEM extraction
Mountain
shading
DEM extraction
Distance to rivers Buffer analysis
Distance to
water bodies
Buffer analysis
Cognitive level Questionnaire survey
Calculation methodInVESTCASAInVESTSolVES
Note: “○” represents required data.
Table 2. The value of trade-off and weigh under the scenarios.
Protection ←Neutral→ Development
Decision scenarioS1S2S3S4S5S6S7S8S9S10S11
Risk level00.10.20.30.40.50.60.70.80.91
w100.010.050.10.170.250.350.460.60.761
w200.040.110.170.210.250.270.280.250.180
w300.180.250.280.270.250.210.170.110.040
w410.760.60.460.350.250.170.10.050.010
ω
Trade-off level
00.370.570.710.8610.860.710.570.370
Note: S1 to S11 represents the different decision scenarios, and w1 to w4 represent the different weights of each ordered raster.The “←” arrow indicate that as the scenario number decreases, the decision tends more towards protection; the “→” arrow indicate that as the scenario number increases, the decision tends more towards development.
Table 3. Protection efficiency under the scenarios.
ServiceWater YieldCarbon SequestrationBiodiversityAesthetics and Scientific ResearchAverage
ScenarioCold SpotHotspotCold SpotHotspotCold SpotHotspotCold SpotHotspotCold SpotHotspot
S10.892.020.711.090.671.140.900.780.791.26
S20.761.970.531.140.551.230.880.970.681.33
S30.821.700.541.210.581.350.761.150.671.35
S40.871.310.561.260.601.410.671.390.681.34
S50.920.860.561.270.611.430.631.610.681.29
S60.980.750.611.250.571.430.591.660.691.27
S71.020.720.681.240.581.410.541.690.711.27
S81.070.730.701.230.591.360.541.720.721.26
S91.120.730.701.200.631.270.541.750.751.24
S101.240.720.721.200.701.260.541.760.801.24
S111.270.660.721.090.751.030.541.870.821.16
Disclaimer/Publisher’s Note: The statements, opinions and data contained in all publications are solely those of the individual author(s) and contributor(s) and not of MDPI and/or the editor(s). MDPI and/or the editor(s) disclaim responsibility for any injury to people or property resulting from any ideas, methods, instructions or products referred to in the content.

