
Soil Texture Mapping in the Permafrost Region: A Case Study on the Eastern Qinghai–Tibet Plateau

 ,
, 
 ,
,  , ,
, ,
Abstract
1. Introduction
2. Material and Methods
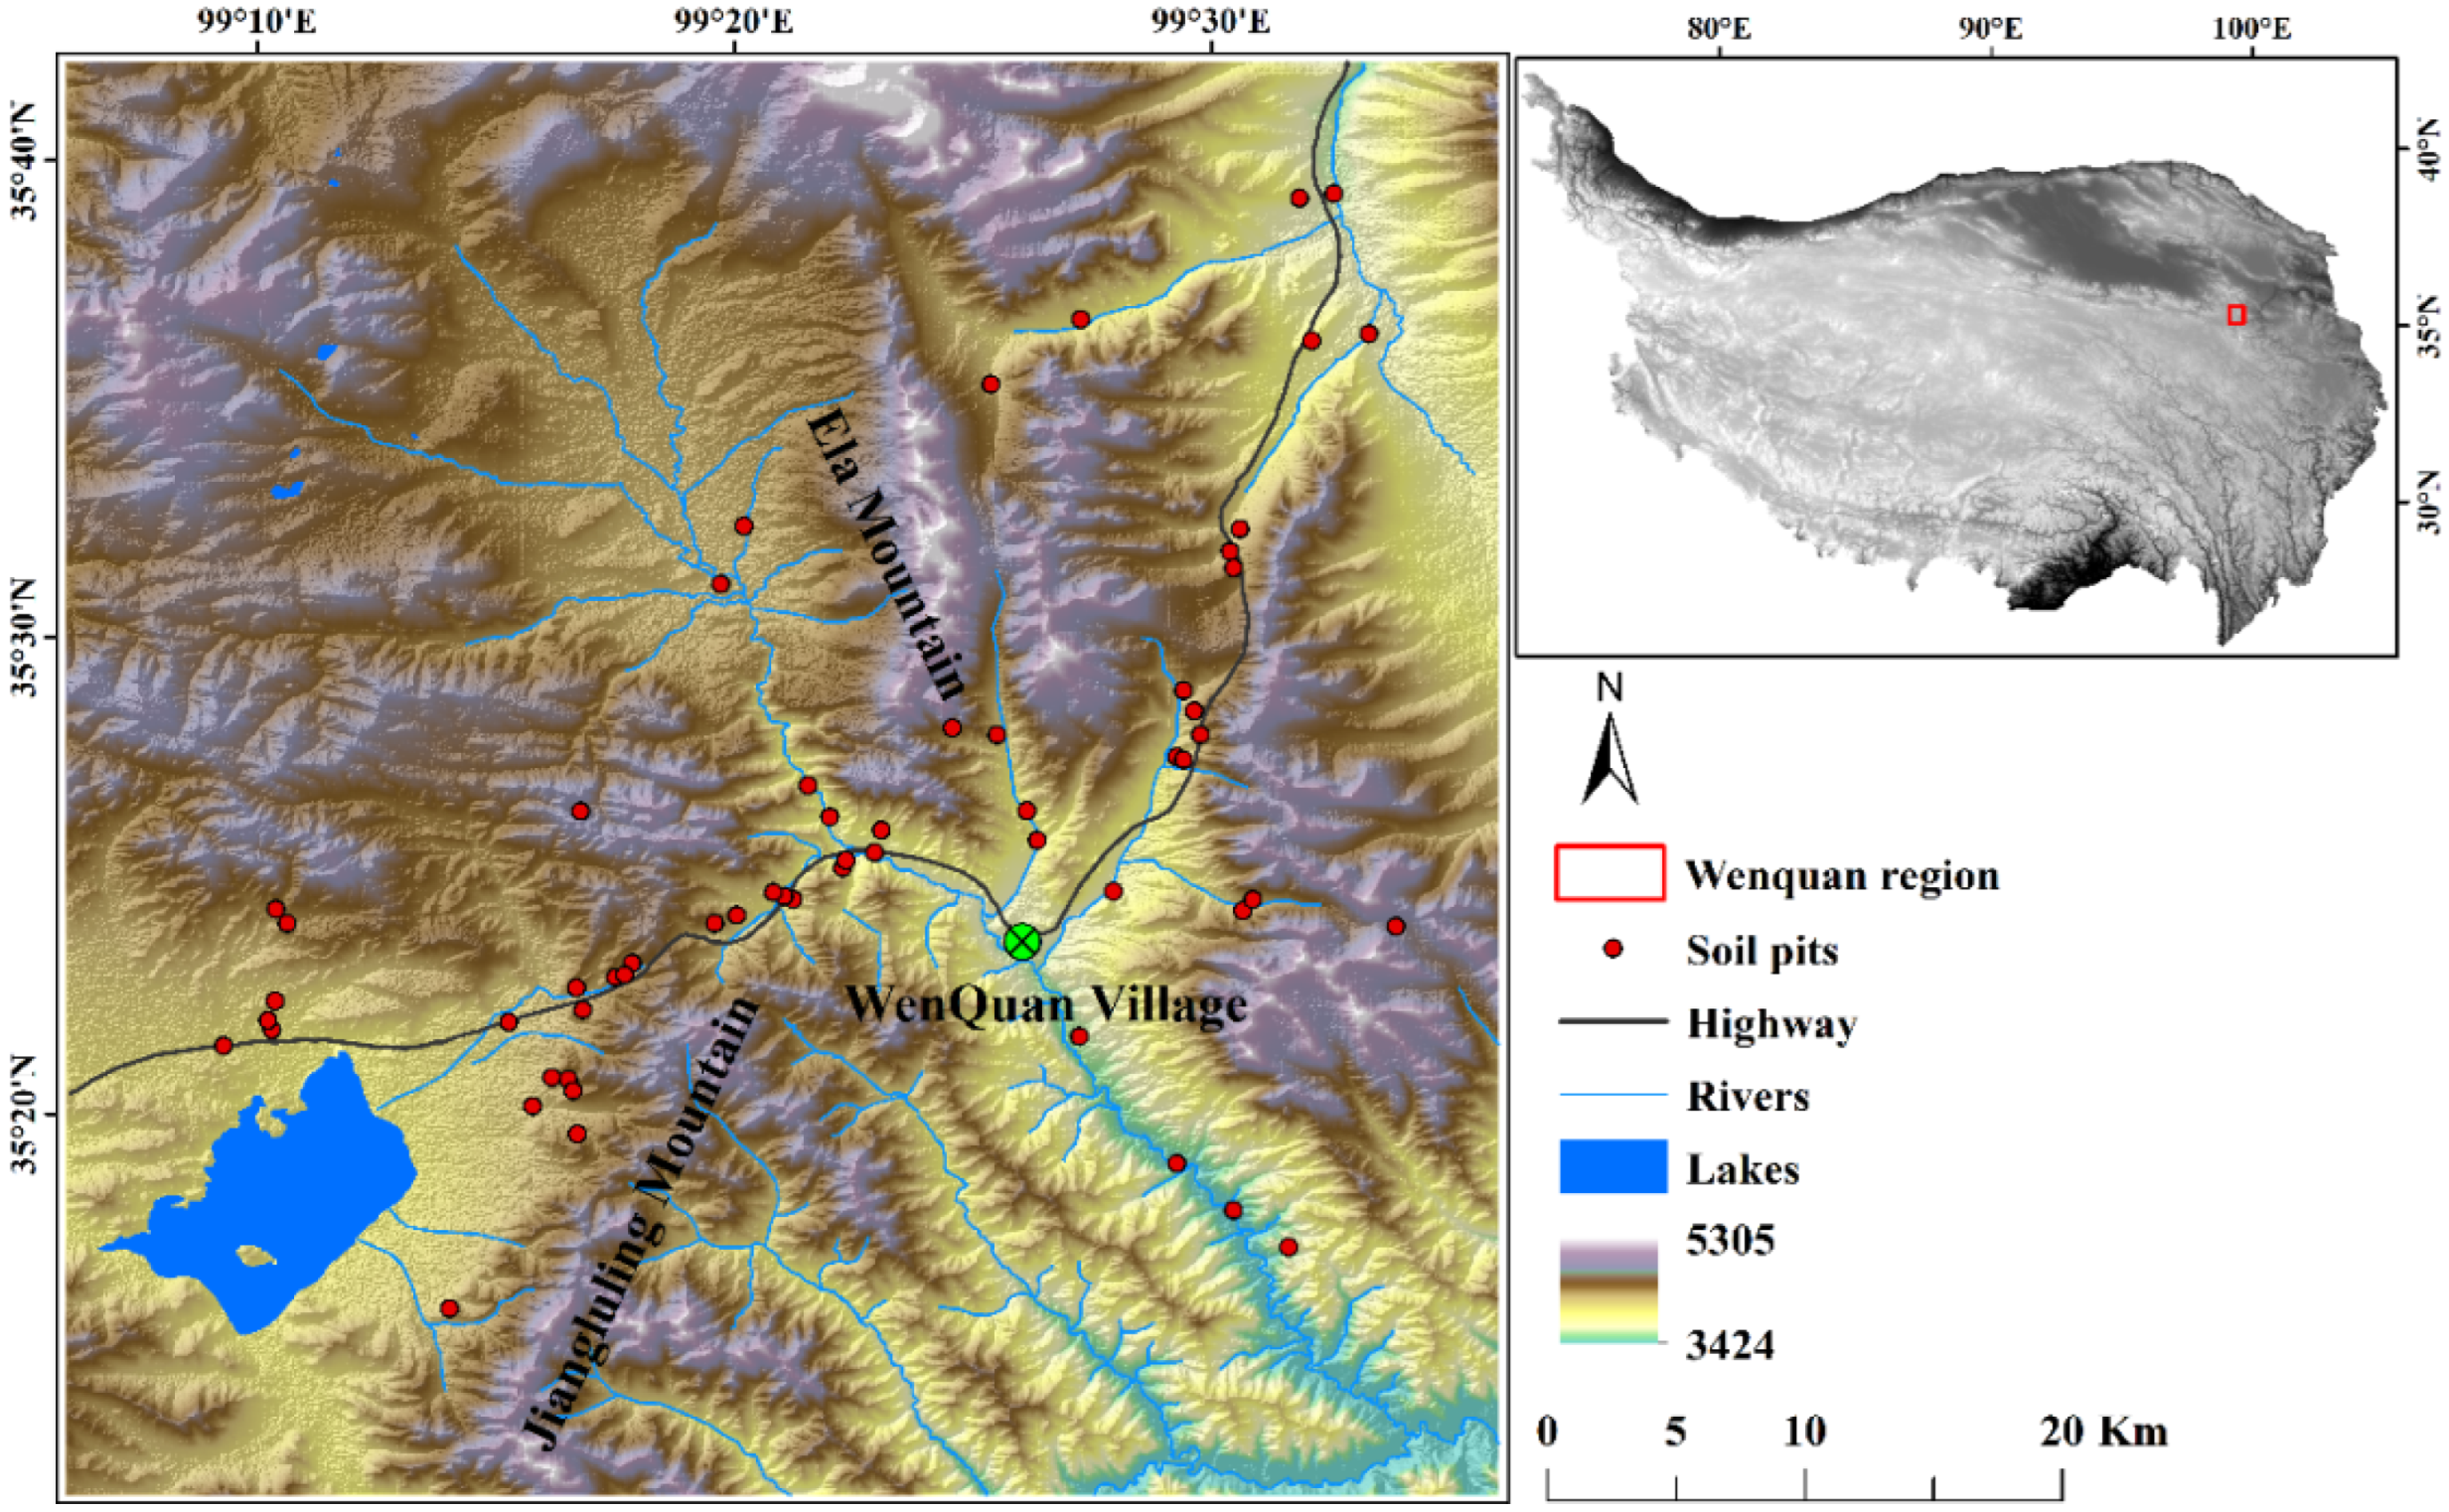
2.1. Study Area
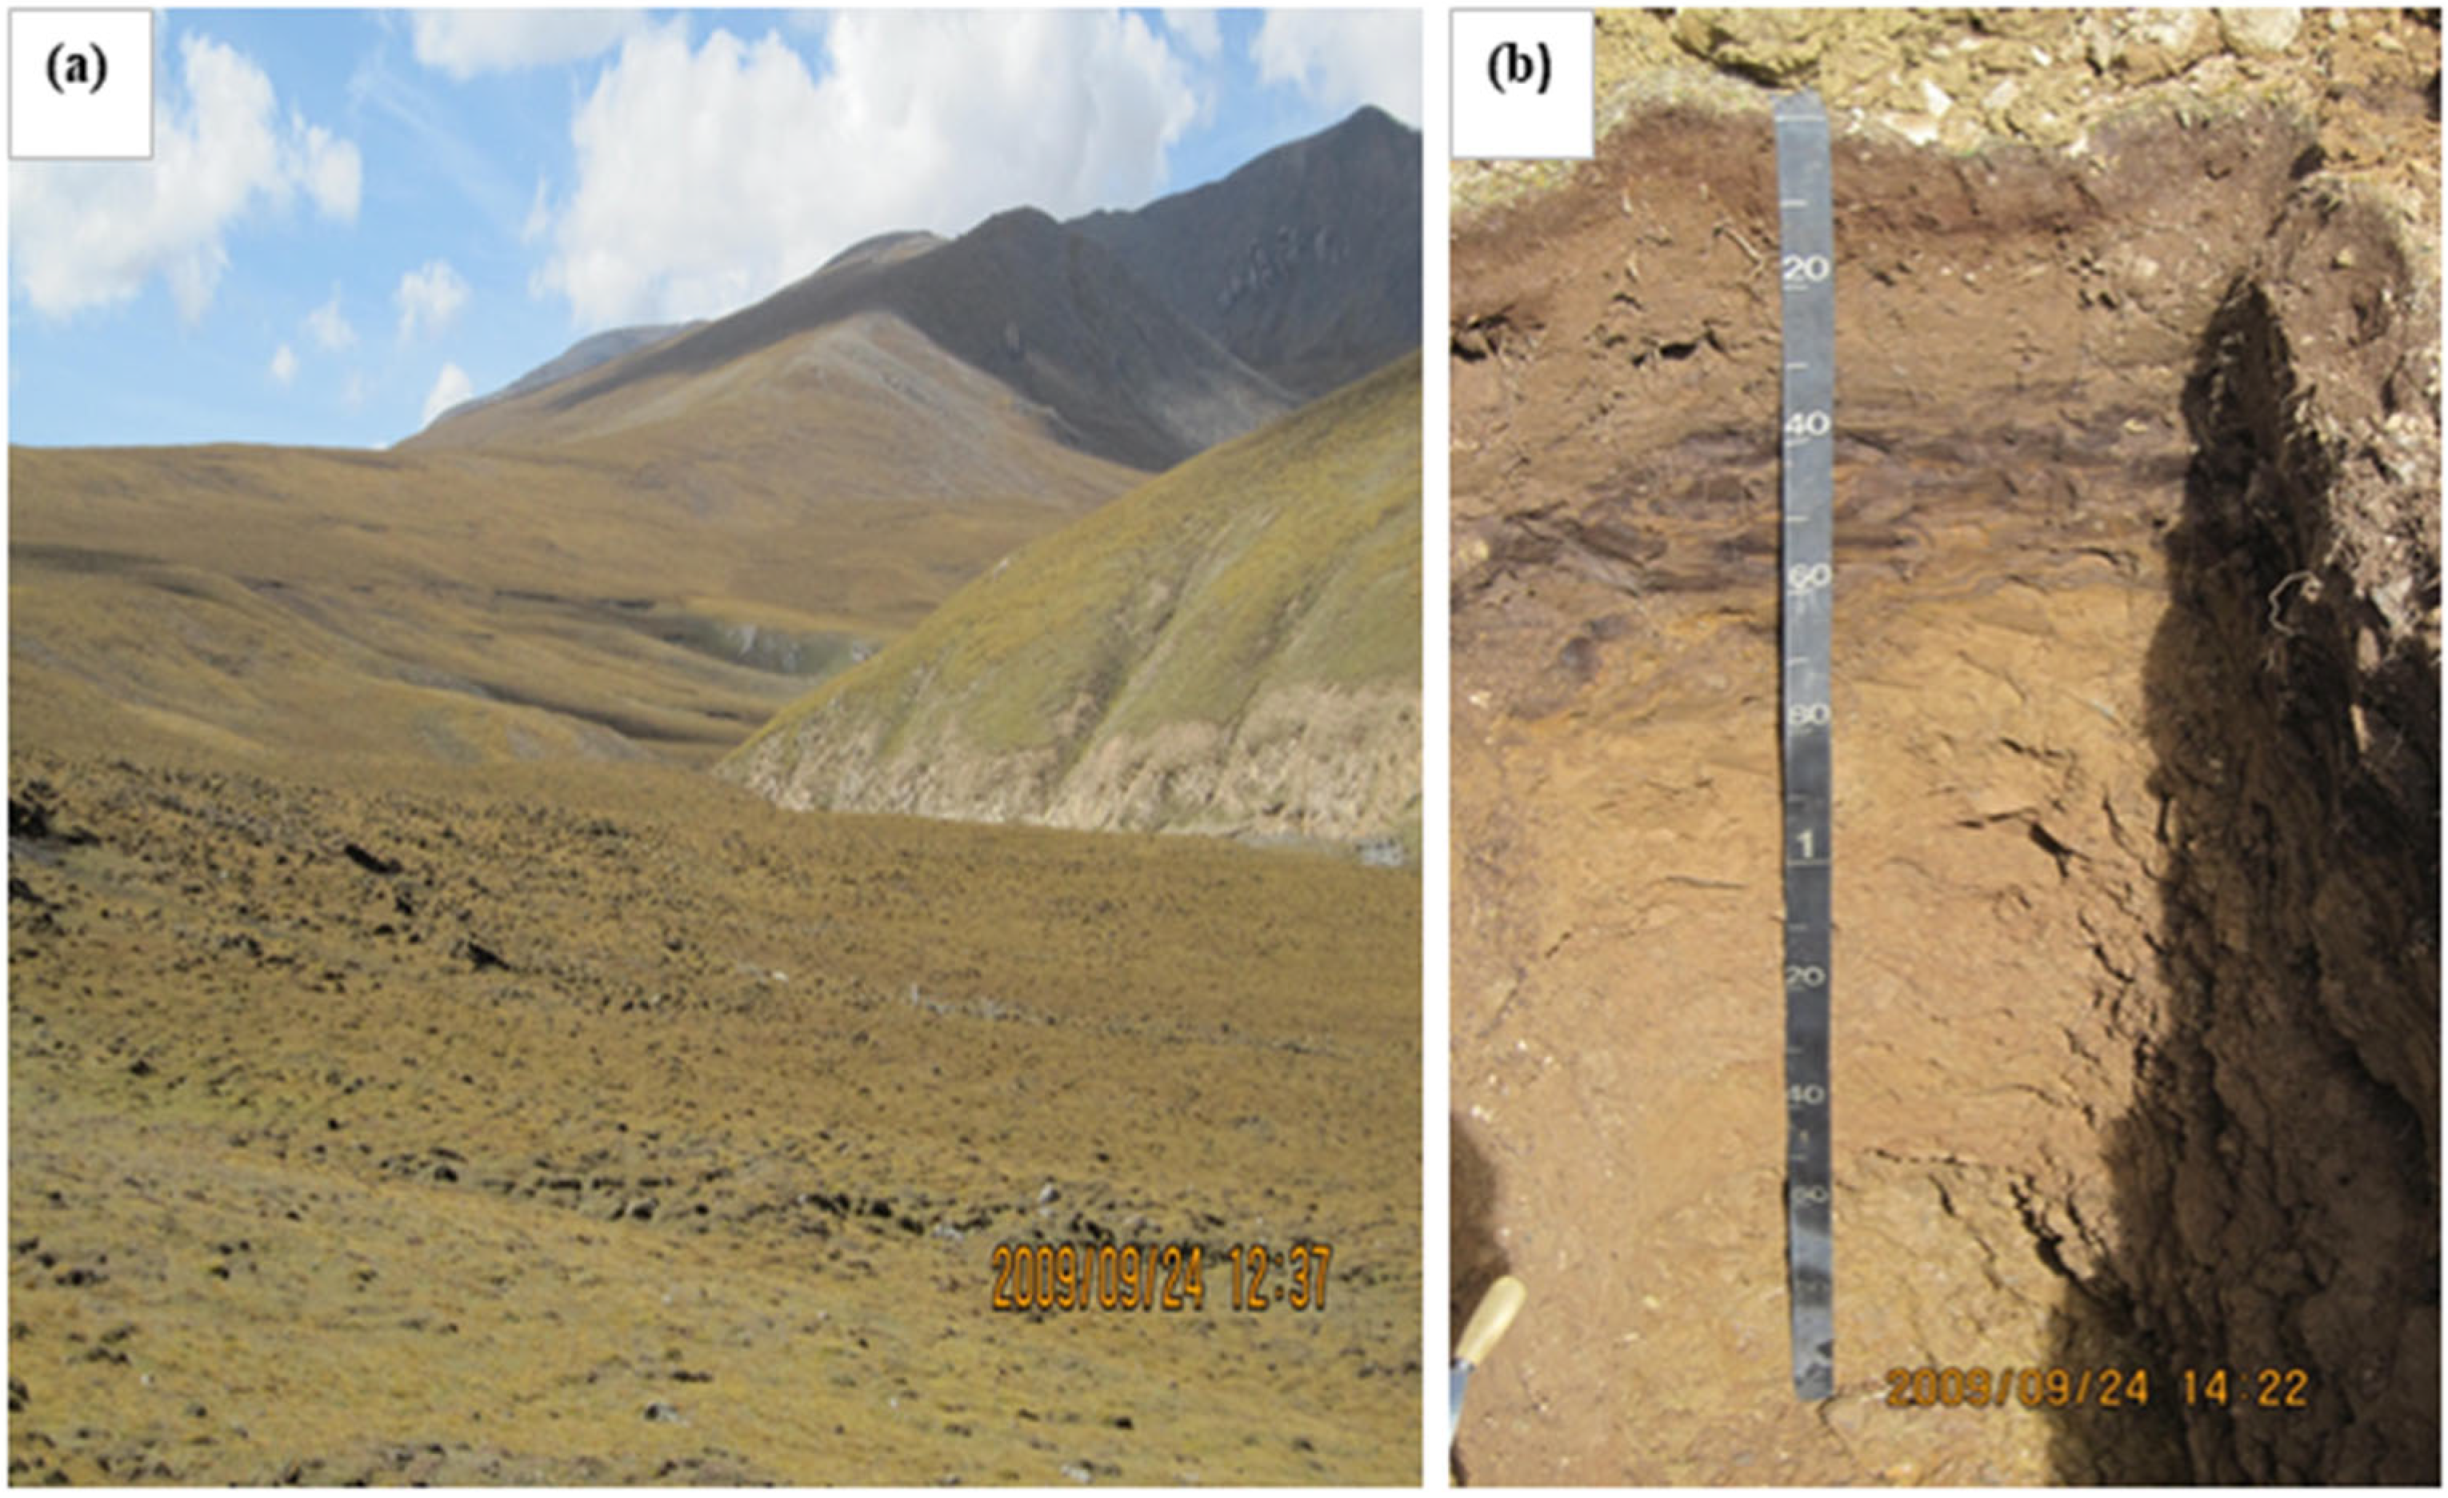
2.2. Field Work
2.3. Environmental Covariates
2.4. Random Forest Model
2.5. Data Processing and Analysis
2.6. Accuracy Validation
3. Results
3.1. Soil Particle Distribution
3.2. Accuracy Assessment
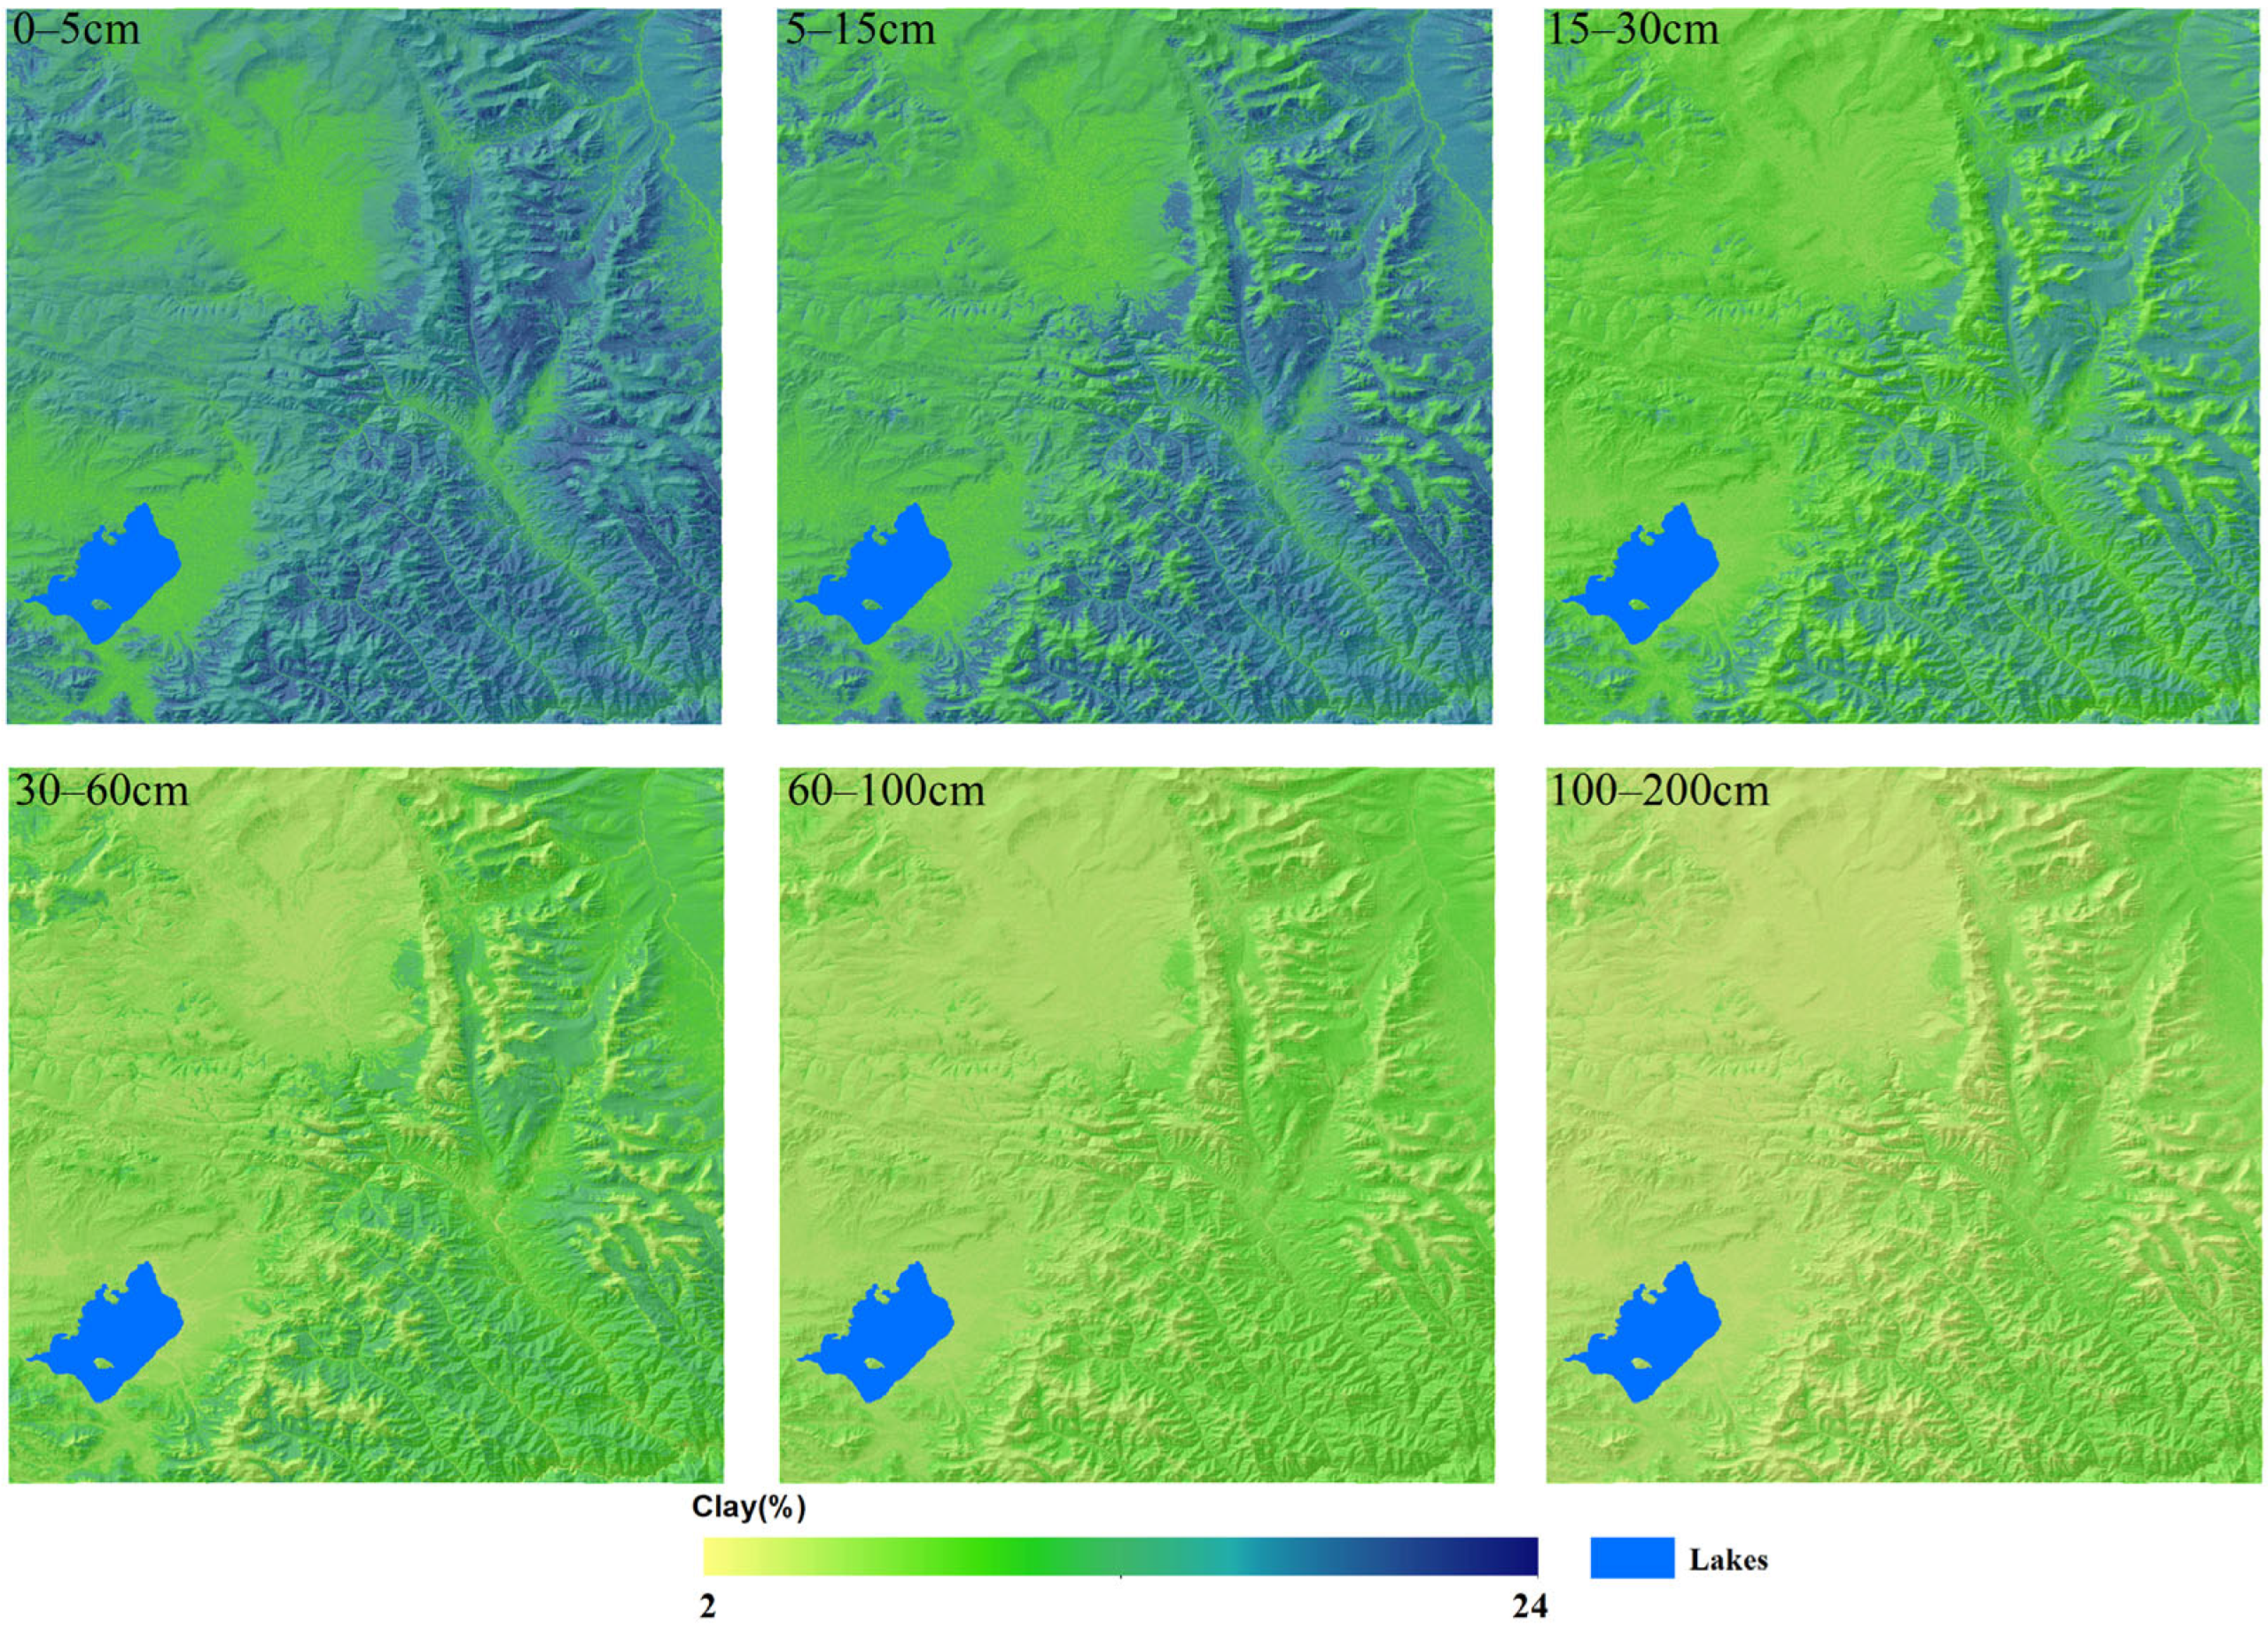
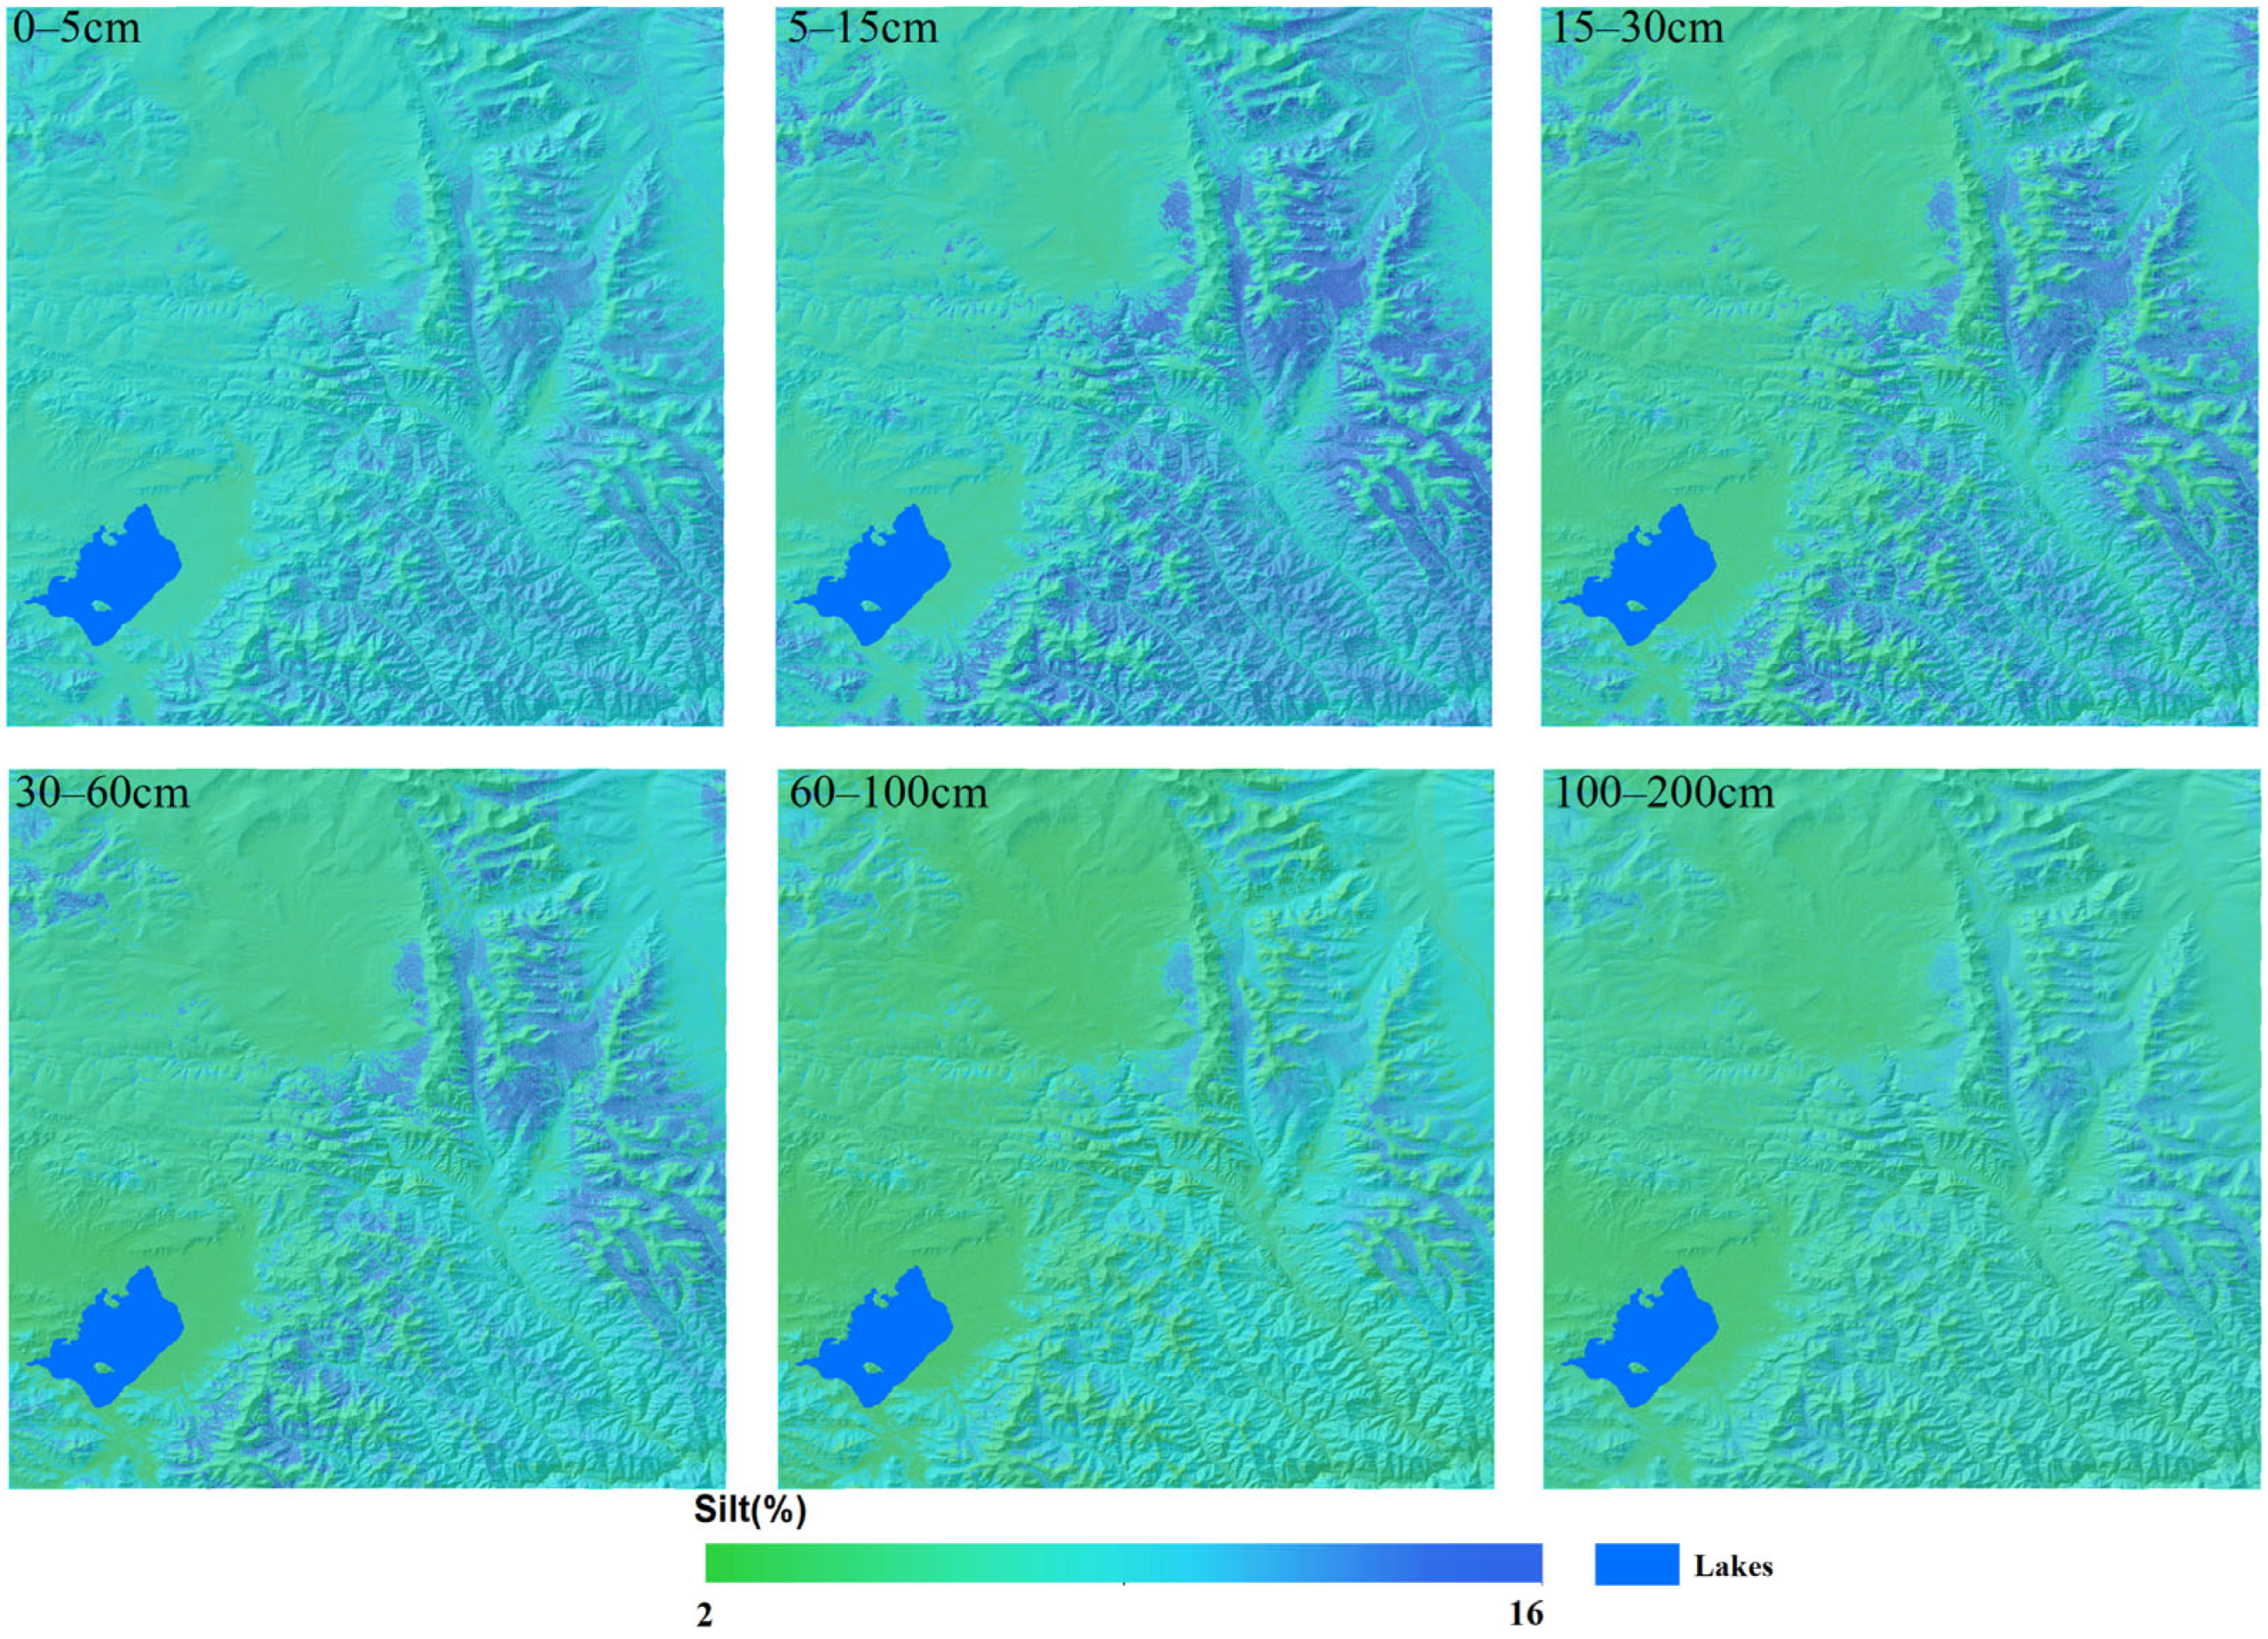
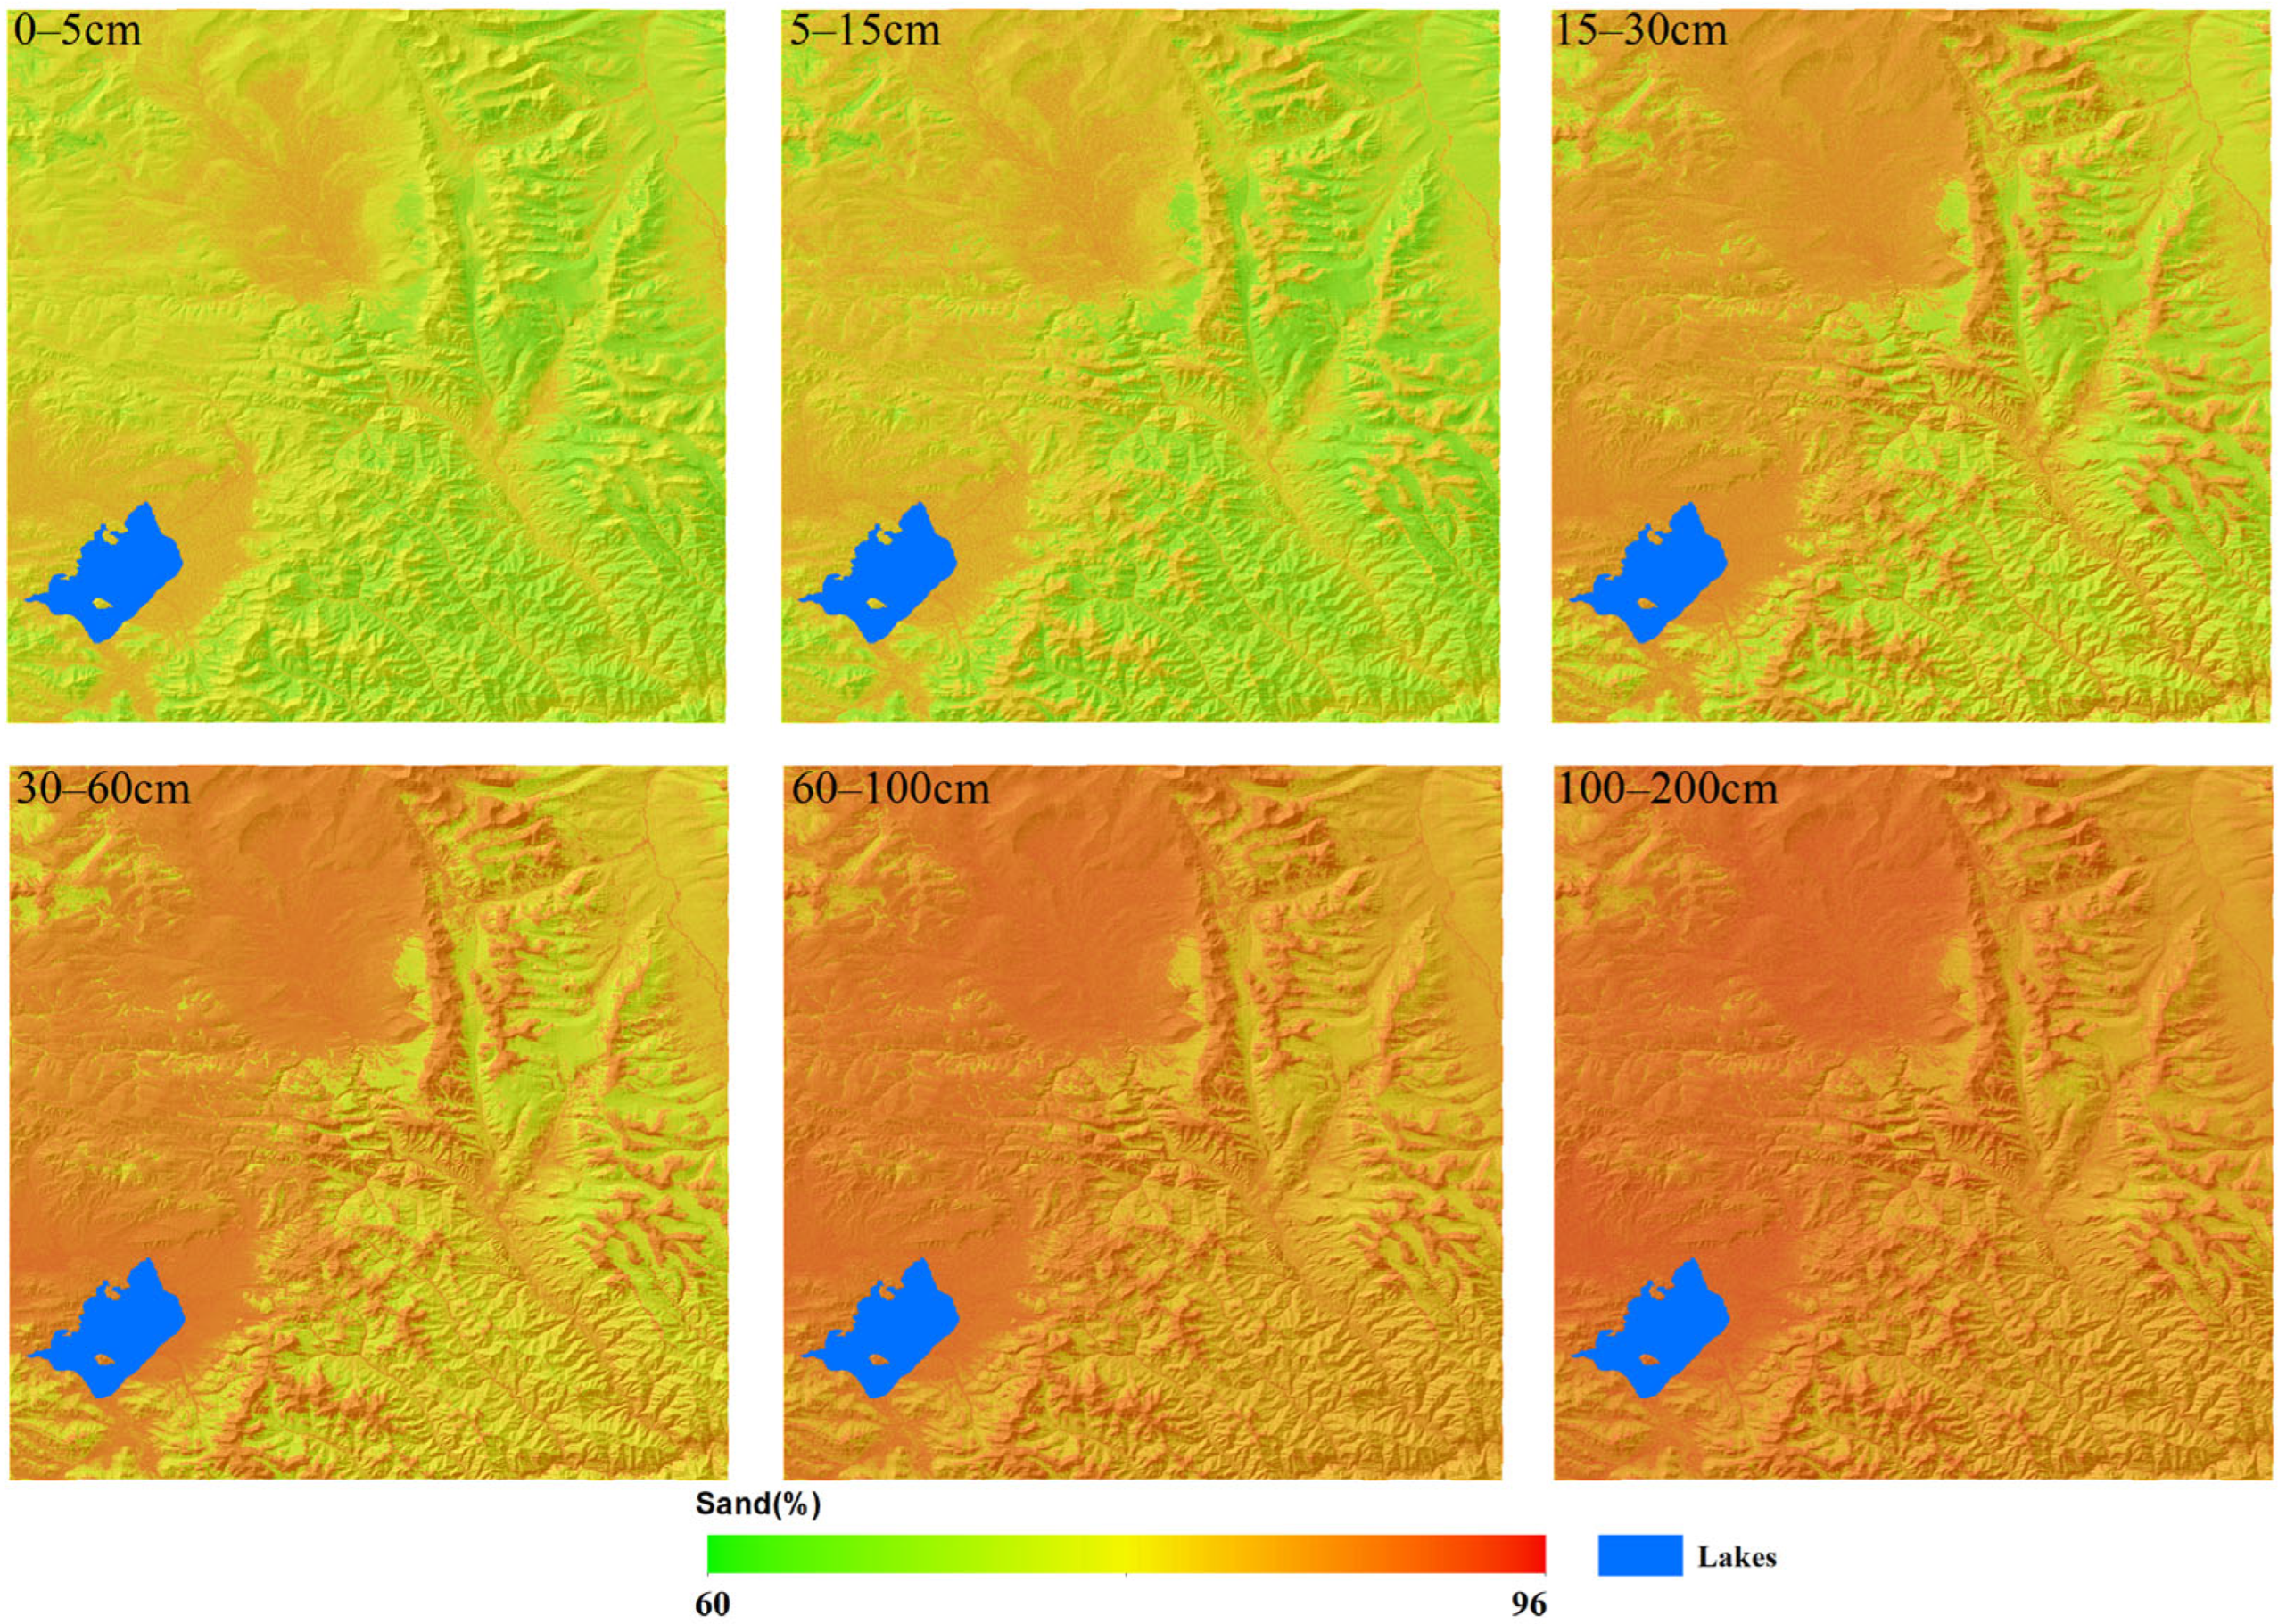
3.3. Spatial Distribution of Soil Particle Size
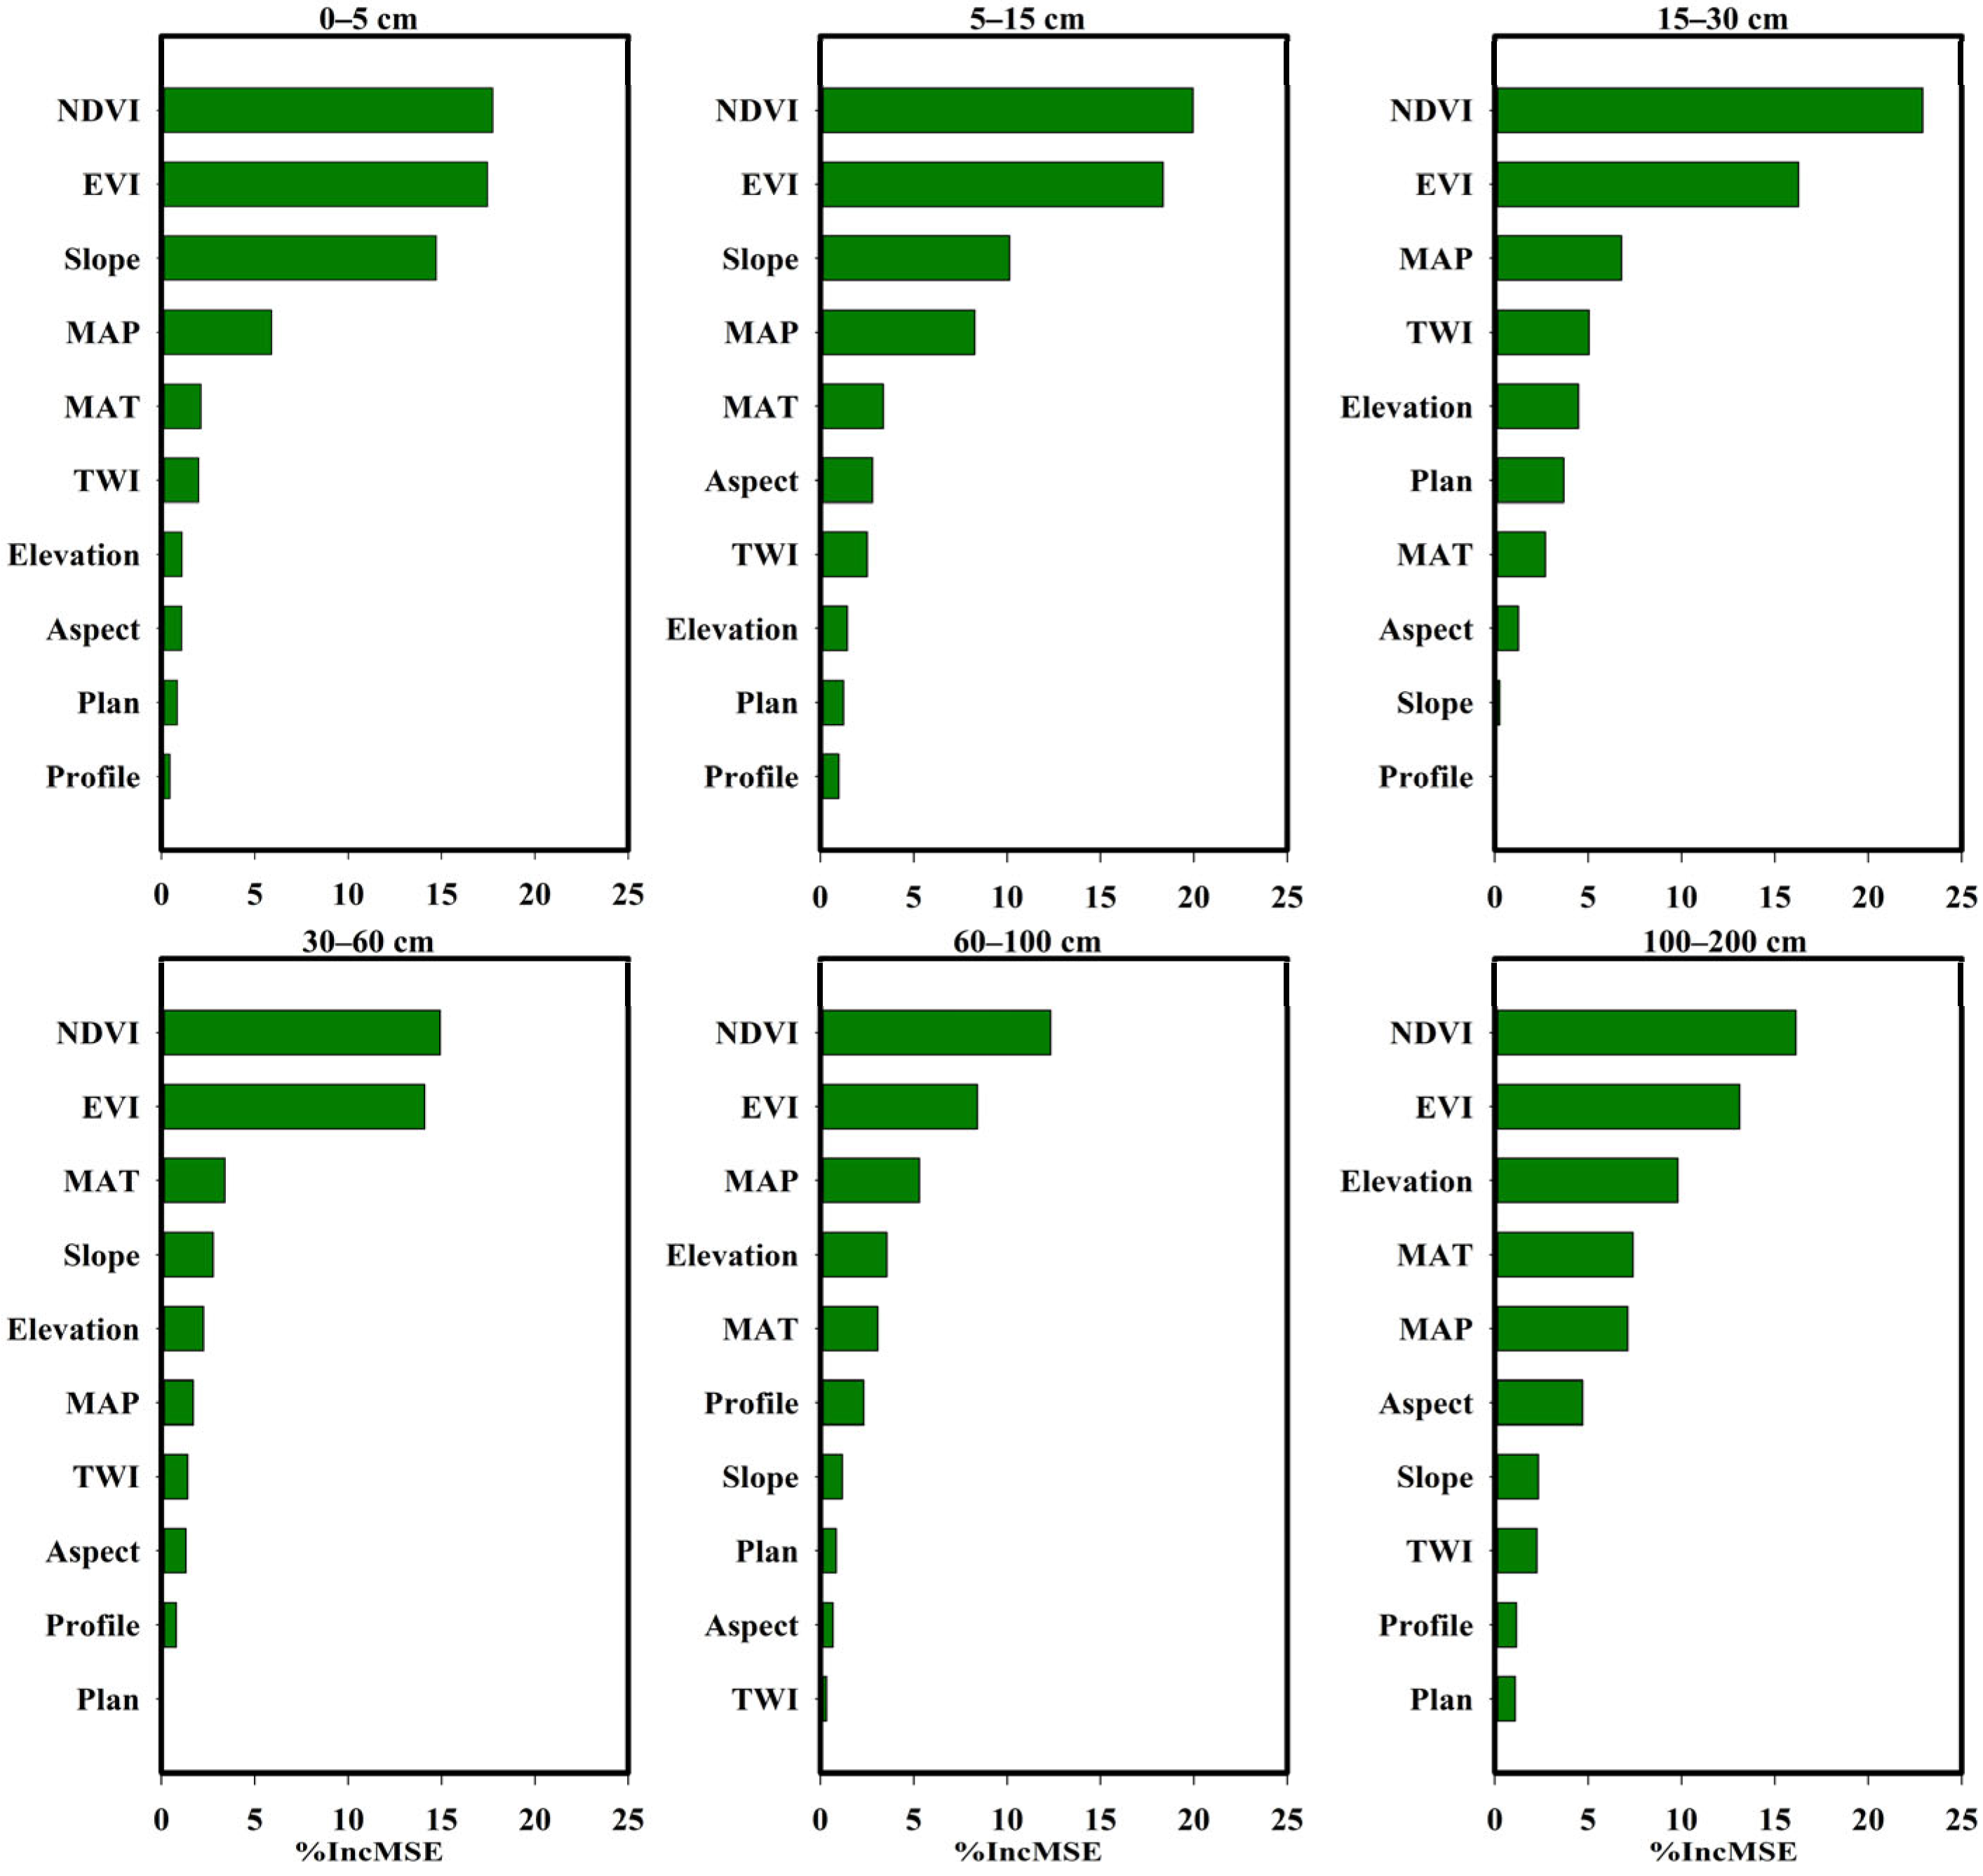
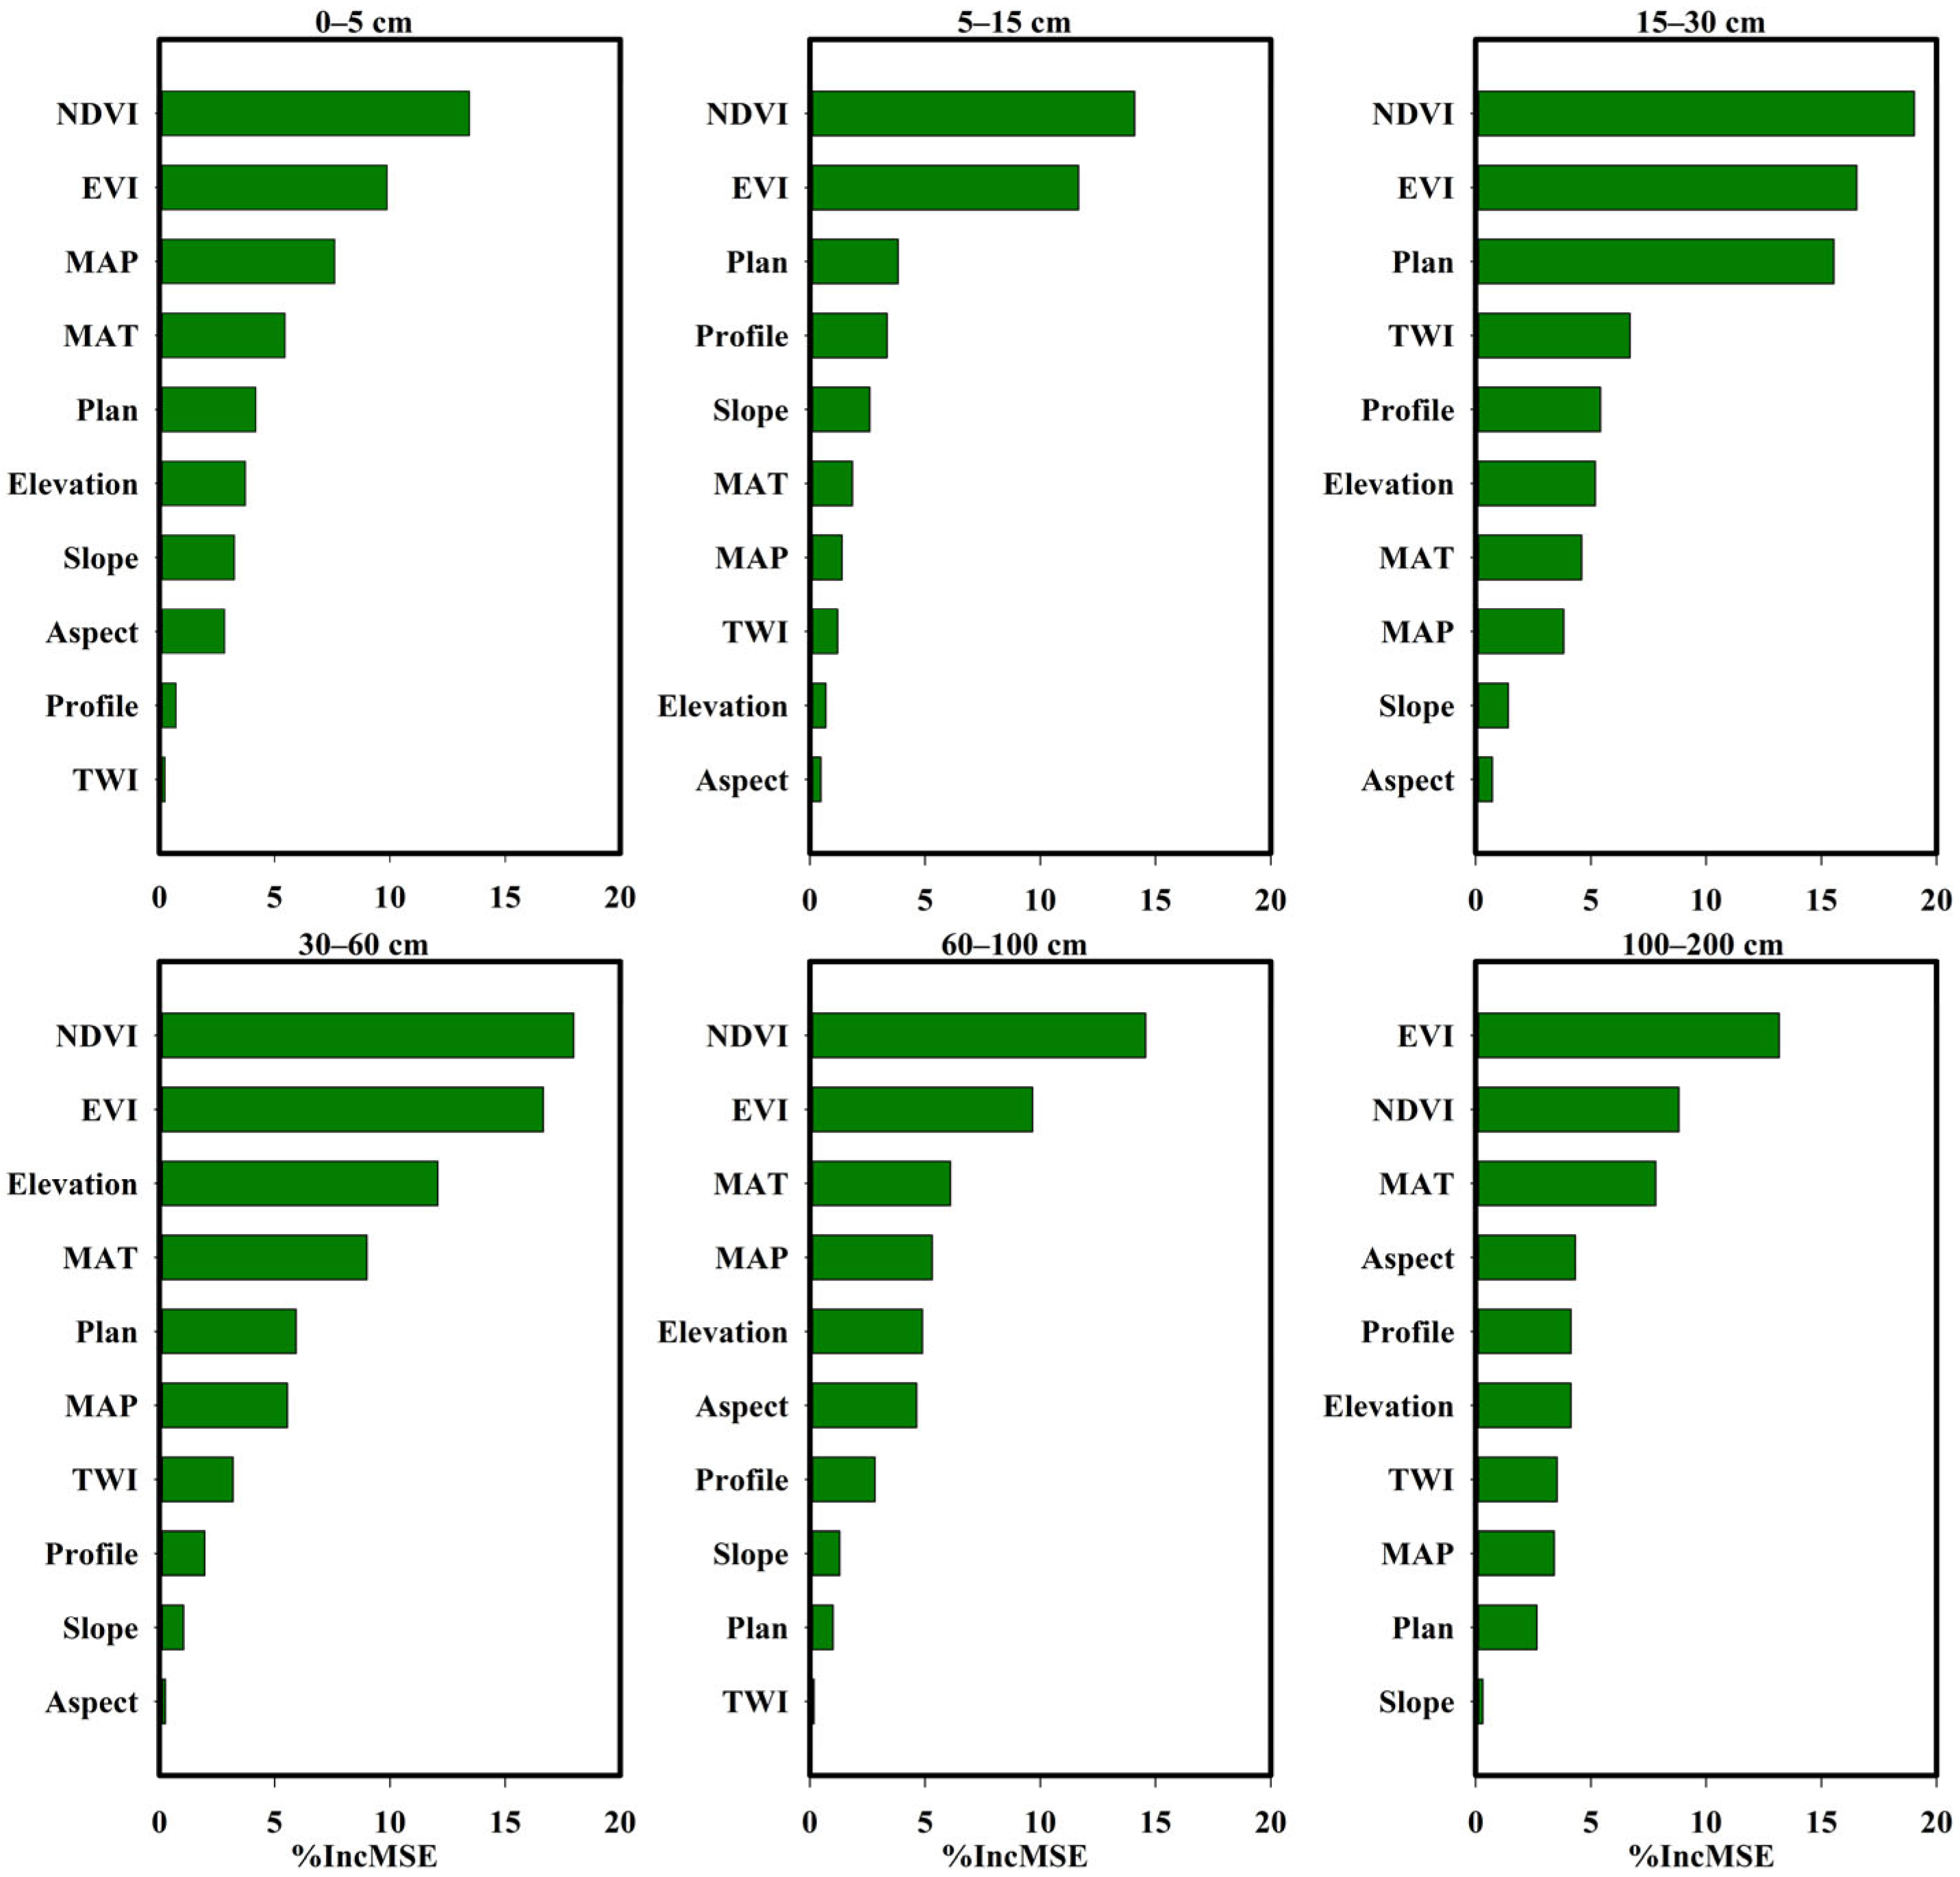
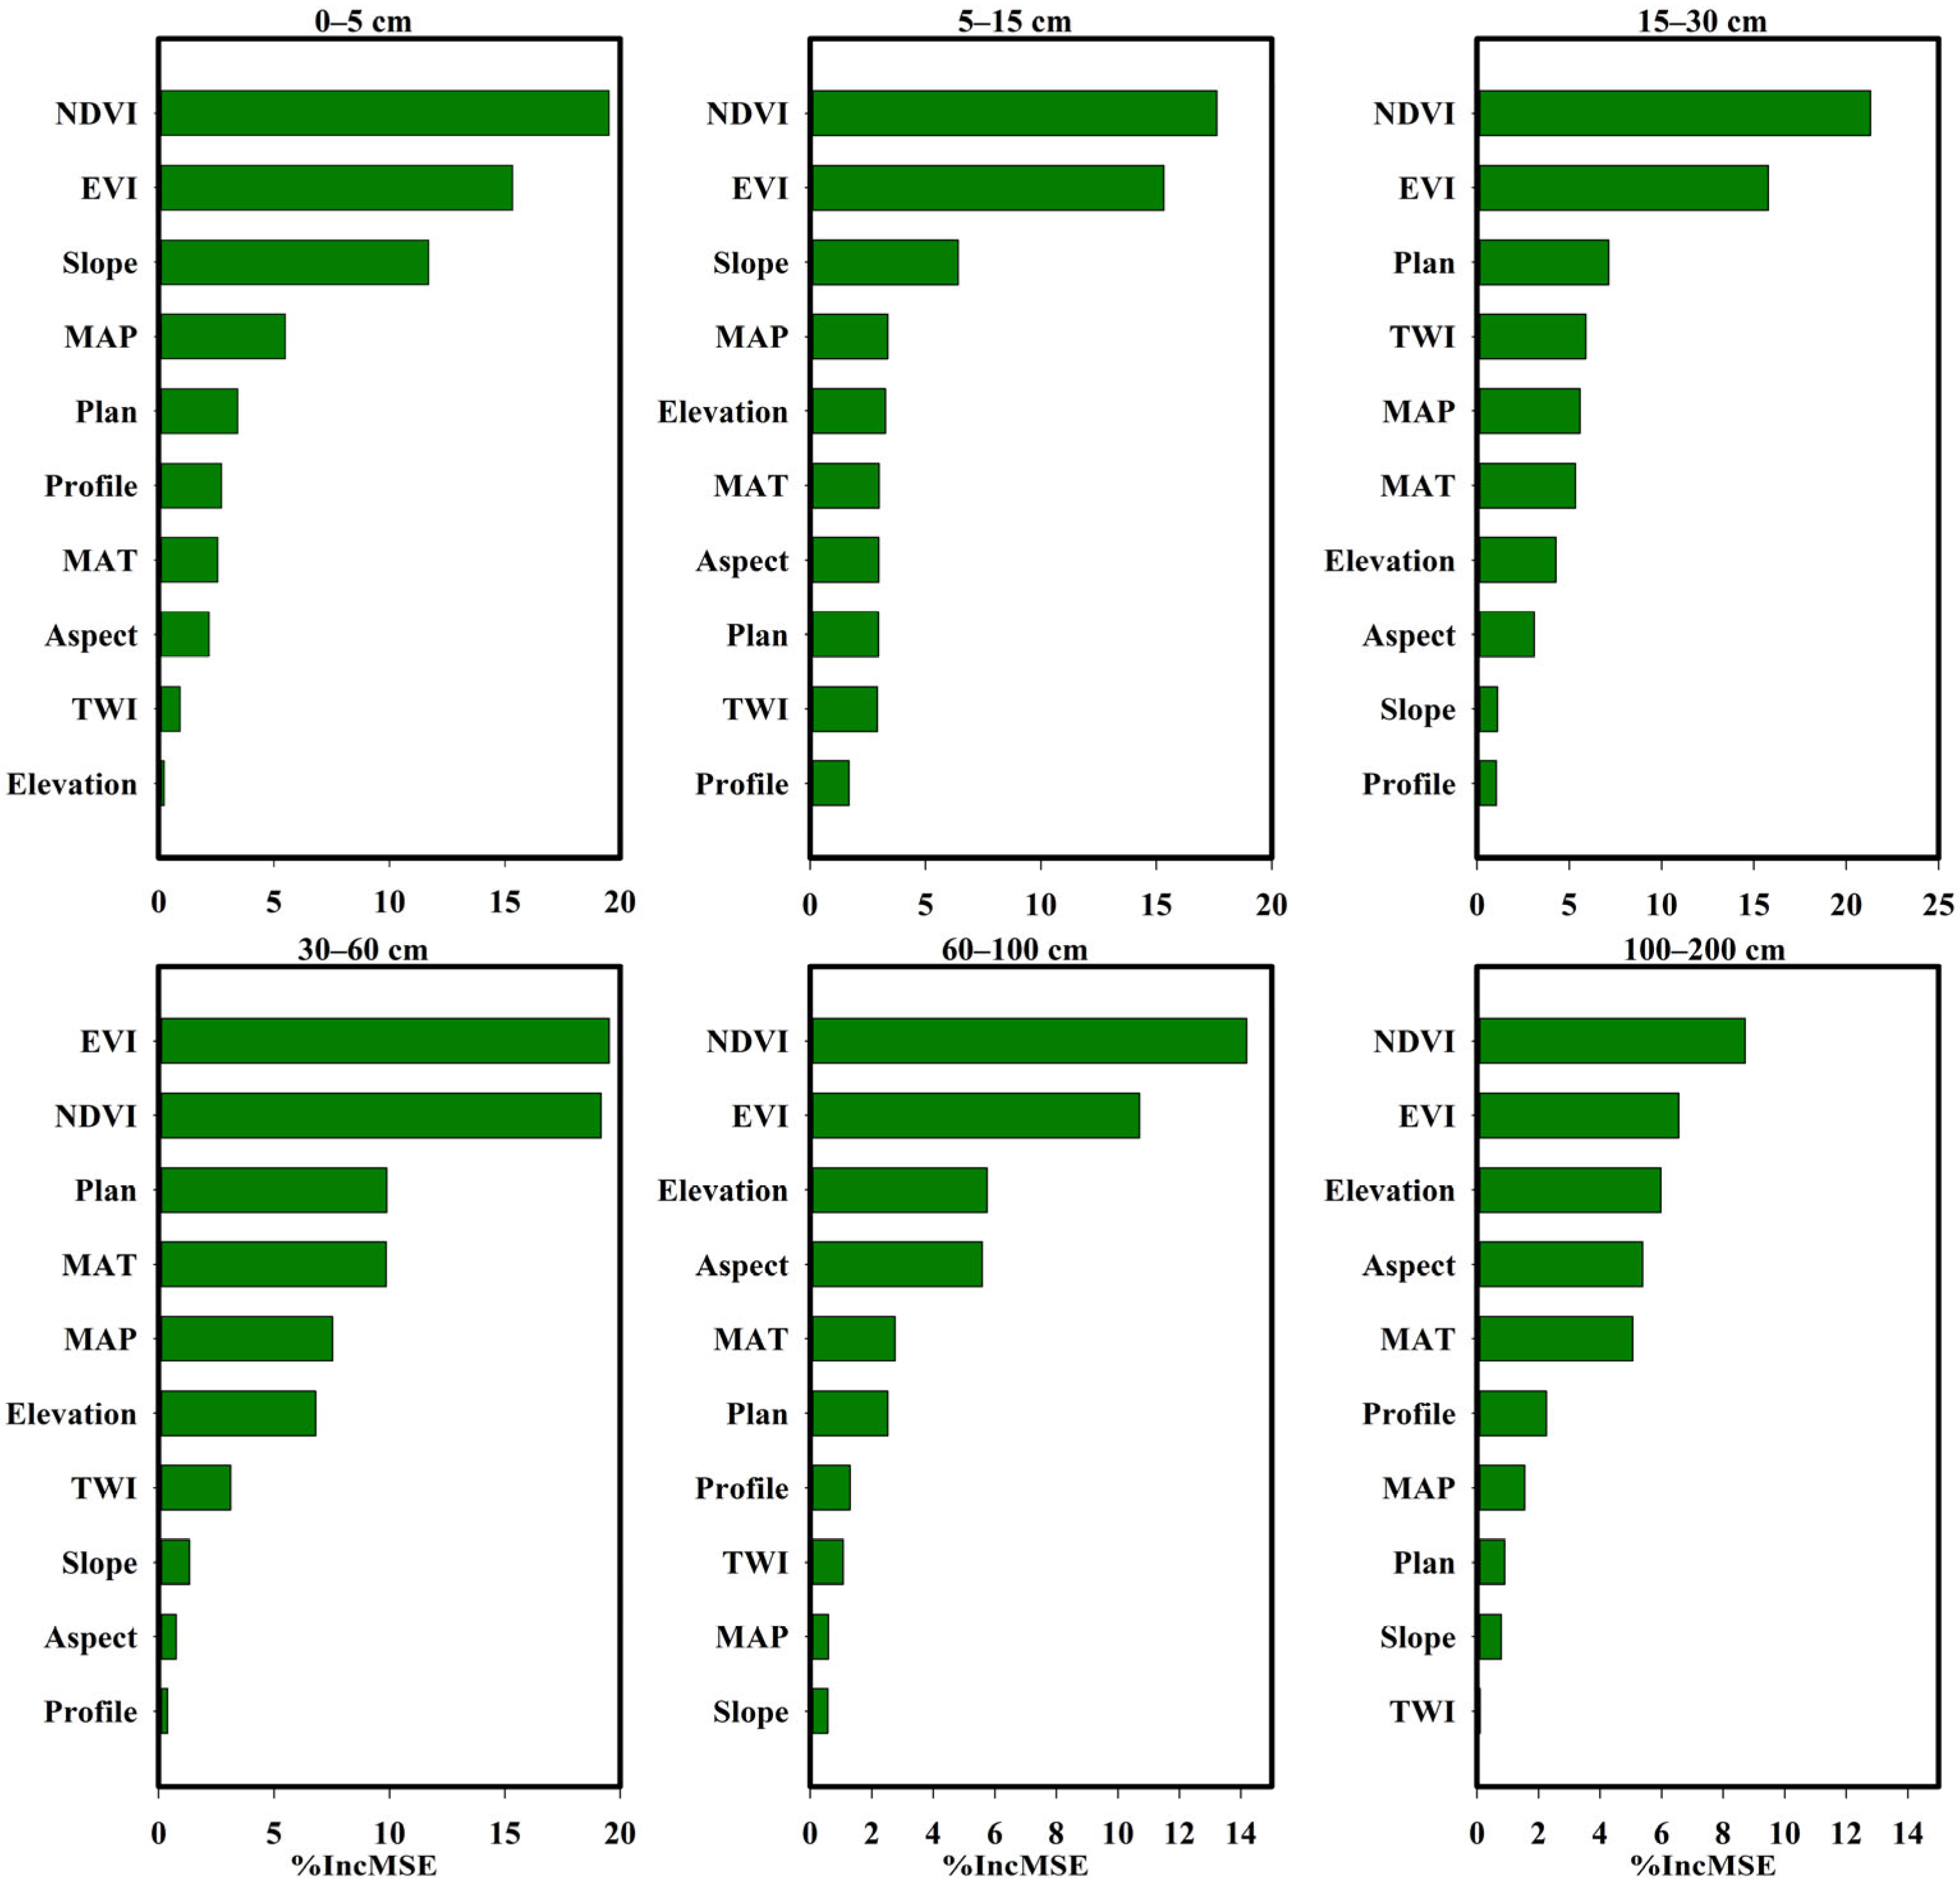
3.4. Importance of the Variables
4. Discussion
5. Conclusions
Author Contributions
Funding
Data Availability Statement
Acknowledgments
Conflicts of Interest
References
- Richer-De-Forges, A.C.; Arrouays, D.; Poggio, L.; Songchao, C.; Lacoste, M.; Minasny, B.; Libohova, Z.; Roudier, P.; Mulder, V.L.; Nédélec, H.J.P. Hand-feel soil texture observations to evaluate the accuracy of digital soil maps for local prediction of soil particle size distribution: A case study in Central France. Pedosphere 2023, 33, 731–743. [Google Scholar] [CrossRef]
- Siqueira, R.G.; Moquedace, C.M.; Francelino, M.R.; Schaefer, C.E.; Fernandes-Filho, E.I.J.G. Machine learning applied for Antarctic soil mapping: Spatial prediction of soil texture for Maritime Antarctica and Northern Antarctic Peninsula. Geoderma 2023, 432, 116405. [Google Scholar] [CrossRef]
- Moreno-Maroto, J.M.; Alonso-Azcárate, J.J. Evaluation of the USDA soil texture triangle through Atterberg limits and an alternative classification system. Appl. Clay Sci. 2022, 229, 106689. [Google Scholar] [CrossRef]
- Kaya, F.; Başayiğit, L. Spatial prediction and digital mapping of soil texture classes in a floodplain using multinomial logistic regression. In Intelligent and Fuzzy Techniques for Emerging Conditions and Digital Transformation, Proceedings of the INFUS 2021 Conference, Istanbul, Turkey, 24–26 August 2021; Springer: Berlin/Heidelberg, Germany, 2022; Volume 2. [Google Scholar]
- Wang, Z.; Li, W.; Li, W.; Yang, W.; Jing, S.J.C. Effects of microplastics on the water characteristic curve of soils with different textures. Chemosphere 2023, 317, 137762. [Google Scholar] [CrossRef]
- Wessolek, G.; Bohne, K.; Trinks, S.T. Validation of soil thermal conductivity models. Int. J. Thermophys. 2023, 44, 20. [Google Scholar] [CrossRef]
- Johannes, A.; Sauzet, O.; Matter, A.; Boivin, P. Soil organic carbon content and soil structure quality of clayey cropland soils: A large-scale study in the Swiss Jura region. Soil Use Manag. 2023, 39, 707–716. [Google Scholar] [CrossRef]
- Naz, B.S.; Sharples, W.; Ma, Y.; Goergen, K.; Kollet, S. Continental-scale evaluation of a fully distributed coupled land surface and groundwater model, ParFlow-CLM (v3. 6.0), over Europe. Geosci. Model Dev. 2023, 16, 1617–1639. [Google Scholar] [CrossRef]
- Ngu, N.H.; Thanh, N.N.; Duc, T.T.; Non, D.Q.; An, N.T.T.; Chotpantarat, S. Active learning-based random forest algorithm used for soil texture classification mapping in Central Vietnam. Catena 2024, 234, 107629. [Google Scholar] [CrossRef]
- Talebmorad, H.; Ostad-Ali-Askari, K. Hydro geo-sphere integrated hydrologic model in modeling of wide basins. Sustain. Water Resour. Manag. 2022, 8, 118. [Google Scholar] [CrossRef]
- Smith, S.L.; O’Neill, H.B.; Isaksen, K.; Noetzli, J.; Romanovsky, V. The changing thermal state of permafrost. Nat. Rev. Earth Environ. 2022, 3, 10–23. [Google Scholar] [CrossRef]
- Obu, J.; Westermann, S.; Bartsch, A.; Berdnikov, N.; Christiansen, H.H.; Dashtseren, A.; Delaloye, R.; Elberling, B.; Etzelmüller, B.; Kholodov, A. Northern Hemisphere permafrost map based on TTOP modelling for 2000–2016 at 1 km2 scale. Earth-Sci. Rev. 2019, 193, 299–316. [Google Scholar] [CrossRef]
- Yin, G.-A.; Luo, J.; Niu, F.-J.; Liu, M.-H.; Gao, Z.-Y.; Dong, T.-C.; Ni, W. Environmental factors controlling soil warming and wetting during 2000–2020 in permafrost and non-permafrost regions across the Qinghai–Tibet Plateau. Adv. Clim. Chang. Res. 2024, 15, 285–296. [Google Scholar] [CrossRef]
- Biskaborn, B.K.; Smith, S.L.; Noetzli, J.; Matthes, H.; Vieira, G.; Streletskiy, D.A.; Schoeneich, P.; Romanovsky, V.E.; Lewkowicz, A.G.; Abramov, A. Permafrost is warming at a global scale. Nat. Commun. 2019, 10, 264. [Google Scholar] [CrossRef] [PubMed]
- O’Neill, H.; Smith, S.; Burn, C.; Duchesne, C.; Zhang, Y. Widespread permafrost degradation and thaw subsidence in northwest Canada. J. Geophys. Res. Earth Surf. 2023, 128, e2023JF007262. [Google Scholar] [CrossRef]
- Svennevig, K.; Keiding, M.; Korsgaard, N.J.; Lucas, A.; Owen, M.; Poulsen, M.D.; Priebe, J.; Sørensen, E.V.; Morino, C. Uncovering a 70-year-old permafrost degradation induced disaster in the Arctic, the 1952 Niiortuut landslide-tsunami in central West Greenland. Sci. Total Environ. 2023, 859, 160110. [Google Scholar] [CrossRef]
- Murton, J.B. Permafrost and Climate Change. In Climate Change; Elsevier: Amsterdam, The Netherlands, 2021; pp. 281–326. [Google Scholar]
- Schuur, E.A.; Abbott, B.W.; Commane, R.; Ernakovich, J.; Euskirchen, E.; Hugelius, G.; Grosse, G.; Jones, M.; Koven, C.; Leshyk, V. Permafrost and climate change: Carbon cycle feedbacks from the warming Arctic. Annu. Rev. Environ. Resour. 2022, 47, 343–371. [Google Scholar] [CrossRef]
- Zhao, L.; Hu, G.; Liu, G.; Zou, D.; Wang, Y.; Xiao, Y.; Du, E.; Wang, C.; Xing, Z.; Sun, Z.; et al. Investigation, Monitoring, and Simulation of Permafrost on the Qinghai-Tibet Plateau: A Review. Permafr. Periglac. Process. 2024, 35, 412–422. [Google Scholar] [CrossRef]
- Li, H.; Bulcke, J.V.D.; Mendoza, O.; Deroo, H.; Haesaert, G.; Dewitte, K.; De Neve, S.; Sleutel, S. Soil texture controls added organic matter mineralization by regulating soil moisture—Evidence from a field experiment in a maritime climate. Geoderma 2022, 410, 115690. [Google Scholar] [CrossRef]
- Zhou, Y.; Wu, W.; Wang, H.; Zhang, X.; Yang, C.; Liu, H. Identification of soil texture classes under vegetation cover based on Sentinel-2 data with SVM and SHAP techniques. IEEE J. Sel. Top. Appl. Earth Obs. Remote Sens. 2022, 15, 3758–3770. [Google Scholar] [CrossRef]
- Wang, Q.; Wen, Y.; Zhao, B.; Hong, H.; Liao, R.; Li, J.; Liu, J.; Lu, H.; Yan, C. Coastal soil texture controls soil organic carbon distribution and storage of mangroves in China. Catena 2021, 207, 105709. [Google Scholar] [CrossRef]
- Mei, Q.-H.; Chen, J.; Liu, Y.-Q.; Zhang, S.-H.; Zhao, J.-Y.; Dong, T.-C.; Wang, J.-C.; Zhao, Y. Degradation of warm permafrost and talik formation on the Qinghai–Tibet Plateau in 2006–2021. Adv. Clim. Chang. Res. 2024, 15, 275–284. [Google Scholar] [CrossRef]
- Zakharov, M.; Gadal, S.; Kamičaitytė, J.; Cherosov, M.; Troeva, E. Distribution and Structure Analysis of Mountain Permafrost Landscape in Orulgan Ridge (Northeast Siberia) Using Google Earth Engine. Land 2022, 11, 1187. [Google Scholar] [CrossRef]
- Zou, D.; Zhao, L.; Sheng, Y.; Chen, J.; Hu, G.; Wu, T.; Wu, J.; Xie, C.; Wu, X.; Pang, Q.; et al. A new map of permafrost distribution on the Tibetan Plateau. Cryosphere 2017, 11, 2527–2542. [Google Scholar] [CrossRef]
- Shangguan, W.; Dai, Y.; Liu, B.; Ye, A.; Yuan, H. A soil particle-size distribution dataset for regional land and climate modelling in China. Geoderma 2012, 171, 85–91. [Google Scholar] [CrossRef]
- Mitran, T.; Solanky, V.; Suresh, G.J.; Sujatha, G.; Sreenivas, K.; Ravisankar, T. Predictive mapping of surface soil texture in a semiarid region of India through geostatistical modeling. Model. Earth Syst. Environ. 2019, 5, 645–657. [Google Scholar] [CrossRef]
- Liao, K.; Xu, S.; Wu, J.; Zhu, Q. Spatial estimation of surface soil texture using remote sensing data. Soil Sci. Plant Nutr. 2013, 59, 488–500. [Google Scholar] [CrossRef]
- Chen, S.; Arrouays, D.; Mulder, V.L.; Poggio, L.; Minasny, B.; Roudier, P.; Libohova, Z.; Lagacherie, P.; Shi, Z.; Hannam, J. Digital mapping of GlobalSoilMap soil properties at a broad scale: A review. Geoderma 2022, 409, 115567. [Google Scholar] [CrossRef]
- Schulz, G.; Rodriguez, D.M.; Angelini, M.; Moretti, L.M.; Olmedo, G.F.; Vuegen, L.M.T.; Colazo, J.C.; Guevara, M. Digital soil texture maps of Argentina and their relationship to soil-forming factors and processes. In Geopedology: An Integration of Geomorphology and Pedology for Soil and Landscape Studies; Springer: Berlin/Heidelberg, Germany, 2023; pp. 263–281. [Google Scholar]
- McBratney, A.B.; Santos, M.M.; Minasny, B.J.G. On digital soil mapping. Geoderma 2003, 117, 3–52. [Google Scholar] [CrossRef]
- Liu, F.; Zhang, G.-L.; Song, X.; Li, D.; Zhao, Y.; Yang, J.; Wu, H.; Yang, F. High-resolution and three-dimensional mapping of soil texture of China. Geoderma 2020, 361, 114061. [Google Scholar] [CrossRef]
- Arrouays, D.; Grundy, M.G.; Hartemink, A.E.; Hempel, J.W.; Heuvelink, G.B.; Hong, S.Y.; Lagacherie, P.; Lelyk, G.; McBratney, A.B.; McKenzie, N.J. GlobalSoilMap: Toward a fine-resolution global grid of soil properties. Adv. Agron. 2014, 125, 93–134. [Google Scholar]
- Omondiagbe, O.P.; Lilburne, L.; Licorish, S.A.; MacDonell, S. Soil texture prediction with automated deep convolutional neural networks and population-based learning. Geoderma 2023, 436, 116521. [Google Scholar] [CrossRef]
- Li, W.; Zhao, L.; Wu, X.; Wang, S.; Sheng, Y.; Ping, C.; Zhao, Y.; Fang, H.; Shi, W. Soil distribution modeling using inductive learning in the eastern part of permafrost regions in Qinghai–Xizang (Tibetan) Plateau. Catena 2015, 126, 98–104. [Google Scholar] [CrossRef]
- Svensson, D.N.; Messing, I.; Barron, J.J.S. An investigation in laser diffraction soil particle size distribution analysis to obtain compatible results with sieve and pipette method. Soil Tillage Res. 2022, 223, 105450. [Google Scholar] [CrossRef]
- Cui, P.; Chen, Z.; Fan, F.; Yin, C.; Song, A.; Li, T.; Zhang, H.; Liang, Y. Soil texture is an easily overlooked factor affecting the temperature sensitivity of N2O emissions. Sci. Total Environ. 2023, 862, 160648. [Google Scholar] [CrossRef]
- Jenny, H. The Soil Resource: Origin and Behavior; Springer Science & Business Media: Berlin/Heidelberg, Germany, 2012. [Google Scholar]
- Breiman, L.J. Random forests. Mach. Learn. 2001, 45, 5–32. [Google Scholar] [CrossRef]
- Asif, M.; Kazmi, J.H.; Tariq, A.; Zhao, N.; Guluzade, R.; Soufan, W.; Almutairi, K.F.; Sabagh, A.E.; Aslam, M. Modelling of land use and land cover changes and prediction using CA-Markov and Random Forest. Geocarto Int. 2023, 38, 2210532. [Google Scholar] [CrossRef]
- Sihag, P.; Angelaki, A.; Chaplot, B. Estimation of the recharging rate of groundwater using random forest technique. Appl. Water Sci. 2020, 10, 182. [Google Scholar] [CrossRef]
- Loozen, Y.; Rebel, K.T.; de Jong, S.M.; Lu, M.; Ollinger, S.V.; Wassen, M.J.; Karssenberg, D.J. Mapping canopy nitrogen in European forests using remote sensing and environmental variables with the random forests method. Remote Sens. Environ. 2020, 247, 111933. [Google Scholar] [CrossRef]
- Bargués-Tobella, A.; Winowiecki, L.A.; Sheil, D.; Vågen, T. Determinants of Soil Field-Saturated Hydraulic Conductivity Across Sub-Saharan Africa: Texture and Beyond. Copernic. Meet. 2024, 60, e2023WR035510. [Google Scholar] [CrossRef]
- Eymard, A.; Richer-de-Forges, A.C.; Martelet, G.; Tissoux, H.; Bialkowski, A.; Dalmasso, M.; Chrétien, F.; Belletier, D.; Ledemé, G.; Laloua, D.J. Exploring the untapped potential of hand-feel soil texture data for enhancing digital soil mapping: Revealing hidden spatial patterns from field observations. Geoderma 2024, 441, 116769. [Google Scholar] [CrossRef]
- Amsili, J.P.; van Es, H.M.; Schindelbeck, R. Pedotransfer Functions for Field Capacity, Permanent Wilting Point, and Available Water Capacity Based on Random Forest Models for Routine Soil Health Analysis. Commun. Soil Sci. Plant Anal. 2024, 55, 1967–1984. [Google Scholar] [CrossRef]
- Kaveh, N.; Ebrahimi, A.; Asadi, E. Comparative analysis of random forest, exploratory regression, and structural equation modeling for screening key environmental variables in evaluating rangeland above-ground biomass. Ecol. Inform. 2023, 77, 102251. [Google Scholar] [CrossRef]
- Bognounou, F.; Paré, D.; Laganière, J. Changes in seedlings’ composition and abundance following soil scarification and amendments in a northern hardwood forest. For. Ecol. Manag. 2023, 541, 121071. [Google Scholar] [CrossRef]
- Chou, Y.; Sheng, Y.; Wei, Z. Temperature and deformation differences between southern and northern slopes of highway embankment on permafrost. J. Rock Mech. Eng. 2009, 28, 1896–1903. [Google Scholar]
- Cuo, L.; Zhao, H.; Zhang, Y.; Li, N.; Liang, L.; Liu, Z.; Ding, J.; Zhu, F. Spatiotemporally heterogeneous soil thermohydraulic processes in the frozen soil of the Tibetan Plateau. Geoderma 2023, 438, 116634. [Google Scholar] [CrossRef]
- Saurette, D. Comparing direct and indirect approaches to predicting soil texture class. Can. J. Soil Sci. 2022, 102, 835–851. [Google Scholar] [CrossRef]
- Shi, W.; Zhang, M. Progress on spatial prediction methods for soil particle-size fractions. J. Geogr. Sci. 2023, 33, 1553–1566. [Google Scholar] [CrossRef]
- Akpa, S.I.; Odeh, I.O.; Bishop, T.F.; Hartemink, A.E. Digital mapping of soil particle-size fractions for Nigeria. Soil Sci. Soc. Am. J. 2014, 78, 1953–1966. [Google Scholar] [CrossRef]
- Adhikari, K.; Kheir, R.B.; Greve, M.B.; Bøcher, P.K.; Malone, B.P.; Minasny, B.; McBratney, A.B.; Greve, M. High-resolution 3-D mapping of soil texture in Denmark. Soil Sci. Soc. Am. J. 2013, 77, 860–876. [Google Scholar] [CrossRef]
- Rossel, R.V.; Chen, C.; Grundy, M.; Searle, R.; Clifford, D.; Campbell, P. The Australian three-dimensional soil grid: Australia’s contribution to the GlobalSoilMap project. Soil Res. 2015, 53, 845–864. [Google Scholar] [CrossRef]
- Mulder, V.L.; Lacoste, M.; Richer-de-Forges, A.C.; Arrouays, D. GlobalSoilMap France: High-resolution spatial modelling the soils of France up to two meter depth. Sci. Total Environ. 2016, 573, 1352–1369. [Google Scholar] [CrossRef] [PubMed]
- Padarian, J.; Minasny, B.; McBratney, A. Chile and the Chilean soil grid: A contribution to GlobalSoilMap. Geoderma Reg. 2017, 9, 17–28. [Google Scholar] [CrossRef]
- Kumar, P.; Kumar, P.; Verma, V.; Irfan, M.; Sharma, R.; Bhargava, B. How plants conquered land: Evolution of terrestrial adaptation. J. Evol. Biol. 2023, 35, 5–14. [Google Scholar]
- Kammann, S.; Leinweber, P.; Glaser, K.; Schiefelbein, U.; Dolnik, C.; Mikhailyuk, T.; Demchenko, E.; Heilmann, E.; Karsten, U. Successional development of the phototrophic community in biological soil crusts, along with soil formation on Holocene deposits at the Baltic Sea coast. Front. Ecol. Evol. 2024, 11, 1266209. [Google Scholar] [CrossRef]
- Wang, P.; Su, X.; Zhou, Z.; Wang, N.; Zhu, B. Differential effects of soil texture and root traits on the spatial variability of soil infiltrability under natural revegetation in the Loess Plateau of China. Catena 2023, 220, 106693. [Google Scholar] [CrossRef]
- Kartalaei, Z.M.; Kooch, Y.; Tilaki, G. Litter and soil properties under woody and non-woody vegetation types: Implication for ecosystem management in a mountainous semi-arid landscape. J. Environ. Manag. 2023, 348, 119238. [Google Scholar] [CrossRef]
- Felegari, S.; Sharifi, A.; Moravej, K.; Golchin, A.; Tariq, A. Investigation of the relationship between ndvi index, soil moisture, and precipitation data using satellite images. Sustain. Agric. Syst. Technol. 2022, 2022, 314–325. [Google Scholar]
- Zhang, X.; Nan, Z.; Wu, J.; Du, E.; Wang, T.; You, Y.; Regions, A. Mountain permafrost distribution modeling using Multivariate Adaptive Regression Spline (MARS) in the Wenquan area over the Qinghai-Tibet Plateau. Sci. Cold Arid Reg. 2012, 4, 361–370. [Google Scholar]
- Zhao, T.; Bai, H.; Han, H.; Ta, Z.; Li, P.; Wang, P. A Quantitatively Divided Approach for the Vertical Belt of Vegetation Based on NDVI and DEM—An Analysis of Taibai Mountain. Forests 2023, 14, 1981. [Google Scholar] [CrossRef]
- Volkov, I.; Volkova, I. Are There Mountain Xerphytes in the Mountains of South Siberia? Arid Ecosyst. 2023, 13, 395–402. [Google Scholar] [CrossRef]
- Wei, G.; Weisai, L.; Zhou, Z.; Wu, X.; Gao, S.; Fu, Z.; Wu, Q.; Jiang, G. Impact of a retrogressive thaw slump on surrounding vegetation communities in the Fenghuoshan mountains, Qinghai-Tibet Plateau. Res. Cold Arid Reg. 2023, 15, 11–17. [Google Scholar] [CrossRef]
- Sun, X.; Li, S.; Zhai, X.; Wei, X.; Yan, C. Ecosystem changes revealed by land cover in the three-river headwaters region of Qinghai, China (1990–2015). Res. Cold Arid Reg. 2023, 15, 85–91. [Google Scholar] [CrossRef]

| Soils | Coordinates | Elevation (m) | Slope (°) | Aspect (°) | Layers | Depth (cm) | PH (%) | TN (%) | TP (%) | TK (%) | Mg2+ (mg/kg) | Na+ (mg/kg) | |
|---|---|---|---|---|---|---|---|---|---|---|---|---|---|
| (N) | (E) | ||||||||||||
| IEFK (Pachic Haplocryolls) | 35.46 | 99.49 | 4200 | 4 | 260 | A1 | 0–15 | 7.66 | 0.380 | 0.040 | 1.700 | 29.26 | 3.73 |
| A2 | 15–40 | 7.97 | 0.375 | 0.040 | 1.440 | 42.59 | 176.00 | ||||||
| A3 | 40–50 | 8.03 | 0.274 | 0.037 | 1.420 | 125.19 | 65.44 | ||||||
| 2Bk | 50–100 | 8.23 | 0.085 | 0.012 | 1.760 | 34.32 | 73.19 | ||||||
| 2Cr | 100–215 | 8.30 | 0.063 | 0.007 | 1.910 | 75.05 | 40.52 | ||||||
| IEFP (Typic Haplocryolls) | 35.46 | 99.49 | 4240 | 2 | 300 | A | 0–30 | 8.02 | 0.168 | 0.045 | 1.060 | 79.06 | 92.81 |
| 2Bw1 | 30–80 | 9.02 | 0.076 | 0.006 | 0.990 | 158.29 | 311.67 | ||||||
| 2Bw2 | 80–110 | 8.72 | 0.092 | 0.009 | 0.800 | 91.23 | 319.60 | ||||||
| 2Cr | 110–200 | 9.52 | 0.063 | 0.006 | 0.940 | 54.74 | 265.69 | ||||||
| KDAO (Typic Humicryepts) | 35.48 | 99.49 | 4334 | 13 | 225 | A | 0–25 | 8.02 | 0.183 | 0.055 | 1.300 | 67.05 | 34.99 |
| Bw | 25–90 | 7.97 | 0.095 | 0.033 | 1.310 | 36.48 | 33.66 | ||||||
| Crk/B | 90–120 | 8.04 | 0.09 | 0.055 | 1.600 | 36.53 | 35.29 | ||||||
| Crk | 120–330 | 8.08 | 0.059 | 0.062 | 1.540 | 54.82 | 47.46 | ||||||
| KDAN (Eutric Humicryepts) | 35.54 | 99.51 | 4247 | 6 | 110 | A1 | 0–5 | 6.72 | 0.800 | 0.067 | 1.600 | 49.54 | 6.18 |
| A2 | 5–16 | 7.10 | 0.704 | 0.084 | 1.500 | 23.17 | 6.26 | ||||||
| Bg1 | 16–30 | 7.10 | 0.257 | 0.050 | 1.320 | 46.54 | 1.26 | ||||||
| 2Bg2 | 30–50 | 7.27 | 0.196 | 0.057 | 1.700 | 6.08 | 1.27 | ||||||
| 2Bw | 50–100 | 7.82 | 0.048 | 0.060 | 1.620 | 8.51 | 6.20 | ||||||
| 2C | 100–220 | 7.90 | 0.048 | 0.070 | 1.380 | 26.75 | 1.26 | ||||||
| KDDM9 (Fluventic Haplocryepts) | 35.66 | 99.54 | 3884 | 0.5 | 10 | A | 0–5 | 7.61 | 0.327 | 0.051 | 0.970 | 55.26 | 21.01 |
| Bw | 5–10 | 7.60 | 0.154 | 0.055 | 1.530 | 41.43 | 61.02 | ||||||
| Ab1 | 10–23 | 7.63 | 0.673 | 0.061 | 1.100 | 80.42 | 100.64 | ||||||
| Bwb1 | 23–52 | 7.84 | 0.138 | 0.048 | 1.480 | 43.90 | 21.00 | ||||||
| Ab2 | 52–65 | 7.85 | 0.290 | 0.051 | 1.560 | 51.11 | 18.52 | ||||||
| Bwb2 | 65–95 | 7.44 | 0.073 | 0.045 | 1.770 | 14.60 | 1.27 | ||||||
| Bgb2 | 95–200 | 7.27 | 0.108 | 0.042 | 2.090 | 20.67 | 8.65 | ||||||
| Predictor | Description | Resolution | Factors |
|---|---|---|---|
| Elevation | Elevation above sea level (m) | 30 m | r |
| Aspect | Aspect gradient | 30 m | r |
| Slope | Slope gradient | 30 m | r |
| Plan | Plan curvature | 30 m | r |
| Profile | Profile curvature | 30 m | r |
| TWI | topographic wetness index | 30 m | r |
| MAP | Annual precipitation (mm) | 1 km | c |
| MAT | Annual mean temperature (°C) | 1 km | c |
| NDVI | Mean NDVI during the growing season | 30 m | o, c |
| EVI | Enhanced Vegetation Index | 30 m | o, c |
| Depth (cm) | Min (%) | Max (%) | Mean (%) | SD (%) | CV | Skewness | Kurtosis |
|---|---|---|---|---|---|---|---|
| Clay | |||||||
| 0–5 | 3.77 | 26.35 | 15.27 | 5.39 | 0.35 | 0.09 | −0.84 |
| 5–15 | 3.77 | 32.66 | 15.19 | 6.08 | 0.40 | 0.51 | −0.17 |
| 15–30 | 2.99 | 27.93 | 12.13 | 5.93 | 0.49 | 0.73 | −0.03 |
| 30–60 | 1.02 | 19.65 | 9.54 | 4.76 | 0.50 | 0.58 | −0.74 |
| 60–100 | 1.75 | 17.54 | 7.51 | 3.98 | 0.53 | 0.72 | −0.47 |
| 100–200 | 0.58 | 23.34 | 7.14 | 4.72 | 0.66 | 1.31 | 1.88 |
| Silt | |||||||
| 0–5 | 3.47 | 17.07 | 9.28 | 3.11 | 0.34 | 0.34 | −0.25 |
| 5–15 | 3.47 | 21.11 | 9.72 | 3.90 | 0.40 | 0.77 | 0.35 |
| 15–30 | 2.51 | 20.04 | 9.12 | 3.51 | 0.38 | 0.89 | 1.23 |
| 30–60 | 2.51 | 17.36 | 8.61 | 3.37 | 0.39 | 0.55 | −0.06 |
| 60–100 | 1.81 | 17.36 | 7.98 | 3.38 | 0.44 | 0.77 | 0.56 |
| 100–200 | 1.58 | 19.49 | 7.46 | 3.83 | 0.51 | 1.20 | 1.67 |
| Sand | |||||||
| 0–5 | 58.27 | 90.84 | 75.45 | 7.92 | 0.10 | −0.19 | −0.85 |
| 5–15 | 46.23 | 90.97 | 75.09 | 9.58 | 0.13 | −0.64 | 0.08 |
| 15–30 | 52.02 | 92.99 | 78.75 | 9.30 | 0.12 | −0.85 | 0.36 |
| 30–60 | 64.61 | 92.42 | 81.86 | 7.61 | 0.09 | −0.67 | −0.62 |
| 60–100 | 65.10 | 95.93 | 84.51 | 6.91 | 0.08 | −0.89 | 0.18 |
| 100–200 | 57.16 | 97.25 | 85.40 | 7.90 | 0.09 | −1.57 | 1.13 |
| Depth (cm) | R2 | RMSE (%) | ME (%) |
|---|---|---|---|
| Clay | |||
| 0–5 | 0.21 | 4.49 | 0.98 |
| 5–15 | 0.25 | 4.84 | 0.89 |
| 15–30 | 0.27 | 4.68 | 1.12 |
| 30–60 | 0.32 | 4.19 | 1.08 |
| 60–100 | 0.24 | 4.01 | 0.90 |
| 100–200 | 0.26 | 4.43 | 1.27 |
| Silt | |||
| 0–5 | 0.30 | 2.91 | 0.58 |
| 5–15 | 0.21 | 3.67 | 0.65 |
| 15–30 | 0.32 | 2.01 | 0.67 |
| 30–60 | 0.28 | 2.75 | 0.60 |
| 60–100 | 0.25 | 3.19 | 0.64 |
| 100–200 | 0.23 | 3.61 | 0.79 |
| Sand | |||
| 0–5 | 0.28 | 6.56 | 0.25 |
| 5–15 | 0.21 | 7.82 | 0.71 |
| 15–30 | 0.24 | 7.15 | 0.66 |
| 30–60 | 0.31 | 5.83 | 0.23 |
| 60–100 | 0.26 | 6.58 | 0.44 |
| 100–200 | 0.23 | 7.62 | 0.52 |
Disclaimer/Publisher’s Note: The statements, opinions and data contained in all publications are solely those of the individual author(s) and contributor(s) and not of MDPI and/or the editor(s). MDPI and/or the editor(s) disclaim responsibility for any injury to people or property resulting from any ideas, methods, instructions or products referred to in the content. |
© 2024 by the authors. Licensee MDPI, Basel, Switzerland. This article is an open access article distributed under the terms and conditions of the Creative Commons Attribution (CC BY) license (https://creativecommons.org/licenses/by/4.0/).
Share and Cite
Li, W.; Liu, Y.; Wu, X.; Zhao, L.; Wu, T.; Hu, G.; Zou, D.; Qiao, Y.; Fan, X.; Wang, X. Soil Texture Mapping in the Permafrost Region: A Case Study on the Eastern Qinghai–Tibet Plateau. Land 2024, 13, 1855. https://doi.org/10.3390/land13111855
Li W, Liu Y, Wu X, Zhao L, Wu T, Hu G, Zou D, Qiao Y, Fan X, Wang X. Soil Texture Mapping in the Permafrost Region: A Case Study on the Eastern Qinghai–Tibet Plateau. Land. 2024; 13(11):1855. https://doi.org/10.3390/land13111855
Chicago/Turabian StyleLi, Wangping, Yadong Liu, Xiaodong Wu, Lin Zhao, Tonghua Wu, Guojie Hu, Defu Zou, Yongping Qiao, Xiaoying Fan, and Xiaoxian Wang. 2024. "Soil Texture Mapping in the Permafrost Region: A Case Study on the Eastern Qinghai–Tibet Plateau" Land 13, no. 11: 1855. https://doi.org/10.3390/land13111855
APA StyleLi, W., Liu, Y., Wu, X., Zhao, L., Wu, T., Hu, G., Zou, D., Qiao, Y., Fan, X., & Wang, X. (2024). Soil Texture Mapping in the Permafrost Region: A Case Study on the Eastern Qinghai–Tibet Plateau. Land, 13(11), 1855. https://doi.org/10.3390/land13111855