Article

MMS-EF: A Multi-Scale Modular Extraction Framework for Enhancing Deep Learning Models in Remote Sensing

1
School of Mapping and Geoscience, Liaoning Technical University, Fuxin 123000, China
2
Collaborative Innovation Institute of Geospatial Information Service, Liaoning Technical University, Fuxin 123000, China
*
Author to whom correspondence should be addressed.
Land 2024, 13(11), 1842; https://doi.org/10.3390/land13111842
Submission received: 12 October 2024 / Revised: 1 November 2024 / Accepted: 4 November 2024 / Published: 5 November 2024

Abstract

:
The analysis of land cover using deep learning techniques plays a pivotal role in understanding land use dynamics, which is crucial for land management, urban planning, and cartography. However, due to the complexity of remote sensing images, deep learning models face practical challenges in the preprocessing stage, such as incomplete extraction of large-scale geographic features, loss of fine details, and misalignment issues in image stitching. To address these issues, this paper introduces the Multi-Scale Modular Extraction Framework (MMS-EF) specifically designed to enhance deep learning models in remote sensing applications. The framework incorporates three key components: (1) a multiscale overlapping segmentation module that captures comprehensive geographical information through multi-channel and multiscale processing, ensuring the integrity of large-scale features; (2) a multiscale feature fusion module that integrates local and global features, facilitating seamless image stitching and improving classification accuracy; and (3) a detail enhancement module that refines the extraction of small-scale features, enriching the semantic information of the imagery. Extensive experiments were conducted across various deep learning models, and the framework was validated on two public datasets. The results demonstrate that the proposed approach effectively mitigates the limitations of traditional preprocessing methods, significantly improving feature extraction accuracy and exhibiting strong adaptability across different datasets.

1. Introduction

In the field of land use classification, deep learning technology successfully learns and extracts feature characteristics from complex remote sensing images by using a large amount of remote sensing image data training, shows excellent adaptability and processing ability in diverse remote sensing image classification tasks, and improves efficiency and accuracy in feature information extraction using remote sensing image data [1,2,3,4]. Herein, Convolutional Neural Networks (CNNs) operationalize segmented objects as the fundamental processing units to achieve high-precision feature extraction from remote sensing data. Transformer-based models, integrating self-attention mechanisms, are well-equipped for the extraction of global image features. Currently, deep learning has found wide-ranging applications in tasks involving the extraction of features from remote sensing imagery [5,6,7,8,9].
Due to the large size and high complexity of remote sensing images, in land use classification tasks, researchers often use image segmentation into specifically sized tiles or down-sampling for preprocessing in order to reduce computational memory and meet model input limitations [10,11]. However, due to potential scale-induced variances in representations of the same land cover category within remote sensing imagery [12], such approaches may encounter several issues: (i) sizeable and complex geographical features may be insufficiently captured due to the limitations of single-scale image slicing, leading to omissions and mis-extractions [13,14]; (ii) direct stitching of the network-extracted sub-maps without contextual information could result in biases, culminating in discontinuities within the stitched imagery [15]; and (iii) down-sampling can lead to the loss of image details, thereby precluding accurate identification of small objects and failing to exhaustively extract features due to a lack of scale data [16].
To address the problem of incomplete feature cuts due to single-scale cuts, Ding et al. adopted the strategy of feature fusion, which integrates global feature mapping and local feature mapping from different layers by introducing contextual information in the form of jump splicing in the network structure [17,18]; to reduce splicing bias, Xu introduced a splicing optimization algorithm, which reduces the loss of information at the splicing boundaries and enhances the feature boundaries’ consistency [19]; and to reduce information loss after the down-sampling of an image, Dosovitskiy introduced the method of attention mechanism to enhance the feature details of remote sensing images [20]. However, feature fusion methods contain different layers of feature mappings, which have different information-providing capabilities and may conflict with each other, resulting in the accumulation of noisy information unrelated to the extraction task [7]; the stitching optimization algorithm, although helping to improve the consistency of feature boundaries, may misjudge the features at the boundaries of the remotely sensed image, resulting in discontinuous feature boundaries [21]. A method that introduces the attention mechanism is applied through the convolution operation to extract feature relationships in the local range; however, it is difficult to use global information to infer the importance of local features [22].
Addressing the aforementioned issues is crucial for improving land cover classification accuracy. Therefore, in the following paper, an MMS-EF is used to process remote sensing images and extract feature information, comprising a multi-scale tile overlapping segmentation module, a multi-scale fusion module, and a detail enhancement module. In the multi-scale tile segmentation module, an extraction method with overlapping regions is employed [23,24]. This tile-based extraction method maintains the consistency and continuity of remote sensing images across different scales, increasing the input scale of images to capture multi-scale feature information. In the multi-scale fusion module, stitching and fusion techniques are applied to handle the overlapping regions of multiple image sub-blocks, reducing image boundary distortion, preserving boundary feature information, and achieving smooth image stitching. Additionally, a multi-scale feature fusion mechanism is introduced to integrate feature information across different scales, enhancing information sharing among multiple scales and features, and achieving complementary global information. Finally, in the detail enhancement module, detail enhancement techniques are applied to optimize the feature extraction results, enhance feature details, and improve the robustness and classification accuracy of the algorithm.
The contributions of the study described herein are summarized as follows:
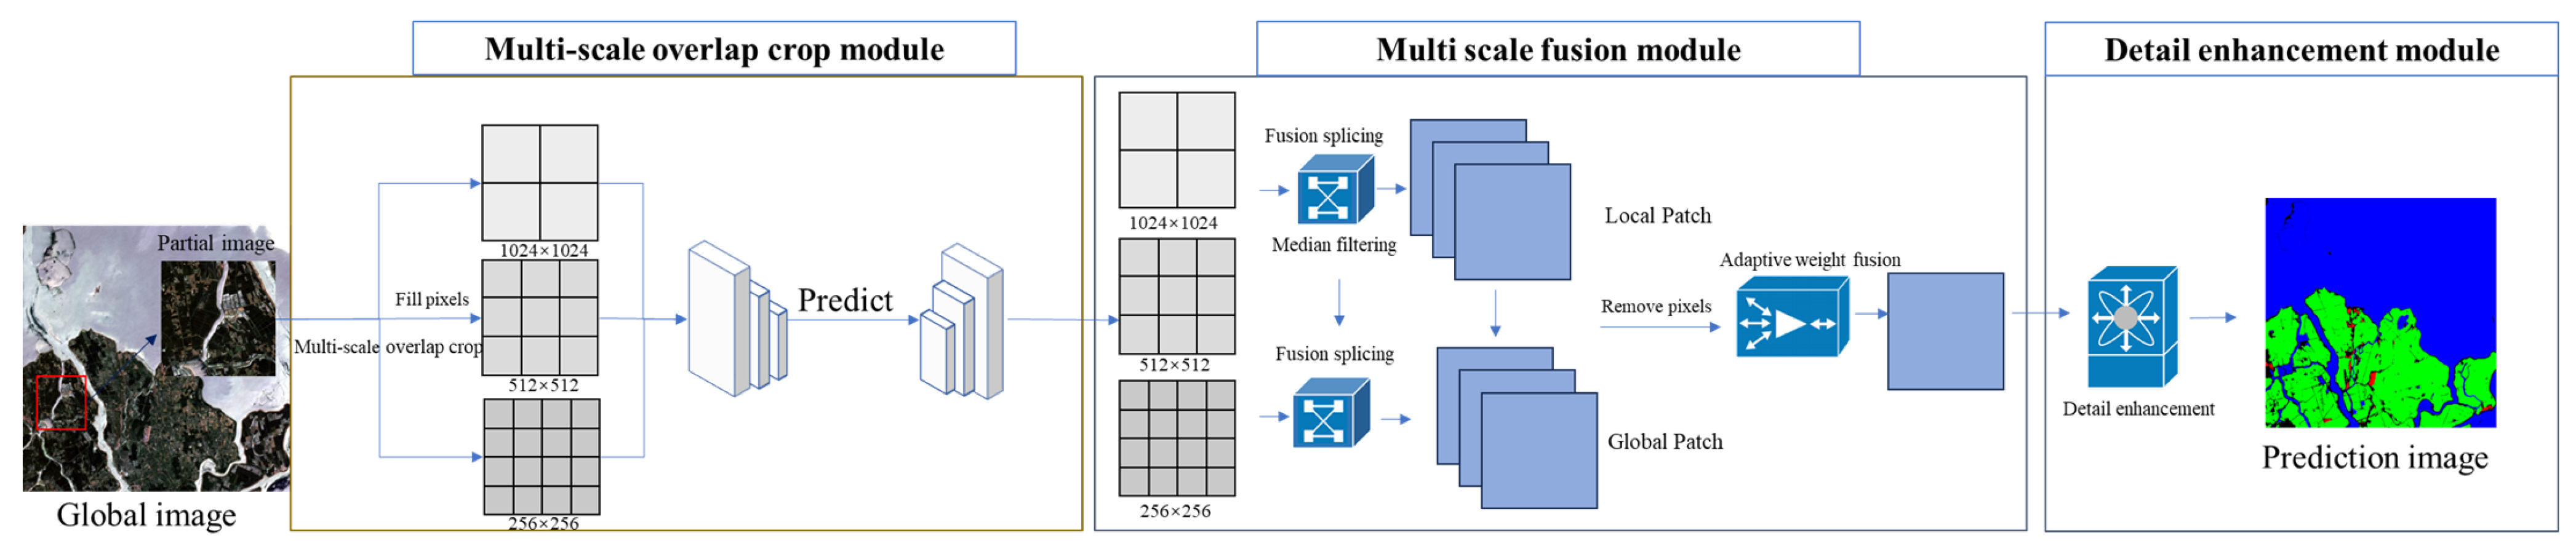
  • The proposed multi-scale geographical feature extraction methodology enables the processing of remote sensing imagery across multiple scales and branches, integrating multi-scale feature fusion and detail enhancement techniques to facilitate the multi-scale extraction, fusion, representation, and augmentation of remote sensing imagery.
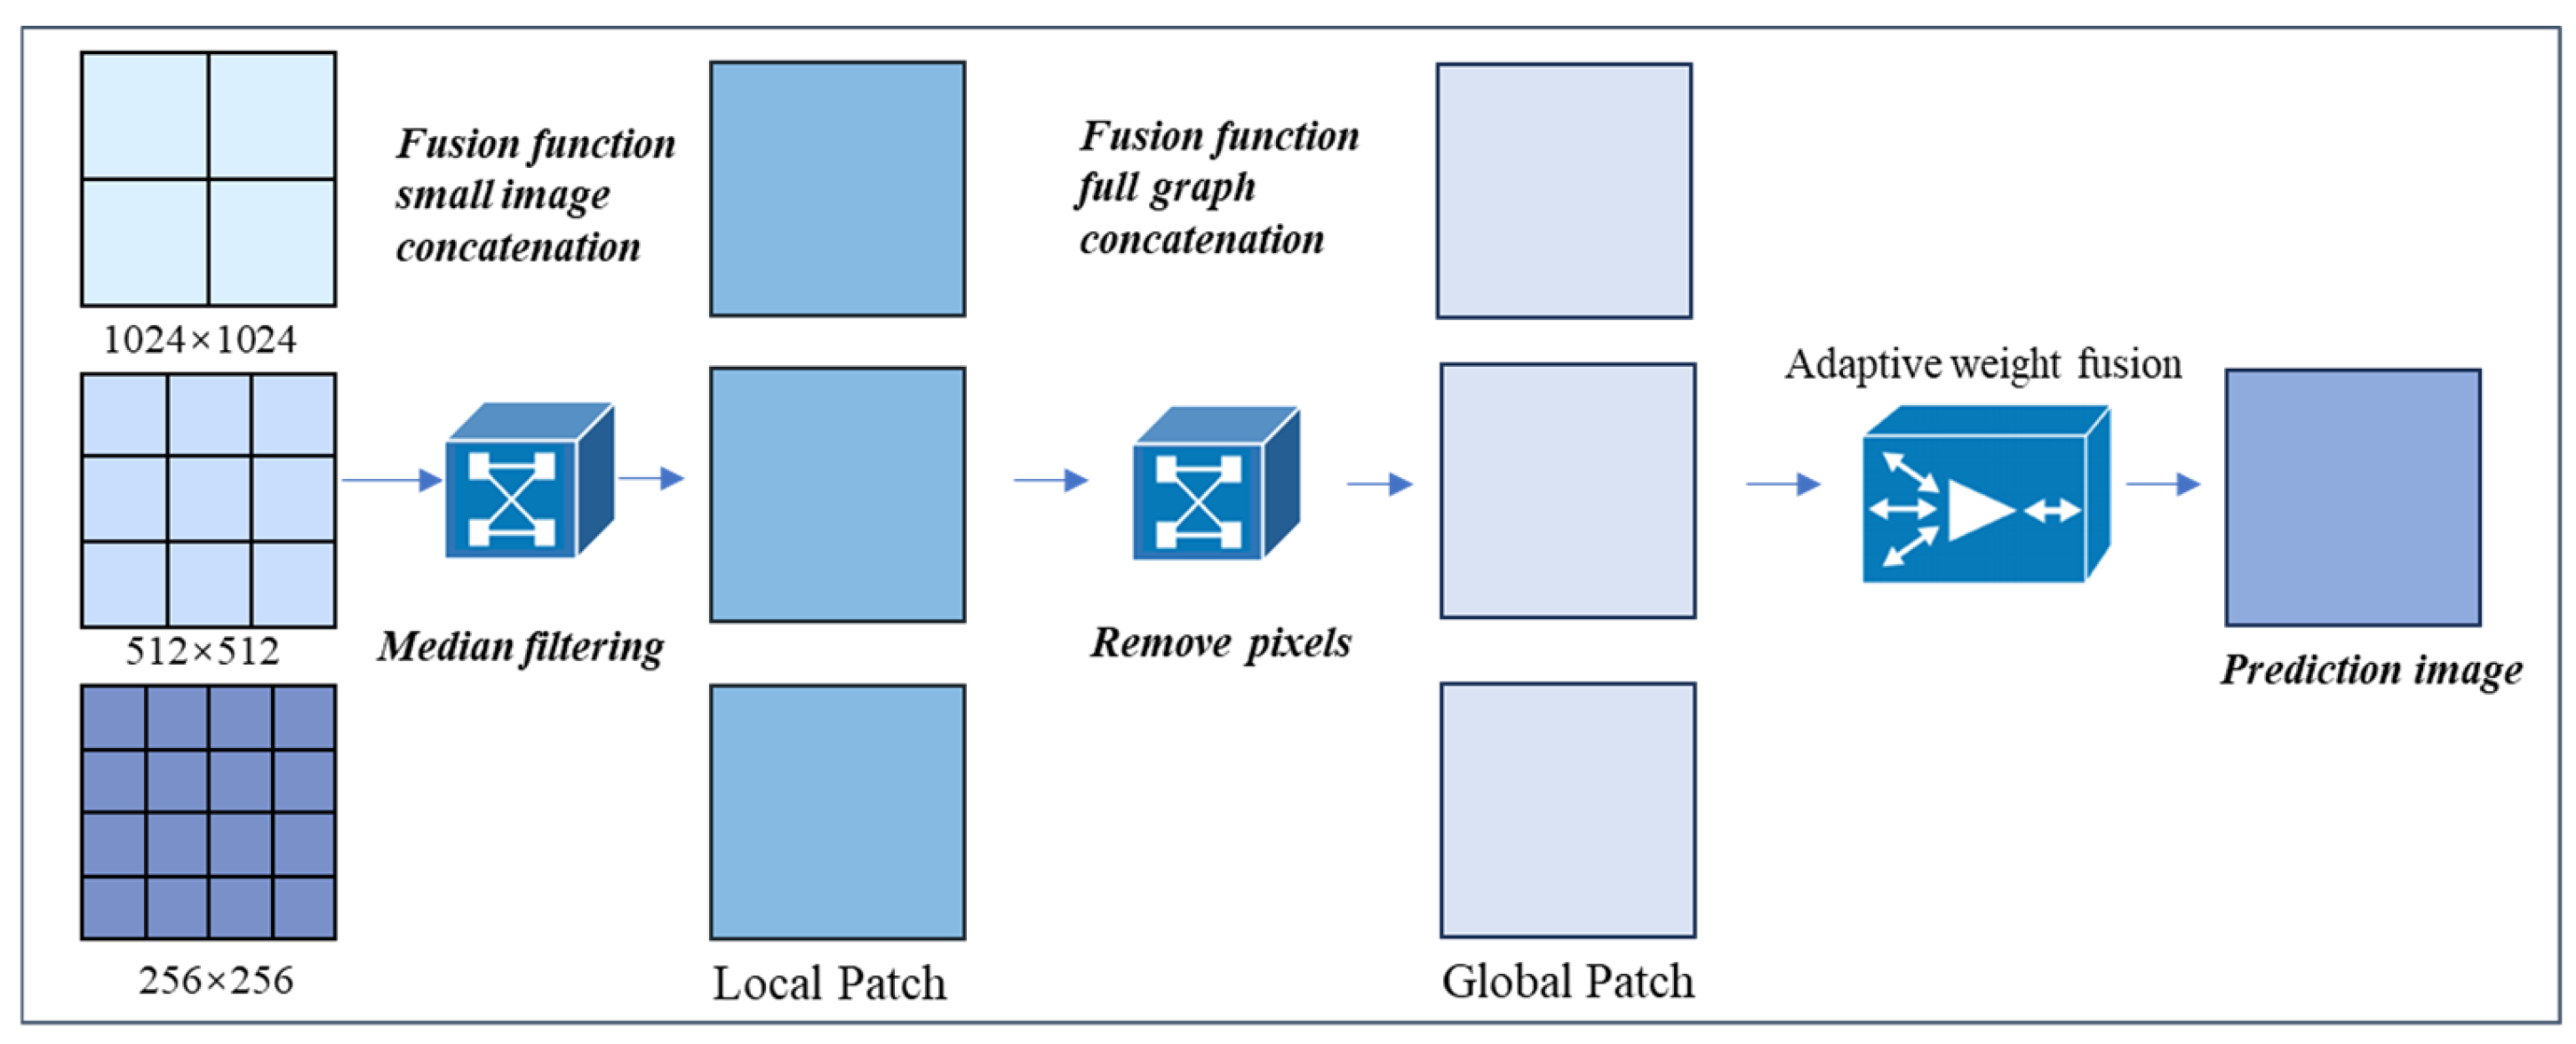
  • The designed fusion function diminishes image boundary distortion, conserves geographical feature information, and facilitates smooth image stitching, thus reducing the incidence of stitching errors. The adaptive fusion function dynamically modulates the weighting of multi-scale information within the fusion, enriching the feature portrayal and enhancing the overall quality of the fusion.
  • The multi-scale image perception module developed herein manifests substantial adaptability and generalizability across diverse network models and data sources.
The present paper is organized as follows: Section 2 introduces the remote sensing image dataset and the deep learning model used for the experiments in the study; Section 3 introduces the multi-scale image perception method designed in this study; Section 4 provides a description of the experimental results; Section 5 presents discussion and analysis of the results; and Section 6 provides a summary of the contributions of the algorithms presented herein.

2. Datasets and Deep Learning Models

2.1. Dataset Composition

The Global Land Cover Dataset (GID) was constructed using high-resolution imagery from the China GF-2 satellite, offering comprehensive coverage [25]. For the present study, we selected the GID-5 subset from the GID as our experimental sample. This subset encompasses 150 GF-2 images annotated at the pixel level, with the dimensions of each image being 6800 × 7200 pixels, spanning varied geographical regions across China. For the experiments detailed in this present paper, 120 images from the GID were allocated to the training set, and the remaining 30 images were designated as the test set.

2.2. Experimental Models

The experiment performed in the study presented herein involves the application of five advanced network models combining CNNs and Transformers [26]:
  • U-Net: U-Net adopts an encoder–decoder structure, rendering the entire network an end-to-end fully convolutional system. Its architecture and skip connection mechanism play a pivotal role in preserving extensive spatial information from remote sensing imagery, making it particularly adept at handling remote sensing imagery extraction tasks of varying sizes and types, especially formidable in processing small sample sizes [27].
  • PSPNet: PSPNet leverages a pyramid pooling module to effectively capture multi-scale information in remote sensing classification tasks. By dividing the acquired feature layers into different-sized grids, each undergoing separate average pooling, it aggregates contextual information from various regions, thereby enhancing the model’s perceptual capacity across the entirety of remote sensing imagery [28].
  • DeeplabV3+: DeeplabV3+ employs an atrous spatial pyramid pooling (ASPP) module for the integration of multi-scale information within remote sensing imagery, thereby augmenting the understanding of both global and local information. The application of atrous convolution and depth-wise separable convolution techniques significantly reduces computational complexity and the number of parameters, enhancing the model’s efficiency. The feature fusion module merges high-level semantic information with comprehensive low-level details, improving the accuracy and robustness of remote sensing imagery extraction results [29].
  • HRNet: HRNet maintains high-resolution representations through parallel connections of high- and low-resolution convolutions, further executing multi-resolution fusion across parallels to enhance high-resolution expressions. It preserves the detail information of high-resolution remote sensing images and enhances model performance through the integration of multi-scale features [30].
  • SegFormer: As an efficient image segmentation encoder–decoder architecture, SegFormer utilizes multi-layer Transformer encoders to capture multi-scale features. Coupled with lightweight Multilayer Perceptrons (MLPs) for semantic information aggregation across different layers, its parallel processing capabilities afford it higher efficiency and speed in handling remote sensing imagery. Furthermore, its scalability and adaptability make it suitable for remote sensing imagery extraction tasks of various sizes and complexities [31].

3. Multi-Scale Modular Extraction Framework

The selected models for the land cover classification task in remote sensing images exhibit various advantages and high accuracy. However, due to the limitations of fixed-scale input sizes, these models face issues such as an incomplete reading of complex features, stitching deviations from direct stitching, loss of detail due to lack of scale information, and boundary blurring. To address these issues while ensuring the integrity of the model structure, in this paper, an MMS-EF is used to process remote sensing images and extract feature information. This technique includes a multi-scale tile overlapping segmentation module, a multi-scale fusion module, and a detail enhancement module. The multi-scale tile overlapping segmentation module is applied during the input stage of the network model, allowing for the multi-scale input of remote sensing images. The multi-scale fusion module and detail enhancement module are applied during the output stage of the model, focusing on the stitching, fusion, and enhancement of the predicted images.
The design methodology used in the present study is illustrated in Figure 1. In this method, the original remote sensing image is first input, with the red box indicating an example of the input image segment. The multi-scale tile overlapping segmentation module divides the remote sensing image into multiple sub-images through multi-scale input. Subsequently, these multi-scale sub-images are fed into the network model for prediction, resulting in multi-scale image outputs. Next, the multi-scale fusion module performs multi-level stitching and multi-scale fusion on the local and global branches of the remote sensing images, generating a fused prediction map. Finally, the detail enhancement module further enhances the semantic information of the predicted remote sensing image.

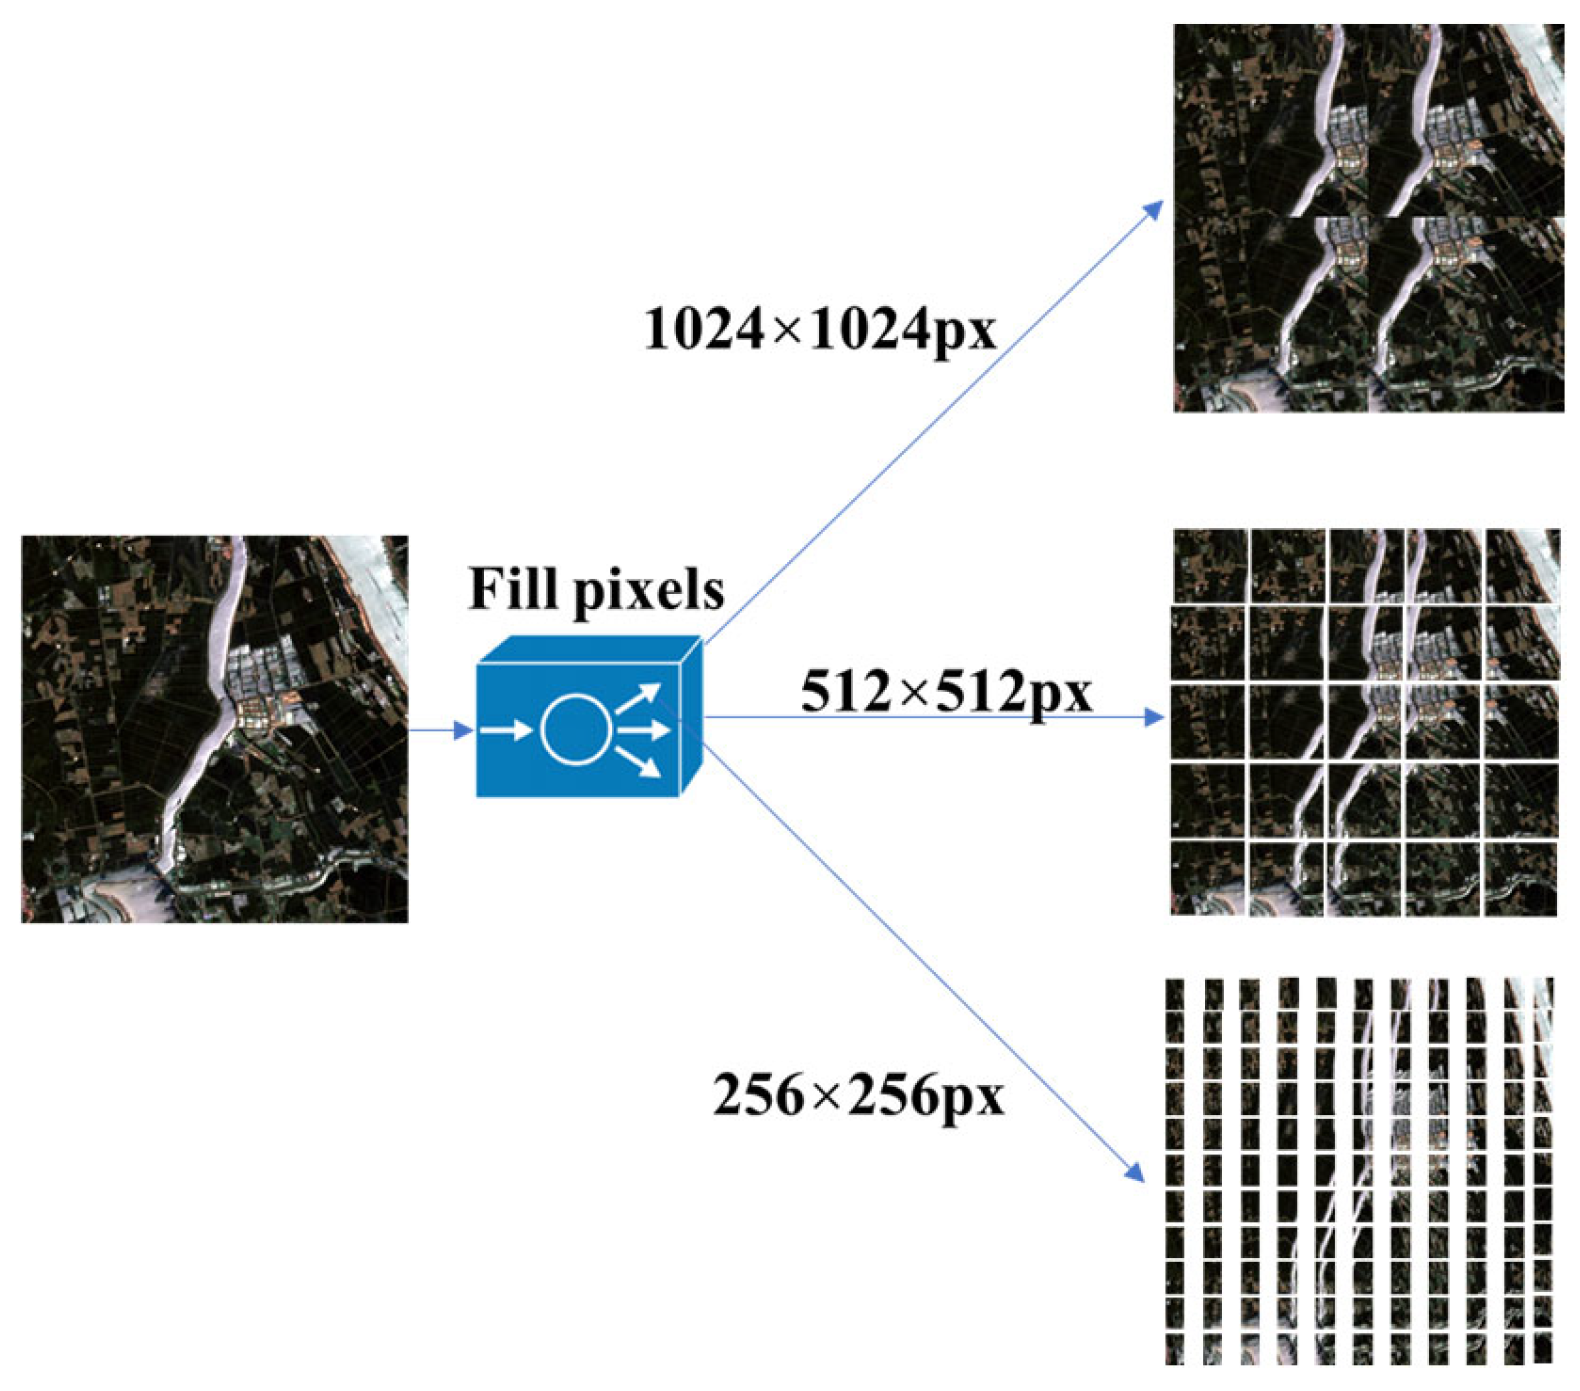
3.1. Multi-Scale Overlapping Tile Segmentation Module

To address the issues of single-scale model input and incomplete segmentation of complex objects that can lead to incorrect identification by network models, we designed a multi-scale overlapping tile segmentation module. This module divides remote sensing imagery into multiple overlapping sub-regions of different scales, increasing interaction within the imagery and enabling network models to extract and better understand feature details and the overall information of objects at multiple scales.
Within the multi-scale overlapping tile segmentation module, to ensure the integrity of the objects, we first performed pixel padding on the remote sensing imagery to meet the requirements for multiples of the desired segment size. We then selected tile sizes of 256 × 256 px, 512 × 512 px, and 1024 × 1024 px for multi-scale overlapping segmentation, producing multi-scale remote sensing image sub-maps, as shown in Figure 2.

3.2. Multi-Scale Fusion Module

In order to overcome the misalignment and false extraction problems caused by fixed scale tile segmentation methods at the splicing point (mainly due to the lack of contextual semantic information), and to solve the detail loss and edge blur problems caused by down-sampling due to insufficient multi-scale information, in the present study, a multi-scale fusion module was designed. This module includes two key elements, the fusion function and the adaptive weighting function, which are, respectively, used for the precise stitching of multi-organization sub-images and the optimized fusion of predicted remote sensing images.
Before using a multi-scale tile fusion module for processing, in this study, the median filtering algorithm was utilized to reduce noise interference, using the principle of replacing the original pixel values with the median of adjacent pixel values. This method preserves the main edge and structural features of the image while eliminating noise [32,33], as shown in Figure 3.
The fusion function within the multi-scale fusion module is applied across overlapping regions of different-scale sub-maps. By meticulously controlling multi-level image fusion, it facilitates the efficient stitching and fusion of multiple sets of multi-scale predictive images across various levels. Through fine processing within the overlapping areas, this function guarantees the continuity and smoothness of transitions between image regions, effectively preventing misalignment issues at stitching points and maximizing the preservation of object details. The precise formulation of the fusion function is as follows (Equation (1)):
y = 1 1 + e k x
where x represents the input variable, k denotes the slope parameter controlling the curve of the function, and y is the output, ensuring a smooth image transition within a range of 0 to 1.
In the process of multi-scale image fusion, the fusion function is first used to calculate the weights of overlapping regions. Specifically, based on the image input x and the slope parameter k of the control curve shape, a logic function weight array y is generated to ensure a smooth transition of the image in the overlapping area. Next, in the fusion function, the dimension of the output image is determined based on the desired fusion direction (left or right or up or down). In the actual operation of image fusion, image channel data are extracted sequentially for each channel, and weights are extended in rows or columns according to the fusion direction. In the context of left–right fusion, weighted average calculation is performed on each pixel in the overlapping area to ensure seamless connection. In the context of top–down fusion, similar smoothing effects are achieved through column expanded weights. Finally, the fusion results of each channel are merged into an output image, achieving smooth transitions and high-precision stitching between images of different scales.
The adaptive weighting function in the multi-scale tile fusion module integrates gradient information, color histogram data, and pixel clustering information from multiple images [34,35,36,37,38,39], facilitating the fusion of multi-scale predictive remote sensing imagery sets. Gradient information aids in preserving the edge and detail features of the image; color histogram data offer a distribution of the image’s color, while clustering information reflects color characteristics and similarities within the image. Specifically, gradient information ensures the clarity and detail accuracy of images; color histograms serve as a reference for the overall color distribution, maintaining color consistency; and pixel clustering information, by showcasing color features and similarities, ensures the correct fusion of similar regions via comprehensive exploitation of these data sources; the adaptive weighting function balances the features across various scales of the imagery, intricately depicting both the details and the overall context of the objects, thereby achieving precise image fusion. The specific expression for the adaptive weighting function is as follows (Equation (2)):
w i = 1 ( m i + e 5 ) h i h j + e 5 h i + h j + e 5 1 l i l j + e 5
where w i is the weight value for the i th image, m i represents the gradient magnitude of the image, h i and h j indicate the color histogram differences between adjacent pixels, and l i and l j denote the cluster label differences, the introduction of e 5 is to prevent the formula from being invalidated due to excessively small values.
The adaptive weight fusion function calculates the gradient of each image through the Sobel operator to obtain the intensity map of image edge and detail information. Simultaneously, we calculated the color histogram of each image to capture the color distribution. Then, we performed K-means clustering on the color histogram to obtain the similarity labels of the image in the color space. By combining features such as gradients, color differences, and clustering labels, adaptive weights were calculated for each image to better preserve edge, color consistency, and region similarity during fusion. Finally, the preliminary fusion result was obtained by weighting and reducing the image, and then enlarging it to the original resolution to obtain the final fused image output.
The multi-scale fusion module is shown in Figure 4. In this module, the median filtering technique is first used to eliminate noise, and then the fusion function is used to concatenate multi-scale image sub-images to generate a pixel-filled remote sensing image prediction map. Next, the filled pixels during the stitching process are corrected to obtain multiple predicted images that are consistent in size with the original image. Finally, the adaptive weight function is applied to fuse the global prediction map and obtain the remote sensing image fusion prediction map.

3.3. Detail Enhancement Module

To further enhance the detailed information on remote sensing imagery and represent its features with greater precision, in this study, a detail enhancement module was introduced. This module applied an image fusion method based on local energy features and Laplacian pyramids to images that have undergone multi-scale feature fusion [40,41,42,43], enriching the semantic information of the predictive remote sensing imagery, as shown in Figure 5.
Within the detail enhancement module, the process begins by constructing a Gaussian pyramid for each input image: (1) Gaussian filtering is applied to smooth the noise in the raw imagery; (2) the filtered results are then down-sampled to reduce the image size; (3) this iteration continues until reaching the predetermined number of pyramid layers, and local energy features for each layer are calculated. Subsequently, based on the Gaussian pyramid, the corresponding Laplacian pyramid is built: (1) the layers of the Gaussian pyramid are up-sampled to match the original image size; (2) the differences between each layer of the Gaussian pyramid and its subsequent layer are calculated to form the corresponding layer of the Laplacian pyramid; and (3) fusion weights are computed for each pyramid layer based on local energy features. Finally, the fusion reconstruction begins. (1) Utilizing the obtained fusion weights, a weighted fusion operation is performed to obtain the fusion result for each layer; (2) these weighted-combined Laplacian layers are progressively up-sampled and accumulated to reconstruct the fused image; (3) by cascading the reconstruction of fused pyramid layers, a predictive remote sensing image rich in detail information is obtained.

4. Experiments

4.1. Model Training

The deep learning models employed in the experimentation were built within the Python 3.7.0 environment, utilizing the PyTorch 1.7.1 framework and accelerated with NVIDIA GeForce RTX 3060 Ti GPU, manufactured by NVIDIA Corporation, Santa Clara, CA, USA. The experimental parameters were established as follows (Table 1).

4.2. Accuracy Evaluation

To accurately assess the effectiveness of the proposed method across different deep learning architectures, mathematical models based on labeled imagery were constructed for a comprehensive evaluation of interpretive accuracy. Two performance metrics were chosen to validate the precision of various network models: the Mean Intersection over Union (mIoU) and the Mean Pixel Accuracy (MPA), represented by Equations (3) and (4) [44,45]:
m I o U = 1 N i = 1 n T P i T P i + F P i + F N i
M P A = 1 N i = 1 n T P i T P i + F P i
where T P i represents the target object correctly predicted as the positive class by the model, F P i stands for the background falsely predicted as the positive class, and F N i is the background incorrectly predicted as the negative class. The mIoU measures the IoU of each category, which is the ratio of correctly classified pixels for that category to the union set of all predictions made by the model for that category, averaged across all categories. The MPA is an index evaluating the performance of the image segmentation model, gauging the degree to which the model correctly classifies pixels throughout the entire image.

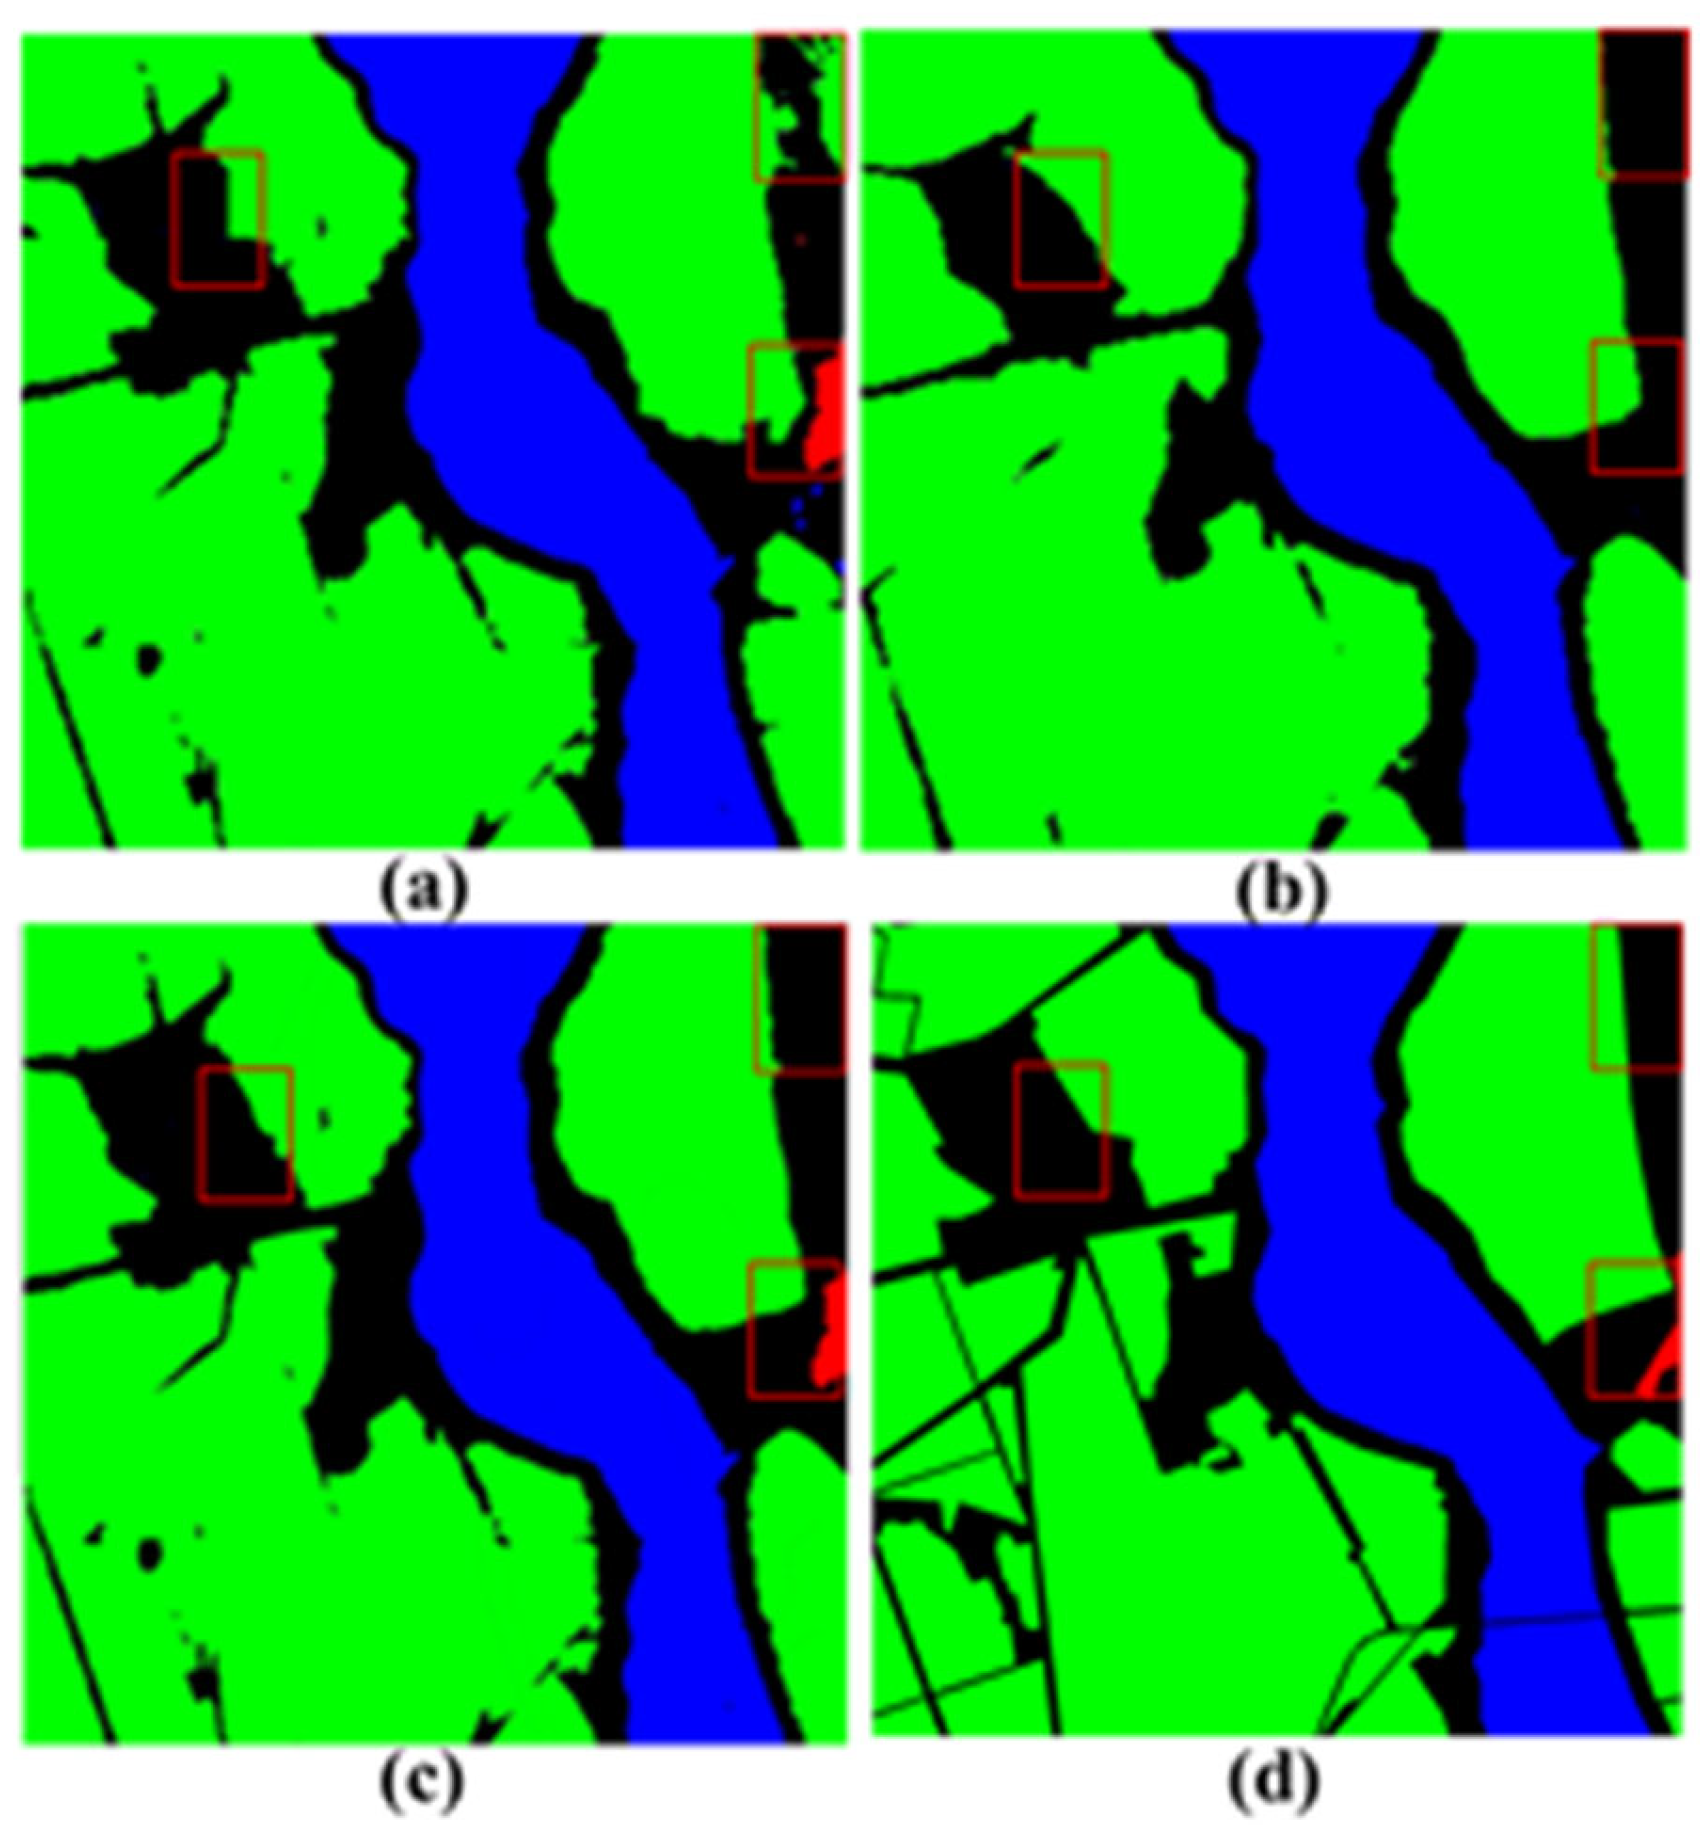
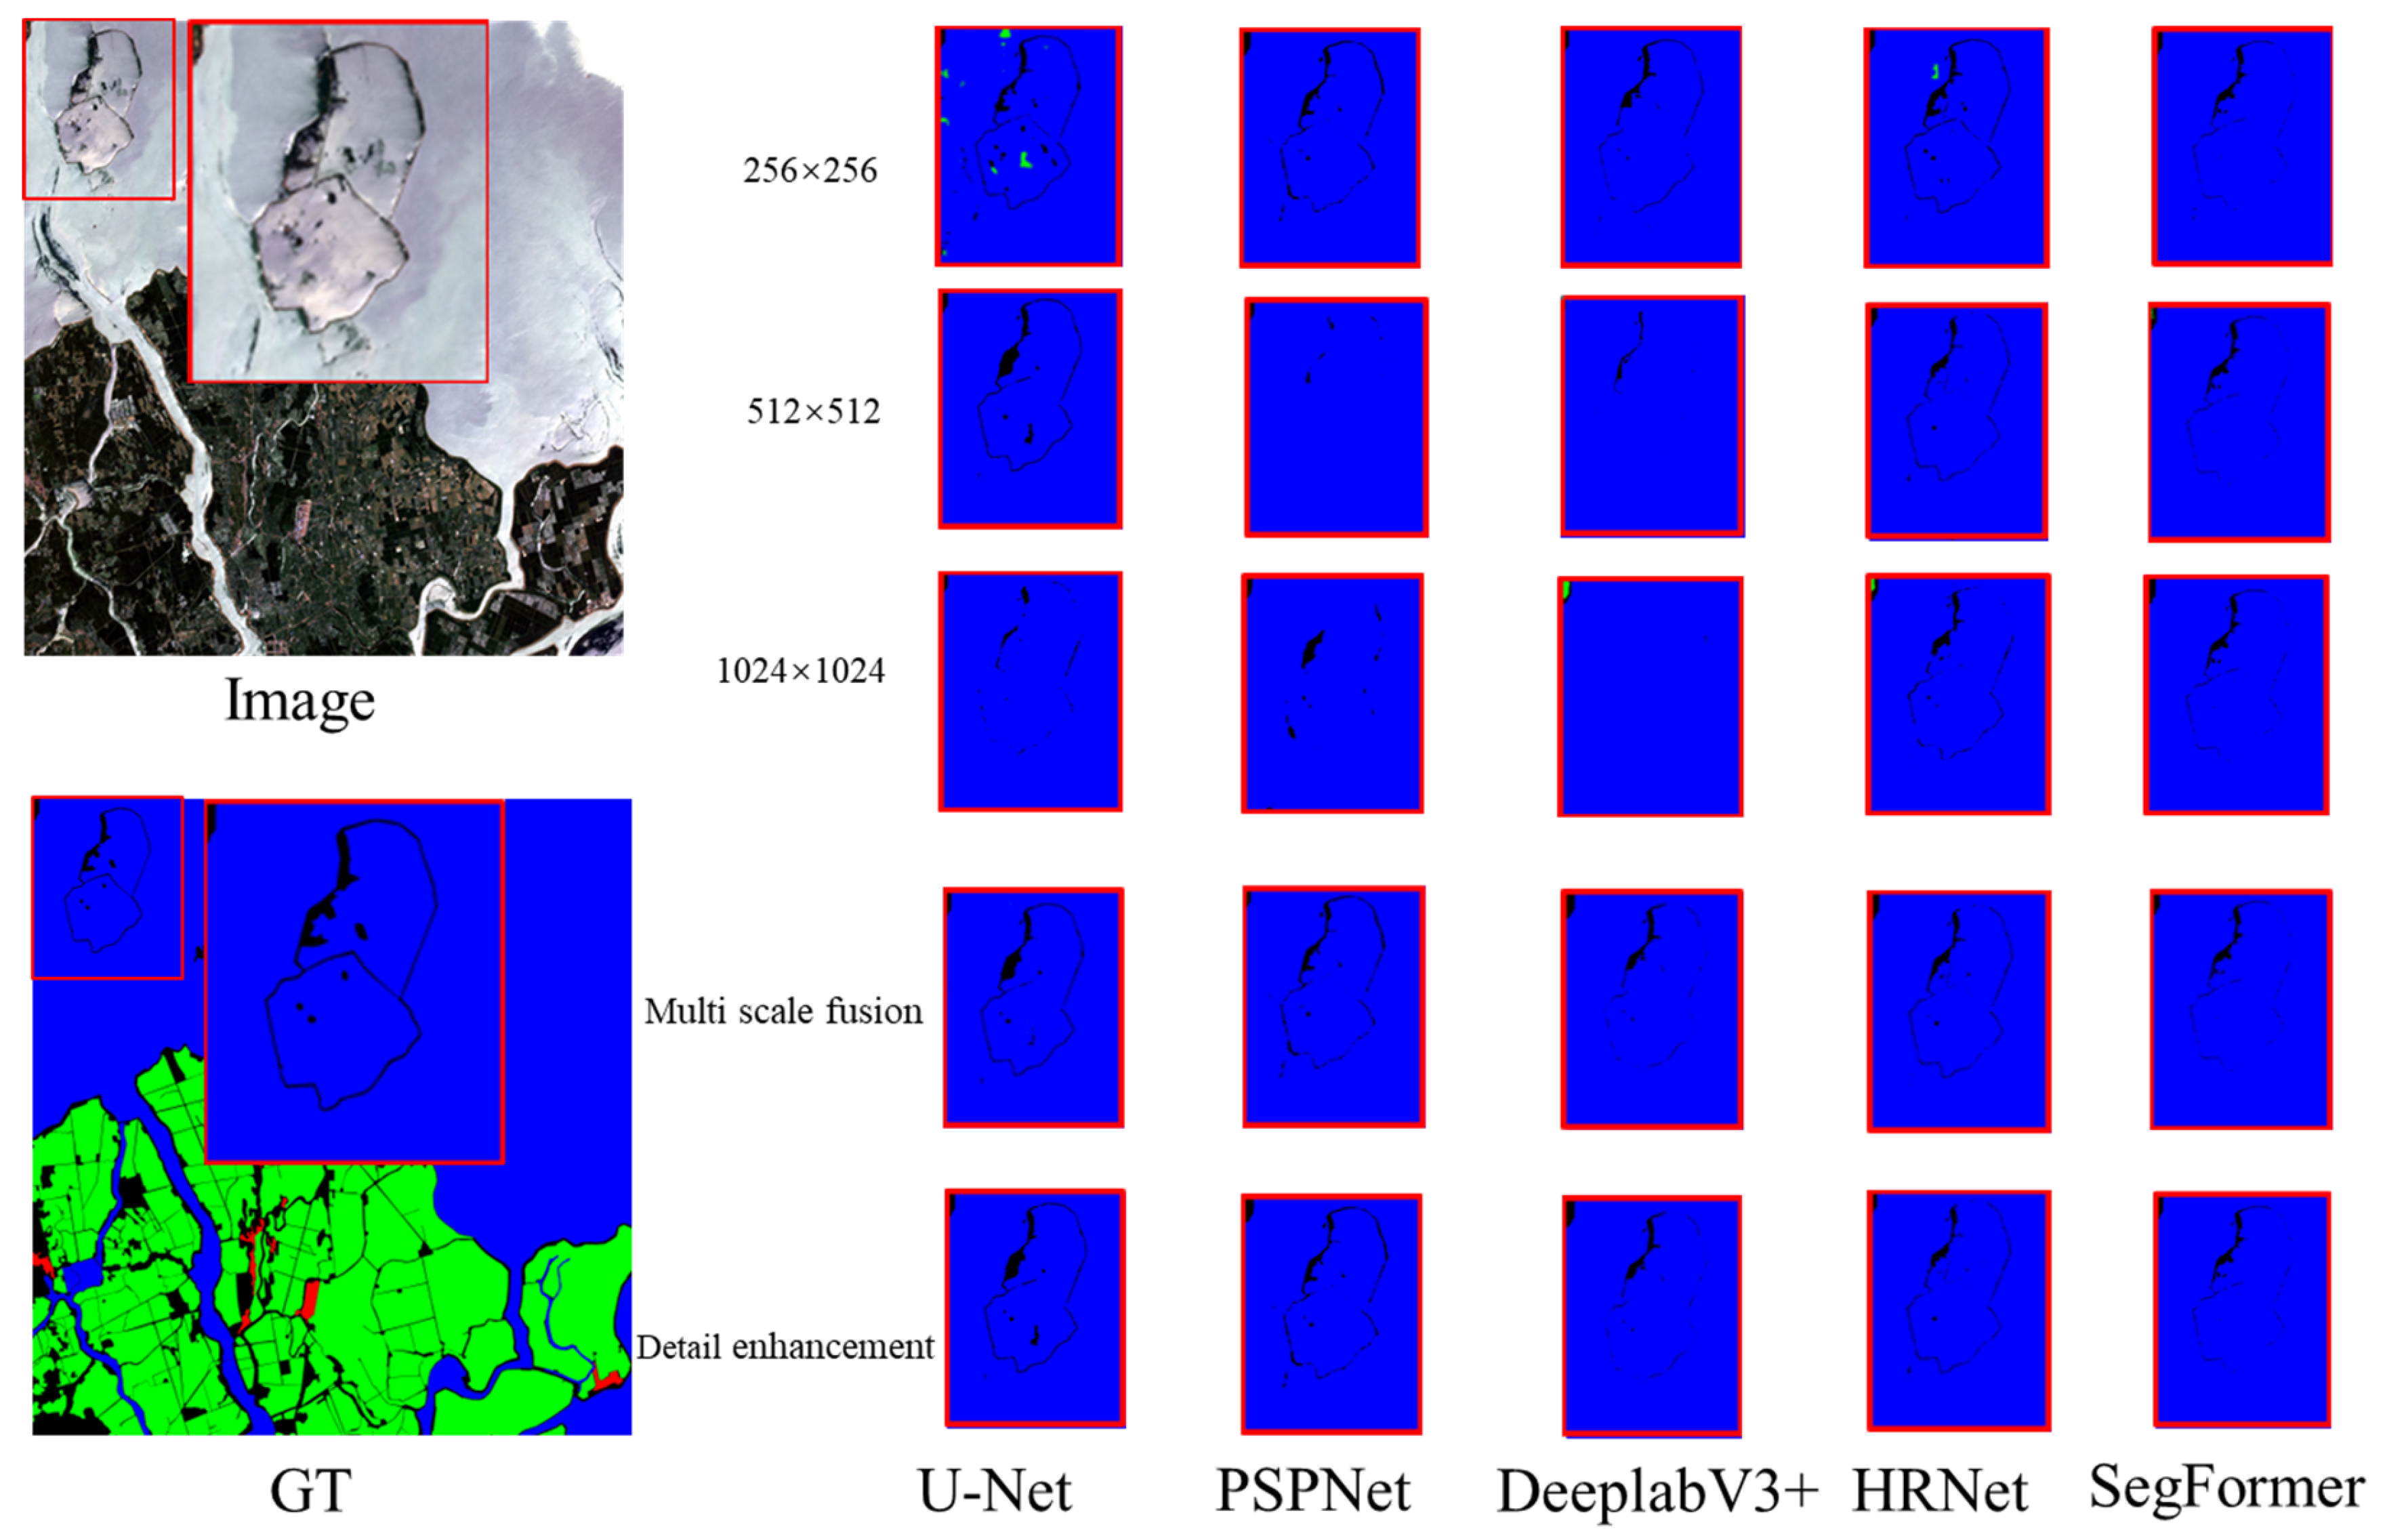
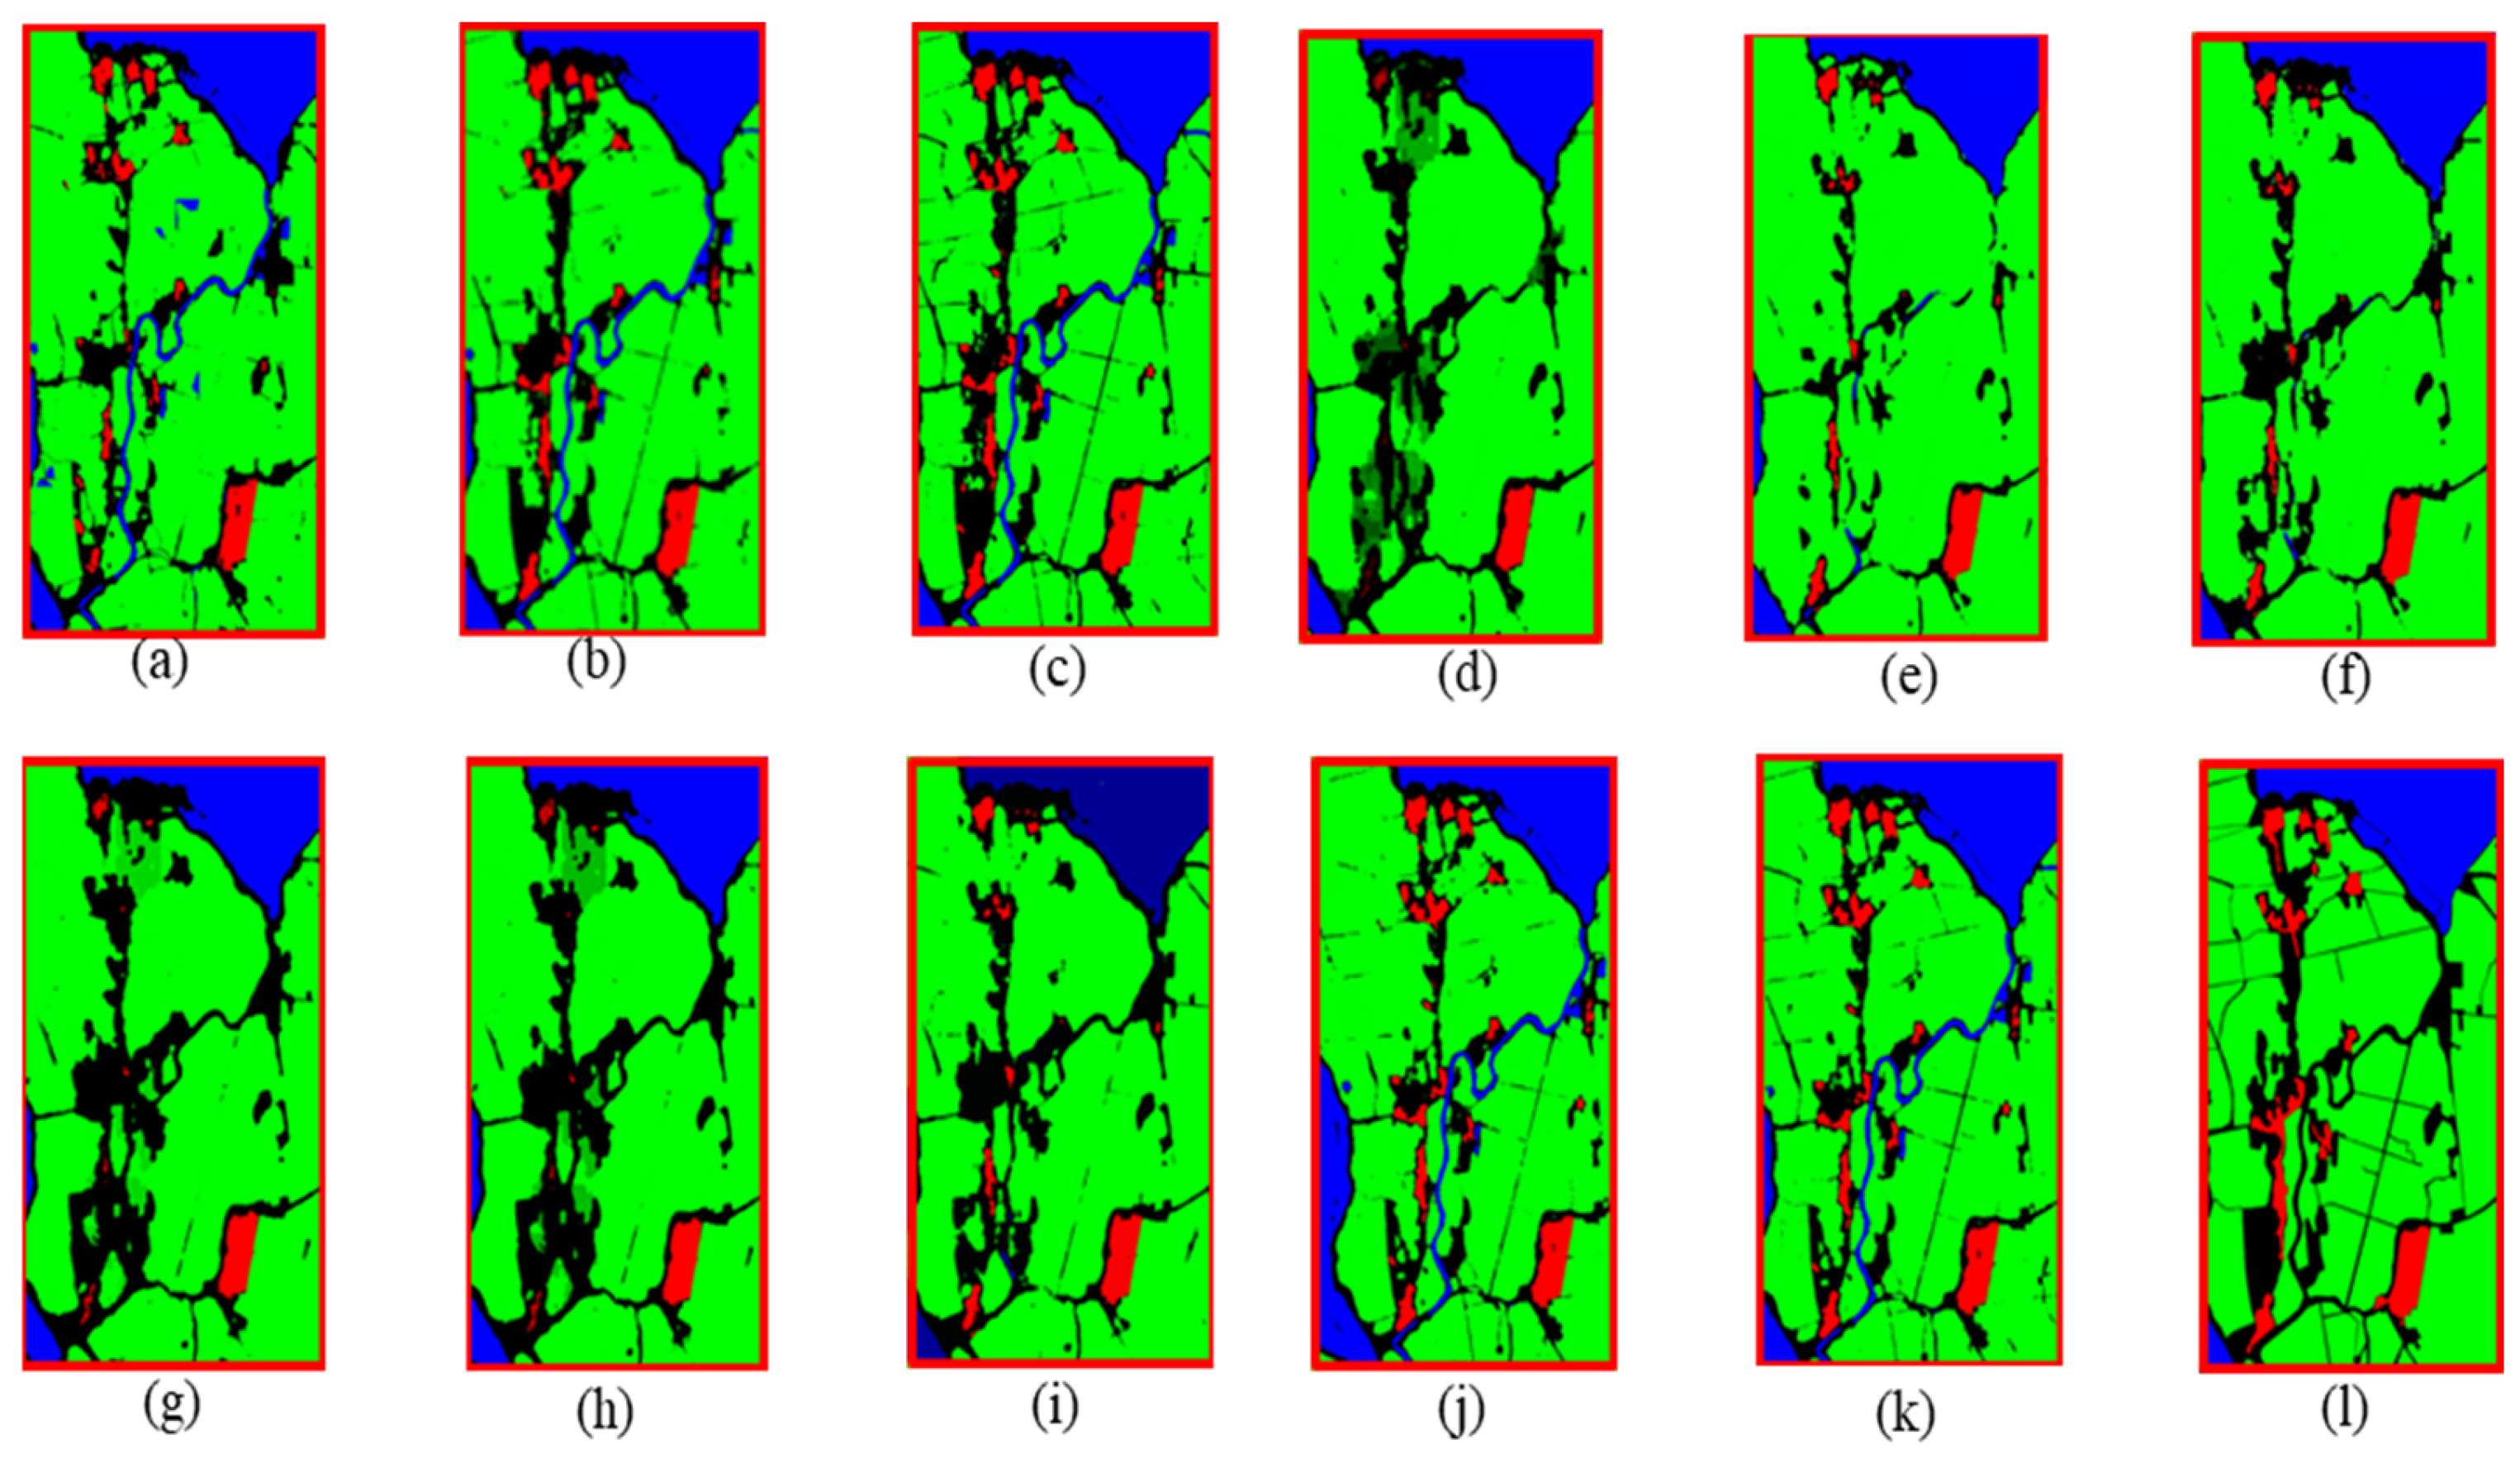
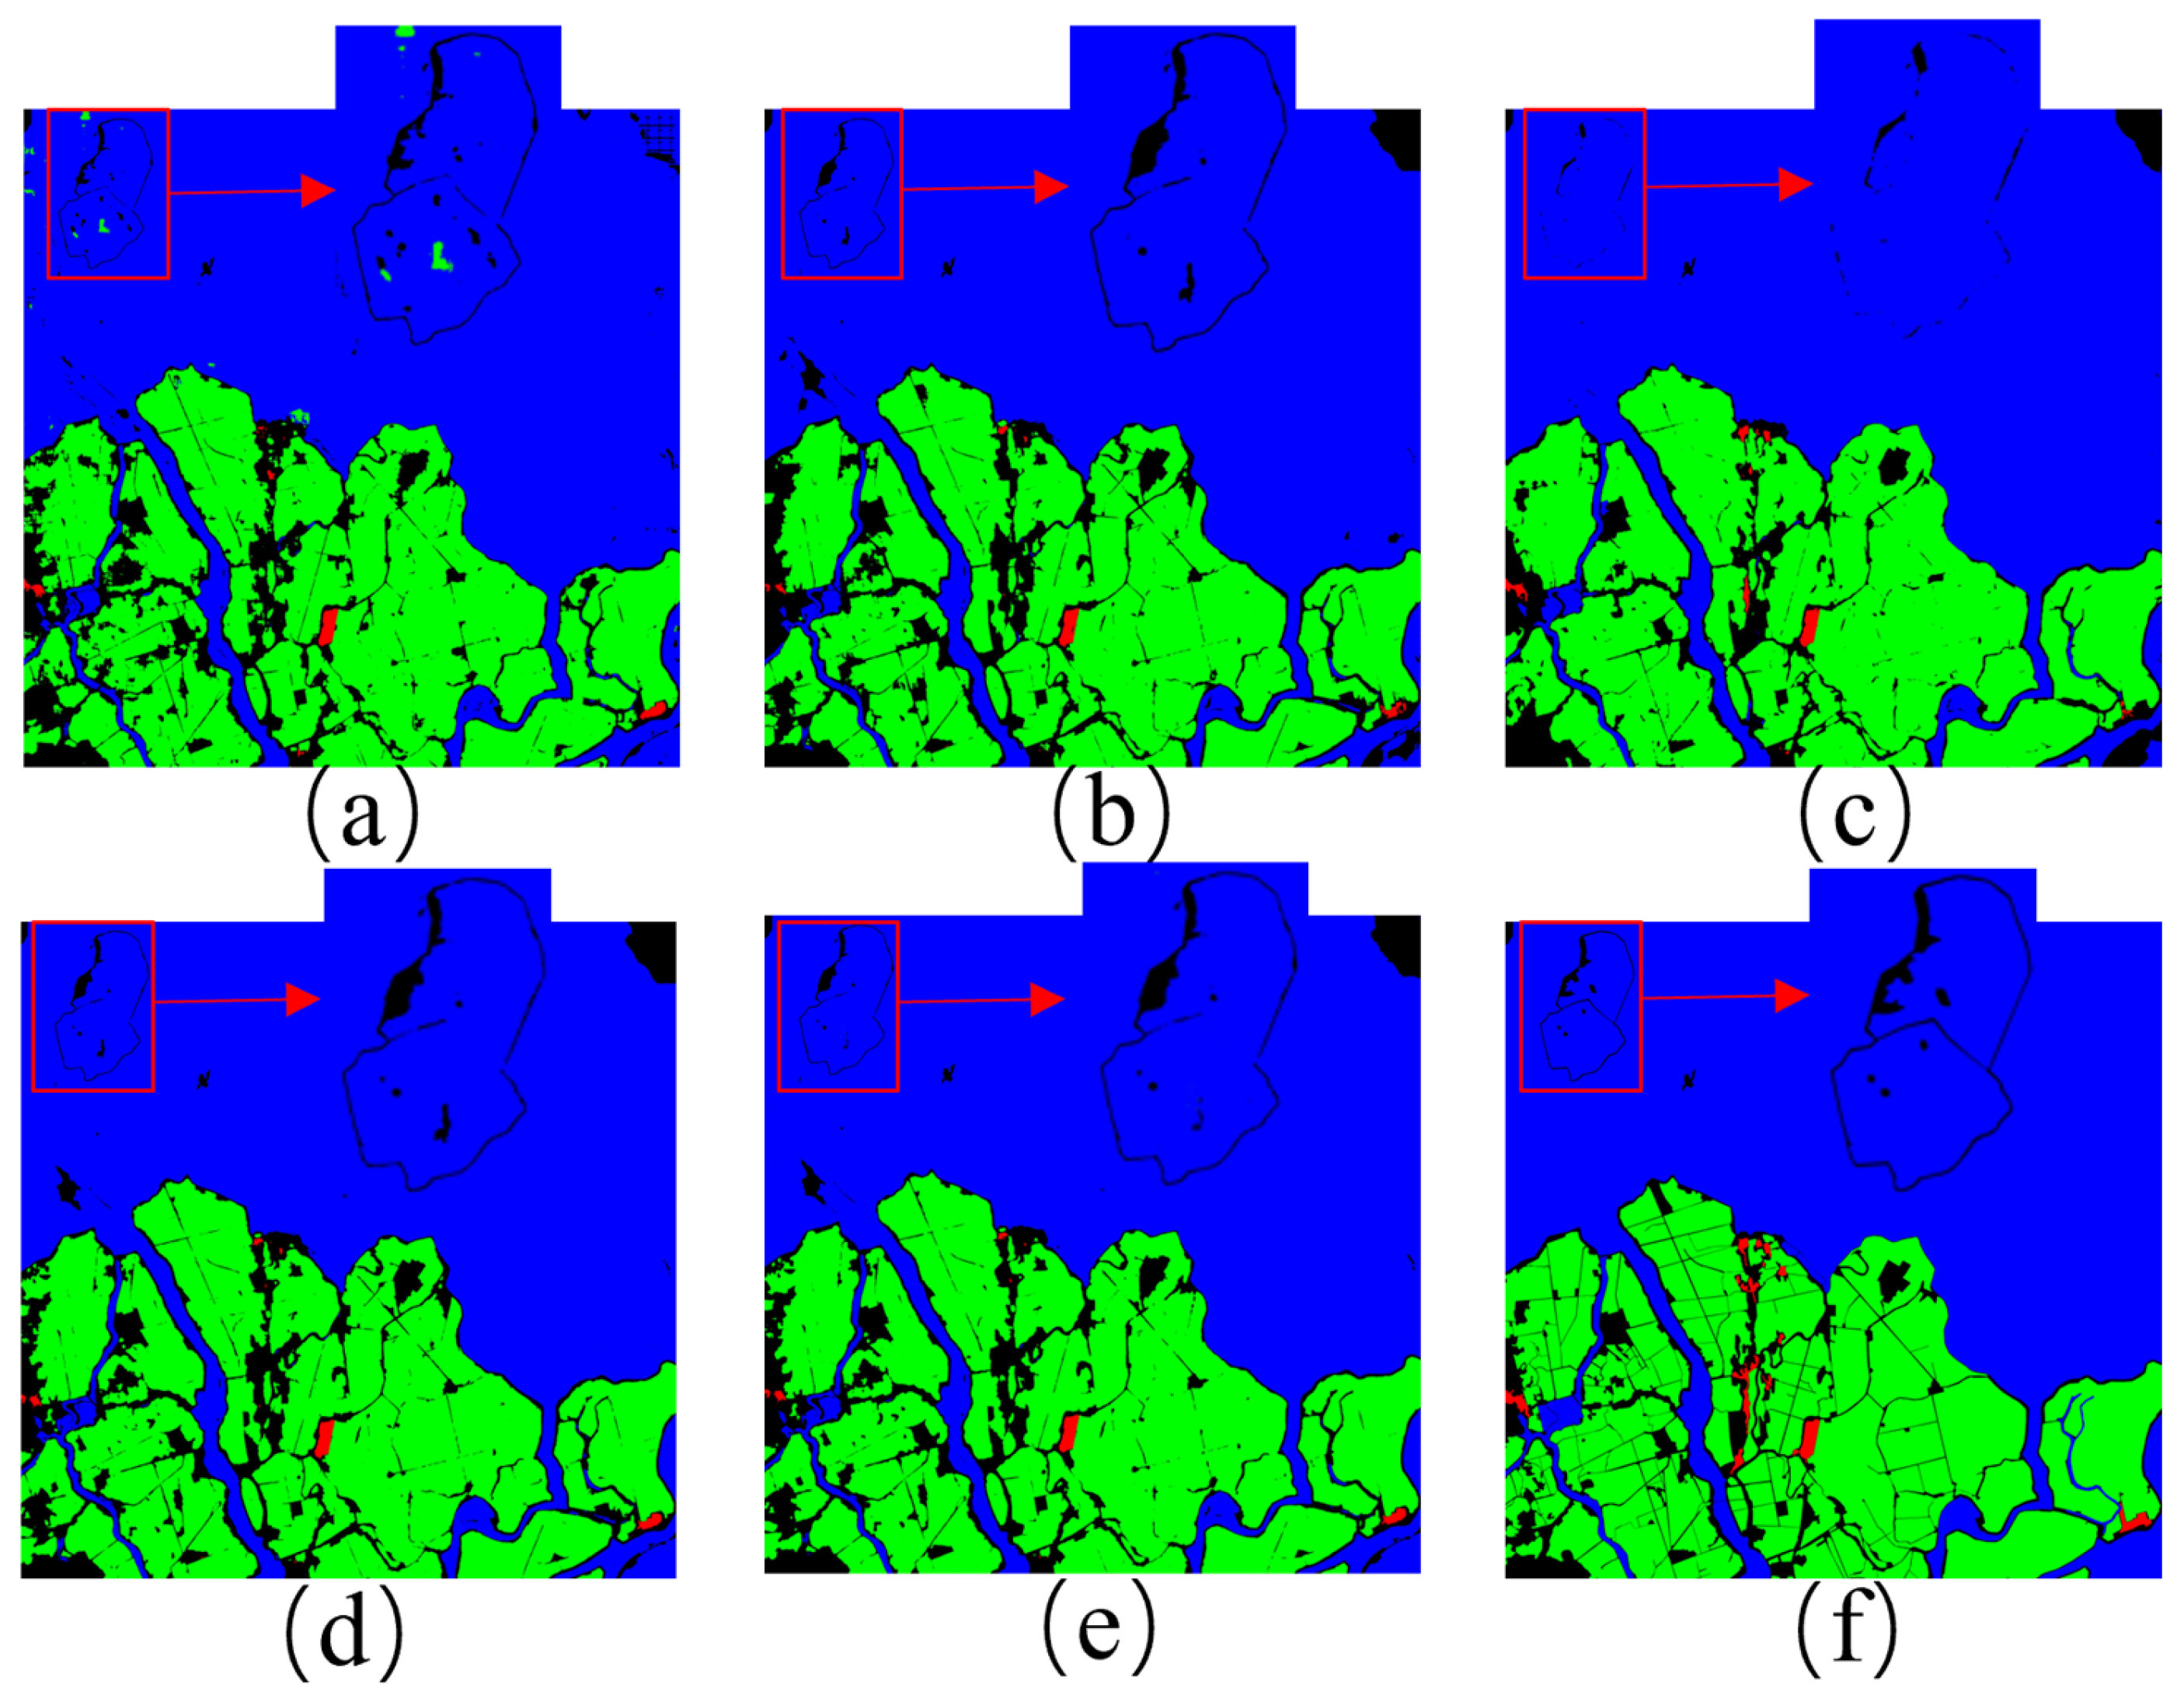
4.3. Experimental Results

Before the feature extraction of remote sensing images, in this study, the multi-scale tile slicing technique was applied to generate multiple sets of multi-scale sub-maps because the extraction accuracy of the model varies with different input scales and different model structures; simultaneously, the multi-scale fusion method designed in this study is an analytical fusion of the prediction results of multiple multi-scale remote sensing images. Therefore, the prediction results of the same remote sensing image using different models are shown in detail in the experimental results section, as shown in Figure 6, in addition to the prediction results of the same remote sensing image on different scales with the prediction results obtained by applying the multi-scale fusion method and detail enhancement method, as shown in Figure 7.
Figure 8 and Figure 9 show the extraction results of remote sensing images obtained by various network models used in the aforementioned experiment. The results indicate that at smaller scales, the prediction maps exhibit detailed feature representation, but the overall representation of the model is relatively poor. At larger scales, the prediction maps effectively retain global information; however, the extraction accuracy for small features is lower. The multi-scale fusion and detail enhancement techniques designed in the present study combine the advantages of prediction maps at multiple scales. This approach not only improves the richness of features but also significantly enhances the extraction accuracy of remote sensing images.
Table 2 and Table 3 reveal that the multi-scale fusion method significantly improves the mIoU value compared to fixed tile size extraction, with improvements ranging from 0.42% to 5.42% across different models. For the MPA value, the multi-scale fusion method also shows enhancement effects, with a maximum increase of 5.27% and a minimum increase of 0.13%. Additionally, when applying the detail enhancement technique, the mIoU value improvements range from 1.09% to 6.38% across different models, while the MPA indicator shows a maximum improvement of 6.21% and a minimum improvement of 1.07%. These results indicate that the MMS-EF designed in this study not only effectively enhances the accuracy of feature extraction in remote sensing images but also demonstrates broad applicability across different network models.

4.4. Ablation Study

In this study, the adaptive weight function of the designed multi-scale fusion module employs a comprehensive dynamic adjustment method by integrating the gradient information, color histogram information, and pixel clustering information of the image. This method is based on an in-depth understanding of the characteristics of different information sources and dynamically adjusts the weight allocation of pixels in the final fused image according to the unique feature representation of each remote sensing image. By considering multiple image features comprehensively, this method effectively optimizes the weight allocation mechanism, significantly enhancing the accuracy of the final fused image, as shown in Figure 10.
The experimental results indicate that relying solely on a single or two information sources for weight adjustment during image fusion can lead to issues such as shadows or color distortion. This result is primarily because a single information source is insufficient to fully capture the diversity and complexity of remote sensing images. In contrast, by integrating multiple information sources such as gradient, color histogram, and clustering information, the adaptive weight function can more comprehensively capture image features, thereby improving the quality of image fusion.

5. Discussion

The complexity of remote sensing images poses several challenges for deep learning models when extracting land features, such as incomplete feature extraction, stitching errors, and loss of details. Based on this, Section 5.1 of this study will discuss the accuracy of our algorithm in ground segmentation, Section 5.2 will compare the traditional stitching algorithm with our algorithm, and finally, Section 5.3 will explore the data applicability, aiming to verify the universality of our research method on different data sources.

5.1. Geographic Feature Segmentation

In the field of remote sensing imagery segmentation, the recognition and classification of continuous geographic features persist as challenging tasks. Particularly for extensive landforms, which may span thousands or even tens of thousands of pixels, the variations in form and size across different scales present significant hurdles to single-scale processing techniques. Traditional mono-scale methods often fail to fully capture the entirety of such features, leading directly to issues such as incorrect extraction or the omission of features during the model’s recognition process.
To address this challenge, in this study, a multi-scale tile overlapping segmentation approach is introduced. By segmenting remote sensing imagery across multiple scales with overlapping tiles, this method ensures that, even if complete segmentation of a feature is unattainable at a specific scale, the image information obtained at other scales can compensate for this. This mutual supplementation elevates the segmentation capabilities of the network model. From a macroscale perspective, the model may not capture all minute features, yet it can attain a holistic understanding of the overall morphology and distribution patterns of the landforms. Conversely, at a finer scale, despite the potential loss of some global structural information, the model can more precisely reveal intricate feature details. Through this layering and merging of scale-specific insights, through our research, we were able to achieve comprehensive and accurate identification and portrayal of various geographic features. The proposed algorithm systematically addresses issues of feature detail loss and incomplete morphological coverage, offering a substantial improvement in the ability of deep learning models to extract features from multi-scale, multi-feature remote sensing imagery. This enhancement enables a more precise representation of land cover, establishing a robust data foundation for studying dynamic land use changes, as demonstrated in Figure 11.

5.2. Image Stitching

In the field of remote sensing image analysis, the direct stitching of single-scale image tiles often poses significant challenges. The limitations of tile segmentation hinder the effective retention of complete semantic information around geographic features, impacting the model’s accurate grasp of the object’s contextual relationships. This loss of semantic information, particularly evident in edge regions during image stitching, can easily lead to image misalignment and, consequently, can interfere with the correct extraction of geographic features.
To address this issue, in the present study, a multi-scale fusion method was introduced. The module meticulously stitches the overlapping areas of images through a fusion function, effectively remedying the problem of image misalignment caused by tile segmentation. Moreover, in regions with complex texture features, the module leverages multi-scale feature fusion technology to provide a wealth of semantic information on the geographic context, enabling the model to more accurately comprehend the spatial distribution and structural characteristics of the geographic features. This multi-scale fusion approach effectively preserves the contextual semantic information of features, which is essential for large-scale, cross-regional urban planning. Particularly in multi-image stitching scenarios, the MMS-EF framework significantly enhances stitching accuracy, ensuring comprehensive and reliable spatial distribution data for features. This not only strengthens feature recognition capabilities but also enables seamless transitions and efficient information exchange in the image stitching process, as illustrated in Figure 12.

5.3. Data Applicability

In the field of remote sensing, the applicability of research methodologies across diverse data sources is of paramount importance. To comprehensively ascertain the practicality and efficacy of the methodology proposed in the present paper, an analysis was conducted using the publicly available dataset provided by the DeepGlobe Land Cover Classification Challenge. This dataset comprises high-resolution (sub-meter) satellite imagery, predominantly spanning rural areas and encompassing a variety of geographic feature categories [46].
In Figure 13, the small-scale prediction images from the DeepGlobe dataset exhibit strong detail extraction capabilities for features; however, they tend to lose some overall feature information. Conversely, the large-scale prediction images provide richer overall information but may miss finer details of the features. The multi-scale fusion and detail enhancement techniques designed in the present study ensure that the prediction images can simultaneously capture multi-scale image features while improving the overall quality of the prediction images.
From Table 4 and Table 5, it is evident that after applying multi-scale fusion technology, the maximum improvement in mIoU across different models reaches 5.25%; in comparison, the minimum improvement is 1.82%. The improvement in MPA ranges from 6.56% to 1.80%. Additionally, after applying detail enhancement technology, the improvement range for mIoU further expands from 2.32% to 5.94%, and the increase in MPA is between 3.13% and 7.45%. The above results demonstrate that the proposed methods effectively enhance the accuracy of remote sensing image extraction from different data sources, proving their high applicability in remote sensing image extraction tasks across various data sources.

5.4. Limitations and Future Research

The proposed MMS-EF framework addresses several practical challenges encountered by deep learning models during preprocessing, ensuring comprehensive feature capture and the effective preservation of contextual information. Although the MMS-EF framework demonstrates clear advantages in multi-scale feature extraction, its adaptability across diverse data sources requires further enhancement. Future research will focus on advancing data heterogeneity handling and model generalization by exploring various deep learning model architectures to improve framework performance in more complex remote sensing scenarios. Additionally, we plan to incorporate temporal data, combining multi-scale feature fusion with temporal information to capture dynamic changes in features over time, thereby improving the framework’s utility and precision in long-term monitoring and multi-scale dynamic analysis.

6. Conclusions

In this study, we successfully designed and validated a Multi-Scale Modular Extraction Framework (MMS-EF) for feature extraction in remote sensing imagery. This framework addresses key challenges in traditional remote sensing image processing, such as feature omission, image misalignment, and information loss, significantly enhancing the feature extraction accuracy of deep learning models. Our multi-scale overlapping segmentation module improves image consistency and continuity across different scales, ensuring the completeness and accuracy of feature extraction. This improvement allows for more precise land cover representation, laying a robust foundation for studies of dynamic land use changes. The multi-scale fusion module precisely aligns overlapping areas in multi-scale images through fusion functions, effectively preserving multi-scale feature information. Fine-tuning with adaptive weighting functions ensures the efficient integration of these features, making it essential for large-scale, cross-regional environmental monitoring and urban planning applications. Additionally, the detail enhancement module optimizes extraction results by enhancing the predictive image’s detail expression and robustness, further boosting classification accuracy. Compared to traditional methods, our approach offers an efficient solution for land feature classification tasks in remote sensing imagery, providing a fresh perspective on leveraging remote sensing data.

Author Contributions

Conceptualization, B.Z. and H.Y.; methodology, B.Z., H.Y. and H.Z.; software, H.Y. and H.Z.; validation, H.Y. and H.Z.; writing—original draft preparation, H.Y. and B.Z.; writing—review and editing, B.Z., H.Y. and J.Z.; visualization, H.Y. and H.Z.; project administration, B.Z., H.Y. and H.Z.; funding acquisition, W.S. and J.D. All authors have read and agreed to the published version of the manuscript.

Funding

The above work was supported in part by the National Natural Science Foundation of China under Grants 42071343, 42204031 and 42071428.

Data Availability Statement

We extend our thanks to the developers of the GID and DeepGlobe Land Cover Classification Challenge datasets for providing the training and testing datasets for remote sensing image se-mantic segmentation tasks, which can be found at the following URLs. GID: https://doi.org/10.1016/j.rse.2019.111322, reference number [25]; DeepGlobe Land Cover Classification Challenge dataset: http://deepglobe.org/index.html (accessed on 1 September 2023), reference number [46].

Acknowledgments

We are very grateful to all of the reviewers, institutions, and researchers who provided help with and advice on the work presented herein.

Conflicts of Interest

All authors declare that they have no conflicts of interest.

References

  1. Aghdami-Nia, M.; Shah-Hosseini, R.; Rostami, A.; Homayouni, S. Automatic coastline extraction through enhanced sea-land segmentation by modifying Standard U-Net. Int. J. Appl. Earth Obs. Geoinformatio 2022, 109, 102785. [Google Scholar] [CrossRef]
  2. Khoshboresh-Masouleh, M.; Alidoost, F.; Arefi, H. Multiscale building segmentation based on deep learning for remote sensing RGB images from different sensors. J. Appl. Remote Sens. 2020, 14, 034503. [Google Scholar] [CrossRef]
  3. Rostami, A.; Shah-Hosseini, R.; Asgari, S.; Zarei, A.; Aghdami-Nia, M.; Homayouni, S. Active fire detection from landsat-8 imagery using deep multiple kernel learning. Remote Sens. 2022, 14, 992. [Google Scholar] [CrossRef]
  4. Yang, B.; Qin, L.; Liu, J.; Liu, X. UTRNet: An unsupervised time-distance-guided convolutional recurrent network for change detection in irregularly collected images. IEEE Trans. Geosci. Remote Sens. 2022, 60, 1–16. [Google Scholar] [CrossRef]
  5. Ji, S.; Wei, S.; Lu, M. Fully convolutional networks for multisource building extraction from an open aerial and satellite imagery data set. IEEE Trans. Geosci. Remote Sens. 2018, 57, 574–586. [Google Scholar] [CrossRef]
  6. Li, J.; Yang, B.; Bai, L.; Dou, H.; Li, C.; Ma, L. TFIV: Multi-grained Token Fusion for Infrared and Visible Image via Transformer. IEEE Trans. Instrum. Meas. 2023, 72, 1–14. [Google Scholar]
  7. Luo, L.; Li, P.; Yan, X. Deep learning-based building extraction from remote sensing images: A comprehensive review. Energies 2021, 14, 7982. [Google Scholar] [CrossRef]
  8. Mei, J.; Li, R.-J.; Gao, W.; Cheng, M.-M. CoANet: Connectivity attention network for road extraction from satellite imagery. IEEE Trans. Image Process. 2021, 30, 8540–8552. [Google Scholar] [CrossRef]
  9. Zhang, R.; Newsam, S.; Shao, Z.; Huang, X.; Wang, J.; Li, D. Multi-scale adversarial network for vehicle detection in UAV imagery. ISPRS J. Photogramm. Remote Sens. 2021, 180, 283–295. [Google Scholar] [CrossRef]
  10. Chen, W.; Jiang, Z.; Wang, Z.; Cui, K.; Qian, X. Collaborative Global-Local Networks for Memory-EFFICIENT segmentation of Ultra-High Resolution Images. In Proceedings of the IEEE/CVF Conference on Computer Vision and Pattern Recognition, Long Beach, CA, USA, 15–20 June 2019; pp. 8924–8933. [Google Scholar]
  11. Zhang, Z.; Lu, M.; Ji, S.; Yu, H.; Nie, C. Rich CNN features for water-body segmentation from very high resolution aerial and satellite imagery. Remote Sens. 2021, 13, 1912. [Google Scholar] [CrossRef]
  12. Xia, G.-S.; Hu, J.; Hu, F.; Shi, B.; Bai, X.; Zhong, Y.; Zhang, L.; Lu, X. AID: A benchmark data set for performance evaluation of aerial scene classification. IEEE Trans. Geosci. Remote Sens. 2017, 55, 3965–3981. [Google Scholar] [CrossRef]
  13. Liu, Y.; Zhong, Y.; Shi, S.; Zhang, L. Scale-aware deep reinforcement learning for high resolution remote sensing imagery classification. ISPRS J. Photogramm. Remote Sens. 2024, 209, 296–311. [Google Scholar] [CrossRef]
  14. Zhao, X.; Zhang, J.; Tian, J.; Zhuo, L.; Zhang, J. Residual dense network based on channel-spatial attention for the scene classification of a high-resolution remote sensing image. Remote Sens. 2020, 12, 1887. [Google Scholar] [CrossRef]
  15. Zhang, Y.; Mei, X.; Ma, Y.; Jiang, X.; Peng, Z.; Huang, J. Hyperspectral panoramic image stitching using robust matching and adaptive bundle adjustment. Remote Sens. 2022, 14, 4038. [Google Scholar] [CrossRef]
  16. Cheng, H.K.; Chung, J.; Tai, Y.-W.; Tang, C.-K. Cascadepsp: Toward Class-Agnostic and Very High-Resolution Segmentation via Global and Local Refinement. In Proceedings of the IEEE/CVF Conference on Computer Vision and Pattern Recognition, Seattle, WA, USA, 14–19 June 2020; pp. 8890–8899. [Google Scholar]
  17. Ding, Y.; Wu, M.; Xu, Y.; Duan, S. P-linknet: Linknet with spatial pyramid pooling for high-resolution satellite imagery. ISPRS-Int. Arch. Photogramm. Remote. Sens. Spat. Inf. Sci. 2020, 43, 35–40. [Google Scholar] [CrossRef]
  18. Wei, S.; Ji, S.; Lu, M. Toward automatic building footprint delineation from aerial images using CNN and regularization. IEEE Trans. Geosci. Remote Sens. 2019, 58, 2178–2189. [Google Scholar] [CrossRef]
  19. Xu, Q.; Chen, J.; Luo, L.; Gong, W.; Wang, Y. UAV image stitching based on mesh-guided deformation and ground constraint. IEEE J. Sel. Top. Appl. Earth Obs. Remote Sens. 2021, 14, 4465–4475. [Google Scholar] [CrossRef]
  20. Dosovitskiy, A.; Beyer, L.; Kolesnikov, A.; Weissenborn, D.; Zhai, X.; Unterthiner, T.; Dehghani, M.; Minderer, M.; Heigold, G.; Gelly, S. An image is worth 16×16 words: Transformers for image recognition at scale. arXiv 2020, arXiv:2010.11929. [Google Scholar]
  21. Bay, H.; Tuytelaars, T.; Van Gool, L. Surf: Speeded Up Robust Features. In Proceedings of the Computer Vision–ECCV 2006: 9th European Conference on Computer Vision, Graz, Austria, 7–13 May 2006; Proceedings, Part I 9. pp. 404–417. [Google Scholar]
  22. Ashish, V. Attention is all you need. Adv. Neural Inf. Process. Syst. 2017, 30, 1. [Google Scholar]
  23. Abuhasel, K. Geographical Information System Based Spatial and Statistical Analysis of the Green Areas in the Cities of Abha and Bisha for Environmental Sustainability. ISPRS Int. J. Geo-Inf. 2023, 12, 333. [Google Scholar] [CrossRef]
  24. Gao, W.; Chen, N.; Chen, J.; Gao, B.; Xu, Y.; Weng, X.; Jiang, X. A Novel and Extensible Remote Sensing Collaboration Platform: Architecture Design and Prototype Implementation. ISPRS Int. J. Geo-Inf. 2024, 13, 83. [Google Scholar] [CrossRef]
  25. Tong, X.-Y.; Xia, G.-S.; Lu, Q.; Shen, H.; Li, S.; You, S.; Zhang, L. Land-cover classification with high-resolution remote sensing images using transferable deep models. Remote Sens. Environ. 2020, 237, 111322. [Google Scholar] [CrossRef]
  26. Song, W.; Zhang, Z.; Zhang, B.; Jia, G.; Zhu, H.; Zhang, J. ISTD-PDS7: A Benchmark Dataset for Multi-Type Pavement Distress Segmentation from CCD Images in Complex Scenarios. Remote Sens. 2023, 15, 1750. [Google Scholar] [CrossRef]
  27. Ronneberger, O.; Fischer, P.; Brox, T. U-net: Convolutional Networks for Biomedical Image Segmentation. In Proceedings of the Medical Image Computing and Computer-Assisted Intervention–MICCAI 2015: 18th International Conference, Munich, Germany, 5–9 October 2015; proceedings, part III 18. pp. 234–241. [Google Scholar]
  28. Zhao, H.; Shi, J.; Qi, X.; Wang, X.; Jia, J. Pyramid Scene Parsing Network. In Proceedings of the IEEE Conference on Computer Vision and Pattern Recognition, Honolulu, HI, USA, 21–26 July 2017; pp. 2881–2890. [Google Scholar]
  29. Chen, L.-C.; Papandreou, G.; Kokkinos, I.; Murphy, K.; Yuille, A.L. Deeplab: Semantic image segmentation with deep convolutional nets, atrous convolution, and fully connected crfs. IEEE Trans. Pattern Anal. Mach. Intell. 2017, 40, 834–848. [Google Scholar] [CrossRef]
  30. Wang, J.; Sun, K.; Cheng, T.; Jiang, B.; Deng, C.; Zhao, Y.; Liu, D.; Mu, Y.; Tan, M.; Wang, X.; et al. Deep high-resolution representation learning for visual recognition. IEEE Trans. Pattern Anal. Mach. Intell. 2020, 43, 3349–3364. [Google Scholar] [CrossRef]
  31. Xie, E.; Wang, W.; Yu, Z.; Anandkumar, A.; Alvarez, J.M.; Luo, P. SegFormer: Simple and efficient design for semantic segmentation with transformers. Neural Inf. Process. Syst. 2021, 34, 12077–12090. [Google Scholar]
  32. Cao, N.; Liu, Y. High-Noise Grayscale Image Denoising Using an Improved Median Filter for the Adaptive Selection of a Threshold. Appl. Sci. 2024, 14, 635. [Google Scholar] [CrossRef]
  33. Oboué, Y.A.S.I.; Chen, Y.; Fomel, S.; Zhong, W.; Chen, Y. An advanced median filter for improving the signal-to-noise ratio of seismological datasets. Comput. Geosci. 2024, 182, 105464. [Google Scholar] [CrossRef]
  34. Filintas, A.; Gougoulias, N.; Kourgialas, N.; Hatzichristou, E. Management Soil Zones, Irrigation, and Fertigation Effects on Yield and Oil Content of Coriandrum sativum L. Using Precision Agriculture with Fuzzy k-Means Clustering. Sustainability 2023, 15, 13524. [Google Scholar] [CrossRef]
  35. Han, S.; Lee, J. Parallelized Inter-Image k-Means Clustering Algorithm for Unsupervised Classification of Series of Satellite Images. Remote. Sens. 2023, 16, 102. [Google Scholar] [CrossRef]
  36. Kanwal, M.; Riaz, M.M.; Ali, S.S.; Ghafoor, A. Fusing color, depth and histogram maps for saliency detection. Multimed. Tools Appl. 2022, 81, 16243–16253. [Google Scholar] [CrossRef]
  37. Li, S.; Zou, Y.; Wang, G.; Lin, C. Infrared and visible image fusion method based on principal component analysis network and multi-scale morphological gradient. Infrared Phys. Technol. 2023, 133, 104810. [Google Scholar] [CrossRef]
  38. Wang, J.; Xi, X.; Li, D.; Li, F.; Zhang, G. A gradient residual and pyramid attention-based multiscale network for multimodal image fusion. Entropy 2023, 25, 169. [Google Scholar] [CrossRef] [PubMed]
  39. Zhou, J.; Zhang, D.; Zhang, W. Adaptive histogram fusion-based colour restoration and enhancement for underwater images. Int. J. Secur. Netw. 2021, 16, 49–59. [Google Scholar] [CrossRef]
  40. Chen, L.; Rao, P.; Chen, X. Infrared dim target detection method based on local feature contrast and energy concentration degree. Optik 2021, 248, 167651. [Google Scholar] [CrossRef]
  41. Liu, X.; Qiao, S.; Zhang, T.; Zhao, C.; Yao, X. Single-image super-resolution based on an improved asymmetric Laplacian pyramid structure. Digit. Signal Process. 2024, 145, 104321. [Google Scholar] [CrossRef]
  42. Sharvani, H.K. Lung Cancer Detection using Local Energy-Based Shape Histogram (LESH) Feature Extraction Using Adaboost Machine Learning Techniques. Int. J. Innov. Technol. Explor. Eng. 2020, 9, 167–171. [Google Scholar] [CrossRef]
  43. Wang, W.; Wang, G.; Jiang, Y.; Guo, W.; Ren, G.; Wang, J.; Wang, Y. Hyperspectral image classification Based on weakened Laplacian pyramid and guided filtering. Int. J. Remote. Sens. 2023, 44, 5397–5419. [Google Scholar] [CrossRef]
  44. Garcia-Garcia, A.; Orts-Escolano, S.; Oprea, S.; Villena-Martinez, V.; Garcia-Rodriguez, J. A review on deep learning techniques applied to semantic segmentation. arXiv 2017, arXiv:1704.06857. [Google Scholar]
  45. Zhang, M.-L.; Zhou, Z.-H.J. A review on multi-label learning algorithms. IEEE Trans. Knowl. Data Eng. 2013, 26, 1819–1837. [Google Scholar] [CrossRef]
  46. Demir, I.; Koperski, K.; Lindenbaum, D.; Pang, G.; Huang, J.; Basu, S.; Hughes, F.; Tuia, D.; Raskar, R. Deepglobe 2018: A Challenge to Parse the Earth Through Satellite Images. In Proceedings of the IEEE Conference on Computer Vision and Pattern Recognition Workshops, Salt Lake City, UT, USA, 18–22 June 2018; pp. 172–181. [Google Scholar]
Figure 1. Process flowchart of the MMS-EF method.
Land 13 01842 g001
Figure 2. The multi-scale tile overlapping segmentation module.
Land 13 01842 g002
Figure 3. The left image is the original, unprocessed image, In comparison, the right image has undergone median filtering. The red box highlights the magnified view of the same feature in both images.
Land 13 01842 g003
Figure 4. The multi-scale fusion module.
Land 13 01842 g004
Figure 5. Images (a,b) are the input images, image (c) is the result after detail enhancement, and image (d) is the label image. The red frames indicate the extracted image details at the same location using the aforementioned method.
Land 13 01842 g005
Figure 6. Taking the 512 × 512 px scale as an example, multiple model predictions at the same scale were compared.
Land 13 01842 g006
Figure 7. Taking SegFormer as an example, under the same model, a multi-scale prediction comparison was performed.
Land 13 01842 g007
Figure 8. (Results in Figure 1). Plot of different-scale prediction results for different network models with application of the methodology described in the present paper to generate the plots; the red box indicates the same area extraction details.
Land 13 01842 g008
Figure 9. (Results in Figure 2). Plot of different-scale prediction results for different network models with application of the methodology described in the present paper to generate the plots; the red box indicates the same area extraction details.
Land 13 01842 g009
Figure 10. Multi-scale prediction results ablation experiment. (a) stitched image with a tile size of 256 × 256. (b) stitched image with a tile size of 512 × 512. (c) stitched image with a tile size of 1024 × 1024. (d) fused image using only gradient information. (e) fused image using only color histogram information. (f) fused image using only k-means clustering information. (g) fused image using gradient information and color histogram information. (h) fused image using gradient information and k-means clustering information. (i) fused image using color histogram information and k-means clustering information. (j) multi-scale fused image using comprehensive information. (k) detail-enhanced image. (l) original labeled image.
Land 13 01842 g010
Figure 11. (a) 256 × 256 tile size mosaic image. (b) 512 × 512 tile size mosaic image. (c) 1024 × 1024 tile size mosaic image. (d) multi-scale fusion image. (e) detail enhanced image. (f) original labeled image. The red frames indicate extracted image details at the same location across different processing strategies.
Land 13 01842 g011
Figure 12. (a) original image. (b) labeled image. (c) directly concatenated image. (d) multi-scale fused image. The red box represents the image details extracted by concatenating them in the same position.
Land 13 01842 g012
Figure 13. The prediction results of different network models at different scales and the generation results of the method proposed in the present paper. The red box highlights the extracted details of the same area.
Land 13 01842 g013
Table 1. Selected experimental parameters.
ParameterEpochBatch SizeInitial Learning RateOptimizer
Value20085 × 10−4Adam
Table 2. mIoU values of different deep learning network models on the GID.
MethodsU-Net (%)PSPNet (%)DeepLabV3+ (%)HRNet (%)SegFormer (%)
25675.5471.3776.9376.5578.14
51275.5170.8974.4276.3575.51
102473.4070.8472.3973.9173.55
Multi-scale fusion76.0174.3277.2578.0178.97
Detail enhancement77.5375.1178.0279.1579.93
Table 3. MPA values of different deep learning network models on the GID.
MethodsU-Net (%)PSPNet (%)DeepLabV3+ (%)HRNet (%)SegFormer (%)
25684.7982.0386.4685.5087.70
51284.7181.0784.4285.0384.71
102481.7980.3981.3283.3383.95
Multi-scale fusion84.9884.2186.5987.4988.32
Detail enhancement86.6784.4787.5388.8789.89
Table 4. mIoU values of different deep learning network models on the DeepGlobe dataset.
MethodsU-Net (%)PSPNet (%)DeepLabV3+ (%)HRNet (%)SegFormer (%)
25671.4971.3572.3173.5574.14
51271.0170.1370.3970.2472.21
102470.1470.0170.2570.2471.55
Multi-scale fusion73.9873.8174.3375.4975.96
Detail enhancement74.6774.0274.6376.1876.99
Table 5. MPA values of different deep learning network models on the DeepGlobe dataset.
MethodsU-Net (%)PSPNet (%)DeepLabV3+ (%)HRNet (%)SegFormer (%)
25682.3682.1583.5485.3286.17
51281.6680.4080.7780.3783.39
102480.4180.2280.5780.5682.44
Multi-scale fusion85.8885.7286.5987.1288.88
Detail enhancement86.9586.0186.6789.0789.89
Disclaimer/Publisher’s Note: The statements, opinions and data contained in all publications are solely those of the individual author(s) and contributor(s) and not of MDPI and/or the editor(s). MDPI and/or the editor(s) disclaim responsibility for any injury to people or property resulting from any ideas, methods, instructions or products referred to in the content.

