Article

Reduce Speed Limits to Minimize Potential Harm and Maximize the Health Benefits of Street Trees

by
Xiaoqi Feng
1,2,3,
Michael Navakatikyan
1,2 and
Thomas Astell-Burt
2,4,*
1
School of Population Health, University of New South Wales (UNSW), Sydney, NSW 2052, Australia
2
Population Wellbeing and Environment Research Lab (PowerLab), Sydney, NSW 2008, Australia
3
The George Institute of Global Health, Sydney, NSW 2000, Australia
4
School of Architecture, Design and Planning, University of Sydney, Sydney, NSW 2006, Australia
*
Author to whom correspondence should be addressed.
Land 2024, 13(11), 1815; https://doi.org/10.3390/land13111815
Submission received: 21 August 2024 / Revised: 11 October 2024 / Accepted: 14 October 2024 / Published: 1 November 2024

Abstract

:
Urban greening is threatened by the concern that street trees increase traffic-related injury/death. Associations between all serious and fatal traffic crashes and street tree percentages were examined in Sydney, Australia. Associations were adjusted for confounding factors relating to driver behavior (speeding, fatigue, and use of alcohol) and road infrastructure, including alignment (e.g., straight, curved), surface condition (e.g., dry, wet, ice), type (e.g., freeway, roundabout), and speed limit. Models indicated that 10% more street trees were associated with 3% and 20% higher odds of serious or fatal injuries and 20% tree collisions on roads of any speed, respectively. However, further analysis stratified by speed limit revealed contrasting results. Along roads of 70 km/h or greater, 10% more street trees were associated with 8% higher odds of serious or fatal injury and 25% higher odds of death. Comparable associations were not found between street trees and serious or fatal injuries along roads below 70 km/h. Reducing speed limits below 70 km/h saves lives and may mitigate risks of serious or fatal traffic accidents associated with street trees, enabling greener, cooler, healthier cities.

1. Introduction

Ample evidence shows that urban greening is crucial for fighting climate change and improving population health. Street trees especially mitigate urban heat islands [1,2] and encourage active transport, including walking [3,4], which studies show are good for our health and environment [5,6]. Given the benefits of green space and street trees, cities around the world are making large and durable investments in tree planting in Sydney [7], Barcelona [8], Vancouver [9], and Seattle [10]. However, the planting and preservation of street trees face considerable attitudinal and systemic challenges from other sectors, including transport planning. There is a concern that street trees may increase the risk of serious injury and death along roads, in part due to the consequences of errant vehicles crashing into trees and also because of proximal factors (e.g., trees reducing visibility that could contribute to more serious crashes not necessarily involving collisions with trees). A literature review [11] identified eight out of ten studies reporting the presence of street trees as a predictor of crash likelihood or severity.
Evidence is unclear on the extent to which the risk presented by street trees to injury and death from traffic crashes may be attributable to other factors that are well-known to affect crash risk and, in some cases, severity, such as wet weather [12], speeding [13], fatigue [14,15], and driving under the influence of alcohol [16]. Moreover, there is a counter-argument to the aforementioned concern from other studies that indicate street trees perform a traffic-calming function, as drivers perceive them as presenting risk and thereby drive more carefully and slowly, reducing the number of crashes occurring and preventing a proportion of the impact on health and disability [17,18]. Furthermore, decades of evidence point to psychologically restorative benefits of contact with nature, providing relief from stress and renewing cognitive capacities depleted through adaptation to stressful experiences such as driving [19,20]. Therefore, street trees may reduce risk-taking behavior that leads to more serious crashes by helping to ameliorate drivers’ stress and frustration, with several studies reporting supportive findings [11]. Evidently, these perceptions of risk and restorative effects on driver psychology may be contingent upon how fast the roads are on which vehicles travel. Along roads with lower speed limits, drivers have greater opportunities to appreciate the leafier streetscapes, whereas, along high-speed roads such as motorways/freeways, a greater focus on traffic is needed due to the reduced time in which to make key decisions and the far greater danger involved in crashes [13].
The evidence on street trees and risks of injury and death from traffic crashes is therefore neither clear nor as well-established as that for mental, physical, and social health benefits of street trees [3,21,22,23,24,25,26,27,28,29] and green spaces more generally [19,20]. However, the transport sector’s public health-related concerns must be treated seriously, transparently, and subjected to interrogation with the best available data for decision-making in transport planning if street tree planting and preservation is to be a sustainable policy option. In this study, we test two hypotheses. We hypothesize that (1) after adjusting for confounding factors (e.g., behavioral risk factors, adverse weather conditions, road complexity), the presence of street trees reduces the risk of serious injury and/or death because of psychologically calming influences on traffic speed and driver behavior. We also hypothesize that (2) these benefits will mainly tend to occur along roads at lower speeds through the negation of risk-taking behaviors, whereas the risks involved in driving along faster roads are built-in due to fast-flowing traffic.

2. Methods

2.1. Traffic Crash Data

Center for Road Safety, Transport for NSW (Australia) provided anonymous crash, traffic unit, and person records from the center crash database for the years 1999 to 2020 in the Sydney Metropolitan area (approximately 5 million residents). For the analysis, we selected five years of data, from 2016 to 2020, for two reasons: (a) the latest data are more relevant to the current green space information available to us, and (b) from October 2014, the reporting of crashes changed, instead of all crashes being investigated by Police, there were currently investigated by Police and by self-reporting. People involved in crashes where a vehicle was towed or a person injured are still required, by law, to report the crash to NSW Police. However, NSW Police are no longer required to attend the crash scene and investigate for tow away crashes where nobody has been injured or killed.
The crash data for the Sydney Metropolitan area had 61,867 entries between 2016 to 2020. From these, the following were unselected in sequential order: 152 crashes with parked vehicles running away, as irrelevant to the aim of the study; 3385 crashes with road area data absent; and another 853 crashed with road area < 800 sq m, as these cases present challenges in reliably identifying nearby street tree canopy cover. After these exclusions, the final analytical sample consisted of 57,477 crashes.
The data contained a range of outcome variables describing the degree of crash by damage to people or vehicles, including a number of fatal, serious, moderate, and minor or no injuries (tow-away). Two kinds of injury variables are available: first, the total number of different types of injuries per crash, and second, the degree of crash detailed, only the most severe type of injury in a crash or none. We chose the second type for the analysis, as it allows us to assess the percentage of crashes related to an injury with respect to the total number of crashes. For the modeling, in addition to fatal injury, we created two combined variables: (1) crashes with fatal or serious injury and (2) crashes with any injury, including fatal. Multiple combinations of the injuries were used because the raw analysis has shown different trends for death and serious injuries versus moderate and minor injuries with a potential for masking each other.
The last variable for the analysis is the occurrence of a car in crash hitting trees or bush during the first or the second hit of an object, or hitting some other object, derived from data on traffic units involved in crash. The latter was expected and proved to be dependent on percentage of trees in area of crash and served as a quality control for the analysis.

2.2. Street Tree Canopy Cover Within the Road Area Where Crashes Occurred

The main index for the green space—the percentage of trees—is the ratio of tree canopy area per road area within a buffer around each crash.
The tree canopy area is represented by a layer of Geoscape (Canberra, Australia) satellite data with 2 m resolution, which covers most of the Sydney Metropolitan area but not some of the outskirts. The road area layer was sourced from the Department of Planning and Environment (New South Wales, Australia) polygon dataset. This covers the actual road area plus 4 m on either side for the nature strip (owned by the local council) and also another 4 m on adjacent properties. As some roads have different numbers of lanes, the widths of roads will vary.
Each crash is used as the centroid for the crash buffer. An initial 20-m radius circular buffer has been used as a balance to allow for varying road widths. In some cases, the final buffer may be clipped to less than the 20 m radius due to a smaller road width or if the crash is not geocoded in the center of the road. This is why the buffer road area can vary from crash to crash. The buffer is spatially joined with the tree canopy layer and the road area layer, and the percentage of trees is calculated. The theoretical maximum RA within a 20-m radius is 1257 m2. If the road area is smaller than 800 m2, it was deemed to be unreliable with respect to the value of the percentage of trees as it is a ratio. In this case, the percentage of trees is calculated with the use of a 30-m radius buffer. If the road area is still less than 800 m2, the 40-m radius buffer is used.
Finally, all remaining crashes with road areas less than 800 m2 were unselected from the analysis. The optimal threshold of 800 m2 was found using a reduction in deviance for the models with a threshold varying from 0 to 1200 with the step of 100 m2. Reduction in deviance was obtained in logistic regression predicting a car hitting a tree or bush in the first or second hit of the object during the crash. (Details of threshold selection are in Supplementary Table S1). The final dataset contained buffers of 20 (n = 55,469), 30 (n = 1451), and 40 m radius (n = 557) with mean road area of 1151 m2, coefficient of variation 9.7%, median = 1166 m2, i.e., almost no skew, with maximum and minimum of 800 and 2347 m2. The mean percentage of tree area was 8.2% (CV = 168%), substantially right-skewed (Median = 1.9%).
Three versions of the percentage of street tree percentage variable were tested: (1) continuous variable with a unit value equal to 10%; (2) variable with ten categories from 0–4.9% with step 5% to 45%+ and (3) variable with five categories: 0–4.9%, 5–9.9%, 10–19.9%, 20–34.5% and 35%+. The last variable structure was motivated by a progressively small number of crashes in the 10-categories variable and incidentally by joining categories with similar raw effects. Most modeling was performed with continuous variables, while most raw analysis was performed with ten category variables.

2.3. Statistical Analysis

Raw data analysis provided frequencies for categorical data and frequencies for different injuries per categorical variable. The calculations and data manipulations were performed using the SAS Enterprise Guide (Version 8.2 Update 1 (8.2.1.1223 (32 bit) Copyright © 2015 by SAS Institute Inc., Cary, NC, USA). Logistic regression for binary crash outcomes was fitted in MLwiN software Version 3.05 [30] using Markov Chain Monte Carlo (MCMC) estimation with burn-in/chain of 3000/20,000 iterations [31,32]. Model fits were compared where needed by the deviance information criterion (DIC), which is an output of the MCMC procedure. To compare the fits, the change in DIC relative to the smallest DIC value (which is the indicator of the best model) was calculated (ΔDIC). Original data were read into Enterprise Guide, exported to Stata/SE (Version 15.1 for Windows StataCorp LLC, College Station, TX, USA), and imported into MLwiN from the Stata file. The modeling went in three steps: two exploratory analyses and the final modeling.
To model the incidence of different injuries or hitting trees during a crash, we would ideally require offsets describing the risk exposure/traffic volume at the point and time of the crash. Such information is impossible to obtain. Other indices for traffic volume, such as vehicle distance traveled, proved to be only indirect measures inadequate for the analysis at specific locations [33]. We avoided this problem by modeling effects on the severity of crashes (or crashes against trees) rather than their occurrence.
Models were adjusted for factors that increase the risk of traffic crashes and may confound an association with street tree canopy. These were initially nine variables, with the list being narrowed down to six for the final modeling. The final six were:
Alignment of the road originally had three categories: straight, curved and unknown, but one crash with unknown alignment was added to the straight category.
Surface condition, originally with four categories: dry (86.5%), wet (13.1%), snow or ice (0.03%), and unknown/not stated (0.3%) was used with only dry and wet/other categories, the latter combined the last three categories except dry.
Weather, originally with seven categories, was used only with fine (84.6%) and rain-overcast-other categories, combining in the latter raining (9.2%), overcast (5.2), other (0.1%), unknown (0.7%), fog/mist (0.2%), and snowing (0.02%). Eventually, the variable was not included into the final modeling due to high correlation (Spearman’s rank correlation coefficient, rs = 0.77) with surface conditions.
The Speed limit variable had 11 categories for speed from 10 to 110 km/h with a 10 km/h step and an unknown category. For the final modeling, a five-category variable was created. Four crashes with unknown speed limits were added to 60 km/h, the most frequent category; 58 crashes from 10–30 km/h were joined with 40 km/h, and 887 crashes from 90 to 110 km/h were joined with 3003 crashes from 80 km/h category. This variable was used as such to create speed limit subsets for modeling.
Type of location variable had originally 13 categories, seven of which with the smallest size of 1.8% was joined as other. However, for the final modeling another two categories—roundabout (5.5%) and dual freeway (3.0%)—were added to other, due to lack of the outcome event of interest.
Speeding, fatigue, and alcohol were three variables related to human behavior that contributed to crashes. Additionally, a combined behavioral count variable was derived by summing up counts for each of the indices, which were assigned a value of 1 if there was involvement in a crash and 0 if not or unknown. Speeding and fatigue variables had two categories related to involvement in a crash: no/unknown and yes, while alcohol had three: unknown, no, and yes. The behavioral count had values 0, 1, 2, and 3. Alcohol and behavioral count were dropped from the final modeling due to the following. Raw frequencies for injuries related to alcohol indicated that they were higher in the no and yes categories relative to the unknown but also higher in the no category relative to the yes category. Speeding and fatigue had more injuries in the yes category relative to no/unknown; however, in the preliminary modeling with co-variates, speeding was associated with an increase in injuries, while fatigue decreased. It was deemed inappropriate to sum them up in a behavioral count variable.

3. Results

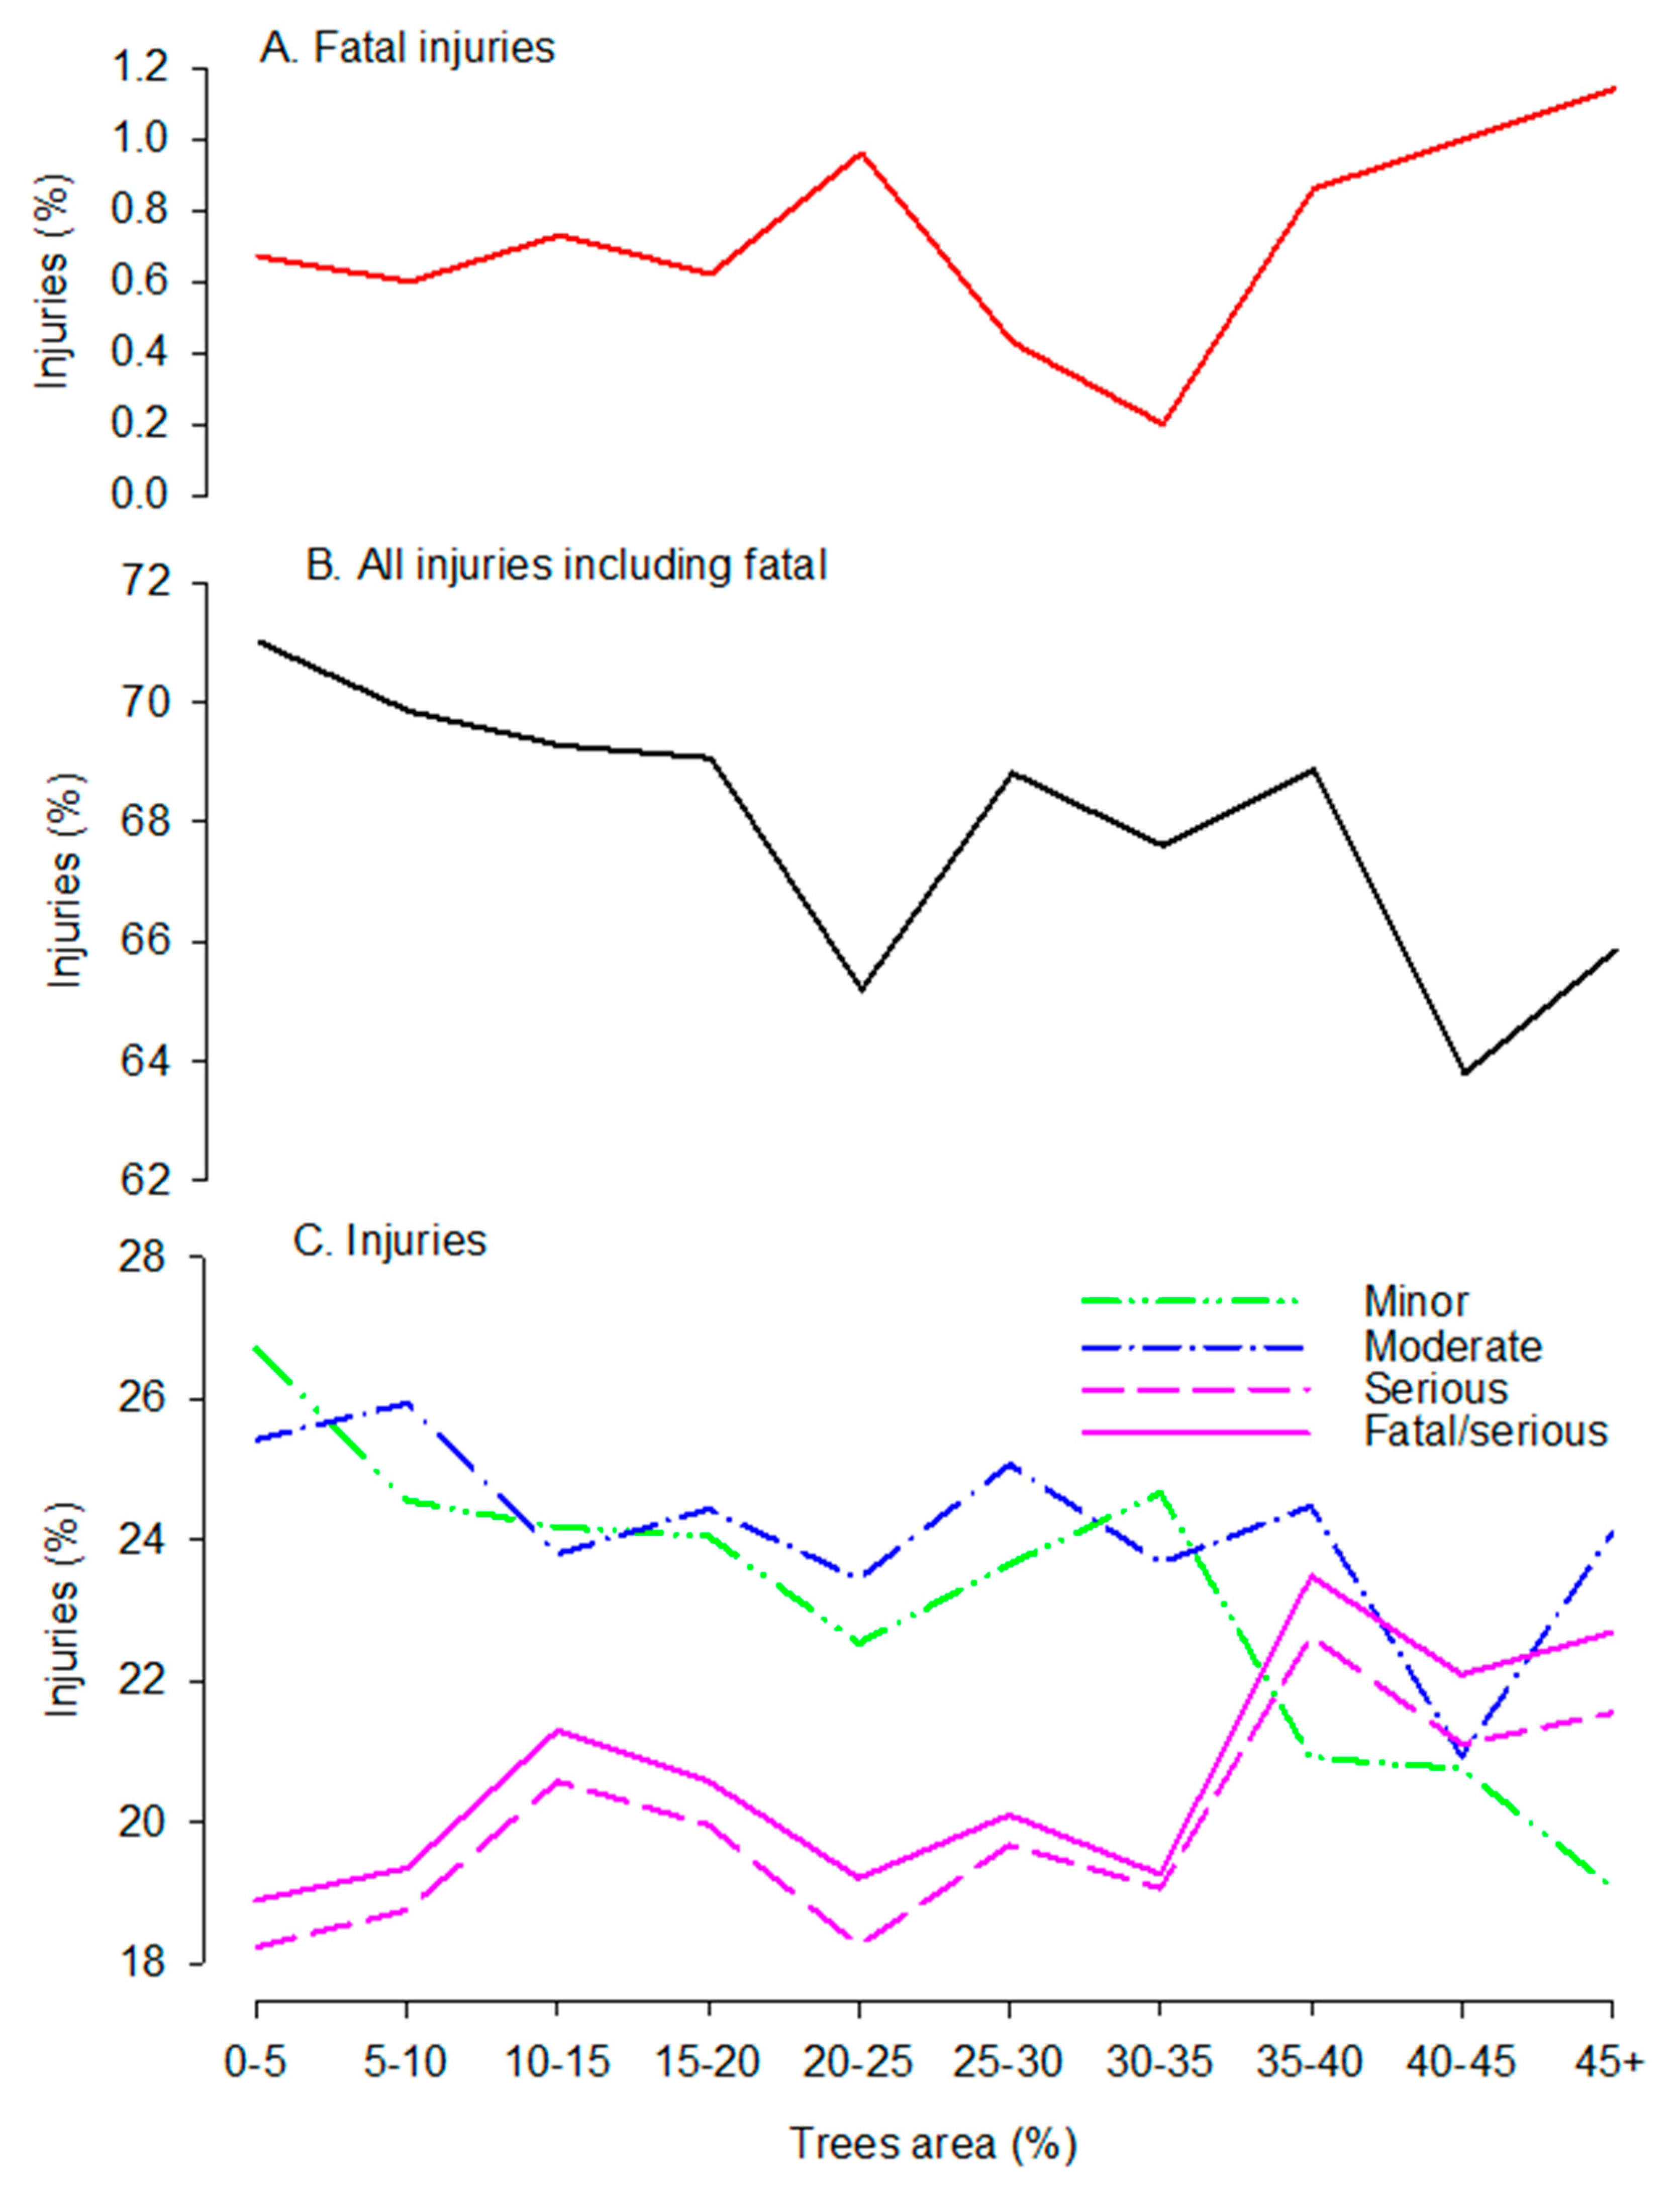
3.1. Raw Frequencies of Injuries/Crashes per Category of Variables

Descriptive statistics of the study sample and key variables are reported in Table 1. The cross-tabulation of the variables used for the final modeling are given in Table 2 and Figure 1, while the table with full list of variables is in Supplementary Table S2.
Injuries. Contrary to expectations, different types of injuries were related to street tree percentage in different ways. Crashes that have fatality were not significantly associated with street tree percentage, though there is some increase in cases for areas with street tree percentage of 30% and above. However, the absolute number of cases is very small.
The number of serious injuries is the only type of injuries that can be claimed, increases slightly with an increase in tree canopy percentage. Moderate injuries decreased slightly, while minor injuries decreased substantially (from 26.7% to 19.1%). Such diverse results prompted us to investigate jointly fatal/serious injuries, which increased from 18.9% to 22.7%, and all injuries, including fatal, which decreased from 71.0% to 65.9%. As can be seen in Figure 1, there are two peaks in fatal/series injuries, around 10–20% and above 30% of street trees percentage, while there are two troughs at these intervals in all injuries attributed to moderate and minor injuries. Yet, linear relationships look like a good approximation.
Crashes. As expected, the percentage of hitting trees/bushes increased with an increase in street trees percentage (from 1.5% to 7.5%). The same occurred to other types of hit objects (e.g., signposts), from 10.3 to 13.6%.

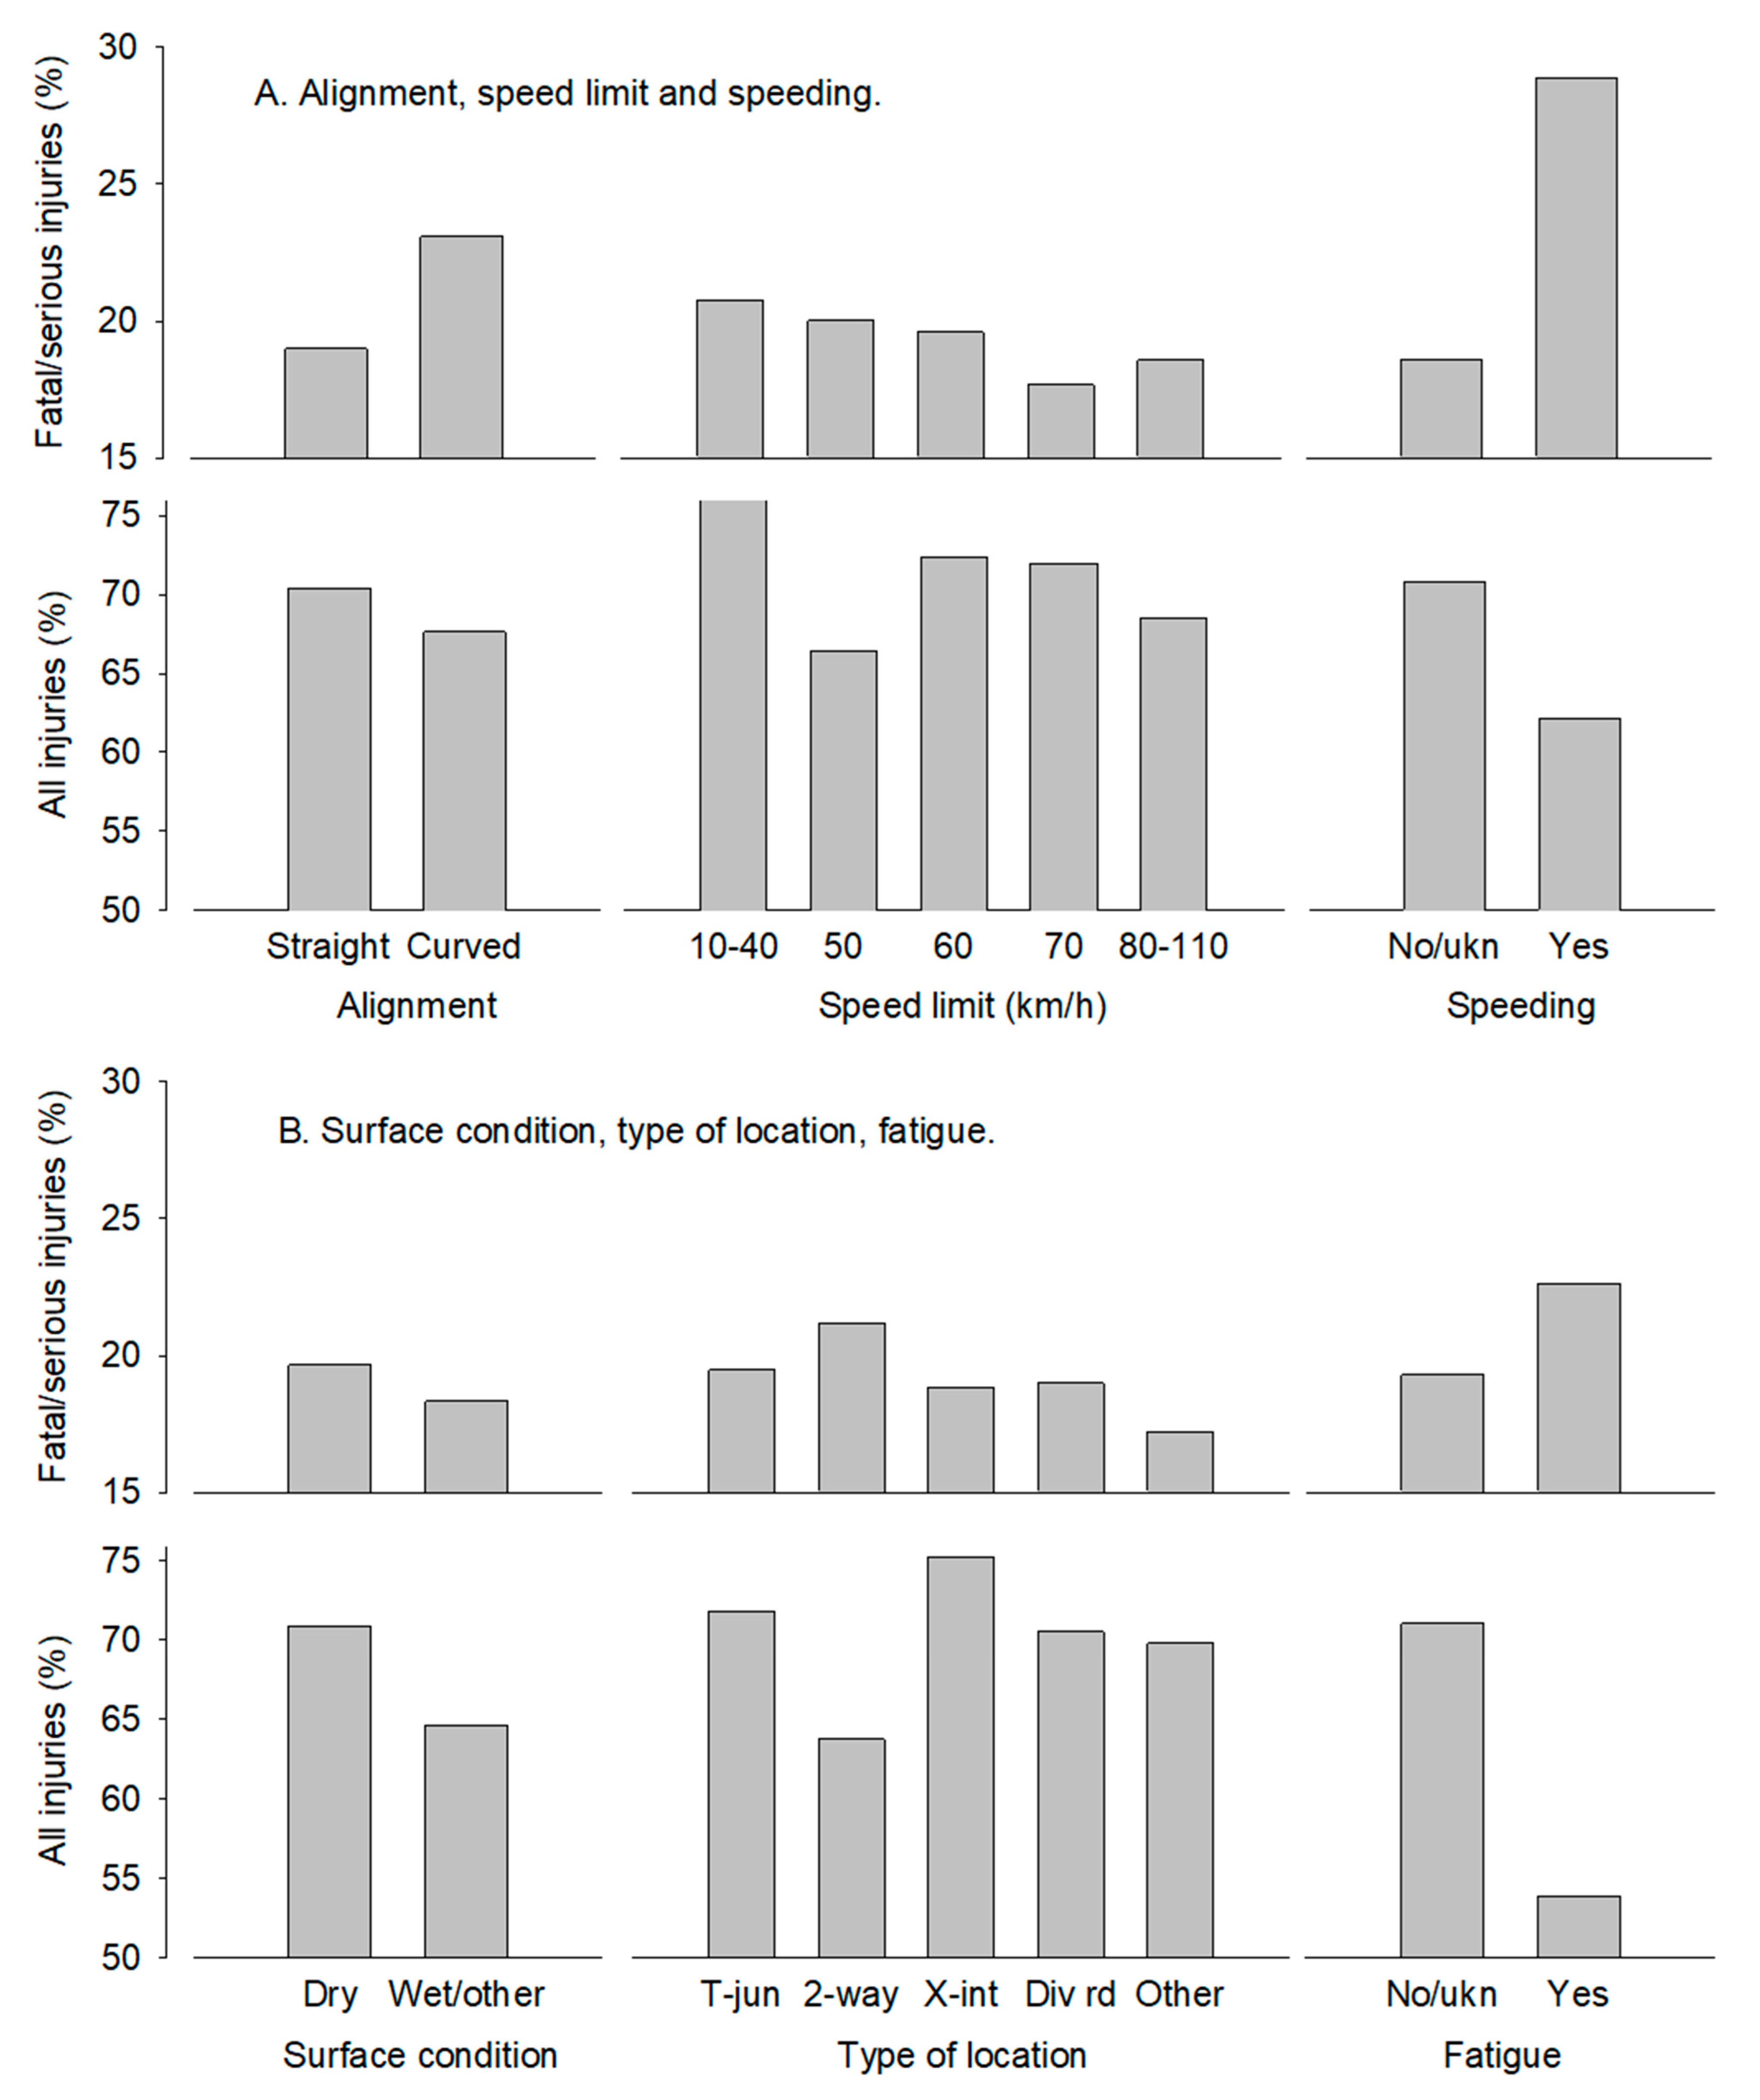
3.2. Co-Variates and Injuries/Crashes

The details of all injury types and crashes across variables included in the final modeling are in Table 2 and Figure 2. Effects for all described variables are in Supplementary Table S2.
Alignment. Curved vs. straight road is associated with more fatal and serious injuries (23.1% vs. 19.0%) but fewer total injuries (67.6% vs. 70.4%).
Surface condition. In both types of injuries, wet/other conditions are associated with a smaller percentage of injuries than dry: 18.3% vs. 19.7% and 64.6% vs. 70.9% for fatal/serious and all injuries, respectively.
Speed limit. Decline in crashes was related to speed limit, 20.8% to 18.6%, 76.7% to 68.5% associated with minimal and maximal speed limit for fatal/serious and all injuries, respectively.
Type of location. Of the four named locations, ignoring ‘other’, the minimal fatal and serious injuries are associated with a divided road, while the maximum is with the two-way undivided road (19.0% and 21.2%). The minimal and maximal percentage of all injuries were on two-way undivided road and X-intersection (63.7% and 75.3%), respectively.
Speeding and fatigue. The raw effects are similar, higher percentage of crashes with fatal and serious injuries, but lower percentage of crashes with all injuries. For speeding, fatal and serious injuries where this behavior is involved was 28.9% vs. 18.6% where it was not; while for fatigue, percentages were 22.6% vs. 19.3%, respectively. For all injuries, the related percentages were 62.2% vs. 70.8% and 53.9% vs. 71.0%.
Crashes of objects. Both crashes against trees/bush and other objects increased from 1.5 to 7.5% and 10.3 to 13.6%, respectively, given for the lowest and highest street tree percentage (0–5% and 45% and above).

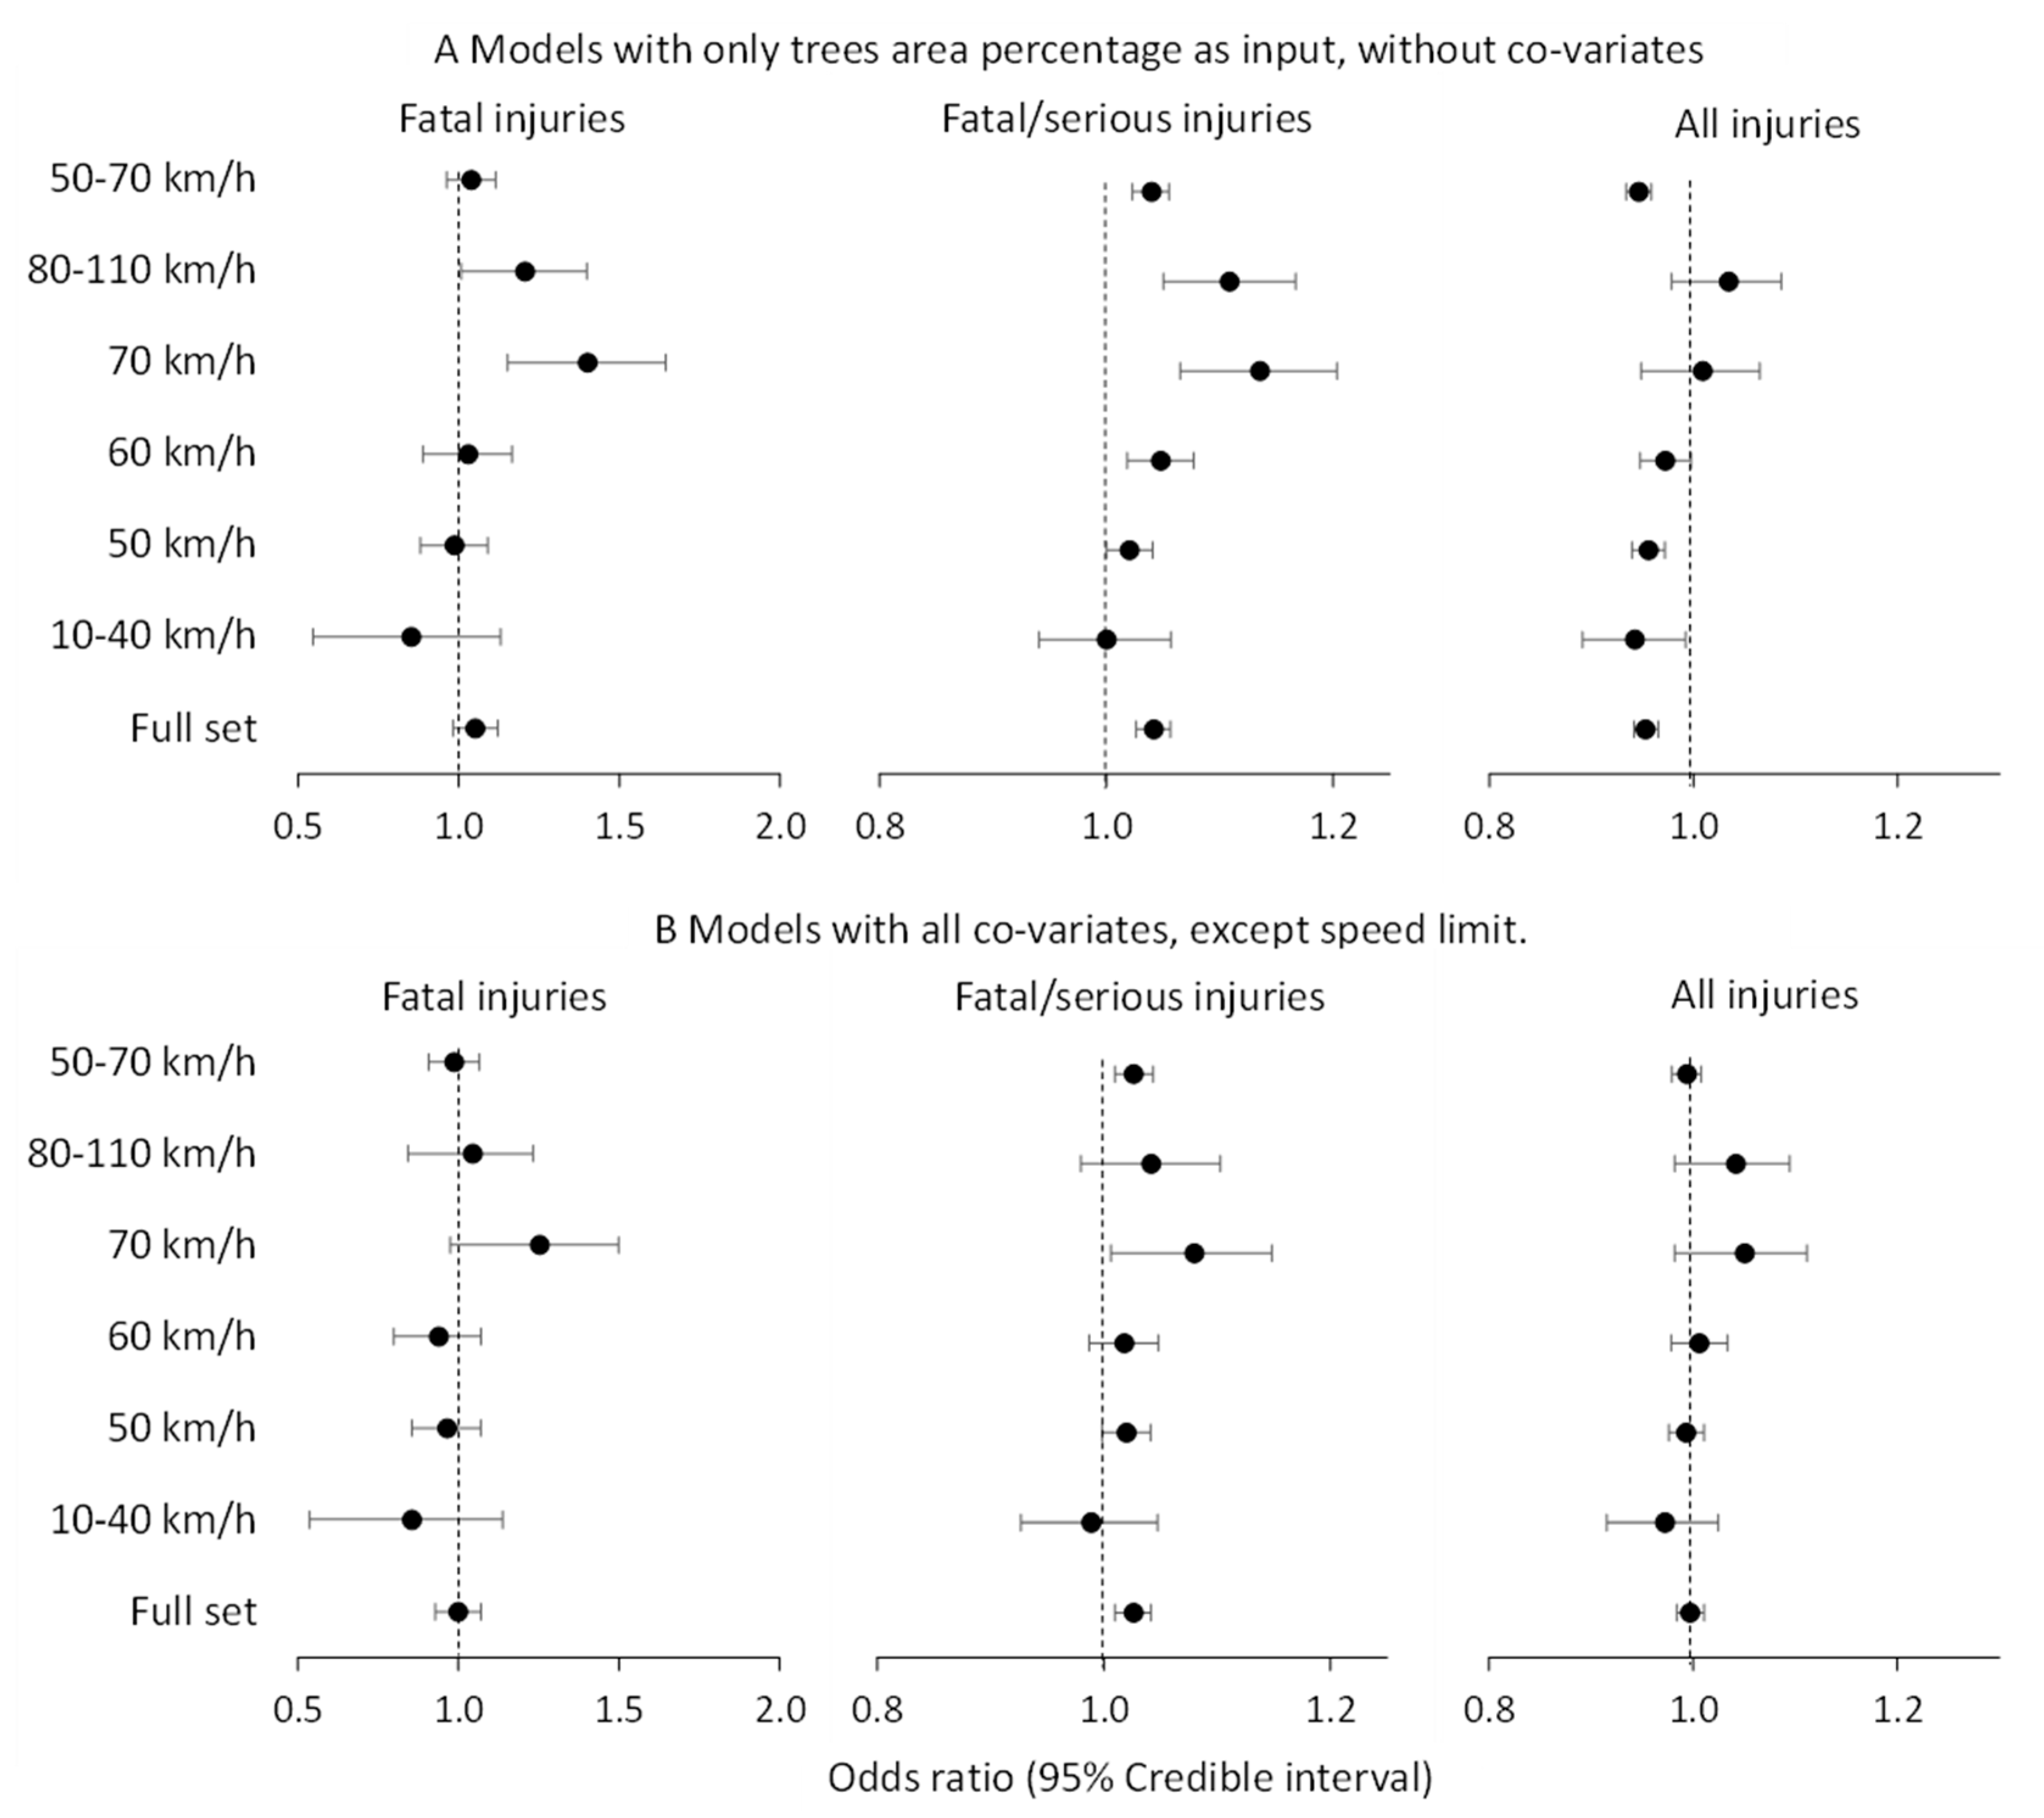
3.3. Modeling: Exploratory Analysis 1

The details of the analysis are presented fully in Supplementary Tables S3 and S4.
The analysis was based on logistic regression models to estimate the odds of fatal and serious injuries in association with street tree percentage.
The first part of the analysis dealt with a comparison of unadjusted model fits using three types of street tree percentage variables: (1) continuous with a unit of 10%, and two sets of categorical variables with (2) 10 and (3) five categories (Table S3). All three models indicated higher odds of fatal and serious injuries associated with a higher street tree percentage. For both categorical models, the odds ratio with 10–20% and ≥35% street tree percentage were statistically significant.
The second part of the analysis tested the performance of different co-variates in addition to the continuous street trees percentage variable (Table S4). The focus on the continuous street tree percentage variable here was selected due to similar unadjusted results with the more complex categorical versions. Model 1 contained only the street tree percentage variable; Model 2 added alcohol (transformed to have two categories, no/unknown and yes), speeding, and fatigue variables; Model 3 had additional surface condition, weather, speed limit, and type of location; Model 4 was like Model 3 but without alcohol, speeding and fatigue variables. All odds ratios (OR) were consistent and statistically significant across the models.
The odds ratio for street tree percentage (for a 10% increase in the three areas) was slightly attenuated with the addition of co-variates, from OR = 1.04 (Model 1) to 1.03 (Model 2–4). Behavioral variables in Models 2 and 3 returned consistent, statistically significant, but also mixed results. Counterintuitively, the presence of alcohol was associated with lower odds of fatal/serious injuries (OR = 0.88–0.87), whereas these odds were raised among those who were speeding (OR = 1.78–1.80) or reporting fatigue (OR = 1.19–1.17).
Surface conditions being wet or other reduced the odds of fatal/serious injuries (OR = 0.83, 086 for Models 3 and 4), though there was no statistically significant association with weather being rain/other in the same model. Henceforth, the weather was omitted from the model in favor of the surface variable. A speed limit of 70 km/h was the only speed that yielded a statistically significant odds ratio, with lower odds of fatal/serious injuries compared to roads with a speed limit of 10–40 km/h (OR = 0.87–0.86). Type of location categories with reference to T-junction increased the odds of fatal/serious injuries in Model 4 for 2-way undivided road, whereas reduced odds were observed for roundabouts and dual freeways in both Model 3 and 4 (OR = 0.79–0.79 and 0.80–0.81, respectively).

3.4. Modeling: Exploratory Analysis 2

Further exploratory analysis focussed on stratified samples denoted by road speeds of 10–40, 50–70 and 80–110 km/h. Logistic regression models analysed fatal and serious injuries as the outcome variable and the continuous street tree percentage variable with 10%-area unit-increment. The details of the analysis are presented fully in Supplementary Tables S5 and S6.
There were seven models fitted for each subset. Model 1 examined the odds of serious/fatal injuries in association with street tree percentage within each road speed subset. Model 2 was as Model 1 + the location type. Model 3 was as Model 2 + surface condition. Models 4 to 6 were based on Model 3 plus one behavioral variable each (speeding, fatigue, alcohol). Model 7 assessed cumulative behaviors.
The odds ratios for a 10% increase in street tree percentage for all 21 models are in Table S5. The 10–40 km/h subset indicated no association between street tree percentage and the odds of serious/fatal injuries at all, before and after adjusting for confounders. For roads with speed limits of 50–70 kph, a 10% increase in street tree percentage was associated with a 4% increase in the odds of serious/fatal injury. This was attenuated down to 3% but remained statistically significant after adjusting for various confounding variables. Similar was found for roads with speed limits of 80–110 kph, with a 10% increase in street tree percentage associated with an 11% increase in the odds of serious/fatal injuries in the unadjusted model. After adjusting for confounders, the association was attenuated to 6% and remained statistically significant in most models, except for models 4 and 7, which adjusted for speeding.
Table S6 presents all models fully. The subset with low-speed limits, 10–40 km/h, had significant odds ratios only in behavioral variables, i.e., increased odds of serious/fatal injury in the presence of speeding and cumulative behaviors, but also, counterintuitively, lower odds associated with fatigue.
In the subset 50–70 km/h, the following observations were made: increased odds of serious/fatal injury were associated with 2-way undivided roads relative to T-junctions, whereas lower odds were noted for roundabouts and dual freeways. Wet surface conditions were consistently associated with reduced odds of serious/fatal injuries across these models. In contrast with the results for 10–40 km/h, increased odds of serious/fatal injury occurred where speeding or fatigue was reported, while increased odds were also noted where alcohol was present, though this was not statistically significant.
In the subset 80–110 km/h, there was a substantially stronger increase in the odds of serious/fatal injury for crashes at 2-way undivided roads compared with T-junctions and also reduced odds for X-intersections. There were no differences in the odds of serious/fatal injury with respect to surface conditions. The odds of serious/fatal injury were substantially higher within the presence of speeding or fatigue, while alcohol was also associated with higher odds but was not statistically significant.

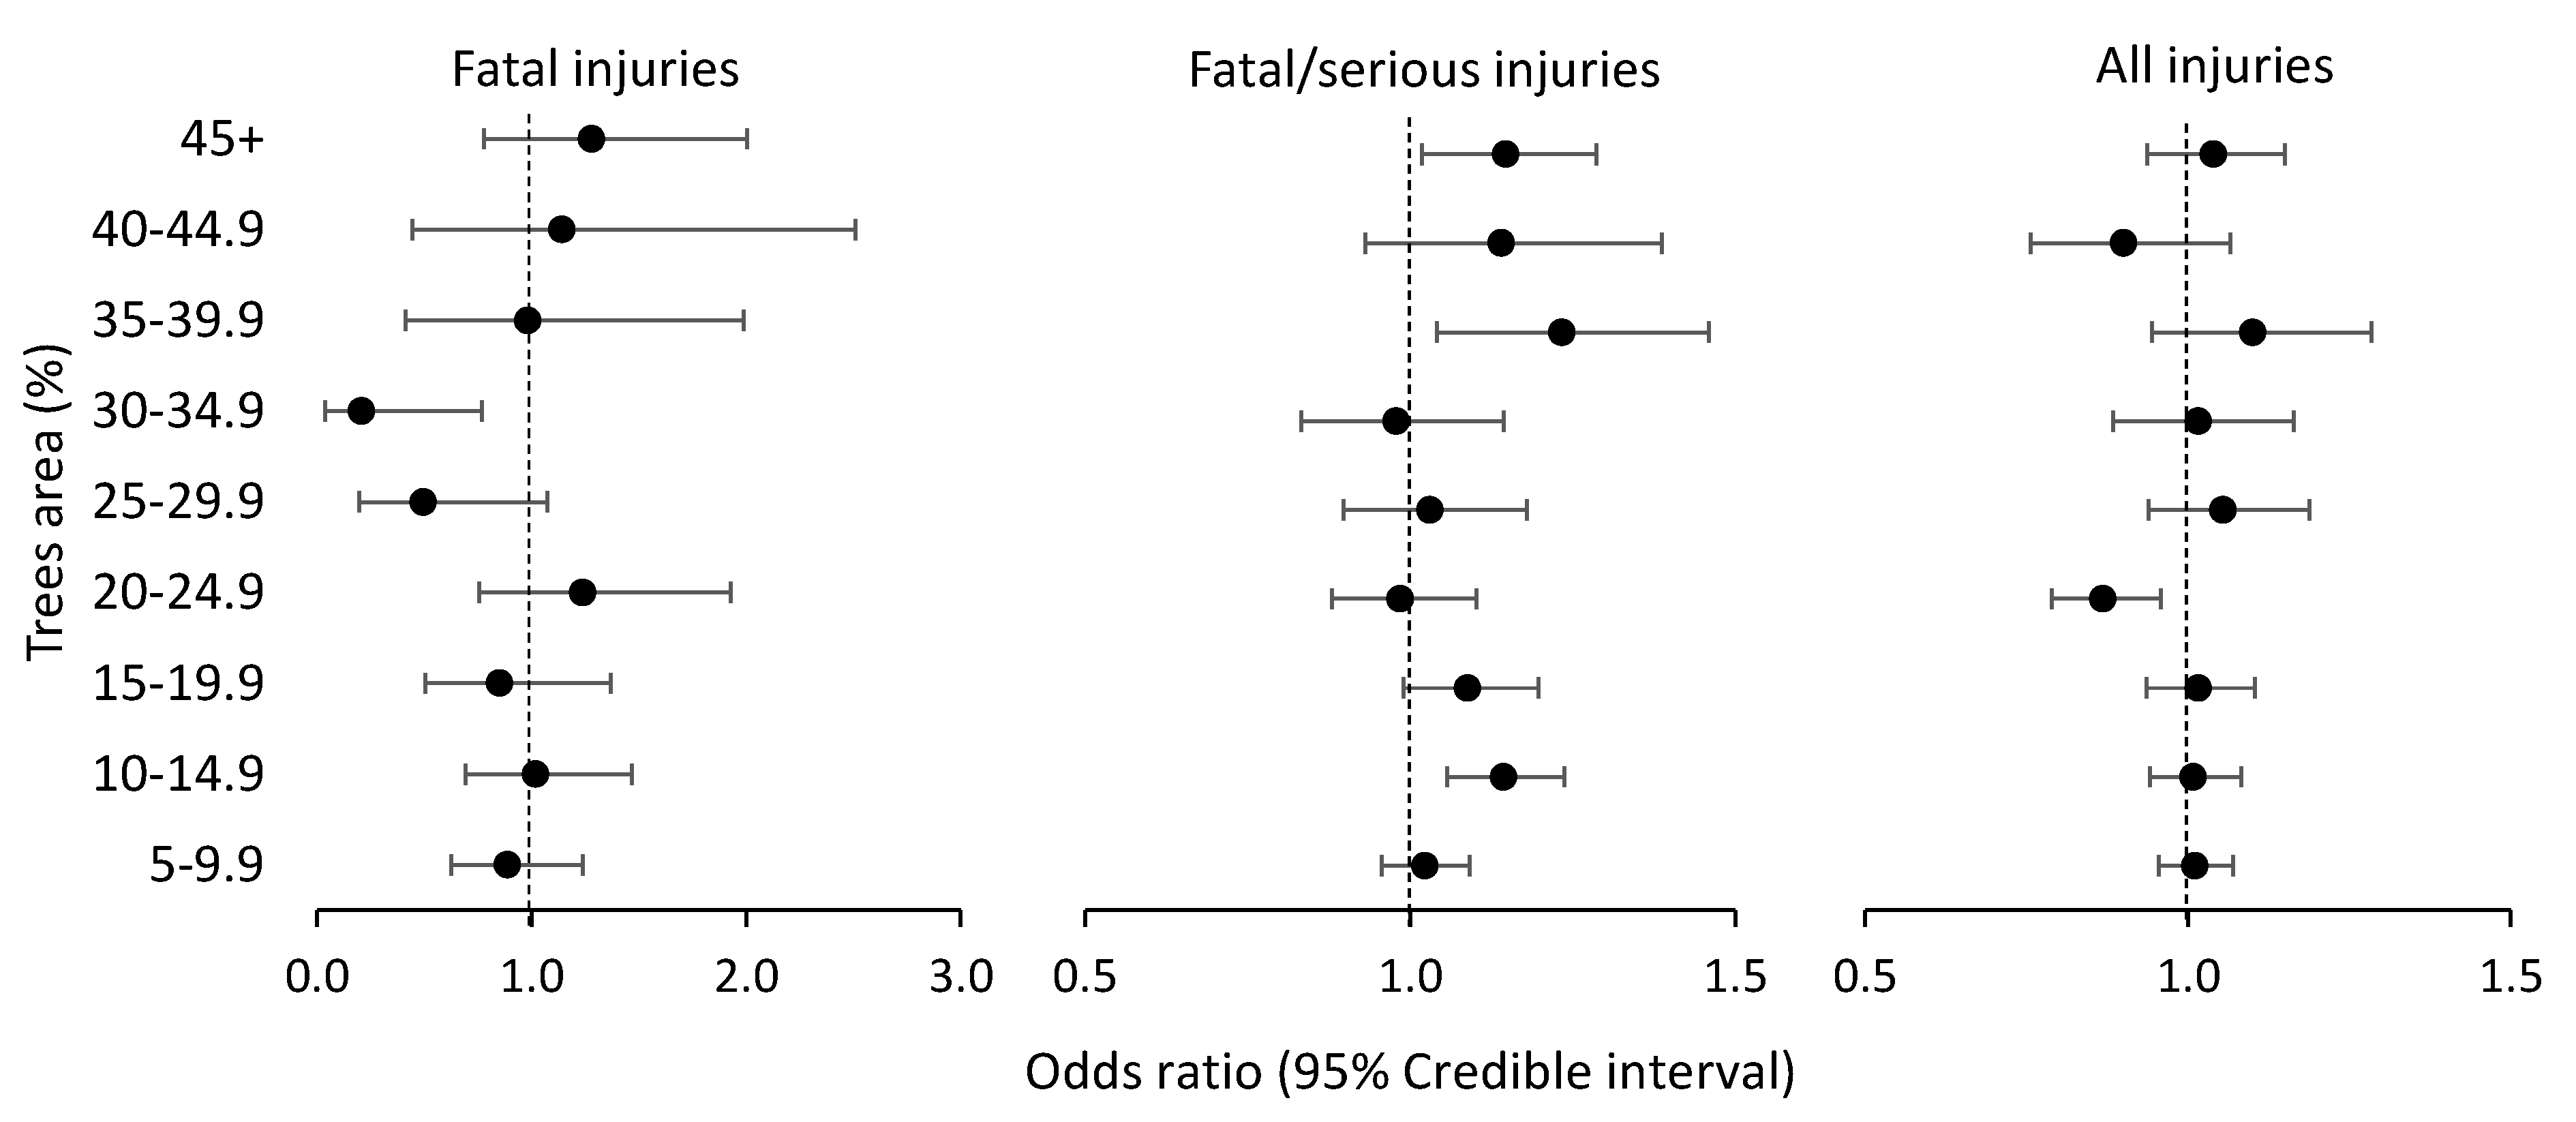
3.5. Modeling: Final Analysis

There were 84 models in the final analysis. They were applied to a full set and five subsets associated with the following speed limits: 10–40, 50, 60, 70, 80–110 km/h. As a result of both the raw frequencies and exploratory analyses, we decided to omit the alcohol variable (and, consequently, the behavioral count variable) from the co-variate list. Speeding and fatigue were examined separately instead of cumulatively. Given the exploratory evidence of potentially increased risk of serious/fatal injury with respect to higher levels of street tree percentage along roads with higher speed limits, we examined this in more detail by interrogating more speed limit subsets, namely, 50, 60, and 70 km/h, while combining types of location (roundabout, dual freeway, others) into a single category due to similar results from individually small cell counts. In addition to examining fatal and serious injuries as the primary outcome, the final analyses also examined secondary outcome variables, including fatal injuries only, all injuries, and crashes specifically involving collisions with trees/bushes.
The first set of 24 models was fitted with only an intercept and the continuous street tree percentage. A second set of 24 models was adjusted for all covariates (type of location, surface condition, speeding, and fatigue), except for speed limit, because subsets were already partitioned by this variable.
A third set of 24 models was also fitted with all-covariates on the same subsets by the speed limit, but this time with the 5-category street tree percentage variable. These models were used to check if risks of different severities of injury were consistently associated with street tree percentage, or if peaks noted in raw frequencies at 10–20% and ≥35% that were present in covariate-adjusted analyses (Table 2 and Figure 1). The last set consisted of 12 models, and these were fitted on the full sample of crashes combining all four outcomes, with all covariates including speed limit and testing continuous, as well as two categorical street tree percentage variables.

3.6. A. Street Tree Percentage Variables

A summary of the first, second and third set of models is given in Table 3 and Figure 3 (for second set only) presents the odds ratios for each outcomes variable and a 10% increase in street tree percentage. Table 4 supplies the raw frequencies of injuries/crashes per 5-category street tree percentage variable per subsets, to inform model presentations. The fourth set of models are presented in Table S9 (fully) and Figure 4.
A1. Unadjusted models (Models 1, continuous street tree percentage variable, Table 3). As expected, the size of odds ratios here was the largest, as the variation can be attributed to co-variates that were not present (but then adjusted in the second set of models; see A2 below). Associations with fatal injuries were increased significantly for subsets with the following higher speed limits: 70 and 80–110 km/h. The odds of serious/fatal injuries were increased consistently, except in the subset with the slowest speed limit. However, the odds of any injuries were significantly reduced with a 10% increase in street tree percentage in the full sample and in subsets with speed limits up to 60 km/h, while being not statistically significant for crashes on roads with speed limits at 70 km/h or above. Associations of crashes into trees/bushes with street tree percentage were higher in all subsets and the full sample.
A2. Models adjusted for co-variates (Models 2, continuous street tree percentage variable, Table 3). The number of significant odds ratios for injuries dropped substantially. Only the 70-km/h subset had fatal injuries statistically significantly associated with street tree percentage. However, this needs to be taken carefully, as the total number of fatalities in this subset was only n = 46, and only n = 8 of them occurred where street tree percentage ≥20% (see Table 4). Serious/fatal injuries were associated with street tree percentage in the full sample (OR 1.03), 50-km/h (OR 1.02), and 70-km/h (OR 1.08) subsets.
There were no statistically significant associations for all injury outcomes. Associations of crashes into trees/bushes with street tree percentage were increased in all sample subsets but less so than in unadjusted models. The peak danger was associated with street tree percentage, and crashes into trees/bushes were observed for roads at a speed limit of 70 km/h.
A3. Models with co-variates without speed limits (Models 3, 5-category street tree percentage variable, Table 3). Co-variate adjusted models yielded broadly similar results to those unadjusted. Associations between street tree canopy and fatal injuries were entirely absent of statistical significance (i.e., no clear evidence of higher or lower odds of fatal injury with higher street tree percentage along roads of any speed limit). For serious/fatal injuries along roads of any speed, there were higher odds where street tree percentage was 10–20% or 20–35% compared with 0–4.9%. Along roads of 50 km/h, higher odds were reported only where the street tree percentage was ≥35%. Along roads of 60 km/h, higher odds of serious/fatal injury were observed only where street tree canopy was 10–19.9%, but not where tree canopy was greater. No statistically significant odds ratios were reported for street tree percentage along roads with speed limits ≥70 km/h. The odds of any injury occurring were higher only along roads of 60 km/h where street tree percentage was 10–19.9% (but not higher) in comparison with 0–4.9%. Injury odds were actually lower, with a street tree percentage of 20–34.9% along roads of 50 km/h, with no other statistically significant associations. Odds of crashes involving trees/bushes were almost uniformly increased along roads of any speed where there were higher percentages of street trees present. Raw frequencies of injuries and crashes are in Table 4.
A4. Models with all co-variates, including speed limits, using three street tree percentage variables built on a full set (Table S9 and Figure 4). Analyses of the continuous street tree percentage variable have shown similar associations as those models with only stratification (but not adjustment) for speed limits. In particular, the association with serious/fatal injuries was statistically significant (OR = 1.03, 1.01–1.04) and crashes involving trees/bushes (OR = 1.20, 1.17–1.24). Analysis of street tree percentage in 10 strata provided further support. There were lower odds of fatal injury for street tree percentage of 25–35%, increased odds of fatal and serious injuries in 10–20% and ≥35% street tree percentage, and lower odds of all injuries for street tree percentage 20–25%. Odds of crashes were increased in all categories relative to the reference street tree percentage of 0–5%. Models with the five-category street tree percentage variable showed similar associations for the odds of serious/fatal injuries and crashes involving trees/bushes and no associations for the fatal and all injury outcome variables.

4. Discussion

The key findings from our assessment of associations between street tree percentage, injury, and death from a large sample of traffic crashes in Australia’s biggest city are as follows. First, running counter to our first hypothesis, a 10% increase in street trees was associated with a 3% increase in the odds of serious/fatal injuries on roads of any speed limit (OR = 1.03, 95%CI = 1.01–1.04) after adjustment for behavioral and structural confounders. Second, the odds of any injury occurring or death separate from serious injury were not associated with a 10% increase in street trees (positively or negatively). Seemingly protective effects observed in unadjusted models for all injuries were explained by adjustment for confounding. Third, when considering roads with different speed limits, a 10% increase in street tree percentage was statistically significantly associated with an 8% (OR = 1.08, 95%CI = 1.01–1.15) increase in the odds of serious/fatal injury and 25% (OR = 1.25, 95%CI = 1.01–1.53) increased odds of death along roads of ≥70 km/h. Fourth, we did not observe any similar associations between street tree percentage and any of the injury/death outcomes for roads with speeds less than 70 km/h. In combination, these results support our supposition that association size between street trees and injury or death from traffic accidents is contingent upon road speed. It does not, however, appear to be the case that street trees confer any protective effect; rather, there is no increased risk of harm from their presence along roads with speed limits less than 70km/h.
The absence of association between serious or fatal traffic accidents and the percentage of street trees along roads with speed limits lower than 70 km/h indicates that speed is the key determinant, rather than street trees promoting more careful driving [17,18] or promoting psychological restorative processes that ameliorate the stress of driving [11]. Our research also confirms results from previous work on the increased risks of fatal or serious injuries in crashes where speeding [13] or fatigue [14,15] were reported. Wet surface conditions were associated with reduced odds of fatal or serious injuries, unlike previous evidence [12]. This may be due to a selection effect wherein some people may be less likely to drive in precarious weather conditions, and others may be more vigilant than normal. Unlike some previous work [16], we found the presence of alcohol was associated with lower risks of fatal or serious injuries. Some work with similar results speculate that intoxication may mean drivers are more relaxed at the time of a crash and relatively less likely to sustain an injury as a result, compared to sober drivers or passengers who tend to tense up, but the evidence is mixed and not strong enough to draw any firm conclusions [34,35,36].
The strengths of this study include the large sample size and the full data on crashes occurring across the entire jurisdiction of metropolitan Sydney, a city of over 5 million people with diverse topography and variable infrastructure quality encompassing higher-density inner city areas and vast urban sprawl. Data available permitted control of a wide range of behavioral and structural sources of confounding. The comprehensiveness of the data also permitted the identification of crashes that actually involved collisions into trees. It is important to emphasize that the majority of crashes (97%) did not. It was no surprise that the analyses of collisions with trees did indicate consistently greater odds of occurrence along roads where there is more street tree coverage. Unfortunately, data were not available to distinguish between collisions that occurred because of a tree that had fallen into the road in front of an oncoming vehicle and collisions that resulted from an errant vehicle veering off-road. The former might be addressed by urban foresters through monitoring and preventive measures, whereas the latter is a problem with errant vehicles. A related limitation is that no data were available on how many pedestrian lives were saved because they were shielded by trees into which vehicles collided. Thus, the analysis is skewed towards measuring the harms side of the ledger, with prevention unmeasured.
Finally, there are incidents reported of street trees being felled for purposes of road expansion and due to malicious actions of rogue individuals attempting to boost housing prices by revealing green or sea vistas. While data to which we had access did not permit examination of change in tree canopy cover as a predictor of road traffic accidents, neither is likely to substantially affect the overall results as the former usually occurs during protracted periods of road closure, and the latter tends to skew towards minor roads through coastal areas. Nevertheless, the assessment of change in canopy cover as a result of street tree planting and trajectories, not only in road traffic accidents but also potential increases in walking and cycling, would be a valuable future avenue for research. Relatedly, our tree data did not permit an ability to distinguish between different densities of street tree planting, differences in tree species and trunk diameter, locations on footpaths versus encroaching onto roads, or differences between proactive and routine tree pruning versus reactive and proper versus improper pruning; all of these may have localized impacts on visibility that might be important for determining crash risk and injury severity.

5. Conclusions

These results paint a nuanced picture contingent upon speed. There is a small degree of support for public health concerns among transport planners, and this is reserved specifically for street tree provision along roads of 70 km/h and serious/fatal injuries (for every 10% increase in street tree percentage, the odds of serious/fatal injury rose 8% along roads of 70 km/h). However, there was no statistically significant risk for injuries, including those less serious, nor for serious/fatal injuries along roads with speed limits lower than 70 km/h. This gives a strong indication of two potential policy recommendations. Firstly, to prioritize planting and preservation of street tree canopy cover along roads less than 70 km/h, given that a higher level of street tree provision along roads with speed limits less than 70 km/h is not statistically associated with increased risk of death or injury of any severity. Second, consider reducing speed limits on roads currently set at 70 km/h to less than 70 km/h, which our findings indicate may alleviate the risk of serious/fatal injury associated with street tree provision. In combination, these measures may alleviate the residual risk for serious/fatal injuries while maintaining the ecosystem services and mental, physical, and social health benefits of street trees.

Supplementary Materials

The following supporting information can be downloaded at https://www.mdpi.com/article/10.3390/land13111815/s1, Table S1. Selection of the best road area threshold for crash data exclusion and correction; Table S2. Distribution of injuries and hits over categorical variables of study; Table S3. Selection of street tree variable; Table S4. Testing models with different complement of co-variates; Table S5. Logistic regression for incidence of crashes with fatal or serious injuries with 10% increase in street tree; Table S6. Logistic regression for incidence of crashes with fatal or serious injuries by three subsets of speed limits: full results; Table S7. Final modelling: Association of the incidence of injuries and hits in crash with continuous street tree and all co-variates in logistic models.; Table S8. Final modelling: Association of the incidence of injuries and hits in crash with all co-variates in logistic models: street tree is 5-category variable.; Table S9. Logistic regression on full set with all covariates including speed limit: different street tree variables.

Author Contributions

Conceptualization, X.F., M.N. and T.A.-B.; methodology, X.F., M.N. and T.A.-B.; software, M.N.; validation, T.A.-B.; formal analysis, M.N.; investigation, X.F., M.N. and T.A.-B.; resources, X.F., M.N. and T.A.-B.; data curation, X.F., M.N. and T.A.-B.; writing—original draft preparation, X.F., M.N. and T.A.-B.; writing—review and editing, X.F., M.N. and T.A.-B.; visualization, M.N.; supervision, X.F. and T.A.-B.; project administration, X.F.; funding acquisition, X.F. and T.A.-B. All authors have read and agreed to the published version of the manuscript.

Funding

We acknowledge funding from NSW Government. We are grateful for the APC waiver.

Data Availability Statement

Data is confidential.

Conflicts of Interest

The authors declare no conflict of interest.

References

  1. Ma, S.; Pitman, A.; Hart, M.; Evans, J.P.; Haghdadi, N.; MacGill, I. The impact of an urban canopy and anthropogenic heat fluxes on Sydney’s climate. Int. J. Climatol. 2017, 37, 255–270. [Google Scholar] [CrossRef]
  2. Deilami, K.; Kamruzzaman, M.; Liu, Y. Urban heat island effect: A systematic review of spatio-temporal factors, data, methods, and mitigation measures. Int. J. Appl. Earth Obs. Geoinf. 2018, 67, 30–42. [Google Scholar] [CrossRef]
  3. Feng, X.; Toms, R.; Astell-Burt, T. Association between green space, outdoor leisure time and physical activity. Urban For. Urban Green. 2021, 66, 127349. [Google Scholar] [CrossRef]
  4. Roscoe, C.; Sheridan, C.; Geneshka, M.; Hodgson, S.; Vineis, P.; Gulliver, J.; Fecht, D. Green walkability and physical activity in UK Biobank: A cross-sectional analysis of adults in Greater London. Int. J. Environ. Res. Public Health 2022, 19, 4247. [Google Scholar] [CrossRef]
  5. Frumkin, H. Urban sprawl and public health. Public Health Rep. 2002, 117, 201–217. [Google Scholar] [CrossRef]
  6. Rissel, C.E. Active travel: A climate change mitigation strategy with co-benefits for health. N. South Wales Public Health Bull. 2009, 20, 10–13. [Google Scholar] [CrossRef]
  7. City of Sydney. Greening Sydney Strategy. Available online: https://www.cityofsydney.nsw.gov.au/strategies-action-plans/greening-sydney-strategy (accessed on 12 October 2021).
  8. City of Barcelona. Trees for Life: Master Plan for Barcelona’s Trees 2017–2037. Available online: https://www.c40knowledgehub.org/s/article/Trees-for-Life-Master-Plan-for-Barcelona-s-Trees-2017-2037?language=en_US (accessed on 13 March 2021).
  9. City of Vancouver. Park Board Achieves Target to Plant 150,000 Trees by 2020. Available online: https://vancouver.ca/news-calendar/park-board-achieves-target-to-plant-150000-trees-by-2020.aspx (accessed on 13 March 2021).
  10. City of Seattle. Trees For Seattle. Available online: https://www.seattle.gov/trees/management/canopy-cover (accessed on 13 March 2021).
  11. Van Treese, J.W., II; Koeser, A.K.; Fitzpatrick, G.E.; Olexa, M.T.; Allen, E.J. A review of the impact of roadway vegetation on drivers’ health and well-being and the risks associated with single-vehicle crashes. Arboric. J. 2017, 39, 179–193. [Google Scholar] [CrossRef]
  12. Theofilatos, A.; Yannis, G. A review of the effect of traffic and weather characteristics on road safety. Accid. Anal. Prev. 2014, 72, 244–256. [Google Scholar] [CrossRef]
  13. Aarts, L.; Van Schagen, I. Driving speed and the risk of road crashes: A review. Accid. Anal. Prev. 2006, 38, 215–224. [Google Scholar] [CrossRef]
  14. Zhang, G.; Yau, K.K.; Zhang, X.; Li, Y. Traffic accidents involving fatigue driving and their extent of casualties. Accid. Anal. Prev. 2016, 87, 34–42. [Google Scholar] [CrossRef]
  15. Moradi, A.; Nazari, S.S.H.; Rahmani, K. Sleepiness and the risk of road traffic accidents: A systematic review and meta-analysis of previous studies. Transp. Res. Part F Traffic Psychol. Behav. 2019, 65, 620–629. [Google Scholar] [CrossRef]
  16. Glucksman, E. Alcohol and accidents. Br. Med. Bull. 1994, 50, 76–84. [Google Scholar] [CrossRef]
  17. Ewing, R.; Dumbaugh, E. The built environment and traffic safety: A review of empirical evidence. J. Plan. Lit. 2009, 23, 347–367. [Google Scholar] [CrossRef]
  18. Calvi, A. Does roadside vegetation affect driving performance? Driving simulator study on the effects of trees on drivers’ speed and lateral position. Transp. Res. Rec. 2015, 2518, 1–8. [Google Scholar] [CrossRef]
  19. Hartig, T.; Mitchell, R.; de Vries, S.; Frumkin, H. Nature and Health. Annu. Rev. Public Health 2014, 35, 207–228. [Google Scholar] [CrossRef] [PubMed]
  20. Markevych, I.; Schoierer, J.; Hartig, T.; Chudnovsky, A.; Hystad, P.; Dzhambov, A.M.; de Vries, S.; Triguero-Mas, M.; Brauer, M.; Nieuwenhuijsen, M.J.; et al. Exploring pathways linking greenspace to health: Theoretical and methodological guidance. Environ. Res. 2017, 158, 301–317. [Google Scholar] [CrossRef]
  21. Astell-Burt, T.; Feng, X. Urban green space, tree canopy and prevention of cardiometabolic diseases: A multilevel longitudinal study of 46 786 Australians. Int. J. Epidemiol. 2020, 49, 926–933. [Google Scholar] [CrossRef]
  22. Astell-Burt, T.; Feng, X. Does sleep grow on trees? A longitudinal study to investigate potential prevention of insufficient sleep with different types of urban green space. SSM Popul. Health 2020, 10, 100497. [Google Scholar] [CrossRef]
  23. Astell-Burt, T.; Feng, X. Association of Urban Green Space with Mental Health and General Health Among Adults in Australia. JAMA Netw. Open 2019, 2, e198209. [Google Scholar] [CrossRef]
  24. Feng, X.; Toms, R.; Navakatikyan, M.; Astell-Burt, T. The nexus between urban green space, housing type, and mental health. Soc. Psychiatry Psychiatr. Epidemiol. 2022, 57, 1917–1923. [Google Scholar] [CrossRef]
  25. Kardan, O.; Gozdyra, P.; Misic, B.; Moola, F.; Palmer, L.J. Neighborhood greenspace and health in a large urban center. Sci. Rep. 2015, 5, 11610. [Google Scholar] [CrossRef] [PubMed]
  26. Kondo, M.C.; Mueller, N.; Locke, D.H.; Roman, L.A.; Rojas-Rueda, D.; Schinasi, L.H.; Gascon, M.; Nieuwenhuijsen, M.J. Health impact assessment of Philadelphia’s 2025 tree canopy cover goals. Lancet Planet. Health 2020, 4, e149–e157. [Google Scholar] [CrossRef] [PubMed]
  27. Browning, M.H.; Lee, K.; Wolf, K.L. Tree cover shows an inverse relationship with depressive symptoms in elderly residents living in US nursing homes. Urban For. Urban Green. 2019, 41, 23–32. [Google Scholar] [CrossRef]
  28. Marselle, M.R.; Bowler, D.E.; Watzema, J.; Eichenberg, D.; Kirsten, T.; Bonn, A. Urban street tree biodiversity and antidepressant prescriptions. Sci. Rep. 2020, 10, 22445. [Google Scholar] [CrossRef]
  29. Giacinto, J.J.; Fricker, G.A.; Ritter, M.; Yost, J.; Doremus, J. Urban forest biodiversity and cardiovascular disease: Potential health benefits from California’s street trees. PLoS ONE 2021, 16, e0254973. [Google Scholar] [CrossRef]
  30. Rasbash, J.; Steele, F.; Browne, W.J.; Goldstein, H. A User’s Guide to MLwiN; Version 3.05; Centre for Multilevel Modelling, University of Bristol: Bristol, UK, 2020. [Google Scholar]
  31. Browne, W.J. MCMC Estimation in MLwiN, v3.03; Centre for Multilevel Modelling, University of Bristol: Bristol, UK, 2019.
  32. Steele, F. Module 6: Regression Models for Binary Responses Concepts; Centre for Multilevel Modelling, University of Bristol: Bristol, UK, 2009. [Google Scholar]
  33. Harvey, C.; Aultman-Hall, L. Urban Streetscape Design and Crash Severity; Transportation Research Board: Washington, DC, USA, 2015; pp. 1–8. [Google Scholar]
  34. Friedman, L.S. Dose–response relationship between in-hospital mortality and alcohol following acute injury. Alcohol 2012, 46, 769–775. [Google Scholar] [CrossRef]
  35. Hsieh, C.-H.; Su, L.-T.; Wang, Y.-C.; Fu, C.-Y.; Lo, H.-C.; Lin, C.-H. Does alcohol intoxication protect patients from severe injury and reduce hospital mortality? The association of alcohol consumption with the severity of injury and survival in trauma patients. Am. Surg. 2013, 79, 1289–1294. [Google Scholar] [CrossRef]
  36. Plurad, D. Motor vehicle crashes: The association of alcohol consumption with the type and severity of injuries and outcomes. J. Emerg. Med. 2010, 38, 12–17. [Google Scholar] [CrossRef]
Figure 1. Cross-tabulation of injuries by tree area. The boundaries of the intervals are from equal left boundary to less the right boundary, except 45+, where the right boundary is less/equal to 100.
Land 13 01815 g001
Figure 2. Percentage of fatal/serious injuries (panels in odd rows) and all injuries (panels in even rows) associated with co-variates: raw frequencies. All results are statistically significant by chi-square criterion (p ≤ 0.001). Type of location categories are: T-junction, 2-way undivided road, X-intersection, divided road, and others. No/unk is No/unknown.
Land 13 01815 g002
Figure 3. Association of the incidence of injuries with 10% increase in trees area using logistic regression. The percentage of trees variable is continuous. (A) Models with only tree area percentage and intercept; (B) Models with all co-variates except speed limit. Models are built on a full set and subsets related to different speed limits. MCMC procedure using MLwiN with 3000–20,000 burn-in and sample iterations was used. Note different x-ranges, and additional to the ones described in the text 50–70 km/h subset of data.
Land 13 01815 g003
Figure 4. Association of the incidence of injuries with 10-category trees area variable using logistic regression. The reference category is 0–4.9% of the tree area. Models built on the full set, with all co-variates, including speed limit speed limits. MCMC procedure using MLwiN with 3000–20,000 burn-in and sample iterations was used. Note different x-ranges.
Land 13 01815 g004
Table 1. Raw frequencies of variables in the study.
Variable/CategoriesN%Name/CategoriesN%
Sources for outputs variables
Degree of crash (detailed) Hits (1st or 2nd) of objects
Non-casualty (tow-away)17,21429.9None49,89586.8
Minor/Other Injury14,64525.5Tree/bus13202.3
Moderate Injury14,42225.1Other626210.9
Serious Injury10,80518.8
Fatal3910.7
Percentage of Street tree percentage categorical variables
Street tree percentage (%, with regular interval) Street tree percentage (5, irregular area intervals)
0–4.935,77662.20–4.935,77662.2
5–9.9667711.65–9.9667711.6
10–14.944047.710–19.9728512.7
15–19.928815.020–34.944827.8
20–24.920773.635+32575.7
25–29.914082.4
30–34.99971.7
35–39.98131.4
40–44.96021.0
45+18423.2
Covariates
Alignment Surface condition
Straight50,57288.0Dry49,72986.5
Curved690512.0Wet/other774813.5
Weather
Fine48,61784.6
Rain/overcast/other886015.4
Speed limit Type of location
10–40 km/h29635.2T-junction17,69730.8
50 km/h21,44037.32-way undivided14,85525.8
60 km/h21,82038.0X-intersection11,80120.5
70 km/h736412.8Divided road726112.6
80–110 km/h38906.8Other586310.2
Behavioural covariates
Speeding Fatigue
No/unknown52,42491.2No/unknown54,20594.3
Yes50538.8Yes32725.7
Alcohol Behavioural count
Unknown39,98669.6048,72284.8
No15,20726.51702712.2
Yes22844.0216022.8
31260.2
Table 2. Distribution of injuries and hits over categorical variables of study.
Injuries (The Severest Injury Type in Crash)Hits of Objects
Fatal Serious ModerateMinor Fatal/SeriousFatal/All InjuriesHits Tree/BushHit Other
Variable/CategoryN TotalN%N%N%N%N%N%N%N%
Total57,4773910.6810,80518.814,42225.114,64525.511,19619.540,26370.113202.3626210.9
Street tree percentage variable
Street tree percentage (%, regular intervals)
0–4.935,7762390.67651818.2909325.4955426.7675718.925,40471.05331.5368710.3
5–9.96677400.60125218.8173225.9164024.6129219.4466469.91502.373811.1
10–14.94404320.7390620.6104823.8106524.293821.3305169.31122.551811.8
15–19.92881180.6257520.070424.469324.159320.6199069.11194.132511.3
20–24.92077200.9637918.348723.546822.539919.2135465.2813.925112.1
25–29.9140860.4327719.735325.133323.728320.196968.8523.717412.4
30–34.999720.2019019.123623.724624.719219.367467.6464.612912.9
35–39.981370.8618422.619924.517020.919123.556068.9496.010412.8
40–44.960261.0012721.112620.912520.813322.138463.8406.68614.3
45+1842211.1439721.644424.135119.141822.7121365.91387.525013.6
Chi-square (p-value) 15.2 39.7≤0.00119.9≤0.05106.6≤0.00143.2≤0.00172.8≤0.001531≤0.00151≤0.001
Co-variates
Alignment
Straight50,5723070.61929418.412,78525.313,20726.1960119.035,59370.49251.848389.6
Curved6905841.22151121.9163723.7143820.8159523.1467067.63955.7142420.6
Chi-square (p-value) 33.4≤0.00149≤0.0018≤0.0190≤0.00166≤0.00122≤0.001410≤0.001765≤0.001
Surface condition
Dry49,7293480.70942819.012,56625.312,91326.0977619.735,25570.910422.1500810.1
Wet/other7748430.55137717.8185624.0173222.4142018.3500864.62783.6125416.2
Chi-square (p-value) 2.1 6≤0.056≤0.0546≤0.0018≤0.01125≤0.00167≤0.001258≤0.001
Speed limit
10–40 km/h2963230.7859220.082527.883228.161520.8227276.7341.21745.9
50 km/h21,4401350.63415219.4530224.7465421.7428720.014,24366.47113.3258012.0
60 km/h21,8201480.68412418.9562825.8588427.0427219.615,78472.33871.8217410.0
70 km/h7364460.62125417.0177124.1222830.3130017.7529972.01051.476410.4
80–110 km/h3890391.0068317.689623.0104726.972218.6266568.5832.157014.7
Chi-square (p-value) 7.5 26≤0.00132≤0.001289≤0.00125≤0.001267≤0.001169≤0.001184≤0.001
Type of location
T-junction17,6971020.58334218.9453725.6472726.7344419.512,70871.82751.615418.7
2-way undivided14,8551280.86301520.3351123.6281318.9314321.2946763.76204.2203113.7
X-intersection11,801600.51216118.3320327.1345629.3222118.8888075.3740.67316.2
Divided road7261700.96130918.0172023.7201927.8137919.0511870.52132.9107414.8
Other5863310.5397816.7145124.8163027.8100917.2409069.81382.488515.1
Chi-square (p-value) 25.9≤0.00144≤0.00154≤0.001477≤0.00150≤0.001462≤0.001437≤0.001694≤0.001
Behavioral co-variates
Speeding
No/unknown52,4242750.52946118.113,17825.114,20727.1973618.637,12170.88031.542528.1
Yes50531162.30134426.6124424.64388.7146028.9314262.251710.2201039.8
Chi-square (p-value) 214≤0.001221≤0.0011 825≤0.001313≤0.001164≤0.0011555≤0.0014761≤0.001
Fatigue
No/unknown54,2053730.6910,08318.613,61025.114,43426.610,45619.338,50071.010602.053009.8
Yes3272180.5572222.181224.82116.574022.6176353.92608.096229.4
Chi-square (p-value) 0.9 24≤0.0010 662≤0.00122≤0.001432≤0.001494≤0.0011224≤0.001
Table 3. Final modeling: Association of the incidence of injuries and hits in crashes with a 10% increase in Street tree percentage using logistic regression.
Output VariablesFull Set and Subsets by Speed Limits
Full set10–40 km/h50 km/h60 km/h70 km/h80–110 km/h
n = 57,477n = 2963n = 21,440n = 21,820n = 7364n = 3890
Odds ratio (95% credible Interval)
A. Continuous Street tree percentage variable (unit = 10%).
1 Models with only Street tree percentage as co-variate (without other co-variates)
Fatal injuries1.05 (0.98, 1.12)0.85 (0.58, 1.16)0.99 (0.89, 1.10)1.03 (0.90, 1.17)1.40 (1.16, 1.65) x1.21 (1.02, 1.41) +
Fatal and Serious Injuries1.04 (1.03, 1.06) *1.00 (0.94, 1.06)1.02 (0.99, 1.04)1.05 (1.02, 1.08) x1.14 (1.07, 1.21) *1.11 (1.05, 1.17) *
All injuries (including Fatal)0.95 (0.94, 0.96) *0.94 (0.89, 0.99) +0.96 (0.94, 0.97) *0.97 (0.95, 1.00) +1.01 (0.95, 1.07)1.03 (0.98, 1.09)
Hit 1st/2nd of tree/bush1.33 (1.29, 1.36) *1.23 (1.05, 1.42) +1.23 (1.19, 1.27) *1.42 (1.35, 1.49) *1.55 (1.38, 1.73) *1.31 (1.19, 1.45) *
2 Models with co-variates (without speed limit)
Fatal injuries1.00 (0.93, 1.07)0.85 (0.57, 1.17)0.96 (0.86, 1.07)0.94 (0.81, 1.08)1.25 (1.01, 1.53) +1.04 (0.86, 1.24)
Fatal and Serious Injuries1.03 (1.01, 1.04) *0.99 (0.93, 1.05)1.02 (0.99, 1.04)1.02 (0.99, 1.05)1.08 (1.01, 1.15) +1.04 (0.98, 1.10)
All injuries (including Fatal)1.00 (0.98, 1.01)0.97 (0.92, 1.03)0.99 (0.98, 1.01)1.01 (0.98, 1.03)1.05 (0.99, 1.12)1.04 (0.99, 1.10)
Hit 1st/2nd of tree/bush1.20 (1.17, 1.24) *1.14 (0.96, 1.34)1.19 (1.14, 1.23) *1.23 (1.17, 1.30) *1.24 (1.09, 1.41) x1.13 (0.99, 1.28)
3. Five-category Street tree percentage variable (ref = 0–4.9%)
Fatal injuries
5–9.90.86 (0.60, 1.20)0.91 (0.20, 3.03)0.59 (0.31, 1.05)1.00 (0.59, 1.61)0.40 (0.06, 1.58)1.84 (0.58, 5.22)
10–19.90.94 (0.67, 1.26)0.51 (0.07, 2.12)0.80 (0.47, 1.31)0.85 (0.49, 1.45)1.64 (0.66, 3.58)1.31 (0.40, 3.61)
20–34.90.78 (0.52, 1.16)0.27 (0.01, 1.92)0.77 (0.41, 1.37)0.62 (0.27, 1.27)1.64 (0.48, 4.78)0.51 (0.08, 2.18)
35+1.20 (0.81, 1.74)0.32 (0.01, 2.34)0.95 (0.52, 1.63)0.93 (0.38, 2.02)3.41 (0.92, 10.20)1.95 (0.67, 5.26)
Fatal and Serious Injuries
5–9.91.02 (0.96, 1.09)0.87 (0.64, 1.17)0.95 (0.86, 1.06)1.10 (0.99, 1.23)0.95 (0.77, 1.17)1.09 (0.79, 1.48)
10–19.91.12 (1.05, 1.19) *0.96 (0.71, 1.30)1.08 (0.98, 1.19)1.14 (1.02, 1.27) +1.13 (0.92, 1.37)1.17 (0.89, 1.52)
20–34.91.00 (0.92, 1.08)0.91 (0.66, 1.28)0.89 (0.79, 1.00)1.08 (0.94, 1.23)1.24 (0.92, 1.65)0.95 (0.69, 1.29)
35+1.17 (1.07, 1.28) *0.99 (0.69, 1.39)1.17 (1.04, 1.32) x1.01 (0.84, 1.23)1.40 (0.92, 2.09)1.36 (0.96, 1.90)
All injuries (including Fatal)
5–9.91.00 (0.94, 1.06)1.02 (0.77, 1.36)0.95 (0.87, 1.04)1.03 (0.94, 1.14)1.09 (0.91, 1.30)1.06 (0.82, 1.36)
10–19.90.99 (0.94, 1.05)0.98 (0.74, 1.30)0.95 (0.87, 1.03)1.14 (1.03, 1.26) x0.93 (0.78, 1.10)0.91 (0.74, 1.14)
20–34.90.94 (0.88, 1.01)0.95 (0.71, 1.31)0.88 (0.80, 0.97) x0.96 (0.85, 1.08)1.08 (0.83, 1.41)1.23 (0.94, 1.64)
35+1.00 (0.92, 1.08)0.78 (0.56, 1.09)1.02 (0.92, 1.14)0.95 (0.81, 1.13)1.37 (0.92, 2.07)1.18 (0.86, 1.63)
Hit 1st or hit 2nd of tree/bush during the crash
5–9.91.32 (1.09, 1.59) x0.55 (0.09, 2.33)0.96 (0.73, 1.25)1.81 (1.55, 2.38) *2.02 (1.10, 3.59) +1.34 (0.51, 3.09)
10–19.91.78 (1.52, 2.08) *1.40 (0.43, 3.91)1.43 (1.14, 1.78) x2.30 (1.97, 2.77) *1.55 (0.82, 2.75)2.45 (1.28, 4.54) x
20–34.91.93 (1.61, 2.31) *2.11 (0.72, 5.58)1.49 (1.16, 1.90) x2.15 (1.57, 2.75) *1.78 (0.87, 3.45)2.46 (1.18, 4.92) +
35+2.88 (2.43, 3.44) *2.28 (0.76, 6.13)2.53 (2.05, 3.13) *3.41 (2.50, 4.76) *2.04 (0.83, 4.61)2.07 (0.94, 4.41)
Models are logistic regressions for injuries or hits of trees and objects. Percentage of trees variable is continuous; only Street tree percentage is presented. The results for covariates are omitted. * p ≤ 0.001, x p ≤ 0.01, + p ≤ 0.05. MCMC using MLwiN with 3000–20,000 burn-in and sample iterations.
Table 4. Raw frequencies of injuries/hits by Street tree percentage per subsets with different speed limits.
Injuries
SubsetsFatal Fatal/SeriousInjuries allHitting tree/bush
Street tree percentage %N totalN%N%N%N%
Full set
Total57,4773910.711,19619.540,26370.113202.3
0–4.935,7762390.7675718.925,40471.05331.5
5–9.96677400.6129219.4466469.91502.3
10–19.97285500.7153121.0504169.22313.2
20–34.94482280.687419.5299766.91794.0
35 plus3257341.074222.8215766.22277.0
Chi-square (p-value) 7.3 41.7≤0.00162.7≤0.001503.2≤0.001
10–40 km/h
Total2963230.861520.8227276.7341.1
0–4.91839160.938721.0142977.7150.8
5–9.933530.96318.825977.320.6
10–19.931520.66621.023975.951.6
20–34.925910.45220.119474.962.3
35 plus21510.54721.915170.262.8
Chi-square (p-value) 1.1 1.1 6.7 11.5≤0.05
50 km/h
Total21,4401350.6428720.014,24366.47113.3
0–4.910,948760.7217519.9743367.92752.5
5–9.92920120.455419.0193866.4712.4
10–19.93360190.670821.1220565.61233.7
20–34.92243130.640618.1141162.9924.1
35 plus1969150.844422.6125663.81507.6
Chi-square (p-value) 3.8 17.5≤0.0130.1≤0.001148.4≤0.001
60 km/h
Total21,8201480.7427219.615,78472.33871.8
0–4.914,920990.7281718.910,81872.51581.1
5–9.92408180.849720.6174172.3532.2
10–19.92413160.751621.4178674.0702.9
20–34.9137080.629021.295569.7564.1
35 plus70971.015221.448468.3507.1
Chi-square (p-value) 1.4 15.1≤0.0114.2≤0.01219.4≤0.001
70 km/h
Total7364460.6130017.7529972.01051.4
0–4.95471280.592817.0394872.2510.9
5–9.969920.311716.751173.1172.4
10–19.975381.115019.952069.1172.3
20–34.930441.36922.721671.1124.0
35 plus13742.93626.310475.985.8
Chi-square (p-value) 18.7≤0.00117.2≤0.014.9 51≤0.001
80–110 km/h
Total3890391.072218.6266568.5832.1
0–4.92598200.845017.3177668.4341.3
5–9.931551.66119.421568.372.2
10–19.944451.19120.529165.5163.6
20–34.930620.75718.622172.2134.3
35 plus22773.16327.816271.4135.7
Chi-square (p-value) 12.9≤0.0516.6≤0.014.7 33.7≤0.001
Disclaimer/Publisher’s Note: The statements, opinions and data contained in all publications are solely those of the individual author(s) and contributor(s) and not of MDPI and/or the editor(s). MDPI and/or the editor(s) disclaim responsibility for any injury to people or property resulting from any ideas, methods, instructions or products referred to in the content.

