Article

Interplay between Network Position and Knowledge Production of Cities in China Based on Patent Measurement

1
Research Center for China Administrative Division, East China Normal University, Shanghai 200241, China
2
Future City Lab, East China Normal University, Shanghai 200241, China
3
Hainan Institute of East China Normal University, Sanya 572025, China
4
School of Geographic Sciences, East China Normal University, Shanghai 200241, China
5
Northeast Institute of Geography and Agroecology, Chinese Academy of Sciences, Changchun 130102, China
6
College of Resources and Environment, University of Chinese Academy of Sciences, Beijing 100049, China
*
Author to whom correspondence should be addressed.
Land 2024, 13(10), 1713; https://doi.org/10.3390/land13101713
Submission received: 18 September 2024 / Revised: 14 October 2024 / Accepted: 17 October 2024 / Published: 19 October 2024

Abstract

:
The urban knowledge network in China has undergone in-depth development in recent decades, intimately connecting the position characteristics of cities in the knowledge network to their knowledge production performance. While existing research focuses predominantly on the unidirectional relationship between network position and the knowledge production of cities, there is a notable dearth of studies exploring the bidirectional relationship between the two constructs. By proposing a conceptual framework, this paper empirically examines the interplay between network position and knowledge production of cities through simultaneous equation models. The results revealed a mutually reinforcing relationship between network position and knowledge production, and this relationship exhibits heterogeneous characteristics and spillover effects. Specifically, cities in the periphery block and the central-western region benefit more from the effect of network position on knowledge production, while cities in the core block and the eastern region benefit more from the effect of knowledge production on network position. Moreover, the interactive effect between network position and knowledge production of cities is significantly affected by the network position characteristics and knowledge production performance of their neighboring cities in geographically adjacent regions and relationally adjacent regions. These findings enhance the understanding of urban network externalities and the connotations of the knowledge production function.

1. Introduction

With the rapid development of ICT/transportation technologies, the temporal and geographical distance between cities has been greatly compressed [1,2,3], the term ‘space of flows’ has become a new concept for characterizing spatial relations [4], and an urban network, which is constituted of multiple flows (e.g., capital flows, information flows, knowledge flows, etc.), is being formed and developed [5,6,7,8,9,10,11]. Among them, knowledge flows are increasing in terms of marginal efficiency, making knowledge a key source of urban economic growth and development [12,13,14,15,16]. Therefore, the study of urban networks based on the perspective of intercity knowledge flows is becoming increasingly important, especially for China, which is undergoing a period of economic transformation, that is, from an industrial economy to a knowledge economy [17,18].
As the crucial territorial units of the national innovation system, cities provide a geographic platform for local knowledge activities by means of the concentration of higher technical enterprises, universities, and research institutions [19,20,21,22]. On the one hand, with the in-depth development of urban knowledge networks, cities can participate in nonlocal knowledge activities by serving as topological nodes in the urban knowledge network [23], wherein cities can benefit from accessing, sharing, and combining complementary and heterogeneous knowledge from outside the local area by embedding into the urban knowledge network [24]. That is, intangible inputs, e.g., network capital, are emerging as a key factor alongside tangible inputs in influencing the innovation performance of cities. On the other hand, the increase in knowledge output could possibly improve the capability to acquire and control knowledge capital in the knowledge network, trigger an increase in demand for network linkages and thus contribute to the establishment and strengthening of network linkages [25]. Therefore, the position characteristics of cities in the knowledge network and their knowledge production performance have been closely intertwined, and discussion of the interactive process between the network position and knowledge production of cities has important theoretical and practical significance.
This study blends two strands of empirical literature that have, thus far, moved in parallel. The first strand of literature relates to the impact of knowledge network properties on regional innovation growth [19,26,27,28,29,30,31,32,33,34]. Among these studies, Guan et al. conducted an econometric analysis to investigate the effects of innovation collaboration networks on innovation performance at the city and country levels [30]. They found that a city’s network characteristics play an important role in the process of innovation production, and the positive effects of a city’s centrality and structural holes on innovation performance are enhanced when a country’s centrality is high. Similarly, Breschi and Lenzi explored the impact of co-invention network structure on inventive productivity in US cities and concluded that the network structure does influence the cities’ inventive performance, noting that external linkages are important for sustaining higher rates of inventive productivity [26]. Furthermore, Hazır et al. and Innocenti et al. emphasized that knowledge networks can effectively affect innovative capacity by fostering interregional knowledge flows at a local level [33,34]. In other studies, based on co-publication data, Gui et al. and Cao et al. verified the important contribution of knowledge networks to regional innovation growth [19,31].
The second strand of literature relates to the influence of knowledge intensity on network linkages [35,36,37,38,39,40,41,42,43]. Among these studies, Cassi et al. investigated the determinants of international scientific collaboration networks in the wine industry and found that a country’s international scientific collaboration is positively influenced by its scientific sizes [35]. Similarly, Hoekman et al. demonstrated that regional science systems of international scientific quality tend to attract relatively more research partners from outside the region [38]. In the same vein, another study carried out by Gui et al. concluded that the scientific sizes of countries are positive determinants of international co-publication and noted that global scientific collaboration networks exhibit a ‘Matthew effect’ or ‘the rich get richer’ phenomenon [36], and thus is in line with the research conclusions of Paier and Scherngell that the choice of collaboration is more likely between organizations that are central players in the network [40].
Based on the above literature, it is observed that the existing studies mainly focus on investigating the unidirectional relationship between network position and knowledge production; however, there is a notable dearth of studies that seek to identify a bidirectional relationship between network position and knowledge production of cities, and no studies have attempted to explore the heterogeneous characteristics and spillover effects of the interactive process. In view of this, by proposing a conceptual framework, this study conducts series empirical tests for analyzing the interplay between network position and knowledge production of cities. It is hoped that this study will contribute to a deeper understanding of urban network externalities and will provide a useful reference for the formulation of urban innovation policies in China.
The remainder of this study is organized as follows. Section 2 introduces the methodology and data, Section 3 provides and discusses the results, and Section 4 summarizes the conclusions.

2. Materials and Methods

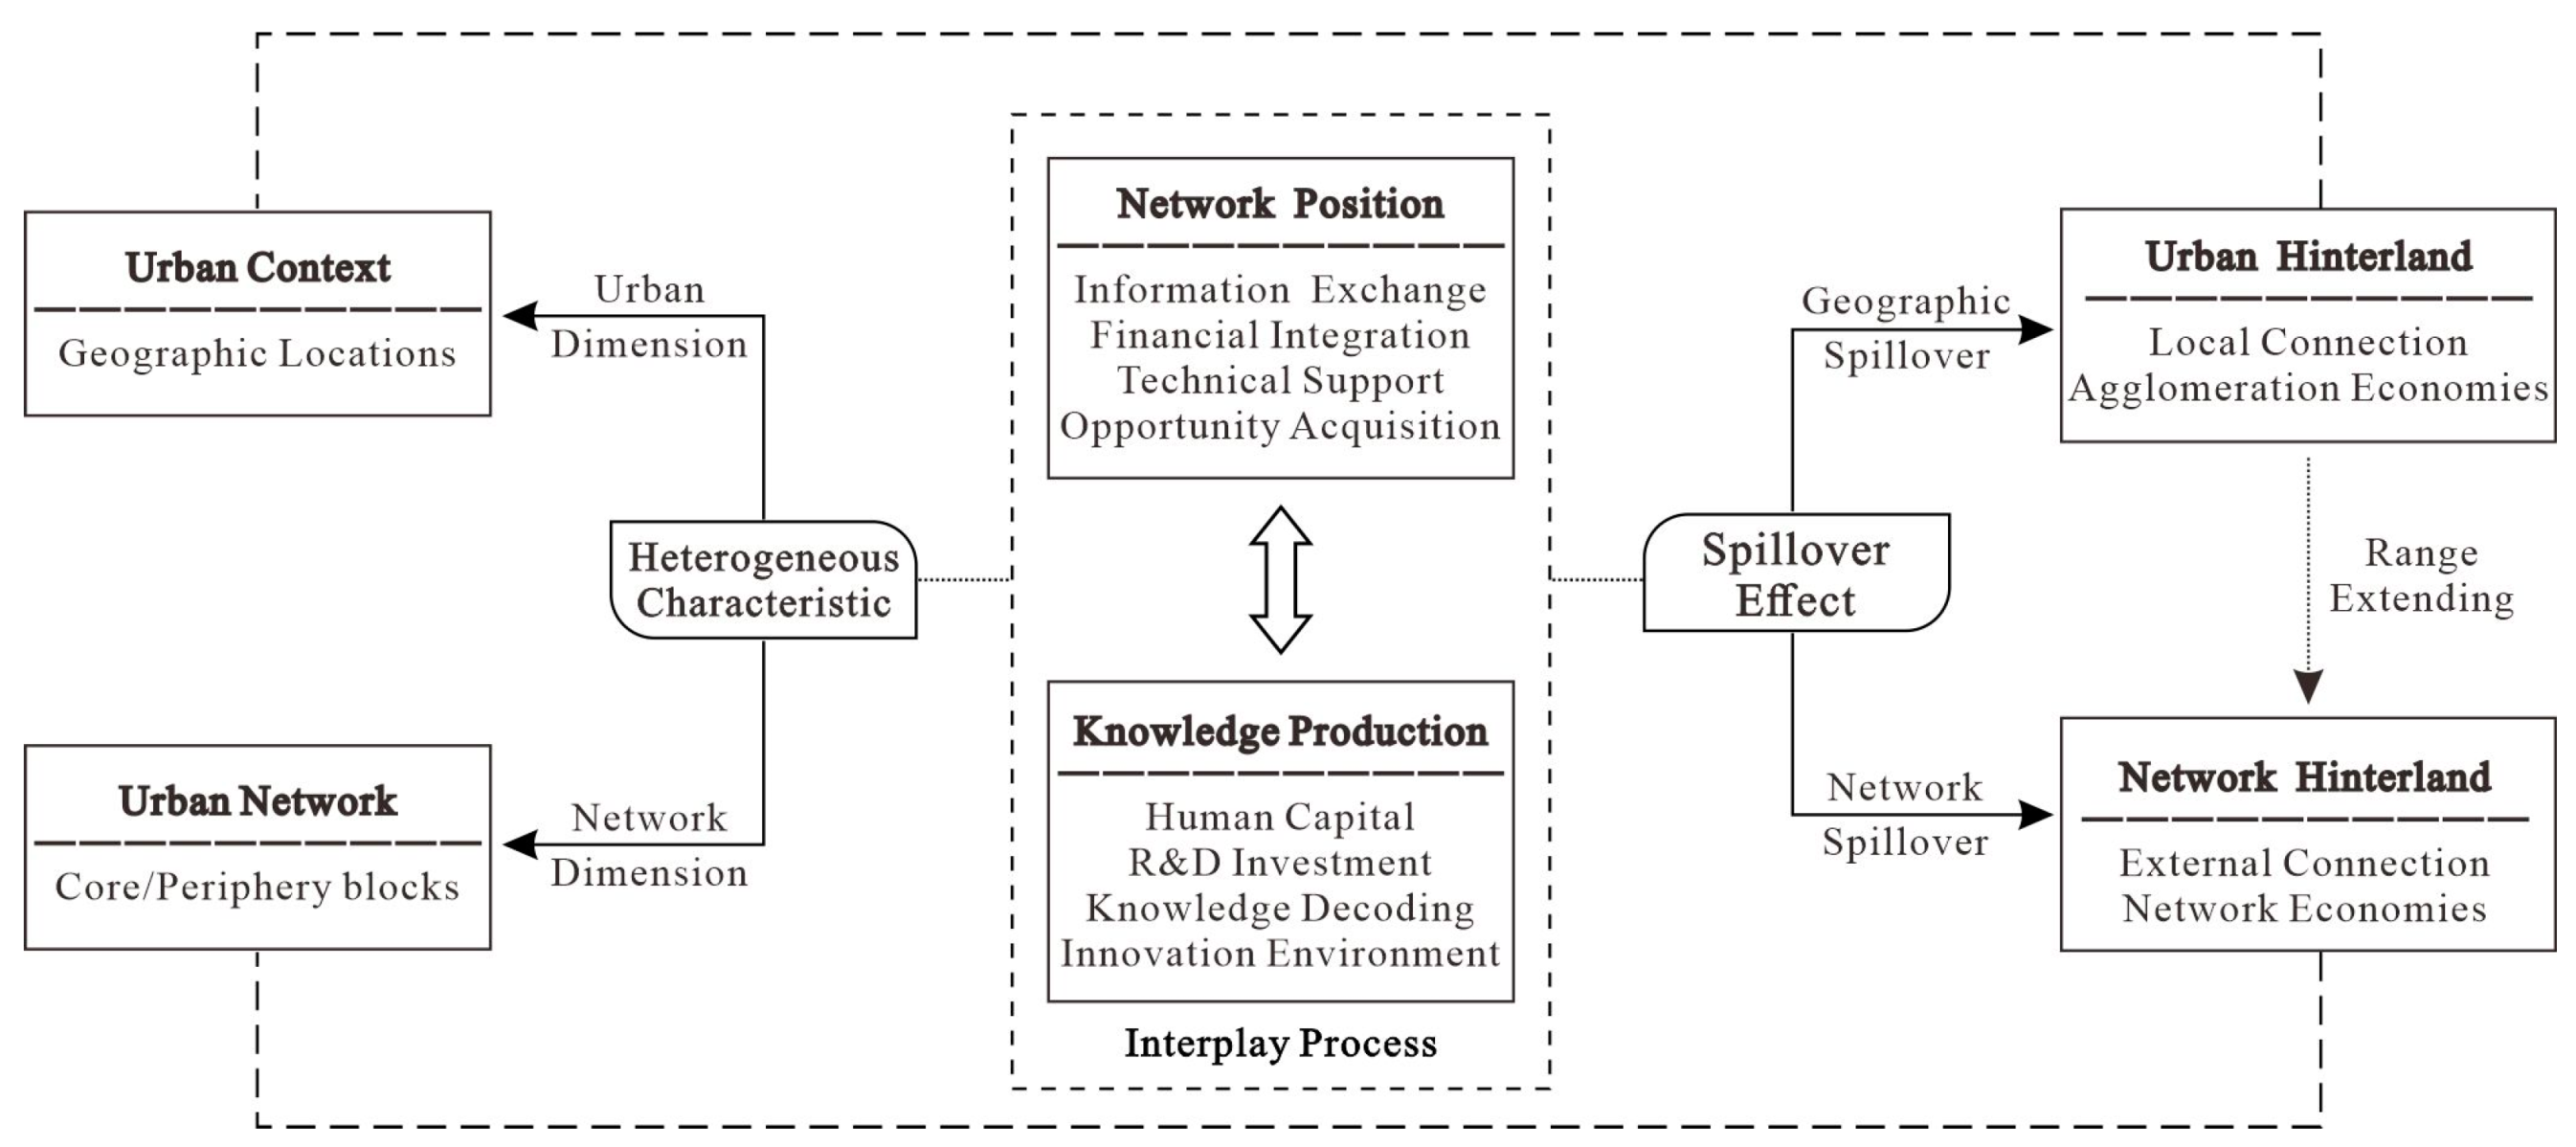
2.1. Conceptual Framework

This study proposes a conceptual framework by integrating existing research for understanding the interplay between network position and knowledge production of cities, as shown in Figure 1.
Network position portrays the degree of cities’ entrenchment in the knowledge network, and thus it is closely related to factors such as information exchange, financial integration, technical support, and opportunity acquisition [24,29,44,45]. Cities located at a strategic and influential position in the network can directly come into contact with new information, new technology, and new knowledge and can form a knowledge pool through network linkages, as this is more conducive to improving the capability to access, learn, and absorb external heterogeneous knowledge through collaborative effects and complementary effects [19,23,46]. Therefore, cities with a higher position in the network tend to have better basic conditions for knowledge production.
Knowledge production represents the performance or productivity of cities regarding knowledge, and is closely related to factors such as human capital, R&D investment, knowledge decoding, and innovation environment [31,37,43,47]. To obtain highly valuable and relatively fresh knowledge, cities are continuously exchanging knowledge with the outside world by promoting innovation in subjects to develop multifaceted reciprocal cooperation (e.g., knowledge sharing, resource complementation, and capability reinforcement) by virtue of urban networks, leading cities’ comparative advantage in knowledge production to transform into an advantage in network position through hyperlocal knowledge flows [48,49,50]. Therefore, cities with a higher capability for knowledge production tend to occupy a central and strategic position in the network. Thus, the interplay between network position and knowledge production is constituted.
In addition, the interplay between network position and knowledge production may have heterogeneous characteristics [28,47,51,52] and spillover effects [33,53,54,55]. On the one hand, China contains various types of cities due to its vast territory, and cities differ considerably across different network blocks and geographic locations. Therefore, the capacity of cities to absorb, transform and utilize knowledge resources varies significantly, thus leading to the heterogeneous characteristics of the interplay between network position and knowledge production. On the other hand, in the ‘space of flows’, knowledge activities are no longer only dependent on agglomeration economies (based on local connection) but are increasingly influenced by network economies (based on external connection). Therefore, the spillover effects of the interplay between network position and knowledge production extend gradually from ‘geographic spillover’ within the urban hinterland to ‘network spillover’ within the network hinterland.

2.2. Measuring the Network Position of Cities

The urban knowledge network is constructed based on patent transfer data in China (Figure 2) (The map used in this study was obtained from Standard Map Service (http://bzdt.ch.mnr.gov.cn/, accessed on 30 January 2023) approved by the Ministry of National Resources of the People’s Republic of China [Map Number: GS(2020)4619]). The specific construction method of the urban knowledge network is as follows. If city i transfers n pieces of patent data to city j, it is considered that city i sends n linkages to city j. Based on the date of registration, a directed multivalued matrix panel of 296 cities × 296 cities and four time sections in 2005, 2010, 2015 and 2020 is obtained, of which the value represents the relational strength between cities in each respective time section. Patent transfer data were derived from the incoPat Global Patent Database (https://www.incopat.com/, accessed on 1 May 2023) and Patentics Patent Database (https://www.patentics.com/, accessed on 1 May 2023), with a total of 1,427,599 data points, including 610,333 intercity patent transferred data and 817,266 intracity patent transferred data.
On the basis of this observation, Degree Centrality (Degree) is used to measure the network position of cities [56,57]. Degree centrality is defined as the sum value of the transferred-in and transferred-out patent data of a city, mainly indicating the link strength of a city in the knowledge network; the higher the value of degree centrality, the higher the capability to acquire and control knowledge capital. Furthermore, we also include two additional indicators, Eigenvector Centrality and Coreness, for robustness checking.

2.3. Measuring the Knowledge Production of Cities

The knowledge production performance of cities is measured by the number of patent applications of cities. Patents are an important component of new technological knowledge production and are also an important output of R&D activities carried out by enterprises, universities, and scientific research institutions [58,59,60]. Moreover, the number of patent applications has a much shorter lag time than the number of patent authorizations and is less affected by human subjective factors of the licensing agency in government departments. Many scholars have conducted numerous empirical studies in knowledge production based on this measurement [26,33,34,39,45,52,61]. Therefore, this study selected the number of patent applications (Patent) to measure the knowledge production performance of cities, and the data were derived from the Baiten Database (https://www.baiten.cn/, accessed on 1 May 2023).

2.4. Estimation Methods

2.4.1. Econometric Models

Considering that the network position and knowledge production of cities are, to some extent, interdependent and that the interactive effect between the two constructs cannot be fully depicted by single equation models, this study selects simultaneous equation models to analyze the interplay between network position and knowledge production to alleviate the endogeneity problems caused by bidirectional causality or unobserved variables. To further address other potential issues such as autocorrelation and multicollinearity, the control variables were lagged by two periods to better capture their effect on the dependent variables. The models are set as follows:
ln K P i , t = α + α 1 ln N P i , t + α 2 ln Z i , t 2 + ε i , t
ln N P i , t = β + β 1 ln K P i , t + β 2 ln Q i , t 2 + μ i , t
where K P i , t is the knowledge production performance of city i in period t, N P i , t is the network position of city i in period t, Z i , t 2 is a set of control variables in the knowledge production equation, Q i , t 2 is a set of control variables in the network position equation, and ε i , t and μ i , t are the residuals.
In order to further investigate the spatial spillover effects of the interplay between network position and knowledge production, the spatial lag terms of network position ( w i j ln N P ) and knowledge production ( w i j ln K P ) are introduced into the simultaneous equation models in this section. The models are set as follows:
ln K P i , t = α + α 1 ln N P i , t + α 2 w i j ln N P i , t + α 3 w i j ln K P i , t + α 4 ln Z i , t 2 + ε i , t
ln N P i , t = β + β 1 ln K P i , t + β 2 w i j ln N P i , t + β 3   w i j ln K P i , t + β 4 ln Q i , t 2 + μ i , t
where w i j is the spatial weight matrix, consisting of two types: geographic adjacency matrix and network adjacency matrix ( w i j = 1 if city i and city j are geographically adjacent or networked adjacent, and 0 otherwise). Among them, the geographic adjacency matrix is calculated using ArcGIS 10.8 software, and the network adjacency matrix is obtained by binarizing the knowledge network matrix.

2.4.2. Control Variables

In the knowledge production equation, Z i , t 2 = ( l i , t 2 , e d u i , t 2 , c i , t 2 , f d i i , t 2 ,   t r a n i , t 2 ) , where l i , t 2 represents the labor input for knowledge production of city i in period t − 2, and this is measured by the number of people engaged in science and technology activities. e d u i , t 2 represents the education level of city i in period t − 2, and is measured by the number of higher education institutions. c i , t 2 represents the capability to utilize the network capital of city i in period t − 2, and is measured by betweenness centrality. f d i i , t 2 represents the degree of economic openness of city i in period t − 2, and is measured by the amount of FDI per capita. t r a n i , t 2 represents the location accessibility of city i in period t − 2, measured by the amount of road passenger transportation.
In the network position equation, Q i , t 2 = ( f i n i , t 2 , M P i , t 2 , p m 2.5 i , t 2 , p g d p i , t 2 , i n f i , t 2 ) , where f i n i , t 2 represents the financial development scale of city i in period t − 2, and is measured by the amount of balance of deposits and loans per capita. M P i , t 2 represents the market potential of city i in period t − 2, and is calculated by referring to the market potential index constructed by Harris [62]. p m 2.5 i , t 2 represents the urban environmental quality of city i in period t − 2, and is measured by the annual average concentration of PM 2.5. p g d p i , t 2 represents the overall level of economic development of city i in period t − 2, and is measured by GDP per capita. i n f i , t 2 represents the informationization level of city i in period t − 2, and is measured by the number of internet broadband access users. Table 1 provides descriptive statistics of the variables used in this study.

3. Results and Discussion

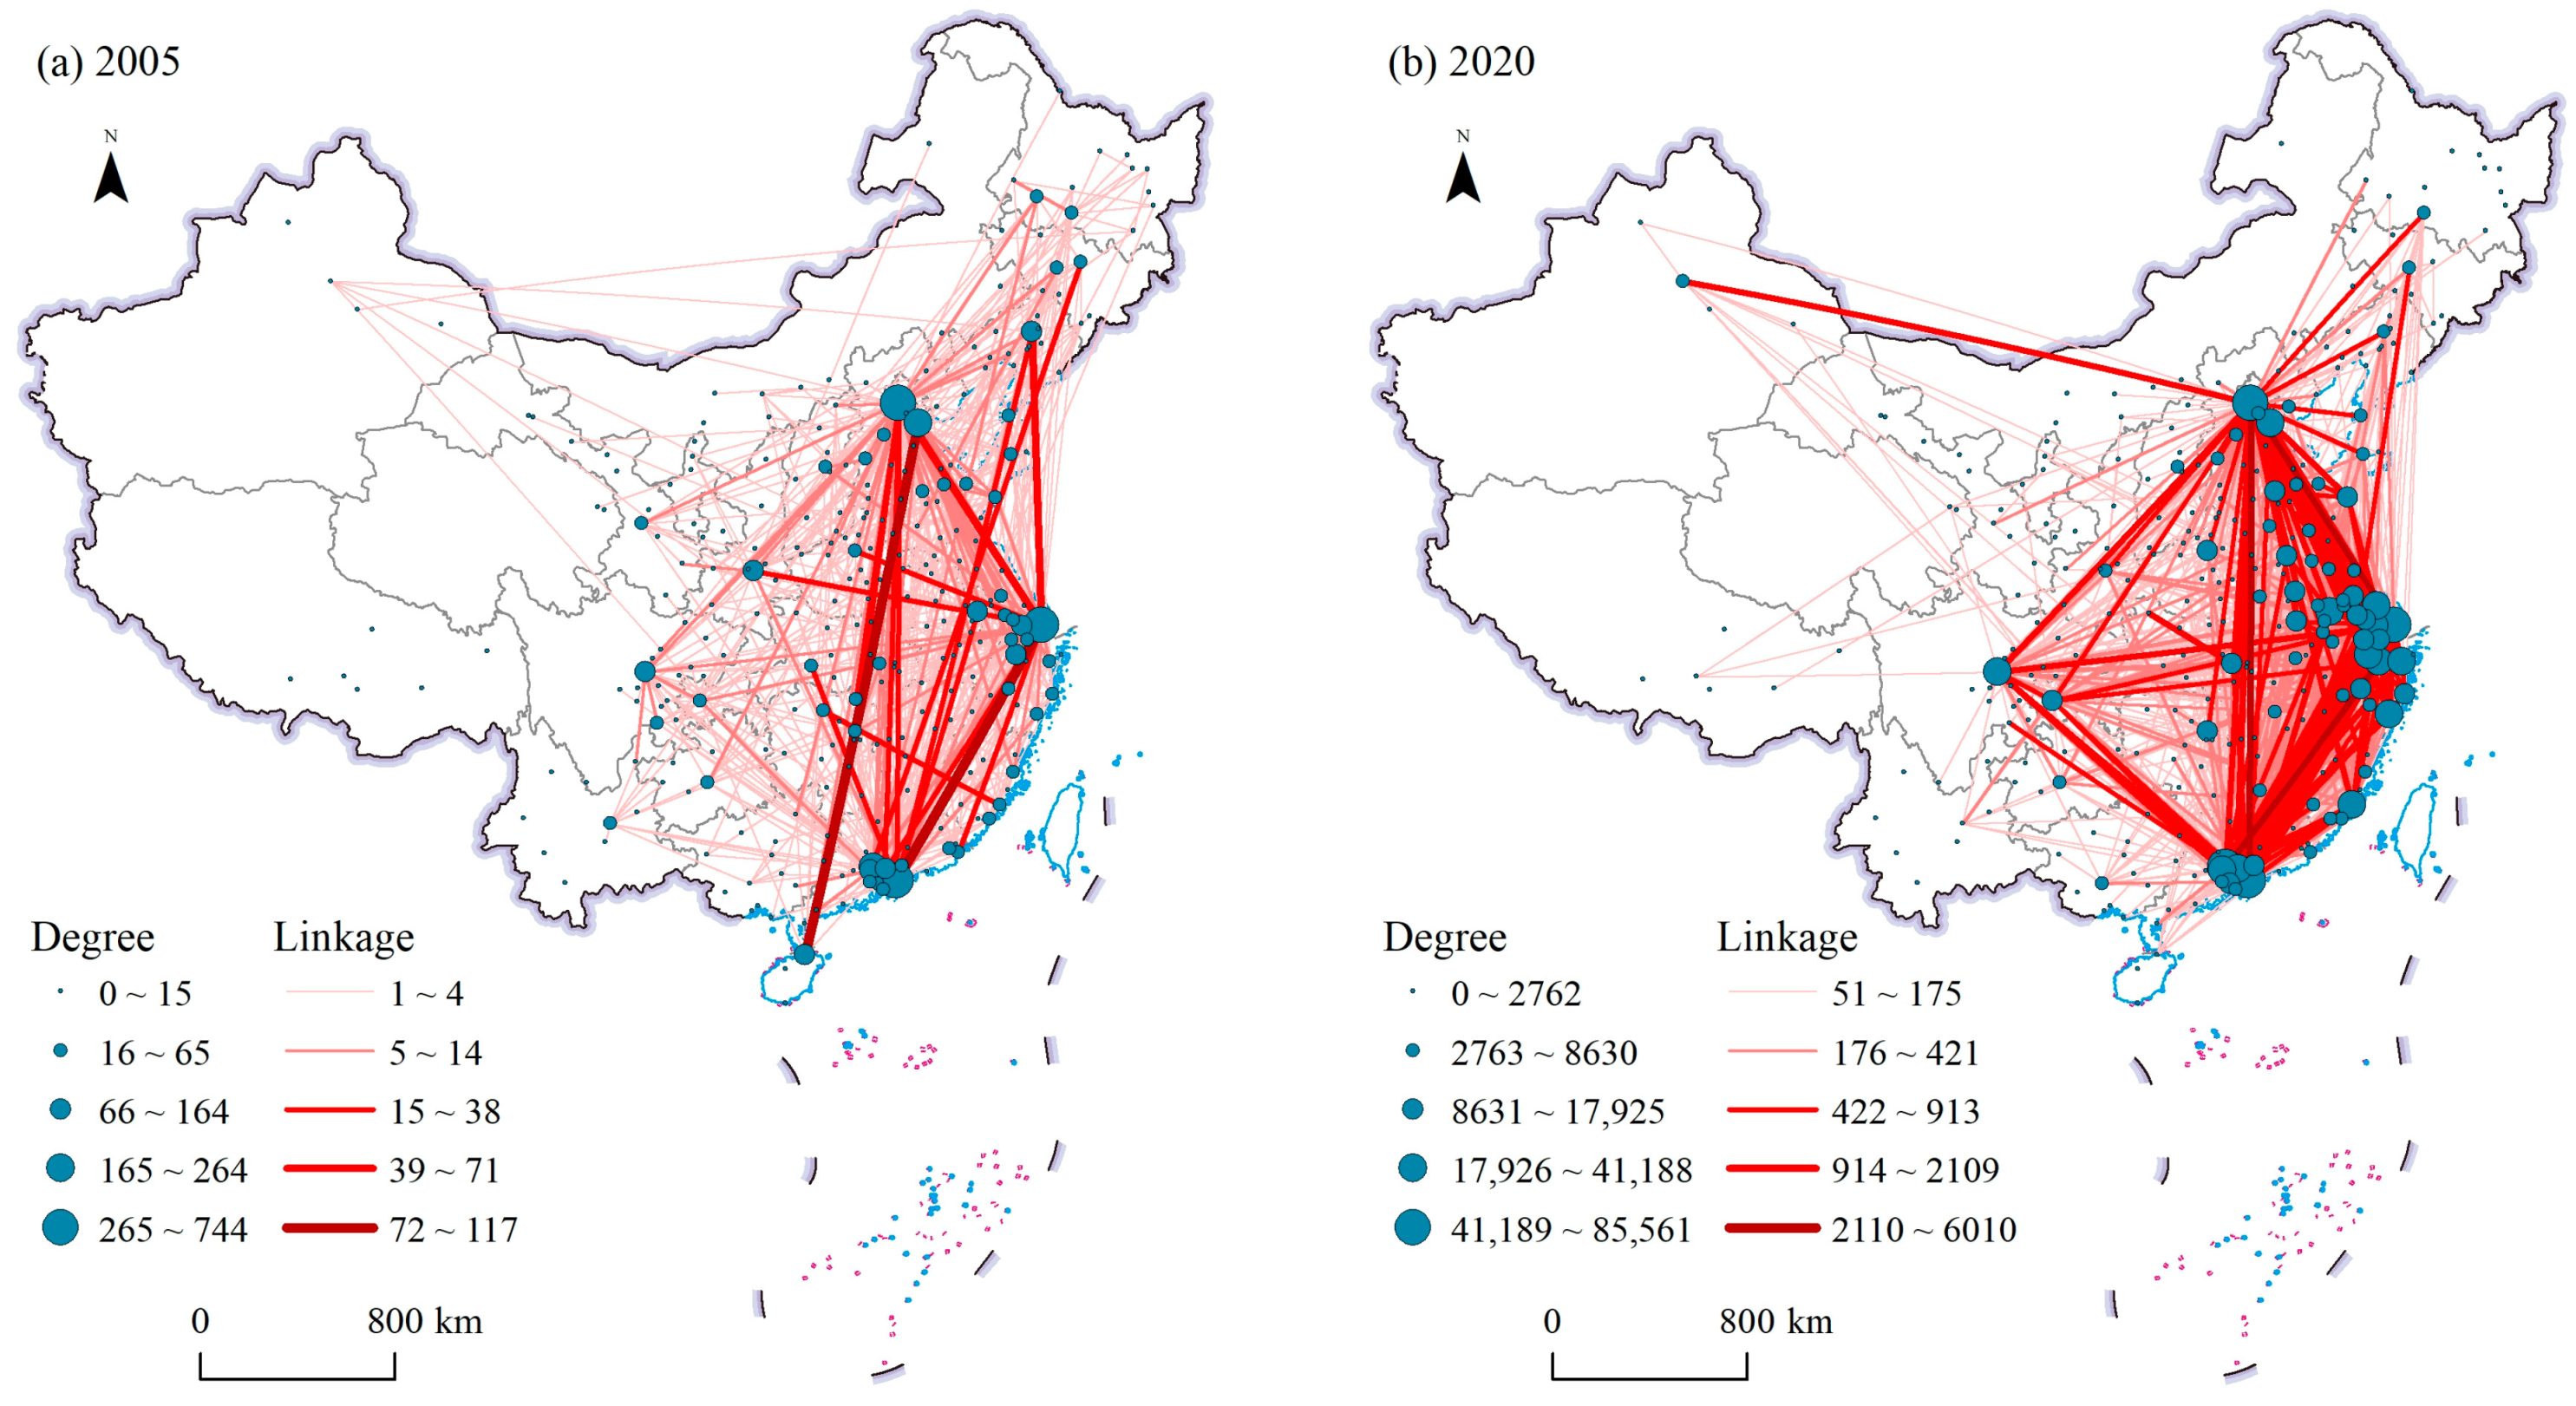
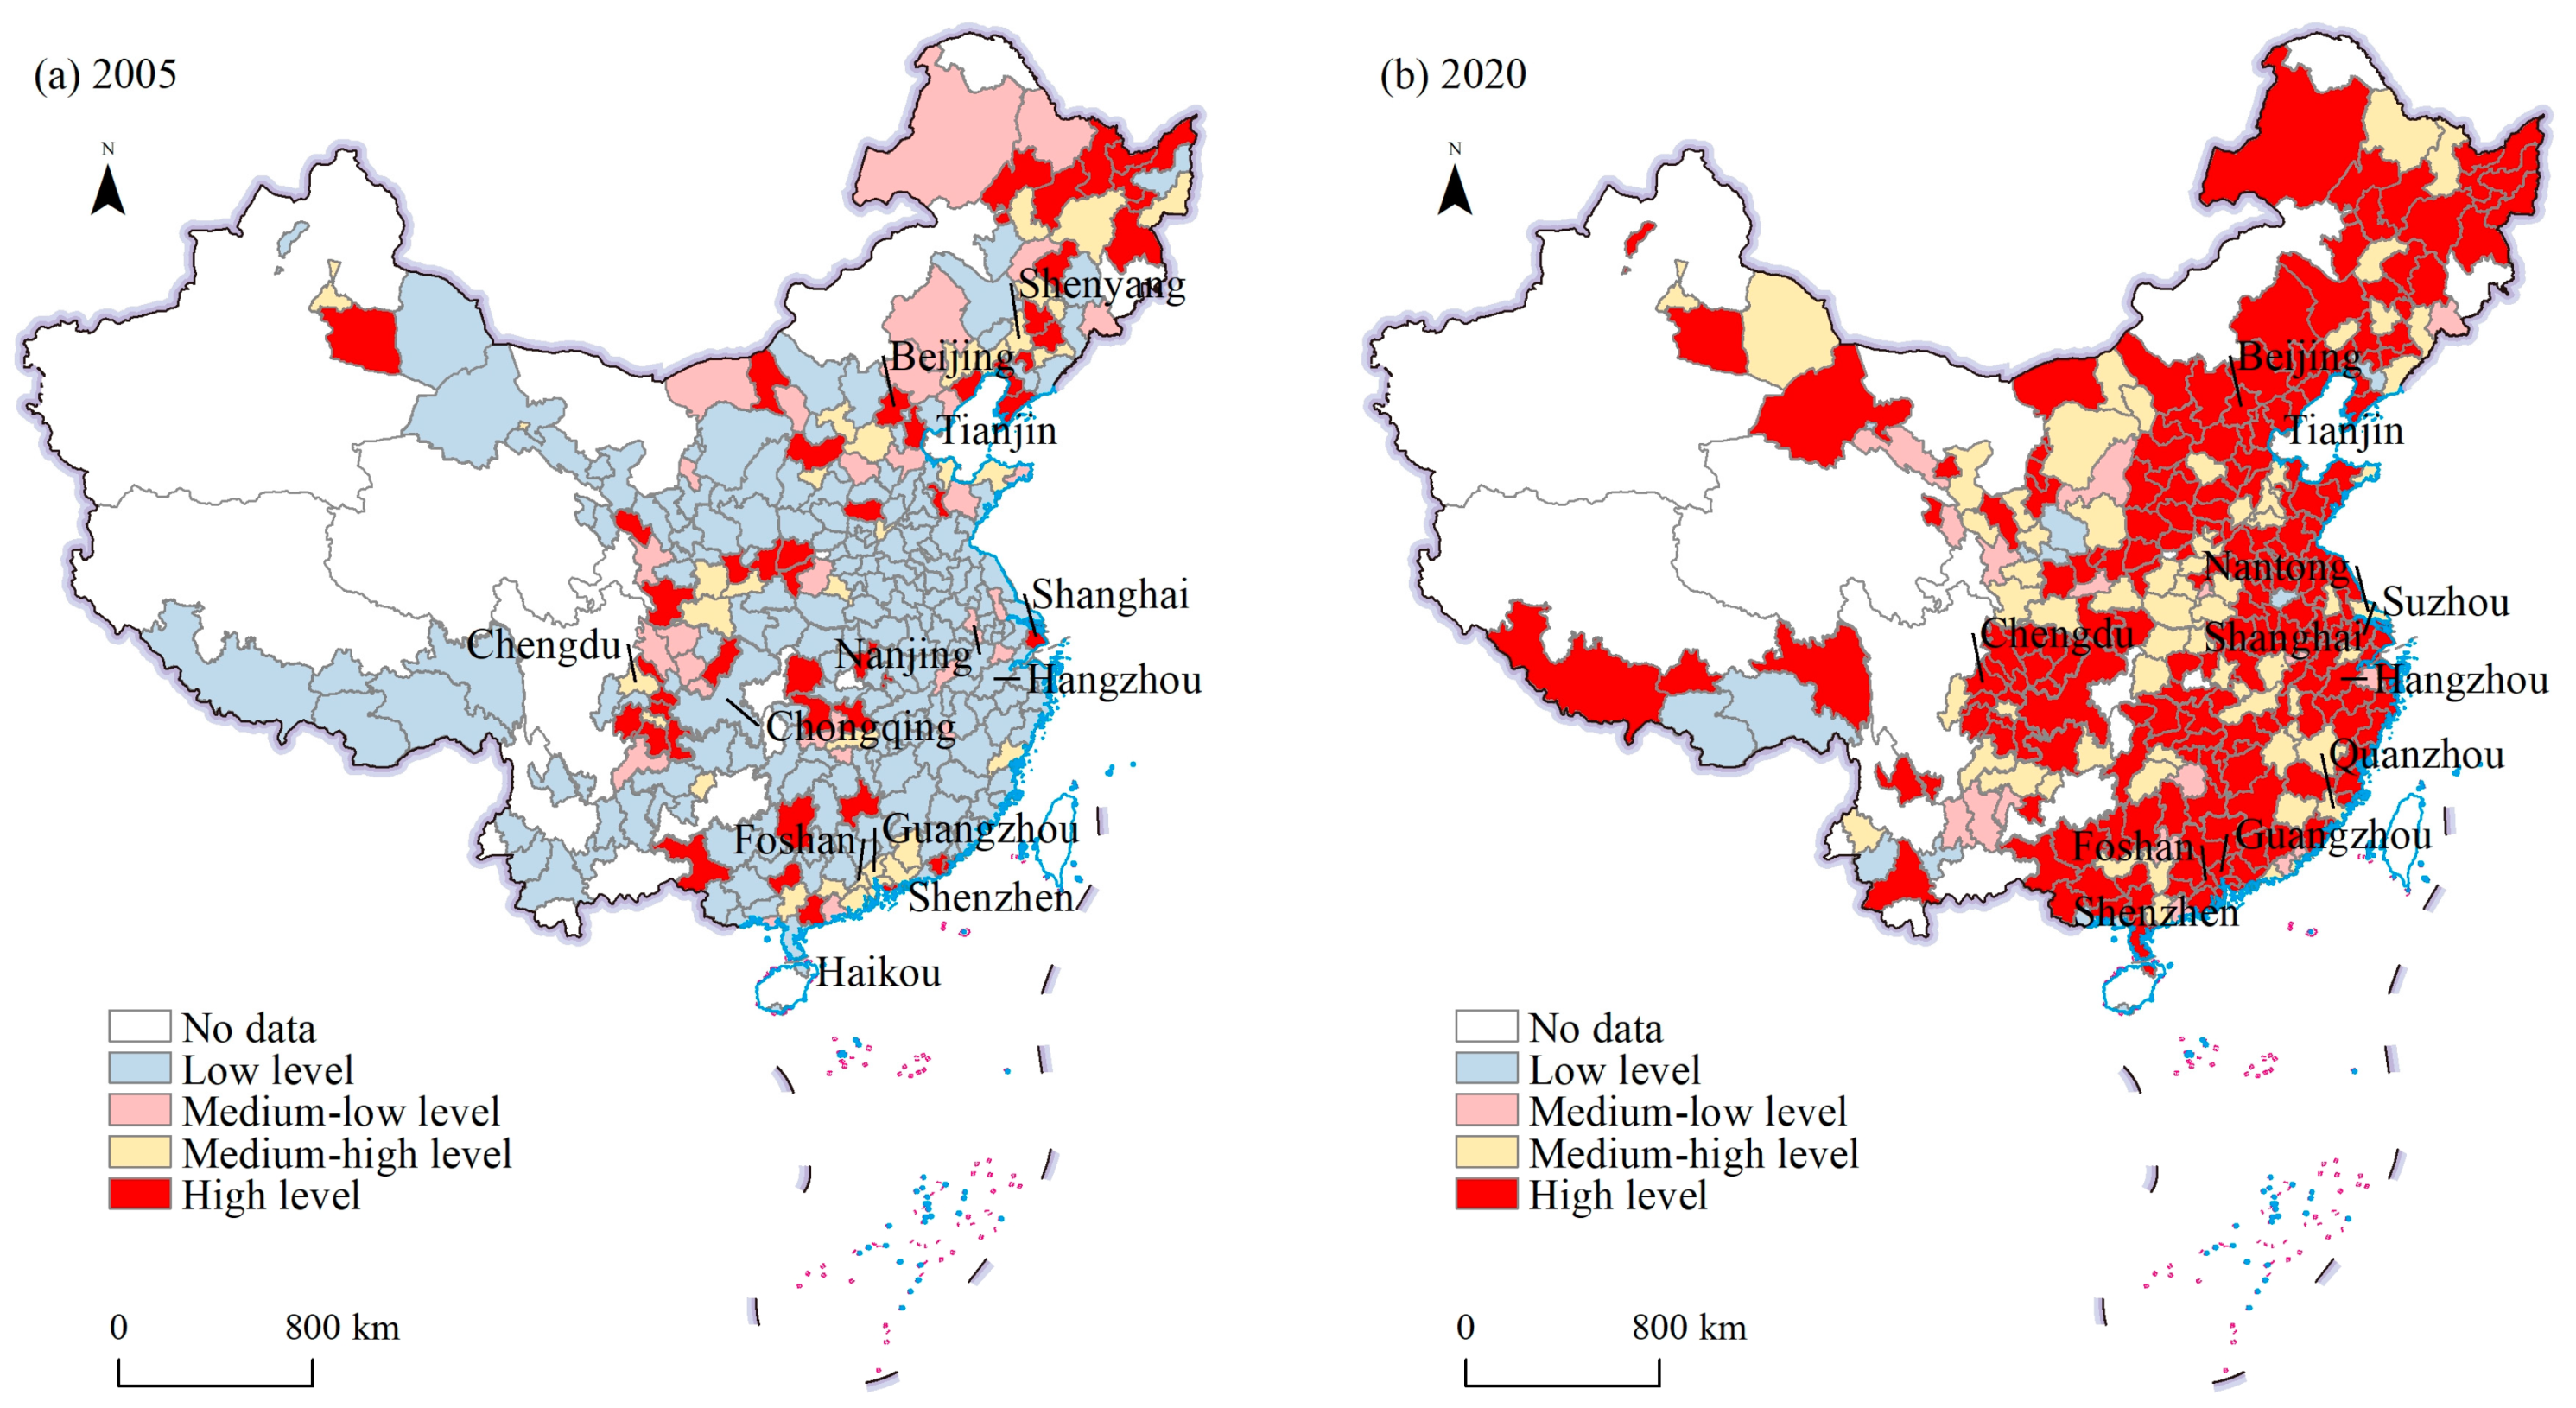
3.1. Stylized Facts of Network Position and Knowledge Production

This study identifies the following three stylized facts of the bidirectional relationship between network position and knowledge production.
First, this study introduces a coupling degree model. The calculation formula of the coupling degree model is set as follows: C = ( N P × K P ) N P + K P / 2 2 k , where NP and KP denote the network position and knowledge production of the city. k is the differentiation coefficient, and k = 4. C is the coupling degree, and the value of C is within the range [0, 1], and higher C values represent a higher coupling relationship between network position and knowledge production. According to the median segmentation method, this study divides the coupling development level into four stages with 0.3, 0.5 and 0.8 as the dividing points: low-level coupling stage, medium-low-level coupling stage, medium-high-level coupling stage and high-level coupling stage. This model reveals the spatial–temporal coupling characteristics between network position and knowledge production, and the obtained results are shown in Figure 3. It can be seen from the figure that the distribution of the network position of cities is coupled in space with the distribution of their knowledge production, and the coupling relationship between network position and knowledge production significantly strengthened from 2005 to 2020. Specifically, in 2005, only 49 cities were in the high-level coupling stage with a relatively scattered distribution, and the majority of Chinese cities were in the low-level coupling stage. By 2020, the number of cities in the high-level coupling stage increased to 200, cities with a high coupling degree were gradually connected from points to areas, and the vast majority of Chinese cities entered the high-level coupling stage. These observations suggest the existence of a bidirectional relationship between network position and knowledge production, providing encouraging preliminary support for the study of the interplay between the network position and knowledge production of cities.
Second, this study lists the top 10 cities in the ranking of network position and knowledge production from 2005 to 2020 to clearly see the statistical distribution of network position and knowledge production (Table 2). Unsurprisingly, the network position and knowledge production statistics show an overall upward trend from 2005 to 2020, and cities with higher values of network position have higher values of knowledge production. However, it is also worth noting that the top five positions on the list are mainly occupied by the core cities of the three major urban agglomerations (Beijing–Tianjin–Hebei, Yangtze River Delta, and Pearl River Delta, with Beijing, Shanghai, Guangzhou and Shenzhen are their core cities, respectively; the geographical locations of these cities are labeled in Figure 3) in the eastern coastal region, with Beijing, Shanghai, Guangzhou, and Shenzhen always ranked in the top five in terms of value of Degree and Patent. In addition, the sum values of Degree and Patent of the top 10 cities accounted for 39.55% and 38.39% of the total (nationwide) in 2020, respectively, thus indicating that the knowledge connections and innovation activities in China are mainly concentrated in a few key cities, while most other cities, including provincial capitals such as Urumqi, Lanzhou, and Taiyuan, are placed in a relatively marginal position in the knowledge network. These findings implicate a strong ‘core–periphery’ structure of knowledge distribution in China and potential heterogeneous characteristics of the interplay between network position and knowledge production of cities.
Third, this study calculates Moran’s I index for network position and knowledge production to evaluate the spatial autocorrelation of network position and knowledge production of cities based on two types of spatial weight matrixes (i.e., geographic adjacency matrix and network adjacency matrix), and the results are presented in Table 3. The Moran’s I indexes for both network position and knowledge production are all positive and pass the 1% significance level test from 2005 to 2020 in both types of spatial weight matrixes. This indicates that there is notable spatial correlation in the network position (as well as knowledge production) among cities in both the geographical dimension and the network dimension, that is, cities with a high (low) network position or knowledge production are distributed near cities with a high (low) network position or knowledge production. From the variation trend, the Moran’s I value of network position and knowledge production are highly consistent and demonstrate a significant upward trend, suggesting that the spatial correlation in both network position and knowledge production have annually been on a rising trend and have been influenced by a preferential attachment mechanism. These results demonstrate the spatial spillover effects of the interplay between network position and knowledge production of cities.

3.2. Benchmark Regression Analysis

This study conducts an empirical analysis based on a panel dataset of 243 prefecture-level and above cities in China from 2005 to 2020 (due to limitations of city-attribute data availability, the size of the city sample for empirical analysis was reduced to 243). The estimation model constructed in this study satisfies the overidentified criteria and thus can be used for parameter estimation and significance testing. Table 4 reports the benchmark regression results of the interplay between network position and knowledge production, and the goodness-of-fit statistics show that, as a rule, the model fit very well.
As shown in Models (1) and (2), the coefficients of the ln N P and ln K P variables are significantly positive at the 1% level, indicating that promotion in cities’ network position significantly enhances cities’ knowledge production [28,34,50,63], and enhancement of cities’ knowledge production significantly promotes cities’ network position [35,39,41,42]. This demonstrates that a mutually reinforcing relationship is supported between the position characteristics of cities in the knowledge network and their knowledge production performance. Furthermore, the coefficient of the ln N P variable is significantly greater than the coefficient of the ln K P variable, implying that the impact of the urban knowledge network on knowledge production plays a larger role at the current stage than the impact of knowledge production on the urban knowledge network.
Specific descriptions of the selected control variables are as follows. In the knowledge production equation, the coefficients of ln e d u , ln f d i , and ln t r a n variables are significantly positive at the 1% level, indicating that the educational environment [33], economic openness [64], and infrastructure development [65] are the key factors for enhancement of the knowledge production of cities. Meanwhile, the coefficient of the ln l variable is positive and statistically significant at the 1% level, confirming the promotion effect of labor force inputs on knowledge production in endogenous growth theory [16]. Furthermore, the ln c variable is a statistically significant predictor for the knowledge production of cities, showing that cities with abundant network capital may have higher knowledge production performance in the ‘space of flows’ [40].
In the network position equation, the coefficients of the ln f i n , ln M P , and ln p g d p variables are positive and statistically significant at the 1% level, proving that cities with a favorable financing environment [20] and considerable economic potential [19] are more likely to become core nodes in the knowledge network. Meanwhile, the coefficient of the ln i n f variable is significantly positive, indicating that the development of information and communication technologies may help the transfer and diffusion of knowledge capital among cities [43]. In particular, the coefficient of the ln p m 2.5 variable is significantly negative at the 1% level, implying that deterioration in the human living environment may hinder the spatial agglomeration of technology-intensive enterprises and high-quality researchers [66].

3.3. Robustness Tests

In order to ensure the robustness of the results, this study further conducts robustness tests using two different methods: replacement indicator and Winsorize variable, and the results are shown in Table 5. For the replacement indicator method, we choose to replace the indicator of NP: Degree Centrality with Eigenvector Centrality and Coreness; the results are shown Models (1), (2), (5) and (6). For the Winsorize variable method, we choose to Winsorize the NP and KP variables at 1% and 99% levels, respectively, and the results are shown in Models (3), (4), (7) and (8).
It can be seen that the coefficients of the ln N P variable and the coefficient of the ln K P variable are all positive and pass the significance test at the 1% level under several methods of robustness tests, confirming the robustness of the above results. Moreover, the coefficients of the ln N P variable are also significantly larger than the coefficients of the ln K P variable in the corresponding models, which further ensures the accuracy of the results.

3.4. Heterogeneity Analysis

Considering that there are many differences among cities in terms of economic development, geographical condition, and policy orientation, the interplay between the network position and knowledge production of cities may exhibit multidimensional heterogeneous characteristics. Therefore, we conduct the heterogeneity analysis from two aspects: network block (divided into core block and periphery block based on the core–periphery structure model developed by Borgatti et al. [67]) and geographic location (divided into an eastern region and a central–western region according to the different locations of cities. The eastern region includes Beijing, Tianjin, Hebei, Liaoning, Shandong, Jiangsu, Shanghai, Zhejiang, Fujian, Guangdong and Hainan. The central–western region includes Hunan, Hubei, Chongqing, Hainan, Sichuan, Shanxi, Guizhou, Yunnan, Jilin, Shaanxi, Henan, Gansu, Qinghai, Anhui, Tibet, Inner Mongolia, Jiangxi, Guangxi, Ningxia, Heilongjiang and Xinjiang). The results are shown in Table 6.
The coefficients of the ln N P variable in Models (1)–(4) are all positive and pass the significance test at the 1% level, and the coefficients of the ln K P variable in Models (5)–(8) are also significantly positive at least at the 5% level. This suggests that there is an interactive effect between the network position and knowledge production of cities in different network blocks and different geographic locations and further proves the reliability and robustness of the benchmark regression results.
An interesting point is that the coefficients of the ln N P variable in the core block and eastern region are significantly smaller than those in the periphery block and central–western region, respectively, while the coefficients of the ln K P variable in the core block and eastern region are significantly greater than those in the periphery block and central–western region, respectively. This finding reveals that the impact of network position on knowledge production and the impact of knowledge production on network position exhibit significant heterogeneity between core blocks and periphery blocks as well as between the eastern region and the central–western region in China.
In terms of the impact of network position on knowledge production, this result may be explained by the fact that cities in the core block (by virtue of their topological advantages) and the eastern region (by virtue of their geographical advantages) have established intensive network linkages [51], and the marginal benefits gained from the urban knowledge network for such cities are nearly reaching critical areas (due to the occurrence of ‘free-riding’ or ‘knowledge leakages’), so it is difficult to substantially enhance their knowledge production by promoting their network position [68], while cities in the periphery block and the central–western region still enjoy higher marginal benefits from the urban knowledge network because their network capital is scarce and highly concentrated [61,64].
In terms of the impact of knowledge production on network position, a possible explanation for this might be that the knowledge-intensive regions (i.e., core block and eastern region) have a stronger capability to absorb, interpret, and utilize knowledge resources than the knowledge-sparse regions (i.e., periphery block and central–western region) [24,29]; therefore, the potential for transforming ‘knowledge advantages’ into ‘network advantages’ in cities in the core block and the eastern region is greater than in the periphery block and the central–western region [53], thus leading to an opposite result compared with the former impact.

3.5. Spatial Spillover Effects Analysis

Table 7 reports the regression results based on the geographic adjacency matrix and knowledge network matrix, respectively, with the coefficients of w i j ln K P and w i j ln N P variables all passing the significance test at the 1% level, confirming that the interplay between network position and knowledge production does exhibit spillover effects in both geographically adjacent regions and networked (relationally) adjacent regions [42,54]. This result indicates that the knowledge production performance of a certain city is not only dependent on its own position characteristics in the knowledge network but is also affected by the network position of its neighboring cities and their knowledge production performance. Likewise, the network position of a certain city covaries with its own knowledge production performance and its neighboring cities’ network position characteristics and knowledge production performance [33,55,69].
Notably, the coefficient of the w i j ln K P variable in the knowledge production equation and the coefficient of the w i j ln N P variable in the network position equation are significantly positive, while the coefficient of the w i j ln N P variable in the knowledge production equation and the coefficient of the w i j ln K P variable in the network position equation are significantly negative. This demonstrates that, as concluded by Demuynck et al., both cooperation and competition likely coexist in the urban knowledge network [70]; in other words, the urban knowledge network is thus shaped by a complex interplay of both cooperative and competitive relations [71,72]. Specifically, at the cooperation level, the estimation of w i j ln K P positively affects ln K P and w i j ln N P positively affects ln N P , supporting general views on urban networks, such as ‘assortativity’ [73] and ‘club good’ [74]. In contrast, at the competition level, the estimation of w i j ln N P negatively affects ln K P and w i j ln K P negatively affects ln N P , corroborating the idea that, as Gordon argued, the competitiveness of a city within a certain region is primarily defined by the geographic extent of its hinterland area and thus is curtailed by the presence of neighboring cities [75].

4. Conclusions

Since Capello introduced the term ‘urban network externalities’ [76], referring to the benefits originating from the functional networks between cities, this field has received considerable attention for its significant contribution to urban performance. However, with the increasing amount of research on the impact of urban networks on urban performance, the reverse impact of urban performance on urban networks and the resulting interactive process between urban networks and urban performance is ignored. To this end, this study examines the bidirectional relationship between network position and knowledge production of cities in China through the lens of technological knowledge and reveals its heterogeneous characteristics and spillover effects. The main conclusions are as follows.
(1)
A mutually reinforcing relationship is supported between the position characteristics of cities in the knowledge network and their knowledge production performance. Promotion of the network position significantly enhances the knowledge production of cities, and enhancement of the knowledge production also significantly promotes the network position of cities.
(2)
The interplay between the network position and knowledge production of cities exhibits heterogeneous characteristics. The positive effect of network position on knowledge production in the core block and the eastern region is significantly smaller than that in the periphery block and the central–western region, respectively, while the positive effect of knowledge production on network position in the core block and the eastern region is significantly greater than that in the periphery block and the central–western region, respectively.
(3)
The interplay between network position and knowledge production of cities exhibits spillover effects. The position characteristics of cities in the knowledge network are significantly affected by the knowledge production performance and network position characteristics of their neighboring cities, and the knowledge production performance of cities is also significantly dependent on the network position characteristics and knowledge production performance of their neighboring cities. In addition, the spillover effects of the interplay are accomplished by the synergistic interaction of the geographical proximity effect and the networked proximity effect.
Compared with previous studies, the main contributions of this study are summarized as follows. First, this study confirms the existence of a bidirectional relationship between the network position and knowledge production of cities, thus offering unprecedented insights into current research that is only concerned with the unidirectional relationship between network position characteristics and knowledge production performance [29,31,53,63] and paving the way for novel avenues of empirical research in China. Second, this study reveals the heterogeneous characteristics and spillover effects of the interactive process between network position and knowledge production, thus helping to deepen the understanding of the essential characteristics of urban network externalities [76,77,78] and contributing to enrichment of the connotations of the knowledge production function in the ‘space of flows’ [79,80,81]. Third, this study connects network theory with regional science and urban economics to investigate the knowledge activities of cities and regions, hence providing a useful complement to the current studies focusing more on the relationship between knowledge network structure and invention productivity at the firm level [13,82,83] and serving to highlight the importance of regionally aggregated collaboration behavior and the innovation-generating geographic environment [22,51,84,85].
Our findings have the following policy implications. First, the results of this study verify that the interactive process between network position and knowledge production exists in both geographically adjacent regions and networked (relationally) adjacent regions, implying that network externalities play a much more important role in knowledge output or innovation performance. Therefore, multiple actors, including enterprises, universities, and research institutions, should actively promote the in-depth development of knowledge networks in the future to fully release the positive effects of network externalities on urban performance. Second, this study found that the interplay between network position and knowledge production exhibits heterogeneous characteristics in terms of network block and geographic location, indicating that different types of cities gain different benefits from the interactive process. Therefore, the government should pay more attention not only to cities with sparse network linkages, in promoting the coordinated development of knowledge transfer and knowledge production, but also to cities with intensive network linkages, in mitigating the risk of overembeddedness and lock-in.
Nevertheless, there are still some deficiencies that need to be improved or complemented in future research. For example, knowledge is a multifaceted concept. This study investigates interplay only from the standpoint of technological knowledge, and a better and more comprehensive evaluation of knowledge should not only rely on patent measurements. Future research can therefore seek to construct a multilayered knowledge network and measure cities’ knowledge production performance more comprehensively to better reveal the interactive effect between network position and knowledge production.

Author Contributions

Conceptualization, J.Z., B.S. and C.W.; methodology, J.Z. and C.W.; software, J.Z.; formal analysis, J.Z. and C.W.; data curation, C.W.; writing—original draft preparation, J.Z., B.S. and C.W.; writing—review and editing, J.Z. and B.S.; visualization, J.Z. and C.W.; supervision, B.S.; funding acquisition, B.S. All authors have read and agreed to the published version of the manuscript.

Funding

This research was funded by the National Natural Science Foundation of China (42071210).

Data Availability Statement

The original contributions presented in the study are included in the article, further inquiries can be directed to the corresponding author.

Conflicts of Interest

The authors declare no conflicts of interest.

References

  1. Cao, Z.; Peng, Z.; Derudder, B. Interurban Scientific Collaboration Networks across Chinese City-Regions. Environ. Plan. A Econ. Space 2021, 53, 6–8. [Google Scholar] [CrossRef]
  2. Mok, D.; Wellman, B.; Carrasco, J. Does Distance Matter in the Age of the Internet? Urban Stud. 2010, 47, 2747–2783. [Google Scholar] [CrossRef]
  3. Strambach, S.; Klement, B. Cumulative and Combinatorial Micro-Dynamics of Knowledge: The Role of Space and Place in Knowledge Integration. Eur. Plan. Stud. 2012, 20, 1843–1866. [Google Scholar] [CrossRef]
  4. Castells, M. The Rise of the Network Society; Blackwell Publishers: Oxford, UK, 1996. [Google Scholar]
  5. Camagni, R. From City Hierarchy to City Network: Reflections about an Emerging Paradigm. In Seminal Studies in Regional and Urban Economics; Capello, R., Ed.; Springer International Publishing: Cham, Switzerland, 2017; pp. 183–202. ISBN 978-3-319-57806-4. [Google Scholar]
  6. Derudder, B.; Neal, Z. Uncovering Links between Urban Studies and Network Science. Netw. Spat. Econ. 2018, 18, 441–446. [Google Scholar] [CrossRef]
  7. Hu, X.; Wang, C.; Wu, J.; Stanley, H.E. Understanding Interurban Networks from a Multiplexity Perspective. Cities 2020, 99, 102625. [Google Scholar] [CrossRef]
  8. Pan, F.; Bi, W.; Lenzer, J.; Zhao, S. Mapping Urban Networks through Inter-Firm Service Relationships: The Case of China. Urban Stud. 2017, 54, 3639–3654. [Google Scholar] [CrossRef]
  9. Pflieger, G.; Rozenblat, C. Introduction. Urban Networks and Network Theory: The City as the Connector of Multiple Networks. Urban Stud. 2010, 47, 2723–2735. [Google Scholar] [CrossRef]
  10. Sun, B.; Liu, P.; Zhang, W.; Zhang, T.; Li, W. Unpacking Urban Network as Formed by Client Service Relationships of Law Firms in China. Cities 2022, 122, 103546. [Google Scholar] [CrossRef]
  11. Wang, T.; Meijers, E.; Wang, H. The Multiplex Relations between Cities: A Lexicon-Based Approach to Detect Urban Systems. Reg. Stud. 2022, 57, 1592–1604. [Google Scholar] [CrossRef]
  12. Gui, Q.; Liu, C.; Du, D.; Duan, D. The Changing Geography of Global Science. Environ. Plan. A Econ. Space 2019, 51, 1615–1617. [Google Scholar] [CrossRef]
  13. Laperche, B. Knowledge Capital and Small Businesses. In Encyclopedia of Creativity, Invention, Innovation and Entrepreneurship; Springer: Berlin/Heidelberg, Germany, 2020; pp. 1527–1532. [Google Scholar] [CrossRef]
  14. Lucas, R.E. On the Mechanics of Economic Development. J. Monet. Econ. 1988, 22, 3–42. [Google Scholar] [CrossRef]
  15. Nelson, R.R. The Sources of Economic Growth; Harvard University Press: Cambridge, MA, USA, 2000. [Google Scholar]
  16. Romer, P.M. Increasing Returns and Long-Run Growth. J. Polit. Econ. 1986, 94, 1002–1037. [Google Scholar] [CrossRef]
  17. Dahlman, C.J.; Aubert, J.E. China and the Knowledge Economy: Seizing the 21st Century; World Bank Publications: Chicago, IL, USA, 2001. [Google Scholar]
  18. Shie, V.H.; Meer, C.D.; Shin, N.-F. Locating China in the Twenty-First-Century Knowledge-Based Economy. J. Contemp. China 2012, 21, 113–130. [Google Scholar] [CrossRef]
  19. Cao, Z.; Derudder, B.; Dai, L.; Peng, Z. ‘Buzz-and-Pipeline’ Dynamics in Chinese Science: The Impact of Interurban Collaboration Linkages on Cities’ Innovation Capacity. Reg. Stud. 2022, 56, 290–306. [Google Scholar] [CrossRef]
  20. Cooke, P. Regional Innovation Systems, Clusters, and the Knowledge Economy. Ind. Corp. Chang. 2001, 10, 945–974. [Google Scholar] [CrossRef]
  21. Florida, R.; Adler, P.; Mellander, C. The City as Innovation Machine. Reg. Stud. 2017, 51, 86–96. [Google Scholar] [CrossRef]
  22. Shearmur, R. Are Cities the Font of Innovation? A Critical Review of the Literature on Cities and Innovation. Cities 2012, 29, S9–S18. [Google Scholar] [CrossRef]
  23. Owen-Smith, J.; Powell, W.W. Knowledge Networks as Channels and Conduits: The Effects of Spillovers in the Boston Biotechnology Community. Organ. Sci. 2004, 15, 5–21. [Google Scholar] [CrossRef]
  24. Tsai, W. Knowledge Transfer in Intraorganizational Networks: Effects of Network Position and Absorptive Capacity on Business Unit Innovation and Performance. Acad. Manag. J. 2001, 44, 996–1004. [Google Scholar] [CrossRef]
  25. Liefner, I.; Hennemann, S. Structural Holes and New Dimensions of Distance: The Spatial Configuration of the Scientific Knowledge Network of China’s Optical Technology Sector. Environ. Plan. A Econ. Space 2011, 43, 810–829. [Google Scholar] [CrossRef]
  26. Breschi, S.; Lenzi, C. Co-Invention Networks and Inventive Productivity in US Cities. J. Urban Econ. 2016, 92, 66–75. [Google Scholar] [CrossRef]
  27. Broekel, T.; Brachert, M.; Duschl, M.; Brenner, T. Joint R&D Subsidies, Related Variety, and Regional Innovation. Int. Reg. Sci. Rev. 2017, 40, 297–326. [Google Scholar] [CrossRef]
  28. Capone, F.; Lazzeretti, L.; Innocenti, N. Innovation and Diversity: The Role of Knowledge Networks in the Inventive Capacity of Cities. Small Bus. Econ. 2021, 56, 773–788. [Google Scholar] [CrossRef]
  29. Coffano, M.; Foray, D.; Pezzoni, M. Does Inventor Centrality Foster Regional Innovation? The Case of the Swiss Medical Devices Sector. Reg. Stud. 2017, 51, 1206–1218. [Google Scholar] [CrossRef]
  30. Guan, J.; Zhang, J.; Yan, Y. The Impact of Multilevel Networks on Innovation. Res. Pol. 2015, 44, 545–559. [Google Scholar] [CrossRef]
  31. Gui, Q.; Liu, C.; Du, D. Does Network Position Foster Knowledge Production? Evidence from International Scientific Collaboration Network. Growth Chang. 2018, 49, 594–611. [Google Scholar] [CrossRef]
  32. Han, M.; Sun, B.; Su, X. Can a Region’s Network Location Characteristics Affect Its Innovation Capability? Empirical Evidence from China. Chin. Manag. Stud. 2020, 15, 328–349. [Google Scholar] [CrossRef]
  33. Hazır, C.S.; LeSage, J.; Autant-Bernard, C. The Role of R&D Collaboration Networks on Regional Knowledge Creation: Evidence from Information and Communication Technologies: Collaboration Networks and Regional Knowledge Creation. Pap. Reg. Sci. 2018, 97, 549–567. [Google Scholar] [CrossRef]
  34. Innocenti, N.; Capone, F.; Lazzeretti, L. Knowledge Networks and Industrial Structure for Regional Innovation: An Analysis of Patents Collaborations in Italy. Pap. Reg. Sci. 2020, 99, 55–72. [Google Scholar] [CrossRef]
  35. Cassi, L.; Morrison, A.; Rabellotti, R. Proximity and Scientific Collaboration: Evidence from the Global Wine Industry: Proximity and Scientific Collaboration. Tijdschr. Voor Econ. En Soc. Geogr. 2015, 106, 205–219. [Google Scholar] [CrossRef]
  36. Gui, Q.; Liu, C.; Du, D. International Knowledge Flows and the Role of Proximity: International Knowledge Flows and Proximity. Growth Chang. 2018, 49, 532–547. [Google Scholar] [CrossRef]
  37. Hoekman, J.; Frenken, K.; Van Oort, F. The Geography of Collaborative Knowledge Production in Europe. Ann. Reg. Sci. 2009, 43, 721–738. [Google Scholar] [CrossRef]
  38. Hoekman, J.; Frenken, K.; Tijssen, R.J.W. Research Collaboration at a Distance: Changing Spatial Patterns of Scientific Collaboration within Europe. Res. Pol. 2010, 39, 662–673. [Google Scholar] [CrossRef]
  39. Montobbio, F.; Sterzi, V. The Globalization of Technology in Emerging Markets: A Gravity Model on the Determinants of International Patent Collaborations. World Devel. 2013, 44, 281–299. [Google Scholar] [CrossRef]
  40. Paier, M.; Scherngell, T. Determinants of Collaboration in European R&D Networks: Empirical Evidence from a Discrete Choice Model. Ind. Innov. 2011, 18, 89–104. [Google Scholar] [CrossRef]
  41. Plotnikova, T.; Rake, B. Collaboration in Pharmaceutical Research: Exploration of Country-Level Determinants. Scientometrics 2014, 98, 1173–1202. [Google Scholar] [CrossRef]
  42. Ponds, R.; Van Oort, F.; Frenken, K. The Geographical and Institutional Proximity of Research Collaboration. Pap. Reg. Sci. 2007, 86, 423–443. [Google Scholar] [CrossRef]
  43. Scherngell, T.; Hu, Y. Collaborative Knowledge Production in China: Regional Evidence from a Gravity Model Approach. Reg. Stud. 2011, 45, 755–772. [Google Scholar] [CrossRef]
  44. Gilsing, V.; Nooteboom, B.; Vanhaverbeke, W.; Duysters, G.; Van Den Oord, A. Network Embeddedness and the Exploration of Novel Technologies: Technological Distance, Betweenness Centrality and Density. Res. Pol. 2008, 37, 1717–1731. [Google Scholar] [CrossRef]
  45. Hung, S.W.; Wang, A.P. Examining the Small World Phenomenon in the Patent Citation Network: A Case Study of the Radio Frequency Identification (RFID) Network. Scientometrics 2010, 82, 121–134. [Google Scholar] [CrossRef]
  46. Huggins, R.; Prokop, D. Network Structure and Regional Innovation: A Study of University–Industry Ties. Urban Stud. 2017, 54, 931–952. [Google Scholar] [CrossRef]
  47. Van Der Wouden, F.; Rigby, D.L. Co-Inventor Networks and Knowledge Production in Specialized and Diversified Cities. Pap. Reg. Sci. 2019, 98, 1833–1853. [Google Scholar] [CrossRef]
  48. Bathelt, H.; Malmberg, A.; Maskell, P. Clusters and Knowledge: Local Buzz, Global Pipelines and the Process of Knowledge Creation. Prog. Hum. Geog. 2004, 28, 31–56. [Google Scholar] [CrossRef]
  49. Boschma, R. Proximity and Innovation: A Critical Assessment. Reg. Stud. 2005, 39, 61–74. [Google Scholar] [CrossRef]
  50. Breschi, S.; Lenzi, C. The Role of External Linkages and Gatekeepers for the Renewal and Expansion of US Cities’ Knowledge Base, 1990–2004. Reg. Stud. 2015, 49, 782–797. [Google Scholar] [CrossRef]
  51. Broekel, T. Collaboration Intensity and Regional Innovation Efficiency in Germany: A Conditional Efficiency Approach. Ind. Innov. 2012, 19, 155–179. [Google Scholar] [CrossRef]
  52. De Araújo, I.F.; Gonçalves, E.; Taveira, J.G. The Role of Patent Co-Inventorship Networks in Regional Inventive Performance. Int. Reg. Sci. Rev. 2019, 42, 235–280. [Google Scholar] [CrossRef]
  53. Feng, Z.; Cai, H.; Chen, Z.; Zhou, W. Influence of an Interurban Innovation Network on the Innovation Capacity of China: A Multiplex Network Perspective. Technol. Forecast. Soc. 2022, 180, 121651. [Google Scholar] [CrossRef]
  54. Maggioni, M.A.; Nosvelli, M.; Uberti, T.E. Space versus Networks in the Geography of Innovation: A European Analysis. Pap. Reg. Sci. 2007, 86, 471–493. [Google Scholar] [CrossRef]
  55. Wanzenbbck, I.; Scherngell, T.; Brenner, T. Embeddedness of Regions in European Knowledge Networks: A Comparative Analysis of Inter-Regional R&D Collaborations, Co-Patents and Co-Publications. SSRN Electron. J. 2014, 53, 337–368. [Google Scholar] [CrossRef]
  56. Borgatti, S.P.; Everett, M.G. A Graph-Theoretic Perspective on Centrality. Soc. Netw. 2006, 28, 466–484. [Google Scholar] [CrossRef]
  57. Freeman, L.C. Centrality in Social Networks Conceptual Clarification. Soc. Netw. 1978, 1, 215–239. [Google Scholar] [CrossRef]
  58. Acs, Z.J.; Anselin, L.; Varga, A. Patents and Innovation Counts as Measures of Regional Production of New Knowledge. Res. Pol. 2002, 31, 1069–1085. [Google Scholar] [CrossRef]
  59. Griliches, Z. Patent Statistics as Economic Indicators: A Survey; National Bureau of Economic Research: Cambridge, MA, USA, 1990; p. w3301. [Google Scholar]
  60. Jaffe, A.B. Technological Opportunity and Spillovers of R & D: Evidence from Firms’ Patents, Profits, and Market Value. Am. Econ. Rev. 1986, 76, 984–1001. [Google Scholar]
  61. De Noni, I.; Orsi, L.; Belussi, F. The Role of Collaborative Networks in Supporting the Innovation Performances of Lagging-behind European Regions. Res. Pol. 2018, 47, 1–13. [Google Scholar] [CrossRef]
  62. Harris, C.D. The Market as a Factor in the Localization of Industry in the United States. Ann. Assoc. Am. Geogr. 1954, 44, 315–348. [Google Scholar] [CrossRef]
  63. Guan, J.; Zuo, K.; Chen, K.; Yam, R.C.M. Does Country-Level R&D Efficiency Benefit from the Collaboration Network Structure? Res. Pol. 2016, 45, 770–784. [Google Scholar] [CrossRef]
  64. Sheng, K.; Chen, H.; Zhang, J.; Gao, Y. Impact of airline network embedding on knowledge production of cities in China. Sci. Geogr. Sin. 2022, 42, 963–974. [Google Scholar] [CrossRef]
  65. Tang, C.; Guan, M.; Dou, J. Understanding the Impact of High Speed Railway on Urban Innovation Performance from the Perspective of Agglomeration Externalities and Network Externalities. Technol. Soc. 2021, 67, 101760. [Google Scholar] [CrossRef]
  66. Song, Y.; Yue, Q.; Zhu, J.; Zhang, M. Air Pollution, Human Capital, and Urban Innovation in China. Environ. Sci. Pollut. R. 2022, 30, 38031–38051. [Google Scholar] [CrossRef]
  67. Borgatti, S.P.; Everett, M.G. Models of Core/Periphery Structures. Soc. Netw. 2000, 21, 375–395. [Google Scholar] [CrossRef]
  68. Granovetter, M.S. The Strength of Weak Ties. Am. J. Sociol. 1973, 78, 1360–1380. [Google Scholar] [CrossRef]
  69. Sebestyén, T.; Varga, A. Research Productivity and the Quality of Interregional Knowledge Networks. Ann. Reg. Sci. 2013, 51, 155–189. [Google Scholar] [CrossRef]
  70. Demuynck, W.; Zhang, W.; Caset, F.; Derudder, B. Urban Co-Opetition in Megaregions: Measuring Competition and Cooperation within and beyond the Pearl River Delta. Comput. Environ. Urban Syst. 2023, 101, 101951. [Google Scholar] [CrossRef]
  71. Burger, M.J. Structure and Cooptition in Urban Networks; Erasmus University Rotterdam: Rotterdam, The Netherlands, 2011; ISBN 978-90-5892-288-5. [Google Scholar]
  72. Lai, K. Differentiated Markets: Shanghai, Beijing and Hong Kong in China’s Financial Centre Network. Urban Stud. 2012, 49, 1275–1296. [Google Scholar] [CrossRef]
  73. Crespo, J.; Suire, R.; Vicente, J. Lock-in or Lock-out? How Structural Properties of Knowledge Networks Affect Regional Resilience. J. Econ. Geogr. 2014, 14, 199–219. [Google Scholar] [CrossRef]
  74. Camagni, R.; Salone, C. Network Urban Structures in Northern Italy: Elements for a Theoretical Framework. Urban Stud. 1993, 30, 1053–1064. [Google Scholar] [CrossRef]
  75. Gordon, I. Internationalisation and Urban Competition. Urban Stud. 1999, 36, 1001–1016. [Google Scholar] [CrossRef]
  76. Capello, R. The City Network Paradigm: Measuring Urban Network Externalities. Urban Stud. 2000, 37, 1925–1945. [Google Scholar] [CrossRef]
  77. Burger, M.J.; Meijers, E.J. Agglomerations and the Rise of Urban Network Externalities. Pap. Reg. Sci. 2016, 95, 5–15. [Google Scholar] [CrossRef]
  78. Van Meeteren, M.; Neal, Z.; Derudder, B. Disentangling Agglomeration and Network Externalities: Conceptual Typology Illustrated by the Geography of Globalized Producer Service Firms. Pap. Reg. Sci. 2016, 95, 61–80. [Google Scholar] [CrossRef]
  79. Anselin, L.; Varga, A.; Acs, Z. Local Geographic Spillovers between University Research and High Technology Innovations. J. Urban Econ. 1997, 42, 422–448. [Google Scholar] [CrossRef]
  80. Griliches, Z. Issues in Assessing the Contribution of Research and Development to Productivity Growth. Bell J. Econ. 1979, 10, 92–116. [Google Scholar] [CrossRef]
  81. Jaffe, A.B. Real Effects of Academic Research. Am. Econ. Rev. 1989, 79, 957–970. [Google Scholar]
  82. Schilling, M.A.; Phelps, C.C. Interfirm Collaboration Networks: The Impact of Large-Scale Network Structure on Firm Innovation. Manag. Sci. 2007, 53, 1113–1126. [Google Scholar] [CrossRef]
  83. Zaheer, A.; Bell, G.G. Benefiting from Network Position: Firm Capabilities, Structural Holes, and Performance. Strateg. Manag. J. 2005, 26, 809–825. [Google Scholar] [CrossRef]
  84. Cantner, U.; Meder, A. Technological Proximity and the Choice of Cooperation Partner. J. Econ. Interact. Coord. 2007, 2, 45–65. [Google Scholar] [CrossRef]
  85. Doloreux, D.; Parto, S. Regional Innovation Systems: Current Discourse and Unresolved Issues. Technol. Soc. 2005, 27, 133–153. [Google Scholar] [CrossRef]
Figure 1. The conceptual framework of the interplay between network position and knowledge production.
Land 13 01713 g001
Figure 2. The urban knowledge network in China based on patent transfer data in 2005 and 2020.
Land 13 01713 g002
Figure 3. The spatial distribution of the coupling degree between urban network position and knowledge production in 2005 and 2020.
Land 13 01713 g003
Table 1. Descriptive statistics.
VariablesNMeanSDMinMax
ln K P 9727.0062.0422.07912.515
ln N P 9724.6292.5160.00011.357
ln l 9728.3951.1545.70713.483
ln e d u 9721.6520.9430.0004.533
ln c 9720.6641.5890.0009.777
ln f d i 9723.7631.7830.0008.517
ln t r a n 9728.3621.3290.00012.184
ln f i n 9720.6590.2510.1061.667
ln p m 2.5 97210.4614.8610.00016.82
ln p g d p 97210.1660.9610.00013.056
ln M P 9726.2371.8213.98511.408
ln i n f 9723.5361.2860.0007.151
Table 2. Statistics of network position and knowledge production of the top 10 cities from 2005 to 2020.
RankDegreePatent
20052010201520202005201020152020
1BeijingBeijingBeijingBeijingShanghaiShanghaiBeijingShenzhen
[744][5271][32,101][85,561][23,131][57,538][147,705][272,436]
2ShanghaiShanghaiShenzhenShenzhenShenzhenBeijingShenzhenBeijing
[652][3698][18,509][70,647][19,138][52,741][106,532][218,631]
3ShenzhenShenzhenShanghaiGuangzhouBeijingShenzhenShanghaiGuangzhou
[491][3154][18,284][55,448][18,575][44,779][90,020][210,273]
4GuangzhouGuangzhouSuzhouShanghaiFoshanSuzhouSuzhouShanghai
[264][1370][9437][54,842][10,181][28,050][88,113][185,076]
5TianjinTianjinNantongSuzhouGuangzhouHangzhouChongqingSuzhou
[217][1216][8826][41,187][7434][24,741][71,092][179,485]
6ShenyangNanjingGuangzhouShaoxingTianjinWuxiTianjinHangzhou
[164][991][6862][31,756][7241][22,248][61,129][129,502]
7FoshanHangzhouHangzhouQuanzhouHangzhouChengduChengduNanjing
[136][924][6708][26,894][6317][21,627][60,999][103,008]
8HaikouSuzhouNanjingNanjingChengduGuangzhouGuangzhouTianjin
[128][769][6153][25,815][5308][18,077][54,585][91,980]
9ChengduChengduNingboHangzhouChongqingTianjinHangzhouChengdu
[108][755][5514][25,470][5115][16,120][53,539][85,678]
10NanjingFoshanChengduNantongNanjingChongqingWuxiFoshan
[101][726][5124][24,939][3876][16,071][48,975][82,213]
The corresponding values are in brackets.
Table 3. Moran’s I index of network position and knowledge production from 2005 to 2020.
YearGeographic Adjacency MatrixNetwork Adjacency Matrix
DegreePatentDegreePatent
Moran’s Ip ValueMoran’s Ip ValueMoran’s Ip ValueMoran’s Ip Value
20050.0090.0140.0130.0020.3700.0000.3620.000
20100.0130.0010.0360.0000.3580.0000.4290.000
20150.0270.0000.0470.0000.3770.0000.4620.000
20200.0580.0000.0480.0000.4680.0000.4590.000
Table 4. Regression results of benchmark analysis and heterogeneity analysis.
VariablesKnowledge Production EquationVariablesNetwork Position Equation
(1)(2)
ln N P 0.685 *** ln K P 0.234 ***
(0.012)(0.080)
ln l 0.077 *** ln f i n 0.354 ***
(0.030)(0.109)
ln e d u 0.209 *** ln M P 0.105 ***
(0.035)(0.028)
ln c 0.033 ** ln p m 2.5 −0.033 ***
(0.013)(0.009)
ln f d i 0.064 *** ln p g d p 0.620 ***
(0.012)(0.051)
ln t r a n 0.128 *** ln i n f 0.946 ***
(0.015)(0.094)
Constant1.518 ***Constant−7.198 ***
(0.219)(0.435)
R20.902R20.893
Observations972Observations972
Standard errors are in parentheses, and *, **, and *** denote significance at the 10%, 5%, and 1% levels, respectively.
Table 5. Regression results of robustness check.
VariablesKnowledge Production EquationVariablesNetwork Position Equation
(1)(2)(3)(4)(5)(6)(7)(8)
NP: Eigenvector CentralityNP:
Coreness
Winsorize: NPWinsorize: KPNP: Eigenvector CentralityNP: CorenessWinsorize: NPWinsorize: KP
ln N P 1.781 ***1.051 ***0.687 ***0.681 *** ln K P 0.267 ***0.254 ***0.214 **0.234 ***
(0.659)(0.607)(0.012)(0.012)(0.047)(0.022)(0.081)(0.083)
ControlsYesYesYesYesControlsYesYesYesYes
Constant2.591 ***1.1601.478 ***1.659 ***Constant−0.748 ***−0.530 *−7.216 ***−7.235 ***
(1.493)(1.284)(0.221)(0.218)(0.245)(0.282)(0.442)(0.435)
R20.5210.5420.9010.900R20.2400.2200.8910.893
Observations972972972972Observations972972972972
Standard errors are in parentheses, and *, **, and *** denote significance at the 10%, 5%, and 1% levels, respectively.
Table 6. Regression results of heterogeneity analysis.
VariablesKnowledge Production EquationVariablesNetwork Position Equation
(1)(2)(3)(4)(5)(6)(7)(8)
Core BlockPeriphery BlockEastern RegionCentral–Western RegionCore BlockPeriphery BlockEastern RegionCentral–Western Region
ln N P 0.660 ***0.691 ***0.447 ***0.691 *** ln K P 0.661 ***0.521 ***0.480 **0.430 ***
(0.022)(0.018)(0.038)(0.018)(0.131)(0.069)(0.211)(0.091)
ControlsYesYesYesYesControlsYesYesYesYes
Constant1.487 ***1.485 ***2.768 ***1.500 ***Constant−6.207 ***−6.804 ***−8.445 ***−6.045 ***
(0.423)(0.240)(0.452)(0.264)(0.457)(0.465)(0.945)(0.381)
R20.6910.7680.8460.847R20.7970.8180.8890.871
Observations176796380592Observations176796380592
Standard errors are in parentheses, and *, **, and *** denote significance at the 10%, 5%, and 1% levels, respectively.
Table 7. Regression results of spatial spillover effects analysis.
VariablesKnowledge Production EquationVariablesNetwork Position Equation
(1)(2)(3)(4)
Geographic Adjacency MatrixNetwork Adjacency MatrixGeographic Adjacency MatrixNetwork Adjacency Matrix
ln N P 1.052 ***1.115 *** ln K P 0.873 ***0.804 ***
(0.027)(0.030)(0.025)(0.025)
w i j ln N P −0.733 ***−0.774 *** w i j ln K P −0.518 ***−0.489 ***
(0.051)(0.051)(0.032)(0.032)
w i j ln K P 0.534 ***0.537 *** w i j ln N P 0.721 ***0.721 ***
(0.040)(0.041)(0.033)(0.031)
ControlsYesYesControlsYesYes
Constant1.565 ***1.493 ***Constant−1.635 ***−1.470 ***
(0.159)(0.166)(0.229)(0.221)
R20.8770.874R20.9310.938
Observations972972Observations972972
Standard errors are in parentheses, and *, **, and *** denote significance at the 10%, 5%, and 1% levels, respectively.
Disclaimer/Publisher’s Note: The statements, opinions and data contained in all publications are solely those of the individual author(s) and contributor(s) and not of MDPI and/or the editor(s). MDPI and/or the editor(s) disclaim responsibility for any injury to people or property resulting from any ideas, methods, instructions or products referred to in the content.

