Article

Identification of Thermal Environment Networks in the Wanjiang Urban Agglomeration Based on MSPA and Circuit Theory

1
School of Resources and Environmental Management, Anhui Agricultural University, Hefei 230036, China
2
School of Economics and Management, Anhui Agricultural University, Hefei 230036, China
*
Author to whom correspondence should be addressed.
Land 2024, 13(10), 1695; https://doi.org/10.3390/land13101695
Submission received: 10 September 2024 / Revised: 4 October 2024 / Accepted: 9 October 2024 / Published: 17 October 2024

Abstract

:
With the acceleration of urbanization, the high density and intensity of urban construction and expansion have led to an exacerbation of the urban heat island (UHI) effect, which, in turn, contributes to global climate warming and severely impacts urban ecological environments and human health. This study takes the Wanjiang urban agglomeration as a case study. Using land surface temperature data from 2010, 2016, and 2022, the study employs the Morphological Spatial Pattern Analysis (MSPA) model to quantitatively identify the types and spatiotemporal distribution characteristics of heat island patches in the Wanjiang urban agglomeration. Based on this analysis, this study constructed thermal environment sources and heat island corridors, and applied circuit theory (CIRCUIT) to identify the spatial network of the thermal environment in the urban agglomeration. The results show that (1) from 2010 to 2022, seven types of heat island patches in the Wanjiang urban belt were identified by consensus, mainly distributed in the northwest and southeast, and their areas increased significantly. The dominant type of heat island patches changed from island type in 2010 to core type in 2022. (2) From 2010 to 2022, the number and area of urban thermal environment sources in Wanjiang increased. According to the thermal environment source distribution and circuit theory, the number of heat island corridors increased from 2010 to 2022. The pinch points of the heat island network in the Wanjiang urban agglomeration increased from 2010 to 2022, indicating that the ecosystem connectivity of the urban agglomeration had improved during the study period. Based on the circuit theory, the heat island network barrier points of the urban agglomeration from 2010 to 2022 are identified. (3) During 2010–2022, α, β, and γ increased with time, the overall connectivity of the thermal environment network in the Wanjiang urban agglomeration was enhanced, the heat transmission efficiency between source areas was gradually improved, and the high temperature threat degree to urban and rural residents was on the rise. This study provides an identification and assessment of the spatial network of the thermal environment in the Wanjiang urban agglomeration, offering valuable insights for understanding the thermal environment network pattern and mitigating the urban heat island effect in the region.

1. Introduction

Global warming and urbanization have brought about significant ecological and environmental challenges [1,2,3]. According to the China Climate Change Blue Book (2021), the global warming trend continues unabated, with China identified as a sensitive region that is significantly affected by global climate change, showing a higher warming rate than the global average [4,5,6]. Against this backdrop, urban thermal environmental issues, characterized primarily by the UHI effect, have emerged as a key focus in environmental research [7,8,9]. The urban thermal environment refers to the heat-related physical environment that affects residents’ behavior, which is usually described quantitatively based on physical parameters such as temperature, thermal radiation, and thermal comfort [10]. In the context of rapid urbanization, the urban scale continues to increase, which leads to great changes in urban spatial environment, such as land use type, the layout of functional facilities, and the spatial form of buildings, which have a significant impact on urban thermal environment [11]. Therefore, the urban thermal environment is also regarded as the comprehensive performance of the urban spatial environment in the complex thermal field [12]. These issues reflect the combined effects of global warming and urbanization, highlighting the pressing need to address the worsening urban thermal environment, which is among the most challenging climate-related problems faced by cities. Manifestations of this problem include high temperatures, heatwaves, and urban heat islands [13,14,15,16]. These not only alter the ecological environment of urban surfaces—affecting vegetation growth, air quality, and hydrological cycles—but also impact the production spaces, living behaviors, and energy consumption of urban and rural residents [17,18,19,20]. Therefore, identifying the spatiotemporal changes in the complex systems and network structures of urban thermal environments, and thereby proactively adapting to and mitigating the urban heat island effect, has become a crucial goal and technical means for addressing climate change and reducing climate risks [21,22,23,24].
A deep analysis of the spatial morphology and structural characteristics of urban heat island patches is essential for developing effective adaptation and mitigation strategies [25,26,27]. Researchers have already conducted studies on the spatiotemporal dynamics of urban thermal environments at various spatial scales—global, national, and regional—using methodologies from spatial morphology and landscape ecology [28,29,30,31]. MSPA emphasizes internal system connectivity and structural connections, providing a theoretical basis for corridor and network identification through the quantitative classification of patches (such as core, isolated, perforation, edge, loop, bridge, and branch) [32,33]. The advantage of MSPA lies in its ability to detail the spatial structure of urban thermal environments, aiding in the understanding of the formation mechanisms of the heat island effect and its impact on urban ecosystems [34]. However, MSPA has certain limitations in analyzing functional connectivity and struggles to comprehensively capture the dynamic relationships between patches in urban thermal environments [35]. Traditional corridor extraction methods, such as the Minimum Cumulative Resistance (MCR) model [36] and the gravity model (GM) [37], the comprehensive evaluation index system [38], etc., regard the corridor as the optimal path of material migration and diffusion [39] and calculate the current value based on the circuit theory to extract the corridor, which is more in line with the random walk characteristics and expands connectivity repair and recognition functions such as obstacle points and sandwich points. To address this shortcoming, circuit theory has been introduced into thermal environment studies to further analyze key corridors within urban thermal environments [40,41]. Although circuit theory has been widely used in studies of ecological corridors and ecological networks, its application to the study of the urban heat island effect remains relatively limited [42]. Current research primarily focuses on evaluating changes in urban thermal environments and revealing how land use patterns or landscape structures affect urban thermal environments [43,44]. However, there is still a lack of systematic research on the spatial networks of urban thermal environments [45]. This limitation hampers a comprehensive network-based understanding and response to the urban heat island effect.
This study takes the Wanjiang urban agglomeration as a case study. Using land surface temperature data from different periods, the study utilizes the MSPA model to identify heat island patches within the urban agglomeration and construct thermal environment resistance surfaces. It further employs circuit theory to identify the spatial networks of urban thermal environments and explores their spatiotemporal evolution from a dynamic perspective. The findings aim to provide scientific references for mitigating regional-scale thermal environment deterioration and hold significant implications for enhancing sustainable urban development. The results of this research will offer a scientific basis for strategies to mitigate thermal environment degradation at a regional scale and are crucial for enhancing the sustainable development capacity of cities.

2. Material and Methods

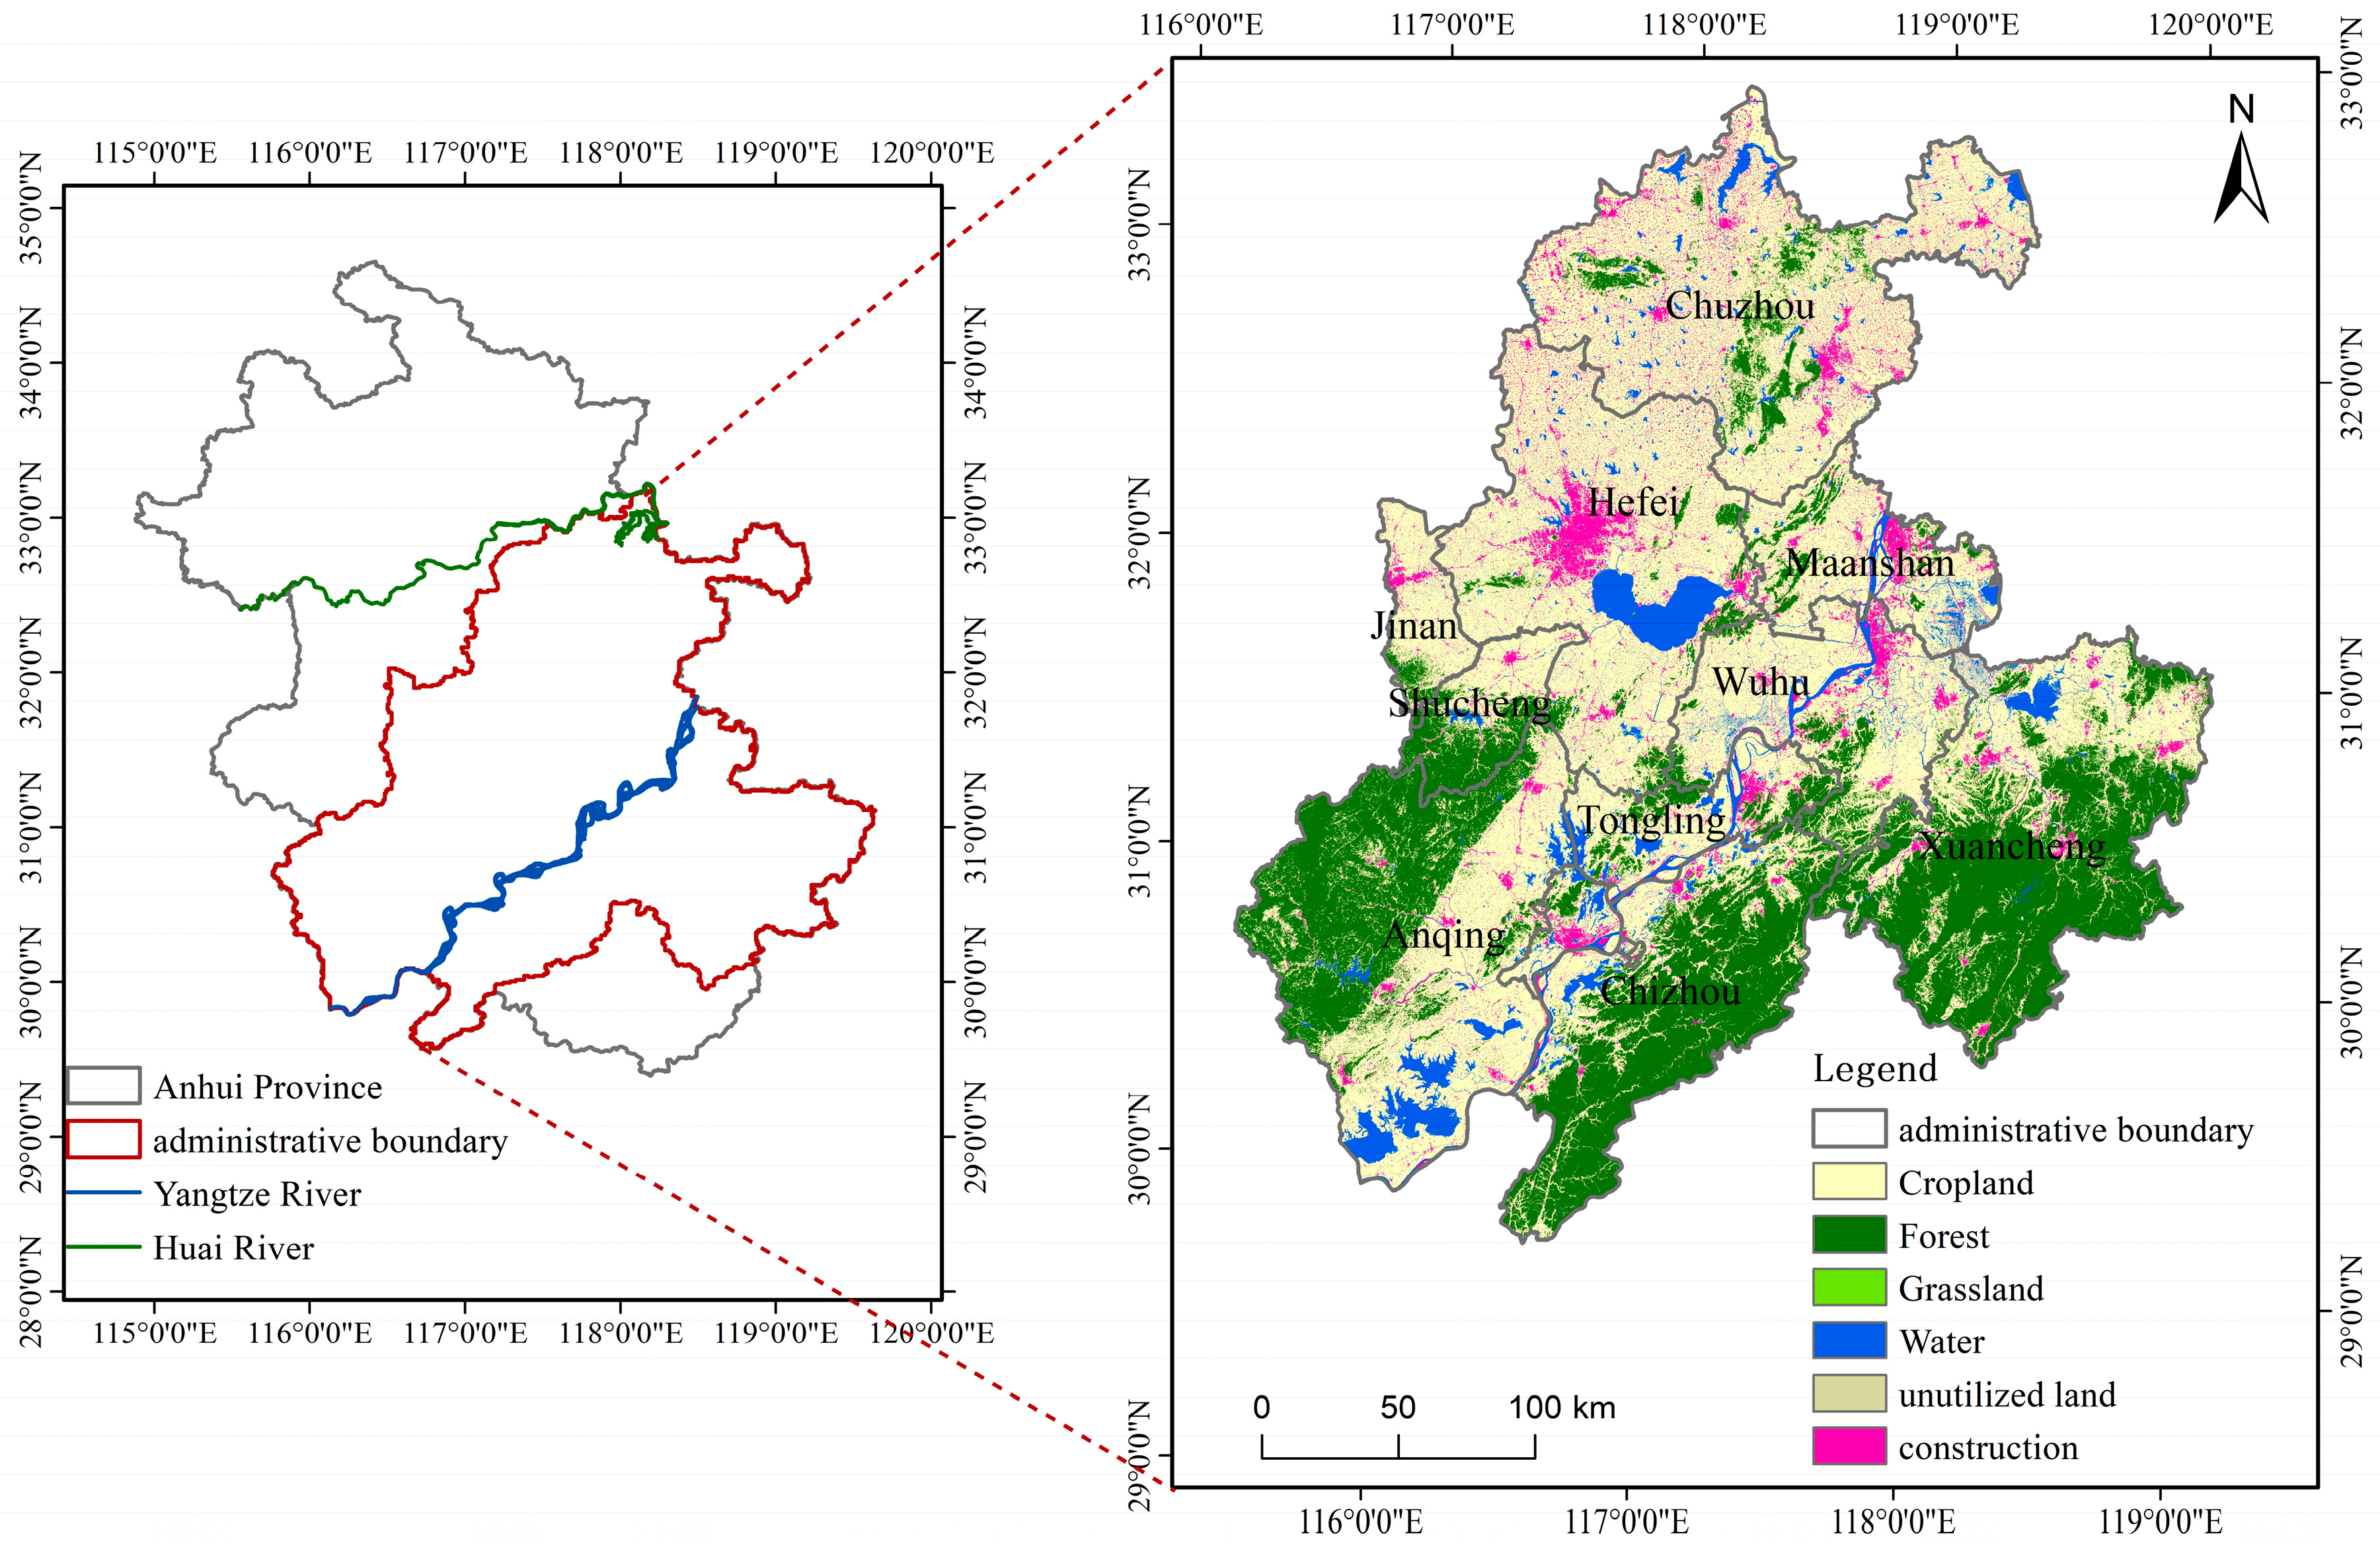
2.1. The General Situation of the Research Area

The Wanjiang urban belt is located in East China, along the lower reaches of the Yangtze River within Anhui Province. As shown in Figure 1, this region spans both sides of the Yangtze River and encompasses the entirety of eight cities—Hefei, Wuhu, Ma’anshan, Tongling, Anqing, Chizhou, Chuzhou, and Xuancheng—as well as Jin’an District and Shucheng County in Lu’an city, covering a total of 59 counties (cities and districts). The Wanjiang urban belt is well connected, serving as a vital hub that links the eastern coastal areas with the inland central and western regions of China.
Geographically, the Wanjiang urban belt features higher elevations in the south and lower elevations in the north, with diverse terrain primarily consisting of plains and hills. The region is crisscrossed by numerous rivers, making it rich in water resources. The Yangtze River in particular flows through this area, providing excellent natural conditions for economic development. The climate in Wanjiang area belongs to the subtropical humid monsoon climate, which is significantly affected by the East Asian monsoon and has four distinct seasons, namely, spring, summer, autumn, and winter, with significant temperature changes. In summer, the southeast monsoon from the ocean prevails, bringing humid air and abundant precipitation. In winter, the northwest monsoon from the mainland prevails, bringing drier and colder weather. The annual precipitation is mostly between 1000 and 1500 mm, mainly concentrated in the summer Meiyu period and typhoon season, and the winter is relatively dry. The summer temperature is high, and some areas often have high-temperature weather above 35 °C, while the winter is not extremely cold, but the wet and cold climate makes the body feel as if the temperature were lower. The annual sunshine hours are sufficient, which is conducive to agricultural production.

2.2. Data and Sources Required for the Study

The data and their sources required for this study mainly include: (1) land use raster data, land surface temperature (LST) data, and Normalized Difference Vegetation Index (NDVI) data for the years 2010, 2016, and 2022, obtained from the National Resource and Environmental Science Data Center of the Chinese Academy of Sciences (http://www.resdc.cn/) (accessed on 25 March 2024), as well as (2) elevation data and slope data sourced from the United States Geological Survey (USGS) (https://www.usgs.gov/) (accessed on 21 March 2024).

2.3. Methods

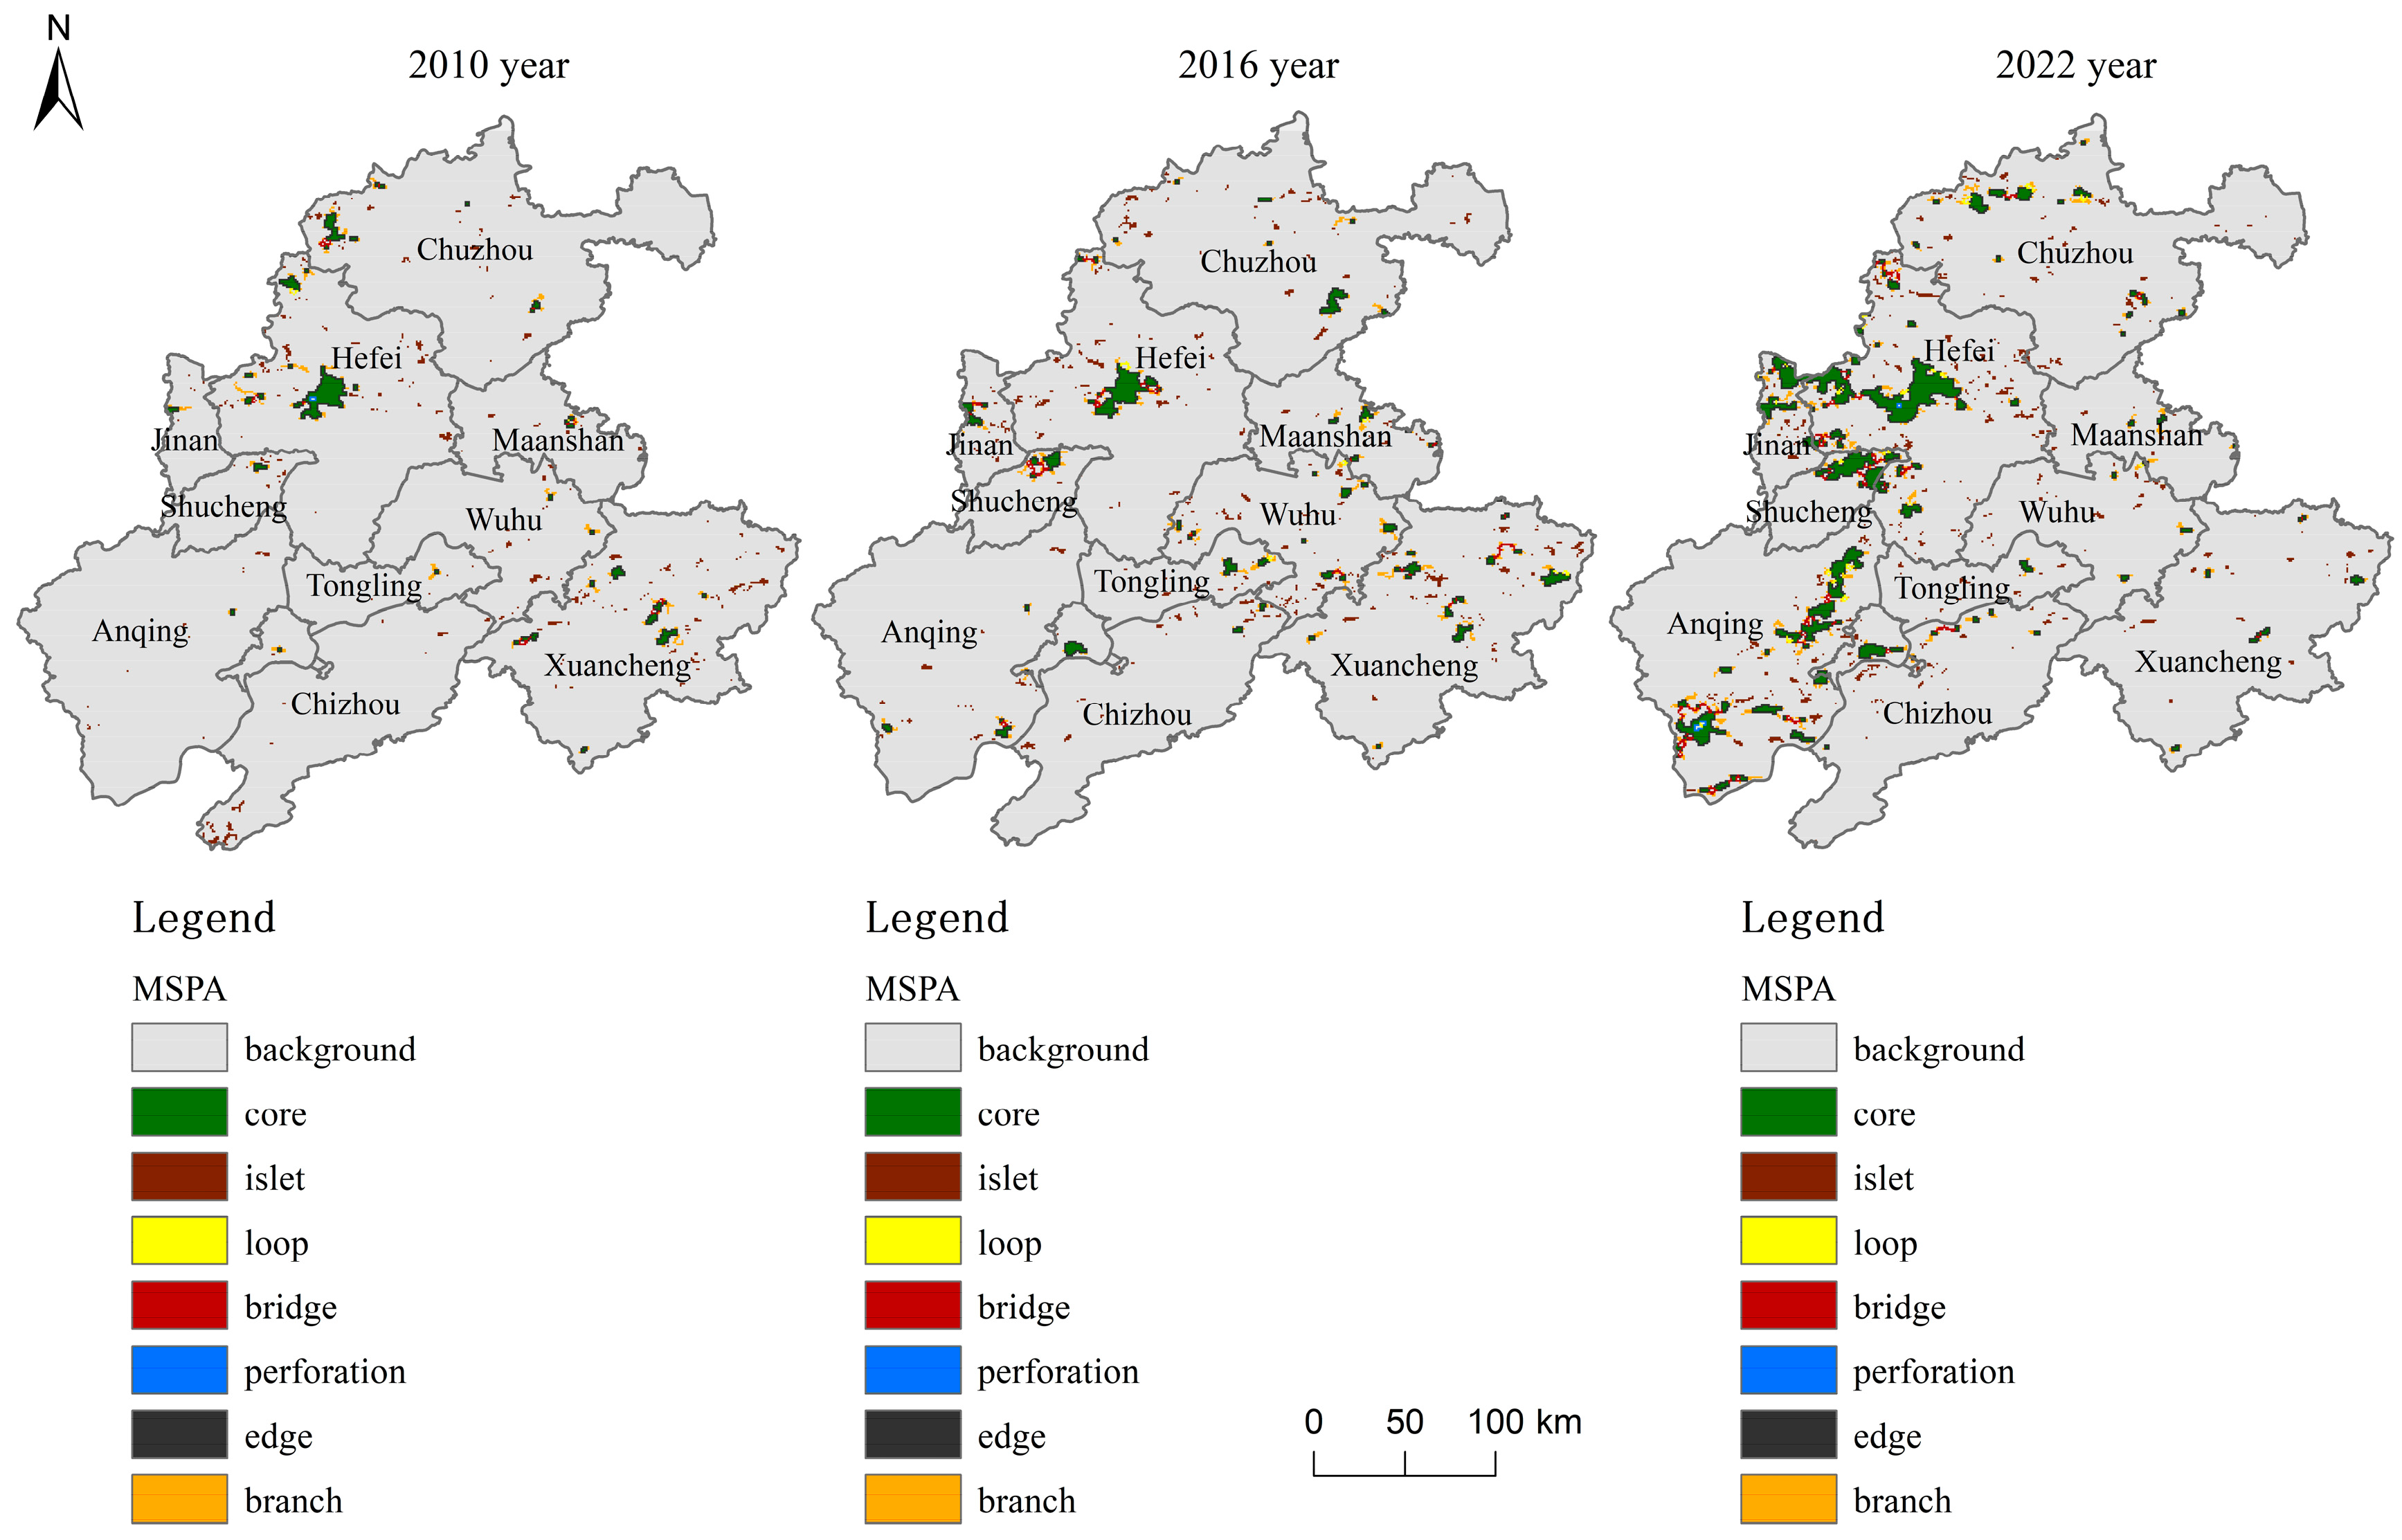
2.3.1. Urban Thermal Environment Source Extraction Based on the MSPA Model

The MSPA model is a method based on mathematical morphology principles, designed to measure, identify, and segment raster images. This method precisely captures structural elements in raster images by considering spatial differentiation patterns and connectivity, extracting seven mutually exclusive pixel patch types: core, island, perforation, edge, loop, bridge, and branch [46,47].
In this study, the MSPA model was employed to categorize UHI patches within urban agglomerations, primarily to analyze and identify spatial patterns of the UHI phenomenon. First, the relative surface temperatures of the Wanjiang urban belt for 2010, 2016, and 2022 were collected, and areas with relative surface temperature exceeding 4 °C were defined as UHI patches, while other areas were classified as non-UHI patches. Next, ArcGIS 10.2’s reclassification tool was used to create a binary raster base map, setting UHI patches as the “foreground” and non-UHI areas as the “background.” Finally, the binary raster base map was imported into Guidos 3.0 software, and using the MSPA model, the foreground was reinterpreted into seven non-overlapping UHI patch types through mathematical analysis. The corresponding classification and spatial morphological characteristics are shown in Table 1.
This study, based on the MSPA model’s identification results from 2010, 2016, and 2022, extracted core area patches larger than 5 km2. Using Conefor 2.6 software, the Probability of Connectivity (PC) and the Importance of Connectivity (dPC) for core area patches in each period were calculated. Core area patches with dPC values of greater than 0.5 were selected as primary urban heat environment sources, while those with dPC values of less than 0.5 were categorized as secondary urban heat environment sources.

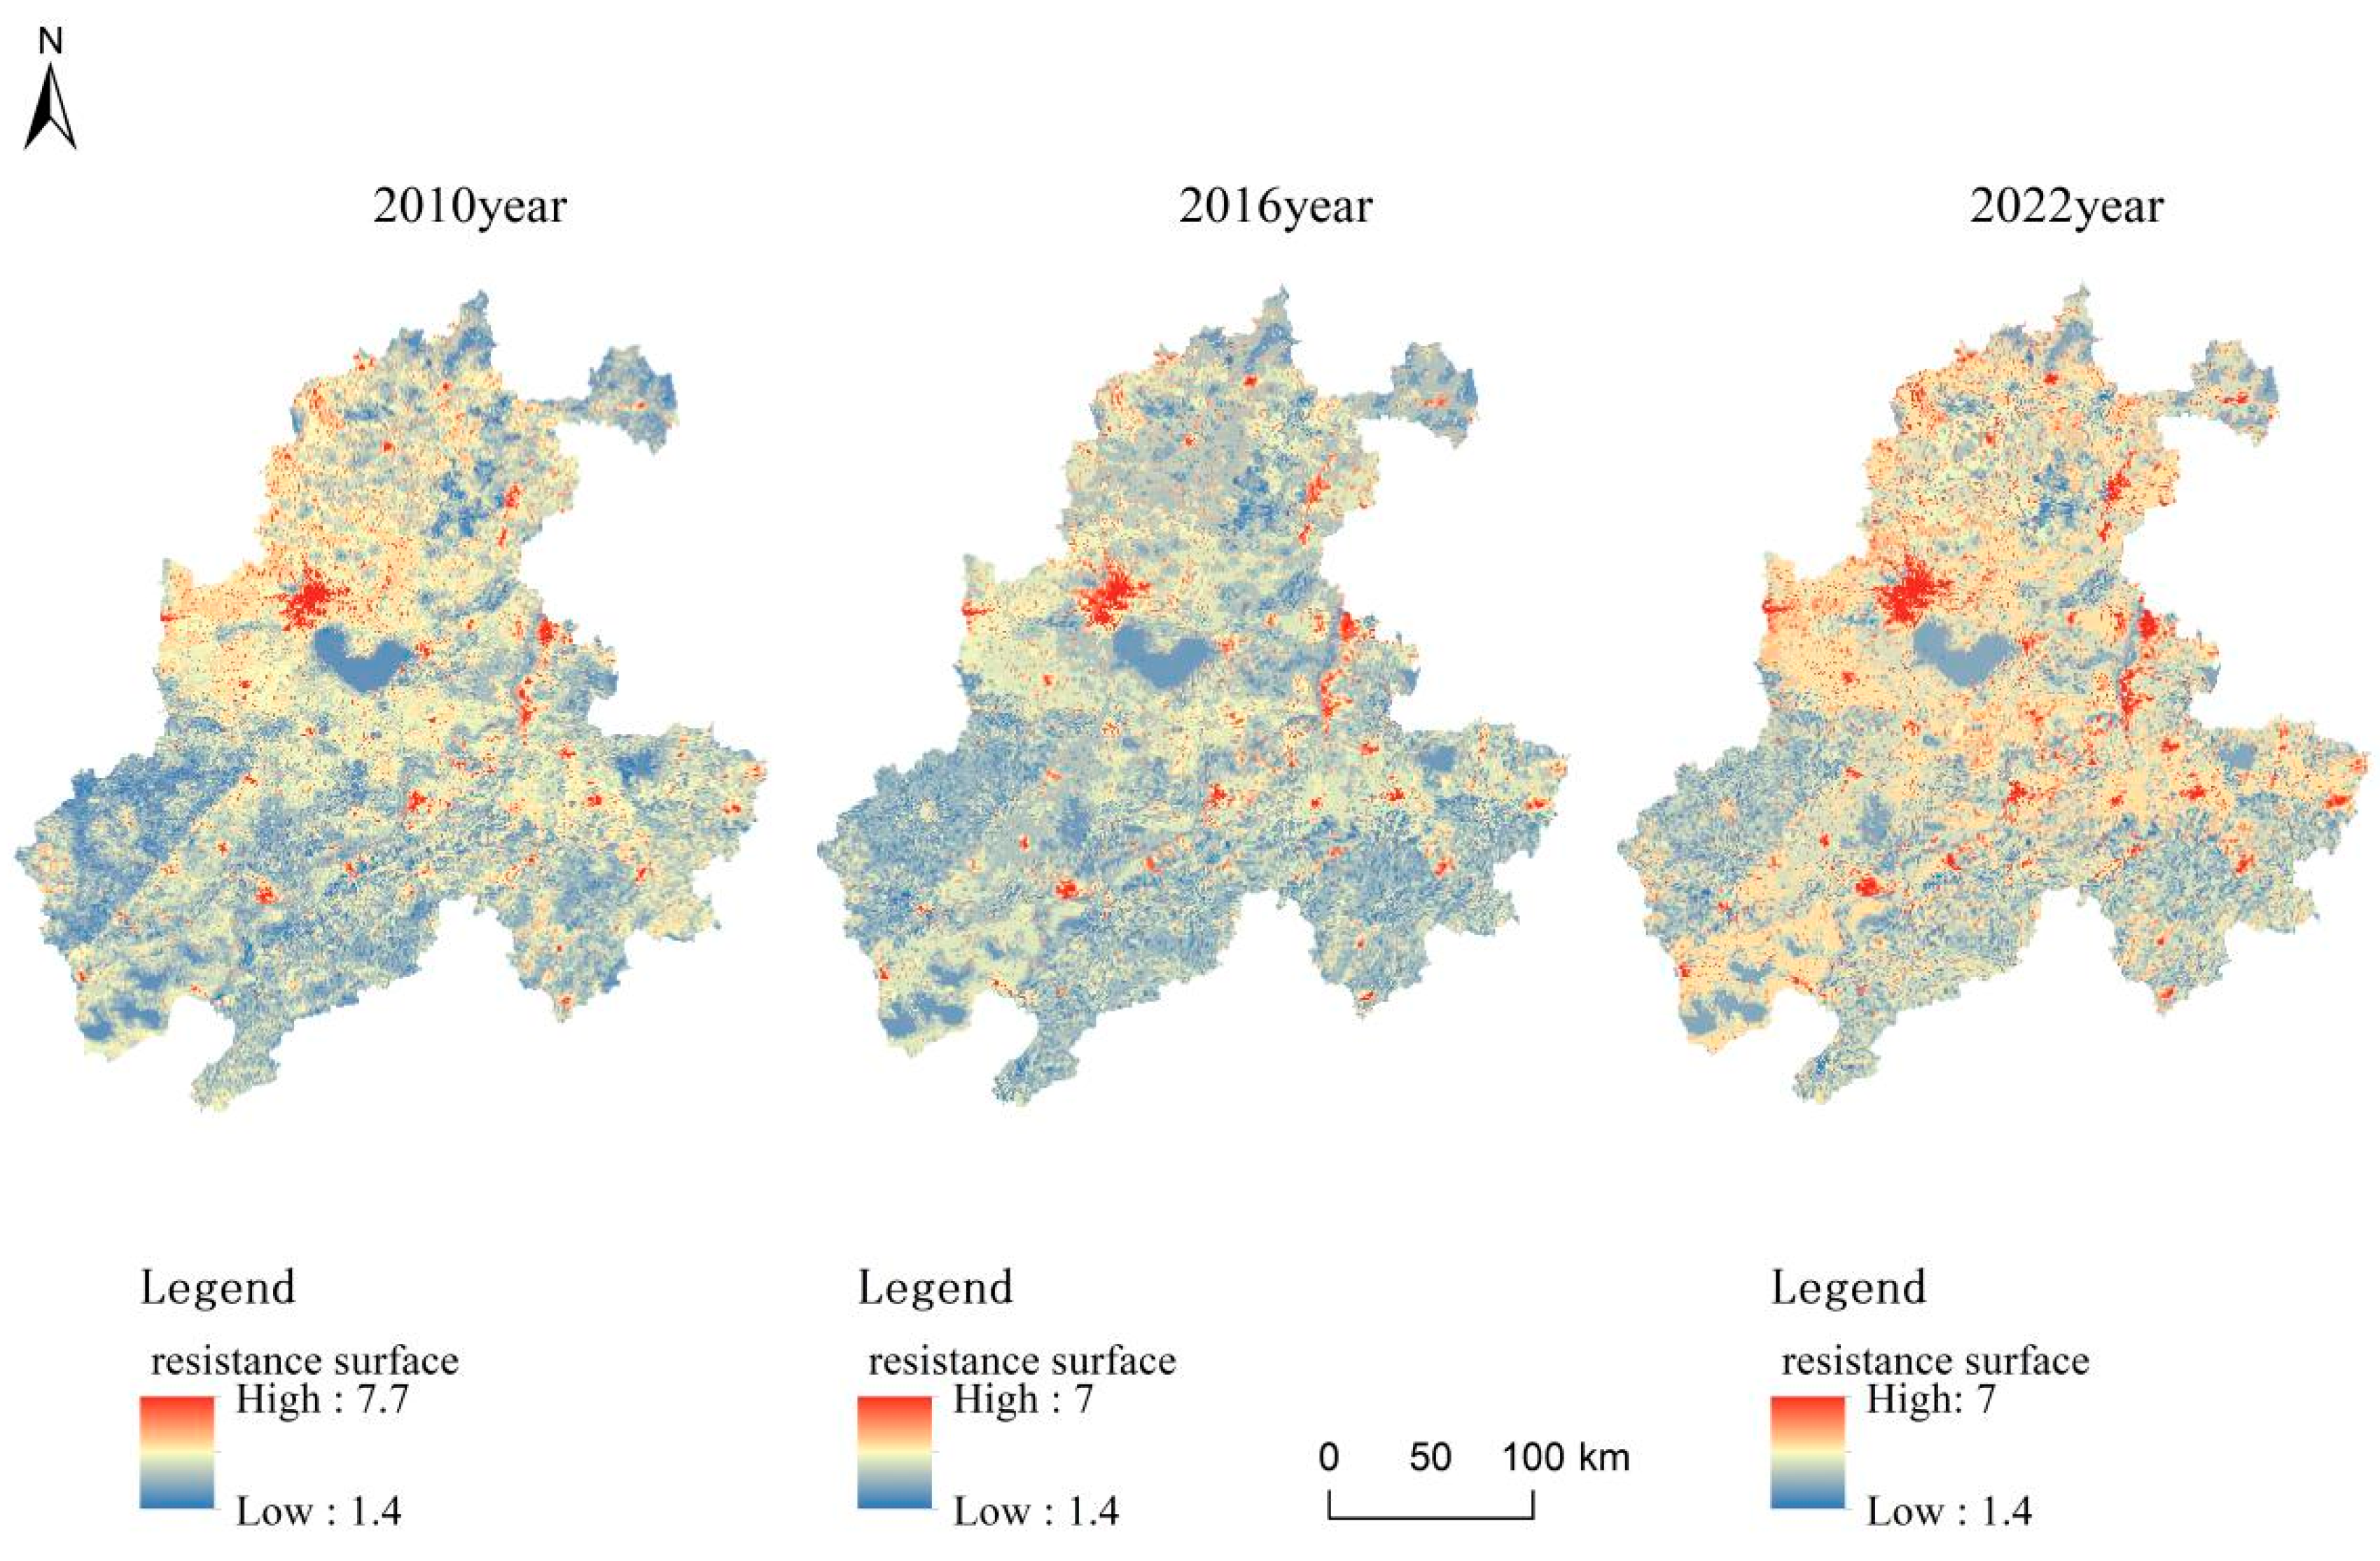
2.3.2. Construction of the Resistance Surface of the Urban Thermal Environment

During random heat diffusion processes, varying degrees of resistance may interfere with the spread of heat. To accurately describe the distribution of resistance to heat diffusion between different thermal environment sources, it is essential to construct resistance surfaces [48,49]. In Table 2, this study constructed resistance surfaces based on the natural environmental conditions of the Wanjiang urban belt, incorporating five key resistance factors: elevation, slope, vegetation cover, land use, and land surface temperature. By referring to relevant literature [50], previous studies [51] and the actual situation of the Wanjiang urban agglomeration, the resistance surface was assigned. Various resistance factors were reclassified by ArcGIS 10.2 software, and corresponding resistance values were assigned to different resistance factors and corresponding index weights were set by using the analytic hierarchy process and the expert scoring method. The combined resistance surface was obtained by weighted summation superposition.
Thermal resistance values are often used to measure the degree to which a particular area or landscape impedes the heat transfer process. The higher the value, the greater the resistance to heat transfer in the region, and the more difficult it is for the heat to spread or pass through the region. On the contrary, the lower the resistance value, the more easily heat is conducted and diffused in the area [52,53]. In this study, the single-factor resistance values were determined based on the actual situation of the Wanjiang urban agglomeration, and the numbers were used to represent different levels of single-factor resistance. The lower the coefficient, the smaller the resistance value. From the perspective of ecological protection, the high-altitude area plays the role of buffering and regulating the thermal environment protection, so its resistance value is low. Generally, forestland, grassland, and water areas have a strong temperature regulation function that can effectively alleviate the heat island effect, so their thermal environmental resistance value is low.

2.3.3. Linkage Mapper-Based Spatial Network Recognition in the Thermal Environment

Extraction of Urban Heat Island Corridors

Constructing urban heat island corridors is an important method for identifying key habitats, improving regional landscape connectivity, and maintaining ecosystem stability [54,55]. The extraction of urban heat island corridors utilizes the Network and Linkage tools in Linkage Mapper. Vector data of thermal environment sources and composite resistance surface raster data were imported into ArcGIS10.2. The cost-weighted distance threshold for truncating urban heat island corridors was set to 10 km. The cost path, which connects thermal environment sources and overcomes the minimum cumulative resistance, was identified as the urban heat island corridor.

Identification of Heat Island Network Pinch Point

As an important part of the urban thermal environment network, the pinch point of a heat island network is an area with a high circulation value in the urban heat island corridor—that is, an area with high current density [56], which reflects the area with a high probability of biological flow passing through during migration or other activities. Based on circuit theory, on the basis of extracting the urban heat island corridor, this study used the Pinchpoint Mapper tool in the Circuitscape program to import the thermal environment source area and comprehensive resistance surface data, selected the “all-to-one” mode, set the distance threshold to 10,000 m, and obtained the current density distribution map. The current density was reclassified from high to low according to the natural breakpoint method, and the value area with the highest current density was selected as the pinch point of the heat island network.

Identification of Heat Island Network Barrier Point

The barrier point of a UHI network is the area in the corridor with the greatest obstacle effect and the area with a higher cumulative current recovery value in the UHI network [57,58]. Based on circuit theory, this study used the Barrier Mapper tool in the Circuitscape program to import ecological source and comprehensive resistance surface data, selected the “maximum” mode, and set the minimum search radius as 1000 m and the maximum search radius as 4000 m. The cumulative current recovery value in the corridor was reclassified from high to low according to the natural breakpoint method, and the highest-value area was selected as the barrier point of the heat island network.

3. Results and Analysis

3.1. Spatial Distribution Characteristics of Urban Heat Island Patch Types

This study, based on the MSPA model, identified UHI patches in the Wanjiang urban belt and categorized them into seven types of UHI patches. As shown in Figure 2, from the analysis of the data from 2010 to 2022, it is evident that UHI patches are primarily distributed in the northwest and southeast parts of the Wanjiang urban belt, with a significant increase in total area over time. In 2010, the UHI patches were mainly concentrated in Hefei and Xuancheng cities. These patches were relatively large in size and densely distributed, indicating significant heat accumulation in these urban centers. By 2016, the distribution of UHI patches had expanded. While Hefei and Xuancheng remained the primary areas of concentration, smaller patches began to emerge in Jin’an District, Shucheng County, and Anqing city. Additionally, there was a noticeable increase in patch areas in Chuzhou and Wuhu cities, although they were more scattered compared to the concentrated patches in other areas. In 2022, the UHI patches were predominantly found in Hefei, Jin’an District, Shucheng County, and Anqing city, where the patches remained relatively large and densely distributed. There was a particularly notable increase in patch areas in Anqing and Chuzhou cities, while Xuancheng saw a decrease in patch area. This shift reflects a dynamic change in the spatial distribution of UHIs across the Wanjiang urban belt, with some regions experiencing intensification and others, such as Xuancheng, seeing a reduction.
By 2022, the dominant type of UHI patch in the Wanjiang urban agglomeration had shifted from isolated to core-type patches. In 2022, core-type UHI patches became the most prevalent, primarily concentrated in the western part of Hefei, the northeastern part of Shucheng County, and the eastern part of Anqing city, with a smaller concentration in the southwestern part of Chuzhou city. Core-type UHI patches were the most dominant in 2022. They were densely concentrated in the western regions of Hefei, northeastern Shucheng County, and eastern Anqing City, with minor occurrences in the southwestern parts of Chuzhou city. This shift towards core-type patches indicates areas of intensified heat accumulation and more centralized urban heat sources. Edge-type and isolated-type UHI patches were the next most common types, predominantly distributed in the western part of the Wanjiang urban agglomeration. These patches were mainly concentrated in Hefei, Shucheng County, and the eastern parts of Anqing city. Their distribution suggests transitional areas where urban heat extends into less densely built or vegetated regions. Perforation-type UHI patches had the smallest area in 2022, indicating that these types of patches, which typically form in areas with more heterogeneous land use or fragmented urban structures, were less prevalent compared to other types. Between 2010 and 2022, core-type and edge-type UHI patches showed the most significant increases in area, reflecting the expansion and densification of urbanized and heated zones. Meanwhile, loop-type patches experienced the fastest growth rate, suggesting the development of ring-like urban heat patterns possibly related to urban sprawl or circular expansion patterns around major urban centers.

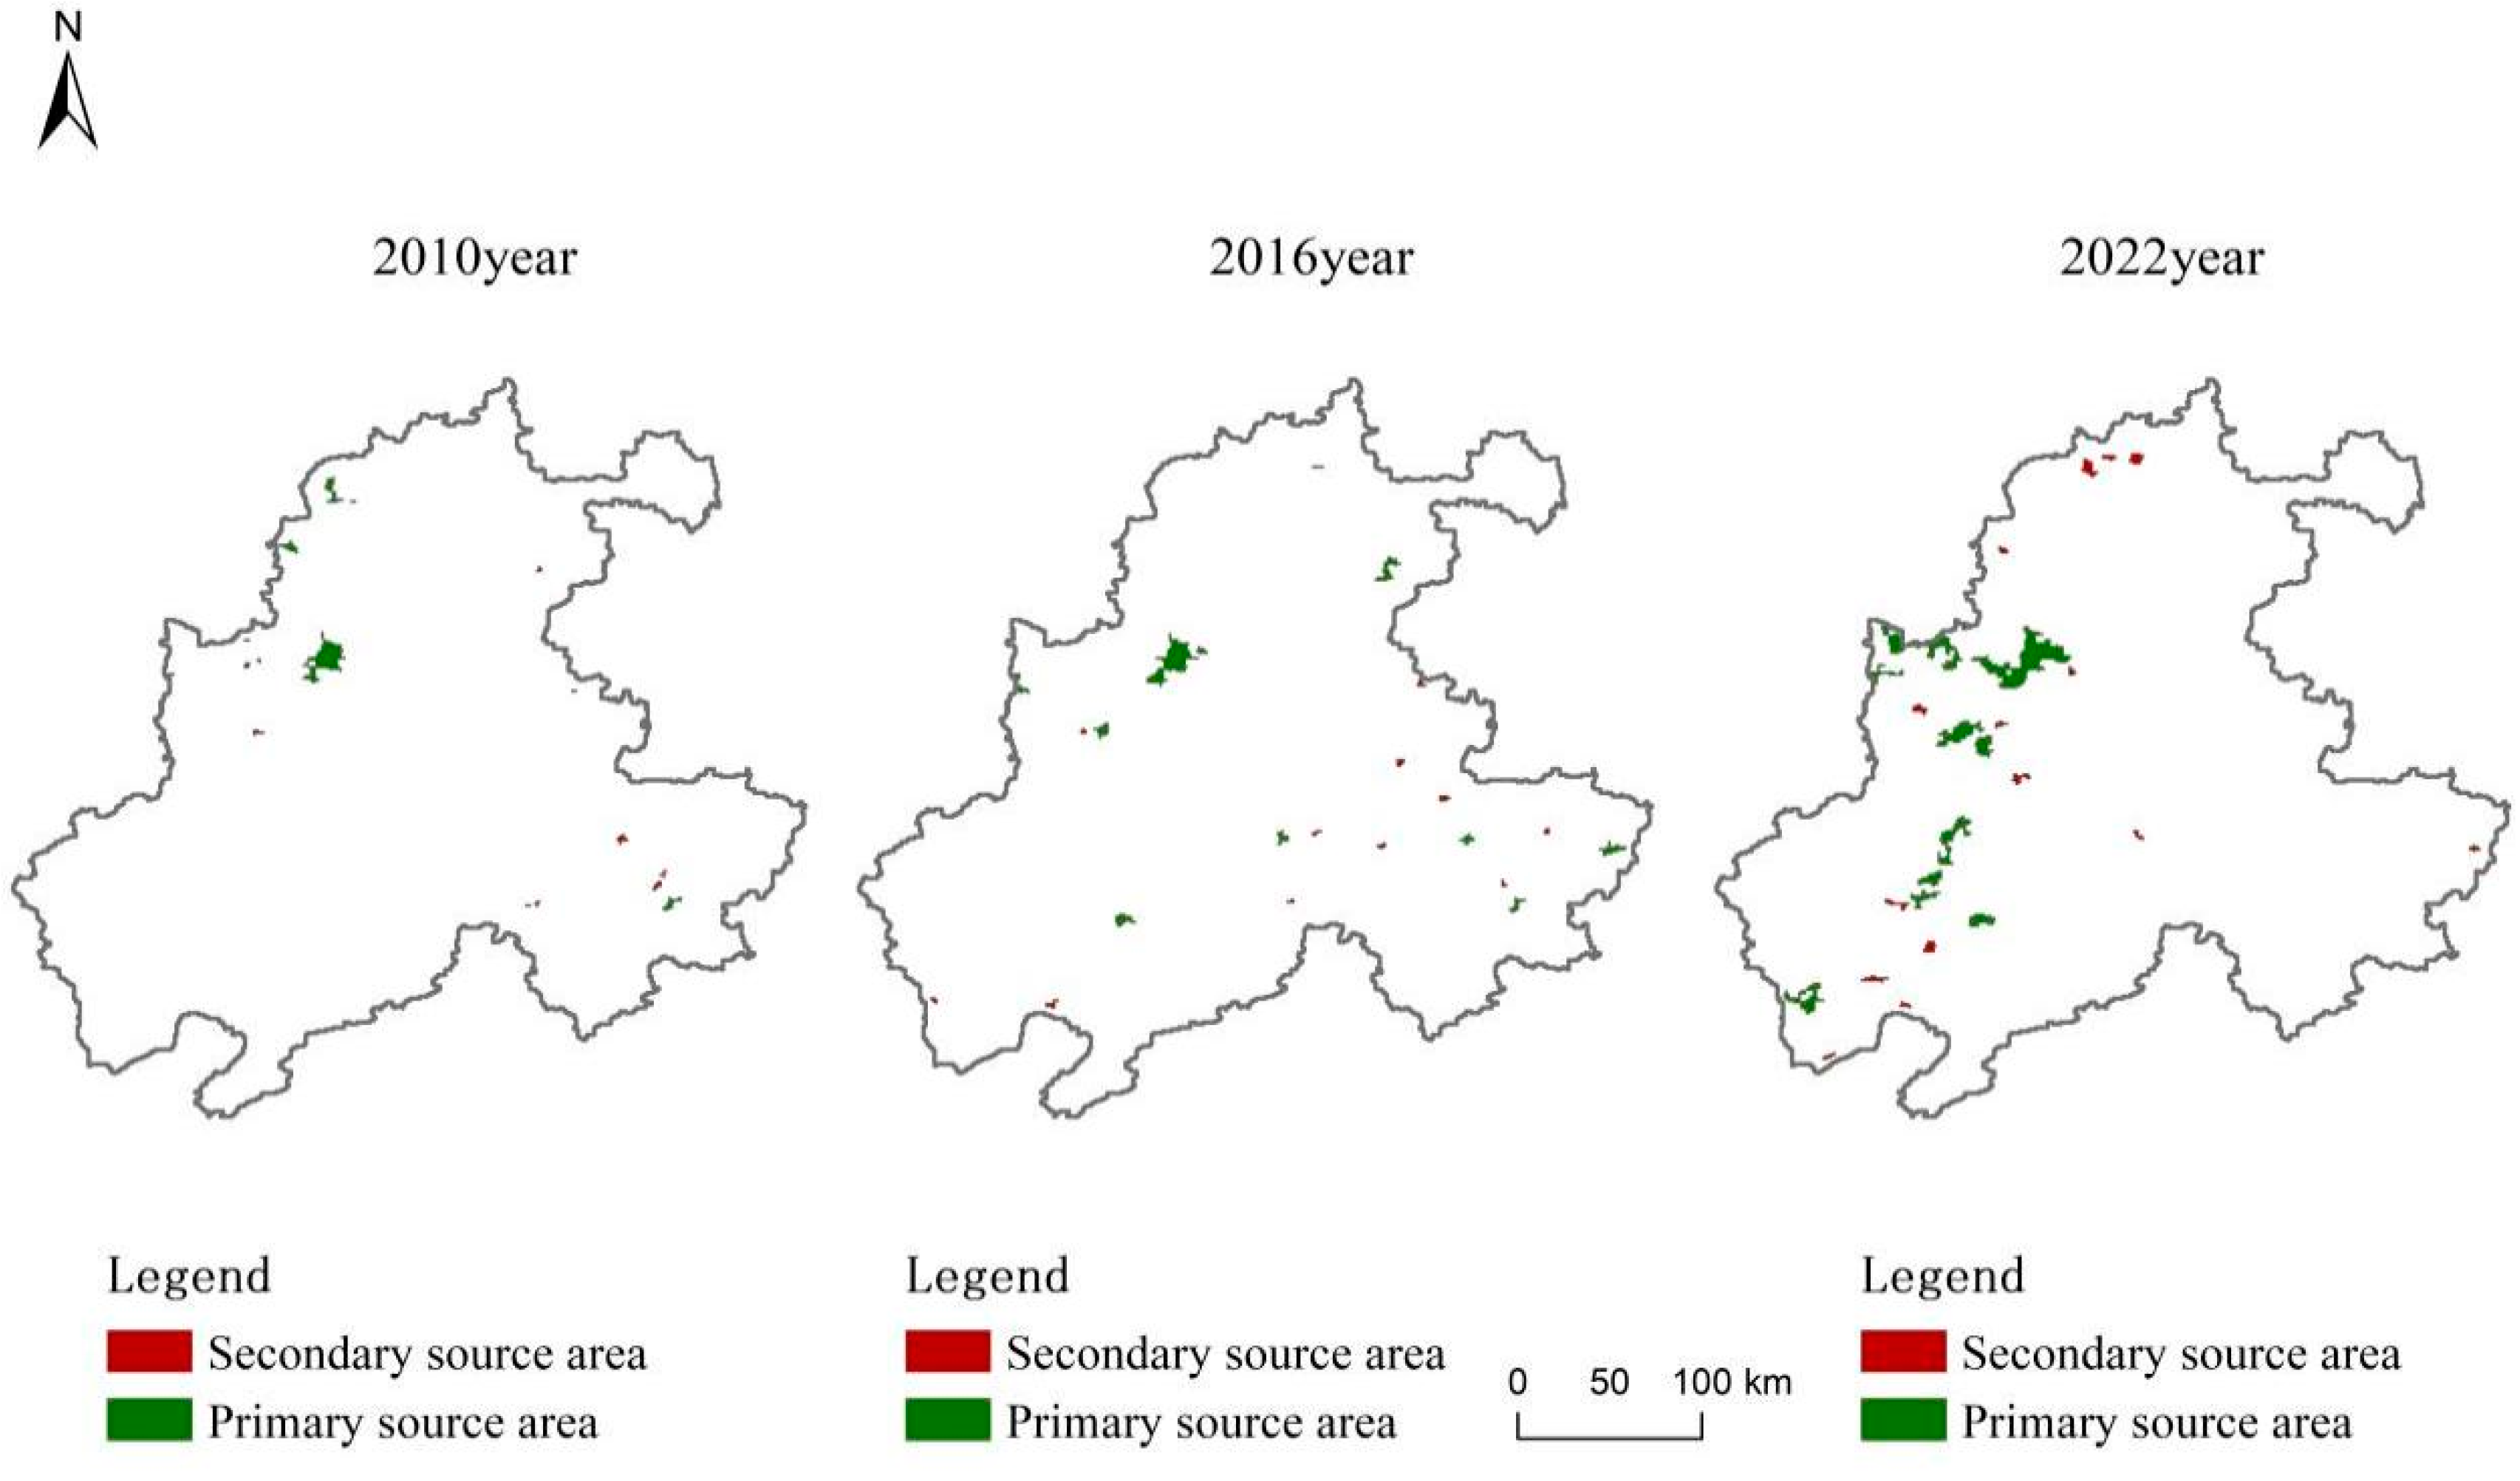
3.2. Urban Thermal Environment Source Extraction

This study utilized the MSPA model’s results from 2010, 2016, and 2022 to extract urban thermal environment sources using software. The extracted sources represent critical areas that significantly influence the connectivity and dynamics of the urban thermal environment.
As can be seen from Figure 3, in 2010, the primary urban thermal environment sources were mainly concentrated in the central part of Hefei, with smaller concentrations in Chuzhou and Xuancheng. Specifically, there were four primary sources identified in Hefei, two in Chuzhou, and one in Xuancheng. The secondary sources were more numerous but had smaller patch areas, scattered across the northwestern and eastern regions of the urban agglomeration. These patches indicate areas with relatively lower connectivity importance but that still play a role in the broader network structure. In 2016, the primary sources showed a shift in distribution and expansion. Two primary sources were located in Hefei, one in Chuzhou, three in Xuancheng, one in Anqing, one in Shucheng County, two in Jin’an District, and one in Tongling. Secondary sources remained scattered, primarily distributed in the southern parts of the urban agglomeration, further indicating fragmented and less connected thermal environment patches in these areas. In 2022, there was a noticeable shift in the distribution of primary sources, with five located in Anqing, two in Jin’an District, two in Hefei, and two in Shucheng County. The secondary sources became more numerous and remained scattered, primarily in the western parts of the urban agglomeration, with key distributions in Chuzhou, Hefei, and Anqing. This pattern suggests a wider spread of lower-connectivity patches, possibly reflecting urban expansion and landscape fragmentation.

3.3. Construction Results of the Resistance Surface of the Urban Thermal Environment

In this study, the comprehensive resistance surface of Wanjiang urban agglomeration was obtained by constructing five resistance factors, namely, elevation, slope, vegetation cover, land use, and surface temperature, and weighted summing, as shown in Figure 4.
From the analysis of the comprehensive resistance surface for the Wanjiang urban agglomeration from 2010 to 2022, a general trend of higher resistance in the north and lower resistance in the south was observed. The distribution of resistance values across the region reveals the impact of urban development and land use changes over time. High-resistance areas are primarily concentrated in the southwestern and eastern parts of the Wanjiang urban agglomeration. These areas are largely clustered in Hefei, Ma’anshan, and Wuhu cities, with smaller patches of high resistance found in Chuzhou, Tongling, and Anqing cities. The land use in these high-resistance areas is predominantly built-up land, reflecting significant urban development and infrastructure. The expansion of high-resistance zones reached its peak in 2022, indicating a high degree of urban construction and widespread human disturbance in the region from 2010 to 2022. Medium-resistance areas are distributed in patches across the northern and central southern parts of the urban agglomeration. These zones experienced an increase in area between 2010 and 2022. The primary land use in medium-resistance areas is cultivated land, serving as a buffer zone where human activities coexist with the natural environment. These areas represent transitional landscapes that are moderately affected by urbanization and agricultural activities. Regions with low resistance to heat diffusion are mainly distributed in patches in the southern part of Shucheng County, the western part of Anqing city, large areas of Chizhou city, and the southern part of Xuancheng city. The dominant land use types in these low-resistance areas are forest land and water bodies, which naturally help dissipate heat and provide cooling effects. However, from 2010 to 2022, the area of low-resistance zones decreased, indicating a loss of forested land due to the accelerating urbanization process in some areas. Overall, the spatial distribution of resistance values reflects the varying degrees of urban development, land use change, and natural habitat retention across the Wanjiang urban agglomeration.

3.4. Spatial Evolution of the Thermal Environment in the Urban Agglomeration

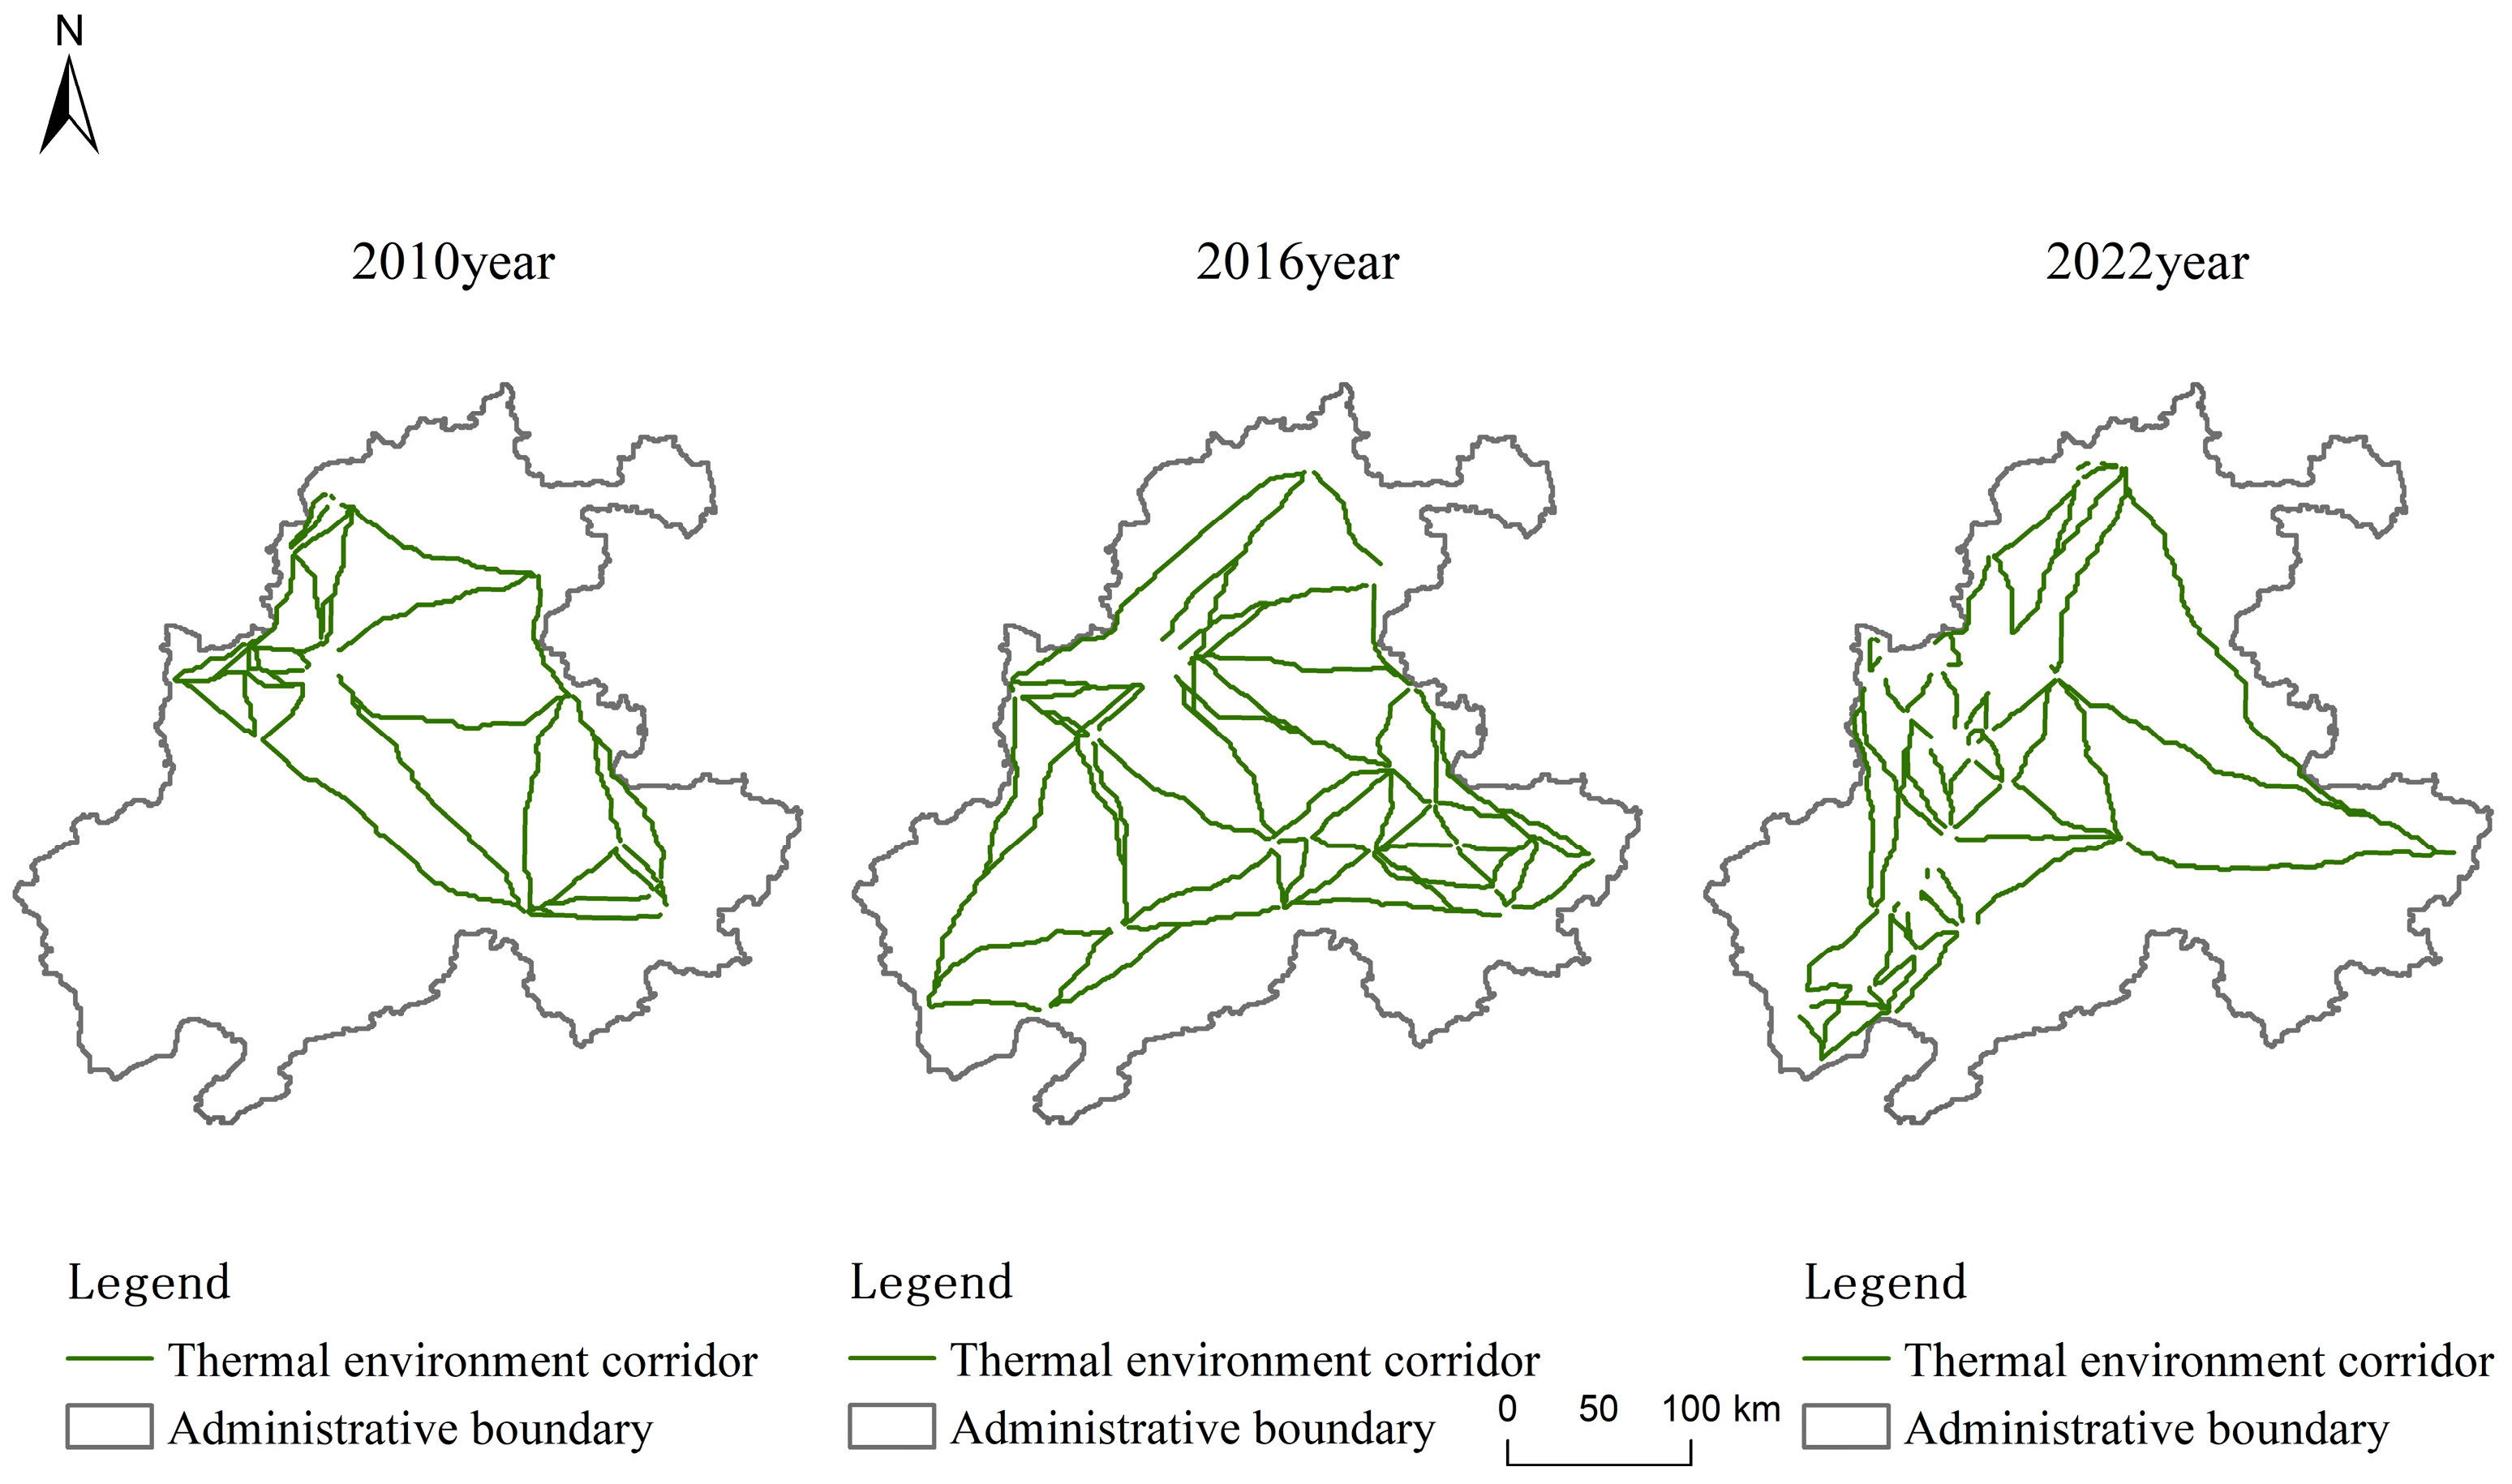
3.4.1. Identification of Heat Island Corridors

Based on the thermal environment source distribution and circuit theory, the thermal environment network of the Wanjiang urban agglomeration from 2010 to 2022 was constructed. Figure 5 shows that the number of corridors in 2010 was 45, distributed in a network in the northern area of the urban agglomeration, with a total corridor length of 2384.8 km, among which the longest corridor, spanning patch 14 and patch 18, was 166.5 km, accounting for 7.0% of the total corridor length. In 2016, the number of corridors was 59. Compared with 2010, the number of corridors increased by 14 in 2016. The total length of the corridors was 4133.8 km, and the distribution was relatively dense, distributed in all cities in the urban agglomeration. In 2022, the number of corridors was 63, and the total length of the corridors was 2950.2 km. The western region mainly followed the “north–south” trend, and the corridors were relatively short, basically connecting with the first-level heat island source area. The eastern region showed an obvious “east–west” trend, and the corridor length was longer than that of the western region, so it is necessary to strengthen the protection of the existing heat island corridor to ensure its smooth flow so as to ensure the exchange of ecological flow and material flow among patches.

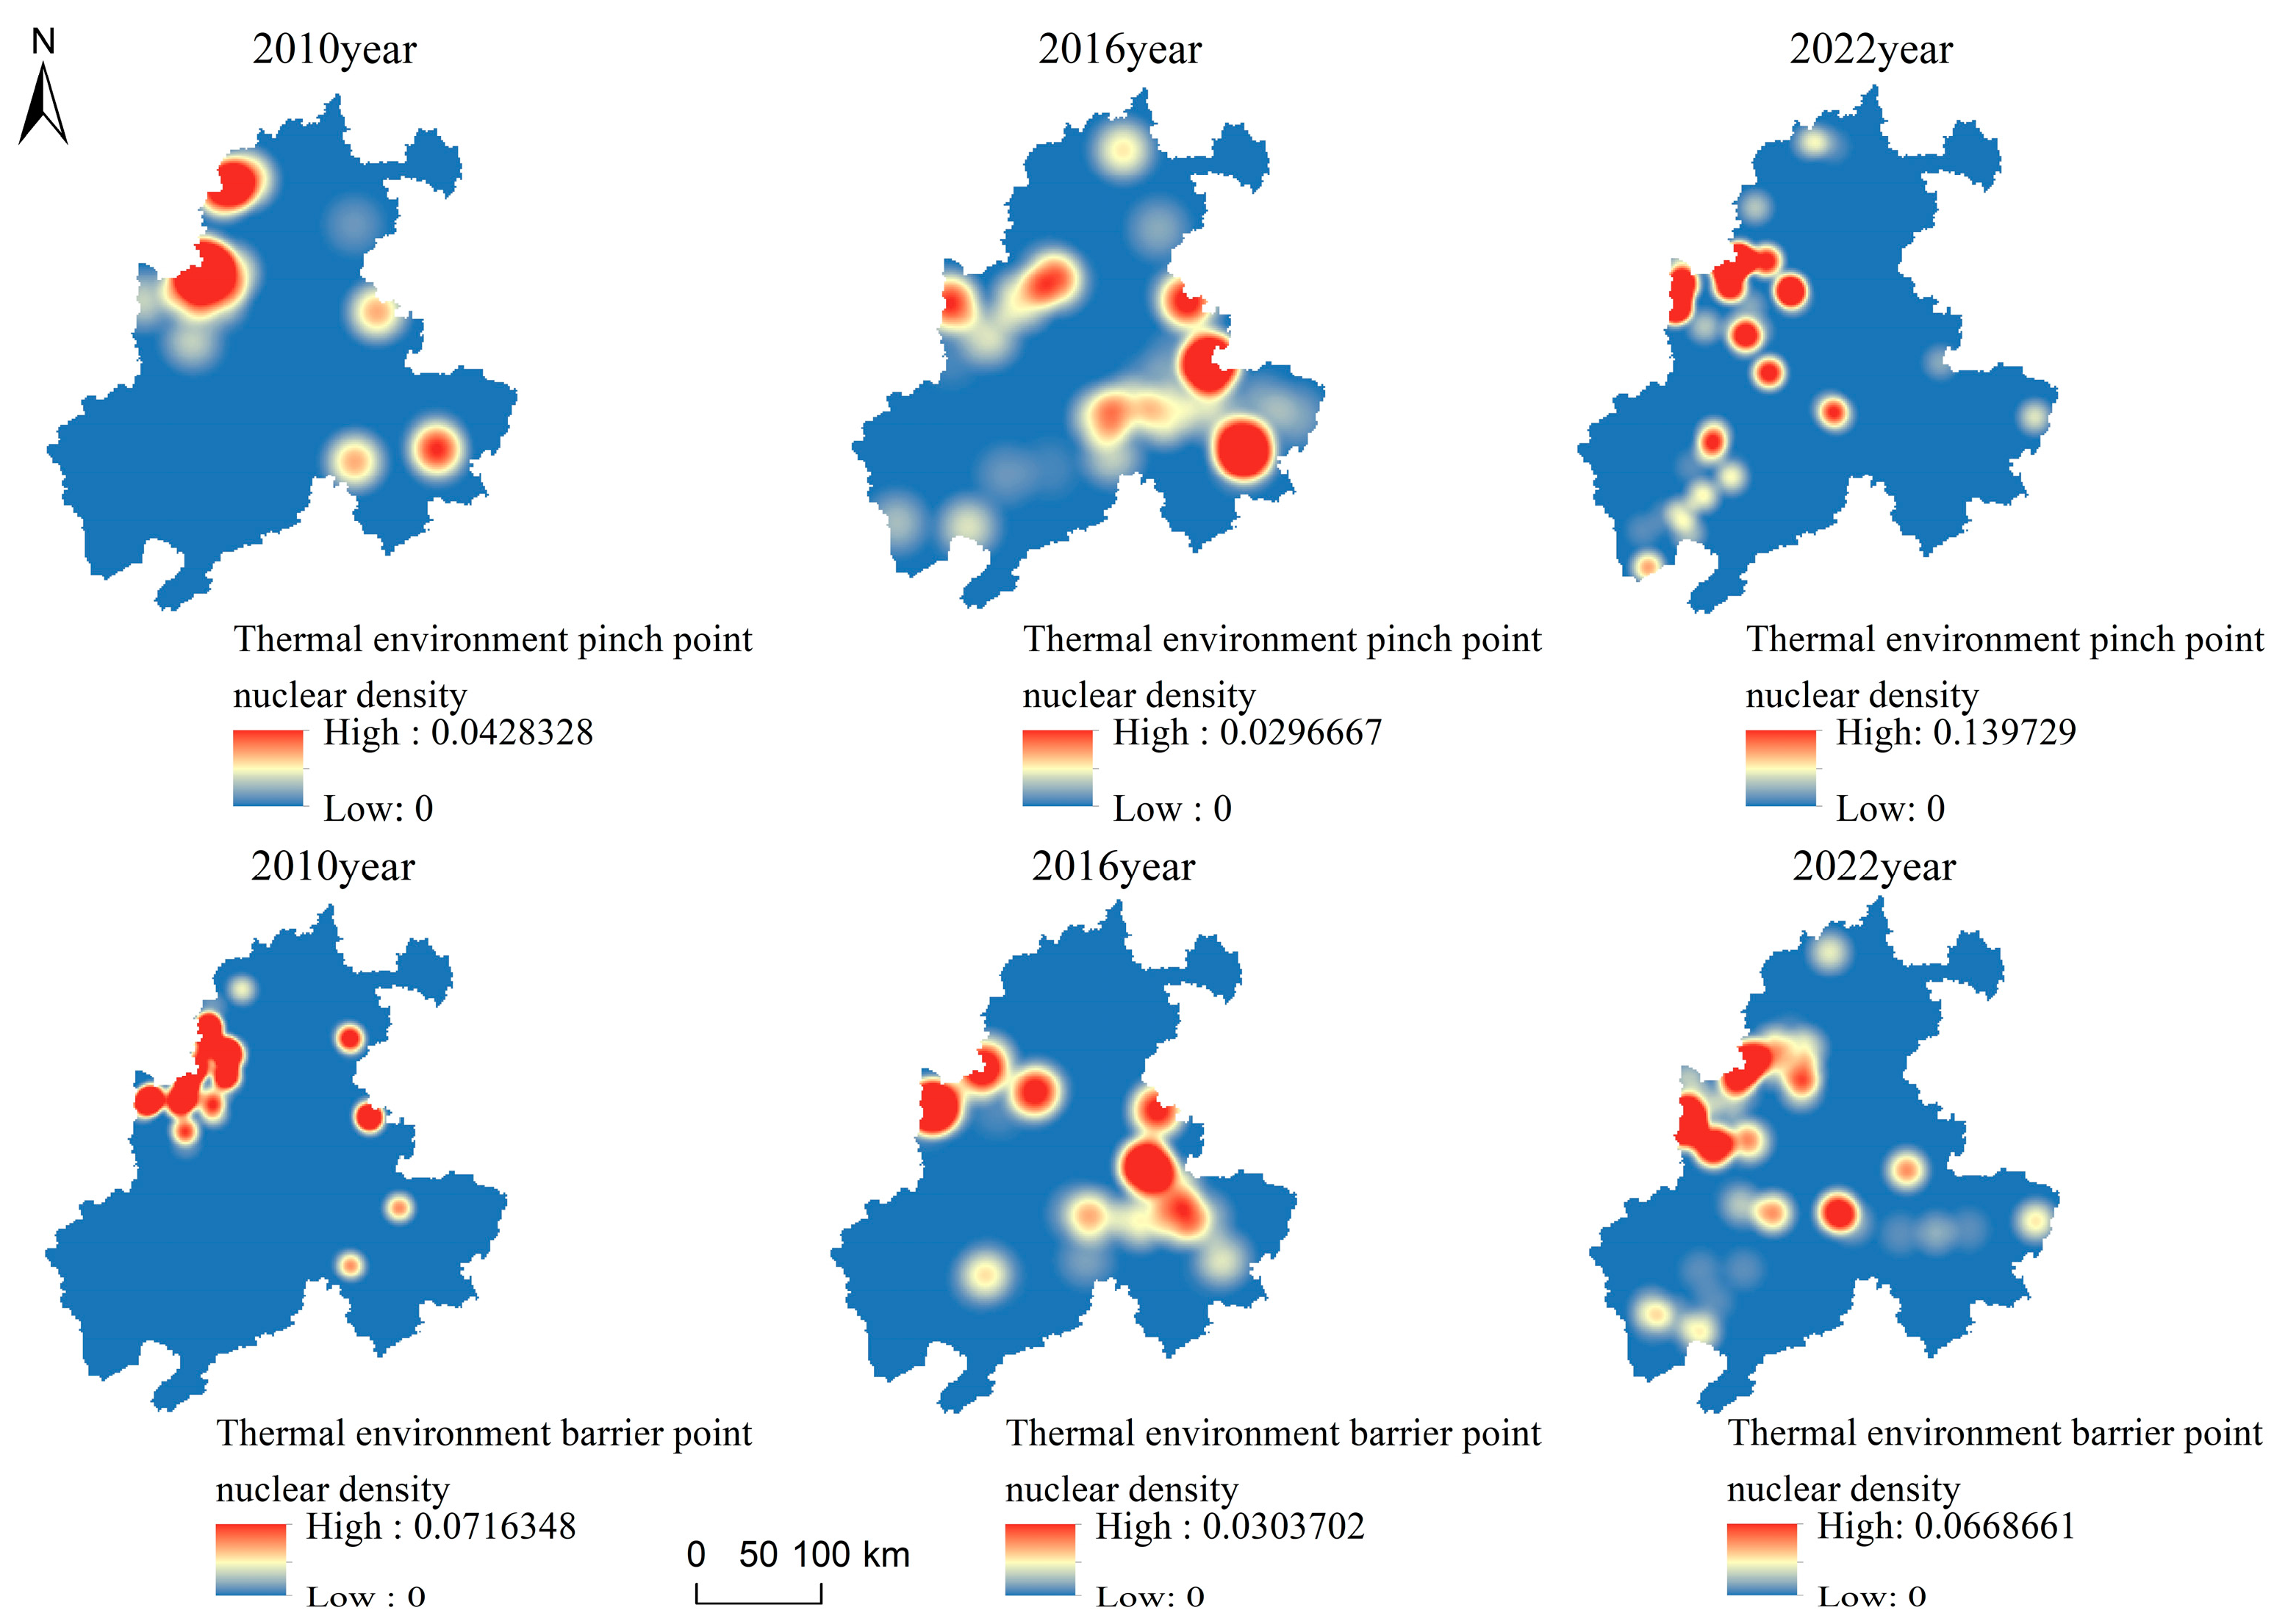
3.4.2. Extraction of Pinch Points in the Heat Island Network

The pinch area of the heat island network is the area with the largest amount of current passing through the corridor, which proves that the ecological circulation in this area is the most frequent, and there is a greater possibility of biological migration [58,59]. In this paper, the cumulative current value was classified by circuit theory. The area with the highest current value is the pinch point of the heat island network.
In Figure 6, the results show that in 2010, the areas with high current density were mainly distributed in the thermal environment corridor connecting Chuzhou and Hefei. There were 147 heat island network pinch points in the Wanjiang urban agglomeration, mainly distributed in the northwestern area of the urban agglomeration, among which the distribution was most concentrated in Hefei, where the current density was high and the cumulative resistance value needed to be overcome by ecological flow transfer was relatively small. In the eastern area, Ma’anshan city and Xuancheng city, there were a few distribution points, mostly located at the end and turning points of the corridor. In 2016, the areas with high current density were mainly distributed in the thermal environment corridors connecting Hefei with Jin’an County, Chuzhou, Ma’anshan, and Wuhu. There were 196 group heat island network pinch points in Wanjiang city, mainly distributed in the western and southeastern areas of the urban agglomeration. The number of pinch points in Hefei decreased, while the number of pinch points in Xuancheng city, Ma’anshan city, Wuhu city, and Tongling city increased and were distributed evenly. This indicates that the awareness of the importance of ecological environmental protection in this region improved during 2010–2016 and the ecological protection work continued to deepen. In 2022, the areas with high current density were mainly distributed in the western and southern thermal environment corridors of the study area, which were mainly reflected in the corridors connecting Chuzhou to Jin’an County, Shucheng County to Tongling County, and various thermal environment pinch points in Anqing. There were 254 heat island network pinch points in the Wanjiang urban agglomeration, mainly distributed in the western cities of the urban agglomeration, with Hefei, Jin’an District, Shucheng County, and Anqing city having the highest concentration, indicating that the regional ecosystem connectivity improved during 2016–2022, with richer natural resources and a better ecological environment.

3.4.3. Extraction of Heat Island Network Barrier Points

Based on circuit theory, this paper reclassified the high-value area of the cumulative current recovery value in the corridor from high to low by using the natural breakpoint method and extracted the first type of high-value area as the barrier point of the heat island network in the Wanjiang urban agglomeration. As can be seen from Figure 7, in 2010, there were 180 heat island network obstacles in the Wanjiang urban agglomeration, mainly distributed in the northwestern region of the urban agglomeration, such as Hefei city and Jin’an District, with a small number scattered in Chuzhou city, Ma’anshan city, Xuancheng city, and Shucheng County. The regional resistance was relatively high, and the land use type was mainly urban construction land, which was generally affected by human activities. There was great resistance to ecological migration. In 2016, a consensus was reached that there were 149 heat island network obstacle points in the Wanjiang urban agglomeration, which were evenly distributed in Hefei, Jin’an District, Ma’anshan city, Wuhu city, Xuancheng city, Tongling city, and the eastern part of Anqing city. The obstacle points were basically located in the primary source area and the surrounding radiation zone, and the land use type was mainly urban construction land and cultivated land, so environmental testing and assessment should be strengthened. The disturbance and damage to the ecosystem needed to be reduced. In 2022, a consensus was reached on 185 heat island network barrier points in the Wanjiang city cluster, mainly distributed in the western cities of the city cluster, among which Hefei city, Jin’an District, Shucheng County, and Anqing city had a large number of distribution points. The land use type was mainly cultivated land, and there were barrier points in a few corridors. Reasonable planning of infrastructure construction projects was needed to reduce cutting and blocking of the ecosystem.

3.4.4. Nuclear Density Analysis

In order to further analyze the spatial agglomeration characteristics of the pinch points and obstacle points of the group heat island network in Wanjiang city, the ArcGIS 10.2 kernel density tool was used to conduct a density analysis of the heat island network in the Wanjiang city cluster, and the following density map was generated. The higher the kernel density value was, the more the pinch points and obstacle points were distributed in Wanjiang city.
As shown in Figure 8, the results show that the core density values of the pinch point and barrier point of the heat island network in the Wanjiang urban agglomeration were significantly different in different regions and different study periods. In 2010, the high pinch density area of the UHI network in the Wanjiang urban agglomeration was mainly distributed in the west of Hefei city and Chuzhou city, indicating that the current density in this area was higher, the distribution of UHI network pinch points was concentrated, and the number of pinch points was large, followed by the central area of Xuancheng city. The medium- and high-density areas were mainly distributed in the southwest of the Xuancheng and Ma’anshan areas, and the other cities had low nuclear density and a wide distribution range. In 2016, the UHI pinch points of Wanjiang urban agglomeration were mainly distributed in the northeast of Ma’anshan city, Xuancheng city, and Wuhu city, indicating that the number of UHI pinch points in this region was relatively large and concentrated, which may be related to the implementation of ecological protection work in this region. The high-density areas were distributed in a small part of Jin’an District, Hefei city, Tongling city, and Wuhu city. The medium-density area was mainly distributed in Chuzhou, Shucheng County, and a small part of Anqing city. In 2022, the UHI pinch points of the Wanjiang city cluster were distributed in Hefei, Jin’an District, Shucheng County, Anqing city, and Tongling city, indicating that the spatial distribution of UHI pinch points in this region was relatively concentrated. Medium-density areas were mainly distributed in the west of Chuzhou city and the south of Anqing city.
In 2010, the high-density area of heat island network barrier points in the Wanjiang city cluster was mainly distributed in the west of the city cluster, with a large area in the west of Hefei city and the north of Jin’an District, and a small amount in Chuzhou city and Ma’anshan city. The medium- and high-density areas were mainly distributed in the west of Xuancheng city, followed by the west of Chuzhou city. In 2016, the area with a high density of heat island network barrier points in the Wanjiang urban agglomeration increased compared with 2010 and were mainly distributed in Hefei, Jin’an District, Ma’anshan city, and Wuhu city, with a small amount distributed in the west of Xuancheng city, indicating the rapid development of urbanization, industry, and agriculture in this region. The high-density area was mainly distributed in Tongling city and Anqing city, followed by the medium-density area, and a small amount was distributed in Xuancheng city. In 2022, the areas with a high density of heat island network barrier points in the Wanjiang city cluster were mainly distributed in Hefei, Jin’an District, Shucheng County, and Tongling city. It is necessary to strengthen the awareness of ecological environmental protection and change the development mode to one such as green production. The range of medium-high density areas has increased and is mainly distributed in a small part of Hefei, Shucheng County, Tongling city, Anqing city, and Wuhu city. It is necessary to increase investment in environmental protection, strengthen environmental governance and restoration, and improve the quality of the ecological environment. From 2010 to 2022, the nuclear density value of other cities was low, which means that the ecosystem in the region is generally in good health, with effective protection of natural resources, high environmental quality, rational use of resources, effective ecological protection and restoration measures, and strong public awareness of environmental protection.

4. Discussion

4.1. Evaluation of the Overall Connectivity of Thermal Environment Networks

Global connectivity reflects the overall complexity and connectivity of the network space, and maps the physical and logical connections between nodes and edges. In the evaluation research of complex cyberspace, the α index, β index, and γ index are commonly used topological indices for quantitative evaluation [59,60]. In this paper, the above three indexes were selected to evaluate the overall connectivity of the thermal environmental network of the Wanjiang urban agglomeration. The expression is as follows:
α = L N + 1 2 N 5
β = L N
γ = L L max = L 3 ( N 2 )
where α represents the network closure, reflecting the degree of closure in the thermal environment network, and its value range is [0, 1]; β is the network connectivity, reflecting the average number of connections in the thermal environment source area in the thermal environment network, and its value range is [0, 3]; γ is the network connectivity rate, reflecting the degree to which all thermal environment sources in the thermal environment network are connected, and its value range is [0, 1]; N represents the number of thermal environment sources (nodes); L represents the number of thermal environment corridors (sides) in urban agglomerations; and Lmax represents the maximum number of possible connected thermal environmental corridors in urban agglomerations.
According to the number of thermal environmental sources (N) and the number of thermal environmental corridors (L), the α, β, and γ indices were calculated to evaluate the overall connectivity of the thermal environmental network in the Wanjiang urban agglomeration.
As shown in Figure 9, the α index was 0.743, 0.787, and 0.902 in 2010, 2016, and 2022, respectively, indicating that the degree of closure in the Wanjiang urban agglomeration was gradually enhanced and that the number of thermal environment network circuits gradually increased. The β index was 2.25, 2.33, and 2.56 in 2010, 2016, and 2022, respectively, indicating that the average number of thermal environmental source area connections in the Wanjiang urban agglomeration increased gradually and that the network connection of the thermal environment gradually improved. The γ index was 0.833, 0.84, and 0.937 in 2010, 2016, and 2022, respectively, reflecting the gradual improvement of the interconnection degree of thermal environmental sources in the Wanjiang urban agglomeration. In general, the α, β, and γ indices increased over time, indicating that the overall connectivity of the thermal environment network in the Wanjiang urban agglomeration was continuously enhanced, the heat transmission efficiency between source areas was gradually improved, and the high-temperature threat degree to urban and rural residents was on the rise. The reasons may be mainly attributed to the following two aspects: First, due to the rapid advancement of urbanization, the area of urban areas was rapidly expanded, which led to the gradual aggregation of the originally dispersed heat island areas and the formation of a larger range of thermal environment network, which shortened the spatial distance between heat island patches and promoted the enhancement of network connectivity. The second is the impact of climate warming, which may have led to the intensification of the urban heat island effect, further promoting the enhancement of thermal environmental network connectivity.

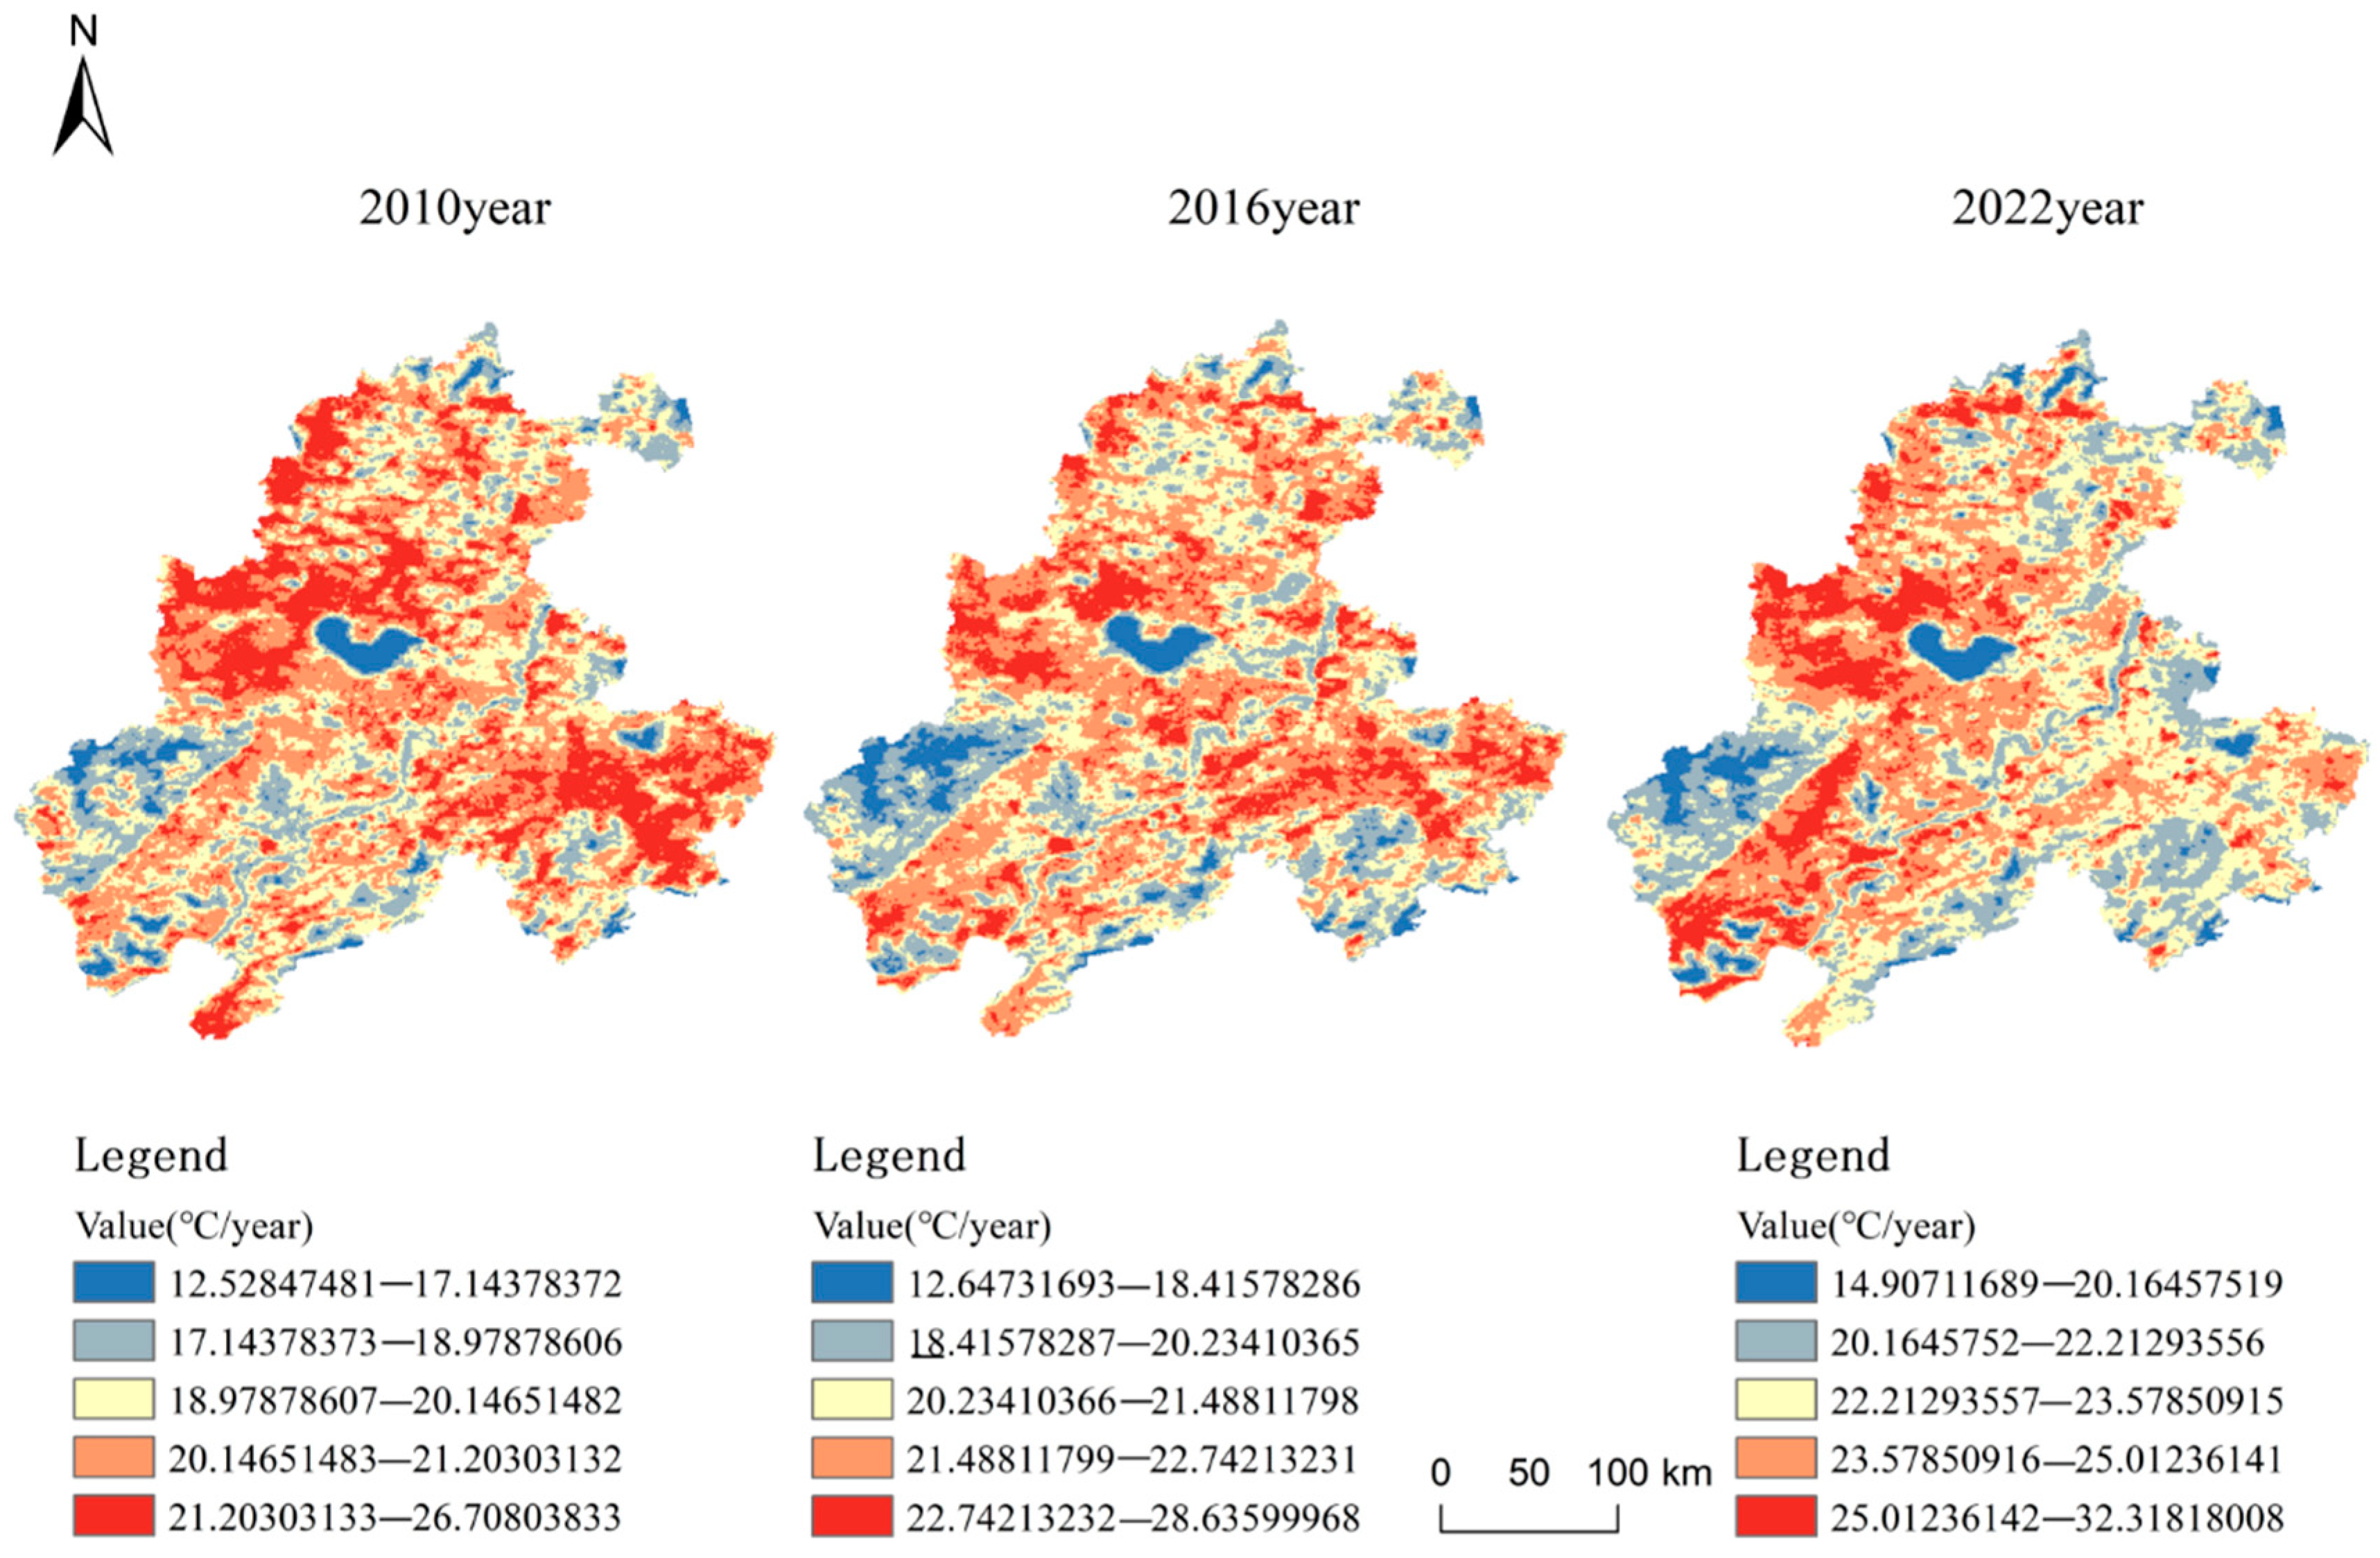
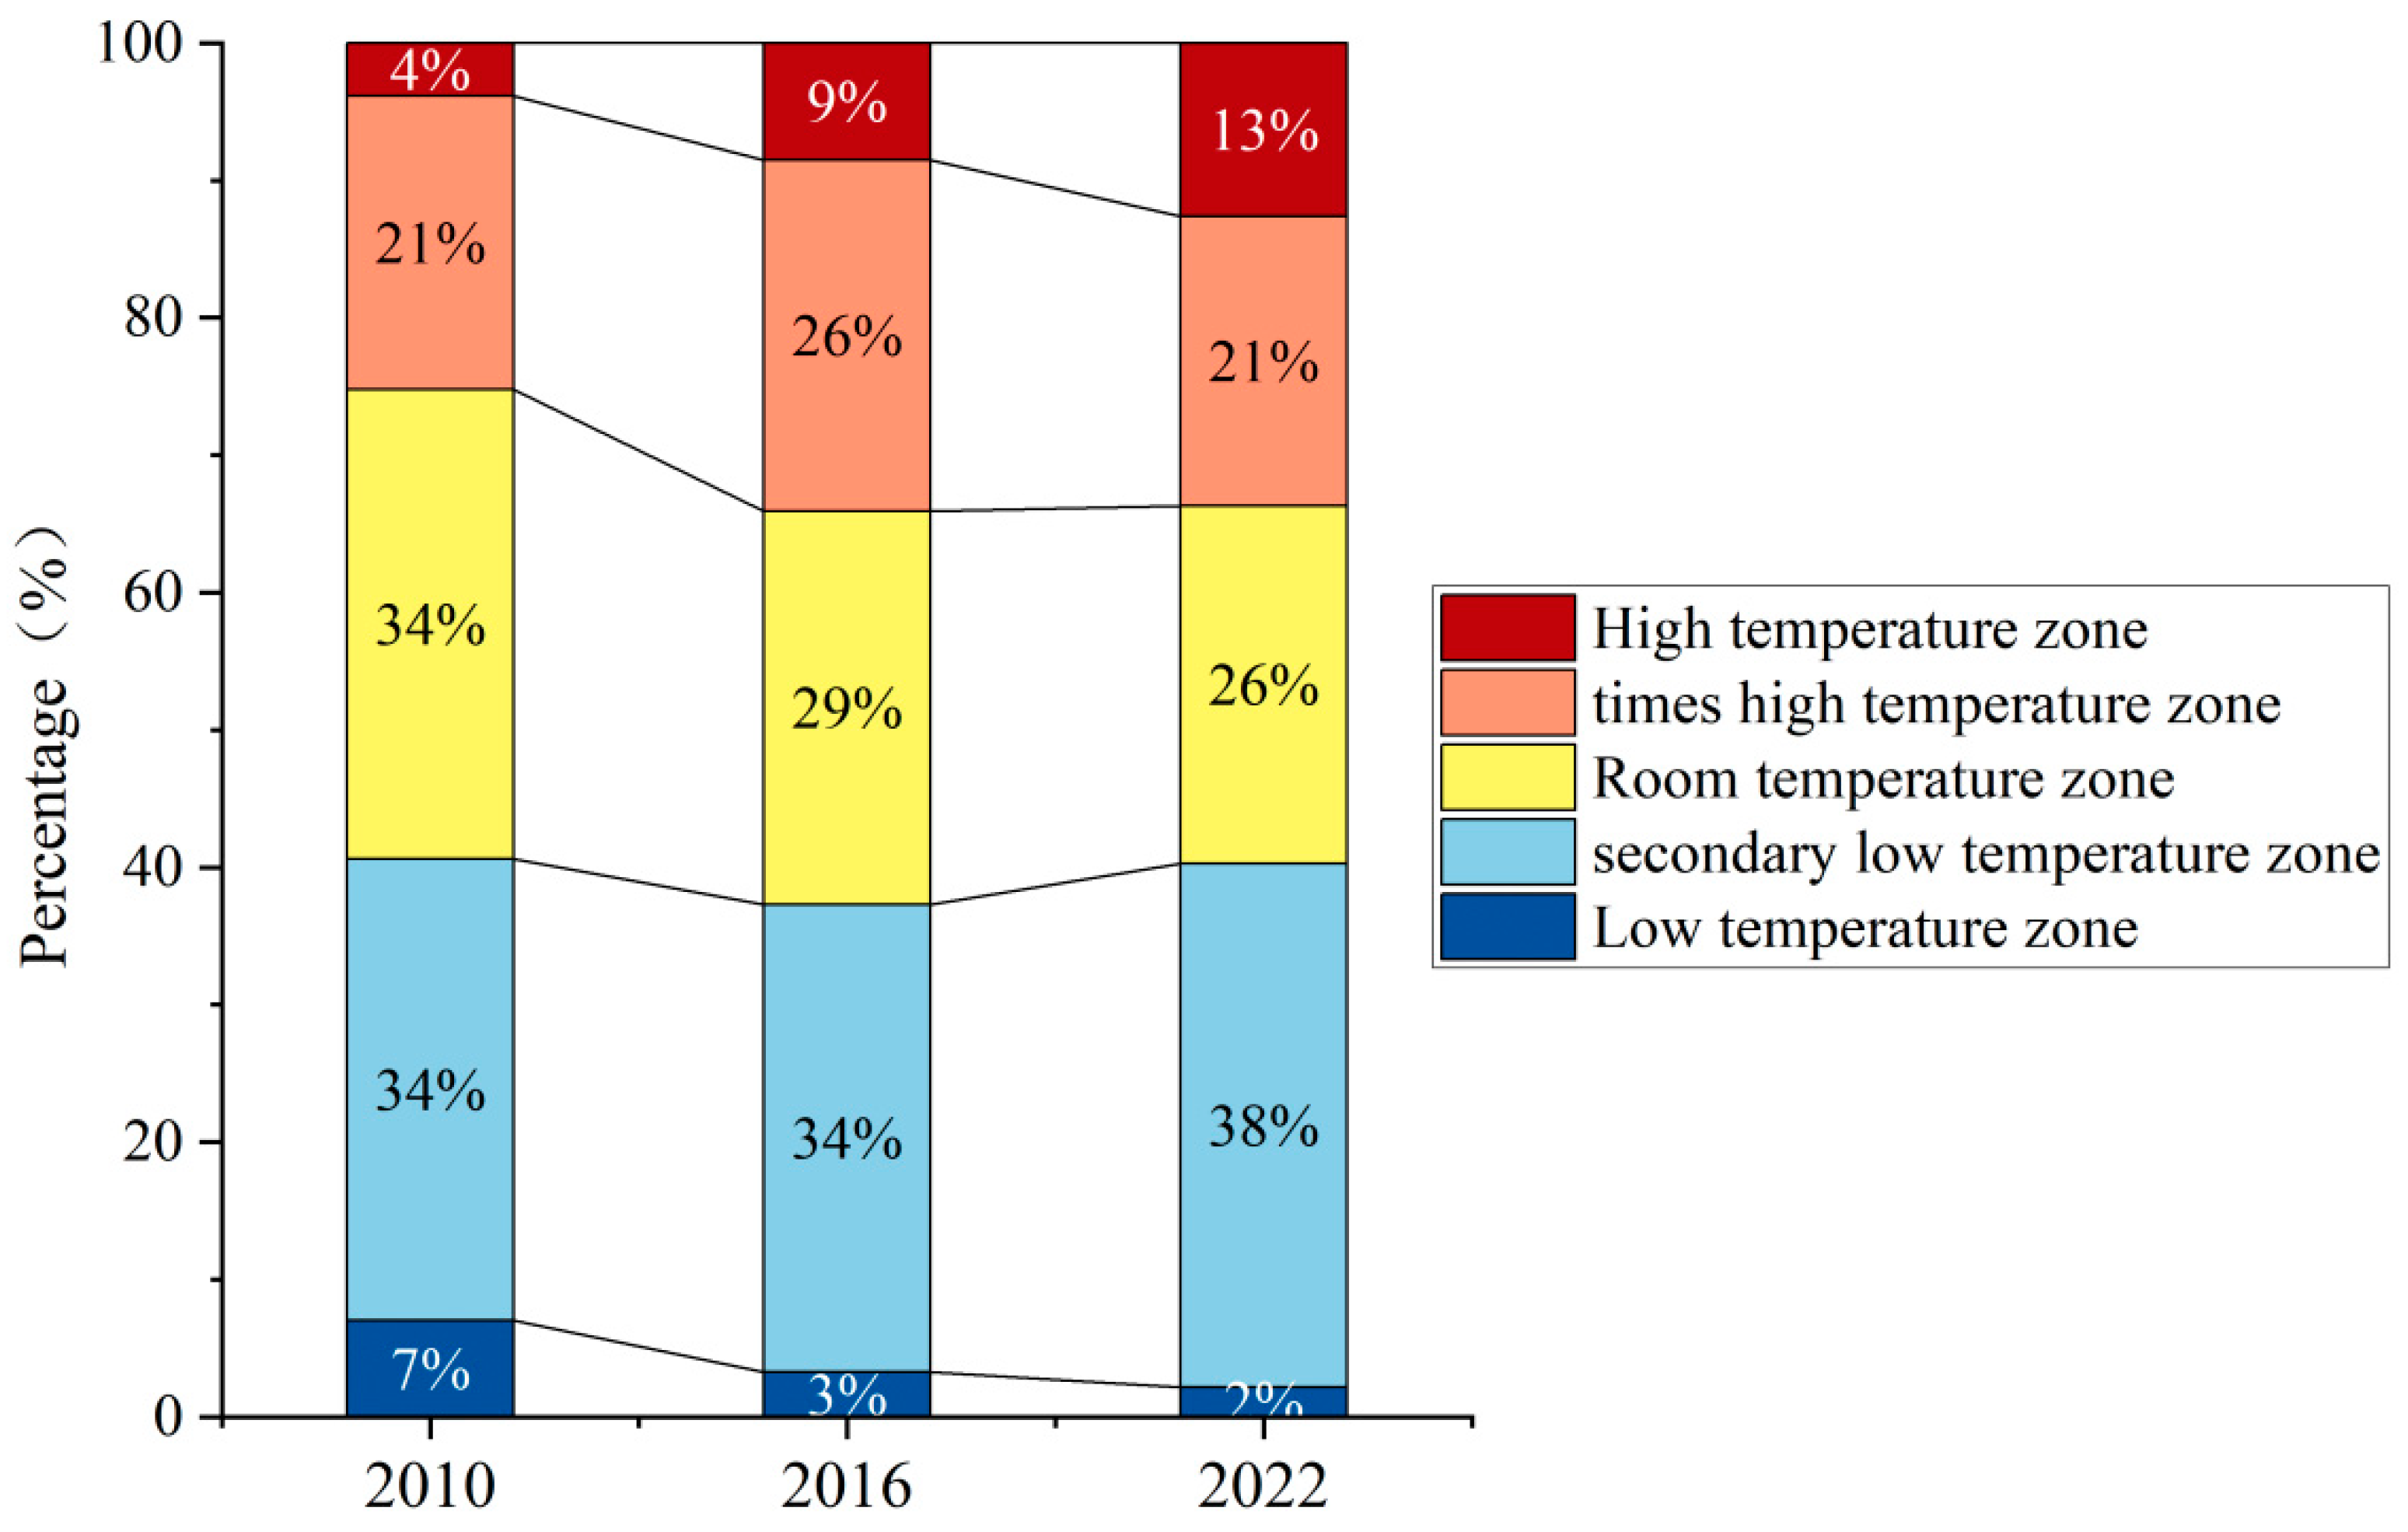
4.2. Spatial Evolution of the Land Surface Temperature and Heat Island Region in the Urban Agglomeration

In order to explore the surface temperature and spatial evolution characteristics of the Wanjiang urban agglomeration from 2010 to 2022, data from 2010, 2016, and 2022 were selected for spatial visualization, and the natural fracture method was used to divide the surface temperature into five levels from high to low, including a low-temperature region, sub-low-temperature region, normal-temperature region, sub-high-temperature region, and high-temperature region. On this basis, the proportion of each grade of surface temperature area was calculated.
As shown in Figure 10 and Figure 11, in 2010, the high-temperature area (3.86%) of the Wanjiang urban agglomeration was mainly distributed in Chuzhou, Hefei, Jin’an, Shucheng, and Xuancheng, with a small amount scattered in Ma’anshan, Wuhu, Tongling, Chizhou, and a small part of Anqing. The sub-high-temperature areas (21.35%) were distributed evenly in Chuzhou city, Ma’anshan city, Tongling city, Anqing city, Wuhu city, and Chizhou city, and scattered in Hefei city, Jin’an District, Shucheng County, and Xuancheng city. In 2016, the proportion of high-temperature areas (8.53%) in urban agglomerations increased and were mainly distributed in Hefei, Jin’an District, Chuzhou city, Wuhu city, and Xuancheng city, followed by Ma’anshan city and Anqing city, and other cities also had small areas of distribution. The sub-high-temperature areas (25.54%) were mainly distributed in Hefei, Chuzhou, Anqing, Chizhou, Wuhu, and Xuancheng, and were also distributed in other cities. In 2022, the high-temperature zone was mainly distributed in Chuzhou city, Hefei city, Jin’an District, Shucheng County, and the eastern part of Anqing city, with a small amount scattered in Ma’anshan city, Wuhu city, Tongling city, Chizhou city, and Xuancheng city. Sub-high-temperature areas (20.68%) were mainly distributed in the eastern cities of the urban agglomerations, among which are Chuzhou city and Ma’anshan.
Tongling city, Xuancheng city, and Chizhou city had a wide distribution, and a small number were distributed in Hefei city, Jin’an District, Shucheng County, and Anqing city. In addition, during the period from 2010 to 2022, the proportion of low-temperature areas in the Wanjiang urban agglomeration generally showed a decreasing trend, from 7.02% in 2010 to 2.09% in 2022. The area of low-temperature areas in the Wanjiang urban agglomeration was relatively small and the spatial change was not obvious, and they were mainly distributed in Chaohu Valley of Hefei city, the west of Anqing city, the south of Xuancheng city, and a small area along the Yangtze River basin.

4.3. The Application Practice of Coupling and Coordinating the Network Pattern of the Urban Agglomeration Thermal Environment

The construction of a thermal environment network for urban agglomerations aims to optimize land spatial patterns, stabilize ecosystems, and promote high-quality economic development [61]. The Wanjiang urban agglomeration is primarily located in the plain areas along the middle and lower reaches of the Yangtze River, a region characterized by relatively flat terrain and fertile soil. This area is one of the more economically developed and urbanized regions within Anhui Province. Given its unique geographical and economic characteristics, studying the thermal environment network of the Wanjiang urban agglomeration not only holds regional significance but also offers theoretical foundations and technical support for optimizing and coordinating thermal environment networks at a regional scale globally. In constructing the urban thermal environment network, key tasks are essential for optimizing the thermal environment pattern: The first task is identifying thermal environment sources, which involves recognizing the key points or areas that significantly impact the urban thermal environment. The second task is to construct the urban thermal environment resistance surface, which involves developing a resistance model to simulate heat diffusion and transfer through the analysis of factors such as topography, meteorology, and land use. The third task is extracting urban heat island corridors, which connect different thermal environment sources, forming a coherent network of heat flow. The final task is identifying the nodes within the heat island network, which may act as points of heat accumulation or dissipation, determining the evolution pathways and characteristics of the thermal environment.
This study integrates innovative methods such as the MSPA model and circuit theory, applying them to the Wanjiang urban agglomeration to identify and assess the thermal environment spatial network. The study validates the feasibility of the “source–corridor–node” approach to network construction in the field of thermal environment research. It provides a robust reference for understanding the thermal environment network pattern of the Wanjiang urban agglomeration and mitigating urban heat island effects, with a particular focus on the development stage and spatial balance of the Wanjiang urban agglomeration, thereby enabling scientific regulation of urban development space. Analyzing and evaluating the evolution of the thermal environment network in urban agglomerations offers new research perspectives on urban thermal environments. It also contributes new ideas for reducing the thermal environment risks faced by urban and rural residents amid rapid urbanization, which is crucial for achieving regional ecological stability and high-quality economic development.

4.4. Current Research and Future Research Directions

This study applies ecological corridor and network identification techniques to the analysis of urban thermal environments, emphasizing the urgency and necessity of proactively adapting to and mitigating changes in urban thermal conditions within the context of urban planning and management. It also underscores the importance of constructing spatial networks for urban thermal environments. The implementation of the “Three Lines and One List” policy—comprising the ecological protection red line, the environmental quality bottom line, the resource utilization upper limit, and the ecological environment access list—has become a crucial tool for promoting refined ecological management. This policy strengthens the control of spatial environmental management and advances green, low-carbon, and high-quality development, thus playing a significant role in optimizing and managing the spatial network pattern of the thermal environment within urban agglomerations.
However, the study has certain limitations: (1) It does not further identify and optimize the hierarchy of urban heat island corridors. Future research could address this by examining the appropriate width of corridors based on landscape structure and function, and conducting buffer zone analyses to optimize the spatial pattern of urban thermal environments. (2) The identification of thermal environment pinch points using circuit theory is highly influenced by the resistance surface. Although the study carefully considers natural factors such as land use types and surface temperature in constructing the resistance surface, it primarily explores the thermal environment pattern on a two-dimensional level. The effects of three-dimensional factors such as building density, wind direction, and wind speed on heat diffusion are not accounted for. Future research should aim to develop a more comprehensive resistance surface and employ dynamic, multi-dimensional approaches to enhance the analysis of environmental elements. (3) The study focuses solely on constructing a spatial network for the thermal environment, without integrating this with other planning objectives such as biodiversity conservation, economic development, and ecological protection. Future research could aim to optimize multiple planning objectives simultaneously, using multi-objective optimization models to achieve a synergistic development of ecological protection and urban construction. (4) Updates and software limitations: ArcGIS 10.2 is an older version of the software, and some advanced functionalities available in newer versions (e.g., ArcGIS Pro) might have been beneficial in improving the efficiency and sophistication of the analysis, such as better integration with cloud computing or machine learning algorithms for spatial analysis.

5. Conclusions

This study, using the Wanjiang urban agglomeration as a case study, integrates multi-source data such as surface temperature and land use from 2010, 2016, and 2022. By employing the MSPA model and circuit theory, it identifies the types and spatiotemporal distribution of UHI patches within the Wanjiang urban agglomeration, revealing the spatial evolution of the region’s thermal environment network. The following conclusions were drawn:
Based on the MSPA model, UHI patches in the Wanjiang urban belt were classified into seven types. From 2010 to 2022, UHI patches were primarily concentrated in the northwest and southeast regions, with a significant increase in area. The dominant UHI patch type shifted from isolated patches to core patches. In 2022, the core-type UHI patches were mainly concentrated in the western part of Hefei, northeastern Shucheng County, and eastern Anqing, with smaller clusters in southwestern Chuzhou.
Between 2010 and 2022, both the number and area of heat source sites in the Wanjiang urban agglomeration increased, with the number of heat source sites increasing from 20 to 27. Using circuit theory to identify UHI corridors based on the distribution of heat sources, the number of corridors increased from 45 in 2010 to 63 in 2022. Furthermore, the number of nodes in the UHI network grew from 147 in 2010 to 254 in 2022, indicating an improvement in the ecological connectivity of the urban agglomeration during the study period. Based on circuit theory, 180 obstacle points in the UHI network were identified in 2010, decreasing to 149 in 2016 and increasing again to 185 in 2022.
From 2010 to 2022, the overall connectivity of the thermal environment network in the Wanjiang urban agglomeration gradually improved. The α-index increased from 0.743 in 2010 to 0.902 in 2022, the β-index increased from 2.25 in 2010 to 2.56 in 2022, and the γ-index grew from 0.833 in 2010 to 0.937 in 2022. These increasing α, β, and γ indices over time suggest that the overall connectivity of the thermal environment network has been continuously strengthening, enhancing the heat transfer efficiency between heat sources. Consequently, the threat posed by high temperatures to urban and rural residents has been on the rise.

Author Contributions

Y.H.: writing—review and editing, validation, supervision, software, methodology, investigation, funding acquisition, formal analysis, data curation, conceptualization. B.D.: writing—review and editing, writing—original draft, validation, supervision, software, resources, project administration, methodology, investigation, funding acquisition, formal analysis, data curation, conceptualization. Z.X.: writing—review and editing, writing—original draft, visualization, validation, supervision, software, resources, project administration, methodology, investigation, funding acquisition, formal analysis, data curation, conceptualization. J.Q.: writing—review and editing, validation, supervision, project administration, methodology, investigation, funding acquisition, formal analysis, data curation, conceptualization. H.W.: writing—original draft, visualization, validation, supervision, software, resources, methodology, investigation, funding acquisition, data curation, conceptualization. L.X.: writing—original draft, visualization, validation, supervision, software, resources, methodology, investigation, funding acquisition, data curation, conceptualization. All authors have read and agreed to the published version of the manuscript.

Funding

This research was funded by [the National Natural Science Foundation of China] grant number (32071600; 41571101), [the Natural Resources Science and Technology Project of Anhui Province] grant number (2022-k-1), and [the Remote Sensing Science and Technology Cross-Peak Cultivation Discipline project] grant number (23103107). We appreciate the above projects for their assistance in this study.

Data Availability Statement

Data will be made available on request.

Conflicts of Interest

The authors declare no conflicts of interest.

References

  1. He, C.; Zhou, L.G.; Yao, Y.R.; Ma, W.C.; Kinney Partric, L. Estimating spatial effects of anthropogenic heat emissions upon the urban thermal environment in an urban agglomeration area in East China. Sustain. Cities Soc. 2020, 57, 102046. [Google Scholar] [CrossRef]
  2. Shreevastava, A.; Rao, P.S.C.; McGrath, G.S. Emergent selfsimilarity and scaling properties of fractal intra-urban heat islets for diverse global cities. Phys. Rev. E 2019, 100, 032142. [Google Scholar] [CrossRef] [PubMed]
  3. Ma, L.; Wang, Y.; Liang, Z.; Ding, J.; Shen, J.; Wei, F.; Li, S. Changing effect of urban form on the seasonal and diurnal variations of surface urban heat island Intensities (SUHIIs) in more than 3000 cities in China. Sustainability 2021, 13, 2877. [Google Scholar] [CrossRef]
  4. Sun, Q.Q.; Wu, Z.F.; Tan, J.J. Spatio-temporal changes of urban thermal environment with thermal centroid in Guangzhou. Sci. Geogr. Sin. 2010, 30, 620–623. [Google Scholar]
  5. Wei, Z.; Xu, Z.; Dong, B.; Xu, H.; Lu, Z.; Liu, X. Habitat suitability evaluation and ecological corridor construction of wintering cranes in Poyang Lake. Ecol. Eng. 2023, 189, 106894. [Google Scholar] [CrossRef]
  6. Feng, G. China Blue Book on Climate Change (2021) was released. Environment 2021, 11, 75–77. [Google Scholar]
  7. Shi, X.M.; Qin, M.Z.; Li, B.; Li, C.Y.; Song, L.L. Research on the green infrastructure network in the Zhengzhou-Kaifeng metropolitan area based on MSPA and circuit theory. J. Henan Univ. (Nat. Sci.) 2018, 48, 631–638. [Google Scholar]
  8. Ning, Q.; Zhu, Z.M.; Qin, M.L.; Shi, Q.Q.; Song, Y.Z. Research on the optimization of territorial space ecological network of Nanning city based on MSPA and circuit theory. J. Guangxi Univ. (Nat. Sci. Ed.) 2021, 46, 306–318. [Google Scholar]
  9. Soille, P.; Vogt, P. Morphological segmentation of binary patterns. Pattern Recognit. Lett. 2009, 30, 456–459. [Google Scholar] [CrossRef]
  10. Sun, T.G.; Xiao, R.B.; Cai, Y.N.; Wang, Y.W.; Wu, C.G. Research progress of quantitative evaluation techniques for urban thermal environment. Chin. J. Appl. Ecol. 2016, 27, 2717–2728. [Google Scholar]
  11. Wang, Z.A.; Meng, Q.Y.; Zhang, L.L.; Hu, D.; Yang, T.L. Haikou city based on CA-Markov model. Heat island simulation and prediction. J. Univ. Chin. Acad. Sci. 2022, 39, 742–753. [Google Scholar]
  12. Xin, R.H.; Zeng, J.; Li, K.; Zhou, I.H.; Hu, J.Q.; Kong, J.G.; Wang, Q.W. Identification of key areas of imbalance between supply and demand of urban thermal environment regulation services. Geogr. Res. 2022, 41, 3124–3142. [Google Scholar]
  13. Chen, L.; Fu, B.; Zhao, W. The “source” and “hui” landscape theory and their ecological significance. J. Ecol. 2006, 26, 1444–1449. [Google Scholar]
  14. Cao, X.; Liu, Z.; Li, S.; Gao, Z.J.; Sun, B.W. Identification of key areas for territorial ecological restoration based on ecological security pattern: A case study of Songyuan City, Jilin Province. China Environ. Sci. 2022, 42, 2779–2787. [Google Scholar]
  15. Shen, Q.W.; Lin, M.; Mo, H.; Huang, Y.B.; Hu, X.Y. Construction and optimization of ecological network in Foshan City. Chin. J. Appl. Ecol. 2021, 32, 3288–3298. [Google Scholar]
  16. Wu, Y.; Li, C.; Gao, B.; Wang, M.; Wu, Y. Construction of ecological security pattern of plateau lake city: A case study of Dali City. Acta Ecol. Sin. 2023, 43, 8153–8166. [Google Scholar]
  17. Zhou, J.; Wang, H.; Tan, B.; Ma, C.; Wang, X.Q. Construction of ecological security pattern and identification of ecological restoration zones in Kaidu River Basin. Acta Ecol. Sin. 2022, 42, 10127–10137. [Google Scholar]
  18. Song, L.; Qin, M.Z. Integrated circuit theory of ecological corridor and their importance identification. J. Appl. Ecol. 2016, 27, 3344–3352. [Google Scholar]
  19. Huang, M.; Liu, C.X.; Yu, X.Y.; Jiao, S. Resilience evaluation and optimization of urban water ecological network: Take Changsha as an example. Econ. Geogr. 2022, 42, 52–60. [Google Scholar]
  20. Aguilera, M.A.; Tapia, J.; Gallardo, C.; Núñez, P.; Varas-Belemmi, K. Loss of coastal ecosystem spatial connectivity and services by urbanization: Natural-to-urban integration for bay management. J. Environ. Manag. 2020, 276, 111297. [Google Scholar] [CrossRef]
  21. Chen, Z.; Kuang, D.; Wei, X. Developing ecological networks based on MSPA and MCR: A case study in Yujiang county. Resour. Environ. Yangtze Basin. 2017, 26, 1199–1207. [Google Scholar]
  22. Dai, L.; Liu, Y.; Luo, X. Integrating the MCR and DOI models to construct an ecological security network for the urban agglomeration around Poyang Lake, China. Sci. Total Environ. 2021, 754, 141868. [Google Scholar] [CrossRef] [PubMed]
  23. Dong, J.Q.; Peng, J.; Liu, Y.X.; Qiu, S.J.; Han, Y.N. Integrating spatial continuous wavelet transform and kernel density estimation to identify ecological corridors in megacities. Landsc. Urban. Plan. 2020, 199, 103815. [Google Scholar] [CrossRef]
  24. Hua, T.; Zhao, W.; Cherubini, F.; Hu, X.P.; Pereira, P. Sensitivity and future exposure of ecosystem service functions to climate change on the Tibetan Plateau of China. Landsc. Ecol. 2021, 36, 3451–3471. [Google Scholar] [CrossRef]
  25. Huang, L.; Wang, J.; Cheng, H. Spatiotemporal changes in ecological network resilience in the Shandong Peninsula urban agglomeration. J. Clean. Prod. 2022, 339, 130681. [Google Scholar] [CrossRef]
  26. Huang, K.; Peng, L.; Wang, X.; Deng, W.; Liu, Y. Incorporating circuit theory, complex networks, and carbon offsets into the multi-objective optimization of ecological networks: A case study on karst regions in China. J. Clean. Prod. 2023, 383, 135512. [Google Scholar] [CrossRef]
  27. Jiang, H.; Zhang, Z.M.; Xu, Z.H.; Dan, Z.Y.; Ye, Y.Y. Construction of ecological security pattern integrating multiple ecological protection objectives in Guangdong Province. Acta Ecol. Sin. 2022, 42, 1981–1992. [Google Scholar]
  28. Jiang, H.; He, G. Analysis of Spatial and Temporal Evolution of Regional Water Resources Carrying Capacity and Influencing Factors—Anhui Province as an Example. Sustainability 2023, 15, 11255. [Google Scholar] [CrossRef]
  29. Ji, X.; Sun, Y.; Guo, W.; Zhao, C.; Li, K. Land use and habitat quality change in the Yellow River Basin: A perspective with different CMIP6-based scenarios and multiple scales. J. Environ. Manag. 2023, 345, 118729. [Google Scholar] [CrossRef]
  30. Ji, X.; Wu, D.; Yan, Y.; Guo, W.; Li, K. Interpreting regional ecological security from perspective of ecological networks: A case study in Ningxia Hui Autonomous Region, China. Environ. Sci. Pollut. Res. 2023, 30, 65412–65426. [Google Scholar] [CrossRef]
  31. Liu, H.; Wang, Y. Construction and evaluation of traditional village cultural landscape safety corridor: A case study of Anyi ancient village in Nanchang. J. Nanchang Inst. Technol. 2019, 38, 5059. [Google Scholar]
  32. Luo, Y.; Wu, J. Linking the minimum spanning tree and edge betweenness to understand arterial corridors in an ecological network. Landsc. Ecol. 2021, 36, 1549–1565. [Google Scholar] [CrossRef]
  33. Li, Y.-Y.; Zhang, Y.-Z.; Jiang, Z.-Y.; Guo, C.-X.; Zhao, M.-Y.; Yang, Z.-G.; Guo, M.-Y.; Wu, B.-Y.; Chen, Q.-L. Integrating morphological spatial pattern analysis and the minimal cumulative resistance model to optimize urban ecological networks: A case study in Shenzhen city, China. Ecol. Process. 2021, 10, 63. [Google Scholar] [CrossRef]
  34. Lin, J.; Yang, W.; Yu, K.; Geng, J.; Liu, J. Identification and Construction of Ecological Nodes in the Fuzhou Ecological Corridors. Forests 2022, 13, 1837. [Google Scholar] [CrossRef]
  35. Luo, Y.; Zhu, Z.; Wu, J.; Zhang, Y.; Li, X.; Zhao, W.; Yuan, Y.; Duanmu, Z.; Li, M. Exploring habitat patch clusters based on network community detection to identify restored priority areas of ecological networks in urban areas. Urban For. Urban Green. 2022, 78, 127771. [Google Scholar] [CrossRef]
  36. Yang, Z.-G.; Jiang, Z.-Y.; Guo, C.-X.; Yang, X.-J.; Xu, X.-J. Based on morphological spatial pattern analysis Construction of ecological network in Guangzhou with minimum cumulative resistance model. Appl. Stud. Acta Phys. Sin. 2018, 29, 3367–3376. [Google Scholar]
  37. Zhang, X.; Li, Z.; Wang, R.; Wang, Y.; Li, F. City based on functional network evaluation Urban ecological security pattern: A case study of Changzhou City. Peking Univ. J. Nat. Sci. Ed. 2009, 45, 728–736. [Google Scholar]
  38. Li, T.; Gong, Y.; Ge, J.; Ai, Z.; Xie, S. Urban landscape based on circuit theory Construction of ecological security pattern: A case study of Hengyang City, Hunan Province. Appl. Ecol. Chin. J. Sci. 2018, 32, 2555–2564. [Google Scholar]
  39. Li, H.; Chen, H.; Wu, M.; Zhou, K.; Zhang, X.; Liu, Z. A dynamic evaluation method of urban ecological networks combining Graphab and the FLUS Model. Land 2022, 11, 2297. [Google Scholar] [CrossRef]
  40. Lu, Z.; Li, W.; Wang, Y.; Zhou, S. Bibliometric analysis of global research on ecological networks in nature conservation from 1990 to 2020. Sustainability 2022, 14, 4925. [Google Scholar] [CrossRef]
  41. Li, Y.G.; Liu, W.; Feng, Q.; Zhu, M.; Yang, L.S. The role of land use change in affecting ecosystem service functions and the ecological security pattern of the Hexi Regions, Northwest China. Sci. Total Environ. 2023, 855, 158940. [Google Scholar] [CrossRef]
  42. Lu, Y.; Liu, Y.; Xing, L.; Liu, Y. Robustness test of multiple protection strategies for ecological networks from the perspective of complex networks: Evidence from Wuhan Metropolitan Area, China. Land. Degrad. Dev. 2023, 34, 52–71. [Google Scholar] [CrossRef]
  43. Lumia, G.; Praticò, S.; Di Fazio, S.; Cushman, S.; Modica, G. Combined use of urban Atlas and Corine land cover datasets for the implementation of an ecological network using graph theory within a multi-species approach. Ecol. Indic. 2023, 148, 110150. [Google Scholar] [CrossRef]
  44. Lopes, I.J.; Biondi, D.; Corte, A.P.; Reis, A.R.; Oliveira, T.G. A methodological framework to create an urban greenway network promoting avian connectivity: A case study of Curitiba City. Urban. For. Urban. Gree. 2023, 87, 128050. [Google Scholar] [CrossRef]
  45. Peng, J.; Li, H.L.; Liu, Y.X.; Hu, Y.N.; Yang, Y. Identification and optimization of ecological security pattern in Xiong’an New Area. Acta Geograph. Sin. 2018, 73, 701–710. [Google Scholar]
  46. Qin, F.; Pen, Y. Development and optimization of ecological network of Shunyi District of Beijing based on RS and GIS. Chin. J. Appl. Environ. Biol. 2016, 22, 1074–1081. [Google Scholar]
  47. Qian, W.Q.; Li, X.Y. A cold island connectivity and network perspective to mitigate the urban heat island effect. Sustain. Cities Soc. 2023, 94, 104525. [Google Scholar] [CrossRef]
  48. Rogan, J.; Wright, T.M.; Cardille, J.; Pearsall, H.; Ogneva-Himmelberger, Y.; Riemann, R.; Riitters, K.; Partington, K. Forest fragmentation in Massachusetts, USA: A town-level assessment using morphological spatial pattern analysis and affinity propagation. Gisci. Remote Sens. 2016, 53, 506–519. [Google Scholar] [CrossRef]
  49. Tu, Y.; Liu, M.; Gao, C.C.; Sun, Y.W.; Cai, C.L.; Su, L. Construction of ecological source identification system in metropolitan areas and diagnosis of key areas for territorial ecological restoration. J. Ecol. 2022, 42, 7056–7067. [Google Scholar]
  50. Liu, J.N.; Long, Y.D.; Chen, Y.F.; Gao, F. Biodiversity conservation in Chenggong New District of Kunming based on habitat network. Chin. Urban. For. 2022, 20, 15–21. [Google Scholar]
  51. Huang, J.; Huang, J.; Chen, C. Construction of urban ecological network based on natural protected areas in Guangzhou. Chin. J. Appl. Ecol. 2024, 35, 247–254. [Google Scholar]
  52. Yang, X.; Ye, X.; Zhao, X.; Nie, B.; Rao, J. Research on ecological corridor construction and optimization based on MSPA and MCR: A case study of Xinjian District in Nanchang City. Reg. Res. Dev. 2023, 42, 85–91. [Google Scholar]
  53. Sun, S.; Li, S.; Tang, J.; Su, J. Construction of urban wetland ecological landscape planning model based on MSPA analysis method. J. Environ. Eng. Landsc. 2022, 30, 500–507. [Google Scholar] [CrossRef]
  54. Sun, W.X.; Ren, J.; Zhai, J.; Li, W.C. Just green enough’in urban renewal: A multifunctional and pragmatic approach in realizing multiscale urban green space optimization in built-up residential areas. Urban. For. Urban. Gree. 2023, 82, 127891. [Google Scholar] [CrossRef]
  55. Teng, Y.; Ke, Y.Y.; Zhou, Q.X.; Tao, R.Q.; Wang, Y.B. Derived regional soil-environmental quality criteria of metals based on Anhui soil-crop systems at the regulated level. Sci. Total Environ. 2022, 825, 154060. [Google Scholar] [CrossRef]
  56. Wei, S.; Pan, J.; Liu, X. Landscape ecological safety assessment and landscape pattern optimization in arid inland river basin: Take Ganzhou district as an example. Hum. Ecol. Risk Assess. 2020, 26, 782–806. [Google Scholar] [CrossRef]
  57. Wang, S.; Wu, M.; Hu, M.; Fan, C.; Wang, T. Promoting landscape connectivity of highly urbanized area: An ecological network approach. Ecol. Indic. 2021, 125, 107487. [Google Scholar] [CrossRef]
  58. Wang, T.; Li, H.; Huang, Y. The complex ecological network’s resilience of the Wuhan metropolitan area. Ecol. Indic. 2021, 130, 108101. [Google Scholar] [CrossRef]
  59. Wang, S.Y.; Rong, W.Z. Construction of ecological network in Suzhou based on the PLUS and MSPA models. Ecol. Indic. 2023, 154, 110740. [Google Scholar]
  60. Wang, C.; Li, Z.; Chen, H.; Wang, M. Comprehensive Evaluation of Agricultural Water Resources’ Carrying Capacity in Anhui Province Based on an Improved TOPSIS Model. Sustainability 2023, 15, 13297. [Google Scholar] [CrossRef]
  61. Wang, Q.; Yu, R.; Chu, Z.; Wu, Y.; Wei, J. Construction of ecological security pattern and identification of key regions based on ecological assessment and circuit theory: A case study of Anhui Province. J. Soil. Water Conserv. 2023, 43, 209–216 + 226. [Google Scholar]
Figure 1. Overview map of the study area.
Land 13 01695 g001
Figure 2. Spatial distribution of UHI patch types based on the Conefor 2.6 MSPA model.
Land 13 01695 g002
Figure 3. Results of thermal environment source area extraction.
Land 13 01695 g003
Figure 4. Resistance surface of the urban thermal environment.
Land 13 01695 g004
Figure 5. Identification results of the thermal environment corridor.
Land 13 01695 g005
Figure 6. Thermal environment pinch point current density distribution.
Land 13 01695 g006
Figure 7. Thermal environment barrier points and current density distribution.
Land 13 01695 g007
Figure 8. Density map of thermal environment pinch points and barrier points.
Land 13 01695 g008
Figure 9. Overall connectivity of the thermal environment network.
Land 13 01695 g009
Figure 10. Spatial evolution characteristics of LST in urban agglomerations.
Land 13 01695 g010
Figure 11. Surface temperature area ratio of different grades.
Land 13 01695 g011
Table 1. Classification of heat island patches and their spatial morphological characteristics based on the MSPA model.
Heat Island Patch TypeSpatial Morphological Characteristics
CoreLarge, continuous, and does not contain its edges
IslandScattered, isolated urban heat island patches with an area smaller than the minimum threshold of the core area
PerforationThe boundary between the urban heat island core area and the inner non-heat island patch
EdgeThe boundary between the urban heat island core area and the outer non-heat island patch
LoopUrban heat island corridors connecting the same urban heat island core area
BridgeUrban heat island corridors connecting different urban heat island core areas
BranchAn urban heat island patch connected only to one end of an urban heat island core, a bridge area, or a ring road area
BackgroundNon-urban heat island area
Table 2. Resistance factor weight analysis table.
Resistance FactorGrading IndexResistance ValueWeight
Altitude>800 m10.1
500–800 m3
200–500 m5
<200 m7
Slope<3°10.15
3–5°3
5–10°5
10–15°7
>15°9
NDVI>0.810.2
0.6–0.83
0.4–0.65
0.2–0.47
<0.29
Land useForest10.3
Grassland1
Water1
Cropland4
Unutilized land6
Construction9
LST<20 °C10.25
20–22 °C3
22–24 °C5
24–26 °C7
26–28 °C9
Disclaimer/Publisher’s Note: The statements, opinions and data contained in all publications are solely those of the individual author(s) and contributor(s) and not of MDPI and/or the editor(s). MDPI and/or the editor(s) disclaim responsibility for any injury to people or property resulting from any ideas, methods, instructions or products referred to in the content.

