Abstract
Under the dynamics of urbanization and counterurbanization, rural areas in China face both challenges and opportunities with the government’s new-town policy. A comprehensive analysis is essential for developing effective strategies. Characterized by traditional water settlements and high ecological sensitivity, Anxin County, which encompasses 50% of Baiyangdian Lake, was selected as a case study. Anxin County was incorporated into the National New Area in 2017, and it served as an experimental site for green ecological development. This study aims to provide insights into the sustainable spatial planning of Anxin County’s settlements by examining their long-term evolution and locational differences, modeling the driving mechanisms, and proposing differentiated spatial planning strategies based on predictive outcomes. Our research findings indicate the folllowing: (1) Anxin County’s settlements have expanded significantly in the past, with a notable surge between 1975 and 1996. Initially, semi-waterside settlements experienced the fastest growth before the 1970s, followed by land settlements. (2) Natural and socio-economic factors are modeled as independent variables to explain the evolution of settlement areas. The results indicate a decreasing impact of natural factors and an increasing influence of socio-economic factors over time. Furthermore, the evolution of settlements in water areas is relatively straightforward and random, whereas land settlements are influenced by a complex array of factors. (3) Utilizing the model to predict settlement growth, the study identifies settlements requiring relocation, and it proposes the most suitable relocation targets for them. A total of 23 villages, including Bei Tianzhuang and Cai Putai, are identified for relocation, while villages such as Ma Village, Bian Village, and Liu Lizhuang have strong capacities for accepting in-migrants. The study also offers recommendations for enhancing waterfront landscapes, flexible land use, road network systems, and internal construction.
1. Introduction
In the four decades following China’s reform and opening-up (1978), rapid urbanization and economic growth were achieved through measures such as land reform, agricultural capital construction, and technical transformation [1,2] This, however, also resulted in a large influx of rural populations into cities, leading to rural depopulation and an increasing disparity between urban and rural areas [3,4]. Despite observing countervailing trends, revitalizing and sustainable developing rural areas remain an issue of concern for the Chinese government in the foreseeable future [3]. The Chinese government’s solution has involved creating new towns in rural areas around large cities [5]. Inevitably, the construction of new towns has impacted original rural areas in terms of land use, spatial patterns, and ecological environments [6]. It adds layers of complexity to our comprehension of regional rural development, and it also puts forward higher requirements for the formulation of development policies. Strategic planning for new towns needs to not only address current challenges but also anticipate future ones, ensuring that policies remain relevant and effective over time. However, rural settlements reflect a region’s natural geography, history, culture, and daily life for local residents, making it crucial to conduct an extensive analysis of their evolutionary process and the environmental factors involved. Consequently, it is necessary to implement tailored protection measures in accordance with their development direction [7].
The rural areas surrounding Baiyangdian Lake are currently grappling with the aforementioned issues. Baiyangdian is the largest lake in North China, and it served as a crucial waterway before the Republican era, linking Baoding and Tianjin. Thanks to its plentiful water resources, a well-developed water transportation network, and a strategic location within the river system, the region has thrived and developed unique landscapes, including embankment towns, wharves, and reed fields, characterized by an interwoven layout over the course of approximately two millennia. The local inhabitants lived by the water and relied on it for their livelihood since antiquity [8]. However, due to urbanization, industrialization, and the building of large reservoirs since the 1980s, Baiyangdian Lake has experienced prolonged droughts and ecological imbalances. The local transportation infrastructure, various industries, and tourism have significantly developed, resulting in a reduced dependence on water bodies [9]. An important turning point was marked on 1 April 2017; the area was incorporated into the Xiong’an New Area. The Xiong’an New Area, designated as a National New Area, was hailed as “a plan of a thousand years” [5], and it was established to alleviate non-capital functions from Beijing and encompasses Xiongxian County, Rongcheng County, Anxin County, and surrounding areas. Soon after, the “Hebei Xiong’an New Area Planning Outline” (hereinafter referred to as “Planning Outline”) [10] was introduced, stressing the importance of a scientific and rational spatial layout of human settlements to protect the ecosystem. The “Baiyangdian Ecological Environment Management and Protection Plan” (hereinafter referred to as “Ecological Plan”) [11] outlines various aspects of the lake’s ecological management and protection. The two official planning documents indicate that the Xiong’an New Area is a policy pilot for the country’s green ecological development. Therefore, there is an urgent requirement for a thorough evaluation of the area’s settlements and the formulation of consolidation strategies to minimize human disruption.
This paper responds to the green ecological development strategy proposed in the planning outline, and it aims to provide insights into the formulation of spatial consolidation strategies in Anxin County through a comprehensive investigation of the evolution process and underlying causes during recent decades. Special attention needs to be paid to the following three issues: (1) What kind of spatial-temporal evolution occurred in the settlements in this area before and after rapid urbanization? (2) What is the driving mechanism behind this evolution, and has it undergone any changes? (3) How can we apply experiences learned from historical evolution to propose consolidation strategies for Anxin County settlements?
This paper is organized as follows. The Section 2 reviews the relevant literature to construct the conceptual and methodological framework; then, Section 3 describes the geographical environment, basic conditions, and historical evolution of the study area, specifies the data employed in the research, and outlines the technical approach of the study. Section 4 presents the results regarding the study area’s evolutionary process and driving mechanisms. Section 5 employs the conclusions drawn from the fourth section to suggest strategies for reconstruction. Section 6 discusses the phenomena discovered and summarizes the main conclusions of the paper, highlighting limitations and areas for improvement.
2. Theoretical Foundations and State of the Art
2.1. Chinese Rural Policies under Urbanization and Counterurbanization
In order to gain a comprehensive understanding of current needs and achieve the aim of proposing recommendations for the future development of rural areas, this paper reviews the issues, opportunities, and governance experiences faced by rural regions worldwide and compares them with the situation in China to gain a comprehensive understanding of current needs. The trend of global urbanization driven by the Industrial Revolution led to concentrated populations in big cities in many developed countries in Europe, North America, and East Asia. However, it experienced a notable shift in the 1960s. The demographic revival of rural areas was first observed in England. In other words, the population growth rates in small to medium-sized cities began to outpace those in mega-cities [12,13]. This phenomenon was first identified and termed “counterurbanization” by Berry (1976) [14]. However, the term ”counterurbanization” cannot precisely capture this phenomenon [15,16]. Many scholars have explored more nuanced scenarios and introduced other terms [17]. Research on mobility [13,17,18], impacts [19], and planning policies [18,20,21] aimed at counteracting counterurbanization is ongoing. Currently, there is no unified consensus on the mobility of counterurbanization, which may be attributed to the appeal of improved infrastructure, lower housing costs, and job opportunities resulting from the relocation of industries from urban to rural areas [17]. Local governments have embraced counterurbanization by implementing redevelopment strategies, focusing on resiliency and innovation in their attempts to transition to a post-industrial economy [20], and they have tried to revitalize suburban and rural areas.
Although China is classified as a developing country, many scholars have noted that counterurbanization also occurs within its borders [22,23,24], albeit driven by different underlying factors. In China, counterurbanization is widely regarded as an opportunity to develop rural areas and reduce the urban–rural disparity [25,26]. On one hand, it caters to the pastoral lifestyle aspirations of urban residents [25], presenting significant market potential for rural tourism development. On the other hand, aligning with the counterurbanization trend facilitates the growth of villages and towns, thereby alleviating pressures on major cities, clarifying the spatial structure of central cities, and narrowing the urban–rural gap. However, the realization of both of these objectives requires a balanced allocation of resources and robust government policy support [24,27]. In this context, the Chinese government has proposed three policy prototypes for the development of metropolitan areas and their surrounding rural areas: new cities or towns driven by an urban planning policy, several development zones driven by economic development policy, and new areas driven by a comprehensive reform policy [28]. The Xiong’an New Area falls into the third category. Its establishment represents an attempt to utilize national resources to promote balanced urban–rural development and explore innovative green development models [5]. Scholars posit that the success of New Area development, even with national policy support, hinges on a consideration of the local economic foundation, locational conditions [27,29], and other fundamental circumstances, as well as a comprehensive assessment of the potential impacts on local resource utilization and the ecosystem that new town construction might entail [19]. Therefore, quantifying rural indicators, monitoring spatiotemporal changes, and improving land quality are essential.
2.2. Spatio-Temporal Evolution and Driving Mechanism of China’s Rural Settlements
To offer insights into the current condition of rural China, extensive research has been conducted in the area of rural settlements, spanning the period from the reform and opening up (1978) to the present. These studies vary in scale, including macro-scale (covering all of rural China), meso-scale (focusing on provinces, cities, or specific regions), and micro-scale (examining individual counties or single villages). At the macro level, although China has seen notable achievements in urbanization over recent decades, this has put the countryside in a position to offer capital, land, laborers, and raw materials to cities [3]. The analysis results of temporal changes in land use structures [30,31] provides evidence that, driven by socio-economic development, a large amount of farmland has been converted for construction purposes. Additionally, quantitative assessments of rural development indicate that many villages remain backward in terms of location and economic development [2,32,33,34,35], with some even experiencing hollowing-out [36,37]. China has gradually recognized the importance of balanced urban–rural development [34] and the construction of an ”ecological civilization” [1] by learning from the past. Li, Long, and Liu (2015) [32] attempted to construct a rural index for villages in China to guide local governments in improving regional policies and rural policies concerning local characteristics. Their rural index takes into account factors such as geography, economy, and policies. Measuring the spatial distribution of settlements across the country reveals that the distribution pattern of villages in China varies significantly, depending on factors such as topography, which may include plains, hills, or deserts, and water resources, and also increasingly influenced by economic conditions, including transportation, industrial development, and agricultural modernization [6,32,38]. Against this background, many scholars have conducted long-term studies on villages within specific regional scopes at the local level. Some of these studies investigate in depth the dynamic transformation between farmland and residential areas in the rural land-use systems [39,40,41]. Concurrently, some studies focus on the dynamic evolution of rural settlement points under the influence of external conditions. The results show that rural settlement points tend to gather around industrial development axes [42], terrain and water sources [43], productive resources such as farmland [44], and major transportation lines [43]. Meanwhile, another strand of the literature considers settlements as patch surfaces and tries to describe them in terms of both area and morphology. These studies draw on landscape ecological theory and employ landscape index analysis methods to extract information on the area, shape, and distribution patterns of settlements [45,46,47,48,49]. Furthermore, the above parameters such as settlement area [48,49,50,51,52], morphology [45,46], density [42,49,53], or ecological habitability, etc. [32,39,54], are utilized as dependent variables to construct a comprehensive indicator system, thereby facilitating the modeling of driving mechanisms. As for the selection of independent variables, Shcherbina E et al. (2019) [55] proposed a five-dimensional driving mechanism for the evolution of rural settlements, consisting of administration, economy, technology, society, and ecology. Similarly, Tong D et al. (2023) [56] suggested that the evolution of rural settlements results from the interaction between internal and external systems. The internal system includes a village’s natural conditions and socio-economic factors, while the external system is influenced by the economic circumstances of higher administrative units and the location conditions on a larger scale. However, due to limitations in data availability and statistical standards, most scholars primarily rely on socio-economic and natural environment indicators when constructing indicator systems. Socio-economic factors comprise management policies, administrative centers, per capita income, the labor force, agricultural land area, and transportation conditions. Natural environmental factors consist of altitude, slope, climate, rainfall, and water bodies. Scholars have found that the influence of factors may exhibit spatiotemporal dynamics:
- A single factor can have positive impacts in some locations while exerting negative effects in others. For example, small water bodies may serve as productive elements in certain areas, attracting settlements, whereas large water bodies pose flood risks, leading to settlement aversion in other regions [48];
- The significance of a factor’s impact is subject to scale effects. Natural elements generally have significant influences across all scales, economic factors tend to be more influential at intermediate scales, and social factors, such as policies, primarily affect the smallest scales [46];
- The magnitude of a factor’s impact is dynamic, changing over time. Several studies have noted that natural elements play a more substantial role in the early stages of settlement evolution, while socio-economic factors become dominant in later stages [57,58].
Finally, other scholars [52,59,60] use Zipf’s law to examine the characteristics of the disparity among rural settlements within the same region from a systemic perspective.
2.3. Spatial Consolidation and Reconstruction Strategy for Spatial Planning
Land consolidation is currently recognized as a prerequisite for responding to national policies aimed at reducing urban–rural disparities and achieving rural vitalization [61], following successful precedents in developed countries [62]. Land consolidation refers to the planned readjustment of land ownership patterns with the aim of forming larger and more rational land holdings. This process also includes the comprehensive management of unused, inefficient, and idle land, as well as damaged and degraded land, to meet the functional needs of human production, life, and ecology. Additionally, land consolidation may involve improvements to infrastructure and the implementation of developmental and environmental policies [34,62,63].The results of quantitative assessments [63,64] indicate that land consolidation offers varying benefits, such as alleviating poverty [63], enhancing rural vitality, liberating land resources [65], and causing minimal destruction [66]. However, it also presents ecological risks and negative impacts [64]. Some scholars have endeavored to evaluate the developmental capacity of settlements, taking into account socio-economic and natural geographical factors [67,68,69,70,71] or ecological adaptability [72]. Assessment criteria were developed to determine settlement development types [53,73,74] or restructuring approaches. Examples of development types include production-functional villages, service-functional villages, and lifestyle-functional villages. Hierarchical structures comprise core villages and grassroots villages [75,76]. Furthermore, villages either require relocation or could benefit from internal optimization [72,77,78]. This method requires relocating village residents to larger nearby settlements, while the vacated land is then repurposed for cultivation. This approach is frequently used because it involves shorter relocation distances, and the destination villages are filled, allowing for more resources to be allocated for development and construction. This method necessitates the designation of residents from relocation-type villages to be relocated to nearby larger residential areas, with the original construction land subsequently utilized for cultivation. This approach is frequently employed, as it not only involves shorter distances for relocation but also facilitates the filling of the incoming villages, thereby enabling the allocation of more resources for development and construction [66,79].
2.4. Summary
The Chinese government aims to leverage the counter-urbanization trend to mitigate urban–rural disparities by constructing New Town in rural areas. Conducting thorough research and analysis of local rural settlements is essential for future urbanization development. The research objects of existing rural geography studies cover a variety of regions, such as mountainous areas, transitional zones between hills and plains, and plains. Water bodies are usually regarded as a crucial element that impacts settlement aggregation, instead of being the geographical context of study objects. However, settlements located near waterfronts have historically maintained a close and interdependent relationship with water bodies, leading to a unique evolutionary process that distinguishes them from the aforementioned territorial settlements. The urbanization process has impacted and altered this relationship, resulting in a more complex situation regarding the conservation and further development of waterside settlements, which is unfortunately overlooked in current research. Conversely, examining the long-term evolution of particular rural areas within a region aids in developing a comprehensive understanding of their developmental processes, which is crucial for formulating adaptable development policies. But most research generally dates back to only the early 21st century. During this time, urbanization had already begun, causing rural areas to undergo rapid development. However, the progress we see today can be traced back to the economic reforms and opening up in 1978. As the stages of urbanization progressed, significant changes occurred in the trends and mechanisms of rural dynamics. Thus, we must track the settlements for an extended period to acquire a comprehensive understanding of their development.
Hence, this study caters to the significant demand for land consolidation and development in Anxin County, and it tries to longitudinally track the development and evolution of waterside settlements in this region to provide a reliable basis for the government to formulate flexible policies. In our previous research [80], we discussed the impact of gradually replacing traditional water transport with a land transport system as the entry point for exploring village development in the region. In this study, in contrast, we take into account additional influencing factors from both the natural geographical environment and socio-cultural conditions to construct the influence indicator system. And, referring to the relevant conclusions, we can hypothesize that the impact is characterized by spatiotemporal dynamics. Therefore, the dynamic evolutionary processes and driving mechanisms can be analyzed by interpreting multivariate time-series data and using a geographical model, which extended the time dimension. Finally, based on the analysis results, policy recommendations are proposed.
3. Study Area, Materials, and Methodology
3.1. Study Area
Anxin County is located between 38°10′ and 40°00′ N and 113°40′ and 116°20′ E. It covers a total area of 738.6 square kilometers, approximately 140 square kilometers of which are the water body of Baiyangdian Lake (Figure 1). The county governs nine towns and three townships, totaling 207 villages. We categorize villages, based on their relative location to water bodies (as shown in Figure 2), into three types using the village as the minimum unit:
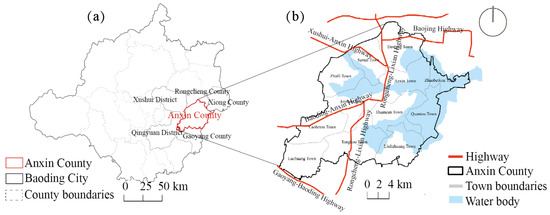
Figure 1.
The study area: (a) The location of Anxin County. (b) The main roads and water bodies in Anxin County.
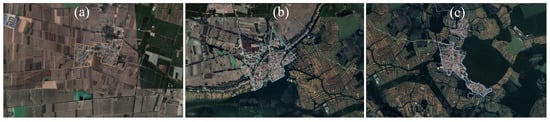
Figure 2.
Three types of settlements in Anxin County: (a) Land settlements. (b) Semi-waterside settlements. (c) Water settlements.
- Land settlements, which are completely located on dry land;
- Semi-waterside settlements, which are situated alongside embankments or incorporate into the village layout;
- Water settlements, which are constructed within the water body itself.
3.2. Materials
The data utilized in this study are presented in Section 2.2 of Wang and He (2022) [80]. The settlement patches, roads, and dikes were extracted from map materials. Furthermore, as a result of long-term evolution, the villages studied by Wang and He (2022) [80] do not perfectly align with their current counterparts due to changes such as new additions, disappearances, mergers, and splits. We standardized the list of settlements using the latest village list provided in the Annals of Anxin County as a reference.
3.3. Methodology
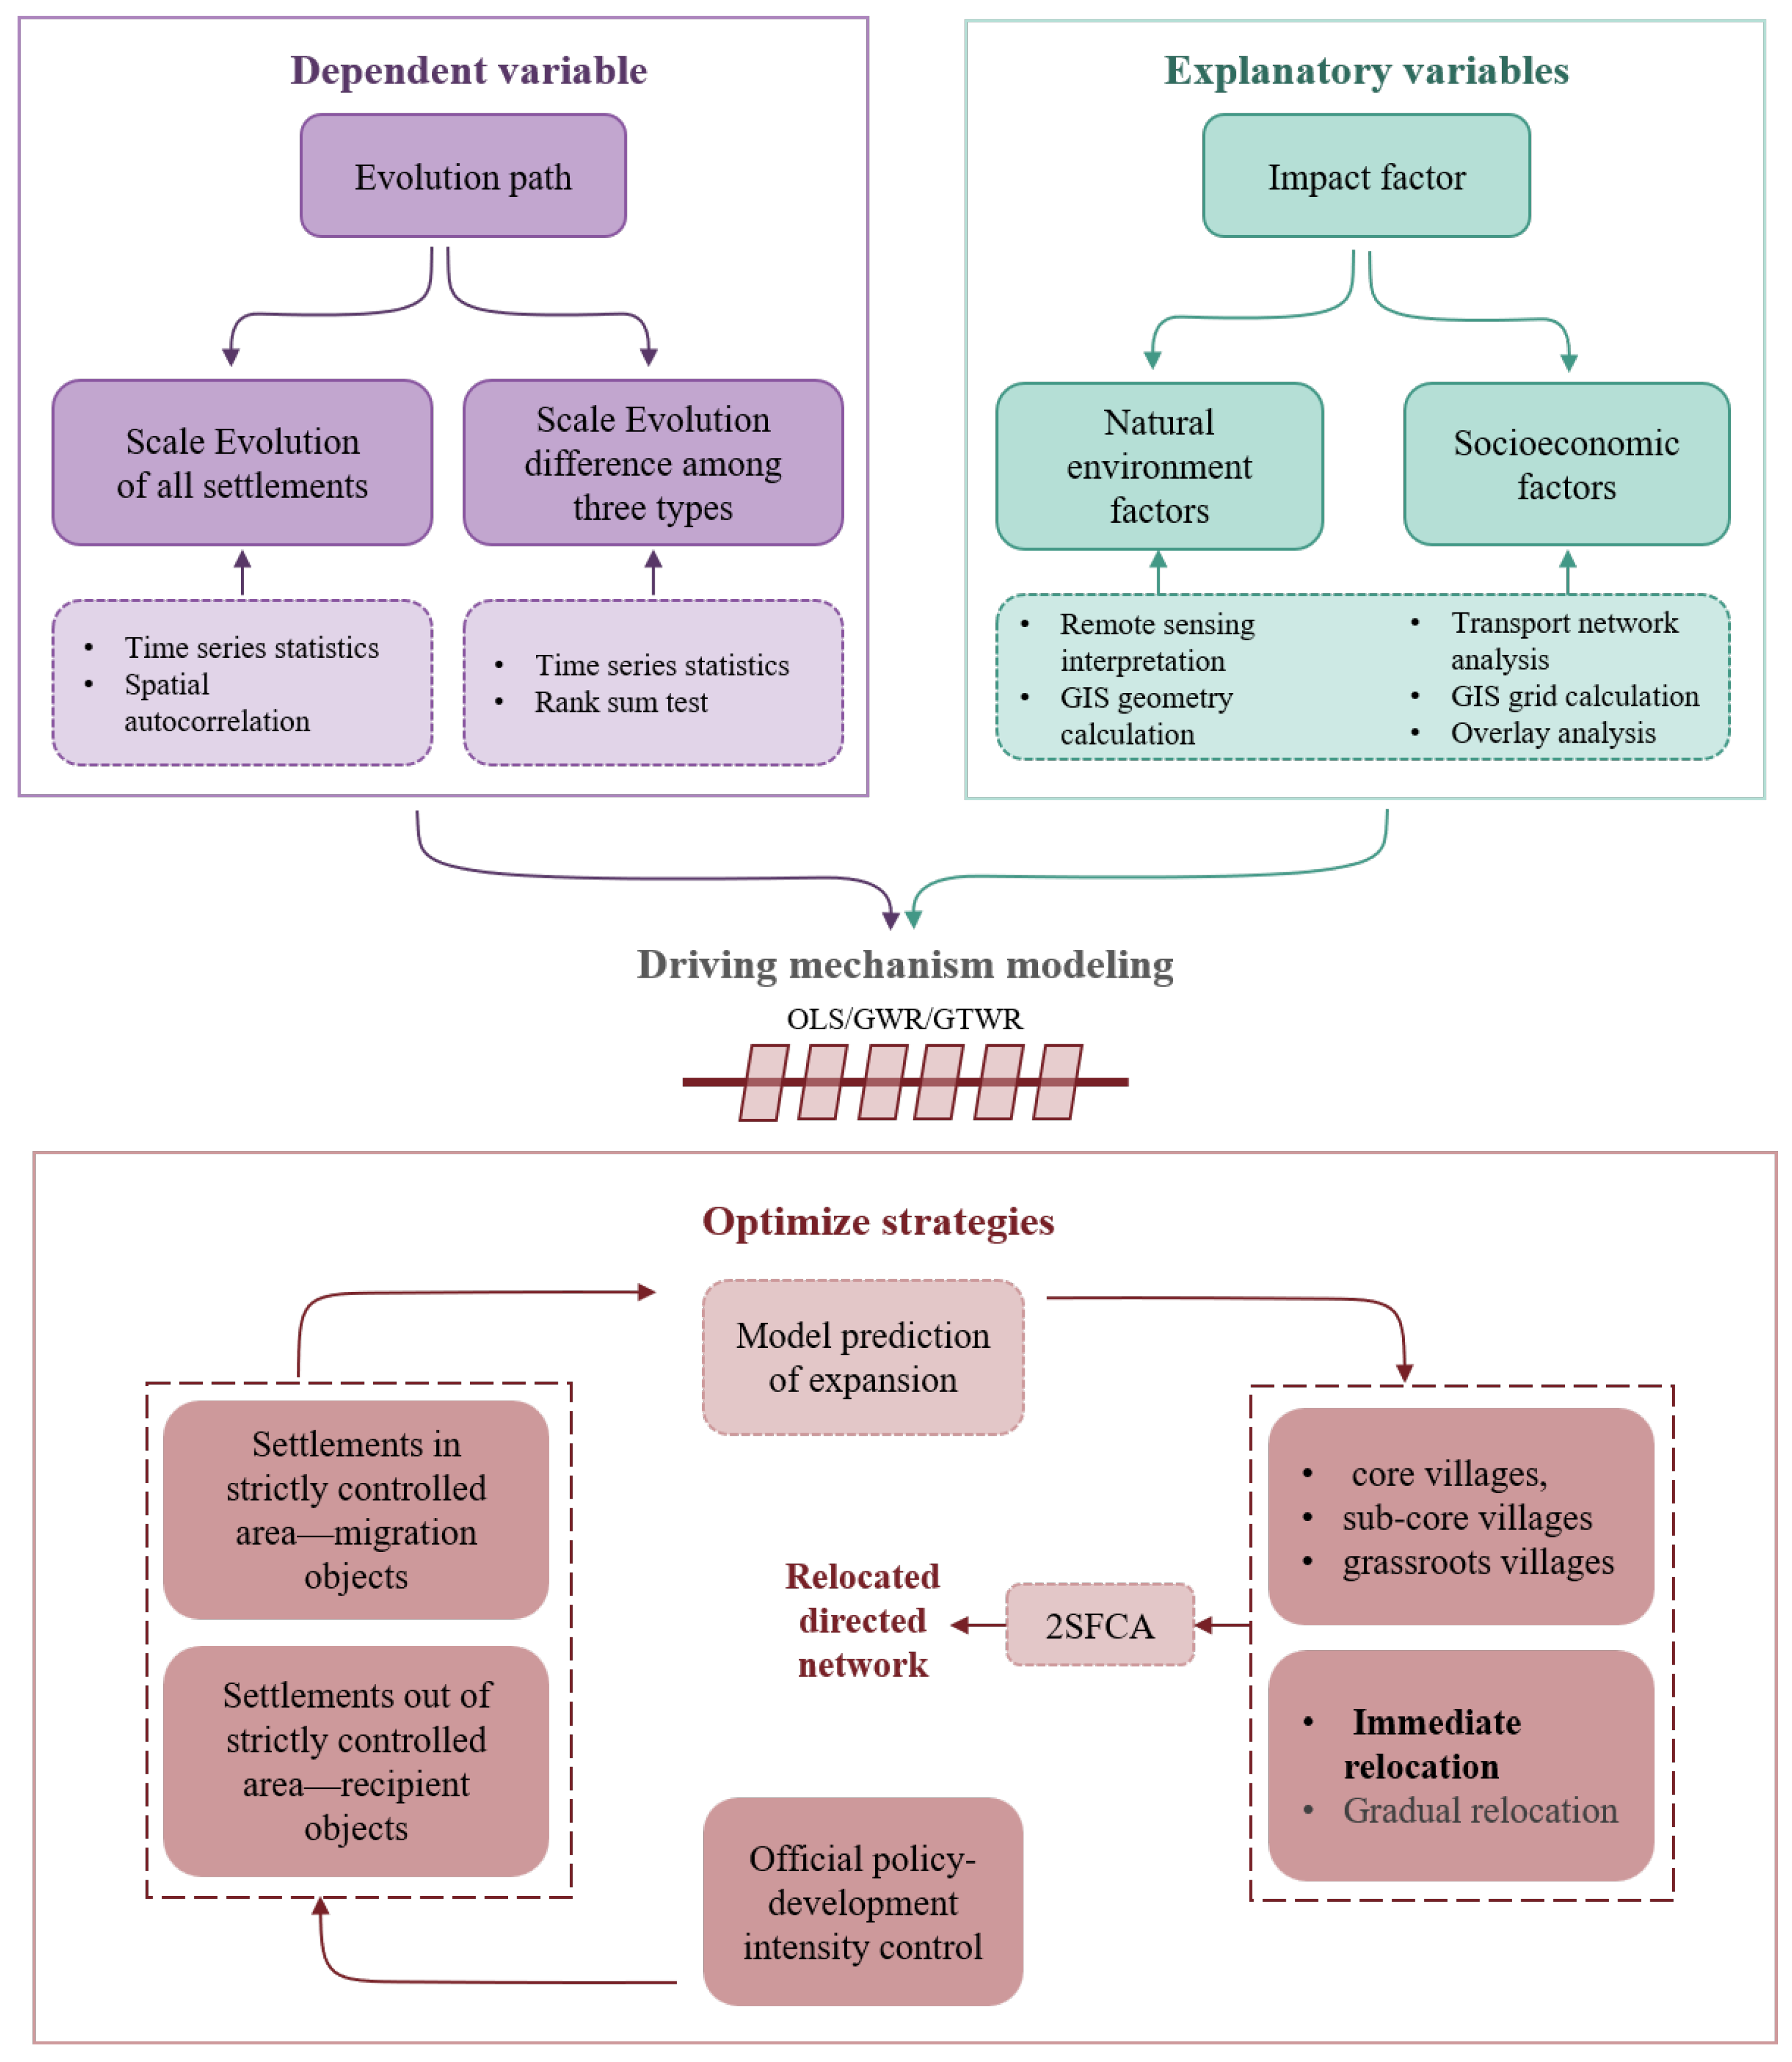
As shown in Figure 3, the technical approach of this paper is divided into three phases. The first phase involves analyzing the expansion of settlement patches. The paper extracts the patch area of all settlements in Anxin County for all study years. And it further calculates the area increment (Area) of patches to measure the scale evolution between two adjacent study years. The multiple Area is used to observe the temporal scale evolution trends and detect hot spots of settlement-scale expansion using the spatial autocorrelation model. Additionally, to analyze the impact of the relationship between settlements and water bodies’ area expansions, the study observed the Area of settlements in groups and determined the dominance of area growth in three types of settlements across multiple study years using the rank sum test method.
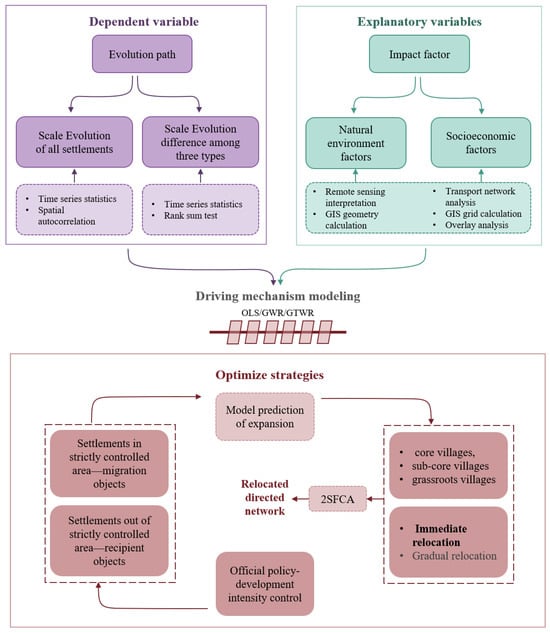
Figure 3.
Framework for studying settlement evolution, driving mechanism, and the formulation of optimization strategies.
The second phase is a modeling of driving mechanisms using Area as the dependent variable. Based on a literature review, two major categories of independent variables, natural environmental factors and socio-economic factors, were identified, and the values of these variables for each study year were calculated. Before modeling, the independent variables from the previous study year were matched with the dependent variable Area in the next period, for example, using the independent variables of 1936 with the area increment from 1936 to 1964. Modeling experiments were conducted using the ordinary least squares (OLS)/geographically weighted regression (GWR)/geographically and temporally weighted regression (GTWR) models, and the optimal modeling results were selected. The resulting model has the capability of predicting growth in the next stage based on the independent variables of the previous study year.
The third phase involves classifying settlement types (those needing relocation and those accepting in-migrants) and conducting land consolidation, using the above model to obtain predictions for settlement area growth. On the one hand, settlements within the “ecological plan” stringent control area were all regarded as potential relocation candidates. Those exhibiting high area growth were classified as the “requiring immediate relocation” type, while the remaining were categorized as the “gradual relocation” type. On the other hand, settlements outside the strict control area were considered potential recipients of relocated populations. Based on the area growth prediction, they were classified into three types: core settlement, sub-core settlement, and grassroots settlement, with their capacity to receive relocated populations decreasing sequentially. Finally, using the 2-step floating catchment area (2SFCA) method, the most suitable recipients for the villages needing relocation were identified.
3.3.1. Measurement of Settlement Evolution
- (1)
- Area evolution
“Calculate Geometry Attributes” in ArcGIS was used to calculate the area of the settlement patches in each study year. Based on this, we calculated the change in the patch area between adjacent study years.
where represents patch , and is the th study year.
- (2)
- Rank sum test
The rank sum test was used to measure whether there was a difference in the overall distribution of data among multiple independent samples, instead of simply calculating the overall average. In this study, it was used for a statistical comparison of the growth of the patch area among three groups of settlements.
- (3)
- Spatial autocorrelation
Spatial autocorrelation was used to measure the spatial dependence of the variables. Spatial dependence indicates that a variable is correlated with spatial location, and it has global and local scales. In this study, it was used to detect the spatial autocorrelation of settlemant areas and area changes.
Global spatial autocorrelation was measured using index (see Equation (2)).
where represents the complete number, represents the observations at the ith point, represents the adjacency relationship of the ith and jth point, such that, if i is adjacent to , = 1, and otherwise = 0, and is the mean squared error (MSE) of all , given by Equation (3):
The value of Moran’s I lies between [−1] and [1]. As the absolute value approaches 0, it indicates that the spatial autocorrelation of the variable is stronger. Conversely, as the absolute value approaches 1, it indicates that the variable’s spatial distribution is uniform. The score indicates whether the results are significant.
- > 1.96: the probability of a random high-cluster is less than 5%;
- −1.96 < < 1.96: random distribution;
- < −1.96: the probability of a random low-cluster is less than 5%.
Local spatial autocorrelation was measured using the Getis–Ord statistic; see Equation (4). It identifies regions with high values (hot spots) and regions with low values (cold spots). A p-value and z-scores () are generated for each spatial unit. The p-value determines the confidence of the result. When p is small, it means that the observed spatial pattern is unlikely to arise from random processes. represents the degree of aggregation. If its value is positive and large in magnitude, the area has high value aggregation. Conversely, if its value is negative and large in magnitude, the area has low value aggregation.
where is the spatial weight between the ith and jth feature, is the total number of features, and is the attribute value of feature . And
3.3.2. Driving Mechanism
- (1)
- Indicator system
Drawing upon a comprehensive review of relevant literature in related fields and concerning the Baiyangdian area, this study formulated a distinctive indicator system, as presented in Table 1.

Table 1.
Summary of indicator system.
- (2)
- Geographically weighted regression (GWR)
In this study, a GWR model was used to explore the varying relationships between the dependent variable and the independent variables shown in Table 1. Specifically, for each study year, the entire set of independent variables was calculated, and the area growth was modeled from this study year to the next study year as the dependent variable. The resulting model has the ability to predict the area growth in the next time period.
The baseline model for geographically weighted regression (GWR) is the ordinary least squares (OLS) regression model, following Equation (7).
In this model, represents the intercept, represents the coefficients for each explanatory variable, and represents the residual, which is the difference between the predicted values and the actual values.
Based on the OLS model, GWR embeds the spatial characteristics of the sample data into the regression parameters, thereby improving the accuracy of the traditional regression model, as shown in Equation (8).
where (,) represents the latitude and longitude of the spatial location of the ith point, signifies the kth explanatory variable of the ith point along with its corresponding coefficient, , and denotes the residual, representing the difference between the predicted and actual values at the ith point. Unlike the traditional linear regression model, which yields a global coefficient for each predictor variable, GWR computes distinct local coefficients for each variable at different locations (each ith point), making it a form of a local multivariate regression model.
Following the results of spatial autocorrelation, the Area, which allows for distinct spatial clustering, was selected as this study’s explanatory variable. The values of all indicators for the study period were computed and then utilized in the subsequent modeling of Area in the following years. For instance, the variable indicators for a settlement in 1936 correspond to the Area in the period of 1936–1964. Ultimately, this led to the formulation of five GWR models.
- (3)
- Geographically and temporally weighted regression (GTWR)
The application and modeling approach of the GTWR model are consistent with that of the GWR. However, geographically and temporally weighted regression (GTWR) incorporates a temporal parameter into the GWR model. This enables the reflection of temporal heterogeneity, in addition to spatial heterogeneity, as shown in Equation (9):
The coefficients in GTWR are functions of both the geographical location and the observation time. Similar to traditional GWR, parameter estimation in the spatiotemporal context necessitates selecting neighboring data for joint parameter estimation. However, GTWR and GWR differ in the spatiotemporal weighting function, as the calculation of the distance between point i and point j requires simultaneous consideration of both temporal and spatial distances. This resembles the calculation of the distance between two points in a three-dimensional ellipsoid, and it can be expressed as follows:
3.3.3. Destination Search
- (1)
- Two-step floating catchment area
The 2-step floating catchment area method [81] was used to determine the destination for settlements’ relocation located on the ecological strict control area in Anxin County. This algorithm is essentially a spatial accessibility algorithm. It assumes the existence of two types of points in space: one type serves as supply points that can provide certain services, such as green spaces or medical facilities, while the other type represents demand points that require these services. In this study, the settlements seeking relocation are designated as supply points, while the settlements capable of receiving relocated populations are set as demand points. The first step (shown in Equation (11)) involved conducting a search for all demand points within a specified radius of supply point j and computing the supply–demand ratio, , for each supply point.
where is the area of supply settlements, indexes the demand settlements within the search radius, is the search radius, and is the area of settlement k.
The second step involved searching for supply points within the radius of each demand point i. The sum of the supply–demand ratios of all supply points within this radius was then calculated (Equation (12)) to determine the accessibility of the demand point.
where represents the demand points, and represents the supply points. denotes the ”accessibility” of the demand point, which, in this context, can be understood as the difficulty of relocation. refers to the distance between points, and . signifies the search radius. is the supply–demand ratio.
- (2)
- Migration–recipient settlement matching
Due to the possibility of retrieving multiple demand point villages within the search radius of each supply point village, it is necessary, based on the calculation results from Equation (12) and the value, to identify the optimal target village for each migration village . The attractiveness function, , of the target village for the migration village was selected for this purpose, and the maximum value was chosen as the best result.
4. Results
4.1. Evolution of Settlements
Figure 4 shows an increasing trend in the scale and the area change of settlements between consecutive study years. The gap between the area and area change widens gradually, suggesting a significant polarization in the scale and growth of villages. After 1996, there is a noticeable acceleration in the rate of growth. When this is combined with Figure 5, the extent and geographical patterns of expansion for each settlement can be discerned. The color gradient, from dark to light, represents the observation time. The following patterns were observed:
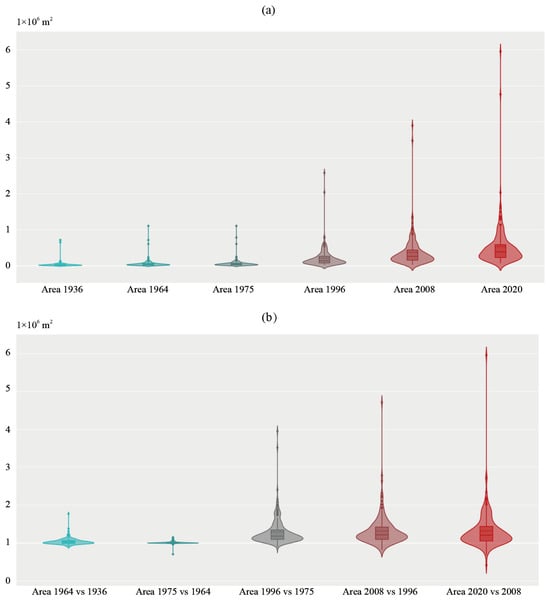
Figure 4.
The area evolution of Anxin County’s settlements: (a) area evolution; (b) area increase evolution.
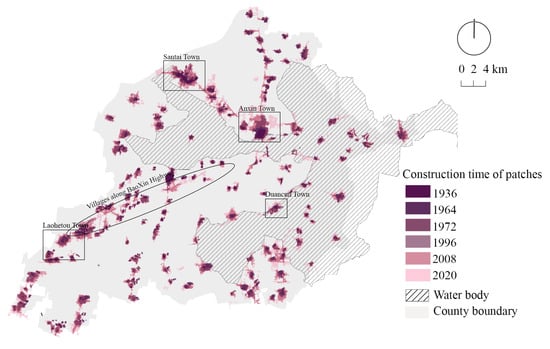
Figure 5.
The expansion process of settlements in Anxin County.
- Settlements in close proximity tend to expand and merge due to mutual gravitational forces, such as the villages between Santai Town and Anxin County Town, and the villages in Laohetou Town;
- Some settlements exhibit a linear expansion trend due to the attraction of road elements, for example, those along the Baoxin Highway; the semi-waterside settlements adjacent to dikes show a tendency to initially expand towards water bodies before extending into the plains, as seen in Duancun Town, indicating the dual influence of water bodies on human settlements;
- Furthermore, the larger settlements demonstrate a greater potential for expansion, leading to a tendency for larger-scale expansion.
The global spatial autocorrelation of settlement areas across six time periods (Table 2) and their area transformations (Table 3) were explored. It was found that the spatial clustering of settlement areas is an incremental process. Prior to 1975, village areas were all randomly distributed. However, weak clustering began to emerge around 1996, and in subsequent years, the clustering tended to become significant. The growth of settlement areas between different time periods exhibits significant geographic clustering effects. This led us to further analyze its local spatial autocorrelation using a regression model.
Table 2.
Spatial autocorrelation results of settlement area.
Table 3.
Spatial autocorrelation results of settlements’ area change.
Figure 6 displays the clustering of areas with a high local spatial autocorrelation for area change ( area) between consecutive study years. There was significant expansion in the area between Anxin Town center (as well as the center of the whole county) and Santai Town center. The settlements around them were influenced by the radiation effect of the two county-level centers, and they have abundant land resources, leading to rapid development. Other township centers also experienced evident expansion, including Laohetou Town, Luzhuang Town, Tongkou Town, Duancun Town, and Liulizhuang Town. However, the settlements around them did not experience significant expansion, and they failed to form a development band like Anxin-Santai Town. In summary, most settlements with a high-value clustering of growth are near water bodies or located at the edge of the county, but they experienced a driving effect from outside.
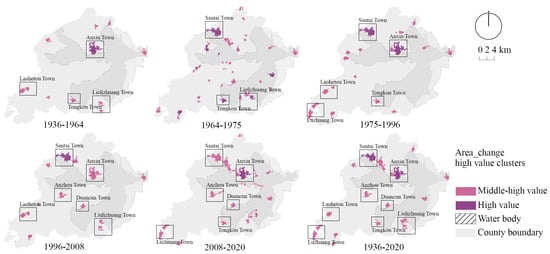
Figure 6.
The high–value cluster of settlements according to Getis–Ord Gi*.
4.2. The Difference in Evolution Paths among Three Types of Settlements
Figure 7 illustrates the evolution of settlement areas for three types of settlements, showing different expansion processes for each type. Land settlements are the most numerous, with the steepest slope in their expansion curve. Semi-water villages, on the other hand, have smaller area growth than land and water villages. Some semi-water villages experience long-term stagnation in growth, while Anxin County Town shows the fastest expansion rate. Lastly, water settlements exhibit a dispersed but continuous growth trend. This continuous expansion of water settlements could potentially pose a significant hazard as a future source of water pollution. Additionally, all types of villages experienced the most significant expansion between 1975 and 1996.
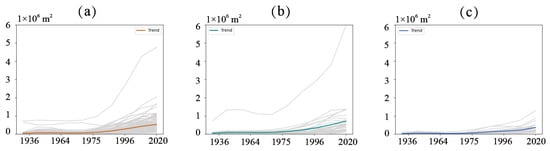
Figure 7.
The area evolution trends of different settlement types: (a) land settlements, (b) semi-waterside settlements, and (c) water settlements.
Using the rank sum test, we compared the growth speeds of different types of settlements. The results in Table 4 show that, during the study period, the expansion speeds of the three types of villages were converging. Before 1964, the Baiyangdian area was not enclosed, and it relied heavily on water bodies for production and lifestyle. During this time, semi-waterside settlements, which were located at the center of both water and land transportation and had docks and market towns, experienced rapid growth. However, with the establishment of a modern road network and the transition from water to land transportation, land settlements expanded the fastest due to convenient transportation and the advantage of having ample land for expansion. After 2008, semi-waterside settlements continued to grow at the fastest rate, mainly driven by the rapid growth of Anxin County Town, a semi-waterside settlement. Additionally, during this period, water settlements expanded more than land settlements, indicating increasing human development pressure on water bodies, particularly due to the development of tourism and other industries.
Table 4.
Spatial autocorrelation results of settlements’ area change.
In summary, the expansion of settlements in Anxin County exhibits significant spatiotemporal heterogeneity, and different types of settlements display inter-group differences in their evolution processes. Therefore, the introduction of spatial regression models was warranted to further explore the driving mechanisms behind the evolution of settlement areas.
4.3. Evolution-Driving Mechanism
Based on the diagnostic results in Table 5, three models were evaluated using the following three indicators. A smaller Akaike information criterion (AIC) value indicates a more concise and accurate model, a higher adjusted R-squared value suggests a better fit, and the residual sum of squares (RSS) represents the portion of the model that cannot be explained, with a smaller value indicating a better fit. Among all models, the OLS model performs the worst. GWR and GTWR each have their own strengths and weaknesses. GWR models each year separately, resulting in a more concise model with smaller residuals. However, GTWR exhibits an adjusted R-squared value higher than that of GWR, as it builds a model for six time slices of the same sample, demonstrating a better fit.
Table 5.
The result of model diagnostics.
The OLS results from Table 6 reveal significant variations that impact area changes. In summary, natural environmental factors had a significant influence on the years leading up to 1996, while socio-economic factors became significant after 1996. In terms of impact effects, two factors related to water, WSA and FloR, are noteworthy. The coefficient for WSA is predominantly negative, indicating less expansion of settlements located near or within water bodies. On the other hand, FloR has positive coefficients, suggesting greater expansion of settlements in close proximity to water bodies. Population, economy, and farmland holdings consistently exhibit positive coefficients and thus drive settlement expansion.
Table 6.
Significance of influencing factors.
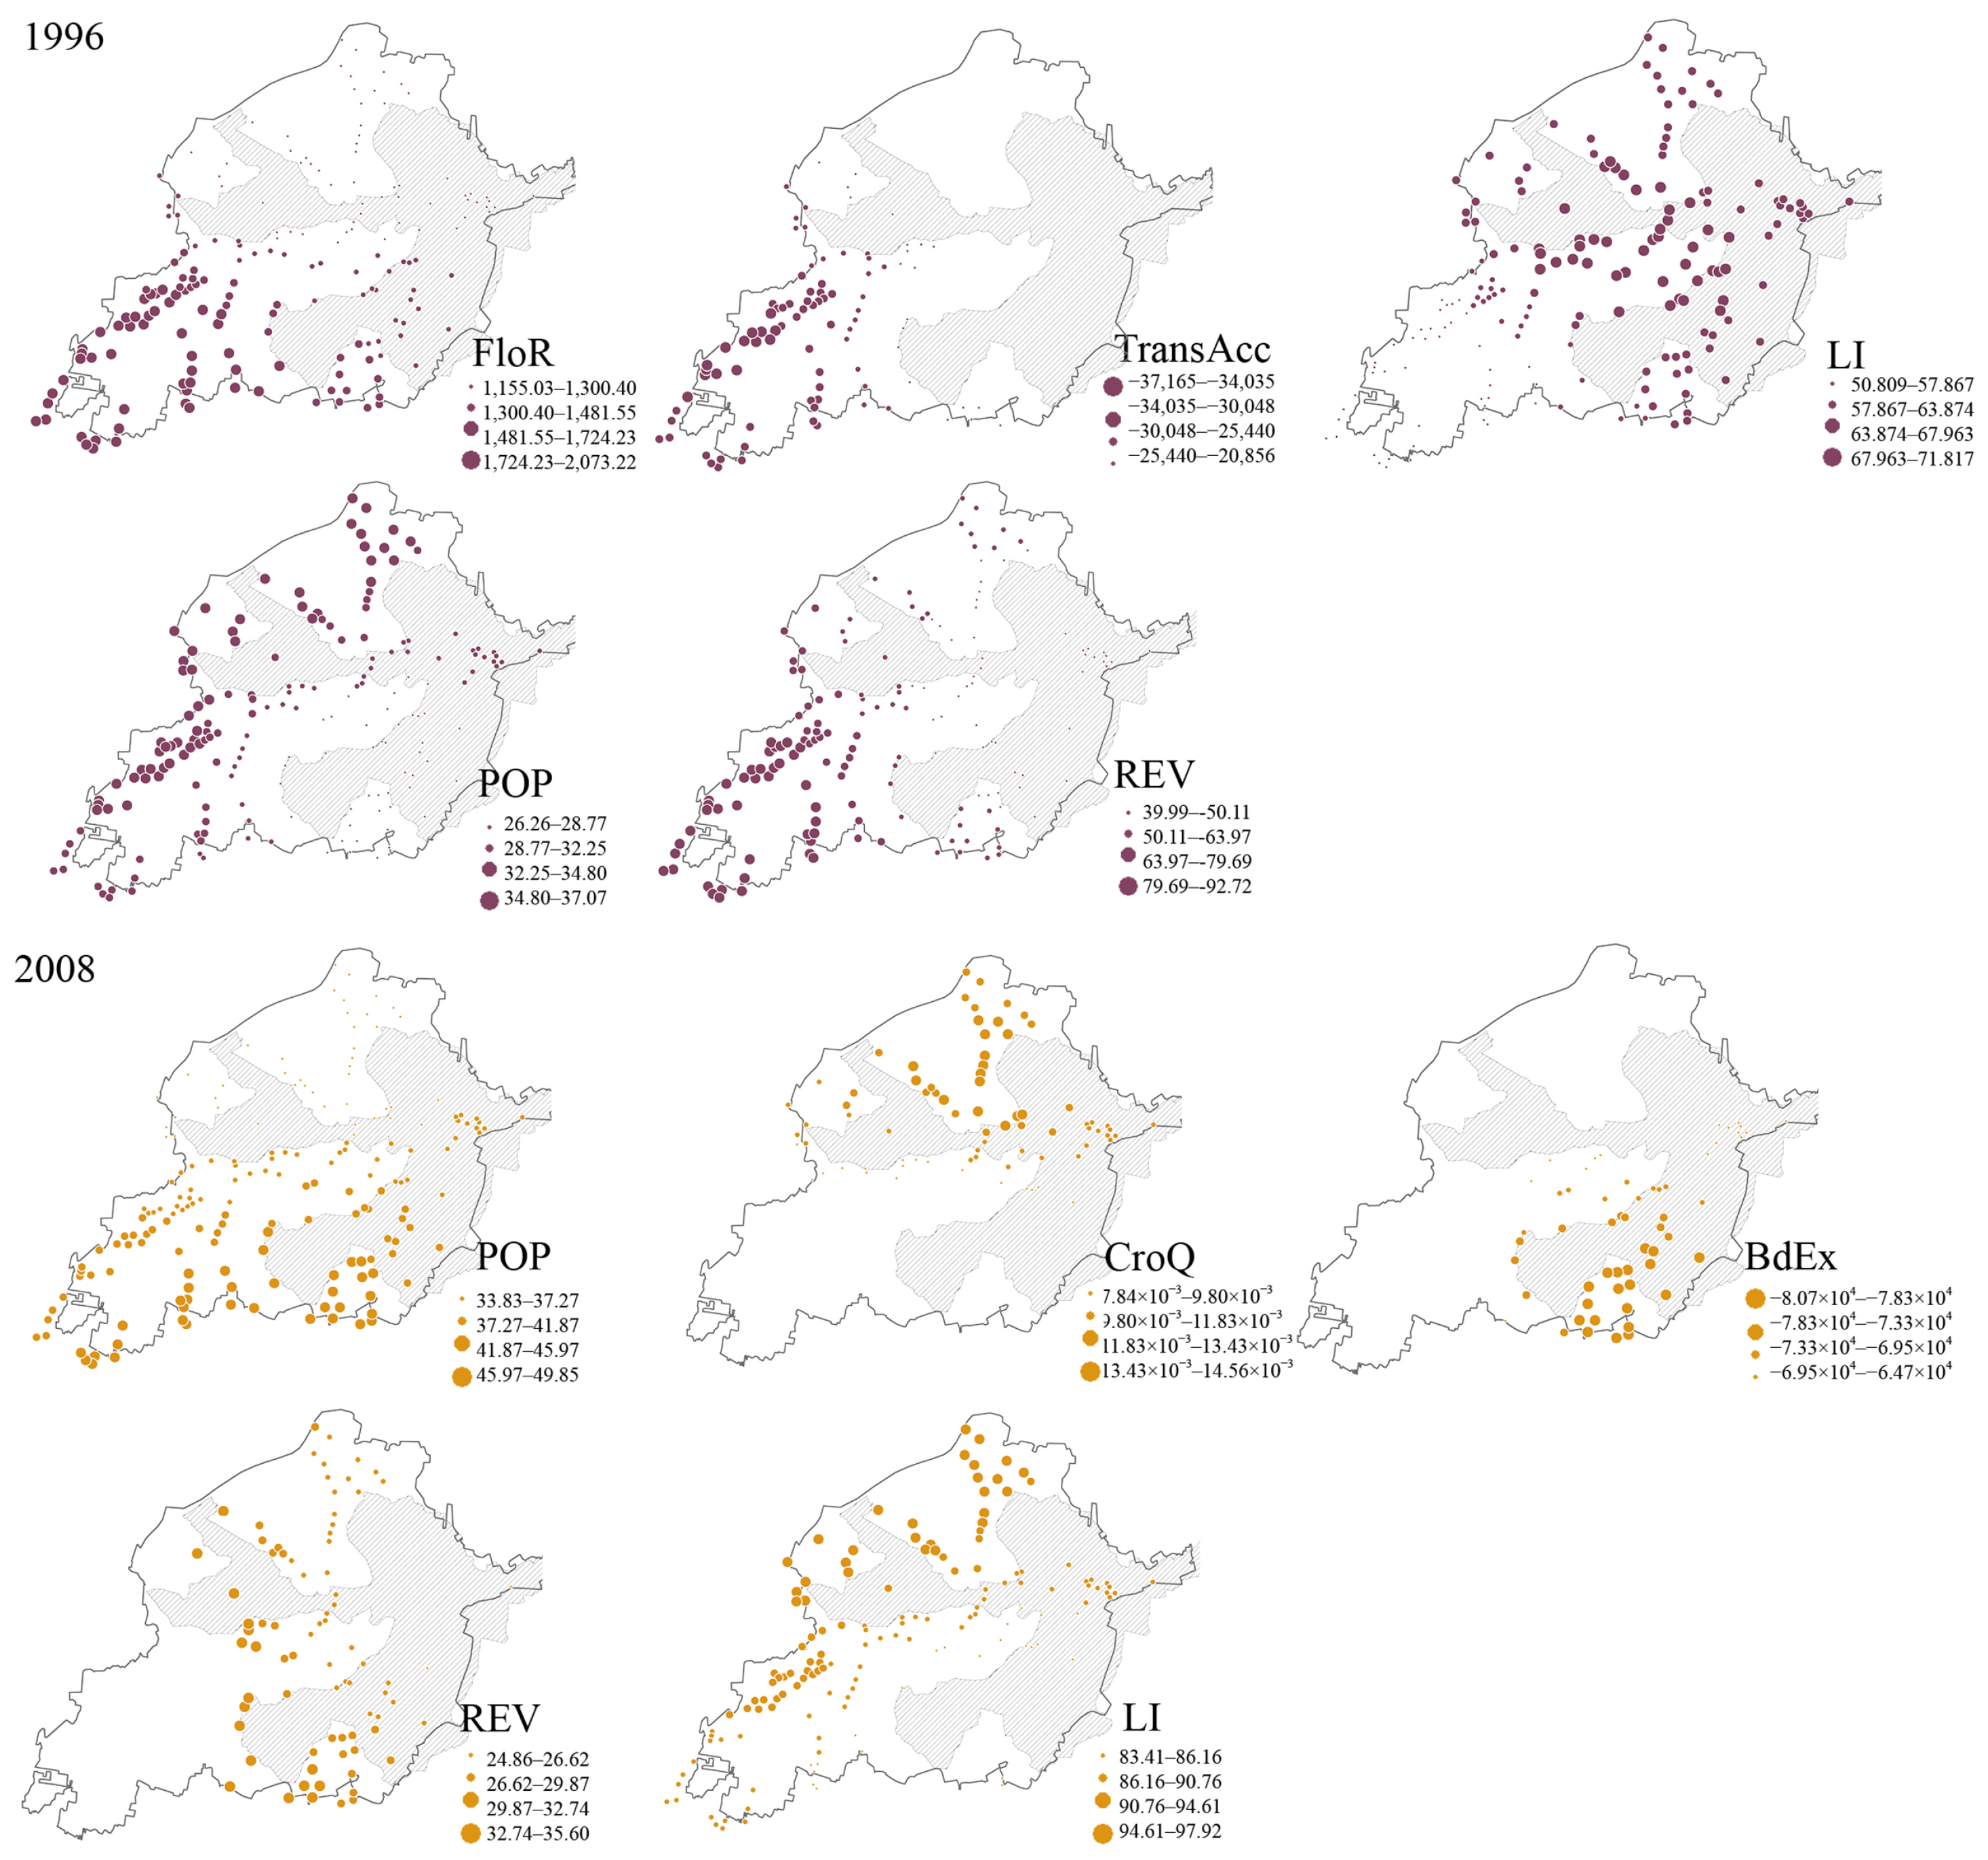
Figure 8 shows the coefficient spatial pattern between the independent variables of each study year and the dependent variable with the area growth in the next time interval.
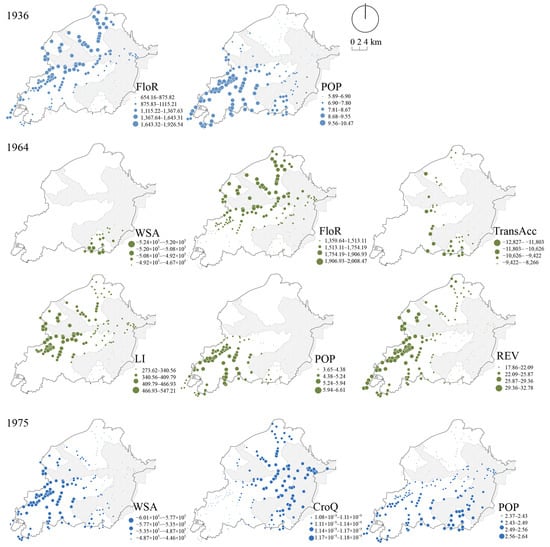
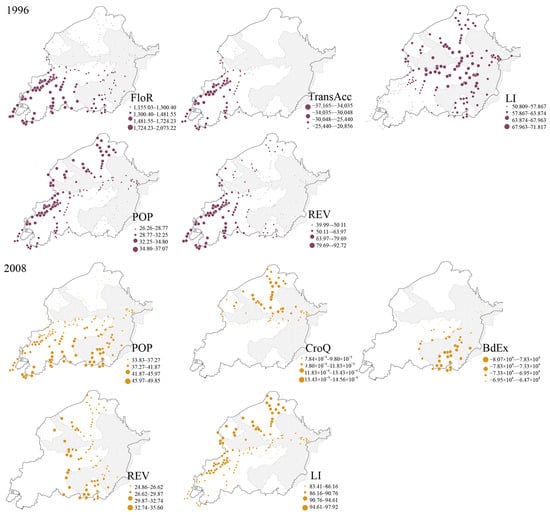
Figure 8.
The spatial pattern of the significantly influenced factors according to the GWR results.
- The significant influence factors in 1936 include FloR and Pop. FloR exhibits strong positive effects in the northern and southwestern areas of water bodies, while Pop mainly influenced southwest plain were less affected by water;
- In 1964, WSA exhibited a negative impact, particularly affecting villages in Liulizhuang Town. The impact of FloR was similar to that in 1936. TransAcc displayed a negative effect in the Liulizhuang Town area and in several semi-waterside settlements. The positive effect of LI was significant primarily situated on the west side of water bodies, including Zhaili Town, Laohetou Town, and Anzhou Town (the former county center), showing the highest impact intensity. The influence patterns of the POP and REV are similar to those in 1936, with a notable positive impact in areas with minimal influence from water bodies;
- In 1975, WSA exhibited a notably negative effect on villages in the southwest plain that far from the water bodies. CroQ had a significant positive impact on many water settlements and those on the northern shore of the Baiyangdian Lake. REV kept the influence pattern in 1964. Additionally, in comparison to previous results, the influence of the Pop factor expanded to include Liulizhuang Town on the southern side of the water bodies;
- In 1996, FloR and TransAcc both affect the southwest region of the county, with the former exhibiting a positive impact and the latter a negative impact. The positive impact range of LI encompasses most settlements except those in the southwestern plains. The influence range of Pop expands towards the north shore, while the influence range of REV remains unchanged;
- In 2008, the positive impact range of CroQ was only significant in the northern areas of Dawang Town and Anxin Town, no longer showing a significant impact on water settlements. The influence range of REV expands towards the north shore. BdEx had a negative impact on expansion, only concentrating in the southern part of Liulizhuang Town.
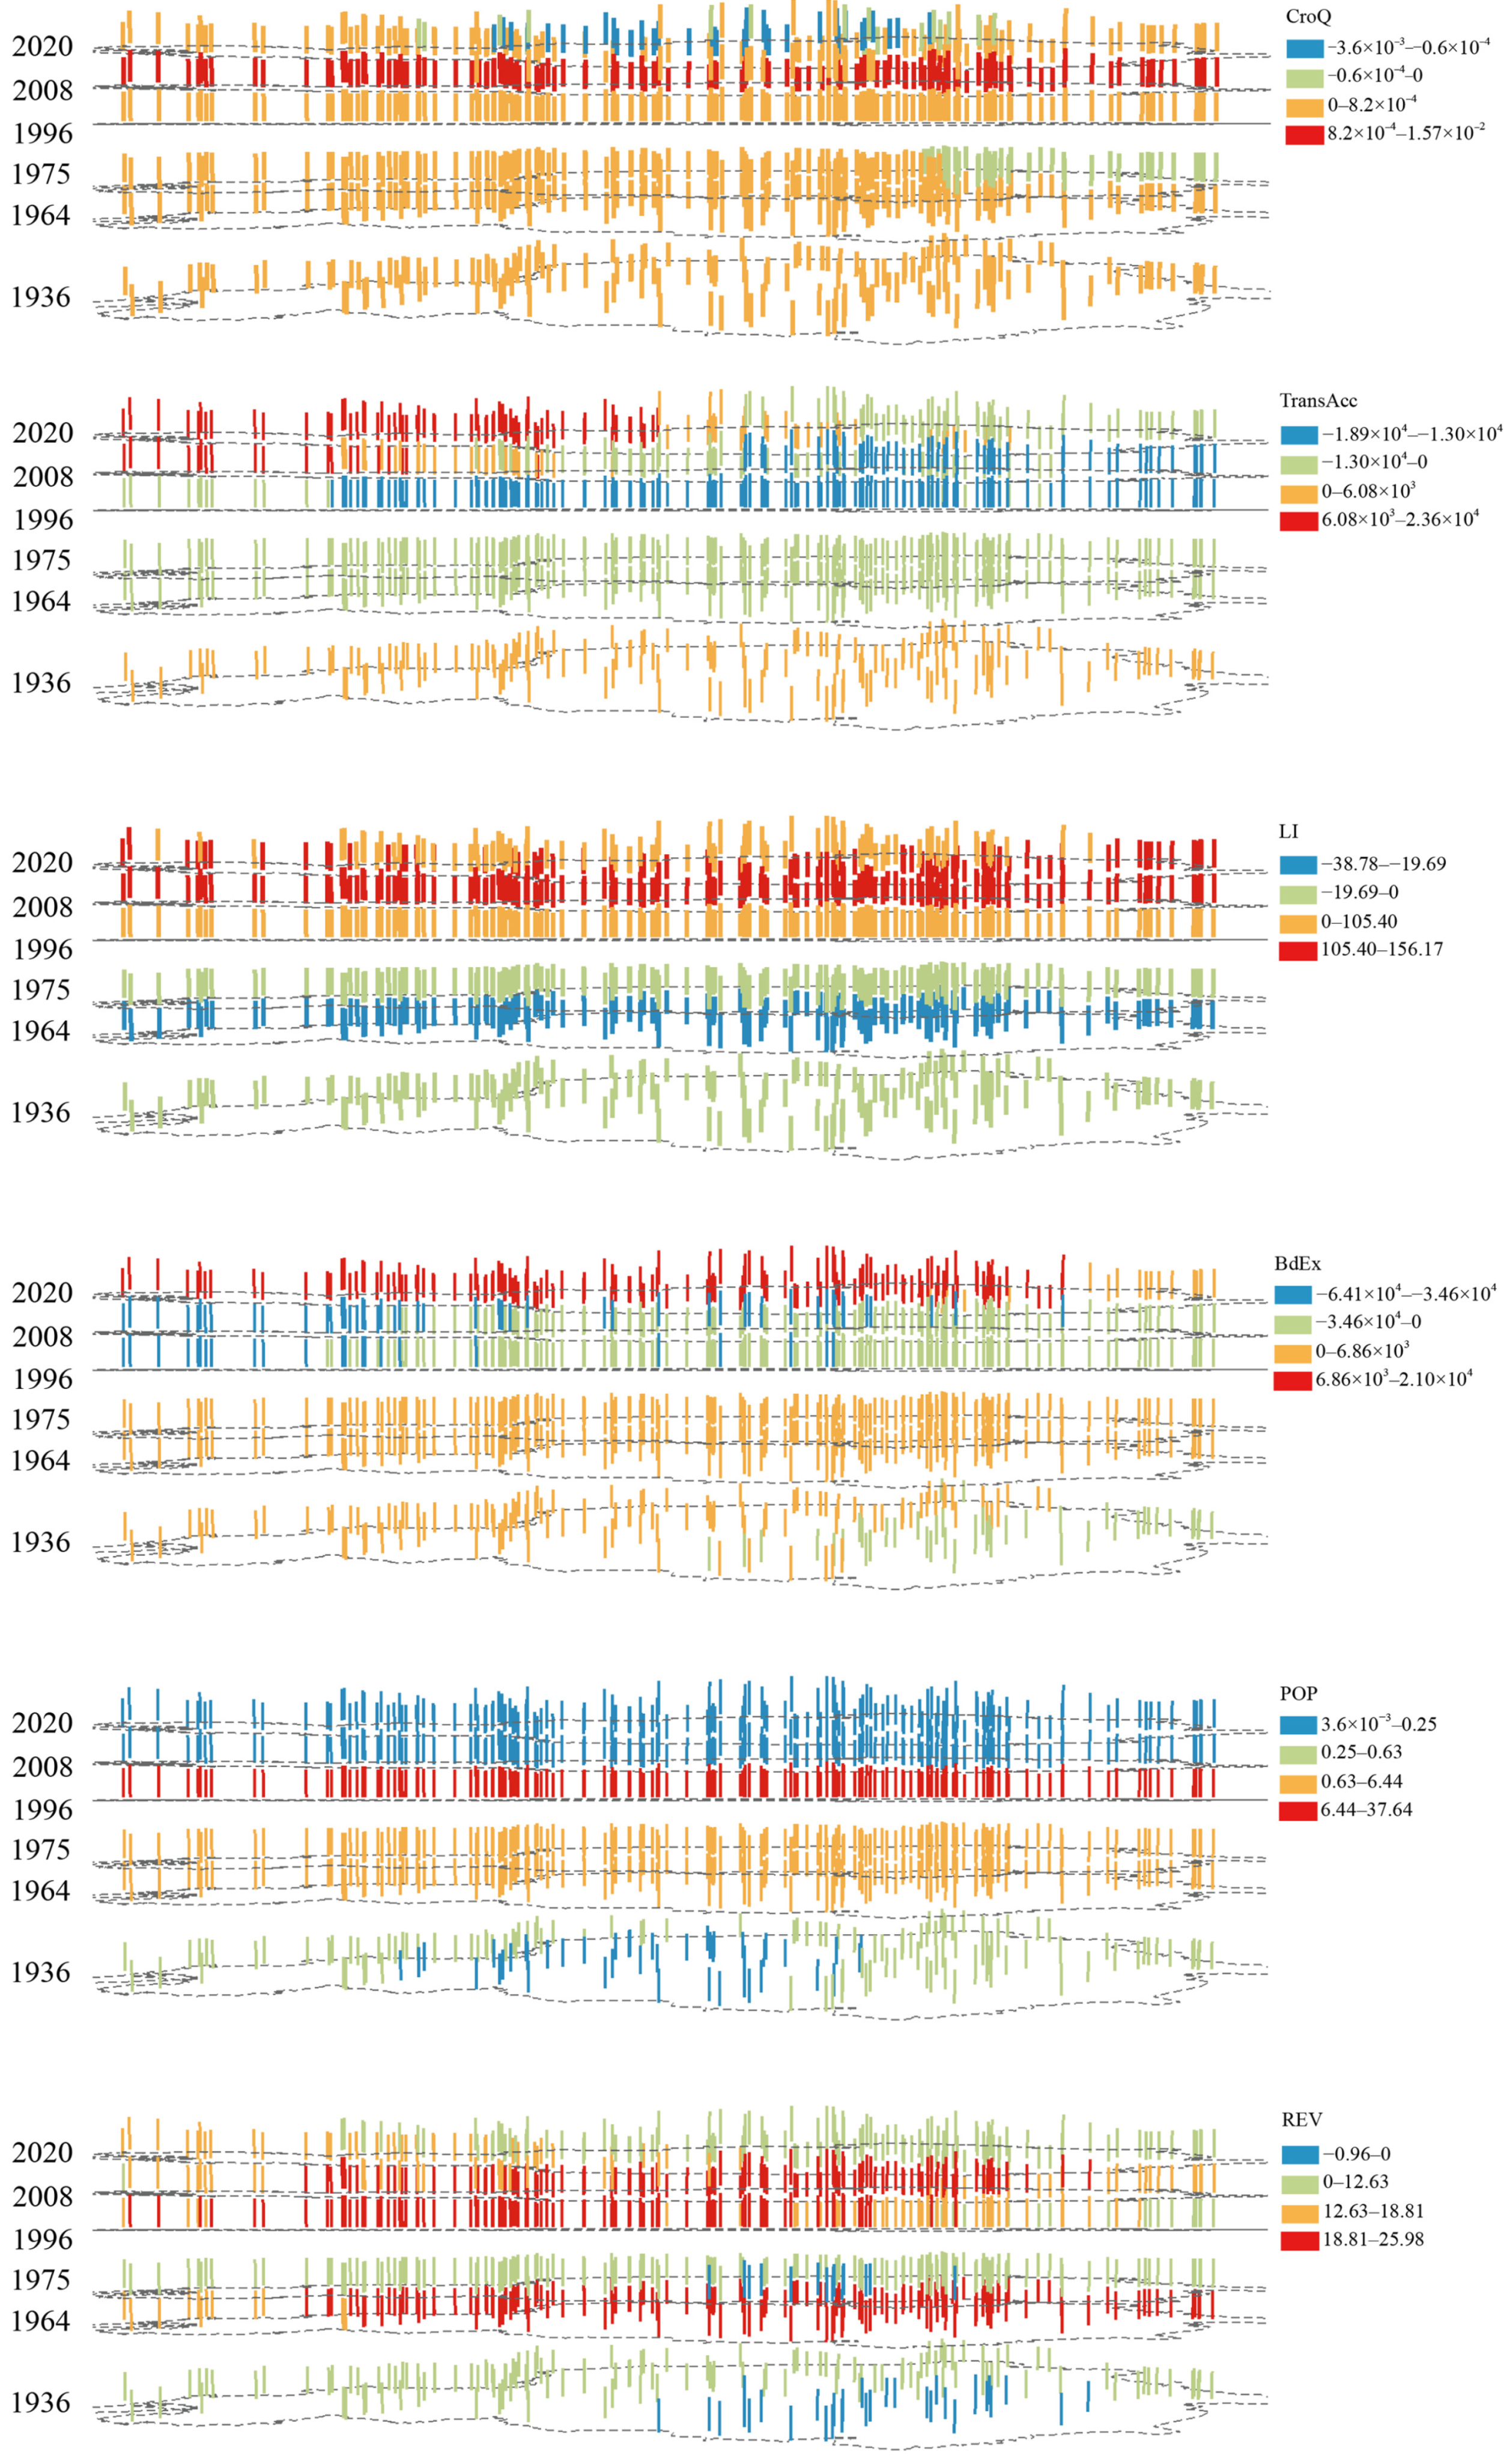
Using the results from GTWR (Figure 9), we demonstrate the temporal variations in the directional effects of each factor. With the exception of individual factors showing no change in direction, we uniformly use cool colors to represent negative effects and warm colors to represent positive effects.
Figure 9.
The temporal change in the significantly influenced factors according to the GTWR results.
- EcoS exhibited a weak negative effect up to 1975; a strong positive effect emerged in 1975, but it changed to a strong negative effect in 1996, followed by a strong positive effect in 2008, indicating the recent expansion of eco-sensitive villages without considering environmental damage;
- WSA showed a strengthened negative effect from 1936 to 1975, but it changed to a positive effect after 1996. It also indicates that settlements closely integrated with water bodies experienced faster expansion, leading to disturbances in the ecosystem in recent years;
- FloR consistently demonstrated a weak negative impact on expansion;
- TP also showed a shift in direction, from a positive effect from 1936 to 1975 to a negative effect from 1996 to 2008, reflecting a preference for expansion first in semi-waterside and water settlements and later in semi-waterside and land settlements;
- TransAcc firstly displayed a weak positive impact in 1936, which turned into a negative impact in 1964 and 1975, which intensified in 1996 and 2008, mainly affecting plains settlements far from water bodies. Their growth was inhibited due to the concentration of village points in this area;
- LI exhibited a negative impact until 1996, especially in 1964. In earlier years, the higher-level administrative center, while providing market services to the lower-level center, also had a restraining effect on the lower-level market. With the weakening of the restraining effect due to the rural construction movement during the reform and opening up, it turned into a driving force, and after 1996, the impact of the location factor was entirely positive; its impact peaked in 2008.
- The Pop coefficient was consistently positive, and its positive effect gradually strengthened from 1936 to 1996 but diminished after 2008. Village-area expansion is no longer largely driven by simple population growth, and expansion is not necessarily used to construct more housing, potentially due to the development of other enterprises or factories.
- With the exception of 1936 and 1975, REV consistently had a strong positive impact on expansion.
- BdEx exhibited a positive effect before 1996, which turned into a negative effect in 1996 and intensified. Well-developed internal villages previously tended to expand outward, but after 1996, they could no longer balance internal development and expansion.
4.4. Optimizing Strategy for Land Consolidation
The “Ecological Plan” [11] specifies that the area surrounding the lake for approximately 600 square kilometers requires strict development control. This study aims to promote the implementation of this plan and proposes a strategy for the relocation of settlements within the strictly control area. By calculation, this area is approximately a 100-m buffer zone extending outward from the Baiyangdian Lake water body. All settlements within the control zone are considered potential relocation subjects, while all settlements outside the first tier are potential relocation destinations.
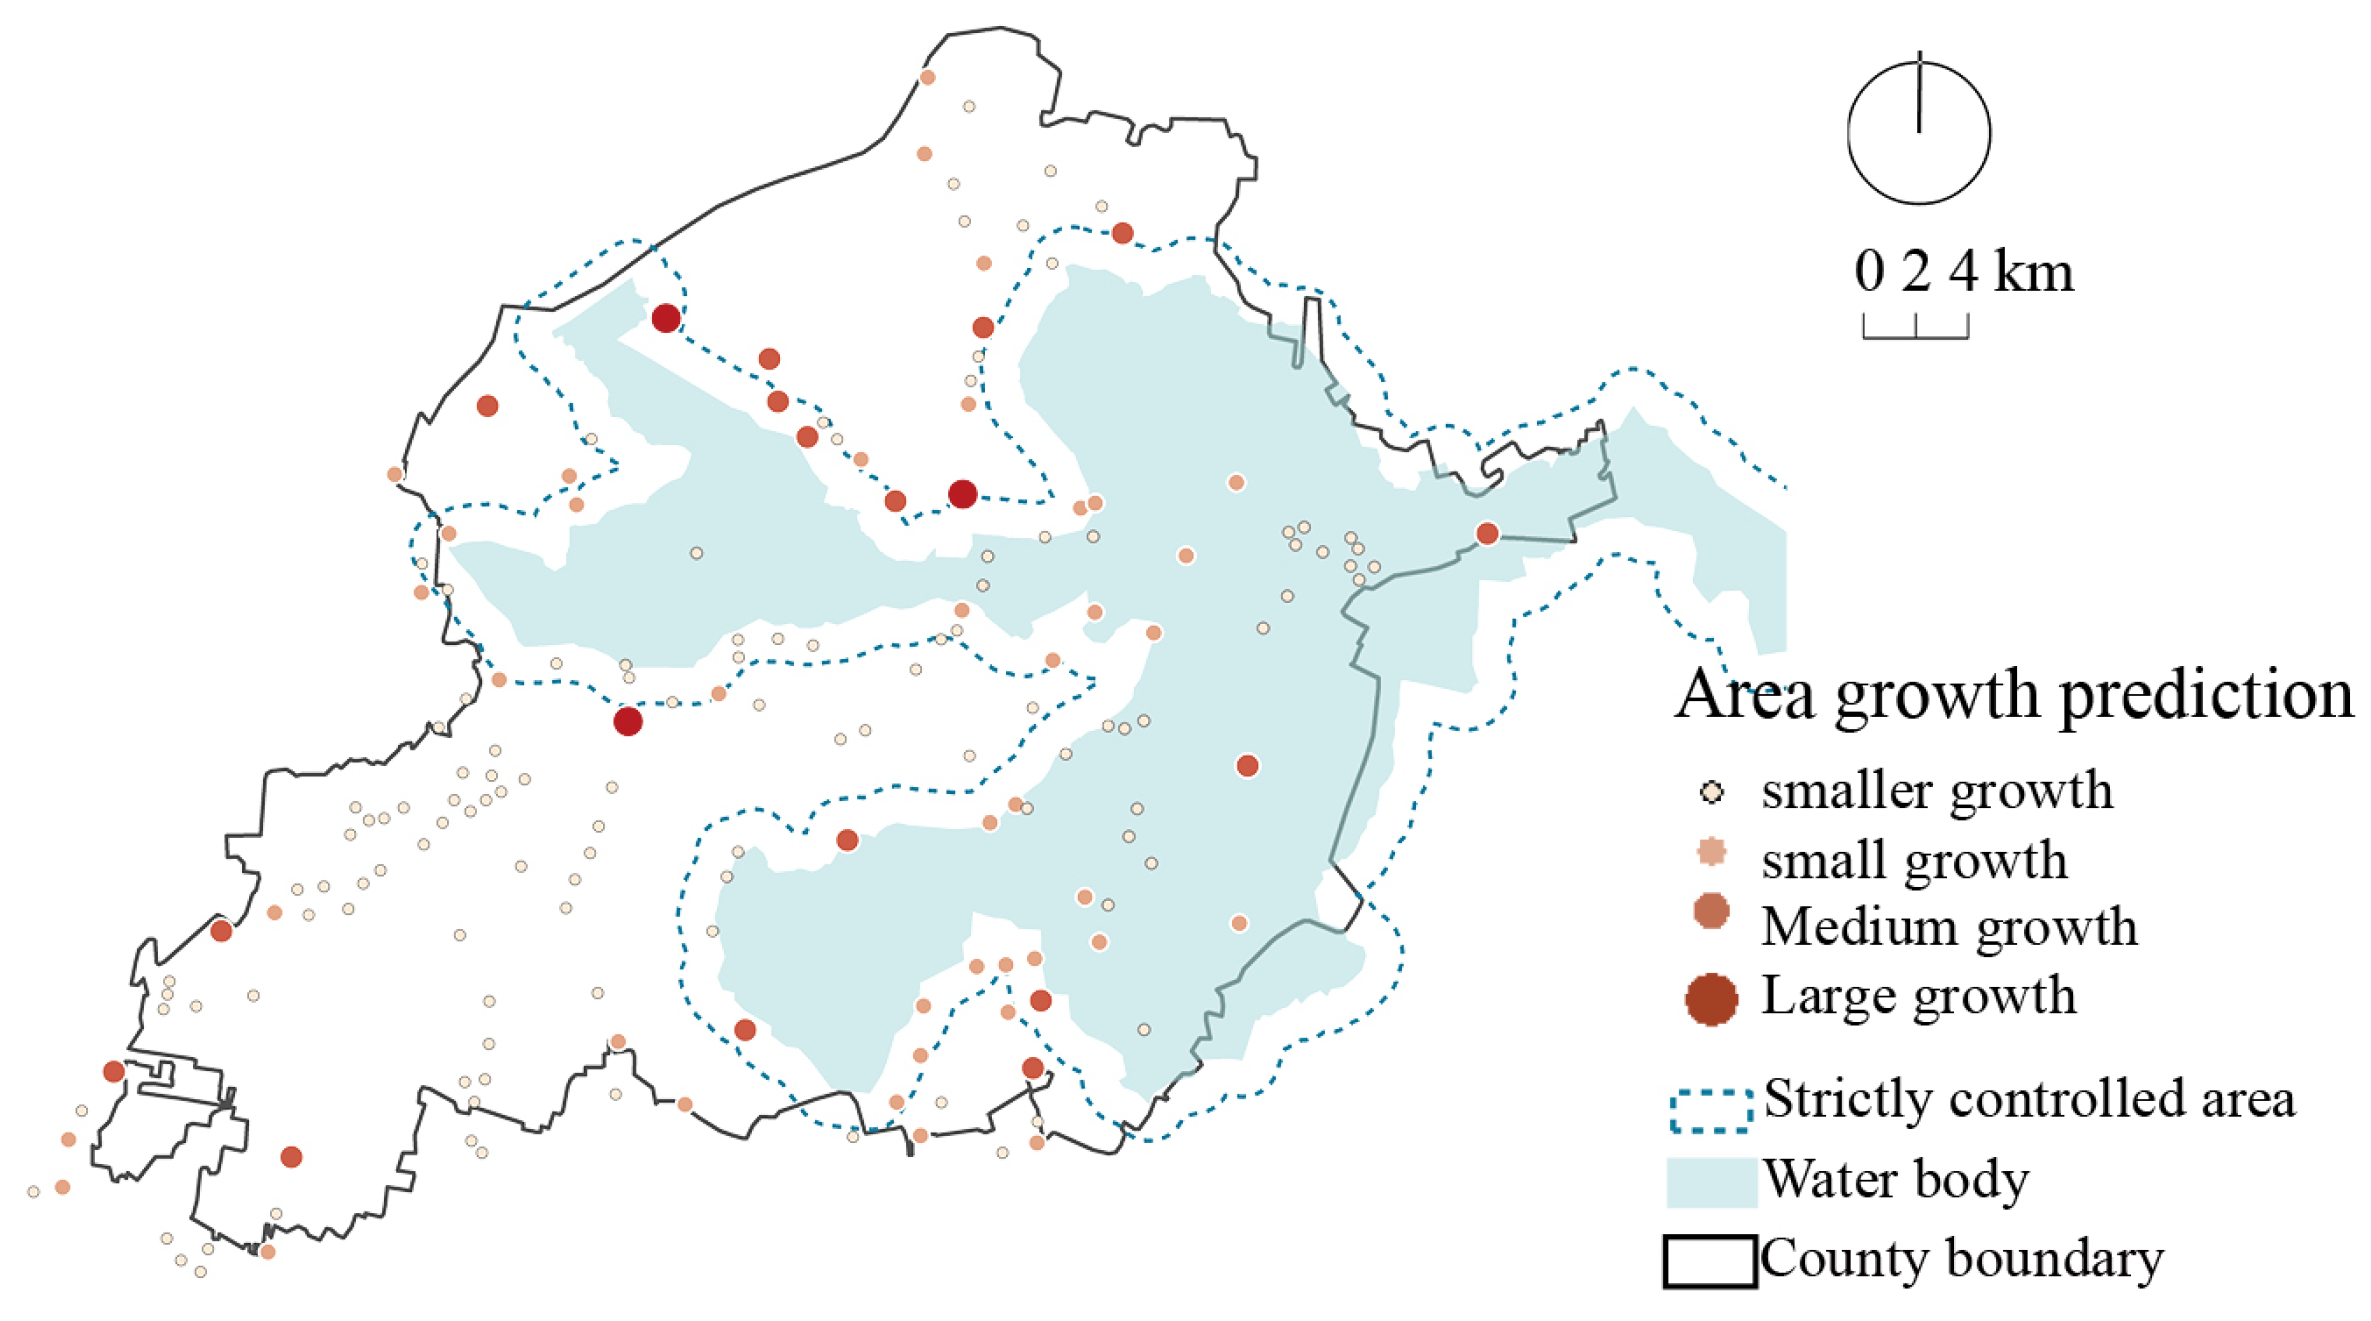
After the data from 2020 were input for the model in Section 4.3, the predicted results for the area growth of each village in Anxin County for the next time period were obtained, as shown in Figure 10. The forecast indicates that all township-level centers will experience significant expansion. Additionally, the settlements located between Santai Town and Anxin County Town generally exhibit high expansion values. There are also several villages with significant expansion along the Simentai area and in the vicinity of the Four Gates Embankment. Most villages in Liulizhuang Town and Zhaili Township are expected to undergo substantial expansion. The blue line in Figure 9 is the boundary between the first and second tiers. It can be observed that many villages showing a significant expansion trend are located within the strictly controlled area. Therefore, relocation has become an issue that must be addressed.
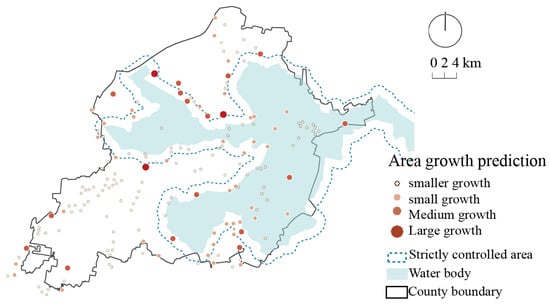
Figure 10.
Predicted results for settlements’ expansion after 2020.
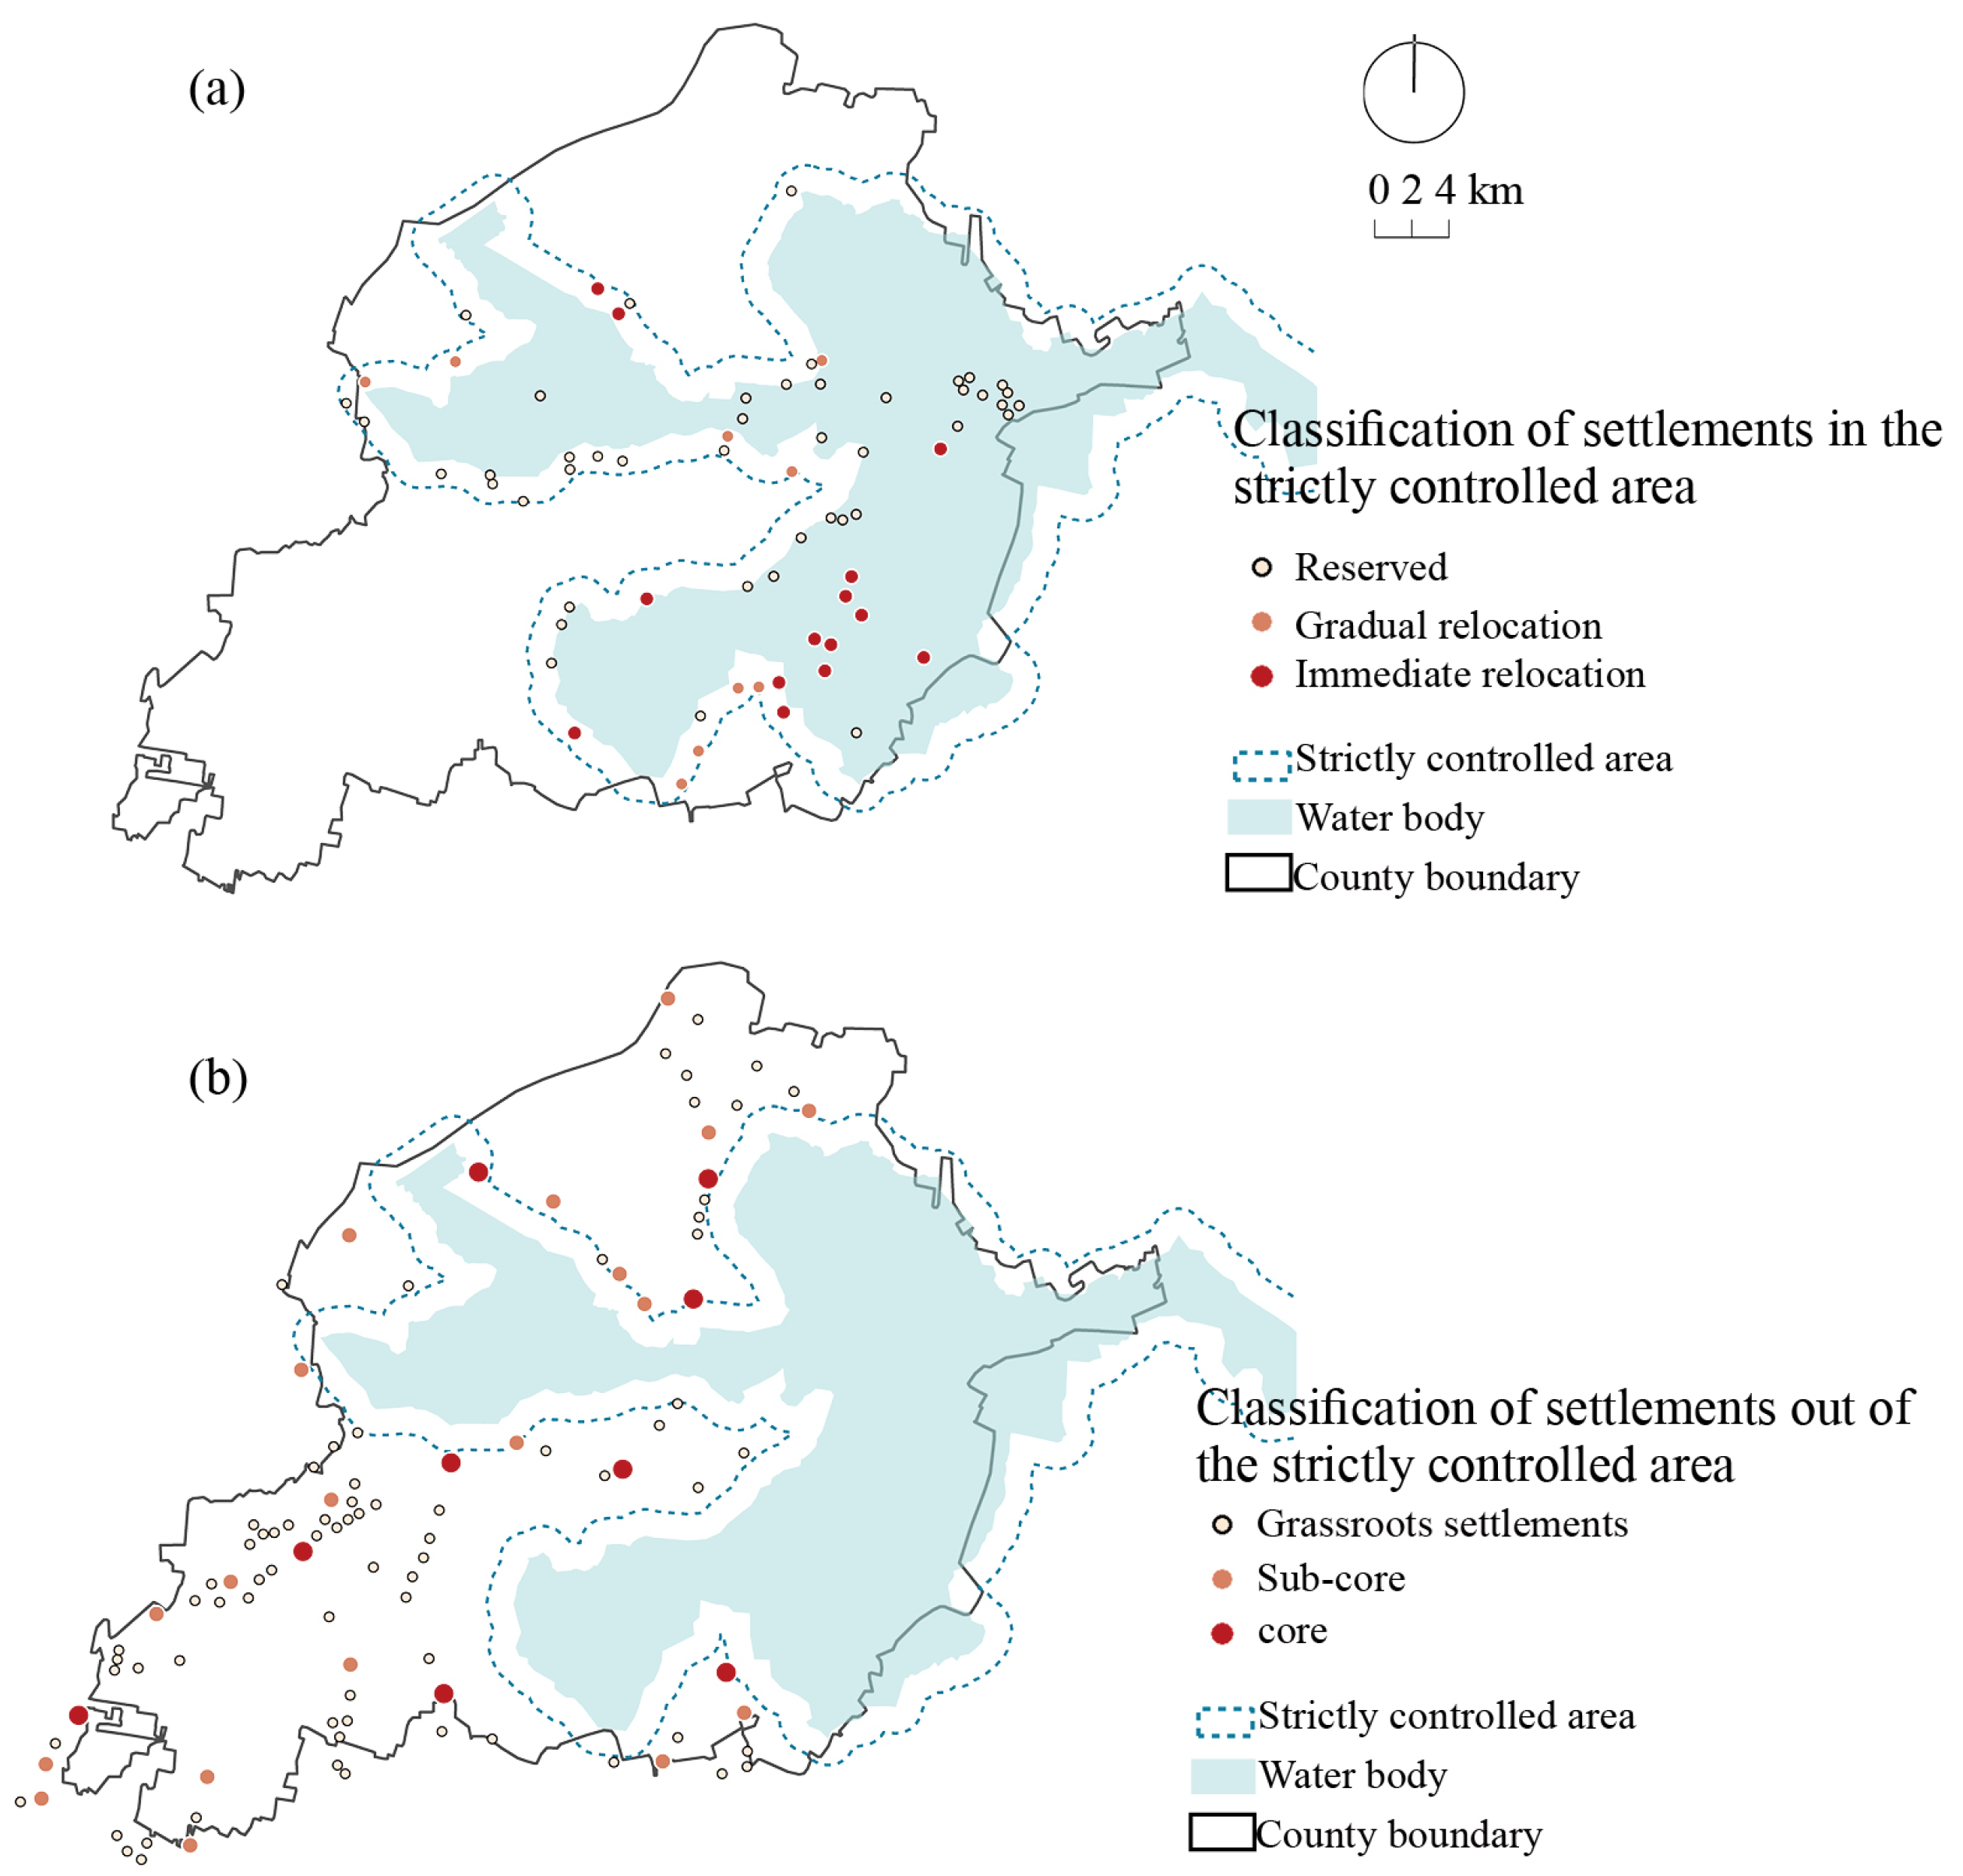
According to the plan for the strictly ecologically controlled area within the first tier, the settlements will be categorized into either relocation settlements or settlement villages based on their expansion levels surpassing a certain threshold. Villages with expansion levels higher than the threshold will be designated as settlements requiring immediate relocation, with the exception of areas where cultural significance is present, namely Guolikou Palace, Duancun Palace, Quantou Palace, and Zhaobeikou Palace. Meanwhile, the relocation of other settlements will be temporarily postponed. Finally, a total of 23 villages have been designated for immediate relocation. In addition to the four historically significant villages, there are 40 remaining villages within the first-tier area that are slated for gradual relocation, as illustrated in Figure 11a.
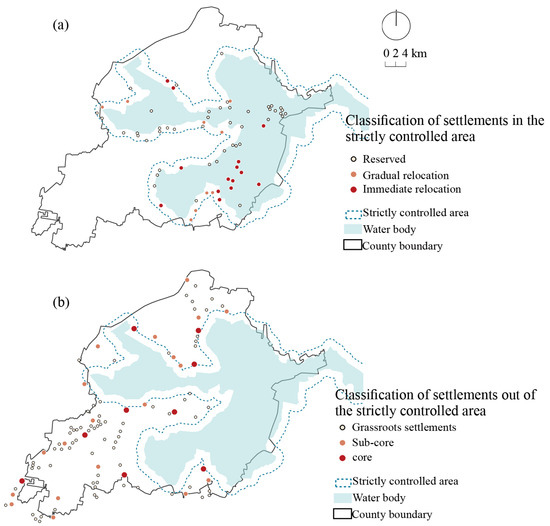
Figure 11.
Settlement type classification: (a) settlements to be relocated; (b) settlements designated as relocated destinations.
The villages situated outside the first tier are considered potential relocation destinations and will accommodate the villages relocating from within the first tier. They will be graded based on the predicted expansion values and categorized into core villages, sub-core villages, and grassroots villages, with the priority for accommodating relocated villages decreasing in that order. The results are depicted in Figure 11b.
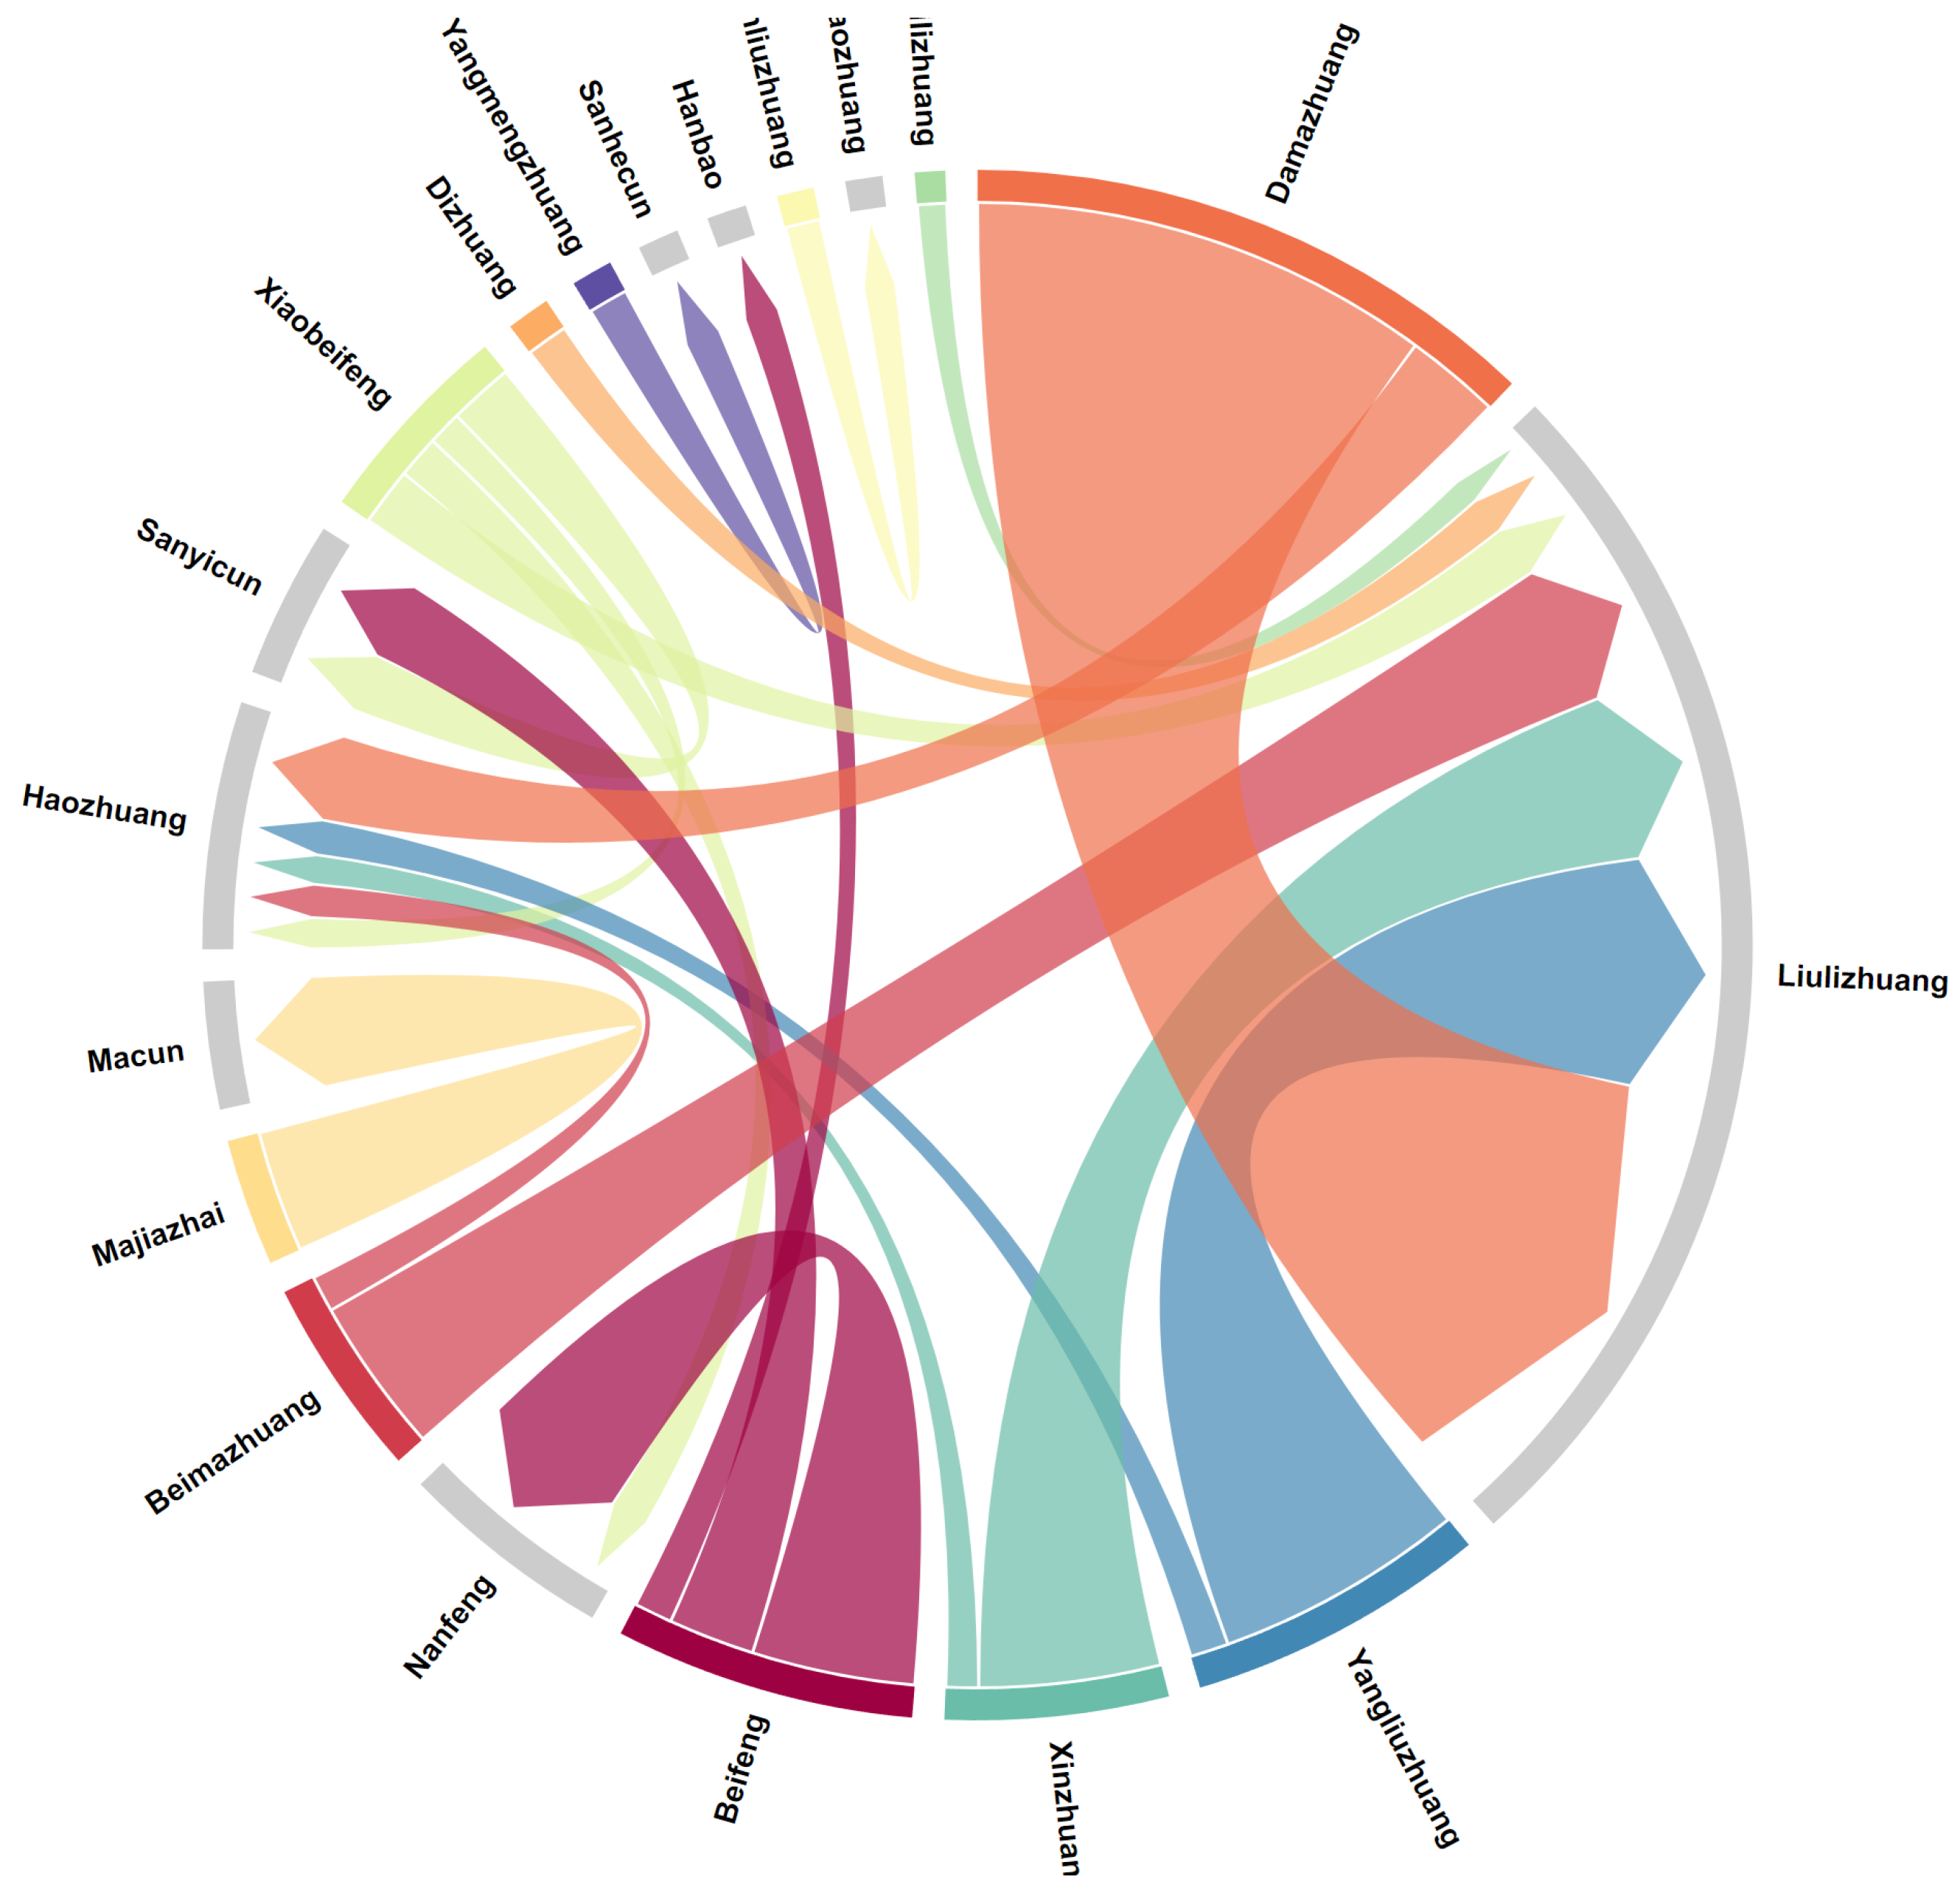
After the provided results were analyzed, a matching strategy was developed to support migration and recipient villages. The first-tier migration villages serve as supply points, while recipient villages outside of this tier are considered demand points. The results indicate multiple demand points for each supply point. For each demand point, this study considers both the supply–demand ratio (as calculated in Formula (14)) and the migration distance from the supply point as factors in determining the evaluation score. Finally, for each supply point, the demand point with the highest score is selected as the destination for each migration village. By constructing a directed network between the supply and demand points, as shown in Figure 12, the migration network among villages can be displayed based on the in-degree. The results indicate that Macun, Biancun, Liulizhuang, and Haozhuang are the preferred destinations for migration for several villages, followed by Xibaizhuang, the Anxin County Town, Nandui, and Sanyi Village, among others.
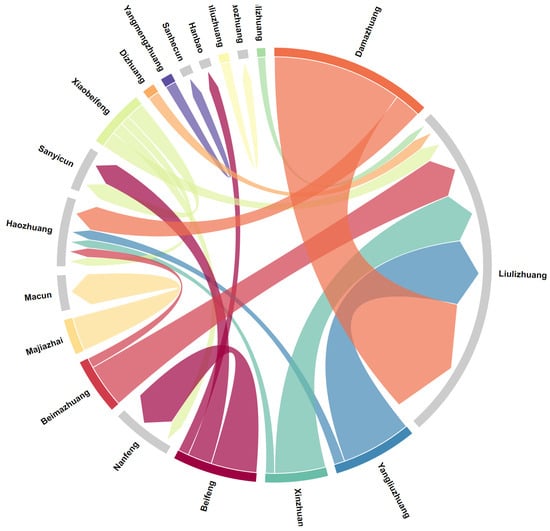
Figure 12.
Settlements’ relocated directed network.
5. Discussion
Our evaluation of rural settlements’ evolution in the Baiyangdian area revealed the complexity of their expansion and driving mechanism. First, the temporal development of settlements is not uniform. There was a leap in development between 1975 and 1996, associated with the rural economic system reforms implemented in mid-1980s China, which drove an increase in crop yields and economic growth in rural areas. Moreover, due to the complexity of the environmental foundation, the development advantages of the three types of settlements continuously shifted during different developmental stages, associated with the predominant modes of transportation in the region. During the period when Baiyangdian had abundant water resources and was connected to other upstream cities through water transportation, settlements in close proximity to water, especially semi-waterside settlements, experienced significant growth. However, as water levels decreased, land settlements on the plains relied on the continuously developing road network to achieve rapid expansion. In the modern era, driven by the tourism industry, water settlements have once again experienced substantial development due to their distinctive landscapes. Second, the expansion of settlements follows certain spatial patterns. Settlements on the land (land and waterside settlements) tend to expand along roads, forming a trend of interconnected development, while those not adjacent to main roads barely expand. The expansion of water settlements is primarily determined by the terrain. In recent years, the decrease in water levels in Baiyangdian has provided convenience for the expansion of water settlements. However, the expansion of residential land within the water bodies will have a negative impact on the aquatic ecological environment.
Based on the modeling results, various factors exhibit temporal and spatial variations in their impacts on settlements’ area expansion. Overall, there is a trend in which natural environmental factors are less constraining, and socio-economic factors have become more dominant. Before 1996, flood risks prompted settlements to expand in directions less affected by floods. However, the expansion of settlements closely associated with water bodies was restricted. Although EcoS did not pass the significance test, based on the results from Figure 9, its coefficient changed from negative to positive after 2008, indicating that village expansion occurred more frequently in ecologically sensitive areas. Regarding socio-economic factors, the influence of higher-level administrative centers became apparent in 1964 and gradually grew stronger. The way in which the transportation system affects the expansion of settlements differs from what has been established in previous research. The existence of water transportation modes means that the growth of certain settlements is not solely dependent on land transportation conditions. Conversely, regions with convenient transportation conditions have a high density of settlement points; thus, their expansion was constrained. The accessibility of farmland positively impacts the expansion of settlements. Farmland not only serves as the primary industry but also provides space for the expansion of settlements. Initially, the population and economy only affected land settlements in the southwest plain, but they eventually spread to settlements in the north shore and some semi-waterside settlements.
The additional following suggestions can be made to optimize local spatial use after formulating relocation strategies for control-area villages and addressing the ecological threat posed by the expansion of water-area villages, as described in Section 4.4.
- Emphasize the development of waterfront areas as a place integrating folk culture and resilient waterside landscapes. Use historical-scenario narratives to showcase traditional scenes, such as fishing and reed production. Furthermore, to minimize ecological disruption and meet the needs of seasonal agricultural production activities, it is advisable to design a spatial utilization plan that allows for flexible use based on seasonal production activities.
- Considering the current contradiction between external village expansion and internal construction, it is important to focus on the efficient use of existing land resources. Each settlement needs to prioritize infilling at the boundaries instead of further land occupation. In densely populated areas, such as the settlements in the southwest vicinity adjacent to major transportation arteries with relatively uniform development levels, promote the consolidation process to achieve the aggregation of residential land and enhance land utilization efficiency.
- In terms of transportation accessibility, planning for the future ”fast and efficient transportation network” requires the establishment of a rational road network connecting settlement points, forming a multi-level road network structure that is well organized and appropriately dense. In the current road network system, certain roads, such as Rongli Highway, need additional intersections with other main roads to effectively connect clusters of villages and improve the overall efficiency of the network.
By implementing these recommendations, the challenges identified in the study can be addressed through spatial optimization in the study area while promoting sustainable development and efficient land use.
6. Conclusions
Against the backdrop of national policies promoting the green ecological developments of Xiong’an National New Area and the importance in terms of ecology of Anxin County, this study focuses on Anxin County’s settlements, a region of significant policy relevance with complex geographical foundations and distinctive cultural–historical characteristics. The research elucidates the spatio-temporal patterns of differential development of these settlements, closely intertwined with the rise and fall of water bodies. As the driving forces shift from being predominantly natural elements to socio-economic factors, the role of policy instruments in shaping future rural development is becoming increasingly prominent. Consequently, conforming to the driving forces while aligning with the goals of green sustainable development, the authorities need to facilitate the orderly relocation of settlements in ecologically restricted areas, facilitate industrial transformation, implement land consolidation in non-restricted areas, enhance the quality of production space, and optimize the upgrading of the road–village transport network.
However, there were certain limitations in this study. In terms of the selection of the research scope, for the convenience of data collection and statistical analysis, only Anxin County was chosen. In reality, if more settlements in the vicinity of the Baiyangdian Lake were considered, and the evolutionary patterns and driving mechanisms were examined, the results could have yielded greater value. In addition, the impact of changes in the transportation system on the development of the three types of settlements in the region warrants further investigation. The comprehensive water–land transport accessibility evaluation system constructed in this study may have suffered from distortion and thus requires additional scrutiny in conjunction with more historical data.
Author Contributions
C.W. contributed to the methodology, software, formal analysis, investigation, resources, visualization, and writing—original draft preparation. J.H. contributed to the resources, writing—review and editing, supervision, project administration, and funding acquisition. All authors have read and agreed to the published version of the manuscript.
Funding
This research was funded by the Research Initiative Fund for Newly Introduced Talents of Harbin Institute of Technology, Shenzhen (#ZX20230488).
Data Availability Statement
The data presented in our article are original and were not inappropriately selected, manipulated, enhanced, or fabricated. All image files in this article were not manipulated or adjusted in any way that could lead to a misinterpretation of the information provided in the original images.
Conflicts of Interest
The authors declare no conflicts of interest.
References
- Chen, G.; Noszczyk, T.; Nawieśniak-Caesar, M.; Pazdan, M.; Hernik, J. Land use change and landscapes in rural areas in china in forty years of reform and opening up. In Cultural Heritage—Possibilities for Land-Centered Societal Development; Springer: Cham, Switzerland, 2022; pp. 345–356. [Google Scholar]
- Huang, J. China’s rural transformation and policies: Past experience and future directions. Engineering 2022, 18, 21–26. [Google Scholar] [CrossRef]
- Li, Y.; Jia, L.; Wu, W.; Yan, J.; Liu, Y. Urbanization for rural sustainability–Rethinking China’s urbanization strategy. J. Clean. Prod. 2018, 178, 580–586. [Google Scholar] [CrossRef]
- Zhang, L. Conceptualizing China’s urbanization under reforms. Habitat Int. 2008, 32, 452–470. [Google Scholar] [CrossRef]
- Wang, L. China’s new town movements since 1949: A state/space perspective. Prog. Plan. 2022, 155, 100514. [Google Scholar] [CrossRef]
- Long, H.; Li, Y.; Liu, Y.; Woods, M.; Zou, J. Accelerated restructuring in rural China fueled by ‘increasing vs. decreasing balance’land-use policy for dealing with hollowed villages. Land Use Policy 2012, 29, 11–22. [Google Scholar] [CrossRef]
- Tao, A. Spatial differentiation pattern and comprehensive regionalization of rural settlement characteristics in China. Acta Geogr. Sin. 2023, 78, 3144–3160. [Google Scholar]
- Pang, F.; Peng, X. Analysis on the Historical and Realistic Value of Villages in Baiyangdian Water Area. J. Hebei Open Univ. 2021, 26, 96–99. [Google Scholar]
- Xia, S. Anxin County Annals: 1978–2008; China Local Records Publishing House: Beijing, China, 2017. [Google Scholar]
- Huibo, W. Hebei Xiong’an New Area Planning Outline. Available online: http://www.xiongan.gov.cn/2018-04/21/c_129855813.htm (accessed on 3 August 2024).
- Huibo, W. Notice of the People’s Government of Hebei Province on Printing and Distributing the “14th Five-Year Plan” for Ecological and Environmental Protection in Hebei Province. Available online: http://www.xiongan.gov.cn/2022-02/16/c_1211574089.htm (accessed on 3 August 2024).
- Yang, J. On the nature of counterurbanization. In Human Geography; Routledge: London, UK, 1995; p. 6. [Google Scholar]
- Dilley, L.; Gkartzios, M.; Odagiri, T. Developing counterurbanisation: Making sense of rural mobility and governance in Japan. Habitat Int. 2022, 125, 102595. [Google Scholar] [CrossRef]
- Berry, B.J. Urbanization and counterurbanization in the United States. Ann. Am. Acad. Political Soc. Sci. 1980, 451, 13–20. [Google Scholar] [CrossRef]
- Mitchell, C.J. Making sense of counterurbanization. J. Rural. Stud. 2004, 20, 15–34. [Google Scholar] [CrossRef]
- Sexto, F.C. Is the counterurbanization process a chaotic concept in academic literature? Geogr. Pannonica 2009, 13, 53–65. [Google Scholar] [CrossRef]
- Cloke, P. Counterurbanisation: A rural perspective. Geography 1985, 70, 13–23. [Google Scholar] [CrossRef]
- Lewis, G.; McDermott, P.; Sherwood, K. The counter-urbanization process: Demographic restructuring and policy response in rural England. Sociol. Rural. 1991, 31, 309–320. [Google Scholar] [CrossRef]
- Herrero-Jáuregui, C.; Concepción, E. Effects of counter-urbanization on Mediterranean rural landscapes. Landsc. Ecol. 2023, 38, 3695–3711. [Google Scholar] [CrossRef]
- Bartosiewicz, B.; Cusack, C. Countering Counter-Urbanization: A Comparative Analysis of Resiliency and Redevelopment in Postindustrial Cities of the United States and Poland. In Urban Dynamics, Environment and Health: An International Perspective; Springer: Berlin/Heidelberg, Germany, 2024; pp. 625–642. [Google Scholar]
- Corey, K.E. Development in Sri Lanka: A model for counterurbanization policies and planning? Urban Geogr. 1987, 8, 520–539. [Google Scholar] [CrossRef]
- Zheng, N.; Wang, S.; Wang, H.; Ye, S. Rural settlement of urban dwellers in China: Community integration and spatial restructuring. Humanit. Soc. Sci. Commun. 2024, 11, 1–12. [Google Scholar] [CrossRef]
- Hu, Y.; Wang, Y.; Zhang, P. Anti-urbanization and rural development: Evidence from return migrants in China. J. Rural Stud. 2023, 103, 103102. [Google Scholar] [CrossRef]
- Cheng, M.; Yin, Z.; Westlund, H. Counterurbanization in China? A case study of counties in Huang-Huai-Hai area from the perspective of urban-rural relations. J. Rural Stud. 2024, 110, 103386. [Google Scholar] [CrossRef]
- Chen, B. Development Opportunities for Chinese Villages and Towns in the Context of “Counterurbanization”—A Discussion on Sustainable Urbanization. Soc. Sci. Res. 2007, 3, 53–57. [Google Scholar]
- Liu, P.; Bai, X.; Ravenscroft, N. Counterurbanization, gentrification and the potential for rural revitalisation in China. Popul. Space Place 2023, 29, e2680. [Google Scholar] [CrossRef]
- Ruijun, D. The Experience of Urbanization in Developed Western Countries and Its Implications for China. City 2008, 10, 54–57. [Google Scholar]
- Jian, L.; Gaofeng, X. A policy discourse on new town development in contemporary china. City Chin. New Towns 2019, 59–70. [Google Scholar] [CrossRef]
- Han, L.; Lu, M.; Xiang, K.; Zhong, H. Density, distance and debt: New-town construction and local-government financial risks in China. J. Asian Econ. 2021, 77, 101376. [Google Scholar] [CrossRef]
- Zhou, Y.; Li, X.; Liu, Y. Land use change and driving factors in rural China during the period 1995–2015. Land Use Policy 2020, 99, 105048. [Google Scholar] [CrossRef]
- Li, Y.; Chen, C.; Wang, Y.; Liu, Y. Urban-rural transformation and farmland conversion in China: The application of the environmental Kuznets Curve. J. Rural Stud. 2014, 36, 311–317. [Google Scholar] [CrossRef]
- Li, Y.; Long, H.; Liu, Y. Spatio-Temporal Pattern of China’s Rural Development: A Rurality Index Perspective. J. Rural Stud. 2015, 38, 12–26. [Google Scholar] [CrossRef]
- Long, H.; Zou, J.; Pykett, J.; Li, Y. Analysis of rural transformation development in China since the turn of the new millennium. Appl. Geogr. 2011, 31, 1094–1105. [Google Scholar] [CrossRef]
- Liu, Y.; Lu, S.; Chen, Y. Spatio-temporal change of urban–rural equalized development patterns in China and its driving factors. J. Rural Stud. 2013, 32, 320–330. [Google Scholar] [CrossRef]
- Liu, Y.; Zhou, Y.; Liu, J. Regional Differentiation Characteristics of Rural Poverty and Targeted Poverty Alleviation Strategy in China. Bull. Chin. Acad. Sci. 2016, 31, 269–278. [Google Scholar]
- Long, H.; Li, Y.; Liu, Y. Analysis of evolutive characteristics and their driving mechanism of hollowing villages in China. Acta Geogr. Sin. 2009, 64, 1203–1213. [Google Scholar]
- Chen, Y.; Sun, H.; Liu, Y. Reconstruction models of hollowed villages in key agricultural regions of China. Acta Geogr. Sin. 2010, 65, 727–735. [Google Scholar]
- Zhou, Y.; Huang, H.; Liu, Y. The spatial distribution characteristics and influencing factors of Chinese villages. J. Geogr. Sci. 2020, 75, 2206–2223. [Google Scholar]
- Yang, R.; Liu, Y.; Long, H.; Qiao, L. Spatio-Temporal Characteristics of Rural Settlements and Land Use in the Bohai Rim of China. J. Geogr. Sci. 2015, 25, 559–572. [Google Scholar] [CrossRef]
- Zhu, F.; Zhang, F.; Li, C.; Zhu, T. Functional Transition of the Rural Settlement: Analysis of Land-Use Differentiation in a Transect of Beijing, China. Habitat Int. 2014, 41, 262–271. [Google Scholar] [CrossRef]
- Long, H.; Liu, Y.; Wu, X.; Dong, G. Spatio-Temporal Dynamic Patterns of Farmland and Rural Settlements in Su–Xi–Chang Region: Implications for Building a New Countryside in Coastal China. Land Use Policy 2009, 26, 322–333. [Google Scholar] [CrossRef]
- Yang, R. An analysis of rural settlement patterns and their effect mechanisms based on road traffic accessibility of Guangdong. Acta Geogr. Sin. 2017, 72, 1859–1871. [Google Scholar]
- Wang, C.; Sun, G.; Zhu, S. The major research progress on spatial evolution of rural settlements in mountainous areas of western China. Hum. Geogr. 2011, 26, 9–14. [Google Scholar] [CrossRef]
- Liu, Z.; Ding, Y.; Jiao, Y.; Wang, J.; Liu, C.; Yang, Y.; Wei, J. Spatial patterns and controlling factors of settlements distribution in ethic minority settlements of southwest China: A case study of Hani terraced fields. Prog. Geogr. 2021, 40, 257–271. [Google Scholar] [CrossRef]
- Hai, B.; Li, X.; Xu, J. Spatio-temporal evolution of rural settlements in Gongyi. Geogr. Res. 2013, 32, 2257–2269. [Google Scholar]
- Yanbo, Q.; Guanghui, J.; Yuting, Y.; Qiuyue, Z.; Yuling, L.; Wenqiu, M. Multi-Scale Analysis on Spatial Morphology Differentiation and Formation Mechanism of Rural Residential Land: A Case Study in Shandong Province, China. Habitat Int. 2018, 71, 135–146. [Google Scholar] [CrossRef]
- Zhu, B.; Ma, X. A Research on Pattern Characteristics and Type Classification of Rural Settlement in Northern Jianggsu Province. Hum. Geogr. 2011, 26, 66–72. [Google Scholar] [CrossRef]
- Li, X.; Li, H.; Zhang, Y.; Yang, L. Spatial Patterns and the Regional Differences of Rural Settlements in Jilin Province, China. Sustainability 2017, 9, 2170. [Google Scholar] [CrossRef]
- Guo, X.; Zhang, Q.; Ma, L. Analysis of the Spatial Distribution Character and its Influence Factors of Rural Settlement in Transition-region between Mountain and Hilly. Econ. Geogr. 2012, 32, 114–120. [Google Scholar] [CrossRef]
- Xu, Z.; Zhao, C. Temporal and Spatial Pattern Evolution of Rural Settlements in the Karst Trough Valley Area in the Past 50 Years. Int. Soil Water Conserv. Res. 2020, 27, 8. [Google Scholar]
- Yang, X.; Song, K.; Pu, F. Laws and trends of the evolution of traditional villages in plane pattern. Sustainability 2020, 12, 3005. [Google Scholar] [CrossRef]
- Zhang, Z. Sudy on the Spatial Pattern of Settlements in Ningling County; Henan University: Kaifeng, China, 2019. [Google Scholar]
- Yang, R.; Liu, Y.; Long, H.; Wang, Y.; Zhang, Z. Spatial Distribution Characteristics and Optimized Reconstructing Analysis of Rural Settlement in China. Sci. Geogr. Sin. 2016, 36, 170–179. [Google Scholar] [CrossRef]
- Zhou, L.; Zhen, F.; Wang, Y.; Xiong, L. Modeling the spatial formation mechanism of poverty-stricken counties in China by using geographical detector. Sustainability 2019, 11, 4752. [Google Scholar] [CrossRef]
- Shcherbina, E.; Gorbenkova, E. Factors influencing the rural settlement development. Ifac-Papersonline 2019, 52, 231–235. [Google Scholar] [CrossRef]
- Tong, D.; Sun, Y.; Tang, J.; Luo, Z.; Lu, J.; Liu, X. Modeling the interaction of internal and external systems of rural settlements: The case of Guangdong, China. Land Use Policy 2023, 132, 106830. [Google Scholar] [CrossRef]
- Xue, M.Y.; Wang, C.X.; Dou, W.S.; Wang, Z. Spatial distribution characteristics of traditional villages in the Yellow River basin and influencing factors. J. Arid. Land Resour. Environ. 2020, 34, 94–99. [Google Scholar]
- Li, H.B.; Zhang, X.L.; Wu, Q.Y.; Wang, Y.H. Characteristics and Mechanism of Rural Settlements Spatial Reconstruction in Developed Areas——A Case Study of Southern Jiangsu. J. Nat. Resour. 2015, 30, 591–603. [Google Scholar]
- Li, Z.; Zhang, X.; Li, H. Evolution characteristics and driving mechanism of urban-rural scale system at county level:A case of Zhangjiagang city, Jiangsu province. J. Nat. Resour. 2019, 34, 140–152. [Google Scholar]
- Li, X. Spatial Evolution of Rural Settlements in Underdeveloped Areas; Science Press: Beijing, China, 2019. [Google Scholar]
- Yu, G.; Feng, J.; Che, Y.; Lin, X.; Hu, L.; Yang, S. The identification and assessment of ecological risks for land consolidation based on the anticipation of ecosystem stabilization: A case study in Hubei Province, China. Land Use Policy 2010, 27, 293–303. [Google Scholar] [CrossRef]
- Pašakarnis, G.; Maliene, V. Towards sustainable rural development in Central and Eastern Europe: Applying land consolidation. Land Use policy 2010, 27, 545–549. [Google Scholar] [CrossRef]
- Zhou, Y.; Guo, L.; Liu, Y. Land consolidation boosting poverty alleviation in China: Theory and practice. Land Use policy 2019, 82, 339–348. [Google Scholar] [CrossRef]
- Zhou, Y.; Li, Y.; Xu, C. Land consolidation and rural revitalization in China: Mechanisms and paths. Land Use Policy 2020, 91, 104379. [Google Scholar] [CrossRef]
- Long, H.; Zhang, Y.; Tu, S. Rural vitalization in China: A perspective of land consolidation. J. Geogr. Sci. 2019, 29, 517–530. [Google Scholar] [CrossRef]
- Li, J.; Lo, K.; Zhang, P.; Guo, M. Reclaiming small to fill large: A novel approach to rural residential land consolidation in China. Land Use Policy 2021, 109, 105706. [Google Scholar] [CrossRef]
- Guan, X.; Zhang, F.R.; Liu, C.; Li, L.; Zhao, H. Spatio-Temporal Analysis and Optimization of Rural Residential Land Distribution in Pinggu District. Resouces Sci. 2013, 35, 536–544. [Google Scholar]
- Chen, Y.; Xie, B. The spatial evolution and restructuring of rural settlements in Jiangnan hilly region: A case study in South Jiangxi. Geogr. Res. 2016, 35, 184–194. [Google Scholar]
- Li, J.; Wu, Y.D.; Zhang, L.; Chen, C.Y. The Suitability Evaluation of Social and Economic Factors on the Location of Rural Settlement—Take Erhai Rim Region of Yunnan for Example. Econ. Geogr. 2016, 36, 195–201. [Google Scholar] [CrossRef]
- Zhang, G.; Zhu, Y.; Zang, L.; Yang, H.; Zhang, P. Spatial reconstruction evaluation and partition of rural residential areas in Changli county under background of new-type urbanization. Trans. Chin. Soc. Agric. Eng. 2016, 32, 237–246. [Google Scholar]
- Li, C.; Liang, S.; Che, Q. Spatial reconstruction of the rural settlements in Wuhu city based on the function oriented zoning. Resour. Environ. Yangtze Basin Resour Env. Yangtze Basin 2015, 24, 1736–1743. [Google Scholar]
- Yao, G.; Xie, H. Rural Spatial Restructuring in Ecologically Fragile Mountainous Areas of Southern China: A Case Study of Changgang Town, Jiangxi Province. J. Rural Stud. 2016, 47, 435–448. [Google Scholar] [CrossRef]
- Wang, C.; Fei, Z.; Ye, Q.; Zhang, Y. Rural settlement space reconstruction strategy and implementation based on symbiosis theory on village scale. Trans. Chin. Soc. Agric. Eng. 2014, 30, 205–214+294. [Google Scholar]
- Kong, X.; Jin, L.; Qie, Y.; Zhang, Y.; Xu, Y. Layout optimization of rural settlements based on point-axis theory. Trans. Chin. Soc. Agric. Eng. 2014, 30, 192–200. [Google Scholar]
- Ma, L.; Gong, M.; Liu, S.; Cui, X. Layout optimization of rural settlements based on point-axis theory. Sci. Geogr. Sin. 2022, 42, 456–465. [Google Scholar] [CrossRef]
- Du, X.; Wang, C.; Jiang, W. Rural Settlements Restructuring Based on Analysis of the Gravity Model at Village Level: The Case of Dazhu Village, Chongqing, China. Econ. Geogr. 2015, 35, 154–160. [Google Scholar] [CrossRef]
- Li, B.; Wang, Z.; Zhang, L.; Xu, F. Study on space reconstruction of rural settlement based on clustering development path. China Popul. Environ. 2018, 28, 47–55. [Google Scholar] [CrossRef]
- Chen, W.; Li, M.; Chen, Z.; Wang, Y.; Mao, K.; Liu, M. Spatial Optimization of Rural Settlement at County Level Based on GIS:A Case Study of Dachang County in Hebei Province. Geogr. -Geo-Inf. Sci. 2013, 29, 80–84+127. [Google Scholar]
- Cui, J.; Qu, Y.; Li, Y.; Zhan, L.; Guo, G.; Dong, X. Reconstruction of rural settlement patterns in China: The role of land consolidation. Land 2022, 11, 1823. [Google Scholar] [CrossRef]
- Wang, C.; He, J. The Transformation and Development Strategy of Waterside Villages through Transport System Reconstruction: A Case Study of Anxin County, Hebei Province, China. Appl. Sci. 2022, 12, 6142. [Google Scholar] [CrossRef]
- Luo, W.; Wang, F. Measures of spatial accessibility to health care in a GIS environment: Synthesis and a case study in the Chicago region. Environ. Plan. Plan. Des. 2003, 30, 865–884. [Google Scholar] [CrossRef] [PubMed]


Disclaimer/Publisher’s Note: The statements, opinions and data contained in all publications are solely those of the individual author(s) and contributor(s) and not of MDPI and/or the editor(s). MDPI and/or the editor(s) disclaim responsibility for any injury to people or property resulting from any ideas, methods, instructions or products referred to in the content. |
© 2024 by the authors. Licensee MDPI, Basel, Switzerland. This article is an open access article distributed under the terms and conditions of the Creative Commons Attribution (CC BY) license (https://creativecommons.org/licenses/by/4.0/).