Highlights
What are the main findings?
- The presence of marine litter in sublittoral areas is determined by the density of coastal tourist territories and is lower in areas predominantly used for tourism versus those of mostly resi-dential use;
- Data collection methodology using depth line transects is essential for estimating marine litter density;
- The presence of macro debris from motor vehicle tyres is independent of urban areas and their associated density and is also unrelated to maritime access.
What are the implications of the main finding?
- The density of coastal tourist territories plays a crucial role in determining the possible presence of marine litter in sublittoral areas and developing specific preventive policies;
- It is not possible, with current technology, to use remote means of complex surface and bottom collection of marine litter without depth transects;
- The deposition of a characteristic type of marine litter, used tyres, shows patterns of occurrence totally independent of coastal urban density.
Abstract
The coastal strip, characterized by the urbanization of coastal tourist territories (CTTs), has expanded over decades through civil engineering, altering the shoreline dynamics and creating artificial beaches crucial for tourism. To examine the relationship between extensive land use in CTTs for tourism and residences and the presence of marine litter, a specific parametric study was conducted along the coast of Tenerife, the largest island in the Canary Islands. Due to Tenerife’s geographical location and exposure to the descending Gulf Stream flow, the coastal waters in the selected zone experience waste impact at both local and global scales. However, the presence of marine litter deposited by ocean currents is at a micro level and falls outside the scope of this report. This study parameterised urban reality in study areas, and the presence of macro waste has been parameterised using standardised units of measurement. This enables the establishment of source measurements that will contribute to preventative measures against this type of coastal pollution. The interdependence between tourist zoning, civil seafront engineering works along the seafront, and marine litter presence in inaccessible and visible areas for tourists requires a methodology to better understand waste origin and loading areas. This knowledge is crucial for an effective local monitoring system. A quantitative overlay reading methodology has been designed in the urban setting through calculations of urban densities, while examining the waste in these areas’ immediate infralittoral flooring through the use of visual underwater extraction. Anticipating the type and quantity of waste in each area will allow for the implementation of effective awareness, promoting action for preventative and corrective measures at the urban level. The results show a direct dependence between urban density and the presence of waste, as well as an equation that makes it possible to anticipate the amount of waste according to urban density and its relational vector. There is no discontinuity between them, as each area is affected by others to the extent that they establish the parametric continuity conditions determining each field. Therefore, it is possible to relate them beyond a one-on-one relationship. This approach fosters sustainable tourism development, reducing pressure on the sea and enhancing the utilisation of tourism revenues in measures to address waste-related challenges and promotes sustainable tourism development in Europe’s coastal regions.
1. Introduction
Coastal strip consolidated by the urbanization of tourist coastal territories (CTTs) has undergone decades of urban growth that is temporally incompatible with the sustainability of the proximate oceanic natural conditions [1]. These natural conditions are one of the main factors attracting tourism to CTTs [2].
At the forefront of the study of marine debris in relation to urban areas, there has been a growing emphasis in the latest years on understanding the specific impacts of human activity in coastal regions, working towards the application of advanced technologies, such as satellite remote sensing and Geographic Information Systems (GIS), to analyse patterns of waste accumulation in the vicinity of urban centres. Moreover, the integration of data from citizen sources, including mobile applications and social networks, has provided a more comprehensive insight into the distribution and typology of marine debris. Urban areas, characterized by high population density and commercial activities, significantly contribute to marine pollution [3], so complex interactions between urban planning, waste management, and coastal water quality highlights the importance of holistic approaches to effectively address the issue of marine debris in urban environments.
On the Mediterranean and Atlantic coasts of Spain, sea bathing, initially associated with bourgeois classes until the mid-20th century, became massively popular during the developmentalism of the 1960s and 1970s [4]. This was made possible by coordinated social protections implemented nationally by various ministries, allowing the growing middle class to enjoy regular vacation periods [5]. The movement to the coast and engagement in sea bathing were also stimulated by the persuasion of the health benefits that such activities could provide, which had previously been accessible mainly to the more affluent classes due to resource availability [6].
Nevertheless, this new social possibility, linked to the consolidation of the middle class as the majority social stratum, implied two constructive needs: transportation infrastructure and accommodation [7]. The connectivity of various localities in the Spanish Mediterranean region—the main recipient due to its proximity to the major peninsular capitals—had been forging for decades, having started between 1924 and 1928 under the government of General Miguel Primo de Rivera [8]. Various connection projects between the peninsular interior and the coast, especially the renewal of the Augusta Road as the backbone of the Mediterranean coast—known as the CN340—[7] transformed road transport infrastructure into a fundamental pillar to facilitate the use of the coast by a seasonal summer population [9].
Accelerated growth of infrastructure since the end of the post-Civil War period and the transition to democracy, especially during the economic boom of the late 1960s and the 1970s [5], allowed for an excessive and disorganized growth of coastal tourist areas.
These territories, constructed since the 1960s, include a significant proportion of holiday residential buildings with diverse designs, including single-family homes, extensive tower blocks, intensive urban sprawl, and the inclusion of hospitality facilities [10]. Moreover, they are all linearly connected on the basis of a large road transport infrastructure. These habitations can be defined as “coastal tourist territories” (CTTs) [7].
In these areas, urbanization has filled the available space along the sea [11] stemming from road communication infrastructure. The expansion of urban space for social use has encroached upon the coastline, particularly in the 1960s and 1970s. Although the problem is global, this study focuses on a representative area of the Canary Islands (Spain) because of the possibility to study different relational zones in this single area (Figure 1). This has led to alterations of the immediate coastline through civil engineering works, turning the coastal dynamics into a kind of social urban space with a boundary and artificial beaches [12,13], causing significant environmental issues on the oceanic platform, mainly because of governance related to spaces and urban facilities near the sea [12,14].
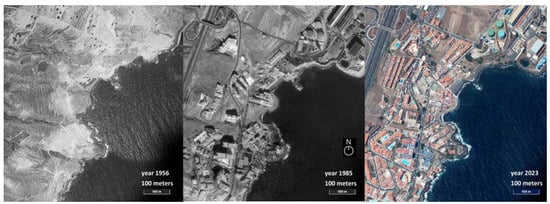
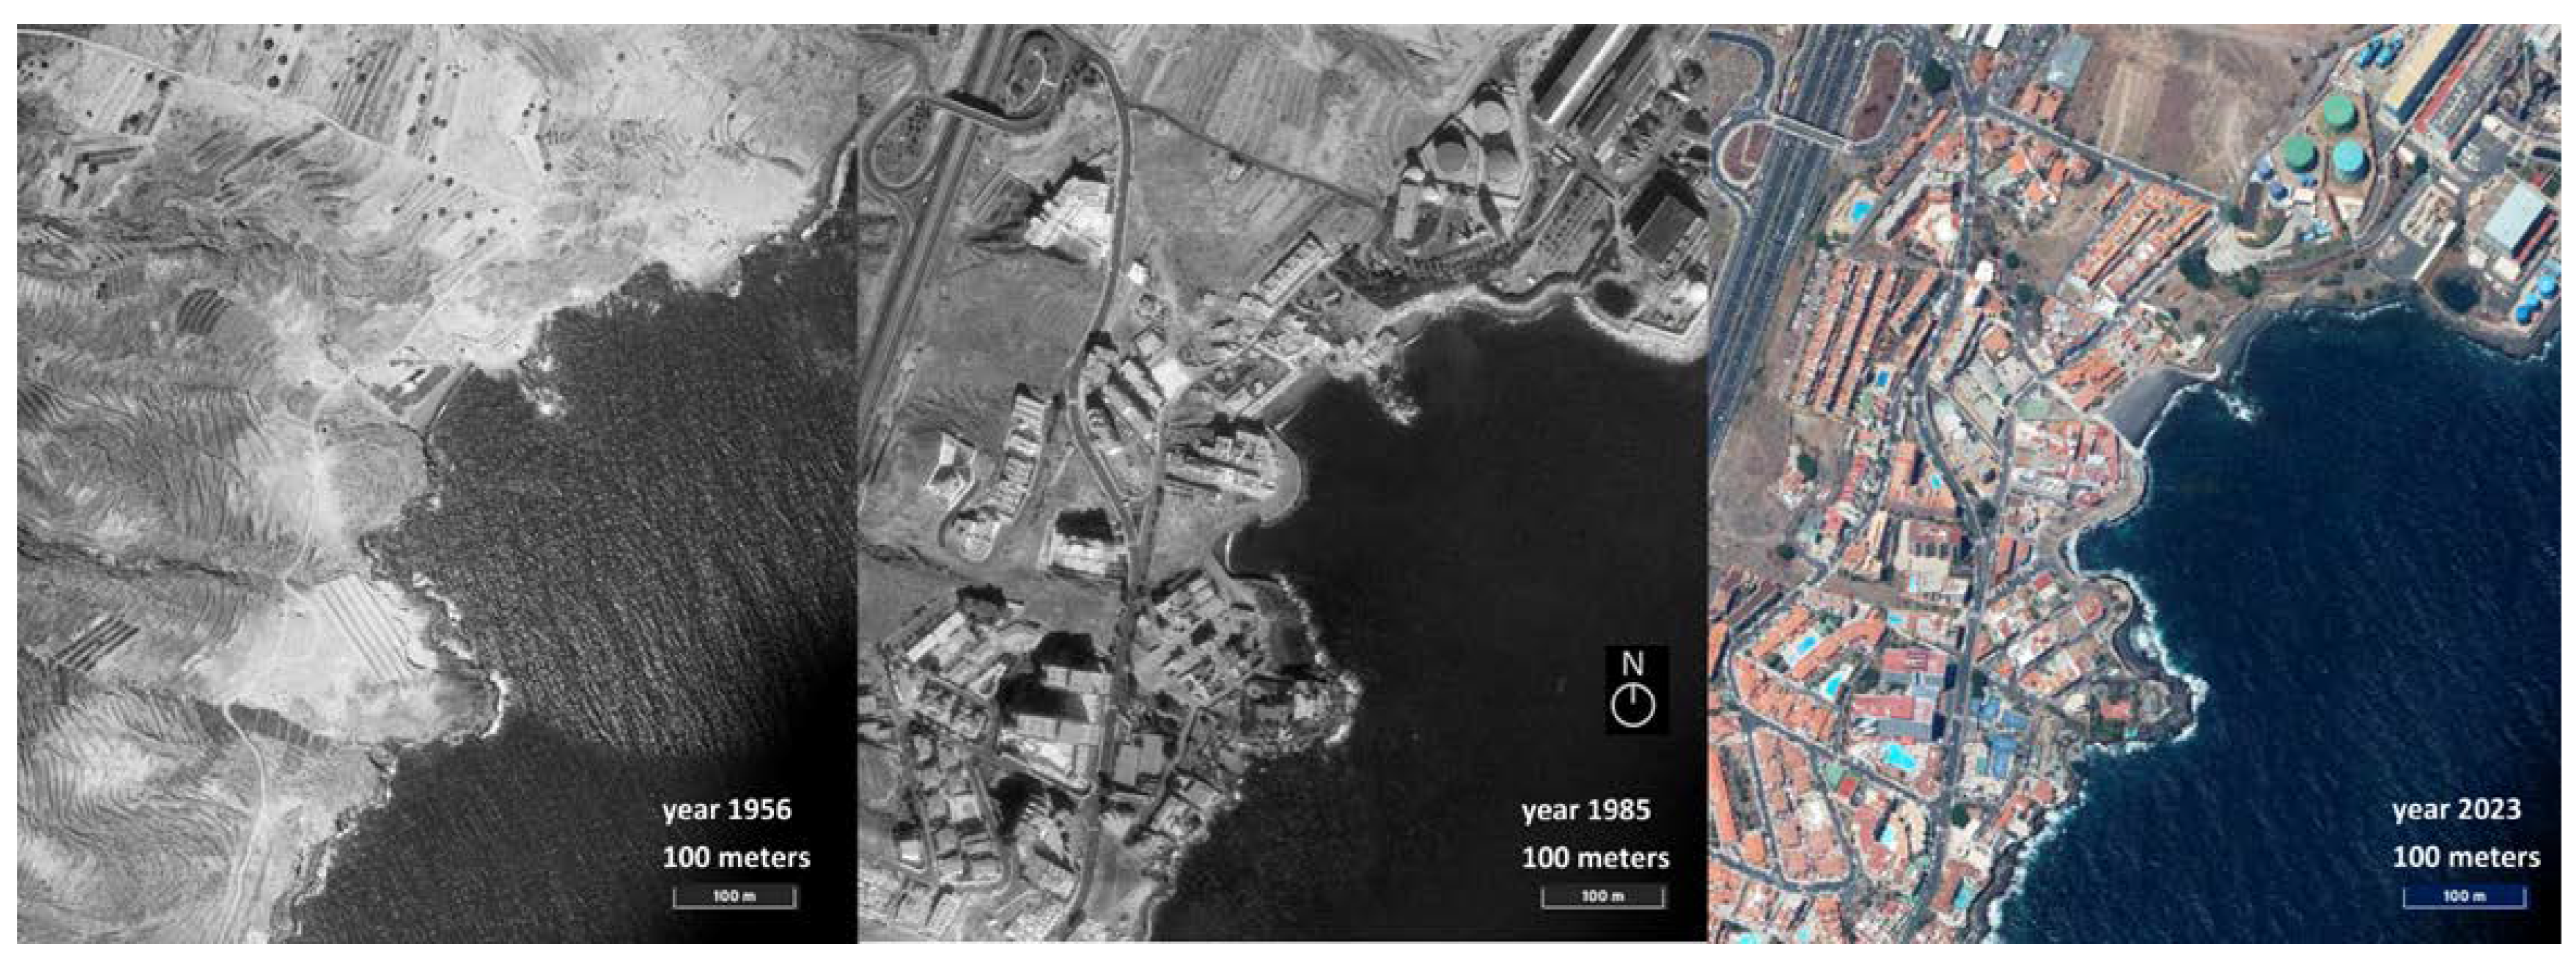
Figure 1.
Evolution of land occupation in Candelaria, Tenerife, in 1956, 1985, and 2023. Source: Grafcan—Spatial Data Infrastructure of the Canary Islands. Reference System ITRF93. WGS84 Ellipsoid. Geodetic Network REGCAN95. UTM Representation System. Authors’ overlay, 1:10,000 scale.
This has resulted in massive macro and micro waste at all depths of the marine environment [15] which affects tourists’ perception of the coastal environment [16]. There has been a decline in ecotourism competitiveness associated with this image of environmental irresponsibility, as it is common to find macro waste and plastic packaging such as bottles, bags, wrappers, caps, and metal packaging like cans and other containers. Furthermore, tyre remnants, construction litter, coastal leisure items like umbrellas, hammocks, clothing, and towels litter the seabed in these areas. Additionally, there is micro waste such as glass fragments, fishing equipment such as lines, weights, and fishing nets parts, and other abandoned or lost items (Figure 2) [15,17,18,19].

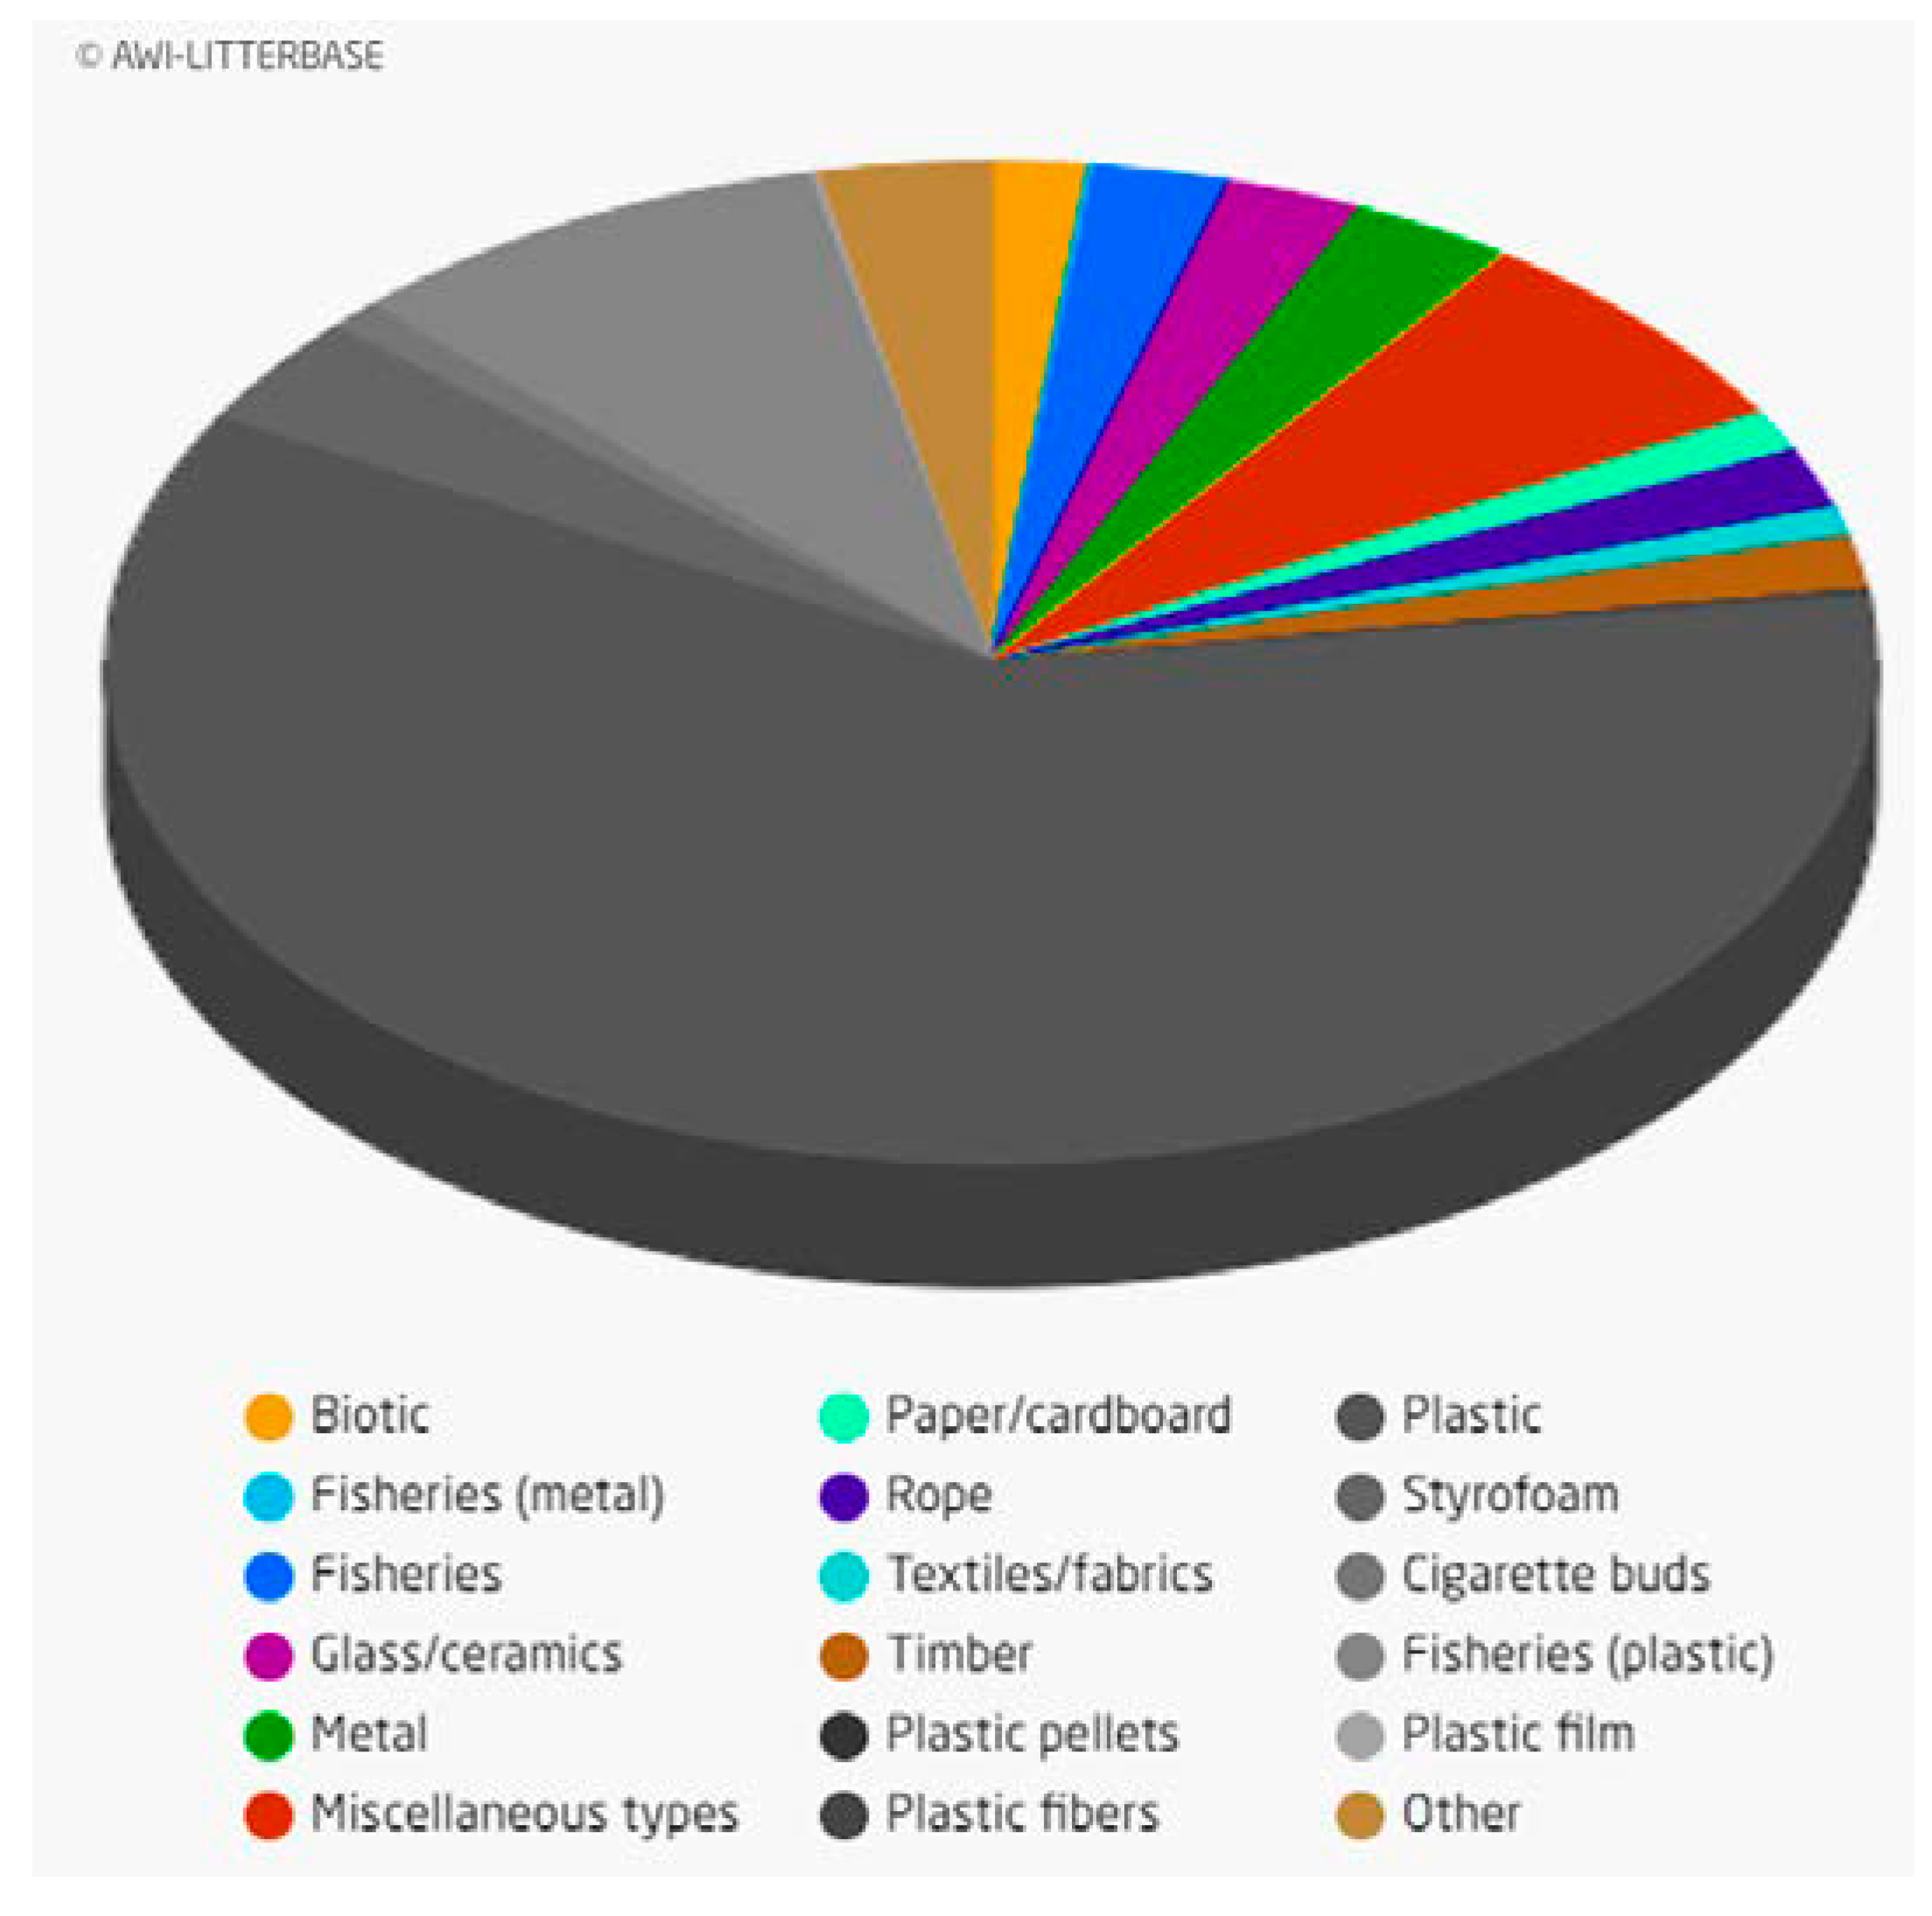
Figure 2.
Estimated composition of marine litter worldwide. The percentages shown are related to the total weight of marine litter collected in 761 documents across 5712 different global locations, and comprise the following: plastic (general) 60.23%; Styrofoam 3.59%; cigarette buds 0.94%; fisheries (plastics) 9.02%; other 3.2%; biotic 1.78%; fisheries 2.47%; glass/ceramics 2.51%; metal 2.97%; misc. types 6.86%; paper/cardboard 1.34%; rope 1.92%; textiles 0.98%; and timber 1.76%. (Authors’ reinterpretation drawn from the original source, https://litterbase.awi.de/litter_graph (accessed on 4 November 2023).
With the same lack of consideration that characterized the expansions onto marine ecosystems directly within its impact zones, leading to significant impacts on these fragile environments [20], the current issue of marine litter globally, particularly in the sub-littoral depths adjacent to these CTTs, requires specific governance to prevent the progression of waste entering from these areas [21]. Often considered as the entry point for macro litter into sub-littoral depths, addressing the contaminant source necessitates research on the parameters linking submerged waste with the emerged reality [22]. In CTTs, terrestrial-origin waste concludes its journey by deposition in the sea for four main reasons [23]:
- Lack of waste management infrastructure: due to the population fluctuation between the summer season and the rest of the year, the infrastructure for proper waste management may be inadequately sized. If the collection and treatment network is demarcated based on the permanent residents in these CTTs, garbage containers, recycling facilities, and waste collection systems will not be efficient in managing the large amount of waste generated during the summer season due to the tourist influx;
- Human behaviour: raising awareness among the population, for both permanent residents and tourists, is essential to prevent the generation of marine litter. Environmental awareness and proper waste management on beaches and coastal areas significantly contributes to avoiding the cycle of garbage deposition on the seabed. Similarly, the lack of collection facilities may encourage improper practices such as littering or leaving domestic waste outside established garbage containers;
- Marine activities: blue economy-related activities, such as fishing—both professional and recreational—and navigation, can contribute to the introduction of waste into the sea, either through accidents or improper waste management during these activities;
- Sewer system overflow and climate change: sewer and wastewater treatment systems are positioned based on population needs but may not be designed to handle large volumes of rainwater from heavy storms after an extended period of summer drought, not to mention wastewater exceeding capacity due to a sudden overpopulation. This overflow can result in untreated wastewater discharges directly into the sea, becoming a vector for the entry of pollutants and waste.
In these scenarios, vectors bringing litter to the seabed are wind and tides [24], as meteorological conditions can displace or submerge litter found on the coast into the sea [25]. Faced with the severity of the global marine litter issue, it is evident that any possibility of reversing pollution levels is no longer feasible [22,26]. Therefore, efforts at this historical moment should be directed towards prevention [27] of the progressive increase in marine litter pollution, which is the focus of this project.
In the confrontation between urban density and marine waste, this research aims to identify possible causes and effects of the relationship between urban density and marine litter. Within the scope of this study, the aim is to assess the impact of waste on the immediate marine environment surrounding the social spaces of Coastal Tourist Territories (CTTs) in coastal and marine regions. Due to the relational complexity, this study could be expanded to include waste collection and treatment policies (with an analysis of solid urban waste collection, recycling, and disposal practices), and a review of local, national, and international regulations related to marine waste management and urban planning.
2. Framework and Objectives
This study tackles the quantitative relationship between urban densities and marine litter in the immediate sub-littoral zone related to coastal tourist territories (CTTs). Understanding the specific origin of waste in each area [28] is crucial to implement targeted litter management policies [29], personalized environmental education for public awareness, and to foster sustainable practices in tourist zones using predictive model systems [30]. This effort aims to enhance tourism competitiveness and preserve the health of marine ecosystems by maintaining the attractiveness of the location [2]. Clean waters and a clean seabed are considered indicators of tourism competitiveness [31]. In the current context, with well-established legal environmental protection measures and numerous marine areas designated across all Spaniard regions [32], though falling short of the 2030 target of 30%, ocean protection evidently requires not only effective management of special conservation areas, marine reserves, and natural sites but also a global awareness that integrates public administration, the productive sector, and the third sector [33]. Despite large-scale protection efforts, if not effective in the sub-littoral zone—visually accessible and easily shareable on social media—the visual impact could be counterproductive [34].
The overarching objective is to analyse and contrast different urban-characterized coastal zones concerning their impact on the immediate sub-littoral zone through waste deposition. From this objective, this research will sequentially dissect the complex interactions between urban density and marine litter, identifying opportunities for mitigation and the promotion of sustainable practices [4,35].
However, the relationship between contrasting concepts, both in their physical entity and interpretative categories, necessitates a specific theoretical framework proposed in four categorizations:
- (A)
- Urban density and morphology: the definition and measurement of urban density, quantifying parameters related to buildings and population. Includes population, land occupation, typologies, morpho-classification, infrastructure, and urban planning;
- (B)
- Density of marine litter: the definition of elements, origin, material composition, distance to the coast, accumulation, coastal access, and waste management practices;
- (C)
- Multifaceted factors: consumer culture and resident behaviour, especially regarding waste management habits, vary between urban areas and can influence the quantity of waste ending up in the sea;
- (D)
- Transport routes: waste generated in urban areas can reach the marine environment through various transport routes such as rivers, sewer systems, windstorms, and other mechanisms.
This expansion could make this research multifaceted by introducing parameters beyond those capturable with remote sensing systems [36]. This relationship is novel, considering that in the last five years, various research projects—some supported by massive initiatives of “citizen science” [37]—have conducted extensive collection, extraction, and characterization of marine litter. While the total volumes and weights collected have served various scientific objectives [38], there has been no correlation between the type of waste, its location, and adjacent urban tissue.
Over the past few years, several operational research projects have been conducted on marine litter in relation to specific tourist areas in Tenerife [17]. These studies have explored entry vectors into marine areas from 2018 to 2021 at different depth levels and with a differential biocenosis relationship [39]. They analysed the relationship between the origin of the waste and its deposition areas from land. However, the conclusions were inconclusive as their methodology did not include the location of extraction or the relationship with the nearest urban environment.
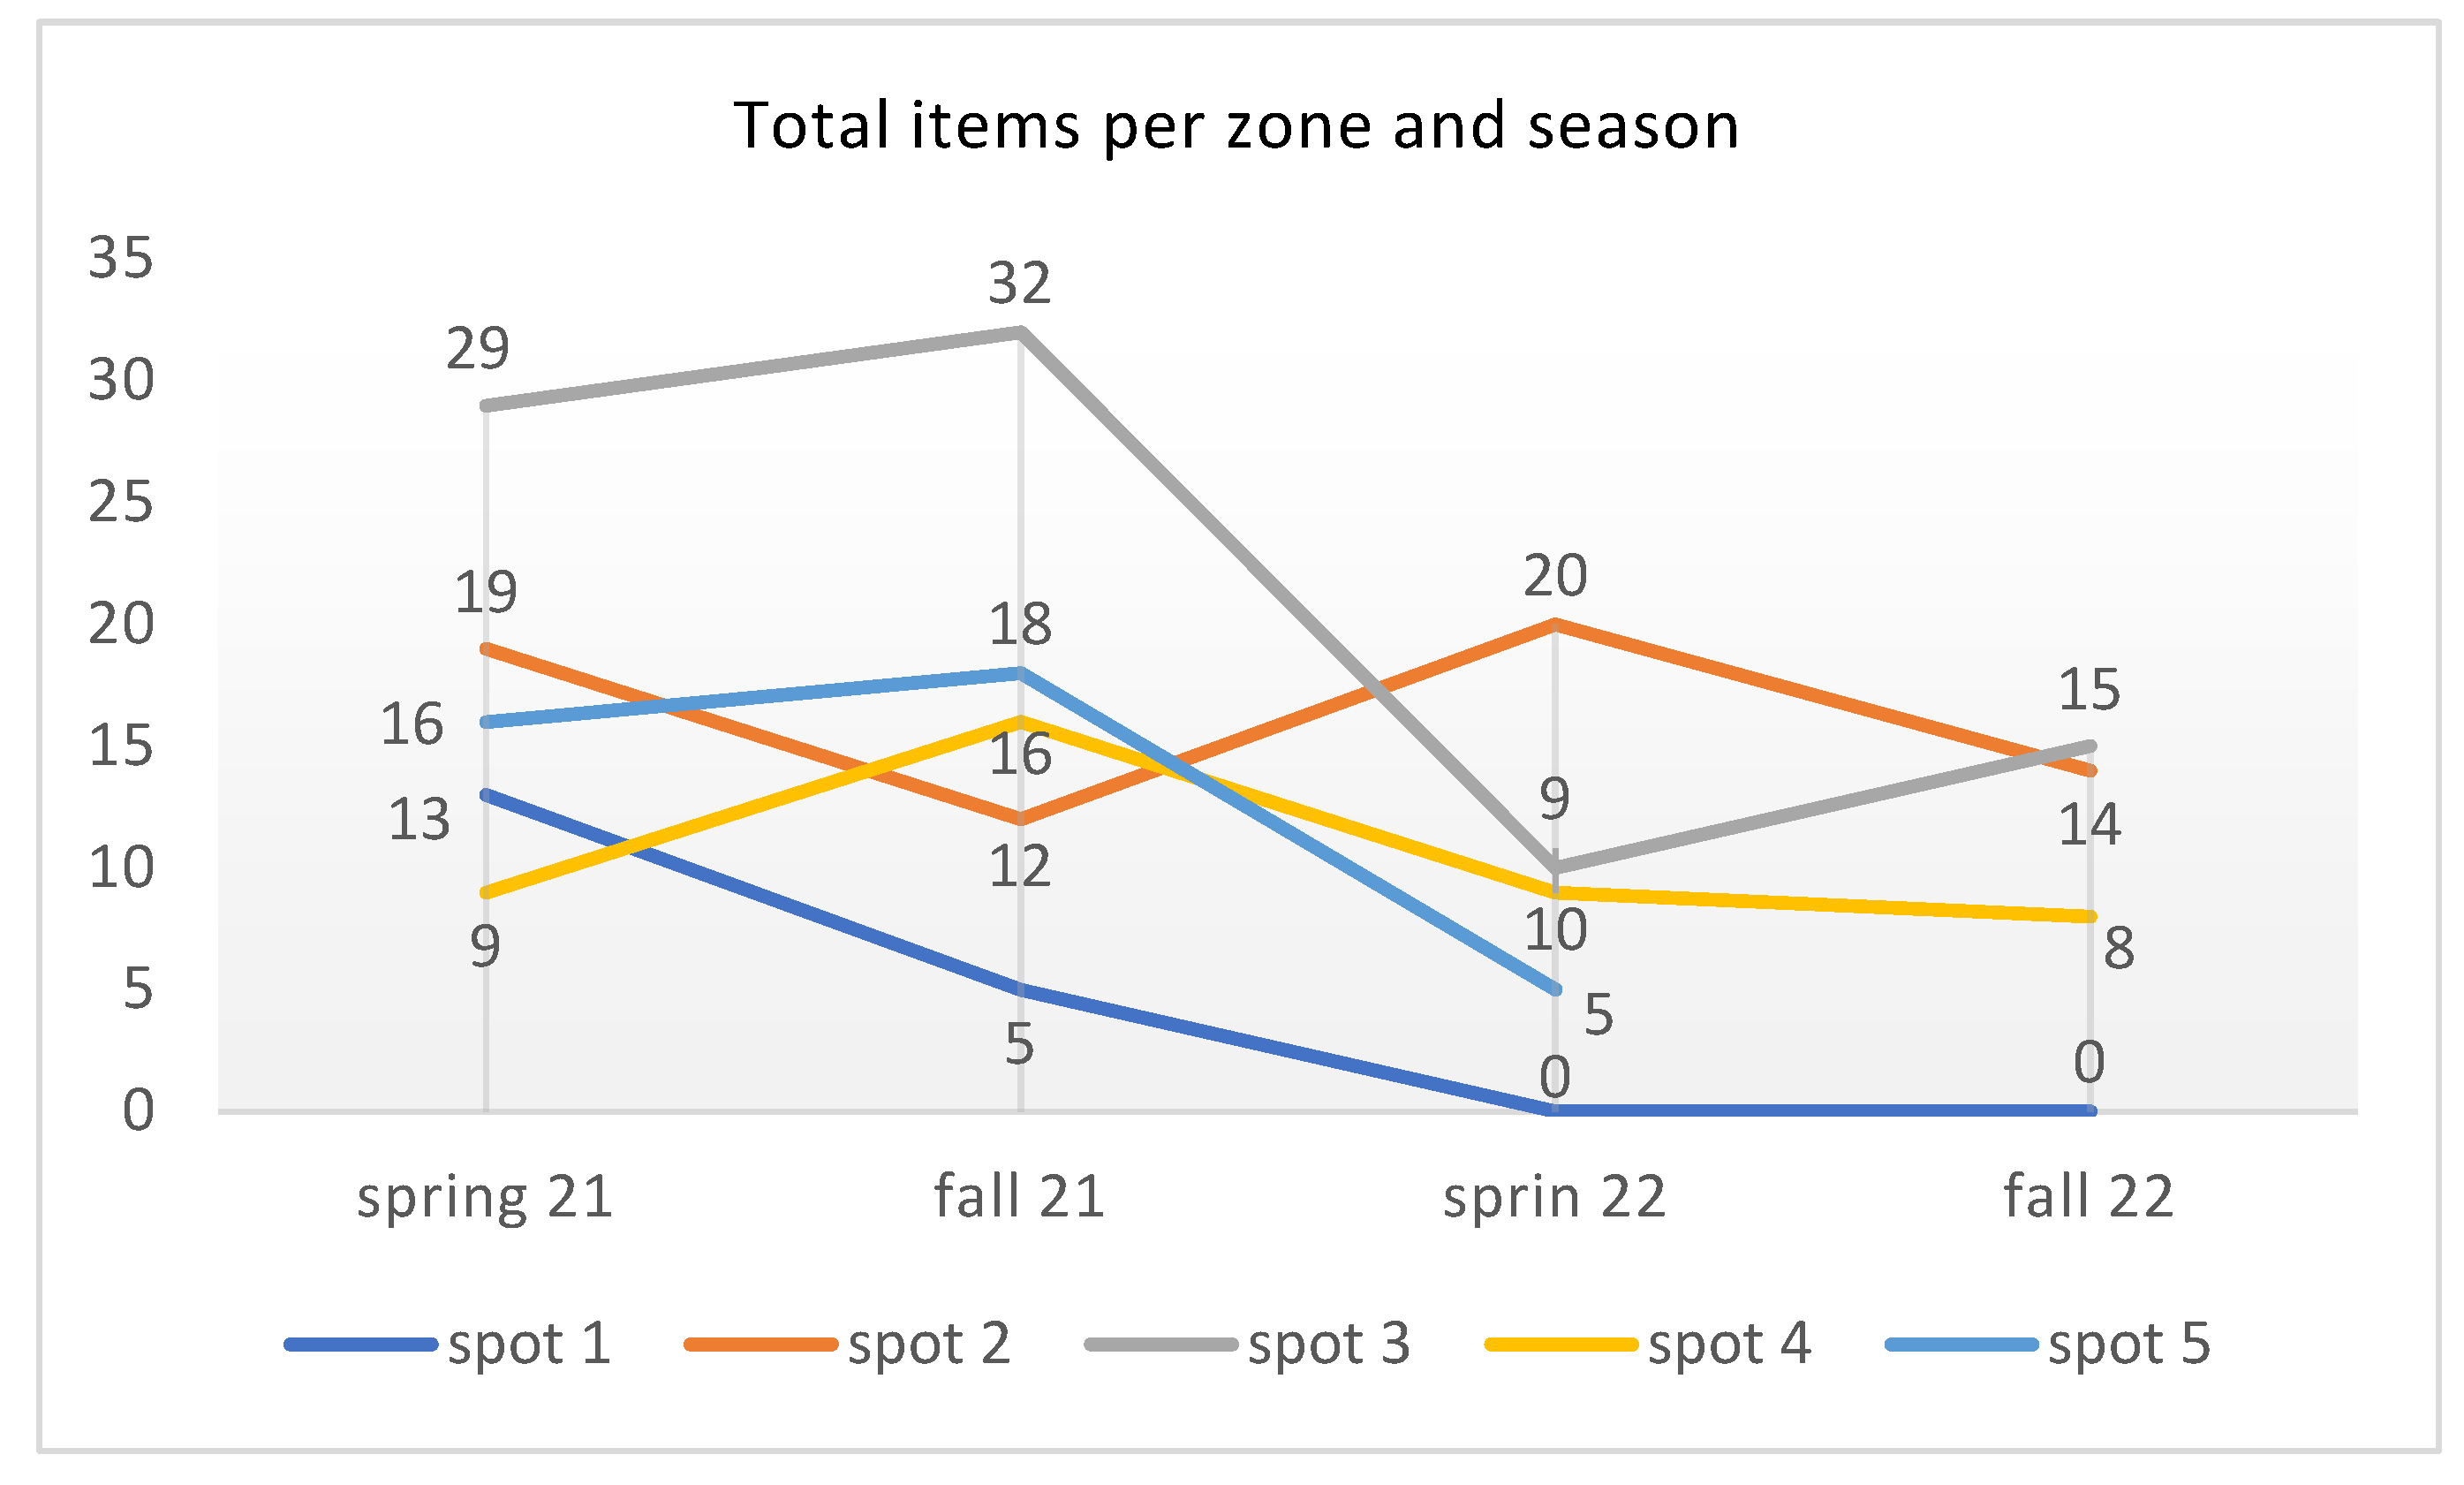
The main technical objective involves developing a relational methodology between urban parameters and marine litter density, enabling the ability to predict expected waste and, based on these predictions, implement personalised preventive measures [21]. The issue with marine litter is not only its presence but also the rhythms of its replenishment or reappearance (Figure 3) [40,41].
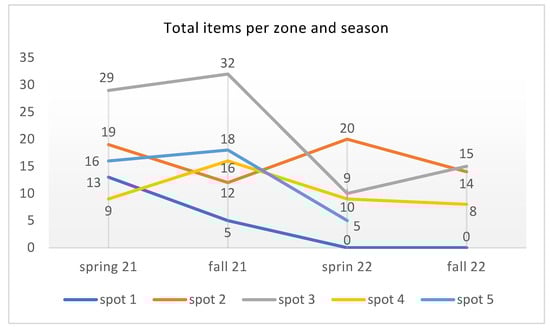
Figure 3.
Relationship of removed and reappeared residual elements at the 5 monitoring points (called spots, zones, or areas) across the 4 measurement and cleaning campaigns. Note how the waste reappears season after season (except in the non-urbanized area, where the cleaning campaign effect remains). Graphs created by the authors, based on the statistics of removed waste from seabeds during the campaigns, highlighting that the issue is not only about removal but also the reappearance in just a few months.
Therefore, the secondary technical objectives are threefold:
- –
- Update the distribution of marine litter in relation to urban and territorial models associated with tourism, highlighting specific models for prevention and decontamination efforts [42];
- –
- Investigate the presence of litter to provide key information for establishing specific waste management needs and awareness policies in the analysed coastal areas [43];
- –
- Possessing precise and updated data on the presence of marine litter in peri-urban environments can enhance the effectiveness of integrated preventive management systems [44].
3. Materials and Methods
3.1. Study Area
Research is focused on the Spanish mid-Atlantic coast as a case study, designated as an experimental site due to its representation of all relational models of topography and constructed coastal environments. For this purpose, a specialised project—called Resless—has been established from November 2020 to January 2023. Among other relationships, the project has investigated crucial issues of the cross-impact between waste and the built environment, embodying a mixed methodology of fieldwork and territorial analysis. In this area, the topography project models the characteristic urban-territorial rela-tionships between the pre-existing topography and natural environment and the urban environments of the most representative repetitive models of coastal tourist territories (CTTs). The focus of the Resless project is on data related to urban morphological groups, with special attention to the social space by the sea [45]. These groups of model homogeneity cover most of the underwater landscape models outlined in the European Union Habitat Directive [46], situated against categories of land representative of the Legislative Royal Decree 7/2015, Land and Urban Rehabilitation Law. This combined focus on these five groups of model homogeneity in the urban–maritime relationship enables the study to be scalable, allowing the application of the study to the field of preventing global pollution in the coastal areas of CTTs. These homogeneous urban groups have also been selected based on the circalittoral floor quality adjacent to coastal environments where the mid-Atlantic faces marine-pollution challenges from plastics, packaging, metals, paper, and other materials discharged into the sea [33].
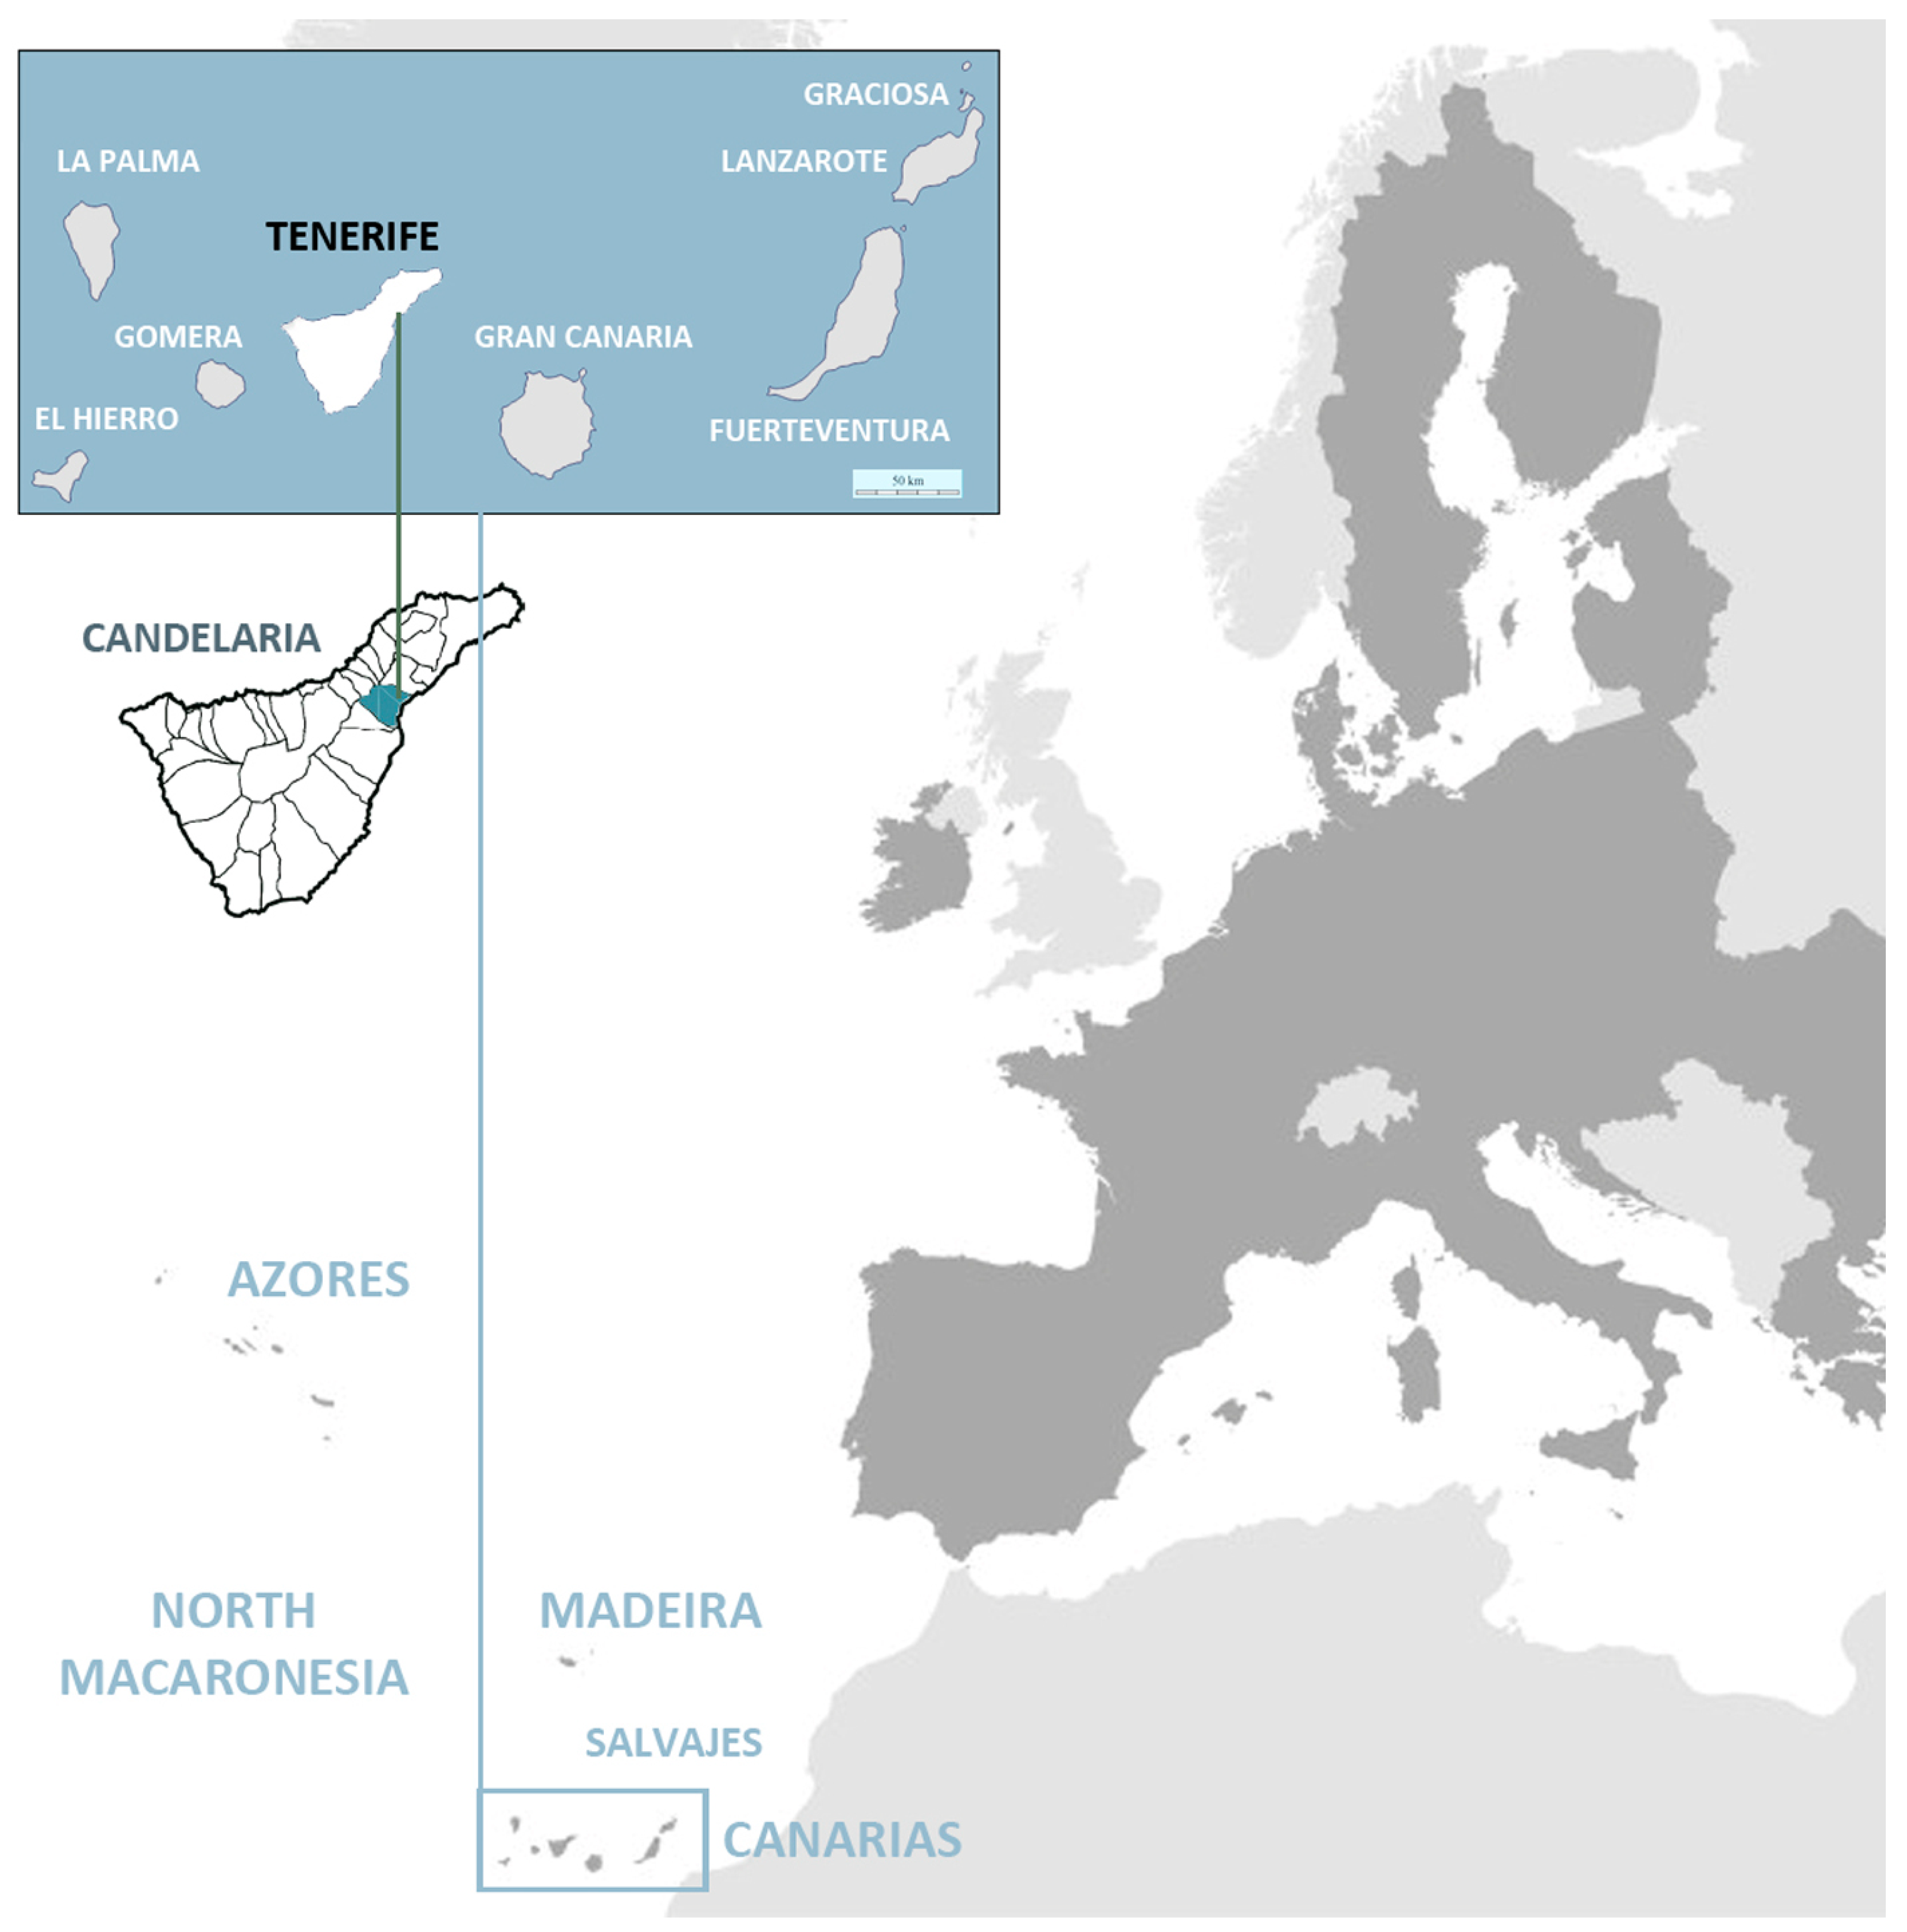
While the relationship between urban density and marine litter is relevant due to geographical proximity, a broader perspective addressing all sources and factors contributing to this issue could be considered later for the implementation of more effective strategies for marine pollution and ocean waste [47]. However, focusing on the first of these relationships establishes this research as expandable in the future. To determine emergent CTTs, characterised by great territorial heterogeneity, the municipality of Candelaria in the northeast of Tenerife has been selected (Figure 4). This municipality’s maritime extension encompasses different urban and natural areas with differential pressures on its coastal perimeter, representing the five territorial models. This research, therefore, tests this methodology in this specific study area, which includes all models of coastal fringe encounter relationships [48]. This allows scaling this study and relationship methodology to a regional—insular in this case—level, as shown in Figure 5.

Figure 4.
Definition of the study area (Candelaria) on the southeast coast of the island of Tenerife, relationship of the island of Tenerife with the rest of the Canary Islands archipelago, and location of the Canary Islands in relation to the northern Macaronesia and the European Union. Prepared by the authors from two sources: Grafcan-Canary Islands Spatial Data Infrastructure. Reference System ITRF93. WGS84 (maps of Tenerife and Canary Islands) and GisTeria OS (North Macaronesia map).
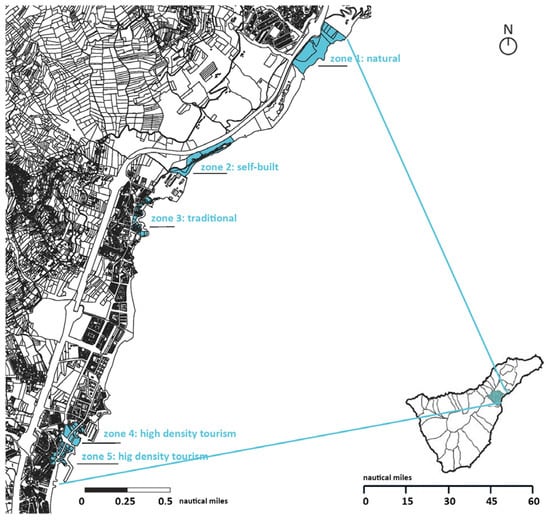
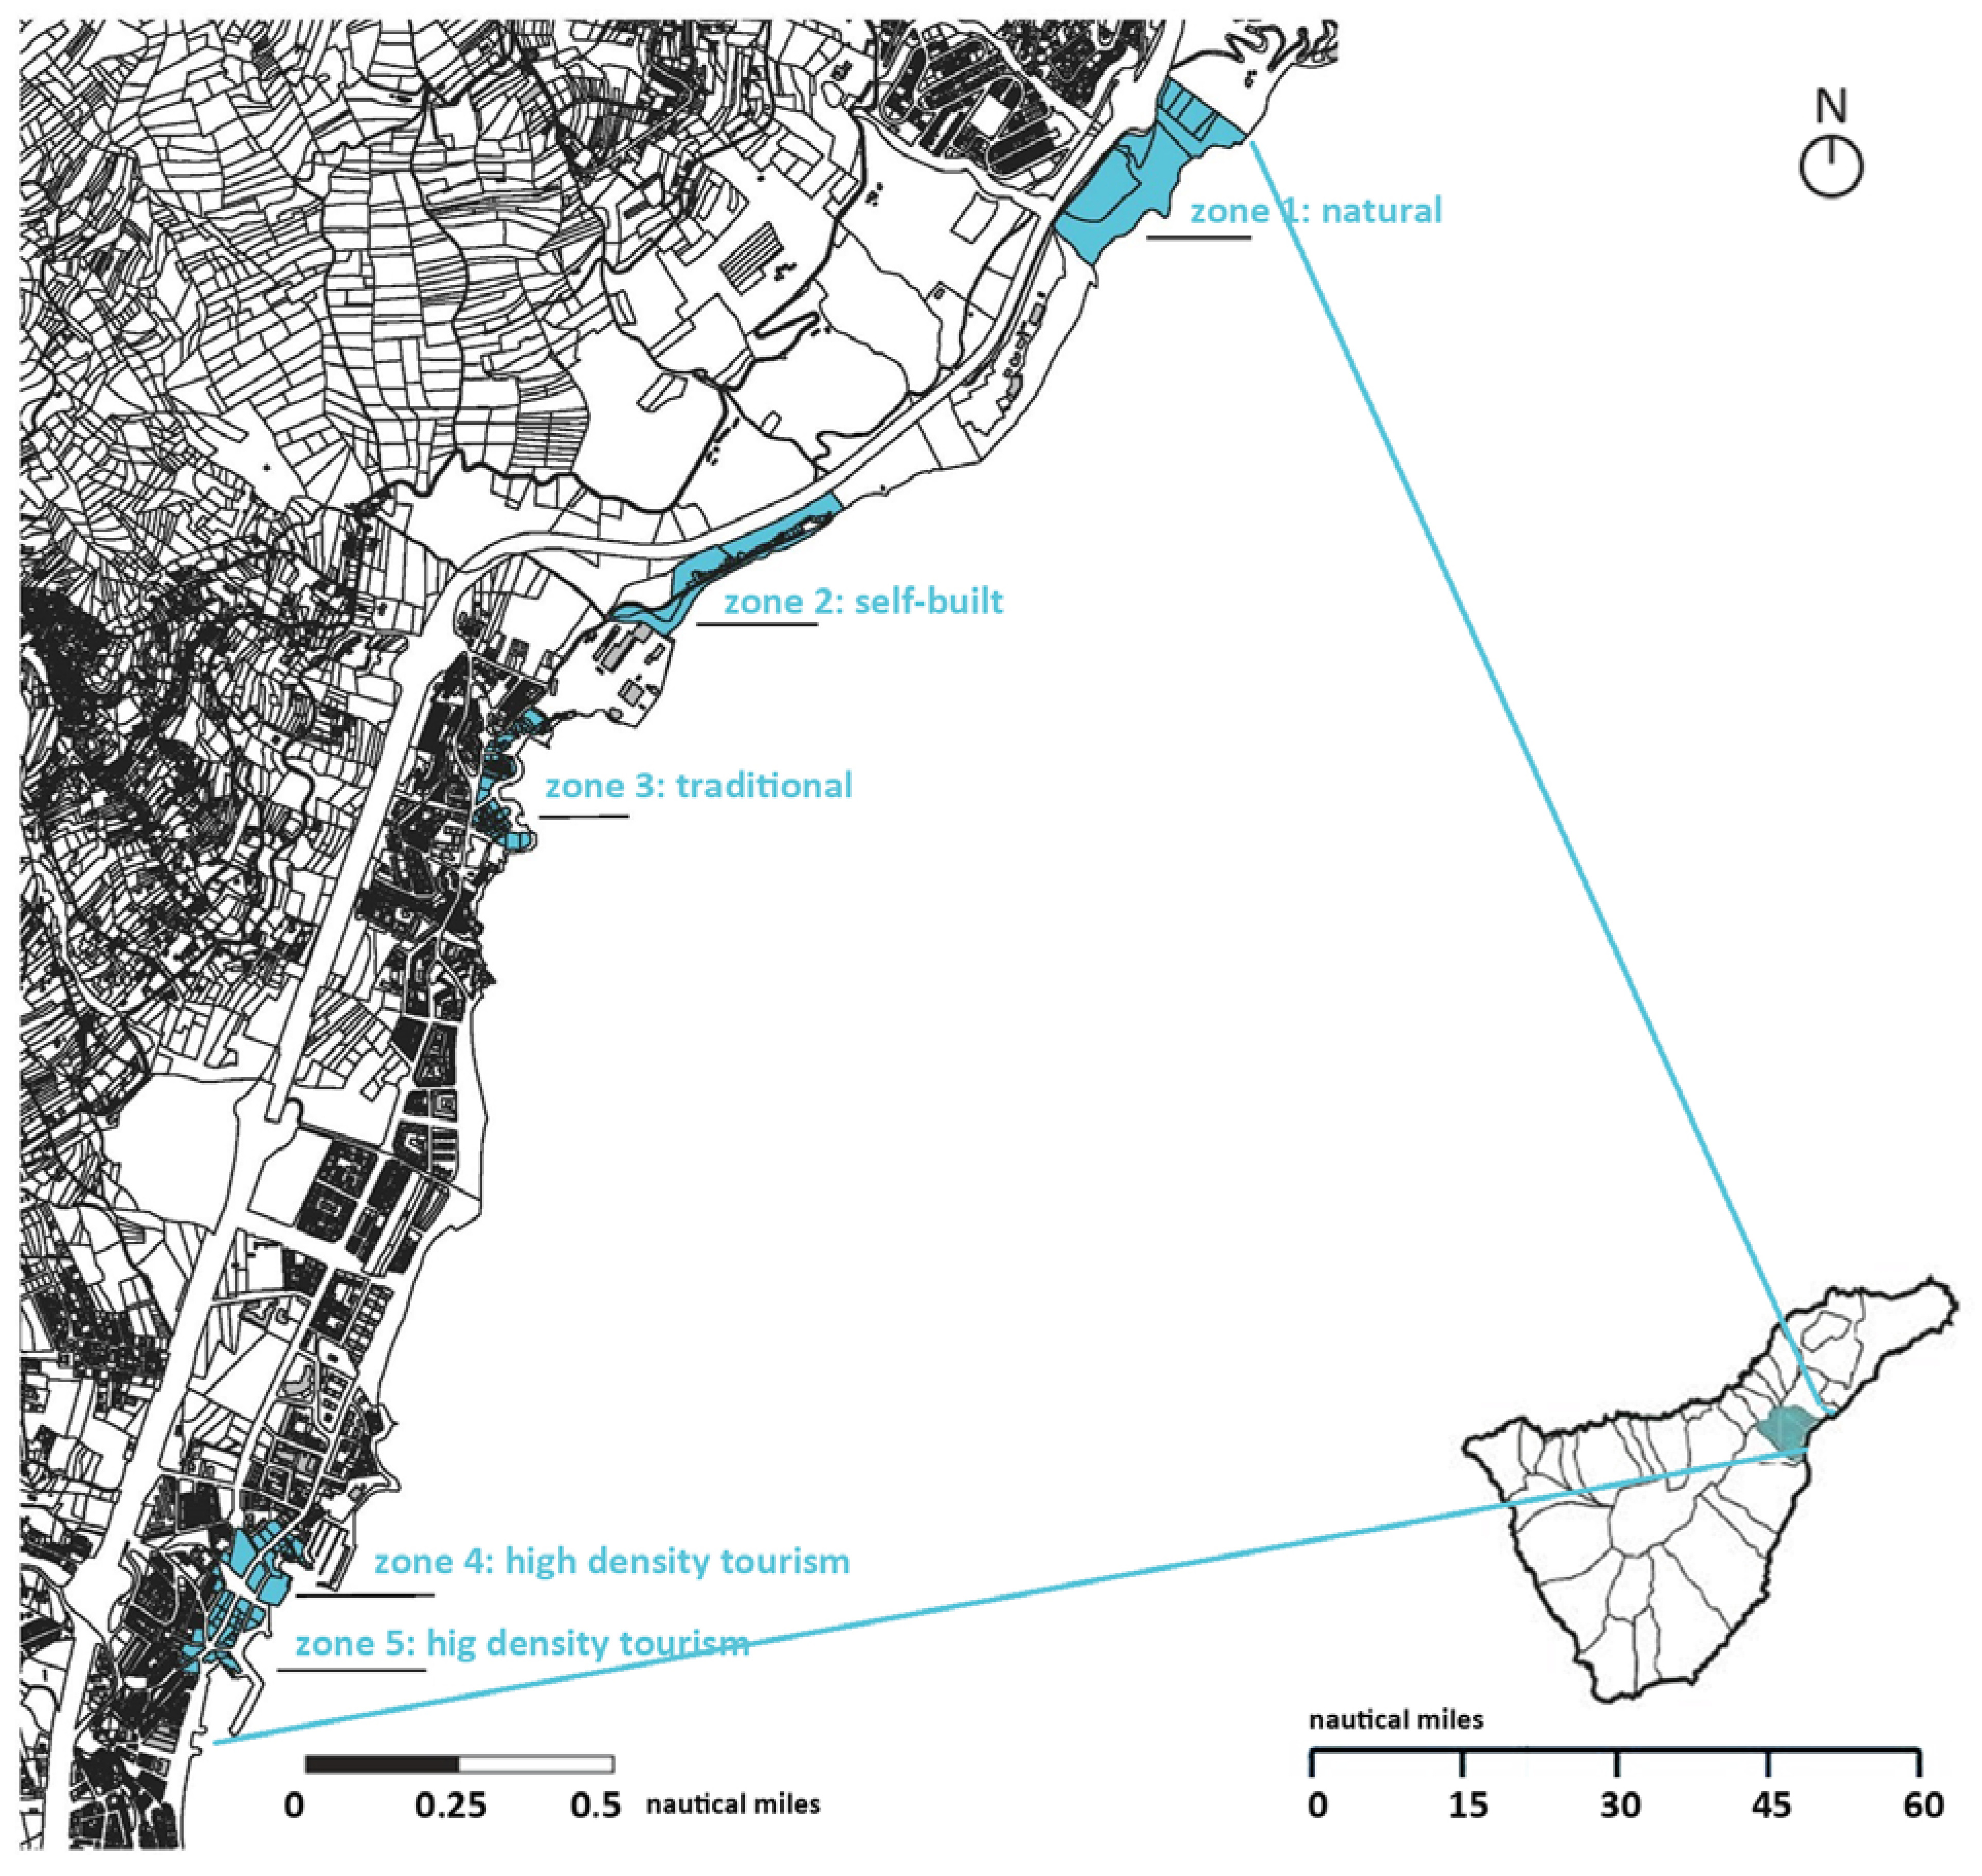
Figure 5.
Location of the project control zones in relation to the coast of Candelaria in the south east of Tenerife island with specific linear scales (nautical miles). Prepared by the authors from: Hernández Chamorro, L; Cruz, O; Ramos dos Santos, G., Óscar Martín, O; Serrano, E; and Nogueira, D; collaborators students (Department of Architecture, Universidad Europea de Canarias).
3.1.1. Zone 1: Natural Areas (Represented in the Cardoon Ravine)
These are natural ravines, confined between the sea surface and extensive walls rising over 100 m in height. Their bottoms should have very low impact (a priori). They are arid, orographically complex lands that do not host any human activity (neither rustic nor urban).
3.1.2. Zone 2: Self-Built Housing Areas in Assimilated Out-of-Order Nuclei (Substandard Housing)
These are substandard housing areas, self-constructed with excavated zones, well-defined in relation to regularly ordered areas, typically with a longitudinal structure and narrow driveways. They lack all urban facilities and are usually located in the coastal-maritime public domain area.
3.1.3. Zone 3: Residential Areas of Historical Implantation, Immediately by the Sea (Caletillas)
These are historically originated built complexes, linked to traditional fishing, with low-density and organic plant layouts. They are consolidated urban areas with low-density single-family and collective housing. The coastline is rugged and elevated relative to sea level. The immediate coastal topography is artificial and extends widely into the sea.
3.1.4. Zone 4: Planned Residential Areas, High Density (Puerto de la Galera)
This models urban areas of expansion from developmentalism that have reached the maritime limit through multiple typologies, creating high-density spaces next to protected areas. Building zones are denser and taller (between 7 and 11 stories above ground). The area encompasses a low zone at sea level and an elevated one. The general use is mainly tourist residential.
3.1.5. Zone 5: Planned Low-Density Tourist Areas (Puerto Playa de la Candelaria)
Originally linked to historical centres by the sea, these areas have experienced semi-ordered growth of medium density (mainly respecting the original height and volume conditions). Mostly, these are collective residential buildings (between 2 and 4 levels above ground). The use of constructions in this area is more varied: commerce, administration, and residential. The area has a slight upward slope to the west with ample public spaces coinciding with the main social spaces of the urban centres.
3.2. Data Collection and Modelling
3.2.1. Urban Density Parameterization
In these areas, the Resless project parametrically models the coastal structures of the CTTs for the five territorial models. The quantification units are as follows: using QGIS analysis, every study area is parameterised based on the urban parameters determined for the characterization of the 5 selected zones, through direct calculation of the spatial data infrastructure of the Canary Islands (IDECanarias). The following parameters have been developed: building typologies (Figure 6), land use (Figure 7), housing density (Figure 8), and built density and population density (Figure 9). With these 5 parameters, the quantitative modelling of these zones is completely defined, and the main indicators are quantified.
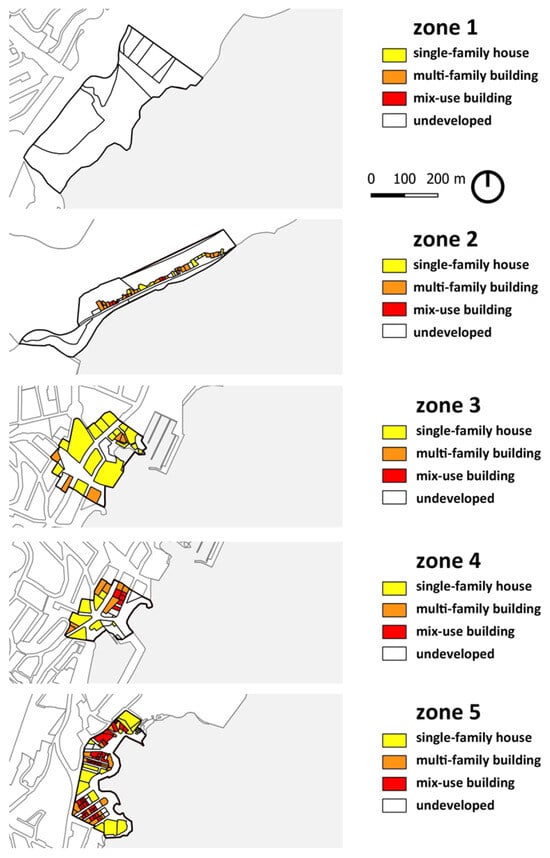
Figure 6.
Graphical representation by categories of “Building Typologies” for each control zone with linear scale (meters). Prepared by the authors from: Hernández Chamorro, L; Cruz, O; Ramos dos Santos, G, Óscar Martín, O; Serrano, E; and Nogueira, D; collaborators students (Department of Architecture, Universidad Europea de Canarias).
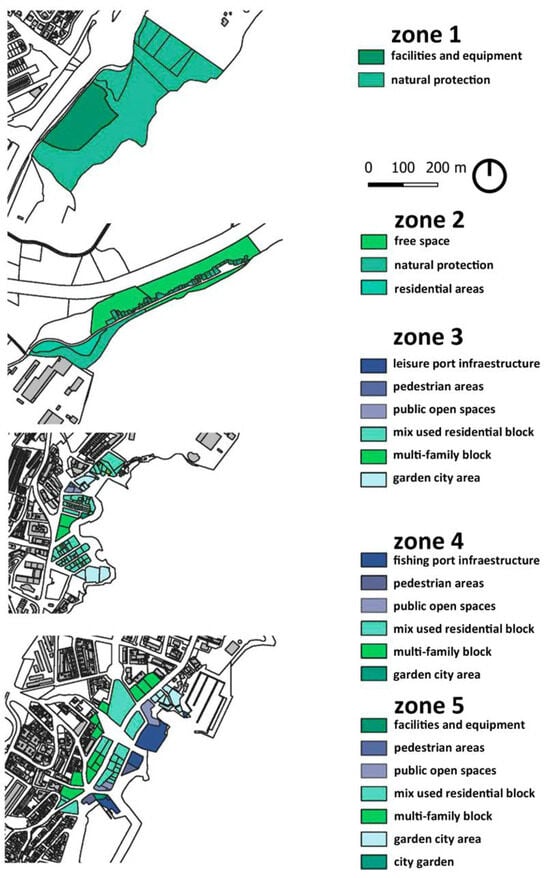
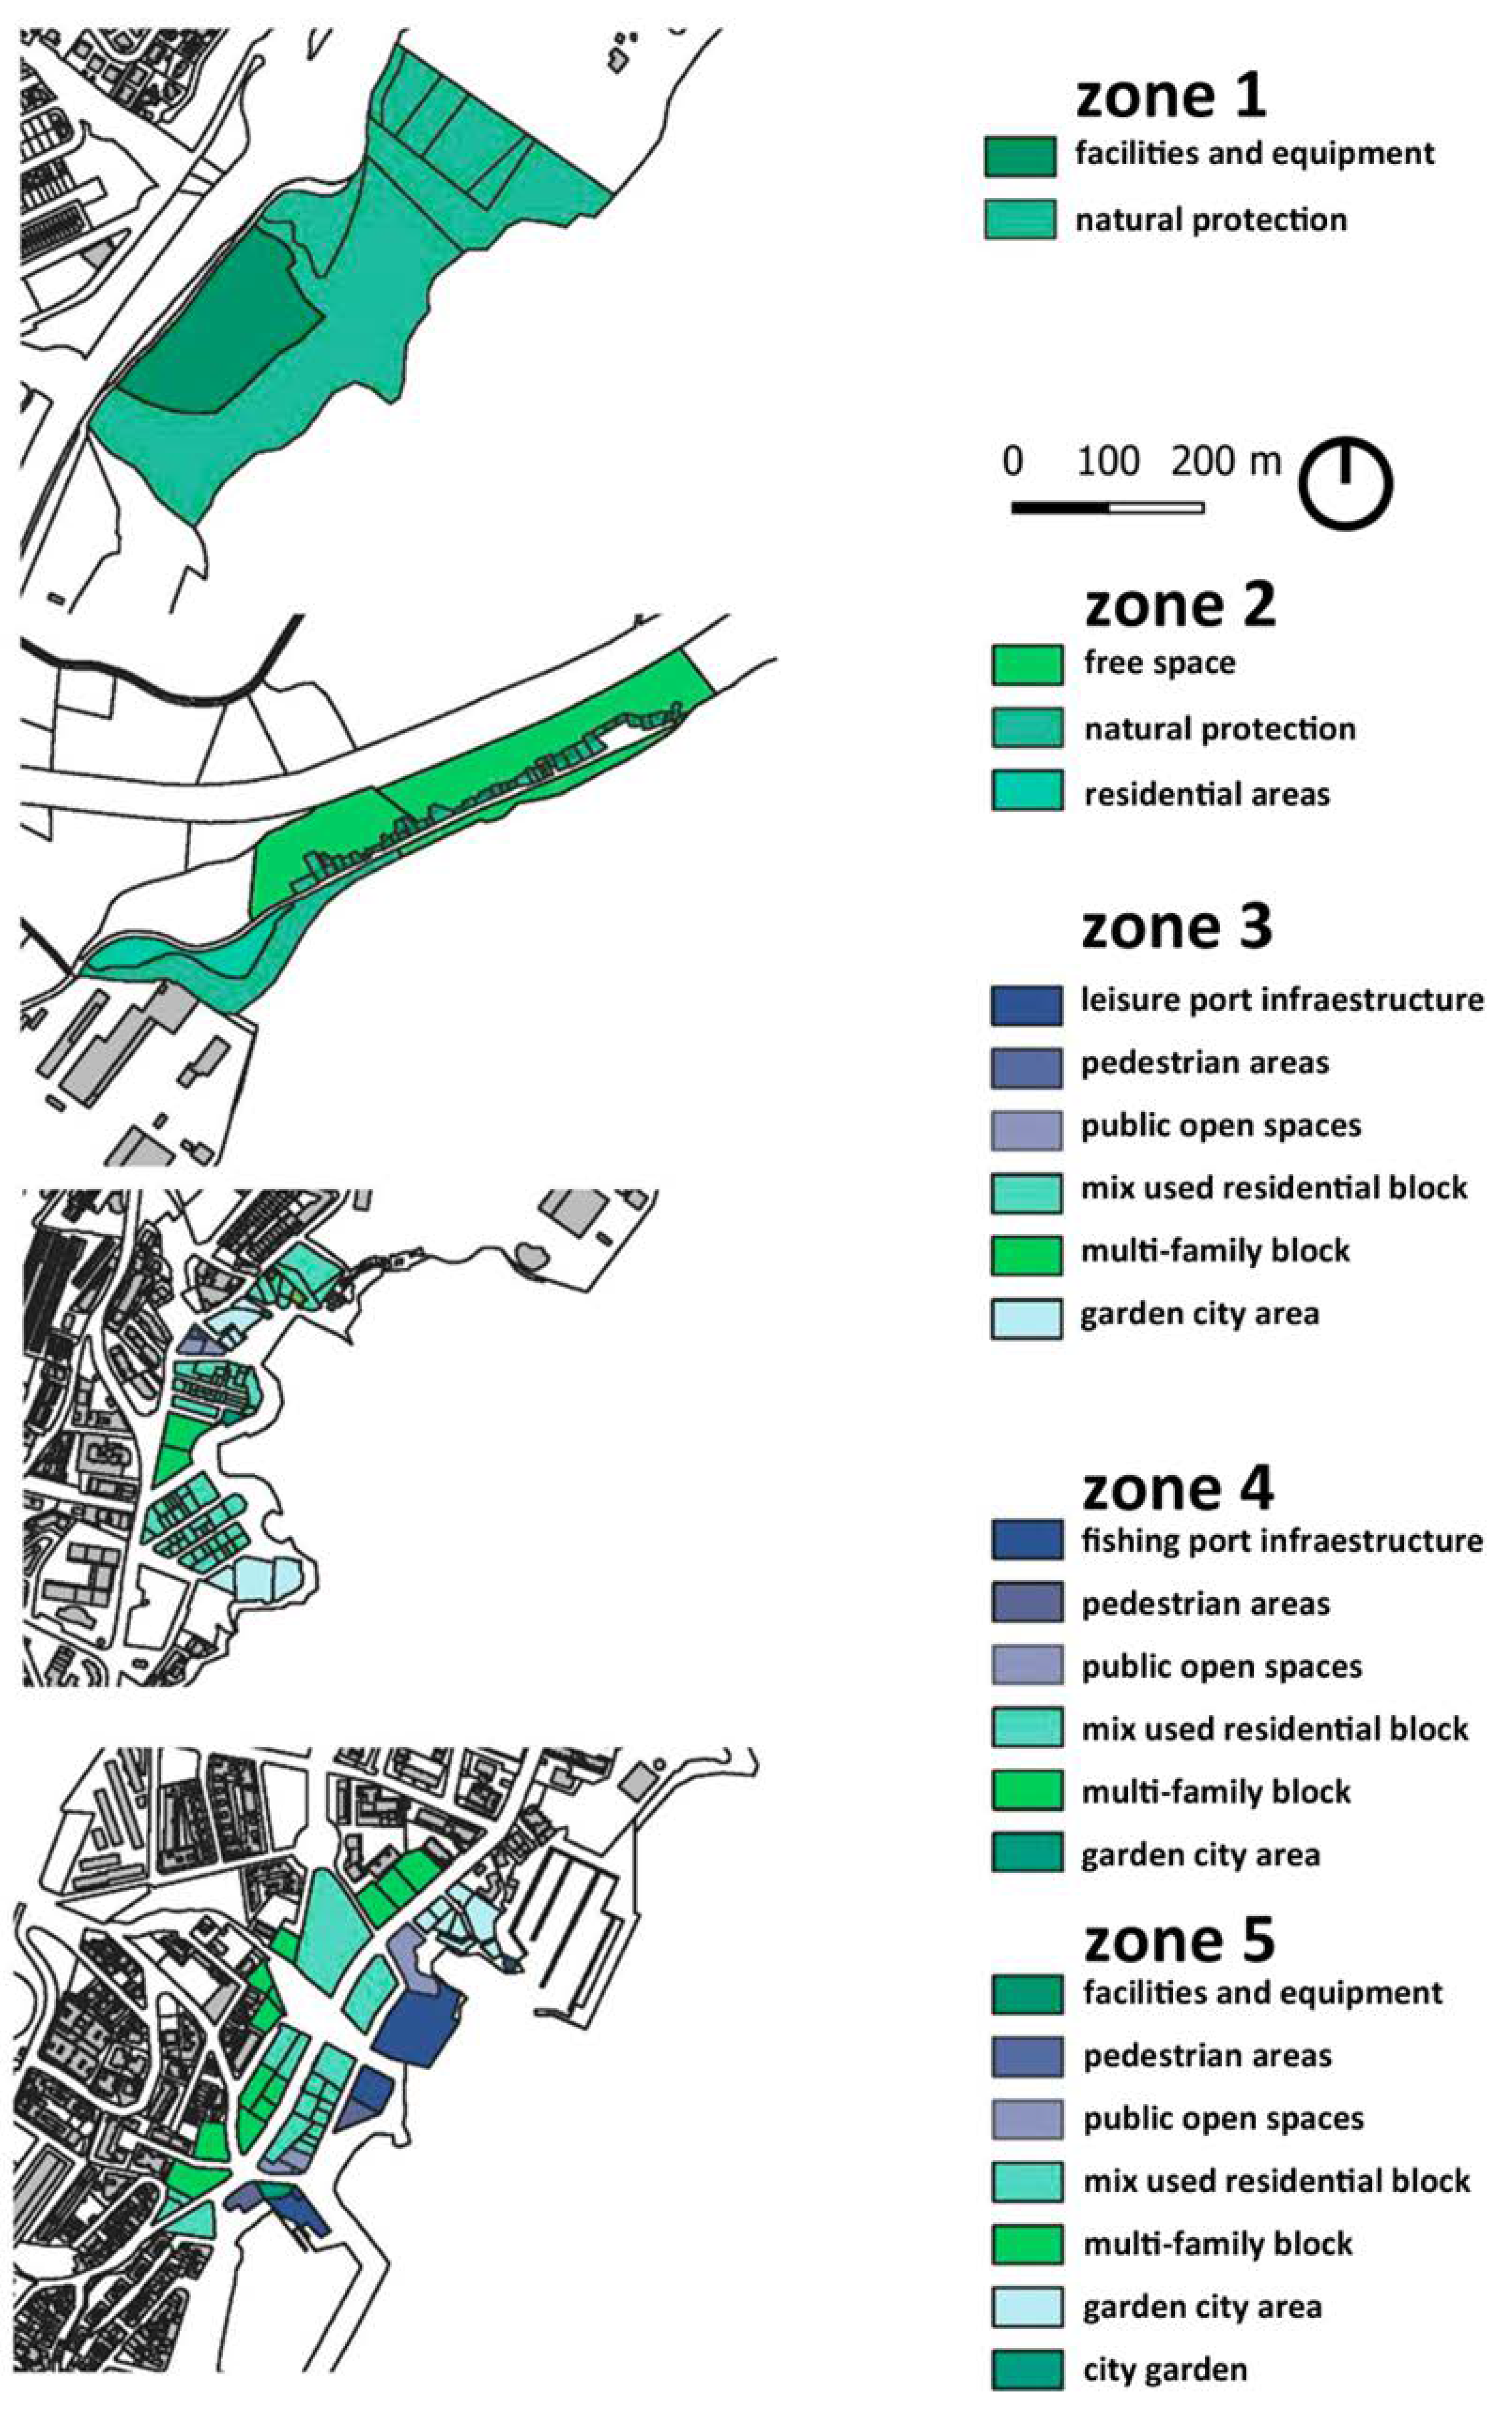
Figure 7.
Graphical representation by categories of “Land use” for each control zone with linear scale (meters). Prepared by the authors from: Hernández Chamorro, L; Cruz, O; Ramos dos Santos, G, Óscar Martín, O; Serrano, E; and Nogueira, D; collaborators students (Department of Architecture, Universidad Europea de Canarias).
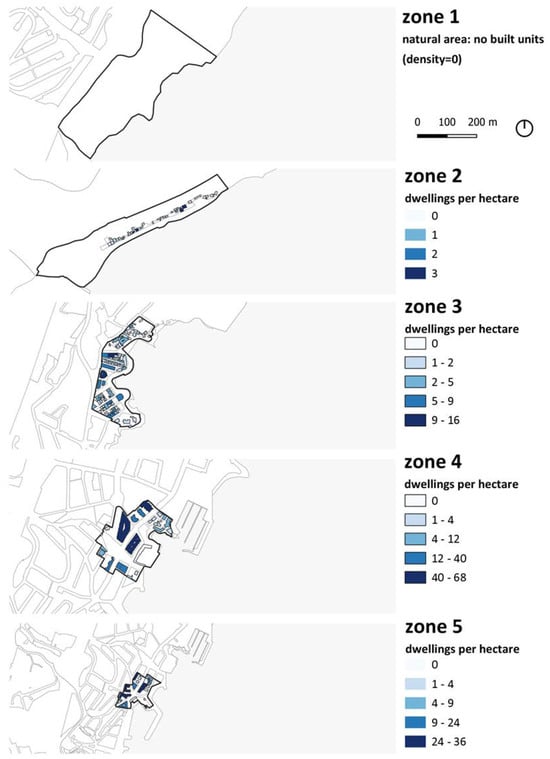
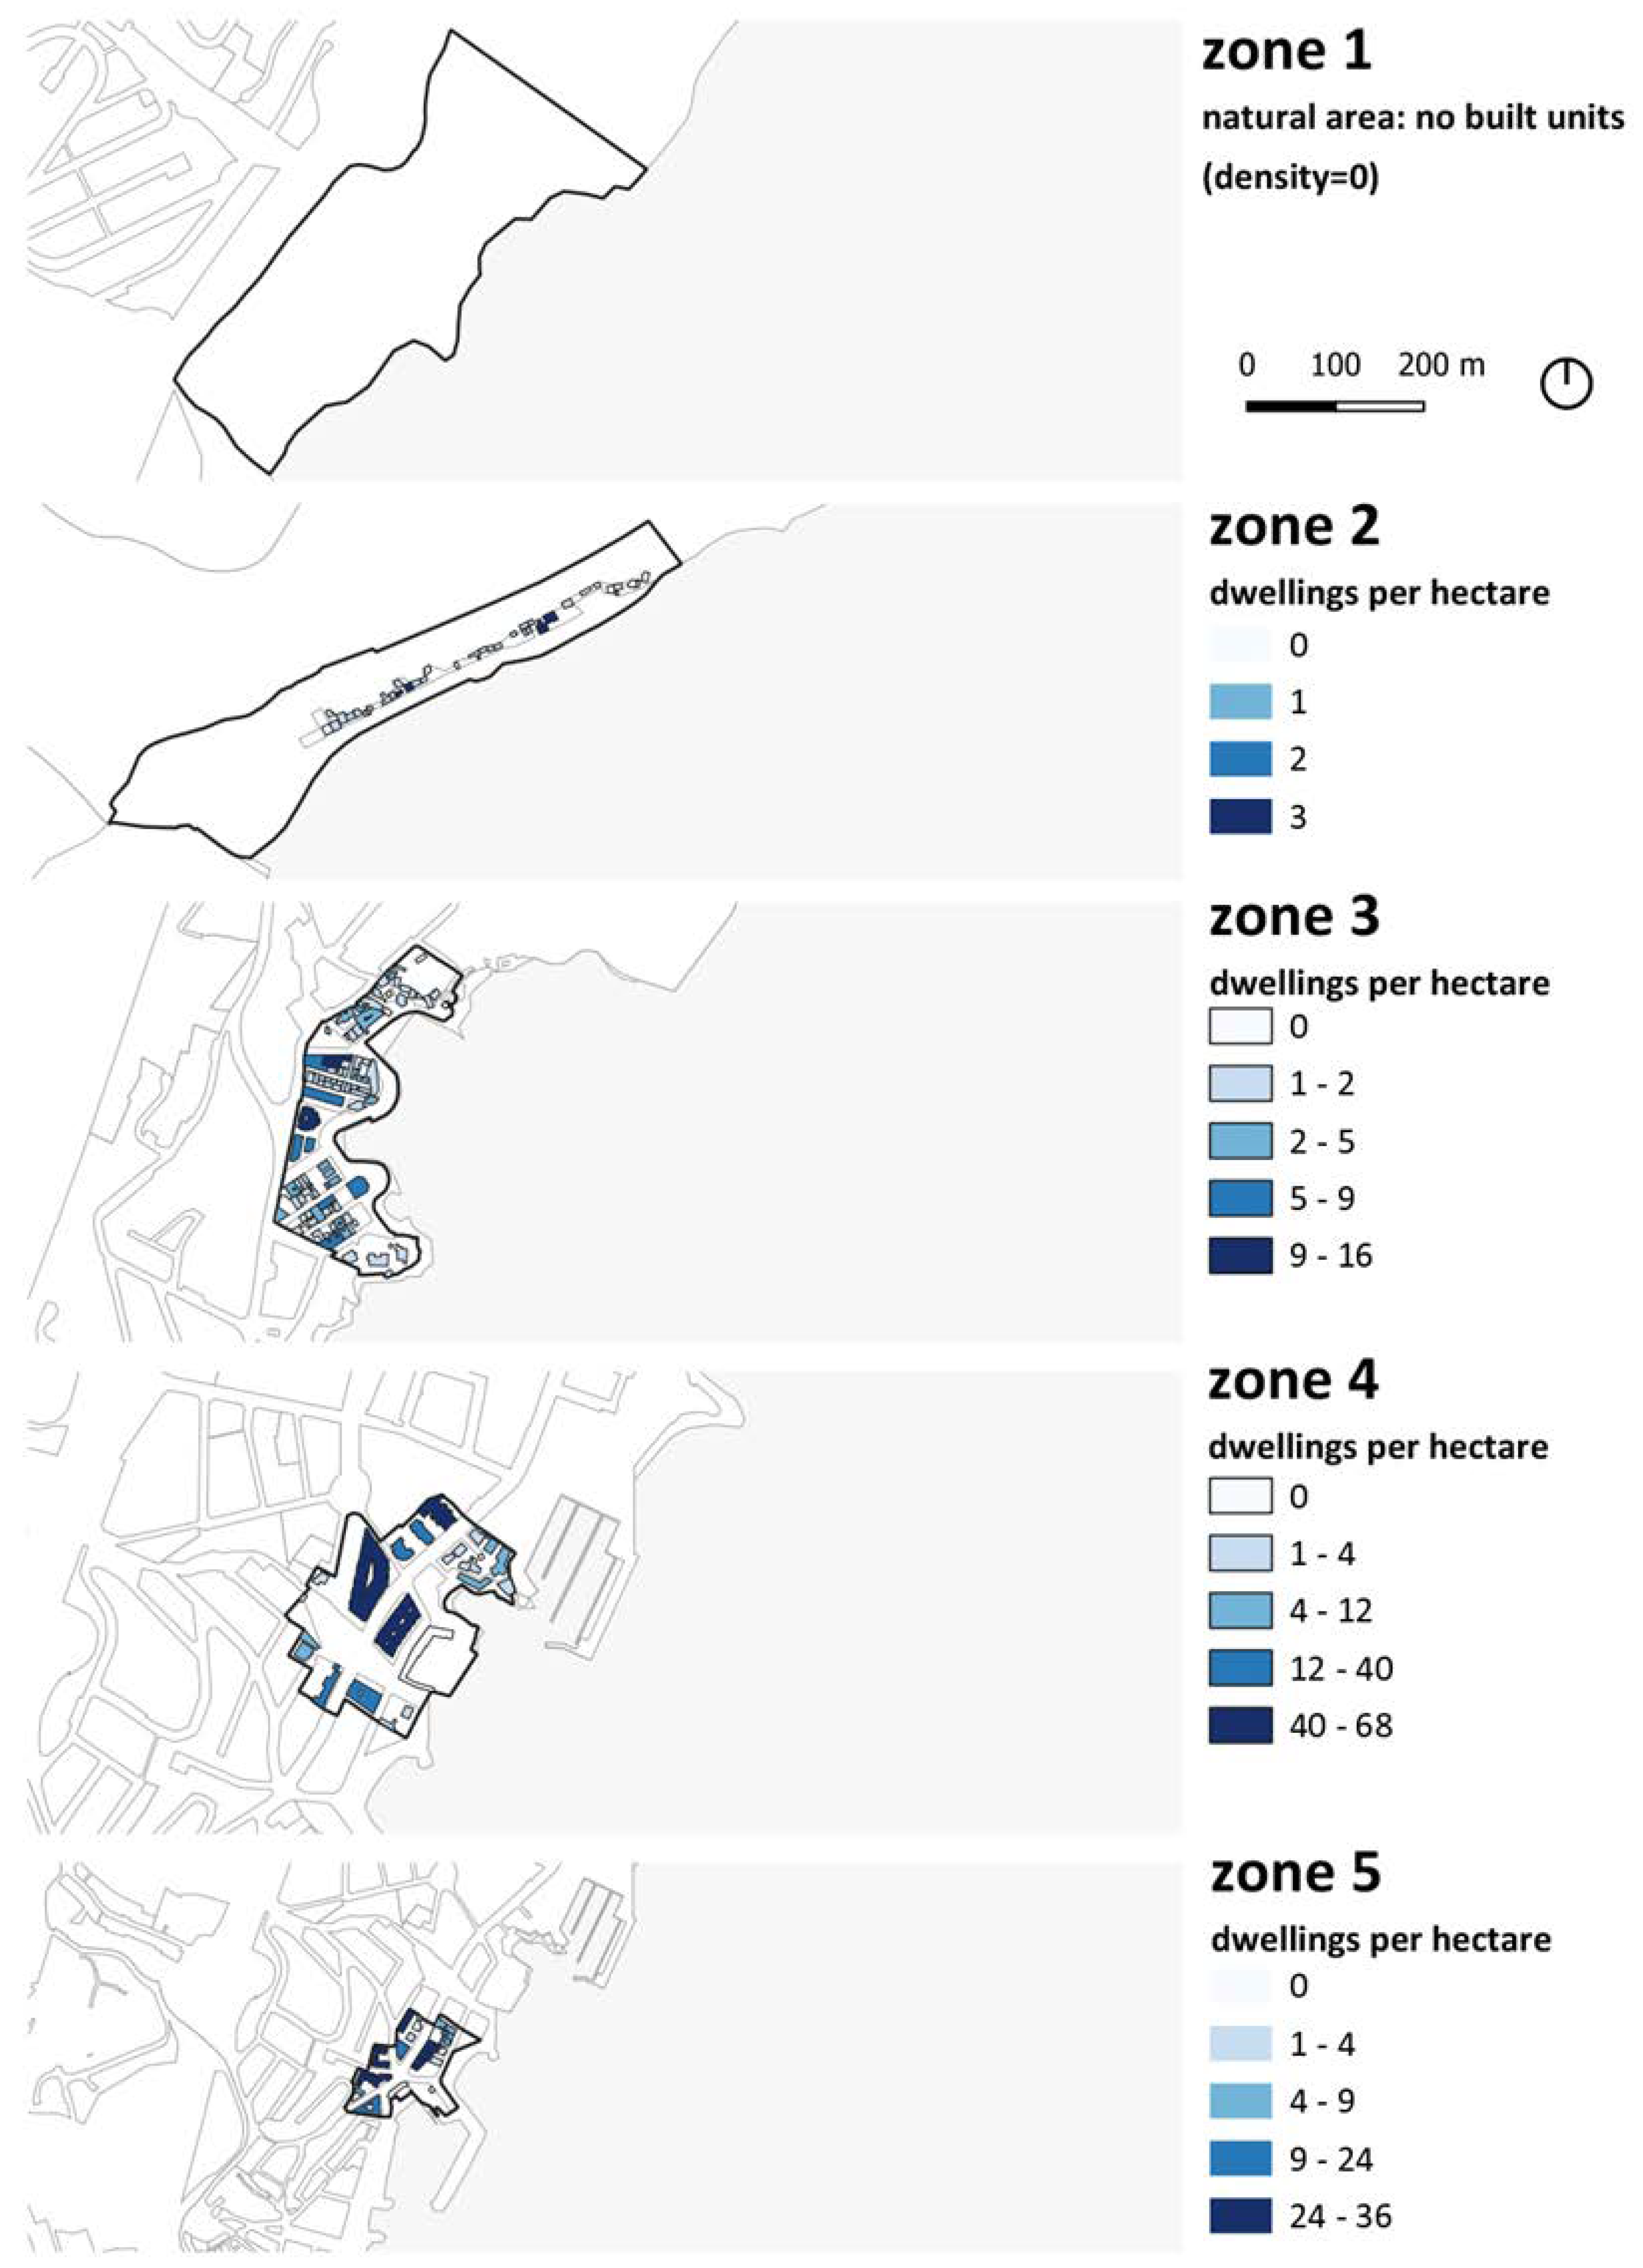
Figure 8.
Graphical representation by categories of the “Housing Density (dwelling per hectare)” parameters for each control zone with linear scale (meters). Prepared by the authors from: Hernández Chamorro, L; Cruz, O; Ramos dos Santos, G, Óscar Martín, O; Serrano, E; and Nogueira, D; collaborators students (Department of Architecture, Universidad Europea de Canarias).

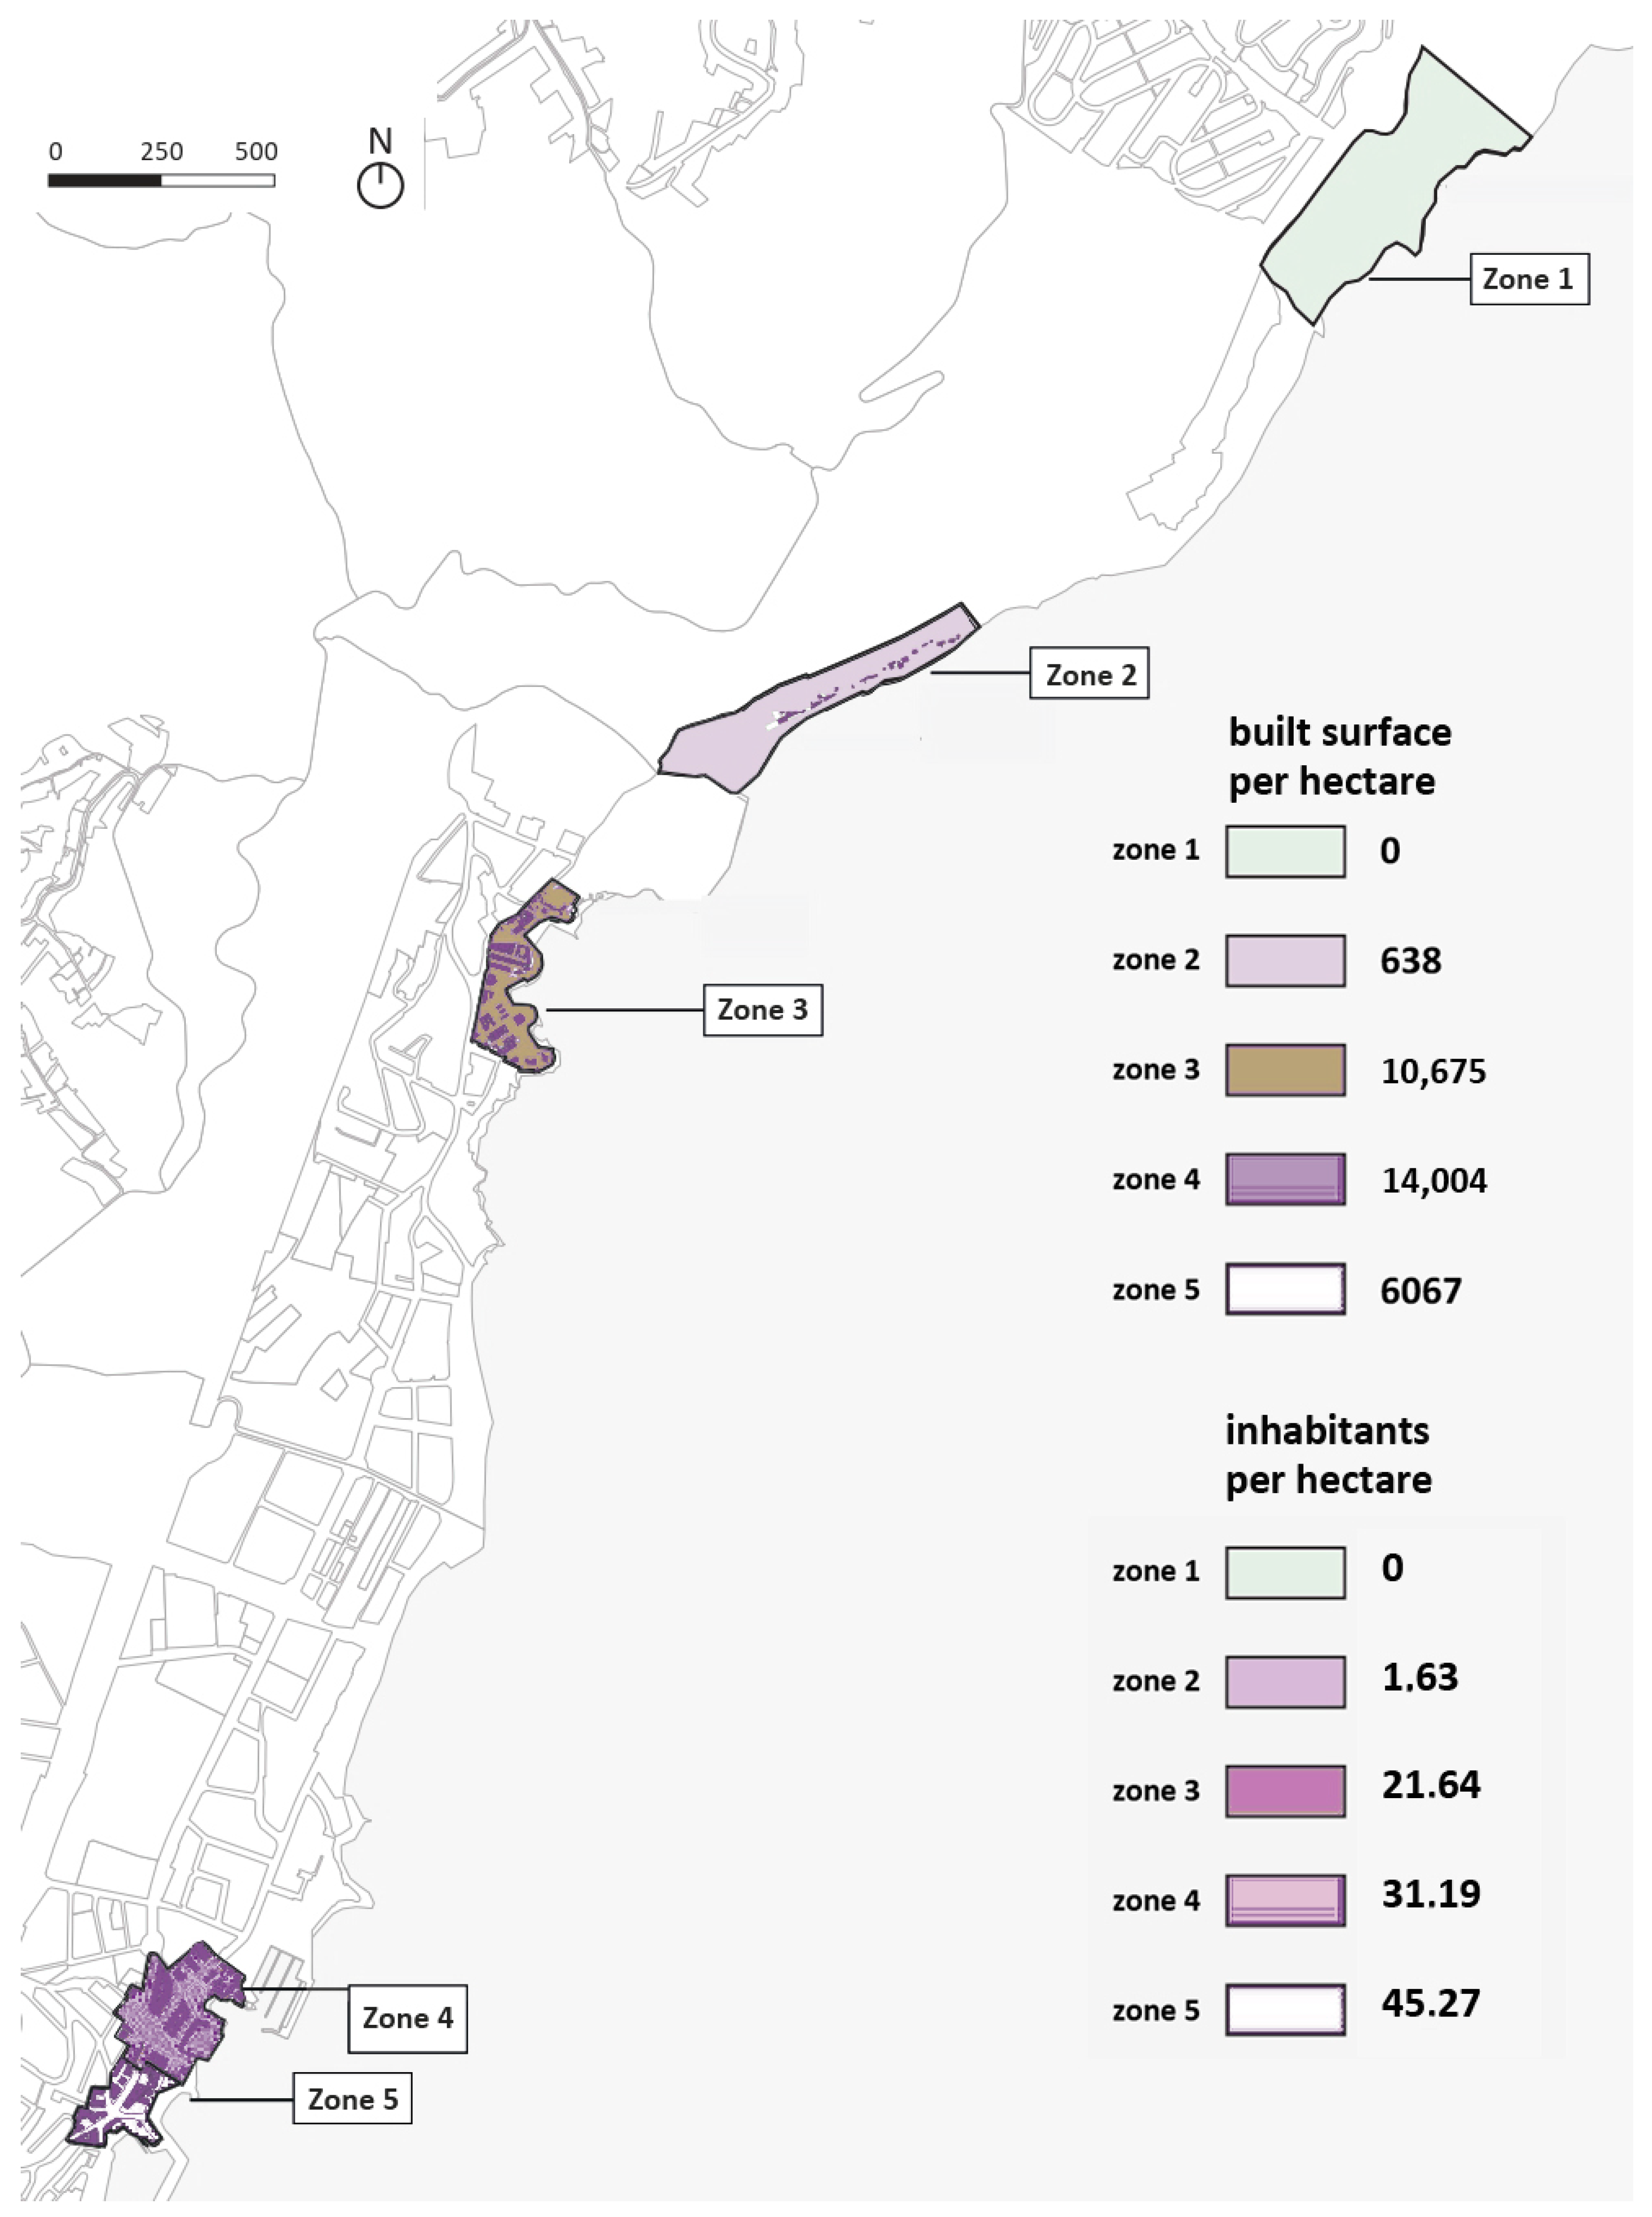
Figure 9.
Graphical representation by categories of “Built Density (built square meters for every hectare) and Population Density (inhabitants per hectare)” for each control zones with linear scale (meters). Prepared by the authors from: Authors: Hernández Chamorro, L; Cruz, O; Ramos dos Santos, G, Óscar Martín, O; Serrano, E; and Nogueira, D; collaborators students. (Department of Architecture, Universidad Europea de Canarias).
With these urban parameters, main indicators of urban density are completely quantitatively modelled (Table 1).

Table 1.
Parametric modelling of density measures in the control zones.
3.2.2. Parameterization of Marine Litter
In contrast to the urban modelling conducted in the previous section and as the first part of this methodology, the parameterization of marine litter in a specific area poses specific challenges due to the impossibility of capture through nonvisual means [38]. Additionally, data collection may involve the removal of the litter itself, beneficial for both local problem elimination and measuring the replenishment rate [23].
Among the most frequently found items in marine litter are glass, metal, paper, and plastic, with plastic being the most prevalent type of marine litter globally. In particular, the most common types of plastic are polyethylene (PE), polypropylene (PP), and polyethylene terephthalate (PET), which explains their high presence in the marine environment [44]. Regarding the Canary archipelago, the presence of microplastics (in some cases mesoplastics were also simultaneously analysed) has been documented on beaches in Tenerife [17]. Although there is no clear definition of what constitutes a hotspot of plastic pollution (especially microplastics), several Canary beaches have been categorized as such—beaches with visual evidence of pollution at any time of the year and reported with values exceeding 100 g/m2 of plastic in certain seasons. Therefore, the selection of zones has also been made based on formal similarities with the maritime-coastal qualities affected by waste [49].
The main challenges addressed originate from both the composition and location of marine litter. Marine litter is a heterogeneous mix of materials with various shapes and sizes [50]. In many cases, it consists of fragments of larger items and accumulates in remote or hard-to-reach areas, making data collection in these locations costly and logistically complex. This impacts the precision of parameterization since a significant portion of the litter is found on the seafloor [51]. Consequently, the automatic identification and classification of deep-sea marine litter using technologies such as drones or satellite images [52] are currently not feasible on a global scale, especially for underwater areas beneath the surface. Finally, the lack of global standards for the classification and parameterization of marine litter complicates data comparison between studies and regions [19].
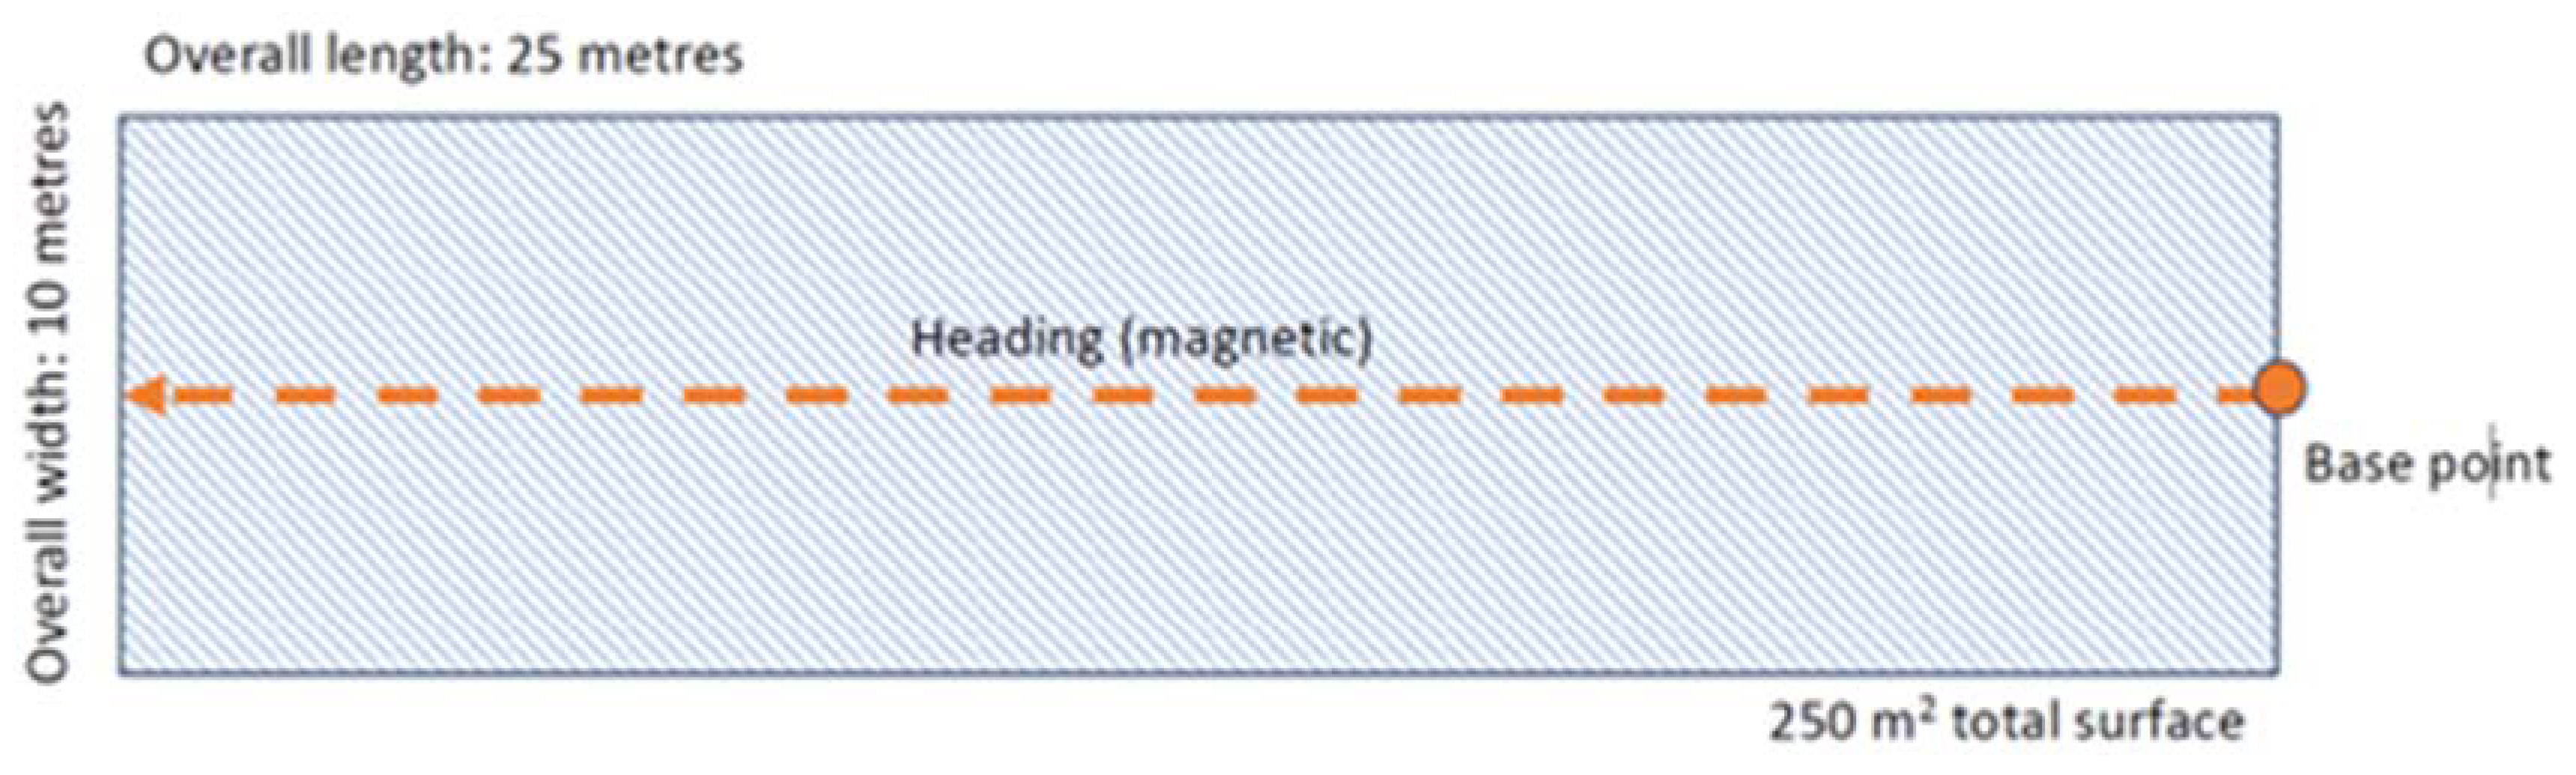
Therefore, a comprehensive monitoring methodology has been designed and implemented in the infralittoral zone of each area. In each of them, and during the same season, data collection of qualified macro litter has been carried out by deploying two underwater transects (Figure 10) with a randomly chosen starting point marked using a bottom marker. Each transect has a length of 25 m and a double bandwidth of 5 m, each covering an area of 250 square meters each transect (Figure 11). Linear search routes are conducted in this area, locating and characterizing litter in situ [53]. During every dive at each point, GPS coordinates and visual headings of each transect’s starting point and its magnetic bearing have been recorded, to be replicated in the subsequent dive in the same zone during next season’s campaign.
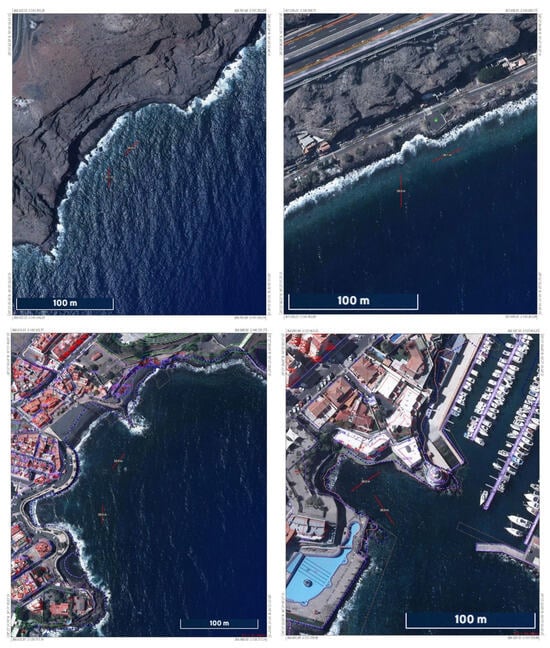
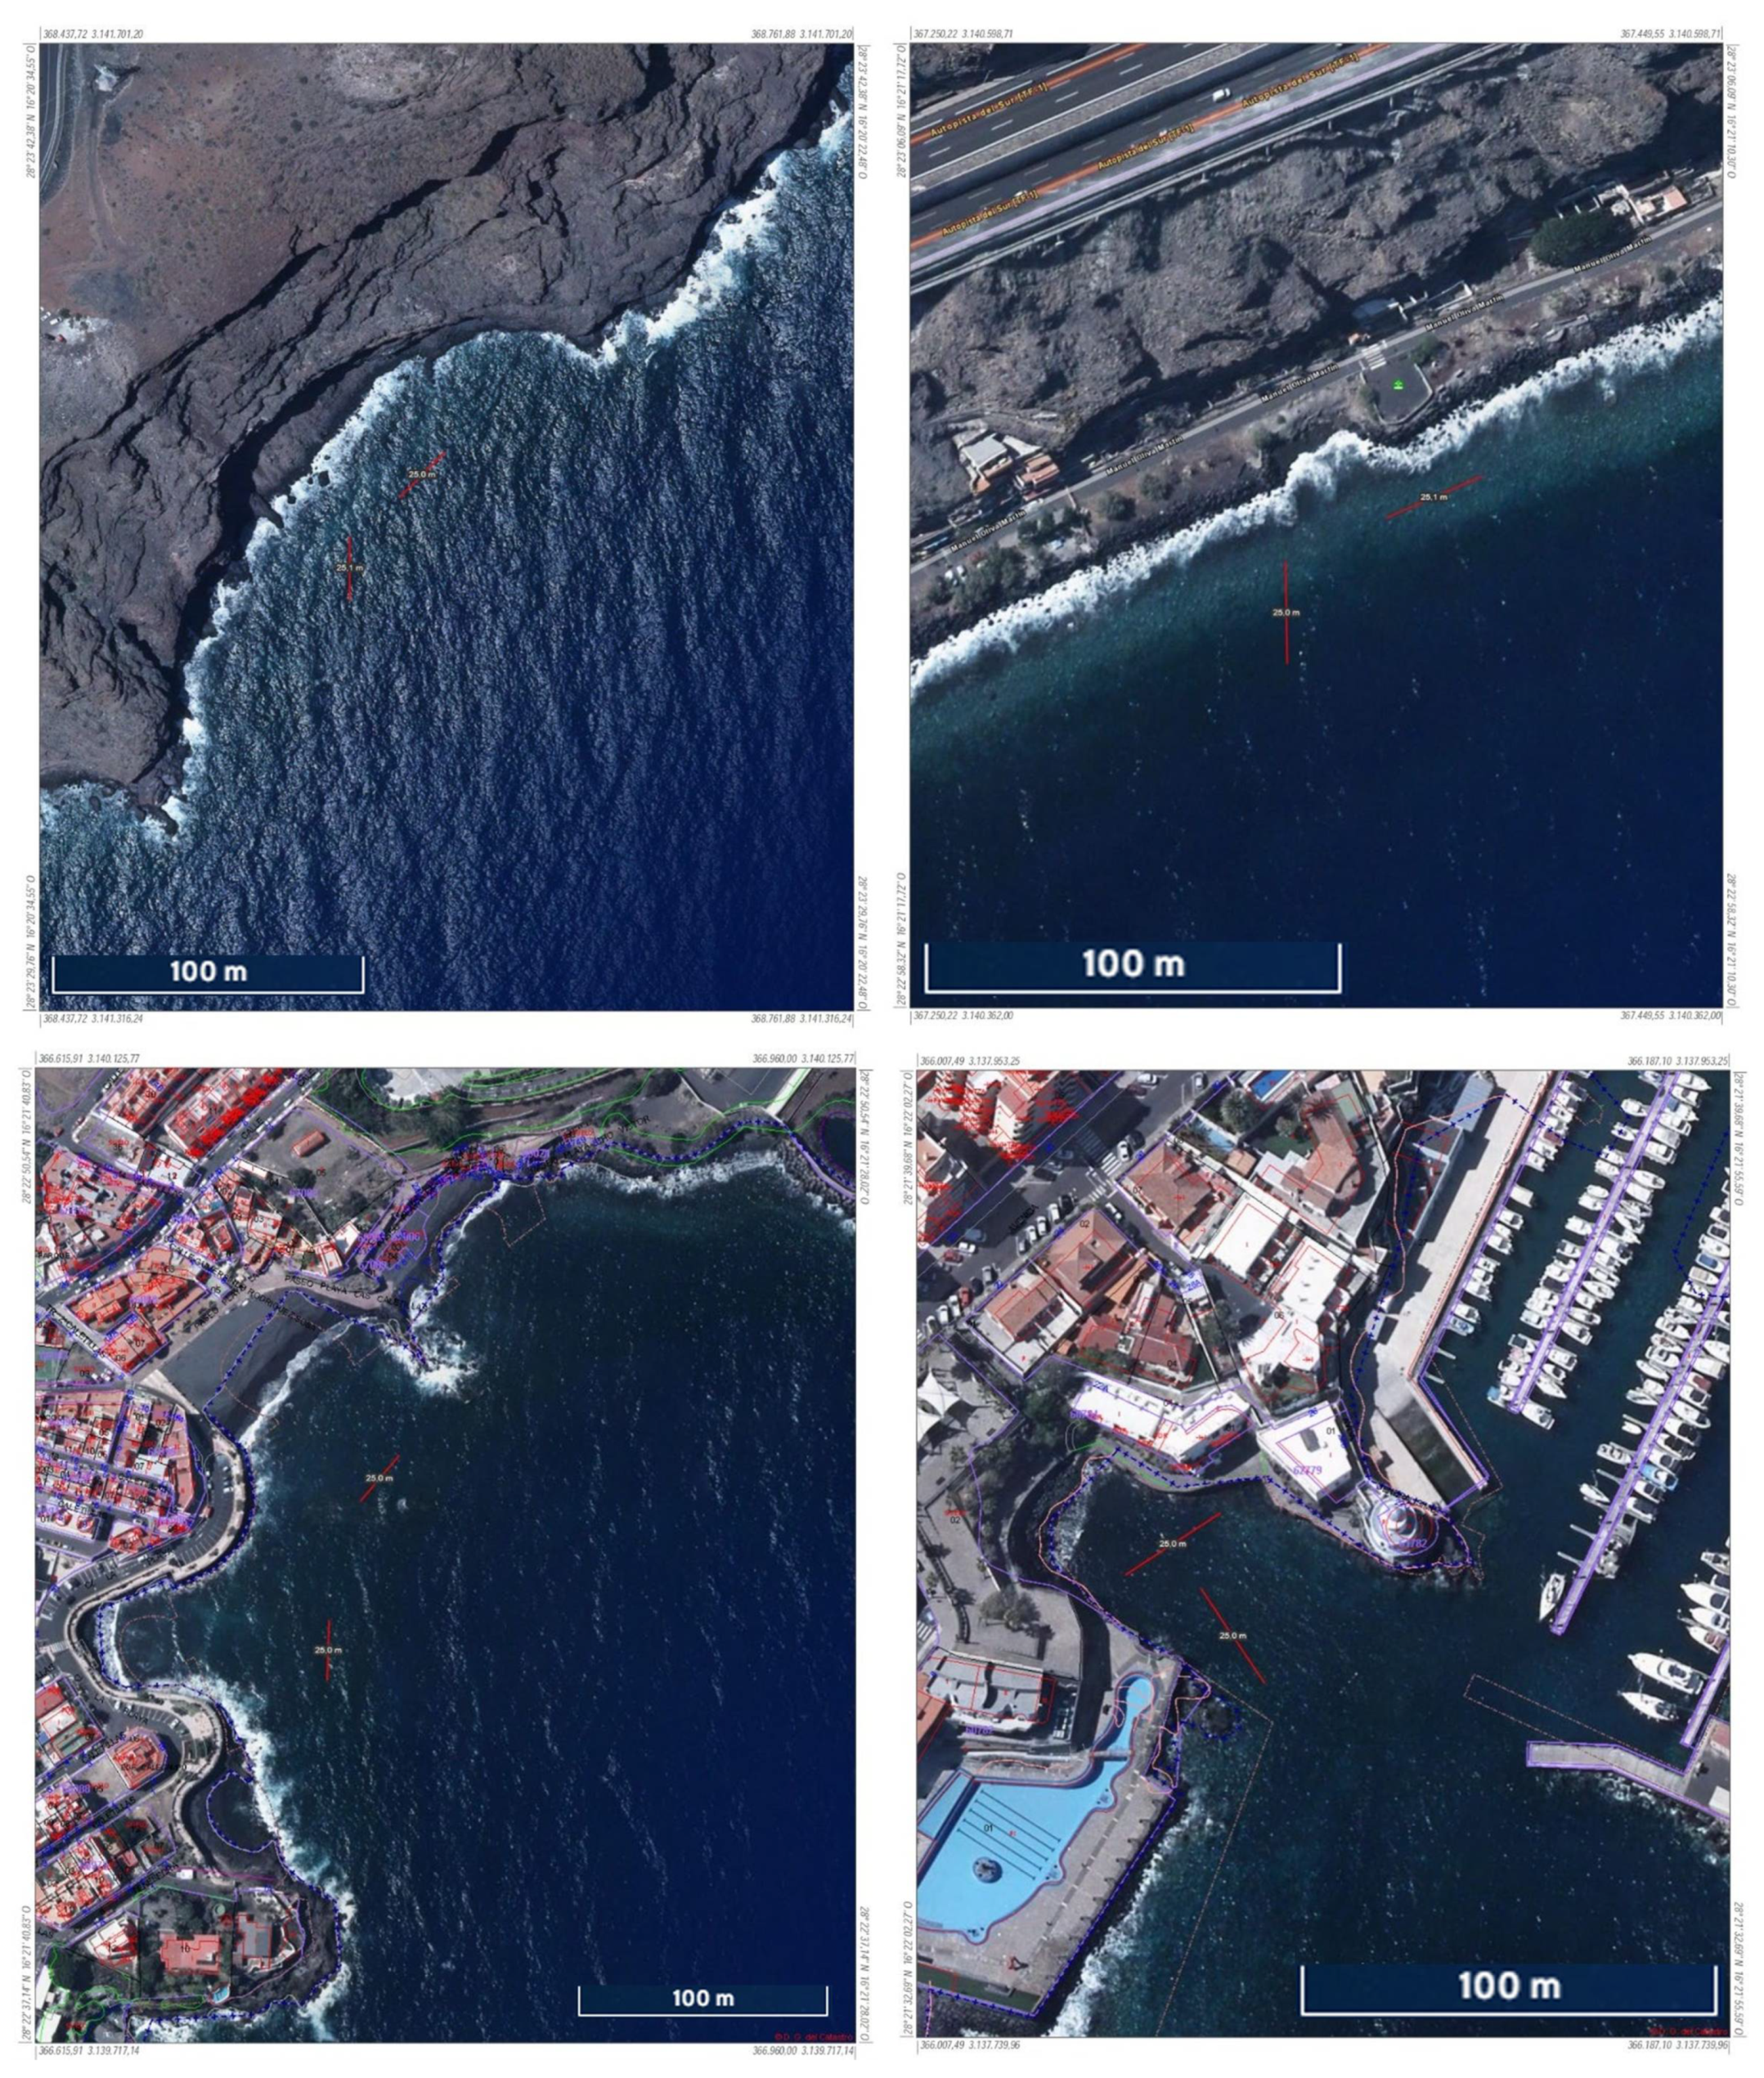
Figure 10.
Location of double transects per control point, the basis of the tested methodology, with double orientation, reproducible starting point, and heading. Location in front of control zones 1 to 4. Source: elaboration of markings on Grafcan-Spatial Data Infrastructure of the Canary Islands. ITRF93 Reference System. WGS84 Ellipsoid. REGCAN95 Geodetic Network. UTM representation system.
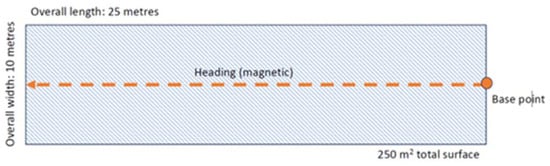
Figure 11.
Schematic development of the baseline transect used for parametric measurement of litter on the seabed—in the infralittoral zone—according to the methodology developed for comparison with urban indicators. The transect has a bottom pike on the seabed, which is marked on the surface with a bottom marker. From this main pike, the main line (25 m long) and two parallel lines on each side at five meters are drawn. The bearing of the transect is magnetic to be reproduced in the different campaigns.
This Resless methodology requires the implementation of scientific diving operations [54] in which the average depth allows for dives with strict adherence to safety standards defined by SEBUCIU (Spaniard Society of Scientific and University Diving) for scientific diving and the recreational scuba diving standards of WRSTC (World Recreational Scuba Diving Training Council), as well as those determined by Royal Law 550/2020, which establishes safety conditions for diving activities [55]. Therefore, the entire transect must always be at depths greater than 40 m, which in the middle of the Atlantic Ocean corresponds closely to the lower limit of the infralittoral zone. This methodology potentially allows data collection throughout the infralittoral zone. These field actions enable in situ studies that would not be possible with remote sensing methods [56] due to the entanglement of litter in substrates with medium (>10 mm) and high (>30 mm) grain sizes.
In reference to parametrization, the Resless methodology adheres to recognized international and national standards to ensure the consistency and comparability of collected data [43]. It also allows for the precise identification and classification of types and sizes of marine litter, as it is conducted in situ [57]. The possibility of exact repetition in the same study area across four campaigns ensures the representativity of the area and the spatial and temporal variability of waste distribution [58]. It is a methodology fully adaptable to different seabed types and marine topographies of infralittoral bottoms, including surface and seabed data, thus collecting information throughout the water column. This allows the compilation of contextual information such as precise geographic location, weather conditions on campaign days, and especially the source and origin of the waste. With multiple campaigns at the same sampling points, it enables the assessment of mitigation measures, including evaluating their effectiveness over time.
Moreover, the Resless methodology is easy to reproduce and standardise for the infralittoral seabed—especially those directly affected by the public spaces of CTTs. It is not costly and avoids the disruption of seabed biocenosis; the selection and manipulation are carried out using manual procedures with the presence of responsible underwater field technicians.
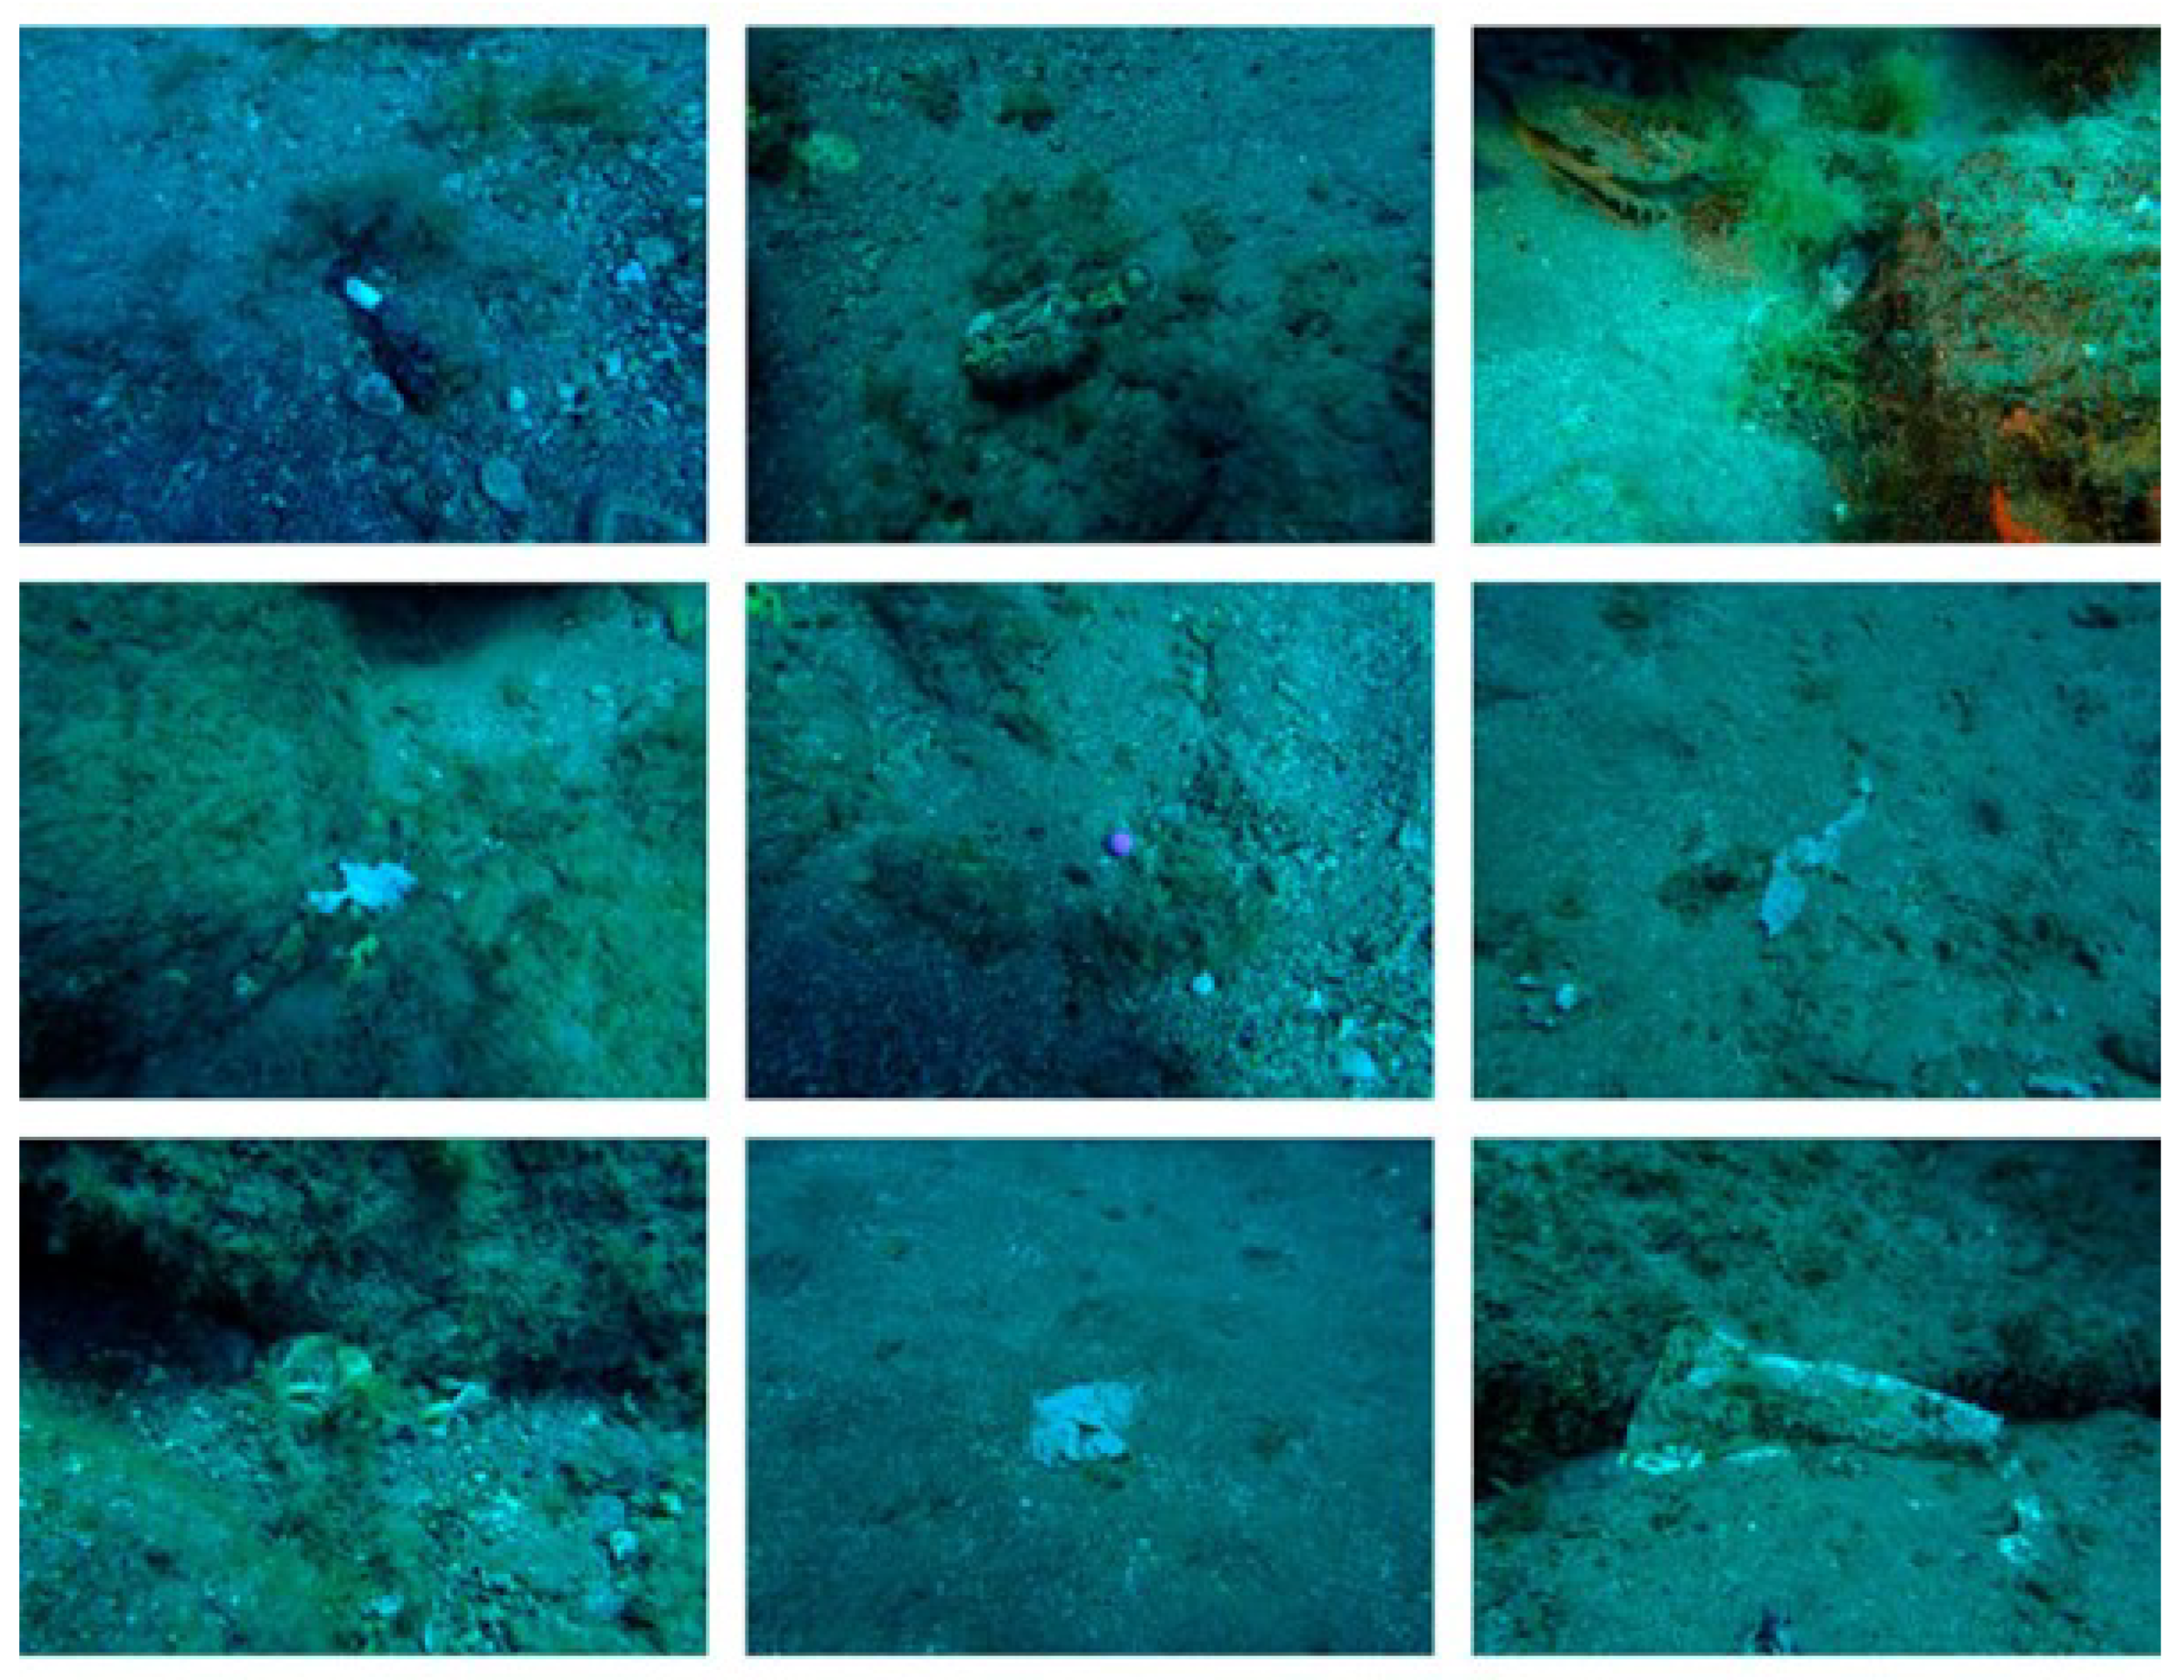
This methodology does not consider data obtained from “citizen science” programs as the basis for measurement. In recent years, the involvement of untrained volunteers (known as “citizen scientists”) has emerged as a promising solution to bridge the gap between the need for assessing environmental issues and large-scale data collection through cost-effective monitoring [37]. Thus, active participation of non-professional citizens in various underwater clean-up activities with associated monitoring has been allowed. The creation of online platforms and apps is facilitating citizen participation in these citizen science programs like clean-up activities [23]. However, although the voluntary involvement of individuals in collecting environmental data strengthens public awareness, there is no empirical evidence validating the impact of data obtained through citizen science initiatives [38] on the monitoring of specific ecological systems. Therefore, in this methodology, and due to the structured work from the transects, data contributions from these programs are not considered, given their unstructured nature and lack of reliability due to the absence of result contrast and evidence from dives. Within this parameterisation methodology, the modelling of the following characterization factors of the CCT′s in relation to the presence of waste is carried out based on the following parameters: average depth of the zone (metres deep), area extension (hectares), the quality of the holding ground (compactness), and the transition section between floors (average slope) (Figure 12). In each of these zones, control immersions have been carried out.
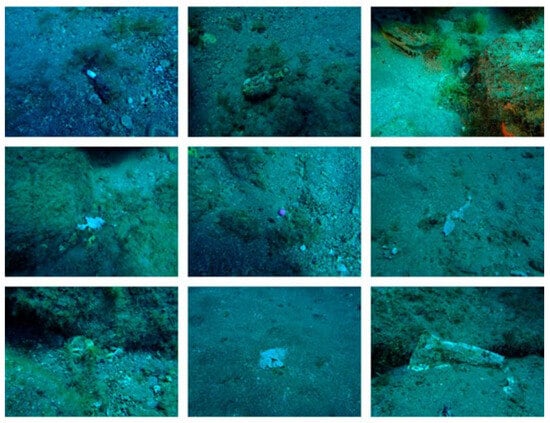
Figure 12.
Imbrication of marine litter in the configuration of the seabed and its biocenosis on supporting substrates. In the images, the combined waste on the seabeds makes it technically unfeasible to conduct studies other than field campaigns at depth using scientific diving techniques. From authors.
4. Results and Discussion
Following completion of observation and removal campaigns, a total of 20 samplings and comprehensive references have been conducted using the presented methodology, documenting 261 references of infralittoral marine waste in the area. This research has allowed for a systematic review of the seabed in the area and an in situ and in visu systematic observation, providing a compilation of evidence that has been contrasted—unlike citizen science actions—while also serving the purpose of raising awareness for those who showed interest in the ongoing actions. Local impact, reflected in regional media, has been correctly fulfilled, and obtained data represent a composite and intricate study that had not taken place until now.
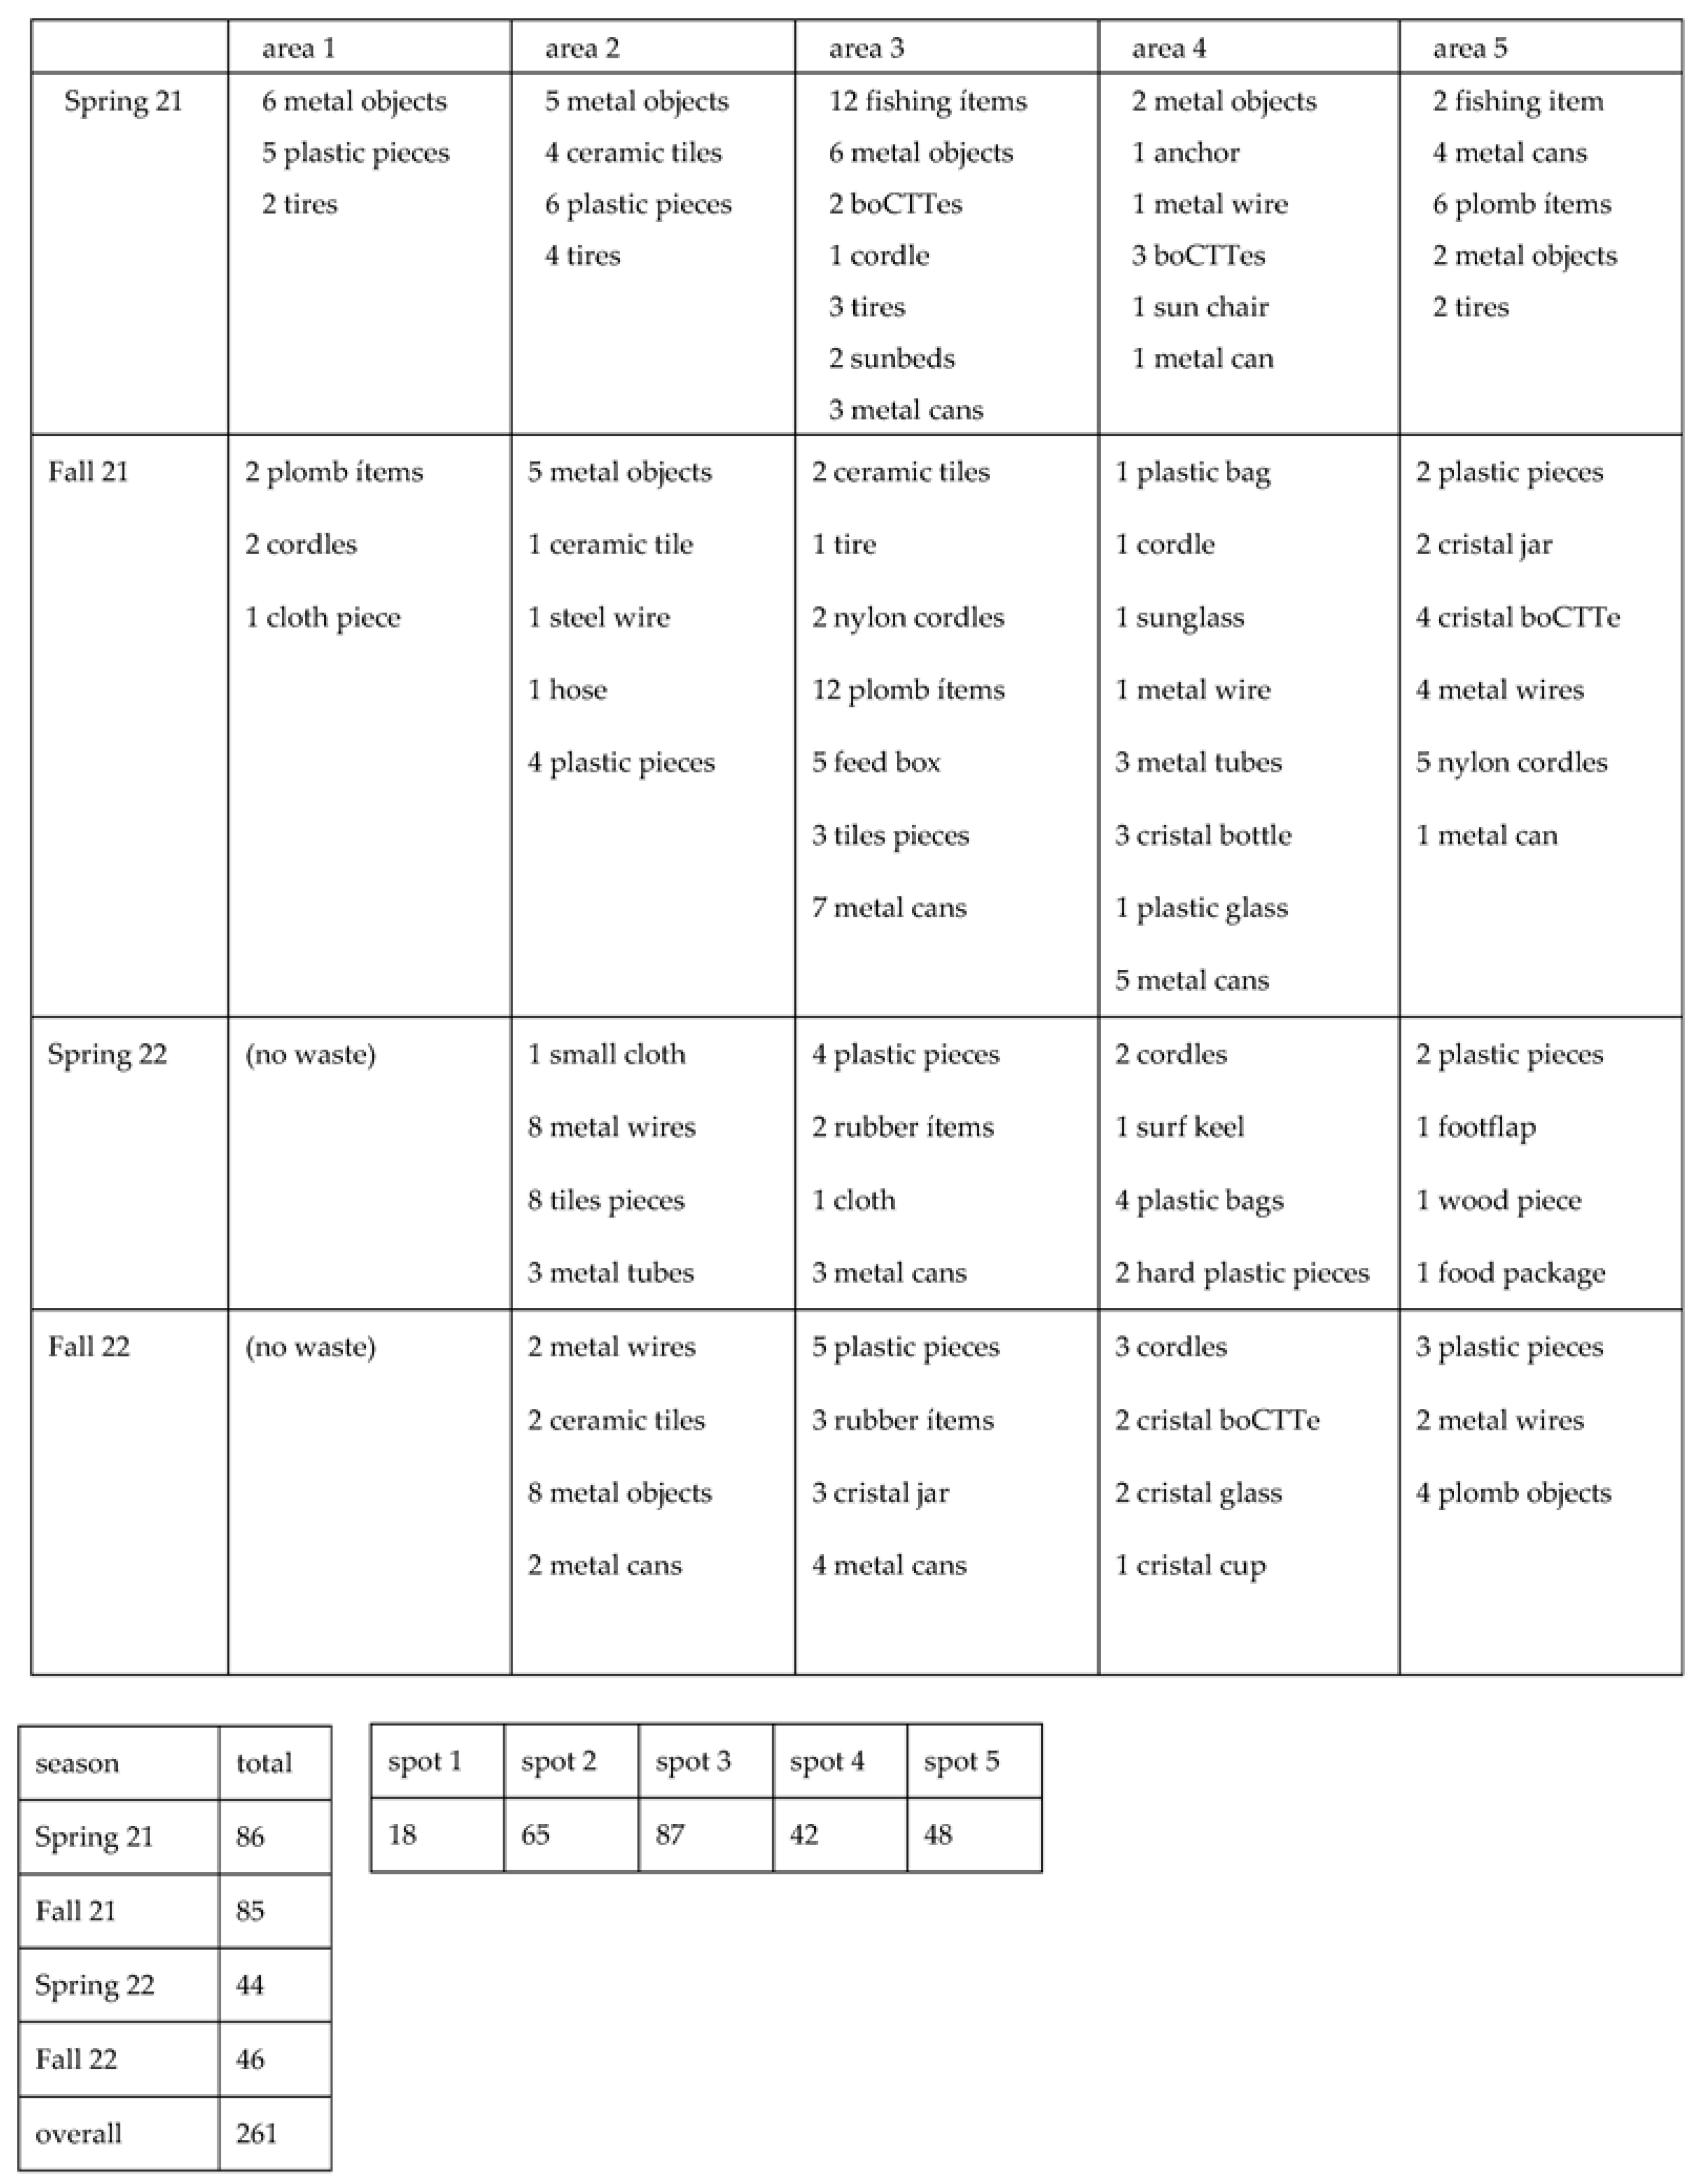
Four underwater characterization campaigns have been conducted at each point: late spring 2021, late summer 2021, late spring 2022, and late autumn 2022 (a total of 20 samplings), carried out by the field team, with a definition of overall conditions (Table 2) and with a classification and characterization of the 261 references found (Figure 13).
Table 2.
Characterization of infralittoral seabed in each zone.
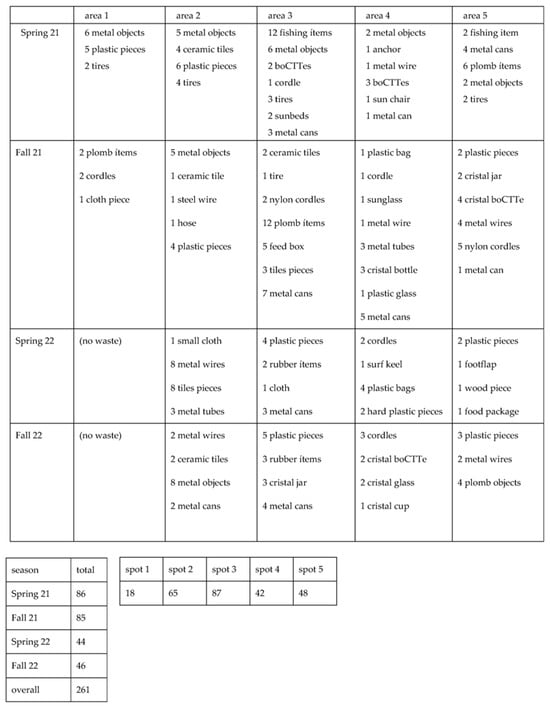
Figure 13.
Total and classified residual elements by season and area, as well as overall summaries.
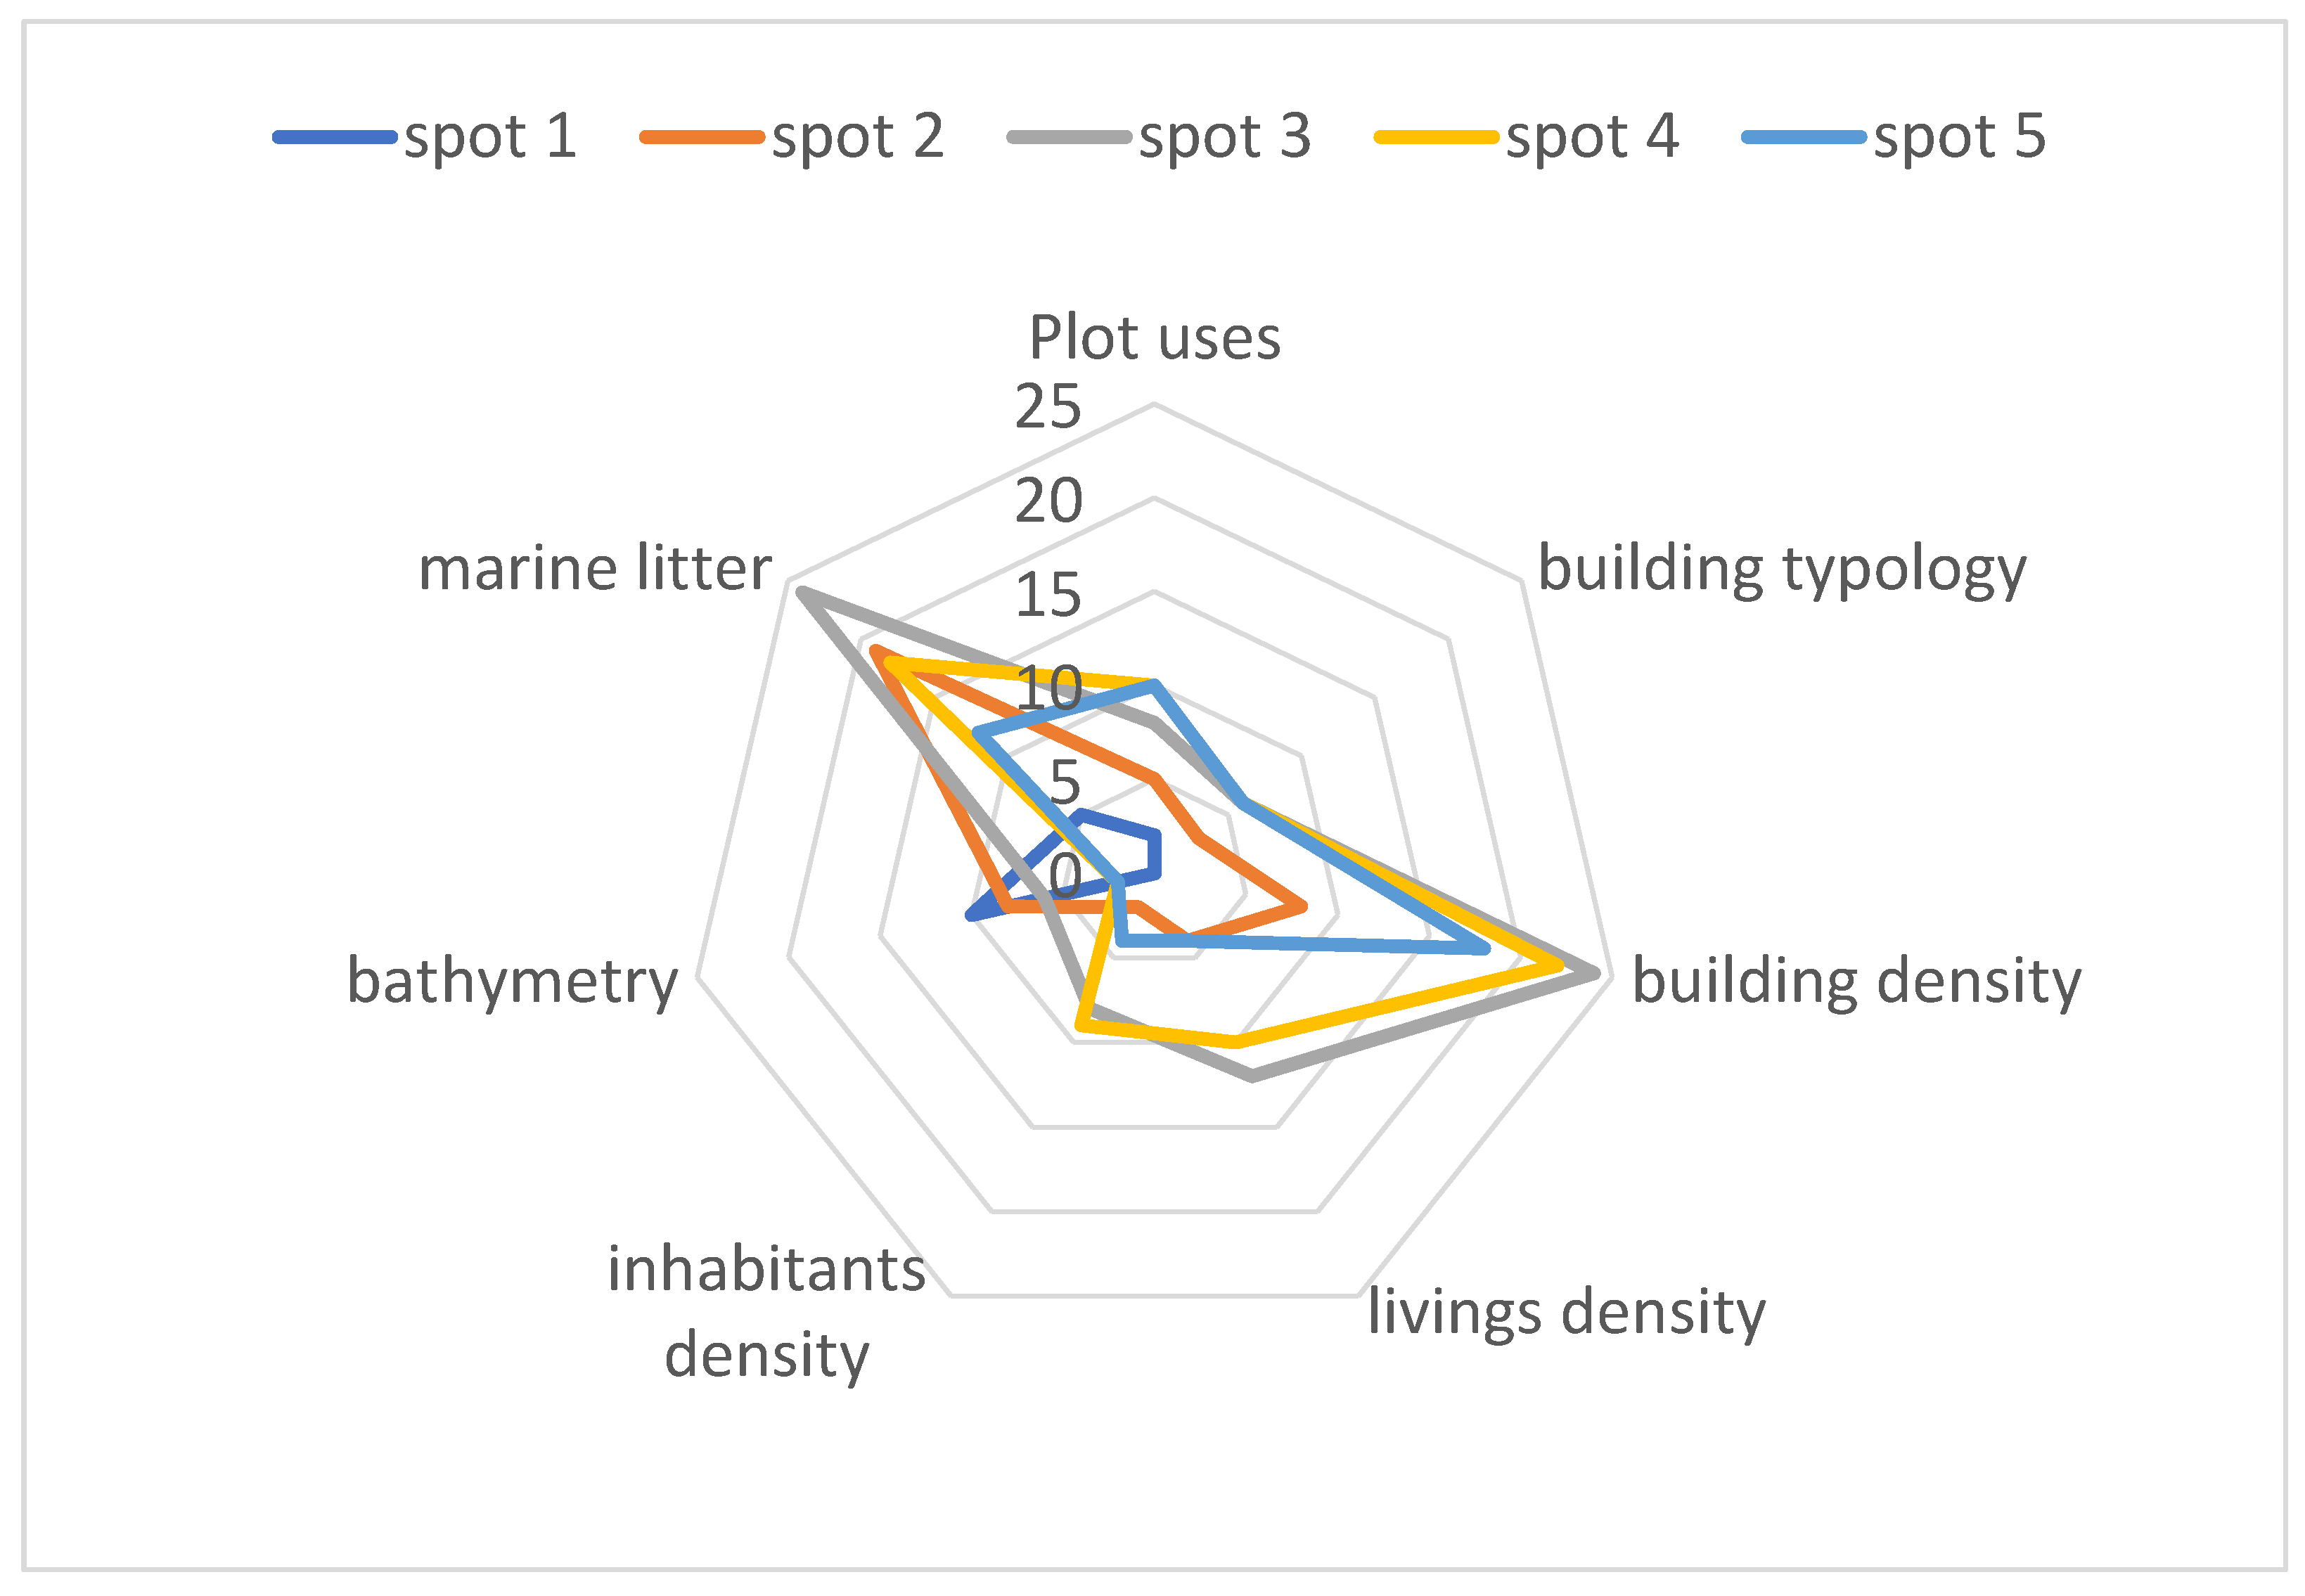
The overall relational results are presented in the following figure (Figure 14), illustrating every of the studied parameters characterizing the coastal zone in terms of potential for marine litter occurrence. Thus, each zone is affected not only by its coastal morphological qualities but also by its relational vector concerning building and urban density. There is no discontinuity between them, as each zone is influenced by the others, establishing the conditions of parametric continuity that determine each field. Consequently, it is possible to relate them beyond the influence of one over the other. Urban planning factors occupy a significant reference space in the graphical overlap of zones, paradoxically indicating the alteration of boundary properties attributed to the CTTs.

Figure 14.
Radar diagram with the generation of heterogeneous global areas over the 6 relational determinants of the CTTs, with quantification (0–100%, where 100% represents the point of the highest level of that determinant).
Therefore, it can be observed how graphic geometry directly relates urban density to marine litter present in the area, surpassing housing density—which releases the typology from establishing itself as a causal link in this ratio—and even the use of these CTTs. In case of spot #1, a natural area without urban pressure, the presence of litter is more determined by the topography of the seabed, although it is the only point where the effect of litter removal is almost permanent, and the reappearance index is close to 0. Similar conditioning is found in spots #3 and #4, where the coincidence of parameters is very similar, in contrast to the areas of informal housing spot #2, whose litter appearance ratio is much higher than what would be expected based on density. The best ratio is that of spot #5, whose density is lower than the urban regulated points #3 and #4, as well as its litter reappearance ratio.
Subsequently, it is possible to formulate a relationship between urban density factors and the potential occurrence of marine litter associated with that area, as a structural equation that reflects the complexity of the factors involved. This equation shows the reality of this multi-causal relationship, defining the need in each area for waste management from the system of equations formed by the combination of parameters and final waste amount in each area. This is defined as follows:
[POML] = [0.014 * A] + [0.91 * B] + [2.82 * C]+ [3.29 * D] + [0.87 * E] + [1.88 * F] + [1.29 * G] + [2.89 * H]
Being configured by the following factors and their units to define [POML] = potential occurrence of marine litter, depending on:
- [A] = building density (m2/Ha);
- [B] = livings density (viv/Ha);
- [C] = inhabitants density (hab/km2);
- [D] = Medium depth (m);
- [E] = overall Surface (Ha);
- [F] = Compactness of the substrate (0.5→2);
- [G] = Plot uses (1→5);
- [H] = building typology (1→5).
Each of these parameters is added to obtain the total attraction potential of a specific category. It is important to note that the values of each parameter can be normalized to an associated qualitative scale or adjusted to have a similar relative weight in the formula, ensuring comparability across different coastal urban environments. Therefore, the occurrence of waste in a particular area is a complex relationship with the parameters that model the urban and coastal support—both determinants in the physical conditioning of the CTTs. All considered factors have a specific weight, with greater emphasis on densities. Hence, effective waste management and community actions [59] can influence the amount of marine waste and its reappearance. The model incorporates these additional variables. The empirical research and subsequent data analysis for formulating this equation offer a specific relationship between urban density and marine waste. Among the observed effects at the control points, the most detrimental is the ability of waste to reappear, nullifying cleaning efforts and highlighting the absolute importance of preventive actions to prevent waste reappearance [60].
This formulation allows for estimation of the amount of marine waste in a particular area, serving as a reliable indicator of global awareness regarding marine care in that area among residents and users. This forecast helps understand the volume of waste management associated with marine waste according to multiple parameters, thereby improving the quality of life by facilitating effective cleaning policies for the infralittoral seabed.
The Resless methodology, which quantitatively relates the presence of waste to coastal morphology, classifies these residues with MSFD codes and associates them with morphological markers for different types of littoral fronts. Although this research focuses on the qualified relationship between waste and urban density, the classification of referenced residual elements is noteworthy. It has been carried out using internationally recognized codes that help identify and classify in a homogeneous manner, allowing for global relational studies. This follows the guidelines established by environmental monitoring organisations and programs [61]. While MSFD codes (acronym for the Marine Strategy Framework Directive of the European Union) have been used, providing a frame- work for the classification of marine litter in the European Union region, there are other international codes such as the ICC (International Coastal Cleanup) code that includes volume parameters, GESAMP codes (Group of Experts on Scientific Aspects of Marine Environmental Protection) that classify according to the type of waste, and OSPAR codes (Commission for the Protection of the Marine Environment of the North-East Atlantic) [58]. Also of relevance are the codes used by global underwater clean-up actions [62] associated with foundations and sports federations, such as PADI (Professional Association of Diving Instructors) through its AWARE program [63]. At the national level in Spain, references from SEBUCIU (Spaniard Society of Scientific and University Diving) and those developed by the Ecopuertos project from SCUBA-LIFE, the University Scientific Section for Logistical Support to Research, are significant.
All these codes are regularly updated to meet region-specific requirements and accommodate the emergence of new types of waste—such as the use of protective face masks during the COVID-19 pandemic [64]. Their standardised use enables the inclusion of local studies in global statistics and observational studies for formulating proposals to address the issue. The high number of observations made and the global and integrative nature of this study have allowed for an additional focus on locating the origin of the waste, which is truly the only way to combat it [65]. Most of the observed elements in zones 3 to 5—those with higher human presence—are linked to leisure activities on beaches and waterfront promenades. In contrast, elements associated with professional and recreational boating dominate in zones 1 and 2, without direct urban coastal pressure.
5. Conclusions
This project has generated a specific methodology for the study of the relationship between coastal morphology and waste located through maintained transects, classified both by deposition dynamics and their origin. From this, we can draw the following conclusions:
- The combined data collection methodology, at the urban level using open urban data with QGIS, and marine waste data through dives with in situ reporting, is the only technically feasible method for the combination of density and marine waste in the infralittoral seabed, and cannot be replaced by exclusively massive capture technologies;
- There is a direct relationship between built density and per capita density and the presence of macro waste in the infralittoral seabed. However, residential areas are more contaminated than tourist areas. Nontourist beaches near urban areas without periodic cleaning show higher levels of marine waste, indicating dependence on initial parameters. Nevertheless, even natural areas with less urban pressure also have waste, especially tyres, which is independent of zones and urban densities, and is not related to maritime access;
- This study highlights the limited impact of urban typologies and the predominant use of urban areas on the presence of waste in the associated infralittoral seabed. Therefore, the appearance of marine waste in the infralittoral seabed of the CTTs is more affected by their relational vector in relation to building and urban density than by their coastal morphological qualities;
- No significant differences were observed between sampling depths; however, a higher number of waste items were observed in areas with larger sediment granulometry (zones 3, 4, and 5);
- The waste reappearance effect is the most concerning, and according to the investigated causal relationship, it is directly proportional to the densities of the CTTs. It can be eliminated in natural areas through proper cleaning and waste management. Corrective measures can only act at the source of waste for real and lasting effectiveness, and personalized actions are necessary based on the area.
Finally, applicability of the developed methodology extends beyond specific study areas to other worldwide coastal tourist zones struggling with plastic pollution. The combined data collection approach, using open urban data with QGIS at the city level and in situ reporting through dives for marine litter, provides a versatile and effective means of assessing the density and distribution of plastic litter on infralittoral seabeds. This adaptability ensures that the knowledge gained from this study can be tested against specific strategies to mitigate plastic pollution on a larger scale, encouraging sustainable practices in coastal regions where there is a wide variability of high-density and natural or low-density areas. Pollution associated with urban areas can even spread litter to the natural areas.
A suggestion for other locations where this Resless methodology could be implemented includes Malta (Mediterranean sea), Azores (Atlantic ocean), Algarve (Atlantic ocean), Sardinia (Mediterranean sea), Reunion Island (Indian ocean), New Caledonia (Pacific Ocean), Bahía Blanca (Atlantic ocean), etc.
Author Contributions
Conceptualisation, J.D.L.-A., C.O. and J.S.G.; methodology, J.D.L.-A., C.O. and J.S.G.; data collection: J.D.L.-A.; formal analysis, J.D.L.-A., C.O. and J.S.G.; investigation, J.D.L.-A., C.O., J.S.G. and A.D.S.; resources, J.D.L.-A., C.O. and J.S.G.; writing—original draft preparation, J.D.L.-A., C.O. and J.S.G.; writing—review and editing, J.D.L.-A., C.O., J.S.G. and A.D.S.; supervision, C.O.; project administration, J.D.L.-A. and J.S.G. All authors have read and agreed to the published version of the manuscript.
Funding
This research is part of the Resless project, selected in the 2021 call for competitive projects at the European University, conducted from spring 2021 to autumn 2022 under code 2021/UEM05.
Data Availability Statement
The data presented in this study are available on request from the corresponding author. The data are not publicly available due to the underlying data utilized in this publication pertains to the analysis of marine debris on the seafloor within the scope of the Resless project. The specific nature of these data, coupled with ethical and confidentiality considerations, precludes their full public availability at this time. Comprehensive disclosure of the data could potentially compromise the identification of specific locations or sensitive information related to the study of marine debris. Nevertheless, we are committed to providing access to the data to the extent that is ethically and legally permissible. Interested researchers may request access to the data through a review and approval process. To request data access, please contact the corresponding author or the research team at the following email address: juandiego.lopez@universidadeuropea.es].
Acknowledgments
Special thanks to the collaborating students of the project, who have contributed to the academic model of the School of Architecture at the European University in their research-oriented actions, especially Andrea Benedicto Alonso, Patricia Purriños Hernández, and Sara Estévez Alonso (project interns), as well as the following collaborator students: Laura Hernández Chamorro, Evelin Serrano Santana, German Paulo Ramos, Óscar Martín Pérez, Oriol Cruz Martínez, and Diego Nogueira Martínez. Also, gratitude is extended to the Knowledge Transfer Office (OTRI) of the European University, and to the diving centre Scubanana in Radazul (Tenerife) for the logistics of the underwater data collection campaigns. Special thanks to Benjamin Rice for the translation review.
Conflicts of Interest
The authors declare no conflicts of interest.
References
- Tsaligopoulos, A.; Kyvelou Stella, S.; Karapostoli, A.; Bobolos, N.; Tsintzou, T.; Lekkas Demetris, F.; Matsinos Yiannis, G. Sound complexity as a strategy for livable and sustainable cities: The case of an urban waterfront. Noise Mapp. 2023, 10, 20220173. [Google Scholar] [CrossRef]
- Correia, A.; Oliveira, C.; Pereira, R. From Emotions to Place Attachment. In Co-Creation and Well-Being in Tourism; Correia, A., Kozak, M., Gnoth, J., Fyall, A., Eds.; Springer International Publishing: Cham, Switzerland, 2017; pp. 163–177. [Google Scholar] [CrossRef]
- Katsanevakis, S.; Katsarou, A. Influences on the distribution of marine debris on the seafloor of shallow coastal areas. Water Air Soil Pollut. 2004, 159, 325–337. [Google Scholar] [CrossRef]
- Díaz Ameneiro, P. Turismo y ordenación del litoral. Análisis comparativo de las propuestas de ordenación de la costa española en relación con el turismo. Cuad. Geogr. 2021, 106, 9–30. [Google Scholar]
- Víctor Pérez, E. La arquitectura española del segundo franquismo y el «Boletín de la dirección general de arquitectura» (1946–1957). RA Rev. Arquit. 2014, 16, 25–40. [Google Scholar]
- Monge Juárez, M. De los Orígenes de un Urbanismo Para el Ocio a la Invención del Verano: Aproximación a un Análisis de los Tiempos de Ocio Durante el Proceso de Industrialización en Elche, 1884–1906. Cuad. Tur. 2021, 47, 263–276. [Google Scholar] [CrossRef]
- Loren-Méndez, M.; Pinzón-Ayala, D. (Eds.) En Ruta Litoral Destino: N-340 (1-1); RU Books: Málaga, Spain, 2017. [Google Scholar]
- Alía Miranda, F. La Dictadura de Primo de Rivera (1923–1930): Paradojas y Contradicciones del Nuevo Régimen; Los libros de la Catarata: Madrid, Spain, 2023. [Google Scholar]
- Tatyana Dimitrova, S.D. Political Leadership and Preservation of National Priorities (on the example of General Primo de Rivera). Hist. Pogl. 2023, 6, 93–112. [Google Scholar] [CrossRef]
- Sainz Gutiérrez, V. Nuevos Enfoques del Urbanismo en Andalucía Durante la Transición: Un Itinerario Para su Estudio. Hist. Actual Online 2023, 61, 173–187. [Google Scholar]
- Kosok, L. Pleasurescapes on the Edge: Performing Modernity on Urban Waterfronts (1880–1960). J. Urban Hist. 2022, 48, 1199–1210. [Google Scholar] [CrossRef]
- Trapero Ballestero, J.J. El proyecto del espacio público y los paseos marítimos. Cuad. Investig. Urbanística 1997, 20, 57–61. [Google Scholar]
- Andrés, M.D.; Barragán Muñoz, J.M. Desarrollo urbano en el litoral a escala mundial. Método de estudio para su cuantificación. Rev. Estud. Andal. 2016, 33, 64–83. [Google Scholar]
- Volz, K. Purpose Built: Architecture for a Better Tomorrow. Archit. Aust. 2023, 112, 18–19. [Google Scholar]
- Asensio-Montesinos, F.; Anfuso, G.; Aguilar-Torrelo, M.T.; Oliva Ramírez, M. Abundance and Temporal Distribution of Beach Litter on the Coast of Ceuta (North Africa, Gibraltar Strait). Water 2021, 13, 2739. [Google Scholar] [CrossRef]
- João Pedro, C.; Maria, J.A.; Francesca Dal, C. The (Re)Industrialised Waterfront as a «Fluid Territory»: The Case of Lisbon and the Tagus Estuary. Urban Plan. 2023, 8, 363–375. [Google Scholar]
- Villanova Solano, C.; Romero Peral, F.; Fernández Martín, S.; Muñoz Molina, M.; Álvaro Berlanga, S. Estudio de la abundancia de microplásticos en doce playas de la isla de Tenerife (Islas Canarias). Sci. Insularum. Rev. Cienc. Nat. Islas 2018, 1, 103–121. [Google Scholar] [CrossRef]
- Baztan, J.; Carrasco, A.; Chouinard, O.; Cleaud, M.; Gabaldon, J.E.; Huck, T.; Jaffrès, L.; Jorgensen, B.; Miguelez, A.; Paillard, C.; et al. Protected areas in the Atlantic facing the hazards of micro-plastic pollution: First diagnosis of three islands in the Canary Current. Mar. Pollut. Bull. 2014, 80, 302–311. [Google Scholar] [CrossRef]
- Fleet, D.; Vlachogianni, T.; Hanke, G. A Joint List of Litter Categories for Marine Macrolitter Monitoring; EUR 30348 EN; Publications Office of the European Union: Luxemburg, 2021; Available online: https://publications.jrc.ec.europa.eu/repository/handle/JRC121708 (accessed on 12 November 2023).
- Ananian, P.; Ebacher, V.; Perras, A. Reconnecting waterfronts and central neighbourhoods: The lessons to be learned from user behaviour for the redesign of public spaces. J. Urban Des. 2022, 27, 110–129. [Google Scholar] [CrossRef]
- Botero, C.M.; Tamayo, D.; Zielinski, S.; Anfuso, G. Qualitative and Quantitative Beach Cleanliness Assessment to Support Marine Litter Management in Tropical Destinations. Water 2021, 13, 3455. [Google Scholar] [CrossRef]
- Chiba, S.; Saito, H.; Fletcher, R.; Yogi, T.; Kayo, M.; Miyagi, S.; Ogido, M.; Fujikura, K. Human footprint in the abyss: 30 year records of deep-sea plastic litter. Mar. Policy 2018, 96, 204–212. [Google Scholar] [CrossRef]
- Zorzo, P.; López-Samaniego Palomino, E.; Miranda, F.J. Problemática de las basuras marinas en España: El proyecto MARNOBA y la experiencia en la Demarcación marina del Estrecho y Alborán. Chron. Nat. 2014, 4, 66–74. [Google Scholar]
- Vélez-Mendoza, A. Marine litter in mangroves: Composition, magnitude, and impacts. Boletín Cienc. Tierra 2022, 51, 50–60. [Google Scholar] [CrossRef]
- Krelling, A.P.; Turra, A. Influence of oceanographic and meteorological events on the quantity and quality of marine litter along an estuarine gradient. Mar. Pollut. Bull. 2019, 139, 282–298. [Google Scholar] [CrossRef]
- Murphy, E.L.; Bernard, M.; Iacona, G.; Borrelle, S.B.; Barnes, M.; McGivern, A.; Emmanuel, J.; Gerber, L.R. A decision framework for estimating the cost of marine plastic pollution interventions. Conserv. Biol. 2022, 36, e13827. [Google Scholar] [CrossRef]
- Topouzelis, K.; Papageorgiou, D.; Karagaitanakis, A.; Papakonstantinou, A.; Arias Ballesteros, M. Remote Sensing of Sea Surface Artificial Floating Plastic Targets with Sentinel-2 and Unmanned Aerial Systems (Plastic Litter Project 2019). Remote Sens. 2020, 12, 2013. [Google Scholar] [CrossRef]
- Ryan, P.G.; Moore, C.J.; Van Franeker, J.A.; Moloney, C.L. Monitoring the abundance of plastic litter in the marine environment. Philos. Trans. R. Soc. B Biol. Sci. 2009, 364, 1999–2012. [Google Scholar] [CrossRef]
- Grelaud, M.; Ziveri, P. The generation of marine litter in Mediterranean island beaches as an effect of tourism and its mitigation. Sci. Rep. 2020, 10, 20326. [Google Scholar] [CrossRef]
- Ruiz Palacios, M.A.; Pereira Texeira De Oliveira, C.; Serrano González, J.; Saénz Flores, S. Analysis of Tourist Systems Predictive Models Applied to Growing Sun and Beach Tourist Destination. Sustainability 2021, 13, 785. [Google Scholar] [CrossRef]
- Lee, J.; Hong, S.; Song, Y.K.; Hong, S.H.; Jang, Y.C.; Jang, M.; Heo, N.W.; Han, G.M.; Lee, M.J.; Kang, D.; et al. Relationships among the abundances of plastic litter in different size classes on beaches in South Korea. Mar. Pollut. Bull. 2013, 77, 349–354. [Google Scholar] [CrossRef]
- Blasco Hedo, E. Real Decreto 1056/2022, de 27 de diciembre, por el que se aprueba el Plan Director de la Red de Áreas Marinas Protegidas de España y los criterios mínimos comunes de gestión coordinada y coherente de la Red. Actual. Jurídica Ambient. 2023, 130, 164–166. [Google Scholar]
- Abramic, A.; García, A.; Fernández-Palacios, Y.; Haroun, R. Bases para la PLAnificación Sostenible de áreas MARinas en la Macaronesia: Proyecto PLASMAR. Okeanos 2020, 11, 8–17. [Google Scholar]
- Day, J.C.; Laffoley, D.; Zischka, K. Gestión de áreas marinas protegidas. In Gobernanza y Gestión de Áreas Protegidas, 1st ed.; Worboys, G.L., Lockwood, M., Kothari, A., Feary, S., Pulsford, I., Eds.; ANU Press: Canberra, Australia, 2019. [Google Scholar] [CrossRef]
- Ivar Do Sul, J.A.; Costa, M.F. Marine litter review for Latin America and the Wider Caribbean Region: From the 1970s until now, and where do we go from here? Mar. Pollut. Bull. 2007, 54, 1087–1104. [Google Scholar] [CrossRef] [PubMed]
- Papageorgiou, D.; Topouzelis, K.; Suaria, G.; Aliani, S.; Corradi, P. Sentinel-2 Detection of Floating Marine Litter Targets with Partial Spectral Unmixing and Spectral Comparison with Other Floating Materials (Plastic Litter Project 2021). Remote Sens. 2022, 14, 5997. [Google Scholar] [CrossRef]
- Compagnone, F.; Varricchione, M.; Innangi, M.; Di Febbraro, M.; Loy, A.; Stanisci, A.; De Francesco, M.C.; Matteucci, G.; Carranza, M.L. Coastal Biodiversity Assessment Aided by Citizen Science Volunteers: A Look at the Italian Central Adriatic. Land 2023, 12, 2023. [Google Scholar] [CrossRef]
- Merlino, S.; Paterni, M.; Locritani, M.; Andriolo, U.; Gonçalves, G.; Massetti, L. Citizen Science for Marine Litter Detection and Classification on Unmanned Aerial Vehicle Images. Water 2021, 13, 3349. [Google Scholar] [CrossRef]
- Nuelle, M.-T.; Dekiff, J.H.; Remy, D.; Fries, E. A new analytical approach for monitoring microplastics in marine sediments. Environ. Pollut. 2014, 184, 161–169. [Google Scholar] [CrossRef] [PubMed]
- Villar Lama, A. El urbanismo en el litoral andaluz tras la última burbuja inmobiliaria: Cambio de ciclo o reincidencia. Boletín Asoc. Geógr. Españoles 2020, 85, 1–4. [Google Scholar]
- Painting, S.J.; Collingridge, K.A.; Durand, D.; Grémare, A.; Créach, V.; Arvanitidis, C.; Bernard, G. Marine monitoring in Europe: Is it adequate to address environmental threats and pressures? Ocean Sci. 2020, 16, 235–252. [Google Scholar] [CrossRef]
- Botello, L.C.S. Impacto Ambiental del Turismo de Buceo en Arrecifes de Coral. Cuad. Tur. 2009, 24, 207–227. [Google Scholar]
- Bellou, N.; Gambardella, C.; Karantzalos, K.; Monteiro, J.G.; Canning-Clode, J.; Kemna, S.; Arrieta-Giron, C.A.; Lemmen, C. Global assessment of innovative solutions to tackle marine litter. Nat. Sustain. 2021, 4, 516–524. [Google Scholar] [CrossRef]
- Suaria, G.; Achtypi, A.; Perold, V.; Lee, J.R.; Pierucci, A.; Bornman, T.G.; Aliani, S.; Ryan, P.G. Microfibers in oceanic surface waters: A global characterization. Sci. Adv. 2020, 6, eaay8493. [Google Scholar] [CrossRef]
- López Arquillo, J.D. Beyond the mirror: Social space, attached space and bathymetry for a sustainable planning in Coastal Tourist Territories (CTT’s). Towards a characterization of the attraction potential. REIA Rev. Eur. Investig. Arquit. 2022, 22, 99–116. [Google Scholar]
- Toribio, M. La Directiva Hábitats 92/43/CE y la Red Natura 2000. Cuad. Geogr. 1999, 29, 143–155. [Google Scholar]
- Serra-Gonçalves, C.; Lavers, J.L.; Bond, A.L. Global Review of Beach Litter Monitoring and Future Recommendations. Environ. Sci. Technol. 2019, 53, 12158–12167. [Google Scholar] [CrossRef]
- Reinold, S.; Herrera, A.; Hernández-González, C.; Gómez, M. Plastic pollution on eight beaches of Tenerife (Canary Islands, Spain): An annual study. Mar. Pollut. Bull. 2020, 151, 110847. [Google Scholar] [CrossRef] [PubMed]
- González-Hernández, M.; Hernández-Sánchez, C.; González-Sálamo, J.; López-Darias, J.; Hernández-Borges, J. Monitoring of meso and microplastic litter in Playa Grande beach (Tenerife, Canary Islands, Spain) during a moon cycle. Mar. Pollut. Bull. 2020, 150, 110757. [Google Scholar] [CrossRef] [PubMed]
- Kroon, F.J.; Motti, C.E.; Jensen, L.H.; Berry, K.L.E. Classification of marine microlitter: A review and case study on fish from the Great Barrier Reef, Australia. Sci. Rep. 2018, 8, 16422. [Google Scholar] [CrossRef] [PubMed]
- Corrigan, B.C.; Tay, Z.Y.; Konovessis, D. Real-Time Instance Segmentation for Detection of Underwater Litter as a Plastic Source. J. Mar. Sci. Eng. 2023, 11, 1532. [Google Scholar] [CrossRef]
- Martín-Rodríguez, F.; Rodríguez-Barreiro, L.; Fernández-Bastos, M.; Iglesias, G.M. LitterDrone: Monitorización de basura marina empleando drones y análisis de imagen. In Proceedings of the URSI-2019, Granada, Spain, 9–13 September 2019. [Google Scholar]
- Escrivá, A.; Armengol, J.; Monrós, J.S.; Rueda, J.; Vera, P.; Barba, E. Caracterización de la Vegetación Subacuática y Palustre del Ullal de Massalavés (Valencia). Flora Montiberica 2008, 39, 50–57. [Google Scholar]
- Solano Martos, J.F. Modelización Para el Estudio, Análisis y Prevención de Riesgos Intrínsecos en Sectores Singulares. Available online: https://search.ebscohost.com/login.aspx?direct=true&AuthType=sso&db=edstdx&AN=edstdx.10803.131412&lang=es&site=eds-live&scope=site&authtype=sso&custid=s1136447 (accessed on 20 October 2023).
- Orlando Herrera, B. Estudio de los Organismos Marinos y Factores de Riesgo a las Faenas Subacuaticas Navales y Deportivas. Boletín Científico CIOH 1993, 14, 91–108. Available online: https://search.ebscohost.com/login.aspx?direct=true&AuthType=sso&db=edsdoj&AN=edsdoj.5b0a9619e147379124228d2749e5fa&lang=es&site=eds-live&scope=site&authtype=sso&custid=s1136447 (accessed on 27 October 2023). [CrossRef]
- Palombi, L.; Raimondi, V. Experimental Tests for Fluorescence LIDAR Remote Sensing of Submerged Plastic Marine Litter. Remote Sens. 2022, 14, 5914. [Google Scholar] [CrossRef]
- Reineccius, J.; Appelt, J.-S.; Hinrichs, T.; Kaiser, D.; Stern, J.; Prien, R.D.; Waniek, J.J. Abundance and characteristics of microfibers detected in sediment trap material from the deep subtropical North Atlantic Ocean. Sci. Total Environ. 2020, 738, 140354. [Google Scholar] [CrossRef]
- Addamo, A.M.; Hanke, G.; Laroche, P. Top Marine Beach Litter Items in Europe: A Review and Synthesis Based on Beach Litter Data; Publications Office of the European Union: Luxembourg, 2017. [Google Scholar]
- Del Río-Rama, M.; Álvarez-García, J.; Oliveira, C. Environmental Practices. Motivations and Their Influence on the Level of Implementation. Sustainability 2018, 10, 713. [Google Scholar] [CrossRef]
- Fetisov, S.; Chubarenko, I. Marine Litter Stormy Wash-Outs: Developing the Neural Network to Predict Them. Pollutants 2021, 1, 156–168. [Google Scholar] [CrossRef]
- Trouwborst, A.; Dotinga, H.M. Comparing European Instruments for Marine Conservation. Eur. Energy Environ. Law Rev. 2011, 20, 129–149. [Google Scholar] [CrossRef]
- Merlino, S.; Locritani, M.; Guarnieri, A.; Delrosso, D.; Bianucci, M.; Paterni, M. Marine Litter Tracking System: A Case Study with Open-Source Technology and a Citizen Science-Based Approach. Sensors 2023, 23, 935. [Google Scholar] [CrossRef]
- Lindgren, A.; Palmlund, J.; Wate, I.; Gössling, S. Environmental management and education: The case of PADI. In New Frontiers in Marine Tourism; Routledge: London, UK, 2007; pp. 115–136. [Google Scholar]
- Weng, K.C.; Friedlander, A.M.; Gajdzik, L.; Goodell, W.; Sparks, R.T. Decreased tourism during the COVID-19 pandemic positively affects reef fish in a high use marine protected area. PLoS ONE 2023, 18, e0283683. [Google Scholar] [CrossRef]
- Kuempel, C.D.; Jones, K.R.; Watson, J.E.M.; Possingham, H.P. Quantifying biases in marine-protected-area placement relative to abatable threats. Conserv. Biol. 2019, 33, 1350–1359. [Google Scholar] [CrossRef]

Disclaimer/Publisher’s Note: The statements, opinions and data contained in all publications are solely those of the individual author(s) and contributor(s) and not of MDPI and/or the editor(s). MDPI and/or the editor(s) disclaim responsibility for any injury to people or property resulting from any ideas, methods, instructions or products referred to in the content. |
© 2023 by the authors. Licensee MDPI, Basel, Switzerland. This article is an open access article distributed under the terms and conditions of the Creative Commons Attribution (CC BY) license (https://creativecommons.org/licenses/by/4.0/).