Article

Spatial Characteristics and Obstacle Factors of Cultivated Land Quality in an Intensive Agricultural Region of the North China Plain

1
School of Environmental Science and Engineering, Tiangong University, Tianjin 300387, China
2
School of Public Administration and Law, Northeast Agricultural University, Harbin 150030, China
3
College of Land Science and Technology, China Agricultural University, Beijing 100193, China
*
Author to whom correspondence should be addressed.
Land 2023, 12(8), 1552; https://doi.org/10.3390/land12081552
Submission received: 30 June 2023 / Revised: 29 July 2023 / Accepted: 2 August 2023 / Published: 4 August 2023

Abstract

:
Cultivated land quality (CLQ) is at the core of the trinity protection of cultivated land in China. Scientific evaluation of CLQ and identification of its obstacle factors are the foundation for the construction and improvement of the quality of cultivated land. The main objective of this study was to evaluate CLQ and identify its obstacle factors, and Quzhou County, an intensive agricultural region in the North China Plain (NCP), was selected as a case study. The evaluation index system of CLQ was constructed based on five dimensions, including climate condition, topographic characteristic, soil property, farming status, and environmental condition, by analyzing the logical evolution of elements, processes, functions, and quality of cultivated land. A methodological system based on the Weighted Summation Method (WSM) and the “1 + X” model was developed to evaluate the CLQ. Then, the obstacle diagnosis model constructed based on the Cask Law and relevant academic studies was used to identify the obstacle factors of CLQ. The results showed that the proportion of high-, medium-, and low-quality cultivated land in Quzhou County was 36.19%, 33.60%, and 30.21%, respectively, and the average grade of CLQ was 2.97, which was considered to be at a medium level. Moran’s I of global spatial autocorrelation in Quzhou County was 0.8782, indicating a significant positive autocorrelation of the cultivated land quality index (CLQI). The main obstacle factors of CLQ in Quzhou County were soil profile constitution, irrigation guarantee rate, groundwater depth, and soil microbial biomass carbon. Therefore, based on the stable and dynamic characteristics of the obstacle factors, suggestions were provided to improve the quality of cultivated land in terms of strengthening the consolidation of cultivated land, transforming the concept of agricultural fertilization, and carrying out cultivated land recuperation. This study provides a new perspective on the cognition, evaluation, and identification of obstacle factors of CLQ, and the findings of this study can provide a reference for the consolidation and improvement of CLQ in the NCP.

1. Introduction

Cultivated land is an essential natural resource and the basis for ensuring food security, ecological security, economic development, and social stability [1,2]; it is a fundamental guarantee for achieving the Sustainable Development Goal of Zero Hunger [3,4]. In the face of major challenges such as global climate change, increasing resource scarcity, and environmental degradation, the importance of cultivated land is paramount in ensuring food security for 9.8 billion people worldwide by 2050 and 11.2 billion people by 2100 [5,6,7,8]. Especially as the global per capita cultivated land area continues to decrease due to population growth and urban expansion, improving the quality of cultivated land is an important way to ensure food security, particularly in developing countries [8,9,10,11]. The basic situation in China, with many people and little land, determines the need to protect cultivated land [12,13]. The connotation of cultivated land protection in China has evolved from the protection of quantity, to the protection of quantity and quality, and, finally, to the trinity protection of quantity, quality, and ecology [14,15]. Protecting and improving the quality of cultivated land is at the heart of the trinity protection of cultivated land and the foundation for ensuring food security [16,17]. Therefore, accurately understanding the concept of cultivated land quality (CLQ) and carrying out CLQ evaluation are the foundation of cultivated land improvement and construction.
With the process of cultivated land use, the recognition of CLQ has also extended from basic soil fertility to potential productivity, suitability, sustainability and soil health, and has gradually evolved to a stage of integrated knowledge of production, ecology, and health [18,19,20]. Although there are different understandings of CLQ with the process of cultivated land use, it is generally acknowledged that CLQ is a comprehensive index of natural and human elements [21,22]. Because of its complexity, the quality of cultivated land cannot be measured by a specific soil quality indicator, nor can it be tested directly in the laboratory [23,24]. Instead, the quality of cultivated land can be assessed using a combination of physical, chemical, and biological indicators of cultivated land. Meanwhile, the development of a suitable evaluation method is also the key to the evaluation of CLQ.
Therefore, different government departments, academic organizations, and scholars around the world are constantly conducting research on the selection of indicators and construction of evaluation methods so that the evaluation of CLQ can be carried out scientifically [21,25]. The Land Capability Classification (LCC) [26], Land Evaluation and Site Assessment (LESA) [27], Framework for Land Evaluation [28], Agricultural Ecological Zone (AEZ) [29], Framework for Evaluating Sustainable Land Management (FESLM) [30], Land Quality Indicators (LQIs) [21], and Soil Environment Evaluation [31] are evaluation frameworks constructed from different aspects, providing references for the evaluation of the quality of cultivated land around the world. At the same time, many evaluation methods have been developed for CLQ evaluation, such as the soil quality index methods [32], soil quality card design and test kit methods [33], and geostatistical methods [34]. With regard to the evaluation index system, indicators of natural elements such as soil and topography, and human elements such as agricultural and technical inputs, were selected to evaluate the quality of cultivated land [18,35].
In order to select appropriate indicators and formulate reasonable evaluation methods, different departments of the Chinese government and many scholars have been continuously practicing and exploring the evaluation of CLQ [35,36,37]. The Ministry of Natural Resources formulated the “Regulation for Gradation on Agriculture Land Quality” (GB/T 28407-2012) to evaluate the productivity of cultivated land by selecting indicators from the natural environment and socioeconomic aspects [38]. The Ministry of Agriculture and Rural Affairs formulated the “Measures for Investigation, Monitoring, and Evaluation of Cultivated Land Quality” and the “Cultivated Land Quality Grade” (GB/T 33469-2016) to evaluate the quality of cultivated land [39,40]. In 2019, the Ministry of Agriculture and Rural Affairs conducted a comprehensive evaluation of the quality of China’s cultivated land based on the above two criteria, selecting indicators in terms of site condition, profile characteristics, topsoil physical and chemical properties, nutrient status, soil health, soil management, etc. The “Soil Environmental Quality Risk Control Standard for Soil Contamination of Agricultural Land” (GB 15618-2018) issued by the Ministry of Ecology and Environment focuses on the evaluation of environmental conditions of cultivated land [41]. The classification of CLQ in China’s Third National Land Survey focused on the classification of cultivated land quality by selecting indicators at six levels: physical geography, topography, soil, ecological environment, crop maturity, and cultivated land use. Meanwhile, many scholars have also conducted CLQ evaluation based on different evaluation systems, providing case experiences for the study of CLQ evaluation all over the world. For example, Liu et al. [35] proposed a new grading system for evaluating China’s cultivated land quality that involved two index systems and a scoring and grading scheme, and selected Yimen County, a loess plateau region in western China’s Shaanxi Province, for CLQ evaluation. Zhao et al. [24] constructed a CLQ evaluation index system from physical and chemical properties, nutrient condition, management condition, health condition and ecological environmental condition of cultivated land, and carried out CLQ evaluation in Xiangzhou District, Hubei Province, China, based on a new evaluation method referring to the soil quality index method. Tan et al. [36] constructed a CLQ evaluation index system from natural quality, utilization conditions, and ecological security, and evaluated the quality of cultivated land in Shengzhou, Zhejiang, China, using the weighted summation method (WSM).
In general, both the standards or guidelines proposed by different countries and the academic research conducted by scholars have promoted the continuous development of theories and methods for the evaluation of CLQ. However, there are still many challenges in existing studies on the evaluation of CLQ [20,35,42,43]. Firstly, the connotation of the concept of CLQ varies with changes in socioeconomic and human development on land demand. Many researchers have constructed a cultivated land evaluation system based on an analysis of the concept of CLQ, but such a system lacks theoretical knowledge of the connotation of the CLQ concept from a systemic perspective. Secondly, there are many existing methods for evaluating the quality of cultivated land, but less attention is paid to the essential attribute characteristics of the indicators used in the construction of the evaluation method. A simple combination of indicators sometimes cannot reflect the actual characteristics of regional CLQ. Thirdly, an accurate identification of the obstacle factors of CLQ is the basis for the construction and improvement of CLQ, and there is room for further research on the identification of obstacle factors of CLQ. Therefore, this study aims to address the above challenges in the evaluation of CLQ to fill the research gaps.
The North China Plain (NCP) is a major intensive agricultural region in China, producing 60–80% of China’s wheat and 35–40% of its maize each year [44]. The NCP has rich and diverse soil types and a high level of agriculture, but groundwater has been severely depleted due to over-exploitation for agricultural irrigation [45]. In the present study, Quzhou County, a typical county in the NCP, was selected as the study area to carry out the evaluation of CLQ and the identification and analysis of obstacle factors. Therefore, the main objectives of this study were to (1) construct a theoretical framework for CLQ evaluation based on the basic logic of cultivated land elements, processes, functions, and quality; (2) carry out CLQ evaluation and spatial characterization analysis, as well as the identification of obstacle factors; and (3) provide some countermeasure suggestions for the improvement and construction of CLQ.

2. Materials and Methods

2.1. Study Area

Quzhou County is located in the southern part of Hebei province, China. It is located in the middle of the NCP, and ranges from 36°34′45″ to 57′57″ N and from 114°50′30″ to 115°13′30″ E (Figure 1). Quzhou County has a total area of 676 km2, including 10 towns and 342 villages. The region has warm temperatures and a continental climate with a mean annual temperature and precipitation of 13.1 °C and 566 mm, respectively. The coldest and warmest months are January and July, respectively, and more than 60% of annual precipitation falls between July and September. The accumulated temperature at 10 °C is 4472 °C, while the annual frost-free period lasts 210 days. The elevation decreases from southwest to northeast, with an average height of 42.5 m above sea level. The rural population of Quzhou County was 218,977 in 2020 based on the Seventh National Population Census of Quzhou County, accounting for about 47.22% of the total population.
The area of cultivated land in Quzhou County accounts for about 80% of the total land area, and the main types of crops are wheat, maize, and cotton. As a typical county in the intensive agricultural region of the NCP, Quzhou County is characterized by a high multi-crop index and large agricultural investment. In the 1970s, the cultivated land in Quzhou County was severely salinized and the quality of cultivated land was extremely poor [46,47]. The parent materials of soil formation in Quzhou County are river alluvium and diluvium, and the soil texture includes sand, loam, and clay, which determine the background characteristics of soil nutrients. In addition, problems of drought, flood, salinity, and alkalinity caused by natural conditions, as well as processes of human utilization and management, collectively affect the quality of cultivated land in Quzhou County. Especially since the beginning of the 21st century [48], the level of intensive use of cultivated land in Quzhou County has been continuously improved, along with the improvement in agricultural technology and the input of agricultural production materials. The gross agricultural production and total grain output in 2021 were CNY 2.97 billion and 404.83 thousand tons, and its grain output was 1.68 times the national average level.

2.2. Data Collection and Processing

Multiple sources of data were used to determine the values of the CLQ evaluation indicators. The data for soil profile constitution, effective soil thickness, barrier layer depth, topsoil texture, soil salinization, irrigation guarantee rate, and drainage condition were obtained from the 2016 cultivated land quality database provided by the Bureau of Natural Resources and Planning of Quzhou. The data on field slope were obtained from the digital elevation model (DEM) data provided by the Geospatial Data Cloud site, Computer Network Information Centre, Chinese Academy of Sciences (http://www.giscloud.cn/, accessed on 10 March 2021), and the spatial resolution was 30 × 30 m. The topographic position was defined using a combination of the DEM and expert experience. Data such as soil bulk density, soil organic matter, pH, soil microbial biomass carbon, total nitrogen, available phosphorus, and active potassium were obtained from field surveys and soil sampling in 2018 or 2019 (Figure 1), and their surface data were calculated via inverse distance interpolation of point data. Groundwater depth was determined using the observation data from groundwater monitoring stations set up by the Bureau of Water Conservancy of Quzhou from 2013 to 2017. In addition, field road accessibility and field regularity were calculated from the cultivated land use database using ArcGIS. In addition, the statistical data are taken from the Statistical Yearbook of Quzhou County.
Field regularity was used to reflect the degree of regularity of the field shape, and this study used the shape index to express field regularity. The specific calculation formula is as follows:
S I = 0.25 E / A
where S I is the shape index, i.e., field regularity; E is the perimeter of the cultivated land plot, m; and A is the total area of the cultivated land plot, hm2.
Field road accessibility was calculated according to the formula in the “General Rules for Gradation and Classification on Natural Resources” (TD/T 1060-2021) issued by the Ministry of Natural Resources. The specific calculation formula is as follows:
D L i = s B i S A i × 100 %
where D L i is the field road accessibility in village i , %; s B i is the number of all cultivated land plots accessible by road in village i ; and S A i is the total number of cultivated land plots in village i .

2.3. Evaluation Method of Cultivated Land Quality

2.3.1. Framework of Cultivated Land Quality Evaluation

Cultivated land is land on which crops are grown and is a complex artificial–natural system formed by the combined action of nature and humans [49,50]. From a systemic perspective, cultivated land is composed of essential elements such as climate, topography, soil, utilization status, infrastructure, and property rights [51,52]. Natural factors, including climate, topography, and soil, have a fundamental control on the use of cultivated land, whereas artificial factors including utilization status, infrastructure, and property rights have a dynamic regulation on the use of cultivated land [52,53]. The elements of cultivated land and their combinations undergo physical, chemical, and biological processes to produce functional types, such as production, ecology, landscape, and culture. For example, the nutrient cycles such as nitrogen, phosphorus, and potassium are an important link in the production function of cultivated land; in the process of agricultural activities, the construction of artificial factors can enhance the production, ecology, and other functions of cultivated land, and manifest the agricultural culture function of cultivated land [26,51,54]. Meanwhile, each function of cultivated land has corresponding characteristics, which can reflect the basic characteristics of the corresponding function from a certain dimension, such as the nutrient effectiveness of production function and the biodiversity of ecological function [55]. The quality of cultivated land is a comprehensive reflection of the multiple functional attributes of cultivated land [51,52,53,54,55]. Thus, the quality of cultivated land is a comprehensive index that characterizes its intrinsic and extrinsic aspects and is a comprehensive reflection of the multiple functions formed by the different elements of the cultivated land through numerous processes.
Based on existing research [20,28,43,50,56,57] and the above logical analysis, this study argues that CLQ reflects the extent to which the characteristics of cultivated land itself satisfy agricultural production and enable economic benefits, as well as promote human well-being. Cultivated land is a synthesis of multiple functions with the production function as the core, and different functions have corresponding basic characteristics; for example, the production function corresponds with cultivation suitability, nutrient effectiveness, water effectiveness, etc., and the ecological function corresponds with buffering and filtering properties, biodiversity, etc., which can reflect the basic characteristics of CLQ [51,52]. Different characteristics can be qualified using their corresponding indicators, which are also the indicators to be chosen for the evaluation of the quality of cultivated land [28,50]. For example, cultivation suitability can be specifically described via certain indicators such as topographic position, field slope, and effective soil thickness; nutrient effectiveness can be specifically characterized by certain indicators such as total nitrogen, active potassium, and trace elements; and buffering and filtering properties can be specifically described by certain indicators such as topsoil texture, soil bulk density, soil organic matter, and pH [58]. Therefore, a theoretical framework for CLQ evaluation was constructed based on the basic logic of “element-process-function-quality” of cultivated land, taking into account the elements, processes, and functions of a cultivated land system (Figure 2).

2.3.2. Index System of Cultivated Land Quality Evaluation

Based on the characteristics of cultivated land resources and the concept of CLQ, combined with the fundamental elements of cultivated land and the actual utilization of cultivated land in the selected intensive agricultural region of the NCP, five dimensions, including climate condition, topographic characteristic, soil property, farming status, and environmental condition, were chosen to reflect the quality of cultivated land [58,59]. Climate condition, topographic characteristic, and soil property characterize the basic characteristics of climate, topography, and soil of cultivated land, respectively, and farming status reflects the basic characteristics of utilization, infrastructure, and property right in an integrated manner. Meanwhile, environmental conditions also have a significant impact on the quality of cultivated land as the extent and scope of cultivated land use continues to expand [41]. Therefore, based on the constructed framework of CLQ, this study selected corresponding indicators from the five dimensions of CLQ and built an evaluation index system of CLQ so that it could reflect the quality of cultivated land in the intensive agricultural region of the NCP more objectively.
To screen the evaluation indicators more scientifically, this study contemplated the following two considerations to achieve the purpose of building an evaluation index system with comprehensive screening indicators. On the one hand, the evaluation index system was mainly based on the indicators corresponding to the basic characteristics of the functions of cultivated land in the theoretical framework, such as cultivation suitability, nutrient effectiveness, and buffering and filtering properties [28,58,59]. On the other hand, it also referred to the standard regulations issued by different departments in China, such as the “Regulation for Gradation on Agriculture Land Quality” (GB/T 28407-2012) [38] issued by the Ministry of Natural Resources and the “Cultivated Land Quality Grade” (GB/T 33469-2016) [40] issued by the Ministry of Agriculture and Rural Affairs. Meanwhile, this study not only considered the physical and chemical indicators of soil but also selected soil biological indicators as evaluation indicators of CLQ. Groundwater depth was used as an environmental indicator to evaluate the quality of cultivated land due to the severe decline of groundwater in the NCP [45]. Overall, 21 indicators in 5 of the dimensions constituted the evaluation index system of CLQ of Quzhou County (Table 1). However, given the relative stability of climate condition at the county level, indicators of climate condition were not included in the assessment of CLQ in this study. Therefore, this study evaluated the quality of cultivated land in Qiuzhou County from four aspects, namely the topographic characteristic, soil property, farming status, and environmental condition.

2.3.3. Grading and Weight of Cultivated Land Quality Evaluation Indicator

The classification standards of the CLQ evaluation indicators were comprehensively determined based on “Regulation for Gradation on Agriculture Land Quality” (GB/T 28407-2012) [38], “Cultivated Land Quality Grade” (GB/T 33469-2016) [40] and academic achievements [42,43,50,59] (Table 2). Considering the specific constraints of the environmental condition on the CLQ, we could not directly calculate the environmental condition index of cultivated land using the weighted summation method (WSM), therefore, the “1 + X” model was constructed to calculate the environmental condition index. The weight of the groundwater depth did not need to be determined in the evaluation of CLQ in Quzhou County, and the classification standard was established in the construction of the “1 + X” model and the obstacle diagnosis model, respectively. The Delphi method was used to determine the weights of the evaluation indicators of CLQ (Table 1). In short, experts from the Natural Resources Department, the Agriculture and Rural Department in Quzhou County, as well as scholars specializing in cultivated land use were invited to score the evaluation indicators of the CLQ, and then the indicator weights of the CLQ were determined after a process of aggregation, discussion, and adjustment [60].

2.3.4. Calculation of the Cultivated Land Quality Index (CLQI)

(1) Calculation of the topographic characteristic index, the soil property index, and the farming status index of cultivated land.
The topographic characteristic index, the soil property index, and the farming status index of cultivated land were calculated using the weighted summation method (WSM) of their corresponding indicators and weights, respectively. The specific calculation equations are as follows:
T = i = 1 o ( t i × u i )
S = j = 1 p ( s j × v j )
F = m = 1 q ( f m × w m )
where T , S , and F are the topographic characteristic index, the soil property index, and the farming status index of cultivated land, respectively; t i , u i , s j , v j , f m , and w m are the indicator and the corresponding weight of the topographic characteristic, the soil property, and the farming status of cultivated land, respectively; and o , p , and q are the number of indicators of the topographic characteristic, the soil property, and the farming status of the cultivated land, respectively.
(2) Calculation of the environmental condition index of cultivated land.
The environmental condition included an indicator of groundwater depth, and the “1 + X” model was constructed to calculate the environmental condition index. The base value of groundwater depth was set to 1, and different values of X were set for different groundwater depths (Table 3). Then, the summation of the base value and X was the value of the environmental condition index. For example, if the groundwater depth of a cultivated land plot was at level 3, then the score was −0.04; therefore, the environmental condition index of this cultivated land plot was 1 + (−0.04) = 0.96 based on the “1 + X” model.
(3) Calculation of the cultivated land quality index (CLQI).
Based on the four indices, the composite index was obtained by combining the topographic characteristic index, the soil property index, and the farming status index using the WSM, and the cultivated land quality index was obtained by modifying the composite index using the environmental condition index (Figure 3). The specific calculation equation is as follows:
C L Q I = ( α T + β S + γ F ) × E
where C L Q I is the cultivated land quality index; T , S , F , and E are the topographic characteristic index, soil property index, farming status index, and environmental condition index, respectively; and α , β , and γ are the weights of the topographic characteristic index, soil property index, and farming status index, respectively, and their values are 0.198, 0.490 and 0.312, respectively, which were obtained by means of the analytic hierarchy process (AHP). In short, a judgment matrix was constructed, and the parameter CI was calculated. The CR value of 0.052 passed the test (CR < 0.1). Therefore, the calculated weight values were used as weights for the topographic characteristic index, soil property index, and farming status index.

2.4. Spatial Autocorrelation Analysis Model

The correlation between geospatial things is objective, and spatial autocorrelation analysis is the primary method to reveal the degree of dependence of spatial geographical objects or phenomena [61]. The spatial autocorrelation analysis model includes two models: the global spatial autocorrelation analysis model and the local spatial autocorrelation analysis model. Therefore, the above two models were applied to reveal the spatial distribution characteristics of CLQ in Quzhou County.
The global spatial autocorrelation model was applied to reveal the clustered, dispersed, and random characteristics of the CLQI in Quzhou County at the county level, and the global Moran’s I coefficient is the common statistical indicator. The global Moran’s I is expressed as follows:
I = n i = 1 n j = 1 n w i j ( x i x ¯ ) ( x j x ¯ ) ( i = 1 n j = 1 n w i j ) i = 1 n ( x i x ¯ ) 2
where n is the number of cultivated land quality units; x i and x j are the CLQI of i and j , respectively; x ¯ is the average CLQI of the whole county; and w i j is the spatial weight matrix ( i j ).
The local spatial autocorrelation model was used to explore the aggregation or dispersion characteristics of the CLQI in Quzhou County at a regional scale. The specific calculation formula is as follows:
I i = x i x ¯ S 2 j = 1 n w i j ( x j x ¯ )
where i j , and S 2 = 1 n i = 1 n ( x i x ¯ ) 2 .

2.5. Establishment of the Obstacle Diagnosis Model

CLQ is composed of specific indicators of multiple elements, each of which has an influence on the quality of cultivated land [28,51]. However, different indicators in the same region and the same indicator in different regions have different constraints on the quality of cultivated land. Thus, identifying obstacle factors that affect the quality of cultivated land can play an important role in improving the quality of cultivated land by reducing or even eliminating them [62]. According to the basic principles of the Cask Law and relevant academic studies [24,42,63], the quality condition of cultivated land is limited by low indicators of CLQ. Therefore, this study constructed an obstacle diagnosis model to identify obstacle factors of CLQ. The obstacle degree of a CLQ indicator was calculated from the actual indicator value and the optimal indicator value. Based on the regional reality, the highest value of the indicator classification was determined as the optimal value of the CLQ indicator. That is, the calculation process of the obstacle diagnosis model constructed in this study was based on the difference between the actual indicator value and 1. The specific formula is as follows:
Q j = 1 N j 100 × 100 %
where Q j is the obstacle degree of cultivated land indicator j , and N j is the actual indicator value of cultivated land quality, ranging from 10 to 100 (Table 2).

3. Results and Analyses

3.1. Evaluation Results of Cultivated Land Quality

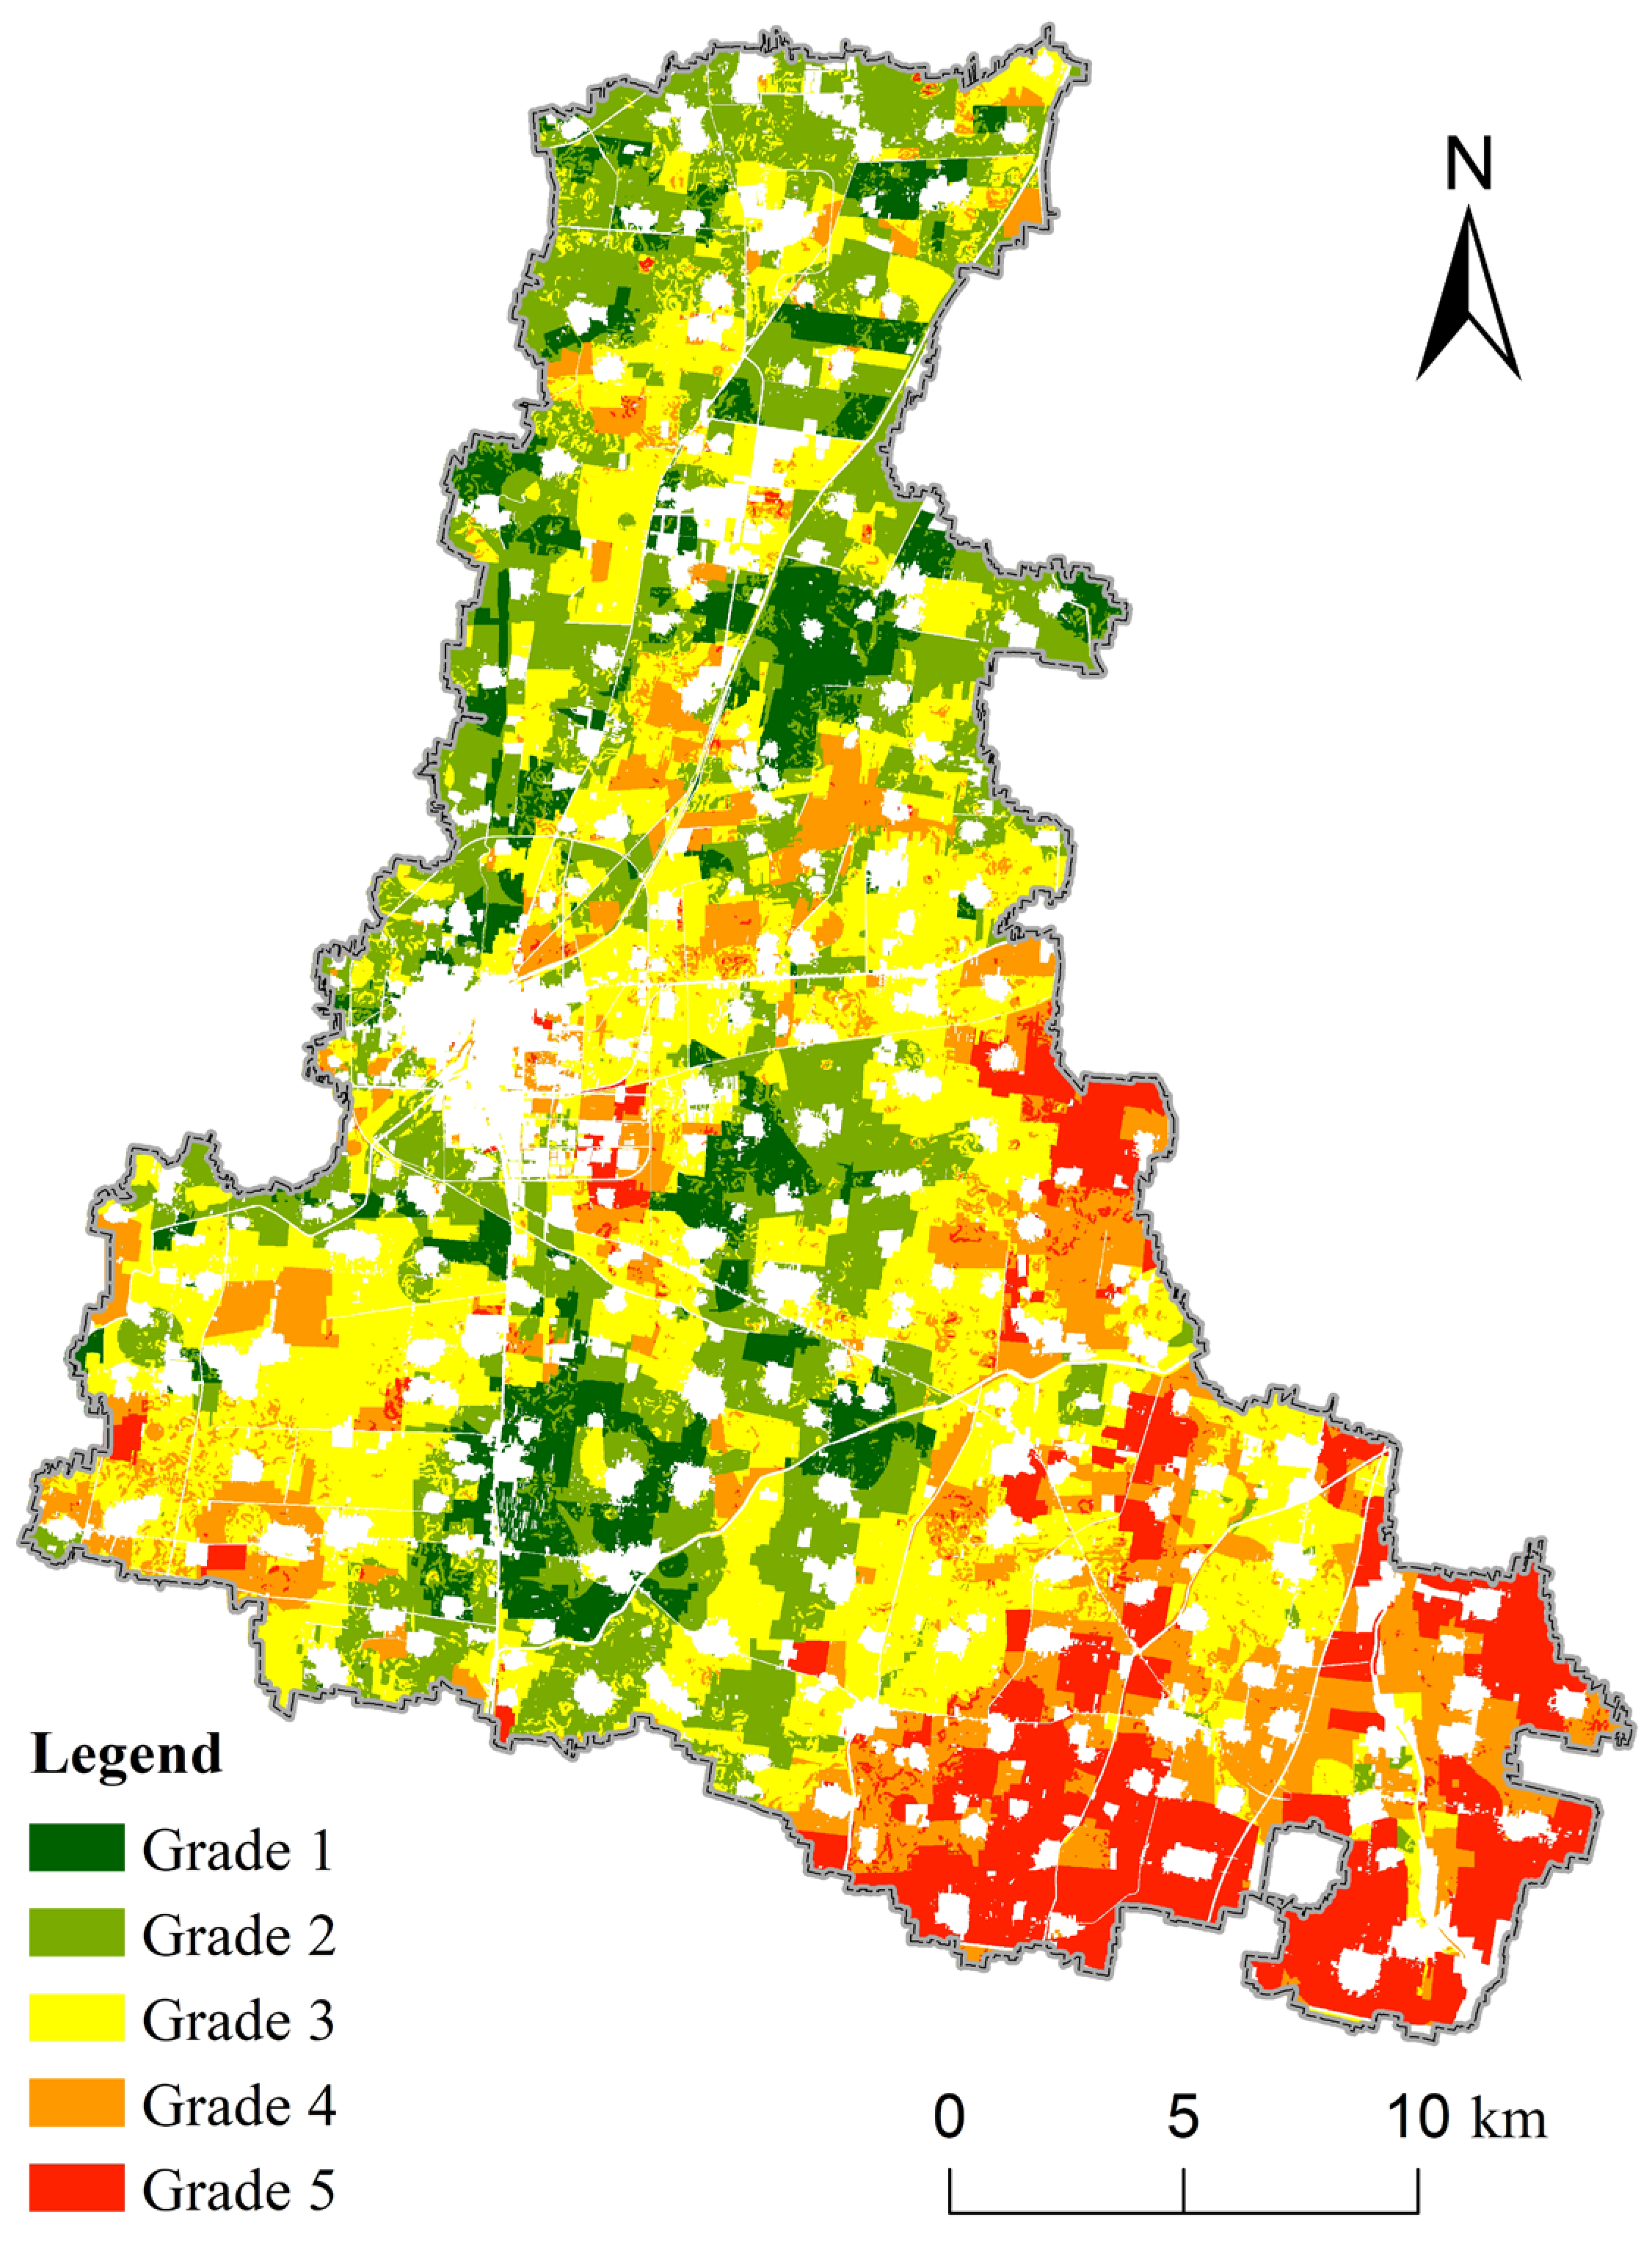
3.1.1. Spatial Characteristics of Cultivated Land Quality

Based on the evaluation method of CLQ, the range of the cultivated land quality index (CLQI) was from 69.74 to 95.59, and the average CLQI was 87.61 in Quzhou County. Using the Equal Interval method in the ArcGIS software platform, we divided the CLQI into five levels from high to low. Grade 1 represented the best quality of cultivated land, and grade 5 represented as the worst quality of cultivated land. Figure 4 shows the spatial distribution of the grades of CLQ, indicating that the distribution of different grades of CLQ has an apparent spatial variation. The areas of high quality (grades 1 and 2), medium quality (grade 3), and low quality (grades 4 and 5) were 196.71, 182.64, and 164.25 km2, respectively, accounting for 36.19%, 33.60%, and 30.21% of the cultivated land area, respectively. The high-quality cultivated land was mainly concentrated in the north and south of Quzhou County, and the low-quality cultivated land was mainly distributed in the southeast of Quzhou County. The average grade of CLQ in Quzhou County was 2.97, which was considered at a medium level.

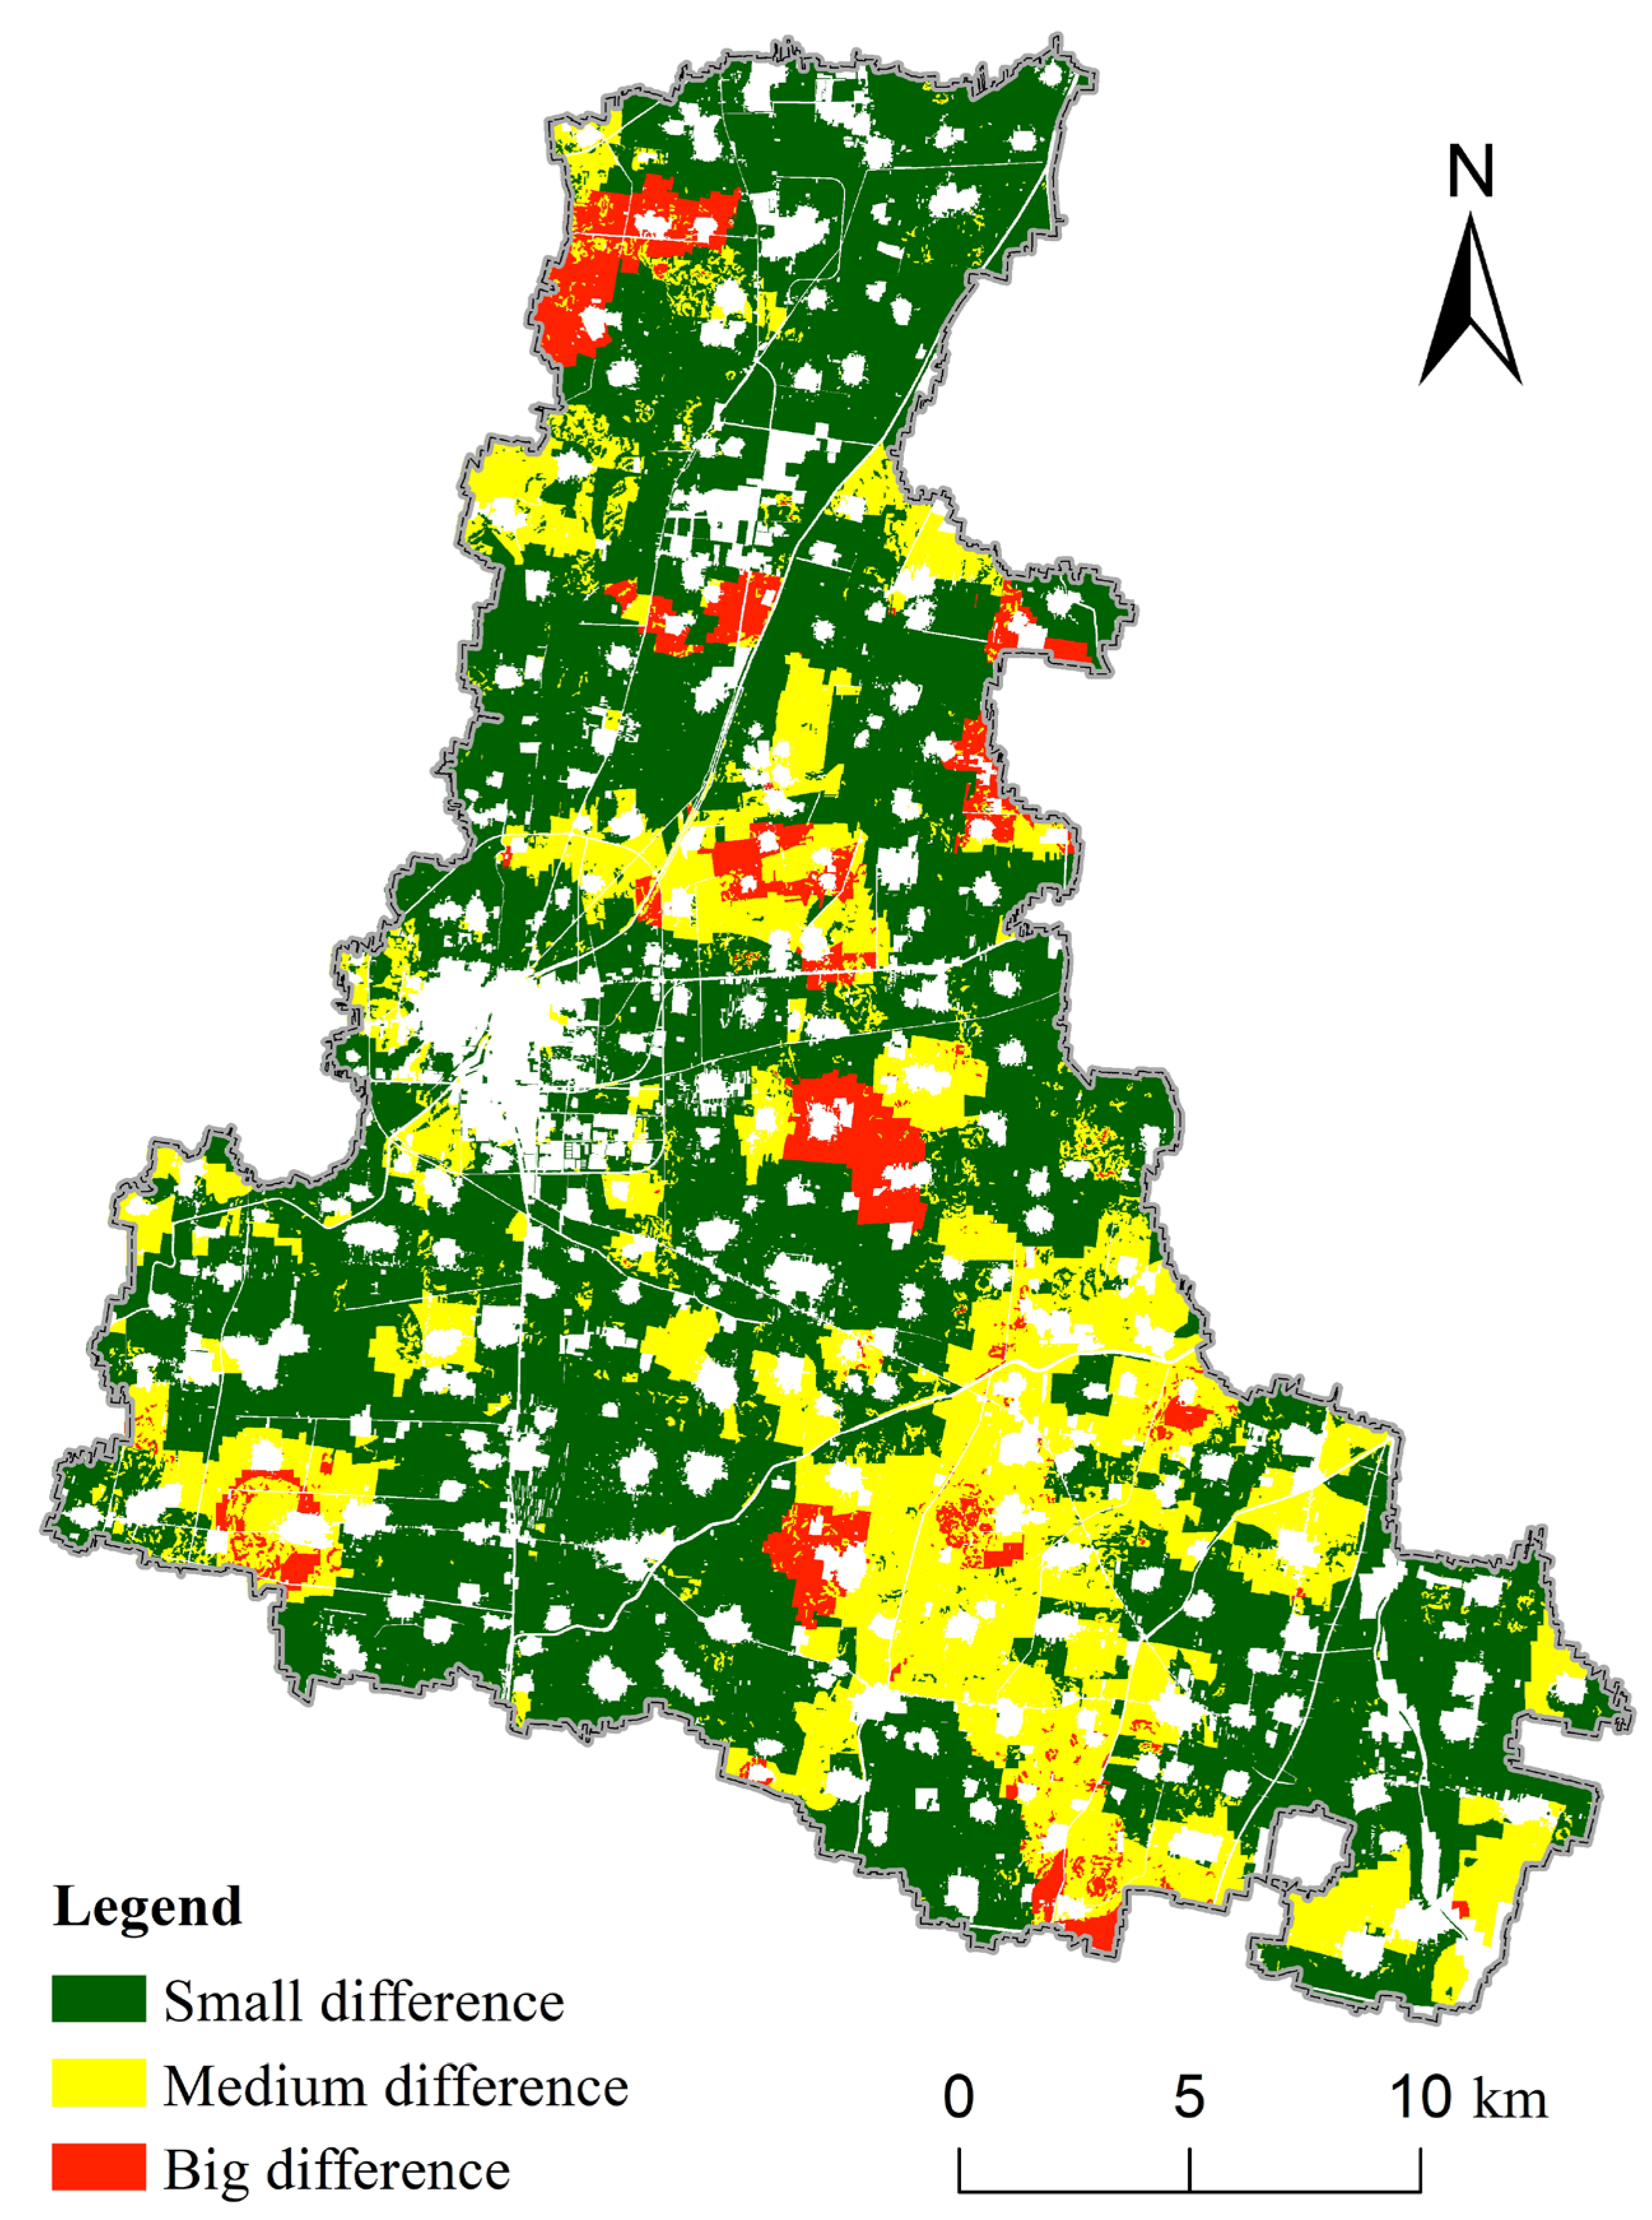
3.1.2. Comparison with Existing Evaluation Results

The “Regulation for Gradation on Agricultural Land Quality” (GB/T 28407-2012) was issued by the Ministry of Natural Resources, and the utilization grade of cultivated land has been widely used in cultivated land use and management [19,38,58]. The utilization quality of cultivated land was classified into 1~15 grades. In 2016, the range of utilization quality grade of cultivated land was 3~10, and the average utilization grade was 6.68 in Quzhou County. A heat map was created to directly compare the area distribution between the different grades of the two results, and it can be observed that the area distribution of the different grades is relatively consistent between the two evaluation results (Figure 5).
A comparison of the indices of the two evaluation results was performed to attain a more accurate comparison of the two evaluation results. In this study, the indices were standardized using the Z-score method as the two indices were not directly comparable. The differences were classified as big, medium, and small using the Equal Interval method, and the areas of cultivated land with large, medium, and small differences decreased in order. As shown in Figure 6, the area of cultivated land with a small difference is the largest, accounting for 67.51% of the total area of cultivated land. Only 5.91% of the cultivated land area has a large difference, and its spatial distribution is dispersed.

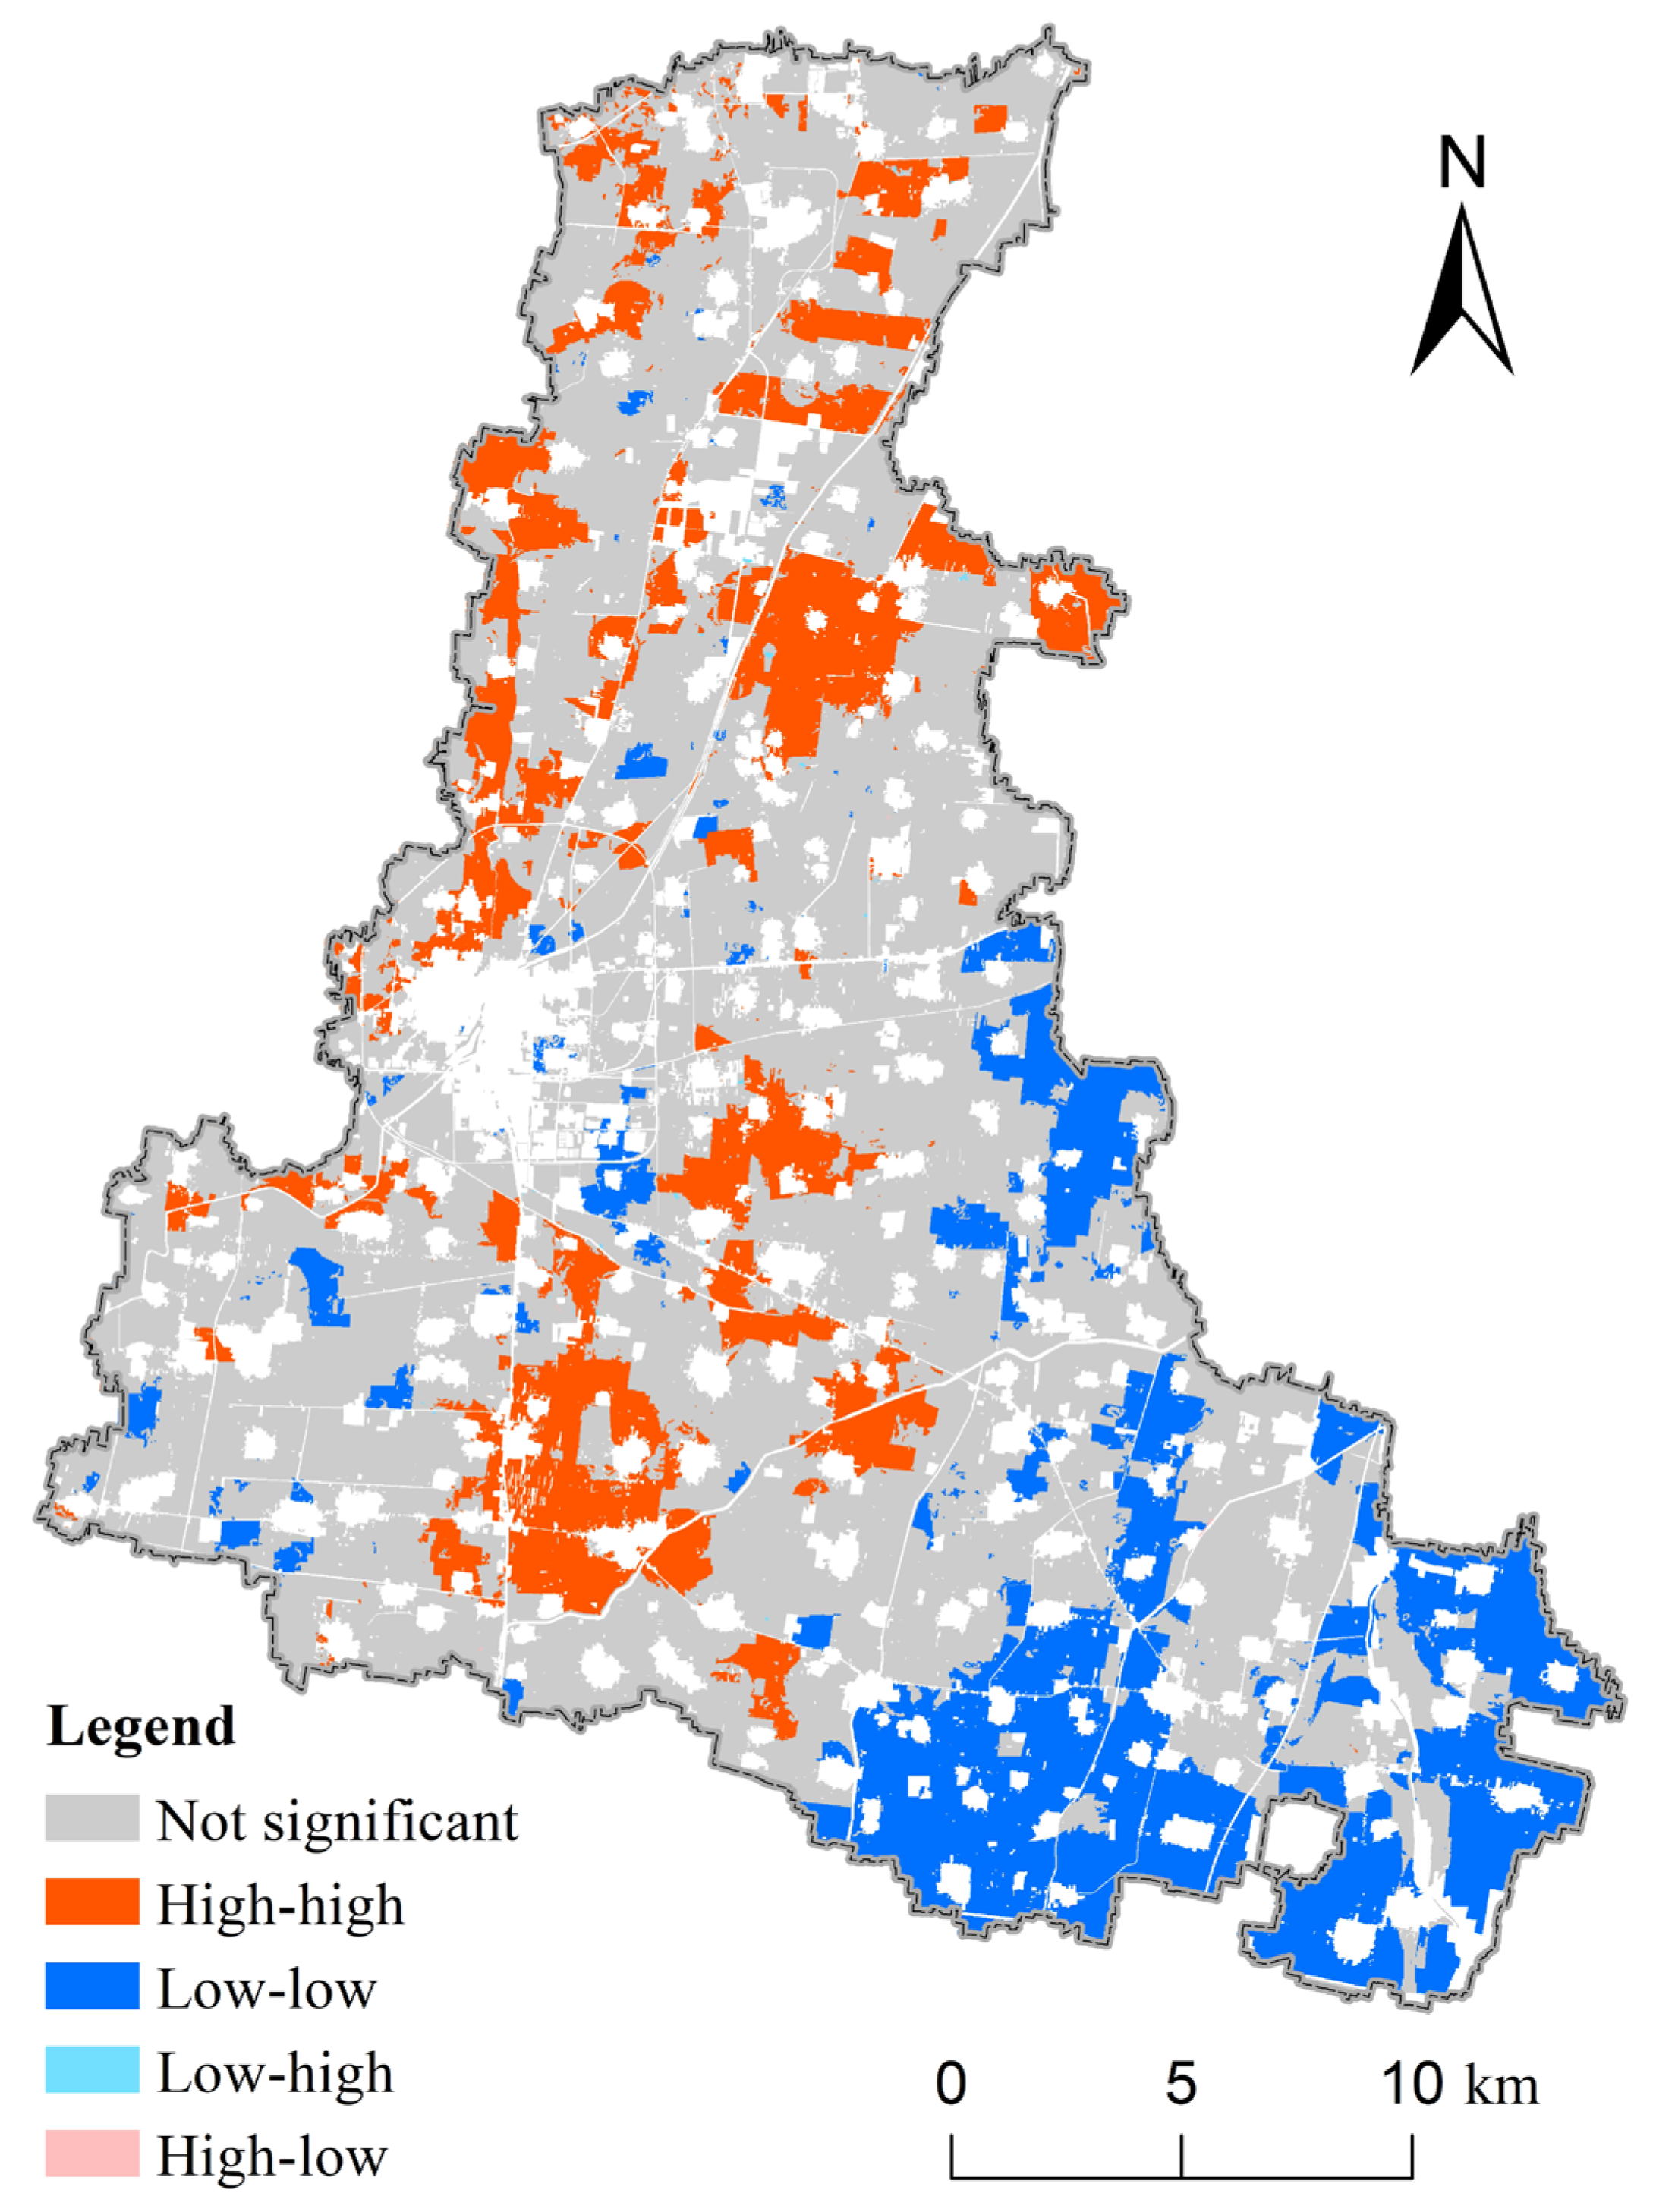
3.2. Spatial Correlation Analysis of Cultivated Land Quality

Using ArcGIS and the GeoDa software, the spatial autocorrelation analysis of CLQI was carried out using the K-Nearest method, and the results are shown in Figure 7 and Figure 8. Moran’s I of global spatial autocorrelation is 0.8782, while the p-value and the z-score are 0.0010 and 230.4920, respectively. Moran’s I passes the significance test, indicating that the CLQI of Quzhou County has strong positive spatial autocorrelation and strong spatial agglomeration. Most of the points are distributed in the first and third quadrants, respectively, indicating that high cultivated land areas are surrounded by high cultivated land areas and low cultivated land areas are surrounded by low cultivated land areas. Meanwhile, a small number of points are distributed in the second and fourth quadrants, indicating that low cultivated land areas are surrounded by high cultivated land areas and high cultivated land areas are surrounded by low cultivated land areas, respectively (Figure 7).
The results of the local spatial autocorrelation show that the index of CLQ has a significant spatial agglomeration. The high–high agglomeration areas of cultivated land are mainly distributed in the south and the middle north regions of Quzhou County, accounting for 15.34% of the total cultivated land area. The low–low agglomeration areas of cultivated land are mainly located in the southeastern part of the county, with an area proportion of 17.66%. However, the areas of low–high agglomeration and high–low agglomeration are relatively small and are significantly smaller than the areas of high–high and low–low agglomeration (Figure 8).

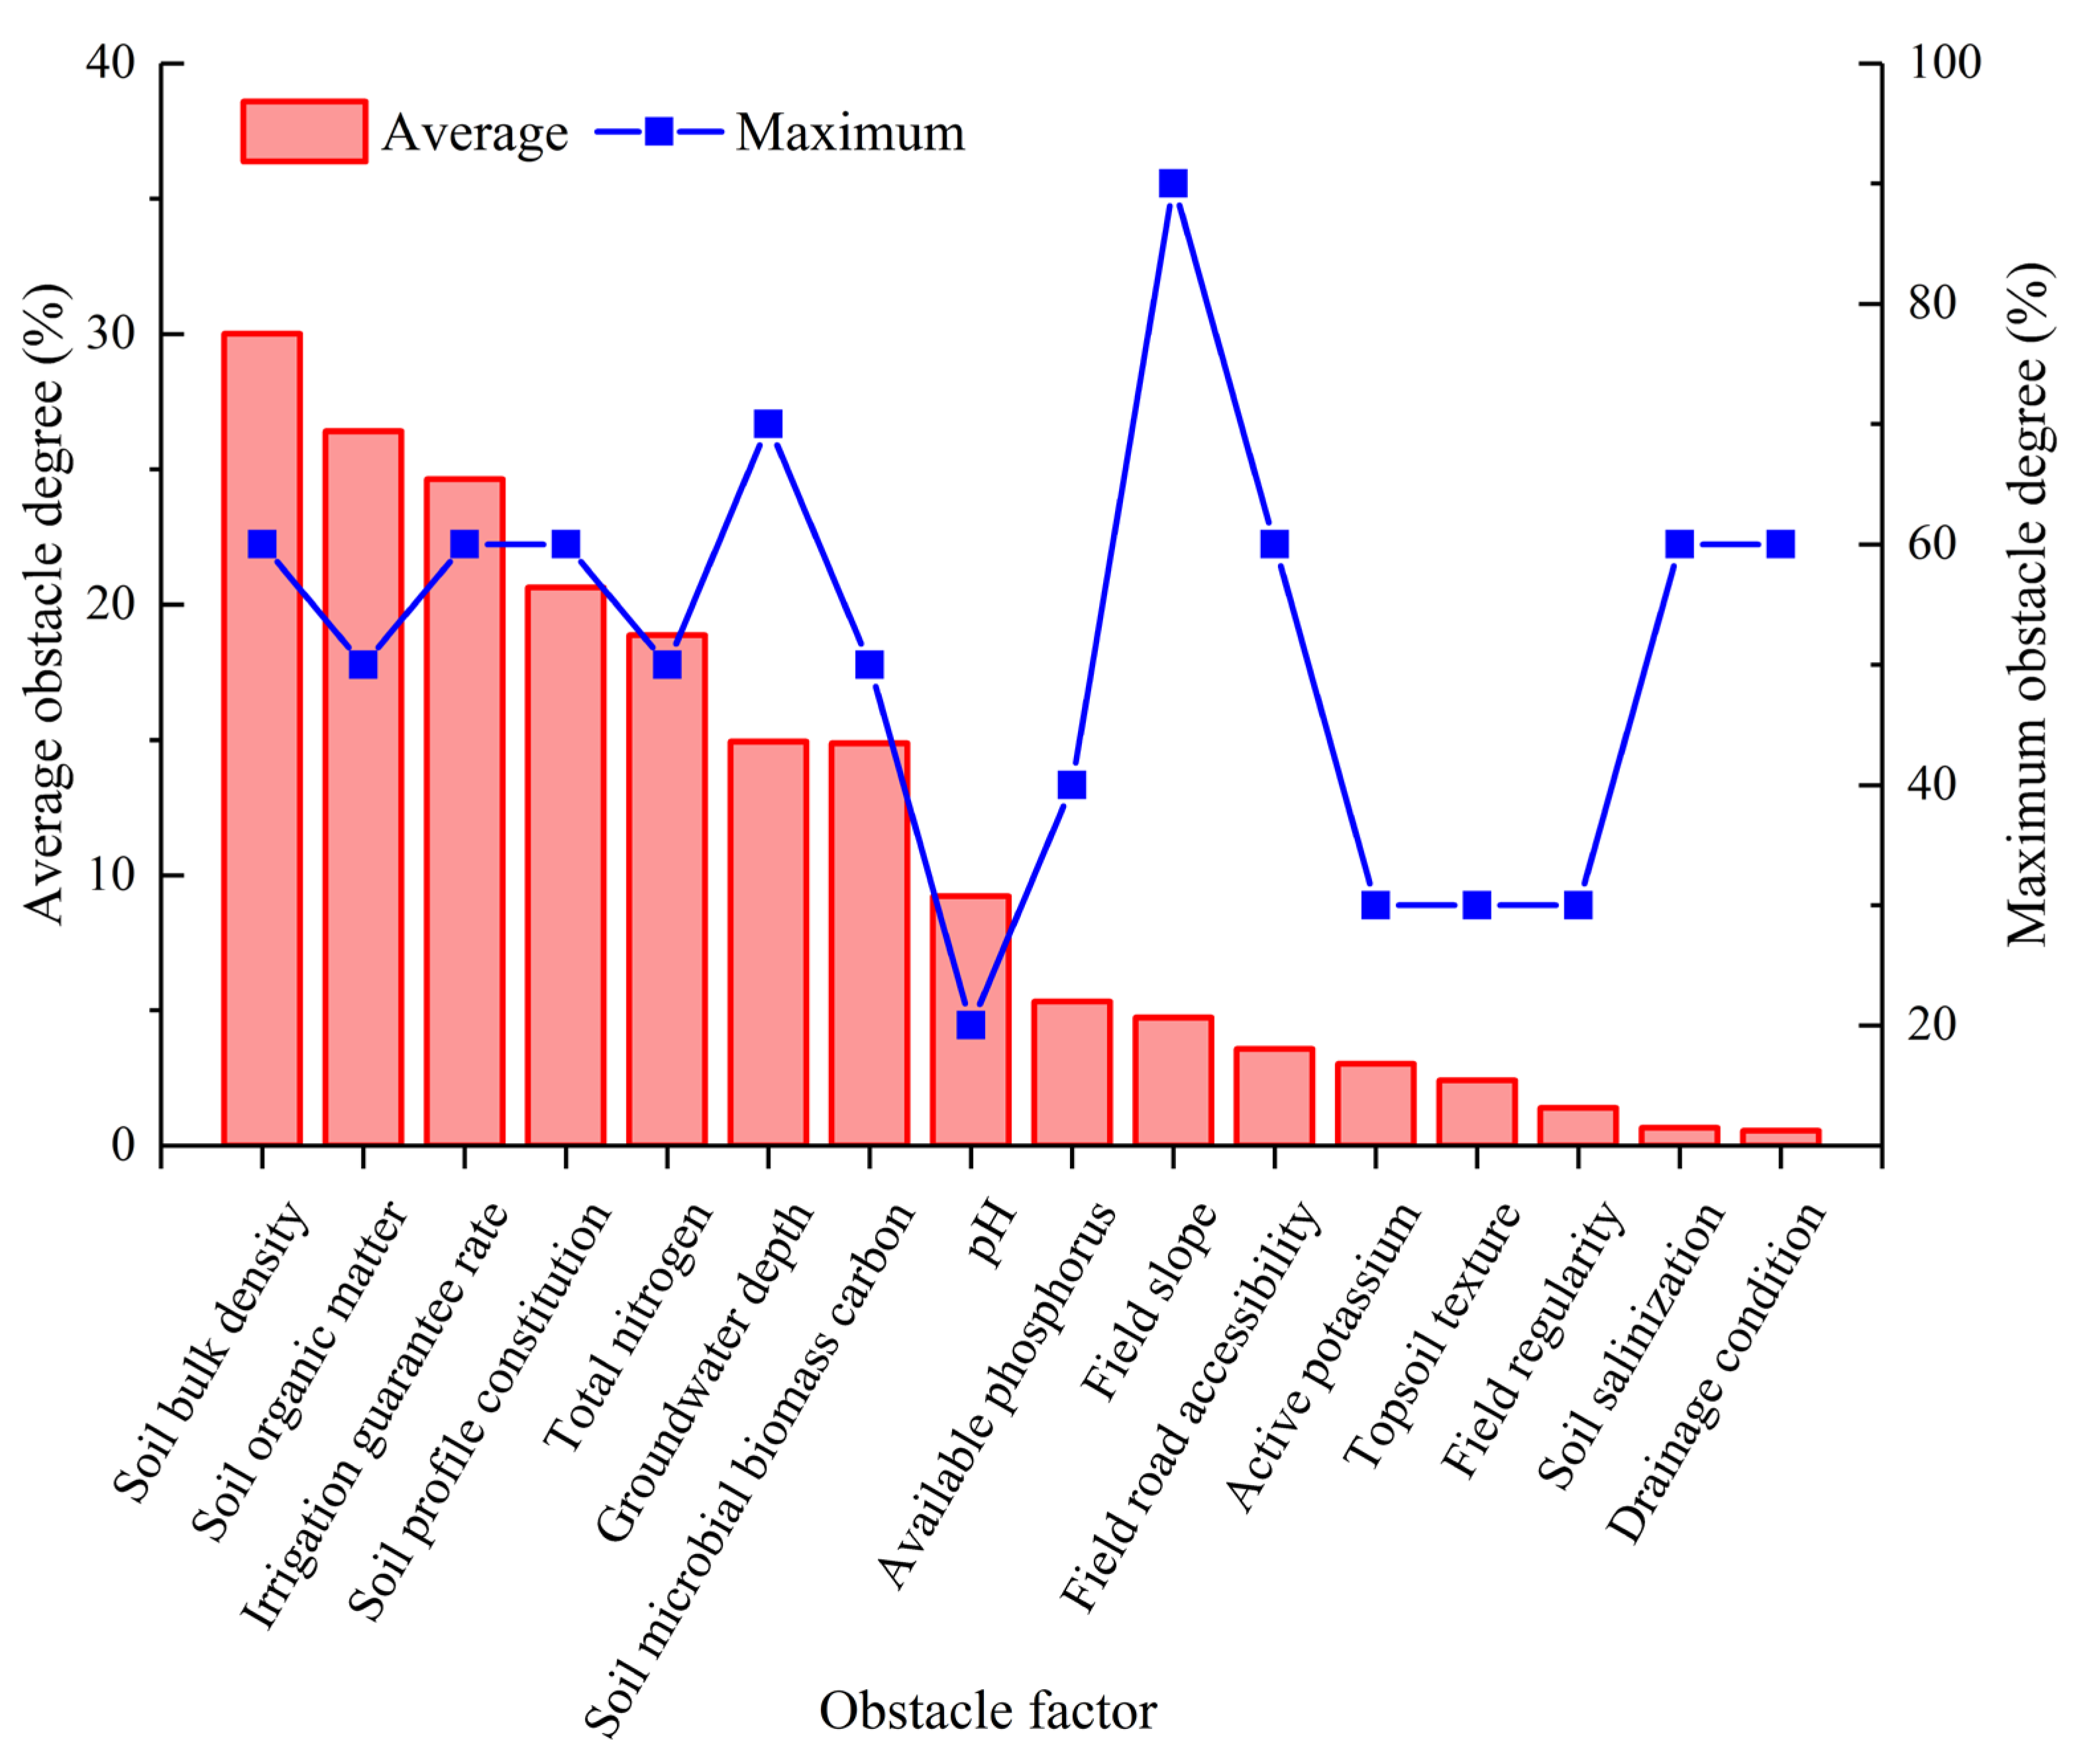
3.3. Diagnosis of Obstacle Factors of Cultivated Land Quality

Based on the obstacle diagnosis model, Figure 9 shows the average and maximum obstacle degree of the indicators of CLQ with an average Q j ≥ 1%. As shown in Figure 9, the average values of the obstacle degree of soil bulk density, soil organic matter, irrigation guarantee rate, and soil profile constitution are more than 20%. The maximum values of the obstacle degree of field slope, groundwater depth, soil bulk density, irrigation guarantee rate, soil profile constitution, field road accessibility, soil salinization, and drainage conditions are above 60%, indicating that these indicators pose some limitations for certain cultivated land plots in Quzhou County. However, from a purely average perspective, some plots of a certain indicator may have higher obstacle degrees, but their average obstacle degree may be lower, such as field slope; correspondingly, most of the plots of a certain indicator may have a similar obstacle degree, and the average obstacle degree of this indicator may be higher, such as soil bulk density.
To better identify the degree of obstacle factors of the quality of cultivated land, factors with an obstacle degree greater than 30% and its constrained area greater than 1 km2 were analyzed (Table 4). The area of cultivated land restricted by soil profile constitution, irrigation guarantee rate, groundwater depth, and soil microbial biomass carbon is above 40 km2, and its area proportion is greater than 8%. Therefore, the above four indicators are considered as the main obstacle factors of CLQ in Quzhou County. Of these, cultivated land restricted by soil profile constitution is mainly distributed in the north-central and southeastern parts of the county; cultivated land limited by groundwater and soil microbial biomass carbon is mainly distributed in the southeastern part; and cultivated land restricted by irrigation is scattered throughout the county. The area of cultivated land constrained by other indicators is relatively small and its spatial distribution is characterized by either concentration or dispersion.

4. Discussion

4.1. Evaluation System of Cultivated Land Quality

This study established a theoretical framework and methodological system for the evaluation of CLQ, and evaluated the CLQ in Quzhou County, an intensive agricultural region in the NCP. This study built a theoretical framework for evaluating CLQ from the logical evolution of elements, processes, functions, and quality of cultivated land, focusing on the essential characteristics of the production function of cultivated land. This framework, together with the evaluation framework of CLQ constructed by Li et al. [52] and Song et al. [20], has a certain role in enriching the theory of CLQ evaluation from different sides. For example, Song et al. [20] constructed the theoretical framework of CLQ evaluation from the perspective of farmland ecosystems, and conducted the CLQ evaluation from different dimensions such as background quality, efficiency quality, sustainability quality, environment quality, and landscape quality, using Wen County, Henan Province, China, as a case study. This study highlights the construction of a theoretical framework for the evaluation of CLQ based on a systematic cognition of CLQ, which is different from other frameworks.
Based on the constructed theoretical framework of CLQ evaluation and the actual use of regional cultivated land in the NCP, 21 indicators in the five dimensions of climate condition, topographic characteristic, soil property, farming status, and environmental condition were selected to build an index system for evaluating CLQ. In the process of evaluating the quality of cultivated land, different studies have chosen different evaluation indicators from different aspects depending on their research objectives [64,65,66,67]. For example, Shi et al. [43] constructed an index system based on the analytical framework of resource-asset-capital attributes of CLQ, and indicators of topography, soil, ecology, location, agricultural inputs, and technology level were selected to evaluate different dimensions of CLQ. Nabiollahi et al. [68] carried out a soil quality assessment using indicators such as pH, electrical conductivity, organic carbon, cation exchange capacity, carbonate calcium equivalent, exchangeable sodium percentage, sodium adsorption ratio, mean weight diameter, and bulk density. Existing studies typically focus on selecting physical and chemical indicators of soil to evaluate CLQ, but there is a growing emphasis on the selection of chemical indicators for CLQ [36,69,70,71]. Soil biological indicators also play an important role in the evaluation of cultivated land quality, for example, Fierer et al. [72] point out that soil microbes should be better integrated into soil health evaluation. Meanwhile, this study also selected indicators from various aspects of cultivated land, such as climate, topography, and infrastructure, which is different from other studies. Therefore, physical, chemical, and biological indicators of soil, and climate, topography, infrastructure, and environmental condition of cultivated land were selected to carry out the evaluation of CLQ in this study.
In this study, a methodological system based on the WSM and the “1 + X” model was constructed to evaluate the quality of cultivated land, in order to better reflect the characteristics of the cultivated land quality indicator. This is different from other studies that have evaluated the quality of cultivated land simply using the WSM or soil quality index method [36,69]. In this study, we mainly consider the characteristics of the role of environmental indicators on the CLQ, and construct a “1 + X” model to show its limiting effect on the CLQ. In addition, taking into account the stability characteristics of climate condition, the evaluation of CLQ in Quzhou County was carried out in four aspects other than climate condition. However, climate condition can be used as indicators for the evaluation of CLQ at the meso- and macro-scales such as municipal, provincial, and national, which could provide theoretical support for CLQ evaluation at different scales.
Different methods or dimensions were compared to verify the accuracy of the CLQ evaluation results. This study directly compared the utilization quality of cultivated land based on the “Regulation for Gradation on Agricultural Land Quality” (GB/T 28407-2012) with the results of this research, and the comparison showed that the evaluation results could well reflect the quality of cultivated land in Quzhou County (see Figure 5 and Figure 6). The results of this study were similar to those of Shi et al. [43] on the resource evaluation of CLQ in Quzhou County, which showed that the areas of high-, medium-, and low-quality cultivated land decreased in order and the differences were small. However, it is worth noting that there are also small differences between the results of this study and those of other studies. The main reason for the difference is that the evaluation methodological system of CLQ is different; it is also possible that the indicators for evaluating the CLQ such as total nitrogen, available phosphorus, and active potassium have improved with the rational use of cultivated land. However, the difference between the evaluation time of this study and the evaluation time of the utilization grade based on the “Regulation for Gradation on Agricultural Land Quality” (GB/T 28407-2012) is small. Therefore, the probability of differences in the results of CLQ evaluation due to time differences is low. Overall, it can be observed that the evaluation results of this study have a high similarity with the existing evaluation results, proving that the evaluation system can accurately evaluate the CLQ in Quzhou County.

4.2. Identification of Obstacle Factors of Cultivated Land Quality

Identifying the obstacle factors of CLQ is the basis for formulating CLQ strategies and policies. Both the mathematical modeling approach and the practical empirical approach have been used in various studies to identify obstacle factors of CLQ [62,73]. For example, Yuan et al. [42] constructed a natural grade improvement potential index model to identify the obstacles of CLQ, and they pointed out that soil structure, salinization, organic matter, and irrigation were the main obstacle factors in the sandy area along the Great Wall in north Shaanxi. Schiefer et al. [73] used the Muencheberg Soil Quality Rating to determine the limitations of soils for cropping and grazing. Based on the basic concept of the Cask Law and related academic research, this study constructed an obstacle diagnosis model to explore the obstacle factors of CLQ in Quzhou County, which is different from previous research [74].
The identification of obstacle factors of cultivated land in Quzhou County was mainly based on the gap between the actual value and the optimal value of the indicators. In this study, the maximum value of each indicator was chosen as the optimal value, while the optimal value can also be set according to the specific situation. The advantage of the obstacle diagnosis model constructed in this study is that it could visually manifest the possible improvement degree of different obstacle factors. Meanwhile, determining the specific Q j value according to the basic situation of different regions can more accurately discern the obstacle factors, and this study identified the obstacle factors in Quzhou County based on setting Q j > 30%. A possible drawback of the model is that it does not take into account the relative importance of the indicators, thus implying that each indicator is equally important.
The results of this study showed that soil profile constitution, irrigation guarantee rate, groundwater depth, and soil microbial biomass carbon were the main obstacle factors of CLQ in Quzhou County. However, other indicators of the CLQ also have limitations on certain plots of cultivated land (see Figure 9). The impact of the indicators on the CLQ varies depending on the extent to which they are influenced by the natural environment and human interference [59]. Indicators such as road access and drainage condition are susceptible to human interference and can change over short periods of time, and are referred to as dynamic indicators. Indicators such as soil configuration are mainly influenced by the natural environment and are less susceptible to human influence, and are referred to as stable indicators. The orderly consolidation of dynamic indicators and the rational use of stable indicators are of great importance in improving the quality of cultivated land. This study identified the obstacle factors of the CLQ in Quzhou County (see Table 4). Thus, a rational identification of stable or dynamic characteristic of the obstacle factors of CLQ is the basis for formulating targeted improvement strategies.

4.3. Improvement Strategies of Cultivated Land Quality

Cultivated land protection has always been the focus of the Chinese government, and it has become the country with the strictest cultivated land protection in the world [14,15]. Protection of CLQ is at the core of the trinity protection of cultivated land, and improving the quality of cultivated land plays a crucial role in ensuring national food security [10,35]. Therefore, based on the characteristics of the obstacle factors of CLQ in Quzhou County, targeted measures are proposed for the construction and protection of CLQ, which could have a positive effect on the improvement of CLQ. It should be noted, however, that the protection of CLQ should not only focus on the consolidation and construction of single obstacle factors but should also take into account the improvement of the overall quality of cultivated land.
(1) Strengthening the rectification of cultivated land and paying attention to infrastructure construction.
Land comprehensive consolidation is an important means for the construction and improvement of the quality of cultivated land [75,76]. The research results of this study showed that various dynamic indicators, such as irrigation guarantee rate, field road accessibility, and field slope, were the obstacle factors of CLQ in Quzhou County, which can be improved through land comprehensive consolidation. Infrastructure such as irrigation facilities and field roads could be improved or rebuilt through land leveling projects, farmland water conservation projects, and field road projects [77,78]. This is mainly because these indicators are affected by human actions and can be improved or reconstructed according to the land consolidation project under consideration. Therefore, targeted land comprehensive consolidation can effectively improve the quality of cultivated land in Quzhou County. However, for some indicators that are strongly influenced by the natural environment, the economy and benefits need to be considered in order to achieve an integrated improvement of CLQ. Some stable indicators, such as soil profile constitution and topsoil texture, are more difficult to change or transform; thus, it is necessary to comprehensively consider at what scale these indicators should be rebuilt based on the actual regional situation.
(2) Transforming the concept of agricultural fertilization and promoting the combination of cultivated land utilization and conservation.
A scientific and reasonable application of fertilizers can effectively regulate soil physical, chemical, and biological indicators, such as soil organic matter and total nitrogen. Some studies have shown that organic fertilizers have the functions of increasing and renewing soil organic matter, promoting the reproduction of microorganisms, and improving soil physical and chemical properties, as well as biological activities [79,80]. Therefore, based on the basic characteristics of the obstacle factors of CLQ in Quzhou County, the application of organic fertilizers can regulate soil organic matter, soil nutrients, etc. In addition, measures such as straw returning and planting green manure crops can also regulate soil organic matter, which could achieve the combination of cultivated land use and management. Thus, in the process of improving the quality of cultivated land and agricultural production, it is necessary to update farmers’ understanding of fertilization, accelerate the transformation of fertilization methods, promote more widespread application of organic fertilization, and strengthen the combination of cultivated land utilization and conservation.
(3) Enhancing scientific cultivated land recuperation and sustainable optimization of agricultural cultivation structure.
Groundwater depletion has become one of the crucial factors threatening the use of cultivated land resources in the NCP [45], and groundwater depth was identified as an obstacle factor of CLQ in Quzhou County. Groundwater changes are influenced by both the natural environment and human activities, and its regulation is a complex engineering system. Groundwater levels in the NCP have declined significantly due to the large amount of groundwater extracted for agricultural irrigation. Cultivated land recuperation has been widely promoted as an effective means of reducing the intensity of cultivated land use and restoring the fertility of cultivated land [81]. Meanwhile, reducing groundwater extraction by optimizing the planting structure has also been the main way to recharge groundwater. In addition, improving the efficiency of water resource utilization can reduce the rate of groundwater extraction. Overall, these measures can directly or indirectly improve the groundwater level and reduce the limitation imposed by groundwater on the CLQ in Quzhou County.

4.4. Limitations and Prospects of the Research

The purpose of this study was to evaluate CLQ and identify its obstacle factors, using Quzhou County, an intensive agricultural region in NCP, as a case study. However, there are still limitations to this study. Improvements can be made in future research. On the one hand, soil biological indicators also have an important impact on the quality of cultivated land, and a biological indicator of soil microbial biomass carbon was selected in this study. However, multiple soil biological indicators could be selected for future studies in order to more accurately evaluate the quality of cultivated land. On the other hand, this study identified the obstacle factors of CLQ, but did not reveal the driving factors and driving mechanisms of CLQ. Therefore, identifying the driving factors and revealing the driving mechanisms of CLQ will be a major focus for future research.

5. Conclusions

Conducting an evaluation of CLQ is the foundation for consolidating and improving CLQ. In this study, a new theoretical framework and methodological system of CLQ evaluation was constructed for the evaluation of CLQ. Quzhou County, a typical county in the intensive agricultural region of the NCP, was selected as the study area to evaluate the CLQ. The findings of this study showed that the overall quality of cultivated land in Quzhou County was at a medium level, and the quality of cultivated land had significant positive agglomeration. The results of the CLQ evaluation of this study were similar to those of previous studies. Meanwhile, the obstacle diagnosis model constructed based on the Cask Law and relevant academic studies was used to identify obstacle factors of CLQ. This study found that the main obstacle factors of CLQ in Quzhou County were soil profile constitution, irrigation guarantee rate, groundwater depth, and soil microbial biomass carbon, and their spatial distribution was different. Based on the stable and dynamic characteristics of the obstacle factors, we propose three strategies for consolidating and improving CLQ. Overall, this study carried out the evaluation of CLQ and the identification of its obstacle factors from a new perspective, providing a basic reference for future research on CLQ. The proposed strategies for improving CLQ, based on the findings of this study, can provide basic theoretical support for policymakers to implement CLQ construction in the NCP.

Author Contributions

Conceptualization, X.S. and X.K.; methodology, X.S.; software, Q.L.; validation, X.S. and X.K.; formal analysis, B.Z.; investigation, X.S. and M.L.; resources, X.K.; data curation, X.S.; writing—original draft preparation, X.S.; writing—review and editing, X.S., X.K. and W.C.; visualization, X.S. and Q.L.; supervision, X.S. and X.K.; project administration, X.S.; funding acquisition, X.S. All authors have read and agreed to the published version of the manuscript.

Funding

National Social Science Foundation of China Major Project (19ZDA096), National Natural Science Foundation of China (42171289), National Natural Science Foundation of China (42201285).

Institutional Review Board Statement

Not applicable.

Informed Consent Statement

Not applicable.

Data Availability Statement

The data are not publicly available.

Conflicts of Interest

The authors declare no conflict of interest.

References

  1. Zhou, Y.; Li, X.; Liu, Y. Cultivated Land Protection and Rational Use in China. Land Use Policy 2021, 106, 105454. [Google Scholar] [CrossRef]
  2. Viana, C.; Freire, D.; Abrantes, P.; Rocha, J.; Pereira, P. Agricultural Land Systems Importance for Supporting Food Security and Sustainable Development Goals: A Systematic Review. Sci. Total Environ. 2022, 806, 150718. [Google Scholar] [CrossRef]
  3. Wu, X.; Fu, B.; Wang, S.; Song, S.; Li, Y.; Xu, Z.; Wei, Y.; Liu, J. Decoupling of SDGs Followed by Re-coupling as Sustainable Development Progresses. Nat. Sustain. 2022, 5, 452–459. [Google Scholar] [CrossRef]
  4. Zhuang, Q.; Wu, S.; Huang, X.; Kong, L.; Yan, Y.; Xiao, H.; Li, Y.; Cai, P. Monitoring the Impacts of Cultivated Land Quality on Crop Production Capacity in Arid Regions. Catena 2022, 214, 106263. [Google Scholar] [CrossRef]
  5. FAO. The Future of Food and Agriculture–Trends and Challenges; FAO: Rome, Italy, 2017. [Google Scholar]
  6. Lesk, C.; Rowhani, P.; Ramankutty, N. Influence of Extreme Weather Disasters on Global Crop Production. Nature 2016, 529, 84–87. [Google Scholar] [CrossRef] [Green Version]
  7. Chase, J.; Blowes, S.; Knight, T.; Gerstner, K.; May, F. Ecosystem Decay Exacerbates Biodiversity Loss with Habitat Loss. Nature 2020, 584, 238–243. [Google Scholar] [CrossRef]
  8. Chen, G.; Li, X.; Liu, X.; Chen, Y.; Liang, X.; Leng, J.; Xu, X.; Liao, W.; Qiu, Y.; Wu, Q.; et al. Global Projections of Future Urban Land Expansion under Shared Socioeconomic Pathways. Nat. Commun. 2020, 11, 537. [Google Scholar] [CrossRef] [Green Version]
  9. Potapov, P.; Turubanova, S.; Hansen, M.; Tyukavina, A.; Zalles, V.; Khan, A.; Song, X.; Pickens, A.; Shen, Q.; Cortez, J. Global Maps of Cropland Extent and Change Show Accelerated Cropland Expansion in the Twenty-first Century. Nat. Food 2022, 3, 19–28. [Google Scholar] [CrossRef]
  10. Deng, X.; Huang, J.; Rozelle, S.; Zhang, J.; Li, Z. Impact of Urbanization on Cultivated Land Changes in China. Land Use Policy 2015, 45, 1–7. [Google Scholar] [CrossRef]
  11. Song, W.; Pijanowski, B.; Tayyebi, A. Urban Expansion and its Consumption of High-quality Farmland in Beijing, China. Ecol. Indic. 2015, 54, 60–70. [Google Scholar] [CrossRef]
  12. Liu, Y.; Zhou, Y. Reffections on China’s Food Security and Land Use Policy under Rapid Urbanization. Land Use Policy 2021, 109, 105699. [Google Scholar] [CrossRef]
  13. Zhao, H.; Chang, J.; Havlík, P.; Dijk, M.; Valin, H.; Janssens, C.; Ma, L.; Bai, Z.; Herrero, M.; Smith, P.; et al. China’s Future Food Demand and its Implications for Trade and Environment. Nat. Sustain. 2021, 4, 1042–1051. [Google Scholar] [CrossRef]
  14. Liu, X.; Zhao, C.; Song, W. Review of the Evolution of Cultivated Land Protection Policies in the Period Following China’s Reform and Liberalization. Land Use Policy 2017, 67, 660–669. [Google Scholar] [CrossRef]
  15. Wu, Y.; Shan, L.; Guo, Z.; Peng, Y. Cultivated Land Protection Policies in China Facing 2030: Dynamic Balance System Versus Basic Farmland Zoning. Habitat Int. 2017, 69, 126–138. [Google Scholar] [CrossRef]
  16. Kong, X. China Must Protect High-quality Arable Land. Nature 2014, 506, 7. [Google Scholar] [CrossRef] [PubMed] [Green Version]
  17. Foley, J.; Ramankutty, N.; Brauman, K.; Cassidy, E.; Gerber, J.; Johnston, M.; Mueller, N.; O’Connell, C.; Ray, D.; West, P.; et al. Solutions for a Cultivated Planet. Nature 2011, 478, 337–342. [Google Scholar] [CrossRef] [Green Version]
  18. Bünemann, E.; Bongiorno, G.; Bai, Z.; Creamer, R.; Deyn, G.; Goede, R.; Fleskens, L.; Geissen, V.; Kuyper, T.; Mäder, P.; et al. Soil Quality—A Critical Review. Soil Biol. Biochem. 2018, 120, 105–125. [Google Scholar] [CrossRef]
  19. Fu, G.; Bai, W. Advances and Prospects of Evaluating Cultivated Land Quality. Resour. Sci. 2015, 37, 226–236, (In Chinese with English Abstract). [Google Scholar]
  20. Song, W.; Zhang, H.; Zhao, R.; Wu, K.; Li, X.; Niu, B.; Li, J. Study on Cultivated Land Quality Evaluation from the Perspective of Farmland Ecosystems. Ecol. Indic. 2022, 139, 108959. [Google Scholar] [CrossRef]
  21. Dumanski, J.; Pieri, C. Land Quality Indicators: Research Plan. Agric. Ecosyst. Environ. 2000, 81, 93–102. [Google Scholar] [CrossRef]
  22. Shen, R.; Chen, M.; Kong, X.; Li, Y.; Tong, Y.; Wang, J.; Li, T.; Lu, M. Conception and Evaluation of Quality of Arable Land and Strategies for its Management. Acta Pedol. Sin. 2012, 49, 1210–1217, (In Chinese with English Abstract). [Google Scholar]
  23. Doran, J.; Parkin, T.B. Defining and Assessing Soil Quality. In Defining Soil Quality for a Sustainable Environment; SSSA Special Publication 35; Doran, J.W., Coleman, D.C., Bezdicek, D.F., Stewart, B.A., Eds.; Soil Science Society of America Inc.: Madison, WI, USA, 1994; pp. 3–21. [Google Scholar]
  24. Zhao, C.; Zhou, Y.; Jiang, J.; Xiao, P.; Wu, H. Spatial Characteristics of Cultivated Land Quality Accounting for Ecological Environmental Condition: A Case Study in Hilly Area of Northern Hubei Province, China. Sci. Total Environ. 2021, 774, 145765. [Google Scholar] [CrossRef]
  25. Zambon, I.; Colantoni, A.; Carlucci, M.; Morrow, N.; Sateriano, A.; Salvati, L. Land Quality, Sustainable Development and Environmental Degradation in Agricultural Districts: A Computational Approach based on Entropy Indexes. Environ. Impact Assess. Rev. 2017, 64, 37–46. [Google Scholar] [CrossRef]
  26. Klingebiel, A.; Montgomery, P. Land Capability Classification; US Department of Agriculture Handbook: Washington, DC, USA, 1961; p. 210. [Google Scholar]
  27. Dunford, R.W.; Roe, R.D.; Steiner, F.R.; Wagner, W.R.; Wright, L.E. Implementing LESA in Whitman County, Washington. J. Soil Water Conserv. 1983, 38, 87–89. [Google Scholar]
  28. FAO. A Framework for Land Evaluation; Soils Bulletin; FAO: Rome, Italy, 1976. [Google Scholar]
  29. Heilig, G.; Fischer, G.; Van, V. Can China Feed Itself? An Analysis of China’s Food Prospects with Special Reference to Water Resources. Int. J. Sustain. Dev. World Ecol. 2000, 7, 153–172. [Google Scholar] [CrossRef]
  30. FAO. An International Framework for Evaluating Sustainable Land Management; World Soil Resources Report; FAO: Rome, Italy, 1993. [Google Scholar]
  31. Huber, S.; Prokop, G.; Arrouays, D.; Banko, G.; Bispo, A.; Jones, R.J.A.; Kibblewhite, M.; Lexer, W.; Moller, A.; Rickson, R.J.; et al. Environmental Assessment of Soil for Monitoring Volume I: Indicators & Criteria; Office for Official Publications of the European Communities: Luxembourg, 2008; pp. 45–48. [Google Scholar]
  32. Andrews, S.; Karlen, D.; Cambardella, C. The Soil Management Assessment Framework: A Quantitative Soil Quality Evaluation Method. Soil Sci. Soc. Am. J. 2004, 68, 1945–1962. [Google Scholar] [CrossRef]
  33. Ditzler, C.; Tugel, A. Soil Quality Field Tools: Experiences of USDA-NRCS Soil Quality Institute. Agron. J. 2002, 94, 33–38. [Google Scholar] [CrossRef]
  34. Sun, B.; Zhou, S.; Zhao, Q. Evaluation of Spatial and Temporal Changes of Soil Quality Based on Geostatistical Analysis in the Hill Region of Subtropical China. Geoderma 2003, 115, 85–99. [Google Scholar] [CrossRef]
  35. Liu, L.; Zhou, D.; Chang, X.; Lin, Z. A New Grading System for Evaluating China’s Cultivated Land Quality. Land Degrad. Dev. 2020, 31, 1482–1501. [Google Scholar] [CrossRef]
  36. Tan, Y.; Chen, H.; Lian, K.; Yu, Z. Comprehensive Evaluation of Cultivated Land Quality at County Scale: A Case Study of Shengzhou, Zhejiang Province, China. Int. J. Environ. Res. Public Health 2020, 17, 1169. [Google Scholar] [CrossRef] [Green Version]
  37. Liu, S.; Peng, Y.; Xia, Z.; Hu, Y.; Wang, G.; Zhu, A.; Liu, Z. The GA-BPNN-Based Evaluation of Cultivated Land Quality in the PSR Framework Using Gaofen-1 Satellite Data. Sensors 2019, 19, 5127. [Google Scholar] [CrossRef] [Green Version]
  38. GB/T28407-2012; Regulation for Gradation on Agriculture Land Quality. Ministry of Natural Resources of People’s Republic of China: Beijing, China, 2012.
  39. Ministry of Agriculture and Rural Affairs of People’s Republic of China. Measures for Investigation, Monitoring and Evaluation of Cultivated Land Quality; Ministry of Agriculture and Rural Affairs of People’s Republic of China: Beijing, China, 2016. [Google Scholar]
  40. Ministry of Agriculture and Rural Affairs of People’s Republic of China. Cultivated Land Quality Grade; Ministry of Agriculture and Rural Affairs of People’s Republic of China: Beijing, China, 2016. [Google Scholar]
  41. Ministry of Ecology and Environment of People’s Republic of China. Environmental Quality Standard for Soils; Ministry of Ecology and Environment of People’s Republic of China: Beijing, China, 2018. [Google Scholar]
  42. Yuan, X.; Shao, Y.; Li, Y.; Liu, Y.; Wang, Y.; Wei, X.; Wang, X.; Zhao, Y. Cultivated Land Quality Improvement to Promote Revitalization of Sandy Rural Areas Along the Great Wall in Northern Shaanxi Province, China. J. Rural Stud. 2022, 93, 367–374. [Google Scholar] [CrossRef]
  43. Shi, Y.; Duan, W.; Fleskens, L.; Li, M.; Hao, J. Study on Evaluation of Regional Cultivated Land Quality based on Resource-Asset-Capital Attributes and its Spatial Mechanism. Appl. Geogr. 2020, 125, 102284. [Google Scholar] [CrossRef]
  44. Kong, X.; Lal, R.; Li, B.; Liu, H.; Li, K.; Feng, G.; Zhang, Q.; Zhang, B. Fertilizer Intensification and Its Impacts in China’s HHH Plains. Adv. Agron. 2014, 125, 135–169. [Google Scholar]
  45. Kong, X.; Zhang, X.; Lal, R.; Zhang, F.; Chen, X.; Niu, Z.; Han, L.; Song, W. Groundwater Depletion by Agricultural Intensification in China’s HHH Plains, Since 1980S; Academic Press: Cambridge, MA, USA, 2016; Volume 135, pp. 59–106. [Google Scholar]
  46. Hu, K.; Huang, Y.; Li, H.; Li, B.; Chen, D.; White, R. Spatial Variability of Shallow Groundwater Level, Electrical Conductivity and Nitrate Concentration, and Risk Assessment of Nitrate Contamination in North China Plain. Environ. Int. 2005, 31, 896–903. [Google Scholar] [CrossRef]
  47. Jia, J.; Zhang, J.; Li, Y.; Koziol, L.; Podzikowski, L.; Delgado-Baquerizo, M.; Wang, G.; Zhang, J. Relationships between Soil Biodiversity and Multifunctionality in Croplands Depend on Salinity and Organic Matter. Geoderma 2023, 429, 116273. [Google Scholar] [CrossRef]
  48. Li, Y.; Wu, W.; Liu, Y. Land Consolidation for Rural Sustainability in China: Practical Reflections and Policy Implications. Land Use Policy 2018, 74, 137–141. [Google Scholar] [CrossRef]
  49. Di Gregorio, A.; Jansen, L. Land Cover Classification System (LCCS): Classification Concepts and User Manual; FAO: Rome, Italy, 2000; Volume 53, p. 179. [Google Scholar]
  50. Sun, X.; Kong, X.; Wen, L. Evaluation Index System of Cultivated Land Quality and its Development Trend based on Cultivated Land Elements. Chin. J. Soil Sci. 2019, 50, 739–747, (In Chinese with English Abstract). [Google Scholar]
  51. Kong, X.; Zhang, B.; Wen, L.; Hu, Y.; Lei, M.; Yao, J.; Xin, Y. Theoretical Framework and Research Trends of Cultivated Land Quality based on Elements-Process-Function. China Land Sci. 2018, 14–20, (In Chinese with English Abstract). [Google Scholar]
  52. Li, Q.; Guo, W.; Sun, X.; Yang, A.; Qu, S.; Chi, W. The Differentiation in Cultivated Land Quality between Modern Agricultural Areas and Traditional Agricultural Areas: Evidence from Northeast China. Land 2021, 10, 842. [Google Scholar] [CrossRef]
  53. Kong, X. Theory and Practice of Monitoring and Early Warning of Cultivated Land Quality System and Production Warning of Cultivated Land Quality System and Production Potential; China Agricultural University Press: Beijing, China, 2016. [Google Scholar]
  54. Jiang, G.; Wang, M.; Qu, Y.; Zhou, D.; Ma, W. Towards Cultivated Land Multifunction Assessment in China: Applying the “Influencing Factors-Functions-Products-Demands” Integrated Framework. Land Use Policy 2020, 99, 104982. [Google Scholar] [CrossRef]
  55. Drobnik, T.; Greiner, L.; Keller, A.; Grêt-Regamey, A. Soil Quality Indicators—From Soil Functions to Ecosystem Services. Ecol. Indic. 2018, 94, 151–169. [Google Scholar] [CrossRef]
  56. Jin, H.; Shi, D.; Lou, Y.; Zhang, J.; Ye, Q.; Jiang, N. Evaluation of the Quality of Cultivated-layer Soil based on Different Degrees of Erosion in Sloping Farmland with Purple Soil in China. Catena 2021, 198, 105048. [Google Scholar] [CrossRef]
  57. Qian, F.; Wang, W.; Wang, Q.; Lal, R. Implementing Land Evaluation and Site Assessment (U.S. LESA System) in Farmland Protection: A Case Study in Northeastern China. Land Degrad. Dev. 2021, 32, 2437–2452. [Google Scholar] [CrossRef]
  58. Wen, L.; Kong, X.; Xin, Y.; Sun, X. Evolution of Cultivated Land Quality Connotation and its Recognition. J. China Agric. Univ. 2019, 24, 156–164, (In Chinese with English Abstract). [Google Scholar]
  59. Sun, X.; Kong, X.; Zhang, Q.; Wen, L.; Liao, Y. Evaluation of Inherent Quality and Dynamic Quality of Cultivated Land based on Comprehensive Characteristics of Indexes. Trans. Chin. Soc. Agric. Eng. 2020, 36, 254–265, (In Chinese with English Abstract). [Google Scholar]
  60. Hasson, F.; Keeney, S.; McKenna, H. Research Guidelines for the Delphi Survey Technique. J. Adv. Nurs. 2000, 32, 1008–1015. [Google Scholar]
  61. Tobler, W. A Computer Movie Simulating Urban Growth in the Detroit Region. Econ. Geogr. 1970, 46, 234–240. [Google Scholar] [CrossRef]
  62. Ma, R.; Ma, R.; Han, D.; Yun, W. Construction of Cultivated Land Quality Evaluation System in Provincial Level based on Multilevel Indicators. Trans. Chin. Soc. Agric. Eng. 2018, 34, 249–257, (In Chinese with English Abstract). [Google Scholar]
  63. Chen, Z.; Gong, A.; Zhang, L.; Wang, J.; Xiang, B.; Ning, D. Construction of the Quality Regulation System for Provincial Scale Slope Farmland based on Quality Evaluation. Trans. Chin. Soc. Agric. Eng. 2021, 37, 136–145, (In Chinese with English Abstract). [Google Scholar]
  64. Tesfahunegn, G.; Tamene, L.; Vlek, P. A participatory soil quality assessment in Northern Ethiopia’s Mai-Negus catchment. Catena 2011, 86, 1–13. [Google Scholar] [CrossRef]
  65. Li, Y.; Ma, J.; Li, Y.; Jia, Q.; Shen, X.; Xia, X. Spatiotemporal variations in the soil quality of agricultural land and its drivers in China from 1980 to 2018. Sci. Total Environ. 2023, 892, 164649. [Google Scholar] [CrossRef] [PubMed]
  66. Qian, F.; Lal, R.; Wang, Q. Land Evaluation and Site Assessment for the Basic Farmland Protection in Lingyuan County, Northeast China. J. Clean. Prod. 2021, 314, 128097. [Google Scholar] [CrossRef]
  67. Marion, L.; Schneider, R.; Cherubin, M.; Colares, G.; Wiesel, P.; Costa, A.; Lobo, E. Development of a soil quality index to evaluate agricultural cropping systems in southern Brazil. Soil Tillage Res. 2022, 218, 105293. [Google Scholar] [CrossRef]
  68. Nabiollahi, K.; Taghizadeh-Mehrjardi, R.; Kerry, R.; Moradian, S. Assessment of soil quality indices for salt-affected agricultural land in Kurdistan Province, Iran. Ecol. Indic. 2017, 83, 482–494. [Google Scholar] [CrossRef]
  69. Duan, D.; Sun, X.; Liang, S.; Sun, J.; Fan, L.; Chen, H.; Xia, L.; Zhao, F.; Yang, W.; Yang, P. Spatiotemporal Patterns of Cultivated Land Quality Integrated with Multi-Source Remote Sensing: A Case Study of Guangzhou, China. Remote Sens. 2022, 14, 1250. [Google Scholar] [CrossRef]
  70. Samaei, F.; Emami, H.; Lakzian, A. Assessing soil quality of pasture and agriculture land uses in Shandiz county, northwestern Iran. Ecol. Indic. 2022, 139, 108974. [Google Scholar] [CrossRef]
  71. Bagnall, D.; Rieke, E.; Morgan, C.; Liptzin, D.; Cappellazzi, S.; Honeycutt, W. A minimum suite of soil health indicators for North American agriculture. Soil Secur. 2023, 10, 100084. [Google Scholar] [CrossRef]
  72. Fierer, N.; Wood, S.; Mesquita, C. How microbes can, and cannot, be used to assess soil health. Soil Biol. Biochem. 2021, 153, 108111. [Google Scholar] [CrossRef]
  73. Schiefer, J.; Lair, G.; Blum, W. Indicators for the definition of land quality as a basis for the sustainable intensification of agricultural production. Int. Soil Water Conserv. Res. 2015, 3, 42–49. [Google Scholar] [CrossRef] [Green Version]
  74. Chen, Y.; Zhu, M.; Lu, J.; Zhou, Q.; Ma, W. Evaluation of Ecological City and Analysis of Obstacle Factors under the Background of High-quality Development: Taking Cities in the Yellow River Basin as Examples. Ecol. Indic. 2020, 118, 106771. [Google Scholar] [CrossRef]
  75. Tang, X.; Pan, Y.; Liu, Y. Analysis and Demonstration of Investment Implementation Model and Paths for China’s Cultivated Land Consolidation. Appl. Geogr. 2017, 82, 24–34. [Google Scholar] [CrossRef]
  76. Zhou, Y.; Li, Y.; Xu, C. Land Consolidation and Rural Revitalization in China: Mechanisms and Paths. Land Use Policy 2020, 91, 104379. [Google Scholar] [CrossRef]
  77. Duan, J.; Ren, C.; Wang, S.; Zhang, X.; Reis, S.; Xu, J.; Gu, B. Consolidation of Agricultural Land can Contribute to Agricultural Sustainability in China. Nat. Food 2021, 2, 1014–1022. [Google Scholar] [CrossRef] [PubMed]
  78. Jiang, G.; Zhang, R.; Ma, W.; Zhou, D.; Wang, X.; He, X. Cultivated Land Productivity Potential Improvement in Land Consolidation Schemes in Shenyang, China: Assessment and Policy Implications. Land Use Policy 2017, 68, 80–88. [Google Scholar] [CrossRef]
  79. Liu, L.; Xu, Y.; Zhu, S.H.; Gao, Y.; Zheng, X.Q. Meta-analysis on the responses of soil bulk density to supplementation of organic fertilizers in croplands in China. J. Agric. Resour. Environ. 2020, 38, 867–873, (In Chinese with English Abstract). [Google Scholar]
  80. Zhang, Z.; He, P.; Hao, X.; Li, L. Long-term Mineral Combined with Organic Fertilizer Supports Crop Production by Increasing Microbial Community Complexity. Appl. Soil Ecol. 2023, 188, 104930. [Google Scholar] [CrossRef]
  81. Lu, H.; Xie, H.; Lv, T.; Yao, G. Determinants of Cultivated Land Recuperation in Ecologically Damaged Areas in China. Land Use Policy 2019, 81, 160–166. [Google Scholar] [CrossRef]
Figure 1. Location of the study area and distribution of soil sampling points in Quzhou County.
Land 12 01552 g001
Figure 2. Theoretical framework for cultivated land quality.
Land 12 01552 g002
Figure 3. Logic diagram of the calculation process of the cultivated land quality index.
Land 12 01552 g003
Figure 4. The evaluation results of cultivated land quality in Quzhou County.
Land 12 01552 g004
Figure 5. Heat map of different quality grades of cultivated land between the evaluation results of this research and the national evaluation results of utilization quality.
Land 12 01552 g005
Figure 6. Difference between the index results of this research and the national utilization evaluation index of cultivated land in Quzhou County.
Land 12 01552 g006
Figure 7. Scatter plot of Moran’s I of global spatial autocorrelation of the CLQI in Quzhou County.
Land 12 01552 g007
Figure 8. Local spatial autocorrelation map of the cultivated land quality index in Quzhou County.
Land 12 01552 g008
Figure 9. Average and maximum values of obstacle degree of cultivated land quality indicators in Quzhou County.
Land 12 01552 g009
Table 1. Indicators and their weights for the evaluation of CLQ in Quzhou County.
DimensionsIndicatorsWeights
Climate condition≥10 °C accumulated temperature
Annual average precipitation
Topographic characteristicTopographic position0.300
Field slope0.700
Soil propertyProfile characteristicsSoil profile constitution0.095
Effective soil thickness0.102
Barrier layer depth0.018
Physical, chemical, and biological propertiesSoil bulk density0.027
Topsoil texture0.134
Soil organic matter0.129
pH0.100
Soil salinization0.069
Soil microbial biomass carbon0.078
Nutrient statusTotal nitrogen0.090
Available phosphorus0.072
Active potassium0.086
Farming statusIrrigation guarantee rate0.439
Drainage condition0.179
Field road accessibility0.268
Field regularity0.114
Environmental conditionGroundwater depth
Table 2. Classification standards of evaluation indicators for the quality of cultivated land in Quzhou County.
DimensionsIndicatorsScore
1009080706050403010
Topographic characteristicTopographic positionAlluvial plain, piedmont Interfluvial lowland Low hillside, low hillock
Field slope≤2°>2°–5°5°–8° >8°–15° >15°–25°>25°
Profile characteristicsSoil profile constitutionLoam entire loam, loam/sand/loamClay
Loam/clay/loam
Sand/clay/sand, loam/clay/clay, loam/sand/sandSand/clay/clayClay/sand/clay, entire clay,
clay/sand/sand
Entire sand, entire gravel
Barrier layer depth/cm>60~90 >30~60 ≤30
Effective soil thickness/cm>150>100~150 >60~100 >30~60 ≤30
Physical, chemical, and biological propertiesSoil bulk density/(g/cm3)>1~1.25≤1, >1.25~1.35 >1.35~1.45 >1.45~1.55 >1.55
Topsoil textureLoamCay Sand Gravel
Soil organic matter/(g/kg)>40>30~40>20~30>10~20>6~10≤6
pH6.0~7.95.5~6.0, 7.9~8.55.0~5.5, 8.5~9.0 4.5~5.0 ≤4.5, 9.0~9.5 >9.5
Soil salinizationNo salinizationSlight salinization Moderate salinization Severe salinization
Soil microbial biomass carbon>300 100–200 ≤100
Nutrient statusTotal nitrogen/(g/kg)>2>1.5~2>1~1.5>0.75~10.5~0.75≤0.5
Available phosphorus/(mg/kg)>40>20~40>10~20>5~103~5≤3
Active potassium/(mg/kg)>200>150~200>100~150>50~10030~50≤30
Farming statusIrrigation guarantee rateFully satisfiedBasically satisfied Generally satisfied Dissatisfied
Drainage conditionsFully satisfiedBasically satisfied (1–2 days of accumulated water in high flow year) Generally satisfied (2–3 days of accumulated water in high flow year) Dissatisfied (waterlogging more than 3 days in a year)
Field road accessibility/%>80 >60~80 >40~60 ≤40
Field regularitySHAPE ≤ 22 < SHAPE ≤ 4 4 < SHAPE ≤ 6 SHAP > 6
Environmental conditionGroundwater depth/(m)≤5>5~10>10~15>15~20 >20~25 >25
Table 3. Grading of groundwater depth for the construction of the “1 + X” model.
IndicatorClassificationScoreDepth (m)
Groundwater depthLevel 10≤5
Level 2−0.02>5~10
Level 3−0.04>10~15
Level 4−0.06>15~20
Level 5−0.08>20~25
Level 6−0.10>25
Table 4. The area, proportion, and distribution of the obstacle factors of cultivated land quality in Quzhou County.
IndicatorsArea (km2)Proportion (%)Distribution Region of County
Soil profile constitution147.9127.21North-central, and southeastern
Irrigation guarantee rate81.1914.94Sporadic distribution
Groundwater depth44.248.14Southeastern
Soil microbial biomass carbon43.728.04Southeastern
Field road accessibility8.081.49South-central
Total nitrogen6.141.13Southeastern
Soil organic matter4.480.82Sporadic distribution
Field slope1.110.20Sporadic distribution
Disclaimer/Publisher’s Note: The statements, opinions and data contained in all publications are solely those of the individual author(s) and contributor(s) and not of MDPI and/or the editor(s). MDPI and/or the editor(s) disclaim responsibility for any injury to people or property resulting from any ideas, methods, instructions or products referred to in the content.

