Abstract
Water and soil resources are the key elements required to maintain the stability and sustainable development of oases in inland drylands. This study takes oases in Xinjiang as an example, and reveals the spatial and temporal distribution characteristics of oases across Xinjiang, as well as the dynamic migration and transformation process of oases and the mutual influence of human activities on oasis resources, through a combination of land movement and attitude indicators, use of a gravity model, and Geodetector. The results show that: (1) the area containing the oases in the study has expanded, increasing by 24.0% between 1990 and 2020; (2) both artificial oases (AO) and natural oases (NO) were tilted in a northeast–southwest direction, with the center point of AOs moving slightly to the northeast, and the centripetal force and dispersion degree did not change significantly; the center point of NO moved significantly to the northeast, and the dispersion degree weakened, showing spatial convergence; (3) cultivated land and grassland were the main land types of oasis evolution, and their contribution to evolution was over 70%; and (4) the Geodetector results show that the three main factors driving the evolution of oases were vegetation cover, population density, and GDP. The research results have practical implications for land-use management planning and ecological environmental protection in arid zones.
1. Introduction
Oases, as the core of the ecosystem and important places for human beings, are the main areas for human socioeconomic activities such as agriculture and industrial production within arid zones [1]. The proportion of oasis areas in inland river basins is usually only about 5% of the area, but they gather more than 95% of the population and more than 90% of the socioeconomic wealth [2]. Oases are the core areas of economic output of the whole arid zone watershed and the areas with the most frequent interaction with humans [3]. Oases in China have experienced massive expansion due to rapid population growth, sustained economic development, and climate change [4,5], which has also put tremendous pressure on oasis ecosystems [6]. This has greatly constrained the sustainable development of oases, and the risk of oasis shrinkage is increasing, which has drawn more and more scholars’ attention to the conservation and restoration of oases [7]. The process of oasis change and the drivers of change are the basis and prerequisites to support the study of oasis conservation and restoration. Therefore, studying the spatial and temporal changes of oases and their drivers is of reference value and practical significance for co-ordinating human–land relations, protecting arable land, and formulating ecological restoration policies.
The evolution of oases is most directly manifested by changes in land cover types [8]. Based on the study of land-cover-type change, one can investigate the rate and scale of change in specific land types, as well as the interconversion relationship with other land types [9,10,11]. To further explore the trajectory of movement during oasis migration, the center of gravity model and the standard deviation ellipse (SDE) model were introduced [12]. Xuning explored the evolution of the spatial structure of oasis economy through the center of gravity model and indicator system. It was found that the economic center of gravity in the Tarim River basin moves from the source stream to the middle stream, and its change trajectory follows the linear rate law [13]. Yuding explored the oasis migration evolution process in the northwest arid zone through the center of gravity model and pointed out that the land-use types that contribute more in the process of oasis-to-desert transformation are grassland and woodland [14]. Jinping He revealed the spatial and temporal evolution of oases in the Kaidu-Kongchu River basin in the past 30 years by means of the center of gravity model, and used principal component analysis to find that human activities are the main factors accelerating oasis migration [15].
To further explore the drivers in the migration process, traditional methods include correlation analysis [16], principal component analysis [17], regression analysis [18], etc. However, these methods do not correspond drivers to spatial relationships, while geographic probes can effectively solve this problem and have many applications in environment, geology, and diseases [6,19,20,21]. For example, Yizhen Zhao found that elevation, distance from cities, and population were the main factors influencing land-use change in Mao County, Sichuan, China, by means of a geographic probe [22]. Yanan Liu analyzed the degree of influence of nine drivers on 12 types of land-use change in Henan Province, China, by means of a geographic probe, and found that anthropogenic factors were the main factors of land conversion for construction [23].
Xinjiang (XJ) is located in an inland arid region with a vast area, and is an important part of the “One Belt, One Road” construction. With the rapid economic development of Xinjiang, the landscape pattern of oases in the watershed has also significantly changed. Some studies on Xinjiang oases have been conducted [24,25]. For example, Ke He analyzed the oasis area in Xinjiang from 1972 to 2015 by examining remote sensing image data, and found that the area share increased from 8.18% to 9.93%; combined with the statistical results, he found that the warm and wet climate changes, as well as policy, population, socio-economic, and technological factors, became the driving factors of land-use changes in Xinjiang [26]. Li Song took 18 oasis cities in Xinjiang from 1995 to 2010 as research objects and found that the land-use landscape diversity in Xinjiang oasis cities showed an increasing trend, and the land-use structure tended to be complex and multivariate. Principal component analysis was used to find that land economic input efficiency and urban expansion became the main factors influencing the evolution of land-use landscapes in Xinjiang oasis cities [27]. Qi used satellite remote sensing and GIS to assess the dynamics of land-use change in Jinta Oasis, a typical oasis in the temperate arid zone of northwest China, from 1988 to 2003, and explored the interaction between these changes and the oasis environment. The results showed that arable, urban, and wasteland areas increased, while grassland and woodland areas decreased rapidly [28]. Using a geo-weighted regression model, Mireguli Ainiwaer recorded that the rate of groundwater decline was significantly higher in the Aksu oasis than in the oasis–desert transition zone. The expansion of arable land area and the rapid decrease in shrub cover is one of the main reasons for this phenomenon [29].
These studies have provided some basis for revealing the evolutionary characteristics of oases in Xinjiang and their influencing factors. However, existing studies have focused on ecological quality [30,31], service function [32], carrying capacity [33], and heat island effect [34] within the oasis. The consideration of the driving factors behind the oasis has been neglected. There are still deficiencies in the spatially analytical expression of the evolutionary characteristics of oases, and the guidance for watershed management policy formulation and planning practice is not strong. To address this problem, this study uses Landsat remote sensing data from 1990 to 2020 to study different regional subdivisions of Xinjiang, taking oases in the Xinjiang plain area as research objects. The study contains the following aims: (1) to measure the spatial and temporal changes of oasis evolution in Xinjiang from 1990 to 2020 through dynamic attitude and contribution indicators, and to explore the interconversion relationship between artificial oases (AO) and natural oases (NO); (2) to refine the oasis migration process through the center of gravity migration model and standard deviation ellipse analysis; (3) to analyze the driving force of oasis evolution process through geographic-probe-selected indicators, and to explore its spatial and temporal changes; and (4) to explore the intrinsic drivers of oasis evolution through geographic probes, and to reveal the dominant picture of oasis evolutionary characteristics in Xinjiang, China. The study is expected to provide a reference for integrated watershed management and oasis conservation in the arid zone.
2. Materials and Methods
2.1. Study Area
The study area is Xinjiang (Figure 1), with a total area of 1.66 million km2, located in the hinterland of Eurasia, with a geographical location of 34°25′ N–48°10′ N, 73°40′ E–96°18′ E. It is bordered by eight countries, including Russia, Kazakhstan, Tajikistan, Kyrgyzstan, Afghanistan, Mongolia, Pakistan, and India. Since Xinjiang is far from the sea, it has a typical temperate continental arid climate with a large temperature difference, sufficient sunshine, annual average precipitation of about 150 mm, low precipitation and high evaporation, and a dry climate. The Tianshan Mountains stretch across the center of Xinjiang, dividing the region into northern and southern halves. South of the Tien Shan is called South Xinjiang (SXJ), north of the Tien Shan is called North Xinjiang (NXJ), and the Hami and Turpan basins are called East Xinjiang (EXJ).
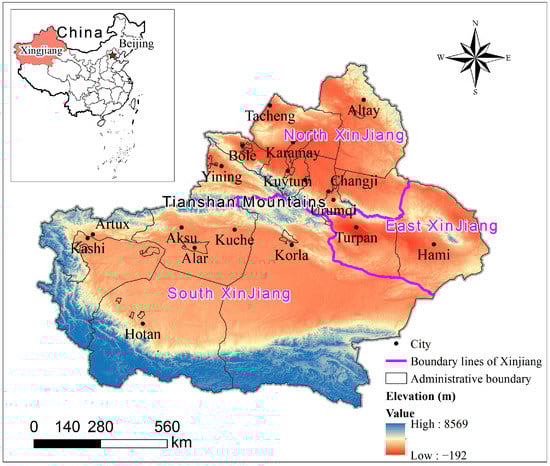
Figure 1.
Location of the study area.
2.2. Data Sources
The data used in this study are shown in Table 1, where slope data are generated by ArcGIS 10.2 software using DEM data. The land-use/cover types of oases in the study area were classified according to the mechanism of oasis formation [35]. Considering the characteristics of the natural environment of the arid zone, the study area was divided into deserts, mountains, and oases based on the oasis scoping method [1,4]. The mountainous areas are over 1500 m above sea level. Oases are categorized into AO and NO. NO land-use types in the study area include forested, open forest, shrubland, high cover grassland, medium cover grassland, lakes, beaches, and swamps, and AOs include paddy fields, dry land, other forested land, construction land, reservoirs, and canals.

Table 1.
Description of the data used in this study.
2.3. Methodology
2.3.1. Oasis Land-Use Type Change Dynamic Attitude Indicators
The single land-use dynamic attitude is an indicator of the rate and magnitude of change in different land-use types over a certain period of time and using the following formula [36]:
where K is the rate of change in a land-use type within a certain time period in the study area (%), Si and Sj are the areas of land-use types at the beginning and end of monitoring (km2), T is the study period, and K is the annual rate of change of a land-use type in the study area (%) when the period of T is one year.
2.3.2. Contribution Rate Indicator
Different land-use types contribute differently to the oasis change during the transformation of oasis and desert. In this study, we define the oasis expansion contribution rate, Pe, and oasis decline contribution rate, Pd, to assess the contribution of each land-use type in the process of oasis expansion (or decline). For land-use type i, the oasis expansion contribution rate, Pe,i, and the oasis decline contribution rate, Pd,i, [18] are, respectively:
where ΔUin is the total area converted from desert to oasis during the study time period; ΔUin,i is the area converted from desert to land-use type i during the study time period; ΔUout is the total area converted from oasis to desert during the study time period; and ΔUout,i is the area of land-use type i converted to desert during the study time period.
The combined oasis contribution, Pc, is defined to describe the overall contribution of a land-use type to the oasis change within the study period. For land-use type i, the oasis integrated contribution rate, Pc,i, is defined as:
As oases and deserts are transformed, AO and NO are also transformed into each other. The analysis of the process of AO and NO transformation can help to explore the causes of oasis structure change and interaction relationship, and further understand the influence of human activities in the process of oasis migration. The NO conversion contribution, Pn, and AO conversion contribution, Pa, can be defined as, respectively [37]:
where ΔUna is the area of natural oasis transformed into artificial oasis during the study period, and ΔUan is the area of artificial oasis transformed into natural oasis during the study period. Pn, in the physical sense, represents the percentage of natural oasis transformed into artificial oasis in the overall process of mutual transformation. Pa represents the percentage of artificial oases transformed into natural oases in the overall process. Pa represents the percentage of the conversion from artificial to natural oases in the overall process. When Pn ≥ 50 indicates that the conversion of natural oases to artificial oases is the dominant conversion direction; when Pn < 50, it indicates that the conversion of artificial oases to natural oases is the dominant conversion direction. All indicators of oasis contribution are explained in Table 2.
Table 2.
Illustrative table of oasis contribution rate indicators.
2.3.3. Standard Deviation Ellipse
The standard deviation ellipse model can spatially represent the spatial and temporal migration trajectory and distribution pattern of oasis land resources. The model is mainly composed of the spatial center of gravity co-ordinates (Xi, Yi), the offset angle θ, and the standard deviation of the major axis (x-axis) and the minor axis (y-axis). The model can visually reflect the general outline of point space organization. Parameters such as offset angle θ and migration distance D can also reflect the spatial change process of the overall region; the larger the θ and the longer the D, the more serious the spatial imbalance of the region. The x-axis reflects the dominant distribution direction of the data, and the y-axis reflects the distribution range of the data; the shorter the y-axis, the stronger the centripetal force presented by the data, and, vice versa, the greater the dispersion of the data. The larger the difference ratio between the two axis distances (the larger the flatness) indicates that the directionality of the data is more significant, and, vice versa, the directionality is not significant.
The center of gravity co-ordinates of each element are brought into the spatial center of gravity migration in Equation (7), and the spatio-temporal migration trajectory of the center of gravity of soil and water resources is plotted by the distance (D) and the offset angle (θ) of the center of gravity migration of each element:
where D is the distance of center of gravity migration (km), and (Xt1, Yt1) and (Xt2, Yt2) represent the co-ordinates of center of gravity at time t1 and t2, respectively. C is a constant that represents the coefficient of conversion from earth latitude and longitude co-ordinates (°) to plane distance (km) and takes the value of 111.111.
2.3.4. Geodetector
Geodetector is a statistical method based on the theory of spatial statistics and spatial autocorrelation. It can be used to investigate spatial anisotropy, reveal the magnitude and significance of the influence of each driver, detect the strength of interaction between factors, and perform risk detection. In this study, we used the factor detection tool, interaction detection tool, and risk detector to analyze the drivers of oasis migration changes in the region [38].
- (1)
- Factor detection: This is used to detect the spatial variability of the dependent variable Y (oasis change area) and the magnitude of the independent variable X (each natural and anthropogenic factor) on the spatial variability of Y, measured by the q value [19], as follows.
In Equation (8), N is the number of sample units in the whole study area, σ2 is the discrete variance of Y values in the whole area, h is the partition of variable Y or factor X, and L is the number of partitions, i.e., the number of sub-regions. q has a value range of [0, 1], and the larger its value, the stronger the explanatory power and contribution of the factor to the spatial differentiation of surface temperature production; the weaker its value, the opposite occurs.
- (2)
- Interaction detection: This identifies the interaction between different independent variables X, reflecting whether the influence of two factors on Y when acting together is correlated or independent, and derived by q-value [q(X1∩X2)], as shown in Table 3.
Table 3. Driving force magnitude criterion interval and interaction type.
3. Results
3.1. Spatial and Temporal Trends in Oasis Size
The oasis area of the whole territory showed an overall increasing trend during the period of 1990–2020 (Figure 2a), from 13.95 × 10⁴ km2 in 1990 to 17.32 × 10⁴ km2 in 2020 (an increase of 24.0% during the past 30 years), with an annual growth rate of 0.8% (Figure 2b). Among them, the AO area increased from 6.18 × 10⁴ km2 in 1990 to 10.08 × 10⁴ km2 in 2020 (an increase of 63.1% during the past 30 years), with an annual growth rate of 2.1%. The NO area showed a trend of annual decrease, from 7.77 × 10⁴ km2 in 1990 to 7.24 × 10⁴ km2 in 2020 (a decrease of 6.8% during the past 30 years).
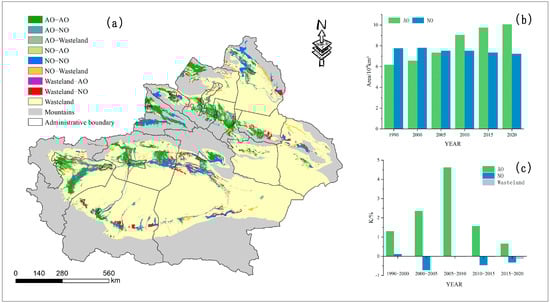
Figure 2.
Oasis change in Xinjiang from 1990 to 2020 (a), oasis dynamic attitude (b), and oasis area change (c).
The dynamic change process of the oasis can be further revealed by the dynamic attitude (K) analysis of the above land types. The results show (Figure 2c) that the kinetic attitudes of all land types in the study area changed significantly from 1990 to 2020, with AO kinetic attitudes increasing continuously between 1990 and 2010, reaching a peak of 4.62% between 2005 and 2010, and then decreasing to a minimum of 0.65% between 2015 and 2020. The rate of NO degradation accelerated during the period of 1990–2000, reached a maximum negative value of −0.72% during 2000–2005, was moderated during 2005–2010, and then continued to degrade during 2010–2020.
3.2. Analysis of the Contribution of Different Land Types to Oasis Evolution
The oasis expansion contribution rate Pe, the oasis decline contribution rate Pd, and the combined oasis contribution rate Pc were calculated separately for each land-use type in the study area. Three major land types, namely, cropland, forest land, and grassland, were selected to calculate the changes in the contribution rate to oases at different time periods during the period of 1990–2020 (Table 4). The land-use types that dominate the spatial and temporal migration of oases in the study area are cropland and grassland, and the combined contribution of these two land types is above 70% in all time periods and reaches above 80% after the year 2000. This indicates that most of the transition between oasis and desert is related to cropland and grassland. The combined contribution of cropland compared with 1990–2000 shows a significant increase after the year 2000 and then decreases year by year, whereas the combined contribution of forest land decreases until 2005 and then increases year by year.
Table 4.
Contribution of different types of land-to-oasis evolution in the study area.
The Pn and Pa values of the study area during the period of 1990–2020 were calculated as shown in Table 5. The main conversion direction of the oasis in the study area is the conversion of NO to AO, and the conversion of NO to AO is at more than 50% in all periods. The peak was reached during the period of 2000–2005, when 89.26% of NO was converted to AO. The amount of NO converted to AO was 84.47% during 2005–2010, and the percentage of NO converted to AO started to decrease until 2015–2020.
Table 5.
AO and NO conversion contribution ratio.
3.3. Analysis of Oasis Migration Directionality Results
The AO and NO standard deviation ellipses (SDE) were obtained by calculating the 1990–2020 AOSDE and NOSDE (Figure 3a and Figure 4a). The results show that the AOSDE varies slowly over 30 years, with an overall contraction and a shift of the center of gravity to the northeast. The NOSDE varies more strongly than the AOSDE, with an obvious directional shift, an overall shift to the northeast, and a spatial expansion and clustering.
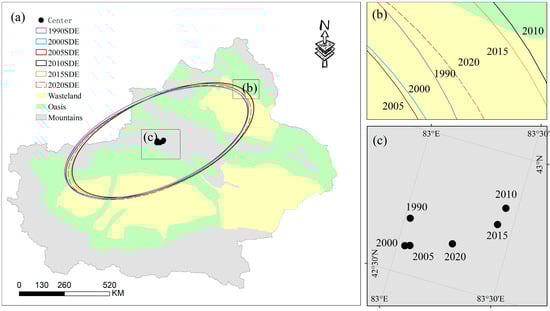
Figure 3.
Xinjiang AOSDE (a,b) and SDE center point (c).
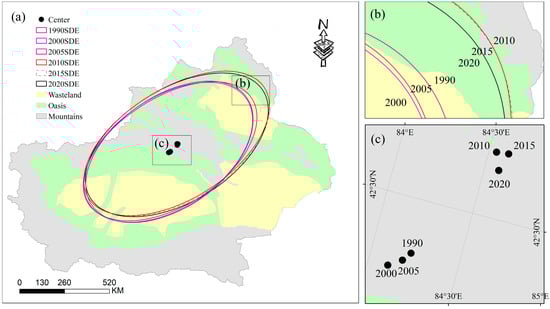
Figure 4.
Xinjiang NOSDE (a,b) and SDE center point (c).
The SDE areas of both AO and NO show a trend of increasing and then gradually decreasing, and the corresponding x-axis and y-axis fluctuate at low levels. The y-axis of AO shows a fluctuating trend of “decreasing–increasing–decreasing” from 1990 to 2020 (Figure 3b). The y-axis of NO shows a decreasing trend from 1990 to 2000 and an increasing trend from 2005 to 2015 (Figure 4b), which indicates that the centripetal force of AO decreases and the dispersion weakens from 1990 to 2015. The center point of NO is tilted in the southeast–northwest direction (Figure 4c), and the displacement of the center point is significant in 2005–2010, showing a significant northeastward migration. The above results indicate that after 2000, the agricultural production activities and urbanization within the AO were more intense compared with those before 2000, and the NO center migrated from SXJ to NXJ.
The standard deviation ellipses were obtained for the variation in AO and NO areas in different years for each region in Xinjiang (Figure 5a and Figure 6a), and the artificial oasis standard deviation ellipses (AOSDE) showed a more obvious directionality in NXJ, EXJ, and SXJ (Figure 5c,d,f), with the most obvious in NXJ and SXJ, and the AO in SXJ had a northwest–southeast main axis tilt. In terms of the amount of area change, the increase in AO area is mostly concentrated in Aksu and Korla, thus showing the migration of the center point to the northeast (Figure 5b), with increased centripetal force, weakening dispersion year by year, and spatial aggregation. The EXJ, on the other hand, has an east–west tilted main axis, and the area increase area is mostly concentrated in the Hami region, thus showing a directional migration of the center point to the east (Figure 5e). The NXJ has a northeast–southwest tilted main axis, and the increase area is mostly concentrated in the Urumqi to Kuitun region on the northern slope of the Tianshan Mountains, thus showing a significant shift of the center point to the northeast (Figure 5g), but not showing a more pronounced change in the SDE area.
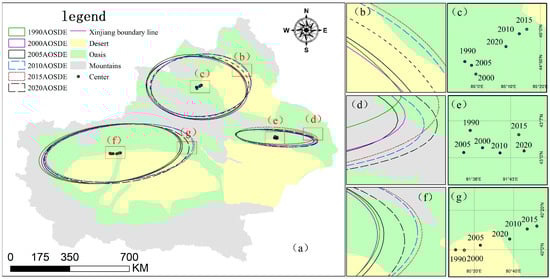
Figure 5.
Changes in AOSDE migration in Xinjiang (a), NXJ (b,c), EXJ (d,e), and SXJ (f,g).
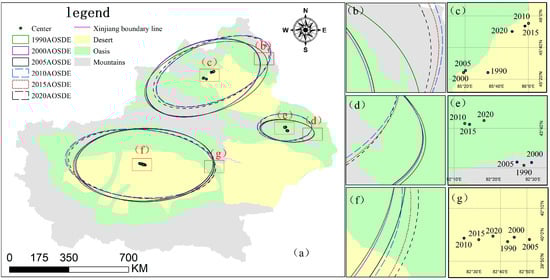
Figure 6.
Changes in NOSDE migration in Xinjiang (a), NXJ (b,c), EXJ (d,e), and SXJ (f,g).
The natural oasis standard deviation ellipse (NOSDE) shows a more pronounced directionality in SXJ and NXJ (Figure 6a). Oasis migration in NXJ is tilted to the northeast with a northeast–southwest axis (Figure 6b). The center point better illustrates this current situation. It has migrated substantially to the northeast since 2000 (Figure 6c). The direction of NOSDE change in EXJ is east (Figure 6d), and the overall migration direction of the center point is mainly east (Figure 6e). The NO in NXJ is tilted to the northeast–southwest main axis, and the boundary line of SDE extends to the southeast year by year (Figure 6f); the center point shows the same trend (Figure 6g).
3.4. Analysis of Oasis Migration Driving Mechanism
3.4.1. Drive Factor Detection
Oasis migration change is a dynamic process, which is the result of the superposition of natural, social, and ecological factors, and the driving factors of its change mainly include natural and socio-economic factors [39]. In this paper, both natural environment and socio-economic aspects are considered, and eight driving factors are selected, namely, primary industry output value (X1), distance from town (X2), GDP (X4), population density (X7), precipitation (X3), slope (X5), elevation (X6), and NDVI (X8). A 5 km × 5 km size evaluation cell grid was created based on the GIS platform, and the Xinjiang oasis was divided into 21,113 sample cells. The amount of area change in the oasis in each sample cell from 1990 to 2020 was used as the dependent variable, and the single-factor driving force was calculated for each driving factor in the area using a geographic probe (Table 6).
Table 6.
Results of one-way detection of spatial and temporal changes in the oasis.
The results showed that all the influencing factors passed the F < 0.05 test, and the degree of influence of each factor on the spatial distribution of AO migration was ranked from strong to weak as follows: NDVI (0.624) > population density (0.332) > GDP (0.322) > distance to town (0.156) > precipitation (0.088) > slope (0.087) > value added from primary industry (0.072) > elevation (0.044). Among the natural factors, NDVI has the highest contribution and is the main natural factor influencing the change in AO; precipitation and slope are the secondary influencing factors; and elevation has the weakest influence on AO. Among the anthropogenic factors, the contribution of population density was the highest.
The influence of each factor on the spatial distribution of NO migration was ranked from strong to weak: NDVI (0.407) > population density (0.114) > GDP (0.109) > slope (0.068) > distance to town (0.057) > precipitation (0.051) > added value of primary industry (0.028) > elevation (0.014). The highest contribution of NDVI among the natural factors was the main natural factor influencing the variation of NO; slope had a higher degree of influence compared with precipitation. Elevation had the weakest influence on NO. Among the anthropogenic factors, population density had the highest contribution, whereas GDP and distance from town ranked second and third, respectively.
3.4.2. Driving Factor Interaction Detection
The results of the interaction show that the influence of the two-factor interaction is significantly higher than that of the single factor, and the interaction results of any two factors show a non-linear enhancement. In the interaction of drivers of NO change (Figure 7a), the interaction drivers with greater explanatory power are NDVI/slope (0.449), NDVI/precipitation (0.436), and NDVI/population density (0.436). Among the interactions of the drivers of AO (Figure 7b), the explanatory power of the interaction between GDP, population density, and NDVI is much greater than that of other factors, with NDVI/population density (0.668) having the greatest explanatory power, followed by NDVI/GDP (0.652) and NDVI/slope (0.650). The drivers with lower explanatory power in the single factor had significantly higher q-values after interacting with other drivers, and the drivers did not independently influence each other, but had some connection. The results of the interaction further verified that anthropogenic factors are the main drivers of spatial and temporal changes in AO, and, on this basis, interact with other factors to jointly influence spatial and temporal changes in Xinjiang Oasis.
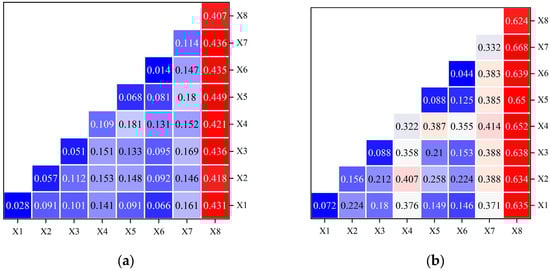
Figure 7.
The results of two-factor interaction detection of spatio-temporal variation in NO (a) and two-factor interaction detection of spatio-temporal variation in AO (b).
4. Discussion
4.1. Influence of Natural Factors on the Process of Oasis Migration
In the process of oasis evolution, changes in climate, hydrology, and other natural factors often lead to changes in the volume of water resources [40]. A certain volume of water resources can only maintain a certain area of oasis under certain conditions; the volume of water resources determines the size of the oasis, and increases or decreases in the volume of water resources will lead to the expansion and decline of the oasis, respectively [41]. Therefore, changes in climate, hydrology, and other natural factors reflect, to some extent, the evolutionary process of oases. In the context of the current change in global climate, the climate of northwest China changed from warm-dry to warm-wet after the 1970s [42], and both temperature and precipitation in the upper mountainous regions showed an upward and increasing trend with global warming. The rate of temperature increase was greater than the global average [43], and with the increase in temperature, precipitation in the mountainous regions increased, glacial meltwater increased, and river runoff from the mountains also increased [44]. The increase in outflow runoff directly leads to an increase in the amount of water available to the oasis, which supports the expansion of the oasis to some extent.
4.2. Impact of Human Activities on Oasis Migration Processes
Human activities act directly on oases and are the most active factors in their migration changes [45]. With the development of science and technology, the influence of human activities has gradually increased and, to a large extent, directly or indirectly determines the direction of oasis evolution. Anthropogenic factors influence the occurrence and development of the oasis evolution process mainly from the following aspects:
- (1)
- Population growth: the population of Xinjiang grew rapidly between 1990 and 2020, from 15.29 million in 1990 to 25.85 million in 2020, which is an increase of nearly 10.56 million, and the growth rate was also at the forefront of the country, with an average annual growth rate of 352,000 [46]. The increase in population has led to an increase in the area of arable land, which has led to the expansion of artificial oases with mainly arable land. At the same time, the increase in population also makes the area of land for urban residents increase year by year, and the area of artificial oases further increases;
- (2)
- Water and soil resources utilization status and mode. Oases comprise a combination of water, soil, air, and life in arid areas, where the utilization of water and soil resources determines the local microclimate and plant growth conditions, and the status and manner of utilization of water and soil resources have a vital relationship with the evolution of oases [47]. By establishing a protective forest system combining trees, irrigation, and grasses, water-saving irrigation, and other active means of water and soil use, people have been able to consolidate the existing oasis while giving conditions for oasis expansion. However, it also brings certain ecological problems, such as the disorderly and predatory exploitation of water resources in the Tarim River basin between 1990 and 2000, which led to the rapid development of desertification and caused the disconnection of rivers as one of the reasons for the shrinkage of green natural oases in this period [48];
- (3)
- Policy factors. Policy is led or advocated for by the government, which constrains human actions and can form a huge synergy, and is often an important factor in the evolution of oases over a certain period of time. The western development and the “Belt and Road” initiative also created more jobs, and the relatively abundant agricultural land resources attracted people from other provinces to work in Xinjiang, which led to the rapid expansion of artificial oases and the shrinkage of natural oases during this period. The peak of expansion was reached during the period of 2000–2010. With the introduction of ecologically sustainable development policies, the expansion of artificial oases slowed down after 2010, while the degradation of natural oases was also moderated.
In summary, oases are water-dependent, and the evolutionary process of oasis evolution and change is, ultimately, a process of water resources change. Natural factors, such as climate and hydrology, influence the evolution of oases by affecting the runoff from the mountains, whereas human factors, such as population change, soil and water use, policy change, and technological progress and urbanization, largely determine the spatial and temporal distribution of water resources, directly or indirectly influencing the evolution of oases.
5. Conclusions
Based on remote sensing data during the period of 1990–2020, this study investigated the land-change characteristics and migration evolution process of oases in Xinjiang and came to the following conclusions:
- (1)
- The total oasis area in the study area showed an increasing trend between 1990 and 2020, from 13.95 × 10⁴ km2 in 1990 to 17.32 × 10⁴ km2 in 2020 (an increase of 24.0% during the past 30 years). The NO to AO area ratio decreased from 1.25:1 in 1990 to 0.72:1 in 2020. The expansion of arable land and construction land in AOs, the expansion of cultivated land and construction land in AOs, and the decrease in forested grassland in NOs are the main reasons for the change in oasis structure. Cultivated land and grassland are the types of land use that contribute more, accounting for more than 70% of the total contribution;
- (2)
- The AOs in the study area from 1990 to 2020 are tilted on a northeast–southwest axis, with no significant change in centripetal force and dispersion. The AOs are consistent with the main axis of NO migration, but the centripetal force is enhanced, the dispersion is weakened, and there is a gradual spatial aggregation trend; after 2005, there is a substantial migration to the northeast, with the centroid moving to the northeast;
- (3)
- Single-factor detection found that each factor influenced the spatial distribution of oasis migration in the following order, from strong to weak: NDVI > population density > GDP. The interaction detection results indicated that the driving factors did not independently influence each other, but there was some connection. The interaction results further verify that anthropogenic factors are the main drivers of spatial and temporal changes to oases, and, on this basis, they interact with other factors to jointly influence the spatial and temporal changes to oases in Xinjiang.
Author Contributions
Conceptualization, J.Z.; methodology, J.Z.; software, J.Z. and X.G.; validation, P.Z. and X.G.; formal analysis, X.D.; investigation, P.Z.; resources, M.D.; data curation, P.Z. and J.Z.; writing—original draft preparation, J.Z.; writing—review and editing, X.L.; visualization, X.G. and X.D.; supervision, A.L.; project administration, A.L.; fund, A.L. and X.D. All authors have read and agreed to the published version of the manuscript.
Funding
This research was supported by the National Natural Science Foundation of China (Grant No. 52179028) and the Third Xinjiang Scientific Expedition Program (Grant No. 2022xjkk0103; Grant No. 2021xjkk0406).
Data Availability Statement
Not applicable.
Acknowledgments
The work was supported by the “Ten Thousand People Plan” of China for Science and Technology Innovation Leaders.
Conflicts of Interest
The authors declare no conflict of interest.
References
- Rahmutulla, A.; Tashkin, J. Discussion on oasis concept and its classification. Arid Land Geogr. 2000, 23, 129–132. [Google Scholar]
- Xie, Y.; Gong, J.; Qian, D. Discussion of quantitative methods on oasis spatio-temporal change. Arid Zone Res. 2015, 32, 1247–1254. [Google Scholar]
- Li, W.-D.; Li, Z.-Z.; Wang, J.-Q. Evaluation of oasis ecosystem risk by reliability theory in an arid area: A case study in the Shiyang River Basin, China. J. Environ. Sci. 2007, 19, 508–512. [Google Scholar] [CrossRef] [PubMed]
- Chen, Y.; Yang, G.; Zhou, L.; Liao, J.; Wei, X. Quantitative analysis of natural and human factors of oasis change in the tail of Shiyang River over the past 60 years. Acta Geol. Sin. Engl. Ed. 2020, 94, 637–645. [Google Scholar] [CrossRef]
- Zhou, D.; Wang, X.; Shi, M. Human Driving Forces of Oasis Expansion in Northwestern China during the Last Decade—A Case Study of the Heihe River Basin. Land Degrad. Dev. 2016, 28, 412–420. [Google Scholar] [CrossRef]
- Hu, Y.; Yao, Y.; Kou, Z. Exploring on the climate regionalization of Qinling-Daba mountains based on Geodetector-SVM model. PLoS ONE 2020, 15, e0241047. [Google Scholar] [CrossRef] [PubMed]
- Buhe, A.; Tsuchiya, K.; Kaneko, M.; Ohtaishi, N.; Halik, M. Land cover of oases and forest in XinJiang, China retrieved from ASTER data. Adv. Space Res. 2007, 39, 39–45. [Google Scholar] [CrossRef]
- Zhang, G.; Rong, X. A concise history of the turfan oasis and its exploration. Asia Major 1998, 11, 13–36. [Google Scholar]
- Long, H.; Tang, G.; Li, X.; Heilig, G.K. Socio-economic driving forces of land-use change in Kunshan, the Yangtze River Delta economic area of China. J. Environ. Manag. 2007, 83, 351–364. [Google Scholar] [CrossRef]
- Verburg, P.H.; Soepboer, W.; Veldkamp, A.; Limpiada, R.; Espaldon, V.; Mastura, S.S.A. Modeling the Spatial Dynamics of Regional Land Use: The CLUE-S Model. Environ. Manag. 2002, 30, 391–405. [Google Scholar] [CrossRef]
- Almadini, A.M.; Hassaballa, A.A. Depicting changes in land surface cover at Al-Hassa oasis of Saudi Arabia using remote sensing and GIS techniques. PLoS ONE 2019, 14, e0221115. [Google Scholar] [CrossRef]
- Forget, Y.; Shimoni, M.; Gilbert, M.; Linard, C. Mapping 20 Years of Urban Expansion in 45 Urban Areas of Sub-Saharan Africa. Remote Sens. 2021, 13, 525. [Google Scholar] [CrossRef]
- Xuning, Q.; Degang, Y.; Xinhuan, Z. Evolution stages of oasis economy and its dependence on natural resources in Tarim River Basin. Chin. Geogr. Sci. 2009, 19, 135–143. [Google Scholar]
- Yuding, W.; Hang, Z.; Jianshi, Z. Evolution of oases under human interference in arid Northwest China. J. Hydroelectr. Eng. 2019, 38, 40–52. [Google Scholar]
- Jinping, H. Spatio-Temporal Change and Driving Force Mechanism of Oasis in the Kaidu-Kongqi River Basin over the Past 30 Years. Master’s Thesis, Xinjiang University, Ürümqi, China, 2018. [Google Scholar]
- Qifang, M.; Liangji, D.; Xianjin, H. Land use change and its driving factors in the mountainous area of the basin: A case study of Ya’an City, Sichuan Province. J. Nanjing Univ. (Nat. Sci.) 2005, 3, 268–278. [Google Scholar]
- Luo, T.; Liu, Y.; Kong, X. Research on the spatial-temporal evolution and driving mechanism of urban and rural construction land in Wuhan. Resour. Environ. Yangtze Basin 2014, 23, 461–467. [Google Scholar]
- Yi, F.; Yang, Q.; Wang, Z.; Li, Y.; Cheng, L.; Yao, B.; Lu, Q. Changes in Land Use and Ecosystem Service Values of Dunhuang Oasis from 1990 to 2030. Remote Sens. 2023, 15, 564. [Google Scholar] [CrossRef]
- Wang, J.-F.; Li, X.-H.; Christakos, G.; Liao, Y.-L.; Zhang, T.; Gu, X.; Zheng, X.-Y. Geographical detectors-based health risk assessment and its application in the neural tube defects study of the Heshun region, China. Int. J. Geogr. Inf. Sci. 2010, 24, 107–127. [Google Scholar] [CrossRef]
- Ju, H.; Zhang, Z.; Zuo, L.; Wang, J.; Zhang, S.; Wang, X.; Zhao, X. Driving forces and their interactions of built-up land expansion based on the geographical detector—A case study of Beijing, China. Int. J. Geogr. Inf. Sci. 2016, 30, 2188–2207. [Google Scholar] [CrossRef]
- Rong, G.; Li, K.; Han, L.; Alu, S.; Zhang, J.; Zhang, Y. Hazard Mapping of the Rainfall–Landslides Disaster Chain Based on GeoDetector and Bayesian Network Models in Shuicheng County, China. Water 2020, 12, 2572. [Google Scholar] [CrossRef]
- Zhao, Y.; Zhang, M.; Cui, J. Land-use transition and its driving forces in a minority mountainous area: A case study from Mao County, Sichuan Province, China. Environ. Monit. Assess. 2022, 194, 688. [Google Scholar] [CrossRef]
- Liu, Y.; Wu, K.; Cao, H. Land-use change and its driving factors in Henan province from 1995 to 2015. Arab. J. Geosci. 2022, 15, 247. [Google Scholar] [CrossRef]
- Eziz, M.; Yimit, H.; Mohammad, A.; Zhifang, H. Oasis land-use change and its effects on the oasis eco-environment in Keriya Oasis, China. Int. J. Sustain. Dev. World Ecol. 2010, 17, 244–252. [Google Scholar] [CrossRef]
- Luo, G.; Zhou, C.; Chen, X.; Li, Y. A methodology of characterizing status and trend of land changes in oases: A case study of Sangong River watershed, Xinjiang, China. J. Environ. Manag. 2008, 88, 775–783. [Google Scholar] [CrossRef]
- He, K.; Wu, S.; Yang, Y.; Wang, D.; Zhang, S.; Yin, N. Dynamic changes of land use and oasis in Xinjiang in the last 40 years. Arid Land Geogr. 2018, 41, 1333–1340. [Google Scholar]
- Li, S.; Zhang, X.L.; Li, S.S.; Du, H.R. Spatial and Temporal Evolution and Mechanism of Landscape Pattern of Oasis of Urban in Xinjiang. Econ. Geogr. 2013, 33, 161–168. [Google Scholar]
- Qi, S.-Z.; Li, X.-Y.; Duan, H.-P. Oasis land-use change and its environmental impact in Jinta Oasis, arid northwestern China. Environ. Monit. Assess. 2007, 134, 313–320. [Google Scholar] [CrossRef]
- Ainiwaer, M.; Ding, J.; Wang, J.; Nasierding, N. Spatiotemporal Dynamics of Water Table Depth Associated with Changing Agricultural Land Use in an Arid Zone Oasis. Water 2019, 11, 673. [Google Scholar] [CrossRef]
- Zhang, Q.; Sun, C.; Chen, Y.; Chen, W.; Xiang, Y.; Li, J.; Liu, Y. Recent Oasis Dynamics and Ecological Security in the Tarim River Basin, Central Asia. Sustainability 2022, 14, 3372. [Google Scholar] [CrossRef]
- Fang, Y.; Wang, X.; Cheng, Y.; Wang, Z. Oasis Change Characteristics and Influencing Factors in the Shiyang River Basin, China. Sustainability 2022, 14, 14354. [Google Scholar] [CrossRef]
- Feng, W.; Li, Y. Measuring the Ecological Safety Effects of Land Use Transitions Promoted by Land Consolidation Projects: The Case of Yan’an City on the Loess Plateau of China. Land 2021, 10, 783. [Google Scholar] [CrossRef]
- Gao, P.; Kasimu, A.; Zhao, Y.; Lin, B.; Chai, J.; Ruzi, T.; Zhao, H. Evaluation of the Temporal and Spatial Changes of Ecological Quality in the Hami Oasis Based on RSEI. Sustainability 2020, 12, 7716. [Google Scholar] [CrossRef]
- Hao, X.; Li, W. Oasis cold island effect and its influence on air temperature: A case study of Tarim Basin, Northwest China. J. Arid Land 2015, 8, 172–183. [Google Scholar] [CrossRef]
- Baoquan, J. Approach to some theoretical problems on oasis landscape. Arid Land Geogr. 1996, 3, 58–65. [Google Scholar]
- Yang, J.; Wang, L.; Wei, S. Spatial Variation and Its Local Influencing Factors of Intangible Cultural Heritage Development along the Grand Canal in China. Int. J. Environ. Res. Public Health 2022, 20, 662. [Google Scholar] [CrossRef]
- Wang, T.; Sun, J.-G.; Han, H.; Yan, C.-Z. The relative role of climate change and human activities in the desertification process in Yulin region of northwest China. Environ. Monit. Assess. 2012, 184, 7165–7173. [Google Scholar] [CrossRef]
- Song, Y.; Wang, J.; Ge, Y.; Xu, C. An optimal parameters-based geographical detector model enhances geographic characteristics of explanatory variables for spatial heterogeneity analysis: Cases with different types of spatial data. GISci. Remote Sens. 2020, 57, 593–610. [Google Scholar] [CrossRef]
- Deng, X.; Liu, Y.; Gao, F.; Liao, S.; Zhou, F.; Cai, G. Spatial Distribution and Mechanism of Urban Occupation Mixture in Guangzhou: An Optimized GeoDetector-Based Index to Compare Individual and Interactive Effects. ISPRS Int. J. Geo-Inf. 2021, 10, 659. [Google Scholar] [CrossRef]
- Wang, Z.; Wang, H.; Lei, Z. Stability analysis of oasis in arid region. J. Hydraul. Eng. 2002, 5, 26–30. [Google Scholar]
- Wang, Y.; Xiao, D.; Li, Y. Dynamics of Soil Salt Accumulation in Oasis at Lower Reaches of an Inland River Basin. J. Desert Res. 2009, 29, 603–610. [Google Scholar]
- Shi, Y. Discussion on the present climate change from warm-day to warm-wet in northwest China. Quat. Sci. 2003, 23, 152–164. [Google Scholar]
- Li, Y.; Chen, Y.; Li, Z. Climate and topographic controls on snow phenology dynamics in the Tienshan Mountains, Central Asia. Atmos. Res. 2020, 236, 104813. [Google Scholar] [CrossRef]
- Lu, L.; Li, X.; Cheng, G. Landscape evolution in the middle Heihe River Basin of north-west China during the last decade. J. Arid Environ. 2003, 53, 395–408. [Google Scholar] [CrossRef]
- Qin, M.L.; Xu, H.T.; Bushman, B. The Ecological Effects of Spatial Changes in the Urban Ecological Territory. Adv. Mater. Res. 2011, 347–353, 2819–2828. [Google Scholar] [CrossRef]
- Wang, Y.; Chao, W.; Gao, Y. Population Characteristics and Development Trend in Xinjiang. Foreign Econ. Relat. Trade 2022, 4, 68–71. [Google Scholar]
- Jiang, Y.; Du, W.; Chen, J.; Wang, C.; Wang, J.; Sun, W.; Chai, X.; Ma, L.; Xu, Z. Climatic and Topographical Effects on the Spatiotemporal Variations of Vegetation in Hexi Corridor, Northwestern China. Diversity 2022, 14, 370. [Google Scholar] [CrossRef]
- Zhang, P. Research on the Coupling System of Society, Ecoenvironment and Water in Tarim River Basin. Ph.D. Thesis, China Institute of Water Resources and Hydropower Research, Beijing, China, 2019. [Google Scholar]
Disclaimer/Publisher’s Note: The statements, opinions and data contained in all publications are solely those of the individual author(s) and contributor(s) and not of MDPI and/or the editor(s). MDPI and/or the editor(s) disclaim responsibility for any injury to people or property resulting from any ideas, methods, instructions or products referred to in the content. |
© 2023 by the authors. Licensee MDPI, Basel, Switzerland. This article is an open access article distributed under the terms and conditions of the Creative Commons Attribution (CC BY) license (https://creativecommons.org/licenses/by/4.0/).