Abstract
In urban development, balancing the ecological services of park green space with residents’ daily life and recreational needs, achieving sustainable development is an important issue in urban construction. The satellite cities of megacities have large development potential and are suitable research objects. This paper takes the Daxing District of Beijing as the research target and measures the integrated level of supply and demand by selecting unique evaluation indicators by integrating various dimensions and using the improved coupled coordination model and indicators with an expanded selection range at the smallest administrative unit of Chinese community unit scale innovatively. The study shows that: (1) The spatial heterogeneity between the supply and demand of parkland in 85 community units in Daxing New Town is obvious, the overall performance conforms with “demand exceeds supply”, and the supply and demand are generally positively correlated. (2) The correlation degree of the matched supply and demand is analyzed, and it is found that 55 community units show a mismatch between supply and demand and 53 community units have a low level of coordinated development. (3) The superposition analysis shows that the comprehensive level of supply and demand decreases from north to south and from the center to the surrounding area. (4) According to the Daxing New City Park Green Space Coupling Coordination Relationship and Policy Document, we divided the community units in Daxing New Town into six types, and provided differentiated development suggestions. The results of the study can help to guide the sustainable construction of Daxing New City and provide a basis for the future construction of satellite cities in other megacities.
1. Introduction
A megacity usually refers to a city with a permanent population of more than 10 million; this definition was put forward by the United Nations Department of Economic and Social Affairs [1]. Under the development of megacities, the development of satellite cities has been highly considered by scholars because of their aim of relieving the functions of the central city [2]. With advancements in industrialization and urbanization, satellite cities are expanding rapidly, and massive land construction and population inflow have led to a reduction in urban greenery and a surge in ecological and recreational demands. Along with the development of urban construction and time, the growth of satellite cities slowed and entered a period of stable development, but the contradiction between the demand for parks, ecological recreation, and urban construction was neither eliminated nor reduced. In this context, strengthening the construction of park green space is of great significance in mitigating the impact of large-scale expansion on alleviating the conflict between people and land, enhancing the urban ecological environment and the sustainable development of cities.
According to the “Urban Green Space Classification Standard” released by China in 2017 [3], park green space is green space in the city that is open to the public, has recreation as its main function, has certain recreational facilities and service facilities, and plays a comprehensive role in ecological maintenance, environmental beautification, disaster mitigation, and refuge. At the same time, during the epidemic, park green spaces also play an important role in relieving emotional stress [4] and reducing the risk of virus transmission [5]. A good layout for park green space can help the coordinated development of urbanization and the ecological environment. In recent years, international research on the layout of park green space has been divided into the following two categories: (1) Exploring the ecological value of park green space and studying the spatial distribution and pattern changes in vegetation, land use, carbon storage, water conservation, biodiversity, etc. [6,7]. (2) Exploring the efficiency of park use from the perspective of visitor use, such as studying the relationship between green space layout, population and road distribution [8,9], focusing on the differences in the supply of green space among different groups [10], studying the relationship between socioeconomic status and park use, as well as that between the share of green space for disadvantaged groups and the average share for society [11,12]. However, most of the current studies focus on a single ecological or human dimension. In the future, indicators should be selected from multiple perspectives to make up for the deficiencies of a single research dimension and explore the matching relationship between green space supply and demand in order to optimize the layout of urban green space, enhance human wellbeing, and promote sustainable urban development.
The supply of green space is subject to the intervention of urban planners [13], and the demand for green space is related to factors such as the number of residents [13] and socioeconomic characteristics [14]. Due to the influence of these two factors, it is often difficult to construct the relationship between the supply and demand of green space as they influence each other [15]. When conducting an in-depth study of the relationship between people and land, some scholars focus on optimizing the spatial layout and exploring ways to maximize the overall benefits realized through the mechanism of matching supply with demand [16]. The coupling coordination model refers to the phenomenon that two or more systems affect each other through various interactions between themselves and the outside world, and it can better reflect the coupling and coordination level of structure and function between different systems [17], focus on the virtuous circle and the trend of healthy development [18], be used to overcome the limitations of using a single research object, and is a good choice for assessing the relationship between the supply and demand of park green space. However, in the current use of coupling coordination models for park green spaces, the coupling degree validity of some studies encounters the problem of focusing on a single end of this dynamic [19,20]. This exerts a certain impact on the calculation results.
In the current research related to the green supply and demand relationship in parks, different scholars have different research perspectives. For example, Some scholars explored different types of ecosystem service cycle changes, starting from the perspective of ecosystem services [21]; Some scholars from the perspective of the spatial pattern of green space, explored the impact of the number, scale, and type of green space on service efficiency [22,23]; some scholars focus on the relationship between supply and demand at the accessibility level, and investigate the relationship between walking, cycling, public transport, private cars, or different modes of transport [24]; some scholars focus on landscape equity, differences due to age, income, educational background, and cultural background [25]; Some scholars also focus on the preferences of different groups [26,27]. However, the current selection of supply and demand indicators is mostly carried out from a single theoretical level. In the subsequent research, a perfect system of supply and demand indicators should be summarized, multiperspective research on supply and demand relationships should be strengthened, and an optimized coupled coordination degree model should be used to make up for the deficiencies.
Such a change in scale also has an impact on the research results. Recent studies on the spatial layout of parklands have focused on urban and urban cluster scales [16,28,29]. It is suitable for comparison at the spatiotemporal level, and the application of a more macroscopic view, while the study of small scale is more helpful for the fine management of urban construction. Therefore, in recent years, some scholars have proposed a grid serves scale of 300 × 300 m for research [6], and some scholars have made progress in the study of road division plots as small-scale units [30]. However, the study area is too fine-grained and prone to the problem of scale homogeneity. Additionally, the government mostly uses administrative boundaries for planning, and dividing plots by grids or roads is not conducive to the implementation of relevant policies. The community unit is the smallest Chinese administrative unit, and the current study lacks the relevant scale, so it is a good choice to guarantee the effective implementation of subsequent planning and construction while refining the study.
Beijing, the capital of China, is a typical megacity, and research on the development of the supply–demand relationship of its satellite cities is of relative importance. As a satellite city of Beijing, Daxing New Town is a key area to undertake population spillover and the functional decentralization of Beijing’s central city; therefore, this paper selects Daxing New Town as the research object, uses the community unit as the research scale and, constructs a new evaluation system based on the synthesis of existing evaluation models such as ecological value, accessibility, and equity. The existing conditions of supply and demand, spatial heterogeneity, and the degree of coupling and coordination of each community unit are evaluated using the improved coupling and coordination degree model; the layout of park green space in Daxing New Town is discussed with the aim of providing a theoretical basis for the exploration of sustainable urban development.
2. Materials and Methods
2.1. Study Area
The Daxing District, located in the southern suburbs of Beijing, is part of the northeastern part of the North China Plain (Figure 1) and is the gateway to the capital’s international activity and a new pinnacle for collaborative regional development. After large-scale demographic changes, socioeconomic transformation, and regional spatial reconfiguration [31], the Daxing District has gradually stabilized and entered into the stock development mode. According to the Daxing District 2050 development goals, the Daxing District will be fully established as a leading demonstration area of high-quality development [32]. According to the National Platform for Common Geospatial Information Services (https://service.tianditu.gov.cn/ (accessed on 10 September 2022)) in 2022, Daxing New City (east longitude:116,224,187–116,438,469; north latitude:39,632,909–39,806,221) includes Qingyuan Street, Gaomidian Street, Forest School Road Street, Xingfeng Street, Guanyinsi Street, Tiangongyuan Street, Huangcun Town, Xihongmen, and part of Beizangcun in the Daxing District, covering a total of 85 community units (Figure 2). After the complex and drastic changes in land types, Daxing New Town is steadily developing and entering into a new urbanization stage.
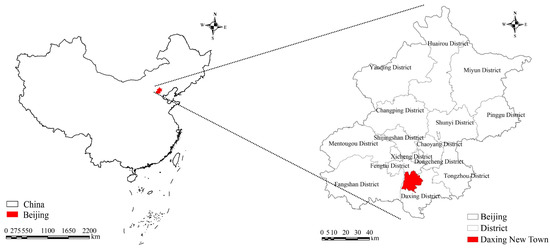
Figure 1.
Location of study area.
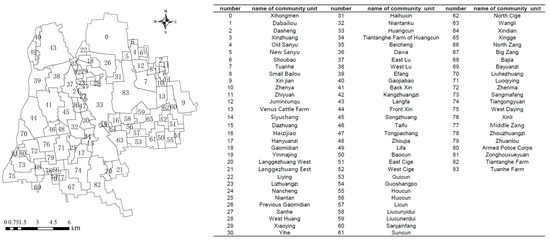
Figure 2.
Community units of Daxing New Town (2 of the 85 units share the same name with the other units).
2.2. Data Acquisition and Preprocessing
2.2.1. Urban Park Green Space Data
In accordance with the Urban Green Space Classification Standards [3] and the Beijing Park Classification and Grading Management Measures (Revised 2021) [33], the scope of park green space in this study covers comprehensive parks, community parks, historical parks, special category parks, pleasure gardens, ecological parks, and nature parks. Referring to the data of the Beijing Municipal Forestry and Parks Bureau (http://yllhj.beijing.gov.cn/ (accessed on 12 September 2022)), combined with the POI (Point of Interest) data obtained from China map websites, Baidu Map, Amap, and ArcGIS software visual interpretation of remote sensing images (from Landsat8 OLI_TIRS image data in late December 2020 of Geospatial Data Cloud, with spatial resolution of 30 m, with cloudiness ≤ 10%), a total of 41 instances of green ground data for Daxing New Town Park were collated. Finally, the geometric centers and entrances of the park green areas were extracted as point data for subsequent analysis.
2.2.2. Population Data
Population raster data of all ages in 2020 were obtained from the Worldpop World Population Data website (https://www.worldpop.org/ (accessed on 20 September 2022)) at a resolution of 100 m and summed using the merge tool in ArcGIS to obtain the total population data, population under 12 years old, and population over 65 years old. The population data of the Daxing District were extracted by mask using ArcGIS and then corrected using the raster calculator based on the population data of the Daxing District in the seventh census (2020).
2.2.3. Other Data
- (1)
- 2020 Beijing 500 m NPP raster data was obtained from MODIS MOD17A3, a product of USGS [34];
- (2)
- POI data was taken from Baidu Map, Gaode Map, and intercepted from June 2022 using the POI data query tool;
- (3)
- The data of the 2020 built-up area are obtained from the dataset of the 2020 built-up area of Chinese cities [35];
- (4)
- Road data were obtained from OpenStreetMap [36], which was vectorized and corrected based on remote sensing images;
- (5)
- Residential area data were obtained from the chain house website [34] using the locomotive collector. All data were obtained using WGS_1984_Albers geographic coordinates.
2.3. Selection of Evaluation Indicators
2.3.1. Selection of Supply Indicators
In this study, the supply of green space is defined as the service provided by the park to residents at the ecological and social levels and is assessed in terms of both ecological services and accessibility.
The ecological services are characterized by the level of net primary productivity of vegetation (NPP) and regional functional mixture.
The NPP index is an important parameter of the ecological process [37,38,39]. It cannot only indicate the ability to fix carbon and release oxygen [40,41] but also has a positive correlation with water conservation and soil conservation [42]. Therefore, NPP can be used as an indicator of ecological services positive indicators. Affected by the service link effect, when the mixed degree of land use types or POI function mixed degree around the park is higher, that is, when the surrounding service facilities are relatively complete, the urban green space is more attractive and the park interior is more dynamic [43]. Since the land use mix will have a certain impact on the evaluation of ecosystem services and the results are generally not a simple linear positive correlation, it is more reasonable to choose the regional functional mixture as an indicator for evaluation.
The accessibility index takes into account the private vehicle, public transport, cycling, and walking factors, and three indices are selected to characterize the density of the road network, the connection rate of the slow walking network, and the density of public transport facilities, which are combined with the “14th Five-Year Plan” for Beijing (2021–2025). The service coverage index is calculated with 500 m as the service radius, taking into account the requirement of “Beijing’s 500 m service radius coverage of parks and green areas reaching 90% by 2025” proposed in the Beijing 14th Five-Year Plan.
2.3.2. Selection of Demand Indicators
The demand level is defined as the residents’ preference and demand for green space in parks, which is assessed in two dimensions: equity and material demand.
In this study, the equity considers the difference in the demand for green space among different age groups and is characterized by three given aspects: total population density, the ratio of the elderly population over 65 years old, and the ratio of children under 12 years old. Because the aging global population is the most critical medical and sociodemographic issue in the world, the aging population expected to reach 2.1 billion by 2050, and social security and public services urgently need to be followed up [44]. In addition, children and teenagers should also receive attention in the use of landscape facilities. For example, children and the elderly have higher demands on the safety of landscape facilities [45,46,47,48]. Therefore, landscape equity focuses on the age composition and selects the population ratio over 65 years old and the population ratio under 12 years old as the index layer for research.
While the material demand is represented by two factors selected as the POI density and construction land ratio, the aggregation of POI reflects the distribution of the population in different occupational categories and is also closely related to urban dynamics [49,50,51,52]. The built-up area refers to the area within the administrative district of the city that has actually been developed and constructed, and where municipal public facilities and public facilities are basically available [53]. Its proportion can reflect the proportion of nonagricultural populations in urban areas to a certain extent; therefore, the ratio of construction land is chosen as an indicator for calculation (Table 1).

Table 1.
Park green space supply and demand indicators and research methods.
The above evaluation indices were calculated separately, and the calculated data were standardized to obtain the supply index and demand index. The indices were weighted and superimposed to obtain the supply level of park green space and the demand level of park green space. Finally, the relationship between the supply and demand system was evaluated using the relative development degree and the coupled coordinated development index. The research path is as follows (Figure 3).

Figure 3.
Research path for the park green space supply and demand measurement.
2.4. Supply and Demand Indicator Layer Research Methods
2.4.1. Absolute Information Entropy Method
The absolute information entropy method was proposed by Shannon on the basis of information entropy generalization, which states that the total amount of information about any activity is constant and can be measured from an objective point of view. The method is commonly used in economics [54], and has been introduced into the planning field in recent years to calculate the functional mix of POIs. The formula for this model is
where H is the integrated information entropy of the green space, is the first object located in k-st, which is the probability of the first object located in the first spatial unit, and denotes the benchmark of the object selection. A fishing net of 100 m × 100 m was created in ArcGIS, and the POI data were generated into a dataset with a search radius of 50 m using the generate nearest neighbor table tool. The regional functional mixture index was calculated based on the generated dataset using Equation (1) above.
2.4.2. Network Analysis Method
Network analysis is a method used to calculate the reach of a parkland based on road networks under certain resistance values. Using the ArcGIS Network Analyst tool, we created a walking road network dataset, selected the entrance and exit locations of the city park as the facility points, and set the passing time and interruption points of each road. In accordance with related research, the walking speed was set to 1.2 m/s, and the average waiting time at intersections was set to 0.5 min. A closed area of 15 min along the road network was generated for residents in walking traffic mode, and this area was superimposed with the study area to obtain the slow walking opportunity index of the park green space.
2.4.3. Density Analysis
Point density analysis, line density analysis, and kernel density analysis were all performed using the corresponding analysis tools of ArcGIS, and their specific processes are more conventional and, thus, do not need to be repeated.
2.4.4. Standardization of Evaluation Index Values
The values and units of each indicator are different, and there are positive and negative differences in the efficacy of certain parameters in different systems. Therefore, to achieve comparable indicators, the original values of each indicator need to be normalized to eliminate the influence of the magnitude. The normalization method used in this paper normalizes the data to the [0,1] interval using the following formula:
where is the standardized result, are the original values of each indicator, and and represent the maximum and minimum values in the same index series.
2.5. Calculation of Weights
SPCA is a method for condensing data into several general indicators (principal components) that are not related to each other to achieve dimensionality reduction, and the weights obtained are based on the extremely correlated relationship of the condensed data. The CRITIC weighting method is an objective weighting method, and its weights are calculated based on the strength and conflict of data to obtain the information value. To reduce the variability caused by the two assignment methods, SPCA and the CRITIC weighting method are integrated to analyze the indicators. SPSS24.0 was used to perform SPCA and the CRITIC weighting method on the data in turn, and then the two sets of results were used to perform integrated weighting analysis using the following formula [55].
where denotes the i-th indicator of the composite weight, and is the weight of the i-th indicator calculated by the SPCA method. is the weight of the i-th indicator calculated by the CRITIC weighting method. The results are as follows (Table 2).

Table 2.
Weights of Comprehensive Evaluation Indicators for Park Green Spaces.
Based on the calculated weights, the combined level of supply and demand is evaluated.
where is the composite score of the standardized park green space supply level, is the composite score of the standardized park green space demand level, k is the sum of the number of factors in each index layer, is the weight of the i-th factor in each index level, and and are the standardized values of the i-th factor in each index layer, which is represented by Ti in Formulas (2) and (3).
2.6. Relative Development Degree
Let the relative development degree (M) = supply level ()-the level of demand (); the relative development degree can reflect the size of the difference between supply and demand.
2.7. Evaluation of Coupling Coordination
The coupled and coordinated development index reflects the reasonable spatial layout of the park green space supply and the strength of the interaction between the supply and demand systems [30]. The coupling coordination model used in the current study to measure green space supply and demand still suffers from the subjectivity of index construction, the volatility of coupling results, and the lack of comparable reliability; therefore, the modified coupling coordination model proposed by Wang et al. (2021) [56] is adopted for this study [56] and used to apply the following formula to measure the comprehensive supply and demand levels of park green space after standardization.
In Equation (7), denotes the coupling degree, and denote the supply level and demand level of park green space, respectively. The coupling degree is generally in the range of 0 to1.00. In Equation (8), and are the coefficients to be determined, and since the supply and demand of park green space are equally important, and are taken as 0.5, and the coordination degree can be obtained by applying the above calculation. is the value in Equation (9), and denotes the degree of coordinated development; the higher that the value is, the higher the degree of coupled coordination between park green space supply and demand.
3. Results
3.1. Analysis of the Spatial Pattern of the Supply and Demand of Park Green Space in Daxing New Town
The individual supply indicators of parkland supply were calculated separately for 85 communities according to their respective calculation methods, and the data were spatially visualized and mapped in the ArcGIS software platform. The resulting data were classified into 6 classes based on the natural intermittency method, resulting in the average net primary productivity (NPP), service coverage rate, road network density, slow walking network connection rate, and density of public transport facilities. The spatial distribution of six individual supply items (Figure 4) and five individual demand items (Figure 5), namely, population density, the rate of elderly people over 65 years old, the rate of children under 12 years old, POI density, and the construction land ratio, are as follows:
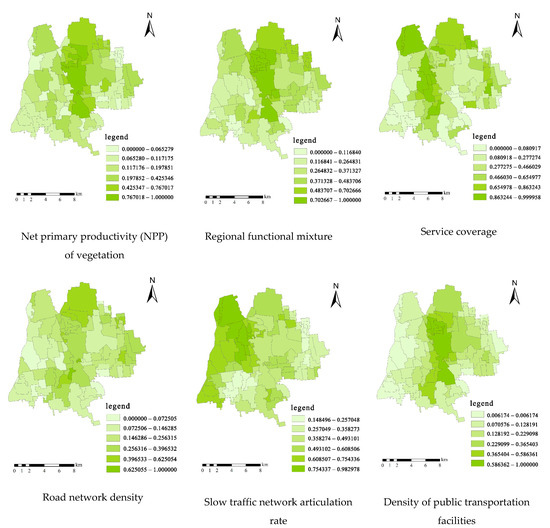
Figure 4.
Spatial distribution of the park green space supply index.
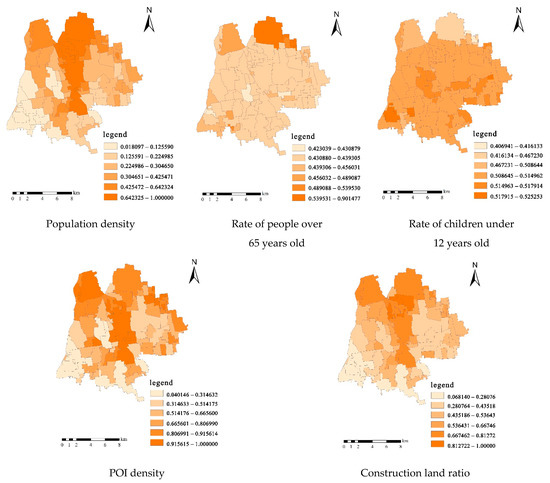
Figure 5.
Spatial distribution of the park green space demand index.
Based on the calculation results of each index weight, the supply and demand indices were weighted and summed, and the results were spatially visualized and mapped in the ArcGIS software platform to obtain the spatial distribution of the comprehensive supply and demand of park green space in Daxing New Town (Figure 6 and Figure 7). The data were divided into five levels according to the natural interval method, and the spatial distribution of the demand level showed a decreasing trend from the main urban area to the edge of the city and from the central area to either side; the supply level was unevenly distributed in space, and the core area had a low overall score. The average value of the supply index is 0.433273215, the average value of the demand water is 0.556907356, and the overall relationship conforms to “demand exceeds supply”.
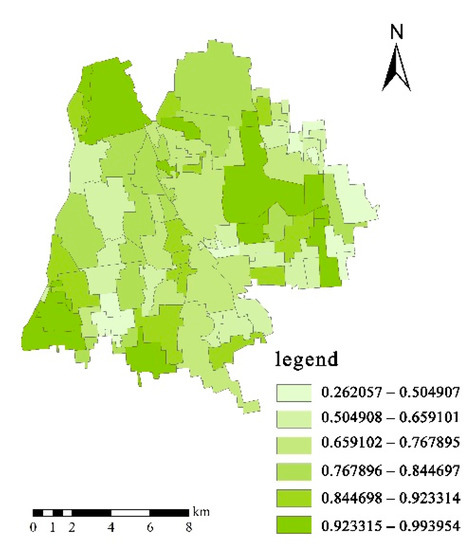
Figure 6.
Comprehensive supply of green space in parks.
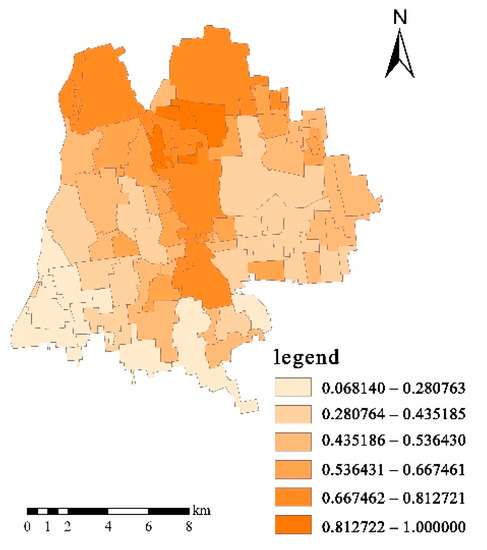
Figure 7.
Comprehensive demand for park green space.
The data obtained from the above analysis results were entered into the quadrant diagram, and a quadrant distribution-based park green space supply and demand matching pattern diagram was derived (Figure 8). The X-axis indicates the comprehensive supply of park green space in Daxing New Town, the Y-axis reflects the comprehensive demand for park green space in Daxing New Town, and the size of the circular area reflects the size of the community unit. In Figure 8, it can be seen that there is some variability in the matching relationship between the levels of supply and demand of park green space in Daxing New Town, which can be roughly divided into four matching types: high–high type (high supply and high demand, for a total of 24 community units), high–low type (high supply and low demand, for a total of 7 community units), low–low type (low supply and low demand, for a total of 28 community units), and low–high type (low supply and high demand, for a total of 27 community units). The Pearson correlation coefficient analysis of the supply and demand of park green space in Daxing New City is generally positive, i.e., the higher that the supply is, the higher the demand. The community units near the central city of Beijing and the central axis of Daxing New Town are at a higher level of supply and demand because they were built earlier; on the southern side of Daxing New Town, the current construction is still at the primary stage, and the supply and demand are both at lower levels.
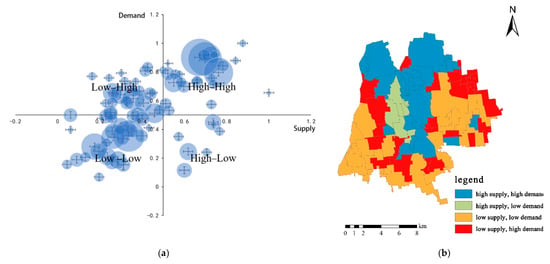
Figure 8.
(a) Supply and demand zoning; (b) Supply and demand zoning spatial distribution.
3.2. Matching Demand and Supply through a Correlation Analysis of Park Green Space in Daxing New Town
Based on the ArcGIS natural interruption method, the relative development degrees was classified into five types (Figure 9 and Table 3). When −0.50 < M ≤ −0.22 it represents a supply extreme deficit, −0.22 < M ≤ −0.07 represents a supply deficit, −0.07 < M ≤ 0.05 represents a supply match, 0.05 < M ≤ 0.22 represents a relatively supply surplus, and 0.22 < M ≤ 0.73 represents a supply surplus. The relative development degree is generally distributed from the center to the surroundings in a radial distribution of supply surplus–supply deficit–supply match, and the extreme supply deficit and supply surplus are distributed at the edge of the study area. Due to the construction of the Daxing Green Centre, the difference between the supply and demand of Xi Huang, Lizhuangzi, Kangzhuangzi, Nanchengzhuang, Previous Gaomidian, Gaomidian, and other community units in the core area of Daxing New Town is greater than 0.22, which indicates a supply surplus. In the central area of Daxing New Town, due to the intensive construction of economic service facilities and the scattered distribution of ecological service facilities, most of the supply is much smaller than that in the central area of Daxing New Town. Due to the dense construction of economic service facilities and the scattered distribution of ecological service facilities, most of the supply is much smaller than the demand and is, thus, in a supply deficit. There is a total of 65% of community units that have mismatched supply and demand, totaling 55 units.
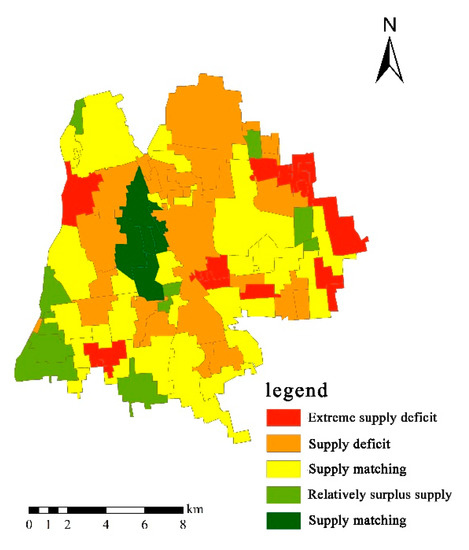
Figure 9.
The spatial distribution of relative development degree.

Table 3.
Relative development degree.
The degree of coordinated development can reflect the mutual promotion relationship between supply and demand. The coordinated development degree of supply and demand development in Daxing New Town Park spans 0.225–0.910, and according to the natural interruption method, 0.225 < D ≤ 0.367 represents disorder, 0.367 < D ≤ 0.513 represents near disorder, 0.513 < D ≤ 0.630 represents low coordination, 0.630 < D ≤ 0.754 represents primary coordination, and 0.754 < D ≤ 0.910 represents intermediate coordination (Figure 10 and Table 4). In terms of spatial distribution, the degree of coordinated development was distributed in a band—disorders, verging on disorder, low coordination, primary coordination, intermediate coordination—from west to east, with seven disordered community units scattered at the edge of the study area, accounting for 8%; the lower level of coordination accounted for 63%, indicating that most of the park green space supply and demand relationships in Daxing New Town were still at a lower level of interaction.
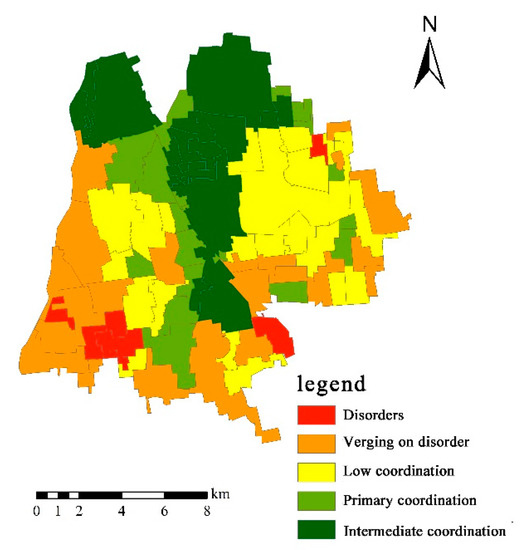
Figure 10.
The spatial distribution of coordinated development degree.

Table 4.
Coordinated development degree.
The relative development degree (M), which indicates the difference between supply and demand (Figure 9), is analyzed by superimposing the coupling degree (C) (Equation (7)) and the coordinated development degree (D) (Equation (9)) as calculated by the coupling coordination degree model to derive the ranking of the integrated level of supply and demand (Figure 11). There is a certain degree of spatial correspondence between the regional distribution of the coupling degree of the green space supply level in Daxing New Town Park and the regional distribution of the relative development degree. It is found that the degree of mutual promotion of the supply and demand capacity can enhance the comprehensive development of green space supply to a certain extent. The spatial correspondence between the degree of coordinated development, the coupling degree, and the relative development degree is low, but the correspondence between the degree of coordinated development and the comprehensive level of supply and demand is high; that is, the degree of coordinated development can reflect the comprehensive level of supply and demand to a certain extent. Among them, Nancheng has the highest comprehensive level of supply and demand, while North Zang has the lowest.
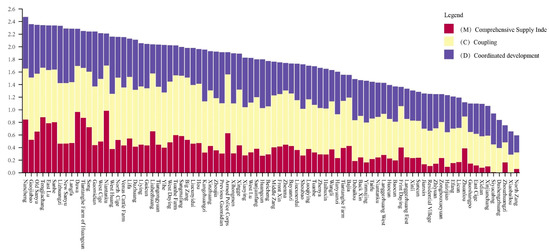
Figure 11.
Composite index of supply and demand and its spatial distribution.
4. Discussion
4.1. Based on the Selection of Appropriate Research Scale According to Different Policies in Different Places
In terms of research scale, throughout the planning management of international metropolises, Paris, France, is conducted with strict government administration and the effective participation of professionals [57], The current Parisian urban fabric is rich, and the government encourages the mixed development of urban functions, focusing on the preservation of historic districts and urban renewal. London, UK, has planning codified and executed by the mayor, borough commissioners, MDC, and community boards. A three-tier planning system was established (overall regional, local, and neighborhood planning), which was put forward in the “The London Plan 2021” [58]; most of the studies related to it have also been conducted from these three scales. Washington, DC, USA, has planning by Congress and its appointed architects, the National Capital Planning Commission (NCPC), and the U.S. Commission of Fine Arts; public participation in the hearings is also an important part of the planning, The current urban pattern is based on the cross-shaped central area planned by Langfang as an extension of the construction [59]. The grid of roads and neighborhoods is an important unit of planning, and most planning studies are carried out in blocks or neighborhoods divided by streets [60]. However, in the remote and arid regions of Australia, community participation planning models are prone to dilemmas due to the distances between residents, and the corresponding planning research scales are different.
Since Beijing is the capital of China, the government plays a more important role in planning, and the smallest administrative division is the community unit; discussing the community unit as a scale has positive implications for the promotion of fine governance and the development of construction in China.
4.2. Analysis of the Results of the Evaluation of the Relationship between Supply and Demand of Park Green Space
In the evaluation of the relationship between the supply and demand of park green space, the selection of indicators integrated with existing studies and the development characteristics of the Daxing District, and 11 unique supply and demand indices were selected from multiple perspectives. The relationship between the interaction of supply and demand indices is evaluated in the paper using a modified cohesion degree model. The results show that Daxing New Town is located on the south side of the main urban area and the extension of Beijing’s central axis, and its development shows the characteristics of decreasing from south to north and from the central axis to both sides; the spatial heterogeneity of park green space supply and demand is obvious. The supply and demand of the earlier developing regions are generally at a high level, but due to the large population concentration and high level of demand, the supply is still smaller than the demand; while the degree of coupling and coordination is relatively high, there is still room for improvement. The later-developed areas have smaller populations, and the supply is smaller than the demand in these areas due to the lower quality of ecological construction and low accessibility, and the degree of coupling and coordination is also lower. The community units in the core area of Da Xing New Town perform well in all indices due to the construction of the green heart, which enables the orderly development of Da Xing New Town in the future; the permanent farmland around Da Xing New Town also limits the city from spreading without need. In the future development and construction of Daxing New Town, attention should be given to spatial heterogeneity and regional characteristics to promote the coordinated development of park green space supply and demand.
4.3. Combine Evaluation Results and Policies to Make Optimization Suggestions
Each country and region should integrate cutting-edge research with government policies when making recommendations for optimizing regional development.
Paola Gullino et al. analyzed the agricultural, natural, and landscape characteristics of rural World Heritage Sites in order to ensure the sustainability of the rural World Heritage Sites; in the context of “the Convention for the Protection of the World Cultural and Natural Heritage” (1972) and “the Plan for the Protection of the World Cultural and Natural Heritage”, the six categories are divided into six separate opinions [61]. Karen Joyce and Steve Sutton (2009) optimized New Zealand recreation planning in the context of the Recreation Opportunity Spectrum (ROS) classification system and Department of Conservation (DOC) policy [62]. Emily Lorance Rall and Dagmar Haase (2011) evaluated German cities in the context of shrinking cities based on the interim use strategy and suggest how cities can be redeveloped at a low cost [63]. This study is based on the administrative division, and there is a possibility of studying it together with policies, so the evaluation results should also be considered together with government policies when making suggestions for optimization.
The Daxing Zoning Plan (2017–2035) required that the future construction of Daxing New Town should focus on the construction of public service facilities, integrated urban and rural development, ecological restoration, and the integration of industry and city.
Based on the spatial distribution characteristics and coupling coordination development status of the supply and demand of park green space in Daxing New Town coupled with the Daxing Zoning Plan (2017–2035), taking the community unit as the basic unit, Daxing New Town is divided into six zoning districts based on the administrative division of communities: the ecological core area, characteristic town area, livable development area, field ecological area, sustainable industrial area, and integrated cultural and educational district. Differentiated parkland development proposals are made by analyzing the driving factors of different zoning areas (Figure 12).
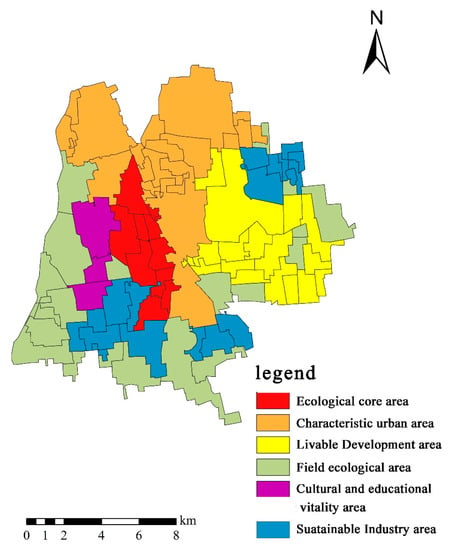
Figure 12.
Daxing New Town zoning based on supply and demand measures.
(1) Ecological core area: This area shows the characteristic of high supply and low demand, and the degree of coordination between supply and demand shows primary or intermediate coordination, mainly distributed in the core area of Daxing New Town, covering 10 community units, including Hanyuanzi, Sanhe, Niantanku, Dawa, and Dong Lucheng. This area is the district administrative center of Daxing New Town, and it comprises some medium- and high-end residential areas and various service facilities. The construction of Daxing New Town Forest Park which covers an area of 538.3 hm2 makes the area green enough and of sufficiently high quality; the population distribution is more concentrated, and the average density is lower, making the demand lower. Thus, the current overall development is more coordinated. Therefore, the region should focus on the construction of an ecological green heart; encourage the integrated development of parks and green spaces with sports, culture, and other resources; and build a public service core featuring ecological culture and a harmonious and livable home that interweaves blue and green interweaving on the basis of maintaining the balance of current ecological services and the needs of residents.
(2) Characteristic town area: This area is mainly located near the central axis of Daxing New Town and near the main urban area of Beijing and is represented by communities such as Langfa, Xihongmen, and Huangcun, with a spatial pattern showing the characteristic of high supply and high demand; the coordination of supply and demand is mainly at the intermediate level and partly at the primary level. The area has a high residential demand because of the early construction of the city, the developed facilities, the high accessibility of the road network, and the dense distribution of residential areas. The distribution of park green space is relatively uniform, with mainly micro green space and strip green space; except for the Lang Fa Forest Park in the northwest area, the rest of the park green space area is small and the recreation function is weak. The ageing population of Xihongmen, Shoubao, Langfa, and other community units near the main city represent a large portion, and the construction of ageing-friendly facilities should be emphasized. In the future, this area can improve the quality of park green space by vacating and renewing, making full use of small open spaces, strengthening the integration of green space inside and outside the city, and promoting the coordinated development of supply and demand in the area in a sustainable way.
(3) Livable development area: The 16 community units belonging to this area are all distributed in the central-eastern part of Daxing New Town. Both supply and demand are at a low level, and the coordination degree is mainly primary coordination. This area belongs to the centralized construction area in the planning, but the current construction level is low, and the residential land is mainly self-built houses and relocated houses. The road level and density are both at low levels, and there is a lack of supporting service facilities and park green space construction. The future development potential is large, so we should focus on improving the construction level of public transportation, municipal facilities, and public facilities to attract the inflow of population, promoting the coordinated development of park and green space construction through the mutual promotion of supply and demand, playing the function of Daxing New Town to evacuate the main urban area, and considering retaining the strategic white areas to leave flexibility for long-term development.
(4) Field ecological area: The supply and demand in this area are both at low levels, but the level of coordinated development is low and mainly verging on disorder. This area is mainly located on the edge of Eastern, Western, and Southern Daxing New Town and contains a certain permanent farmland protection zone, which should not be overdeveloped. Rather, its landscape advantages, such as building a waterfront landscape belt along the Yongding River with water–city integration, encouraging the planting of traditional specialty crops to highlight the idyllic characteristics of the landscape, enhancing its ecological service efficiency, and relieving the demand for urban recreation, should be focused on.
(5) Sustainable industrial area: The distribution of this area is concentrated in three groups. The northeast area covers Tuanhe, Xiaobailou, Dabailou, Zhenya, and Siyuchang, with plans to develop new industrial bases; the southeast area covers the former Daying and Langge community units, including the logistics park; and the southwest area covers Tiangongyuan, Niantan, and Luoqiying communities, with the biomedical industry driving its main development. The construction and development of the factory area causes the area in general to experience low supply and high demand, dysfunctional development, and tension between supply and demand. In the future, the construction of public transportation should be enhanced to improve the convenience of transportation, the greening of industrial parks should be improved, and pollution control should be regulated to reduce ecological impacts.
(6) Cultural and educational vitality area: This zone contains the three community units of Xinzhuang, Taifu, and Xinli. This area is close to the core area of Daxing New Town with high demand; however, due to the existence of a certain amount of wasteland, its levels of ecological value and accessibility are low, and the overall supply and demand match type is low–high, showing barely coordinated development. The high demand and low supply level make this area urgently in need of upgrading. As one of the recent key tasks of the “one district and two stations” concept determined by the Daxing zoning plan, the area should be upgraded by relying on the planned education and research center, cultural and sports center, and important residential area; this plan would renew the stock of low-utility land, improve the quantity of green space, optimize the structure of the urban road network, and improve public transportation. These measures should help to divert the functions of the central city by improving the convenience and pedestrian friendliness of public transportation.
5. Conclusions
In this paper, the relationship between the supply and demand of parkland in Daxing New Town is studied at the scale of the smallest administrative division—the community unit—in China. Based on the characteristics of the Daxing District and complementing previous studies, 11 supply and demand indicators were selected from four dimensions. After normalizing the values of the 11 indicators, the coefficients of each indicator were obtained based on the integrated weight analysis method, and the weights were superimposed to obtain the comprehensive supply and demand. The relationship between comprehensive supply and comprehensive demand is evaluated using the optimized coupling coordination model and relative development model. The evaluation found that there is spatial heterogeneity and different spatial patterns among the comprehensive supply, comprehensive demand, relative development degree, and coordinated development degree. The current causes of the relationship between supply and demand are analyzed combining these analyses with government policies, development suggestions are made for the six subdistricts, providing a basis for the subsequent layout of parkland in Daxing New Town and other regions of the world for high-quality development.
There are still some limitations to this study. First, the subjective preference of residents for green space and the quality of green space construction exert an impact on the efficiency of green space use, but this paper focuses on the quantitative analysis of spatial layout and lacks a qualitative analysis of green space quality. Second, some indices are not supported by solid data; for example, the data on low-income and foreign population are not available in the analysis of equity, and the vegetation data of park green space and other urban land types are not distinguished in the analysis of the primary productivity of vegetation. Third, due to the “boundary effect,” there are some errors in the data at the boundary of the study area that can be reduced by setting buffer zones to expand the study area in a follow-up study. Fourth, this study only analyses spatial distribution, which can be combined with the time dimension in future studies to explore the development process of supply and demand in urban development.
Author Contributions
Conceptualization, Z.Z. (Zhuo Zheng); methodology, Z.Z. (Zhuo Zheng); formal analysis, Z.Z. (Zhuo Zheng); investigation, Z.Z. (Zhuo Zheng); data curation, Z.Z. (Zhuo Zheng); writing—original draft preparation, Z.Z. (Zhuo Zheng) and Z.Z. (Zihan Zhang); writing—review and editing, Z.Z. (Zhuo Zheng), Z.Z. (Zihan Zhang), and S.W.; visualization, Z.Z. (Zhuo Zheng) and S.W.; supervision, S.W.; project administration, S.W.; funding acquisition, S.W. All authors have read and agreed to the published version of the manuscript.
Funding
This research was funded by the National Natural Science Foundation of China (grant number: 52108038), Beijing High-Precision Discipline Project – Discipline of Ecological Environment of Urban and Rural Human Settlements and Territorial Spatial Planning and Design Project (project number: YJSY-DSTD2022008).
Data Availability Statement
The datasets generated during and/or analyzed during the current study are available from the corresponding author upon reasonable request.
Acknowledgments
We hereby thank the National Natural Science Foundation of China, Beijing High-Precision Discipline Project—Discipline of Ecological Environment of Urban and Rural Human Settlements and Territorial Spatial Planning and Design Project for financial support for this research.
Conflicts of Interest
The authors declare no conflict of interest.
References
- United Nations Department of Economic and Social Affairs. 2018 Revision of World Urbanization Prospects. Available online: https://www.un.org/en/desa/2018-revision-world-urbanization-prospects (accessed on 16 May 2022).
- Wang, S. Study on Big City and Fellow Town; Social Sciences Academic Press: Beijing, China, 2008. [Google Scholar]
- CJJ/T85-2017; China, Ministry of Housing and Urban-Rural Development of the People’s Republic of China. Standard for Classification of Urban Green Space. Industry Standard of the People’s Republic of China: Beijing, China, 2017.
- Pouso, S.; Borja, Á.; Fleming, L.E.; Gómez-Baggethun, E.; White, M.P.; Uyarra, M.C. Contact with blue-green spaces during the COVID-19 pandemic lockdown beneficial for mental ealth. Sci. Total Environ. 2021, 756, 143984. [Google Scholar] [CrossRef] [PubMed]
- Bustamante, G.; Guzman, V.; Kobayashi, L.C.; Finlay, J. Mental health and well-being in times of COVID-19: A mixed-methods study of the role of neighborhood parks, outdoor spaces, and nature among US older adults. Health Place 2022, 76, 102813. [Google Scholar] [CrossRef] [PubMed]
- Huang, M.; Xiao, Y.; Xu, J.; Liu, J.; Wang, Y.; Gan, S.; Lv, S.; Xie, G. A Review on the Supply-Demand Relationship and Spatial Flows of Ecosystem ervices. J. Resour. Ecol. 2022, 13, 925–935. [Google Scholar] [CrossRef]
- Turkelboom, F.; Leone, M.; Jacobs, S.; Kelemen, E.; García-Llorente, M.; Baró, F.; Termansen, M.; Barton, D.N.; Berry, P.; Stange, E. When we cannot have it all: Ecosystem services trade-offs in the context of spatial planning. Ecosyst. Serv. 2018, 29, 566–578. [Google Scholar] [CrossRef]
- Tu, X.; Huang, G.; Wu, J. Review of the relationship between urban greenspace accessibility and humanwell-being. Acta Ecol. Sin. 2019, 39, 421–431. [Google Scholar] [CrossRef]
- Chen, Q.; Hou, Y.; Wu, S. Assessment of Accessibility to Urban Parks in Shaoxing Cityfrom the Perspective of Opportunity Equity. Sci. Geogr. Sin. 2016, 36, 375–383. [Google Scholar] [CrossRef]
- Zhang, Y.; Tarrant, M.A.; Green, G.T. The importance of differentiating urban and rural phenomena in examining the unequal distribution of locally desirable land. J. Environ. Manag. 2008, 88, 1314–1319. [Google Scholar] [CrossRef]
- Zhou, C. Research on the Evolution of the Connotation of the “Equity”and lts Measurement Standards in ParkLand Planning. Chin. Landsc. Archit. 2020, 36, 52–56. [Google Scholar] [CrossRef]
- Du, Y.; Jin, Y. Evaluation and Optimization of the Supply and Demand of Urban Park Green Spaces inthe Context of the Evolution of the Concept of Equity: A Case of Shanghai CommunityPark Green Spaces. Landsc. Archit. Landsc. Des. 2022, 19, 153–157. [Google Scholar] [CrossRef]
- Apparicio, P.; Séguin, A.-M.; Landry, S.; Gagnon, M. Spatial distribution of vegetation in Montreal: An uneven distribution or environmental inequity? Landsc. Urban Plan. 2012, 107, 214–224. [Google Scholar]
- Wilkerson, M.L.; Mitchell, M.G.; Shanahan, D.; Wilson, K.A.; Ives, C.D.; Lovelock, C. The role of socio-economic factors in planning and managing urban ecosystem services. Ecosyst. Serv. 2018, 31, 102–110. [Google Scholar] [CrossRef]
- Xing, L.; Liu, Y.; Liu, X.; Wei, X.; Mao, Y.J.H.I. Spatio-temporal disparity between demand and supply of park green space service in urban area of Wuhan from 2000 to 2014. Habitat Int. 2018, 71, 49–59. [Google Scholar] [CrossRef]
- Chen, Z.; Huang, G. Research progress on the differences and connections between supply and demand of urban green space. Chin. J. Appl. Ecol. 2020, 31, 3925–3934. [Google Scholar] [CrossRef]
- Wang, C.; Huang, S.; Deng, M.; Wei, W. Research on Equity of Park Green Spaces in High-density Cities from the Perspective of Supply-demand Coupling Coordination: A Case Study ofLonghua District, Shenzhen. Chin. Landsc. Archit. 2023, 39, 79–84. [Google Scholar] [CrossRef]
- Liao, C. Quantitaitve judgement and classification system for coordinated development of environment and economy case study of the city group in the pearl river delta. Trop. Geogr. 1999, 19, 76–82. [Google Scholar]
- Wang, Z.B.; Fang, C.L.; Cheng, S.W.; Wang, J. Evolution of coordination degree of eco-economic system and early-warning in the Yangtze River Delta. J. Geogr. Sci. 2013, 23, 147–162. [Google Scholar] [CrossRef]
- Schirpke, U.; Candiago, S.; Vigl, L.E.; Jager, H.; Labadini, A.; Marsoner, T.; Meisch, C.; Tasser, E.; Tappeiner, U. Integrating supply, flow and demand to enhance the understanding of interactions among multiple ecosystem services. Sci. Total Environ. 2019, 651, 928–941. [Google Scholar] [CrossRef]
- Rau, A.-L.; Burkhardt, V.; Dorninger, C.; Hjort, C.; Ibe, K.; Kessler, L.; Kristensen, J.A.; McRobert, A.; Sidemo-Holm, W.; Zimmermann, H.; et al. Temporal patterns in ecosystem services research: A review and three recommendations. Ambio 2020, 49, 1377–1393. [Google Scholar] [CrossRef]
- Kronenberg, J.; Andersson, E.; Barton, D.N.; Borgstrom, S.T.; Langemeyer, J.; Bjorklund, T.; Haase, D.; Kennedy, C.; Koprowska, K.; Laszkiewicz, E.; et al. The thorny path toward greening: Unintended consequences, trade-offs, and constraints in green and blue infrastructure planning, implementation, and management. Ecol. Soc. 2021, 26, 36. [Google Scholar] [CrossRef]
- Brown, G.; Schebella, M.F.; Weber, D. Using participatory GIS to measure physical activity and urban park benefits. Landsc. Urban Plan. 2014, 121, 34–44. [Google Scholar] [CrossRef]
- Xing, Z.; Zhu, J. Evaluation On Fair Performance Of Urban Green Space Based On Coupling Model Of Coordinated Development Theory. City Plan. Rev. 2017, 41, 89–96. [Google Scholar]
- Rahman, K.M.A.; Zhang, D. Analyzing the Level of Accessibility of Public Urban Green Spaces to Different Socially Vulnerable Groups of People. Sustainability 2018, 10, 3917. [Google Scholar] [CrossRef]
- Guo, S.; Yang, G.; Pei, T.; Ma, T.; Song, C.; Shu, H.; Du, Y.; Zhou, C. Analysis of factors affecting urban park service area in Beijing: Perspectives from multi-source geographic data. Landsc. Urban Plan. 2019, 181, 103–117. [Google Scholar] [CrossRef]
- Dony, C.C.; Delmelle, E.M.; Delmelle, E.C. Re-conceptualizing accessibility to parks in multi-modal cities: A Variable-width Floating Catchment Area (VFCA) method. Landsc. Urban Plan. 2015, 143, 90–99. [Google Scholar] [CrossRef]
- Wen, C.; Albert, C.; Von Haaren, C.J.U.F.; Greening, U. Equality in access to urban green spaces: A case study in Hannover, Germany, with a focus on the elderly population. Urban For. Urban Green. 2020, 55, 126820. [Google Scholar] [CrossRef]
- Gui, K.; Xu, J.; Zhang, X. Optimization of urban green space spatial arrangement based on supply-demand analysis:A case study in Nanjing City, China. Chin. J. Appl. Ecol. 2013, 24, 1215–1223. [Google Scholar] [CrossRef]
- Wang, M.; Wang, Y. Measurement and Optimization of Supply and Demand of Park Green Space at Urban Block Scale:A Case Study ot Yangpu District, Shanghai. Landsc. Archit. 2021, 28, 22–27. [Google Scholar] [CrossRef]
- Xing, G.; XU, Y.; Zheng, Y. Rural Settlement Spatial Evolution Types And Features In The Process Of Urbanization. Econ. Geogr. 2007, 27, 932–935. [Google Scholar] [CrossRef]
- Beijing Municipal Commission of Planning and Natural Resources. Daxing District Zoning Plan (Territorial Spatial Planning) (2017–2035). 2019. Available online: http://ghzrzyw.bjing.gov.cn/zhengwuxinxi/ghcg/fqgh/202002/P020200213609289783522.pdf (accessed on 25 May 2022).
- Beijing Municipal Forestry and Parks Bureau. Beijing Municipal Park Classification and Grading Management Measures (revised 2021). 2021. Available online: https://www.beijing.gov.cn/zhengce/gfxwj/202210/t20221008_2830137.html (accessed on 16 May 2022).
- Available online: https://lpdaac.usgs.gov/ (accessed on 24 October 2022).
- Sun, Z.; Sun, J.; Guo, H.; Jiang, H.; Gao, J.; Wang, J. China Cities 2020 Built-up Area Dataset. Available online: https://www.scidb.cn/en/detail?dataSetId=5876ca6bf2064a9f9b8d4b092a7a7ba9 (accessed on 15 December 2022).
- OpenHistoricalMap. Available online: https://www.openhistoricalmap.org/ (accessed on 25 October 2022).
- Schloss, A.; Kicklighter, D.; Kaduk, J.; Wittenberg, U. Comparing global models of terrestrial net primary productivity (NPP): Comparison of NPP to climate and the Normalized Difference Vegetation Index (NDVI). Glob. Chang. Biol. 1999, 5, 25–34. [Google Scholar] [CrossRef]
- Cramer, W.; Kicklighter, D.W.; Bondeau, A.; Iii, B.M.; Churkina, G.; Nemry, B.; Ruimy, A.; Schloss, A.L. Comparing global models of terrestrial net primary productivity (NPP): Overview and key results. Glob. Chang. Biol. 1999, 5, 1–15. [Google Scholar] [CrossRef]
- Zhou, G.; Zhang, X. A natural vegetation NPP model. Chin. J. Plant Ecol. 1995, 19, 193. [Google Scholar]
- Ma, X.; Sun, G.; Ren, Z. The Values of Vegetation PurifiedAir and Its Measure In Xin’an City. J. Arid. Land Resour. Environ. 2002, 4, 83–86. [Google Scholar]
- Wei, X.; Yang, J.; Luo, P.; Lin, L.; Lin, K.; Guan, J. Assessment of the variation and influencing factors of vegetation NPP and carbon sink capacity under different natural conditions. Ecol. Indic. 2022, 138, 108834. [Google Scholar] [CrossRef]
- Wang, X.; Wu, J.; Wu, P.; Shangguan, Z.; Deng, l. Spatial and Temporal Distribution and Trade-off of WaterConservation, Soil Conservation and NPP Services in theEcosystems of the Loess Plateau from 2000 to 2015. J. Soil Water Conserv. 2021, 35, 114–121+128. [Google Scholar] [CrossRef]
- Akpinar, A. Factors influencing the use of urban greenways: A case study of Aydın, Turkey. Urban For. Urban Green. 2016, 16, 123–131. [Google Scholar] [CrossRef]
- Milligan, C.; Gatrell, A.; Bingley, A.J.S.s. ‘Cultivating health’: Therapeutic landscapes and older people in northern England. Soc. Sci. Med. 2004, 58, 1781–1793. [Google Scholar] [CrossRef]
- Fan, R. Healthy Landscape System Construction for the Old. J. Nanjing For. Univ. (Humanit. Soc. Sci. Ed.) 2012, 12, 66–69. [Google Scholar] [CrossRef]
- Sugiyama, T.; Thompson, C.W. Older people’s health, outdoor activity and supportiveness of neighbourhood environments. Landsc. Urban Plan. Int. 2007, 83, 168–175. [Google Scholar] [CrossRef]
- Olmedo-Alguacil, M.M.; Ramírez-Rodrigo, J.; Villaverde-Gutiérrez, C.; Sánchez-Caravaca, M.A.; Aguilar Ferrandiz, E.; Ruiz-Villaverde, A. Health-Related Quality of Life, Gender, and Culture of Older People Users of Health Services in the Multicultural Landscape of the City of Ceuta (Spain) A Cross-Sectional Study. J. Transcult. Nurs. 2016, 27, 603–610. [Google Scholar] [CrossRef]
- Grose, M. Landscape and children’s health: Old natures and new challenges for the preventorium. Health Place 2011, 17, 94–102. [Google Scholar] [CrossRef]
- Li, X. Recognition of Urban Polycentric Structure Based on Spatial AggregationCharacteristics of POI Elements: A Case of Zhengzhou City. Acta Sci. Nat. Univ. Pekin. 2020, 56, 692–702. [Google Scholar] [CrossRef]
- Zhang, J.-D.; Chow, C.-Y. Geosoca: Exploiting Geographical, Social and Categorical Correlations for Point-of-Interest Recommendations. In Proceedings of the 38th International ACM SIGIR Conference on Research and Development in Information Retrieval, Santiago, Chile, 9–13 August 2015; pp. 443–452. [Google Scholar]
- Lu, C.; Pang, M.; Zhang, Y.; Li, H.; Lu, C.; Tang, X.; Cheng, W. Mapping urban spatial structure based on poi (point of interest) data: A case study of the central city of Lanzhou, China. J. ISPRS Int. J. Geo Inf. 2020, 9, 92. [Google Scholar] [CrossRef]
- Zhao, S.; Zhao, T.; Yang, H.; Lyu, M.; King, I. STELLAR: Spatial-Temporal Latent Ranking for Successive Point-of-Interest Recommendation. In Proceedings of the AAAI Conference on Artificial Intelligence, Phoenix, AZ, USA, 12–17 February 2016. [Google Scholar]
- GB/T 50280-98; China Architecture Publishing & Media Co., Ltd. Standard for Basic Terminology of Urban Planning. China Building Industry Press: Beijing, China, 2008.
- Chen, Y.; Chen, G.; Li, M. Classification &research advancement of comprehensive evaluation methods. J. Manag. Sci. China 2004, 7, 69–79. [Google Scholar]
- He, D.; Chen, X.; Xu, J. Weight aggregation method based on principle of minimum cross-entropyin multiple attribute group decision-making. Control. Decis. 2017, 32, 378–384. [Google Scholar]
- Wang, S.; Kong, W.; Ren, L.; Zhi, D.; Dai, B. Research on misuses and modification of couplingcoordination degree model in China. J. Nat. Resour. 2021, 36, 793–810. [Google Scholar] [CrossRef]
- Liu, J. Urban Renovation Through Holistic Creation in FranceThe Planning Mechanism of ZAC and Its Implementation in Paris. Urban Plan. Int. 2013, 28, 57–66. [Google Scholar]
- Mayor of London. Available online: https://www.london.gov.uk/programmes-strategies/planning/london-plan/new-london-plan/london-plan-2021 (accessed on 27 January 2023).
- Gutheim, F.; Lee, A.J. Worthy of the Nation: Washington, DC, from L’Enfant to the National Capital Planning Commission; JHU Press: Baltimore, MD, USA, 2006. [Google Scholar]
- McLain, R.J.; Banis, D.; Todd, A.; Cerveny, L.K. Multiple methods of public engagement: Disaggregating socio-spatial data for environmental planning in western Washington, USA. J. Environ. Manag. 2017, 204, 61–74. [Google Scholar] [CrossRef]
- Gullino, P.; Beccaro, G.L.; Larcher, F. Assessing and Monitoring the Sustainability in Rural World Heritage Sites. Sustainability 2015, 7, 14186–14210. [Google Scholar] [CrossRef]
- Joyce, K.; Sutton, S.J.A.G. A method for automatic generation of the Recreation Opportunity Spectrum in New Zealand. Appl. Geogr. 2009, 29, 409–418. [Google Scholar] [CrossRef]
- Rall, E.L.; Haase, D. Creative intervention in a dynamic city: A sustainability assessment of an interim use strategy for brownfields in Leipzig, Germany. Landsc. Urban Plan. 2011, 100, 189–201. [Google Scholar] [CrossRef]
Disclaimer/Publisher’s Note: The statements, opinions and data contained in all publications are solely those of the individual author(s) and contributor(s) and not of MDPI and/or the editor(s). MDPI and/or the editor(s) disclaim responsibility for any injury to people or property resulting from any ideas, methods, instructions or products referred to in the content. |
© 2023 by the authors. Licensee MDPI, Basel, Switzerland. This article is an open access article distributed under the terms and conditions of the Creative Commons Attribution (CC BY) license (https://creativecommons.org/licenses/by/4.0/).