Article

Rural Transformation Development and Its Influencing Factors in China’s Poverty-Stricken Areas: A Case Study of Yanshan-Taihang Mountains

1
Institute of Geographic Sciences and Natural Resources Research, Chinese Academy of Sciences, Beijing 100101, China
2
Key Laboratory of Regional Sustainable Development Modeling, Chinese Academy of Sciences, Beijing 100101, China
3
University of Chinese Academy of Sciences, Beijing 100049, China
*
Author to whom correspondence should be addressed.
Land 2023, 12(5), 1080; https://doi.org/10.3390/land12051080
Submission received: 14 April 2023 / Revised: 12 May 2023 / Accepted: 15 May 2023 / Published: 17 May 2023
(This article belongs to the Special Issue Rethinking the Man-Land Relations in China)

Abstract

:
Rural China has undergone a rapid transformation in the past few decades, especially the poverty-stricken areas, making a historic leap from inadequate subsistence to full well-off status. Based on rural regional system theory, this study analyzes the connotation of rural transformation development (RTD), explores the spatio-temporal patterns of RTD in the Yanshan-Taihang Mountainous, and diagnoses its influencing factors using a geographically and temporally weighted regression model. The results show that RTD is a dynamic process of qualitative changes in rural regional systems based on the accumulation of quantitative changes of elements, and the key to its measurement lies in analyzing the coupling coordination degree between quantitative changes of elements. From 2000 to 2020, the rapid development of urban population share, non-agricultural industry share, construction land share and NDVI in the Yanshan-Taihang Mountains contributed to a leap in RTD status, and the proportion of counties in a coupling coordination state increased from 24.24% to 96.97%. Spatially, the RTD level in the Taihang Mountains was significantly superior to that in the Yanshan Mountains. Average years of schooling, road density, per capita GDP and urban–rural dual structure were the main influencing factors of RTD, of which the first three were positive factors and the last one presented a negative correlation. To promote RTD to a higher level, it is an urgent matter to boost the high-quality development of county economy and rural education, improve public transportation infrastructure and innovate the policy system.

1. Introduction

The countryside is a geographical complex with natural and human characteristics and multiple functions such as production, living, ecology and culture outside the built-up urban areas [1,2]. Since the 1950s, the continuous advancement of globalization as well as the rapid development of industrialization and urbanization have driven rural transformation from production-based to consumption-based, and then to multifunctional and globalized-based [3]. During this process, the characteristics and functions of rural areas have changed dramatically. Meanwhile, international research on rural transformation development (RTD) has shown a clear divergence. One is to continue the previous framework of political economy, that is, exploring rural areas from a political–economic perspective and policy framework and analyzing the influences of policy adjustments on RTD [4]. The other is to redefine the spatial composition and values of rural areas, advocating themes such as pastoralism, post-ruralism, multifunctionality and gentrification [5,6], and to shift the understanding of rural areas from a physical to a socially constructed theory. Essentially, RTD refers to the changes in rural socio-economic forms and rural spatial reconstruction under the combined effects of internal and external forces, and the core lies in the transformation of industrial–agricultural and urban–rural relations [7,8]. Due to the mutagenicity of RTD, it has a profound impact on national food security, farmers’ income increases and social equality (especially poverty alleviation).
China is a developing country with a long history of farming and a large rural population [9,10]. During the various historical periods of China’s revolution, construction and reform, promoting RTD has been an important mainline of national economic and social development [11]. The introduction of a series of policies to support agricultural and rural development has enabled rural China to achieve world-renowned achievements, realizing a historical leap from national liberation to getting rid of poverty and then to a well-off society in an all-round way [12]. Therefore, transformation is one of the most prominent features of China’s rural development in the past few decades, and it is also the core issue of China’s rural development in the current and future period [7,11].
The spatial carrier of rural development is the rural regional system [13,14]. Therefore, RTD is a complex process involving elemental changes, structural adjustment and functional transformation of rural regional system, in which elemental changes cause the structural adjustment of the system, and structural adjustment determines the transformation of the overall function and state of the system [2,7,13]. Meanwhile, the spatial heterogeneity of physical geography and regional imbalance of socioeconomics determine the complexity and diversity of RTD patterns and types [15]. Due to the important roles of population, land and industry in rural development, most studies on China’s RTD focus on demographic transition [16,17], industrial transition [18,19,20,21] and land use transition [22,23,24], aiming to reveal the general characteristics of the evolution of rural regional system through the analysis of elemental changes. Given the complexity of RTD, comprehensive indexes such as rurality [25,26], rural development level [8] and rural multifunctional index [14,27] measure the status of RTD from multiple dimensions. Additionally, analytical frameworks such as vulnerability and resilience have also been employed to analyze the level and status of RTD across time and space [28,29].
Since entering the 21st century, China has actively promoted the implementation of major strategies such as the new socialist countryside construction and targeted poverty alleviation, especially the latter, which has completely solved the long-standing problem of absolute poverty in rural Central and Western China [12,30]. For the poverty-stricken areas, getting rid of poverty is the biggest transformation of their development. In line with the current shift of China’s rural development focus from poverty alleviation to rural revitalization [31], an in-depth analysis of the regional differences and influencing factors of RTD in typical poverty-stricken areas is of great significance in guiding China’s poverty-stricken areas to consolidate and expand antipoverty achievements and comprehensively promote rural revitalization. On the other hand, the global antipoverty process has suffered a setback for the first time in over 20 years due to multiple challenges such as the COVID-19 pandemic, climate change and geopolitical conflicts [32,33]. If the current trends continue, nearly 7% of the world’s population, or nearly 600 million people, will still be struggling in extreme poverty by 2030 [34,35]. China is the first developing country in the world to achieve UN Sustainable Development Goal (SDG) 1 [31]. The study of antipoverty practices in China’s typical poverty-stricken areas will help summarize antipoverty experiences and contribute Chinese wisdom to global poverty alleviation, thereby supporting the timely achievement of the 2030 SDGs.
Following the introduction, Section 2 constructs a cognitive framework of RTD, selects targeted indicators to feature RTD, and develops a model to diagnose the factors influencing the regional divergence of RTD. Section 3 briefly introduces the study area and the data used in this study. Section 4 presents the spatial and temporal patterns of RTD in the Yanshan-Taihang Mountains from 2000 to 2020 and identifies the influencing factors of RTD using the geographically and temporally weighted regression (GTWR) model. Section 5 re-examines RTD and its influencing factors and explores key measures for rural revitalization in the Yanshan-Taihang Mountains and the implications of this study for global poverty alleviation and development. Conclusions are drawn in Section 6.

2. Theory and Methodology

2.1. Theoretical Framework

Transformation refers to the process of fundamental changes in the way things operate and the form of their structures, reflecting the change of things from one qualitative state to another. From the perspective of dialectical materialism, this transformation is also known as qualitative change, and is one of the basic states of the movement of things [36]. Another state of the movement of things corresponding to it is quantitative change, which reveals the increase/decrease in the number of things, the adjustment of places and the changes in the arrangement of various components within things. In essence, quantitative change is a continuous, universal, inconspicuous, gradual and objective change [37,38]. When the accumulated quantitative change does not exceed a specific threshold, it does not change the nature of things; while when it exceeds this threshold, it triggers a change in the nature of things. Generally, the development of things begins with quantitative change, which is the premise of qualitative change, and qualitative change is the result of quantitative change. Meanwhile, qualitative change opens the way for new quantitative change, making things start new quantitative change on the basis of qualitative change. In this way, things continue to develop from a low to a high level, promoting the emergence of new things and the demise of old things.
The rural regional system is a spatial system with a certain structure, function, and inter-regional connection, which is composed of human, economic, resource and environmental elements [15]. Among them, human elements mainly refer to social matters closely related to human development; economic elements mainly refer to various economic activities in rural areas; resource elements mainly refer to water, land, atmosphere, and other natural resources that can be developed and used by human beings; and environmental elements mainly refer to the earth’s surface environment composed of the atmosphere, hydrosphere, lithosphere, biosphere, etc. The changes in the elements within the system constitute the initial dynamics of RTD [7]. They are linked through material circulation, energy conversion and information transmission, and constantly interact with external systems, allowing rural regional system to evolve from simple to complex. In this process, the organizational structure and operational mode of rural regional system are also constantly improved, promoting the evolution of system function and state. Poverty is a state presented by element shortages and structural imbalances in rural regional system, and the purpose of poverty alleviation is to improve the function and state of rural regional system through targeted measures to compensate for element shortages and optimize structural organization [39]. When compensating for shortcomings in the period of quantitative change, rural areas are still in poverty; only when the optimization and adjustment of the system makes rural socio-economic development reach a certain level can poverty-stricken areas get rid of poverty. With the improvement in sustainable development capability, poverty-stricken areas can achieve the goal of eliminating absolute poverty and gradually transform to the stage of affluence (Figure 1).
RTD reveals the dynamic process of qualitative changes based on accumulated quantitative changes in the rural regional system. Therefore, to scientifically understand RTD, the core is to analyze the changes in system function and state based on the changes in system element, where the changes in elements reveal the quantitative changes of the system, the evolution of the function and state reflects the qualitative changes of the system, and the key to bridging the change of element and the evolution of function and state is the optimization and adjustment of system structure.

2.2. Research Methods

2.2.1. Measurement of RTD

According to the theoretical understanding of RTD, the development of human, economic, resource and environmental elements in rural regional system is the quantitative change process of RTD. Based on the availability of data and drawing on existing studies [7,8,40,41,42], the urban population share, non-agricultural industry ratio, construction land share and normalized difference vegetation index (NDVI) are employed to represent the changes of human, economic, resource and environmental elements in rural regional system, respectively, thereby revealing the quantitative changes of rural regional system (Table 1). In terms of the connotation of each indicator, they are all positive, i.e., the higher their values, the more quantitative changes RTD accumulates, and the easier it is for the function of the rural regional system to leap forward and achieve qualitative changes.
Systems theory suggests that the function and state of a system depend not only on the number of elements, but also on the structural organization formed by the interaction between elements [43]. Therefore, this study uses the coupling coordination degree between elements to characterize the function and state of rural regional system and reveal the qualitative changes of rural regional system, i.e., the RTD level at a certain point in time. In general, the coupling coordination degree is calculated as follows:
D i t = T i t × C i t = ( a H u m i t + b E c o n i t + c R e s i t + d E n v i t ) × ( 4 × H u m i t × E c o n i t × R e s i t × E n v i t 4 H u m i t + E c o n i t + R e s i t + E n v i t )
where Dit is the coupling coordination degree of human (Hum), economic (Econ), resource (Res) and environmental (Env) elements of the rural regional system i in period t; Cit and Tit are the coupling degree and comprehensive coordination index of the four elements in the rural regional system, respectively; and a, b, c and d are the weights of human, economic, resource and environmental elements in the rural regional system, respectively. The weight values obtained with the combined Delphi method [44] and entropy weight method [45] are 0.3259, 0.2155, 0.2447 and 0.2139, respectively. Additionally, the RTD state characterized by the coupling coordination degree of elements can be divided into eight levels: severe disorder (0.00~0.20), moderate disorder (0.21~0.30), mild disorder (0.31~0.40), imminent disorder (0.41~0.50), barely coupling coordination (0.51~0.60), primary coupling coordination (0.61~0.70), intermediate coupling coordination (0.71~0.80) and advanced coupling coordination (0.81~1.00).

2.2.2. Pre-Section of Influencing Factors and Model Construction

The dynamics of rural development has been at the core of research on issues concerning agriculture, rural areas and farmers. Since the 1950s, classical rural development theories such as exogenous rural development theory, endogenous rural development theory and comprehensive rural development theory have been developed [46,47]. Exogenous rural development theory places rural areas in the macro context of regional socioeconomic development and argues that regional industrialization and urbanization can affect rural development through the spillover of their polarization effects, thus realizing “top-down” rural development [48]. Endogenous rural development theory focuses on the natural resources and human elements of rural areas and believes that the potential of rural resources can be fully explored through appropriate methods to achieve “bottom-up” rural development [49]. Comprehensive rural development theory overcomes the deficiencies of the previous two theories by focusing on the linkage and balance of internal and external factors in rural areas and pointing out that rural development is the result of a combination of local endogenous forces and external driving forces [50,51].
Essentially, RTD is the result of the interaction between the internal and external subsystems of rural regional system. The key to the former lies in the strength of rural self-development capabilities, while the latter mainly depends on regional industrialization and urbanization [52,53]. Based on data availability and a review of existing studies [8,52,54,55], four variables, namely average altitude, per capita farmland area, average years of schooling, and road density, were selected to feature the level of rural self-development capacity, and four variables, namely, per capita GDP, level of agricultural mechanization, per capita income of rural households, and urban–rural dual structure, were employed to characterize the development of regional industrialization and urbanization (Table 2).
Among the commonly used regression models, the ordinary least squares (OLS) model ignores spatial effects, and the geographically weighted regression (GWR) model ignores temporal effects although spatial effects are considered. Therefore, the estimation results of these models are biased. Based on the GWR model, Huang et al. [56] proposed the GTWR model, which takes both temporal and spatial effects into consideration, making the model estimation results more accurate and providing an analytical basis for dealing with spatio-temporal non-stationarity. Here, the GTWR model is employed to explore the factors influencing RTD in the Yanshan-Taihang Mountains from 2000 to 2020, and its expression is as follows:
y i = β 0 ( μ i , v i , t i ) + k = 1 p β k ( μ i , v i , t i ) x i k + ε i
where yi is the RTD level of county i; xik is the value of the kth independent variable of county i; ui and vi are the longitude and latitude of the center of gravity, respectively; ti is the time sequence; β0 (ui, vi, ti) is the regression constant, which is also the intercept of the GTWR model; βk (ui, vi, ti) is the kth regression coefficient; p is the total number of explanatory variables; and εi is the residual term of the model.

3. Study Area and Data Sources

3.1. Study Area

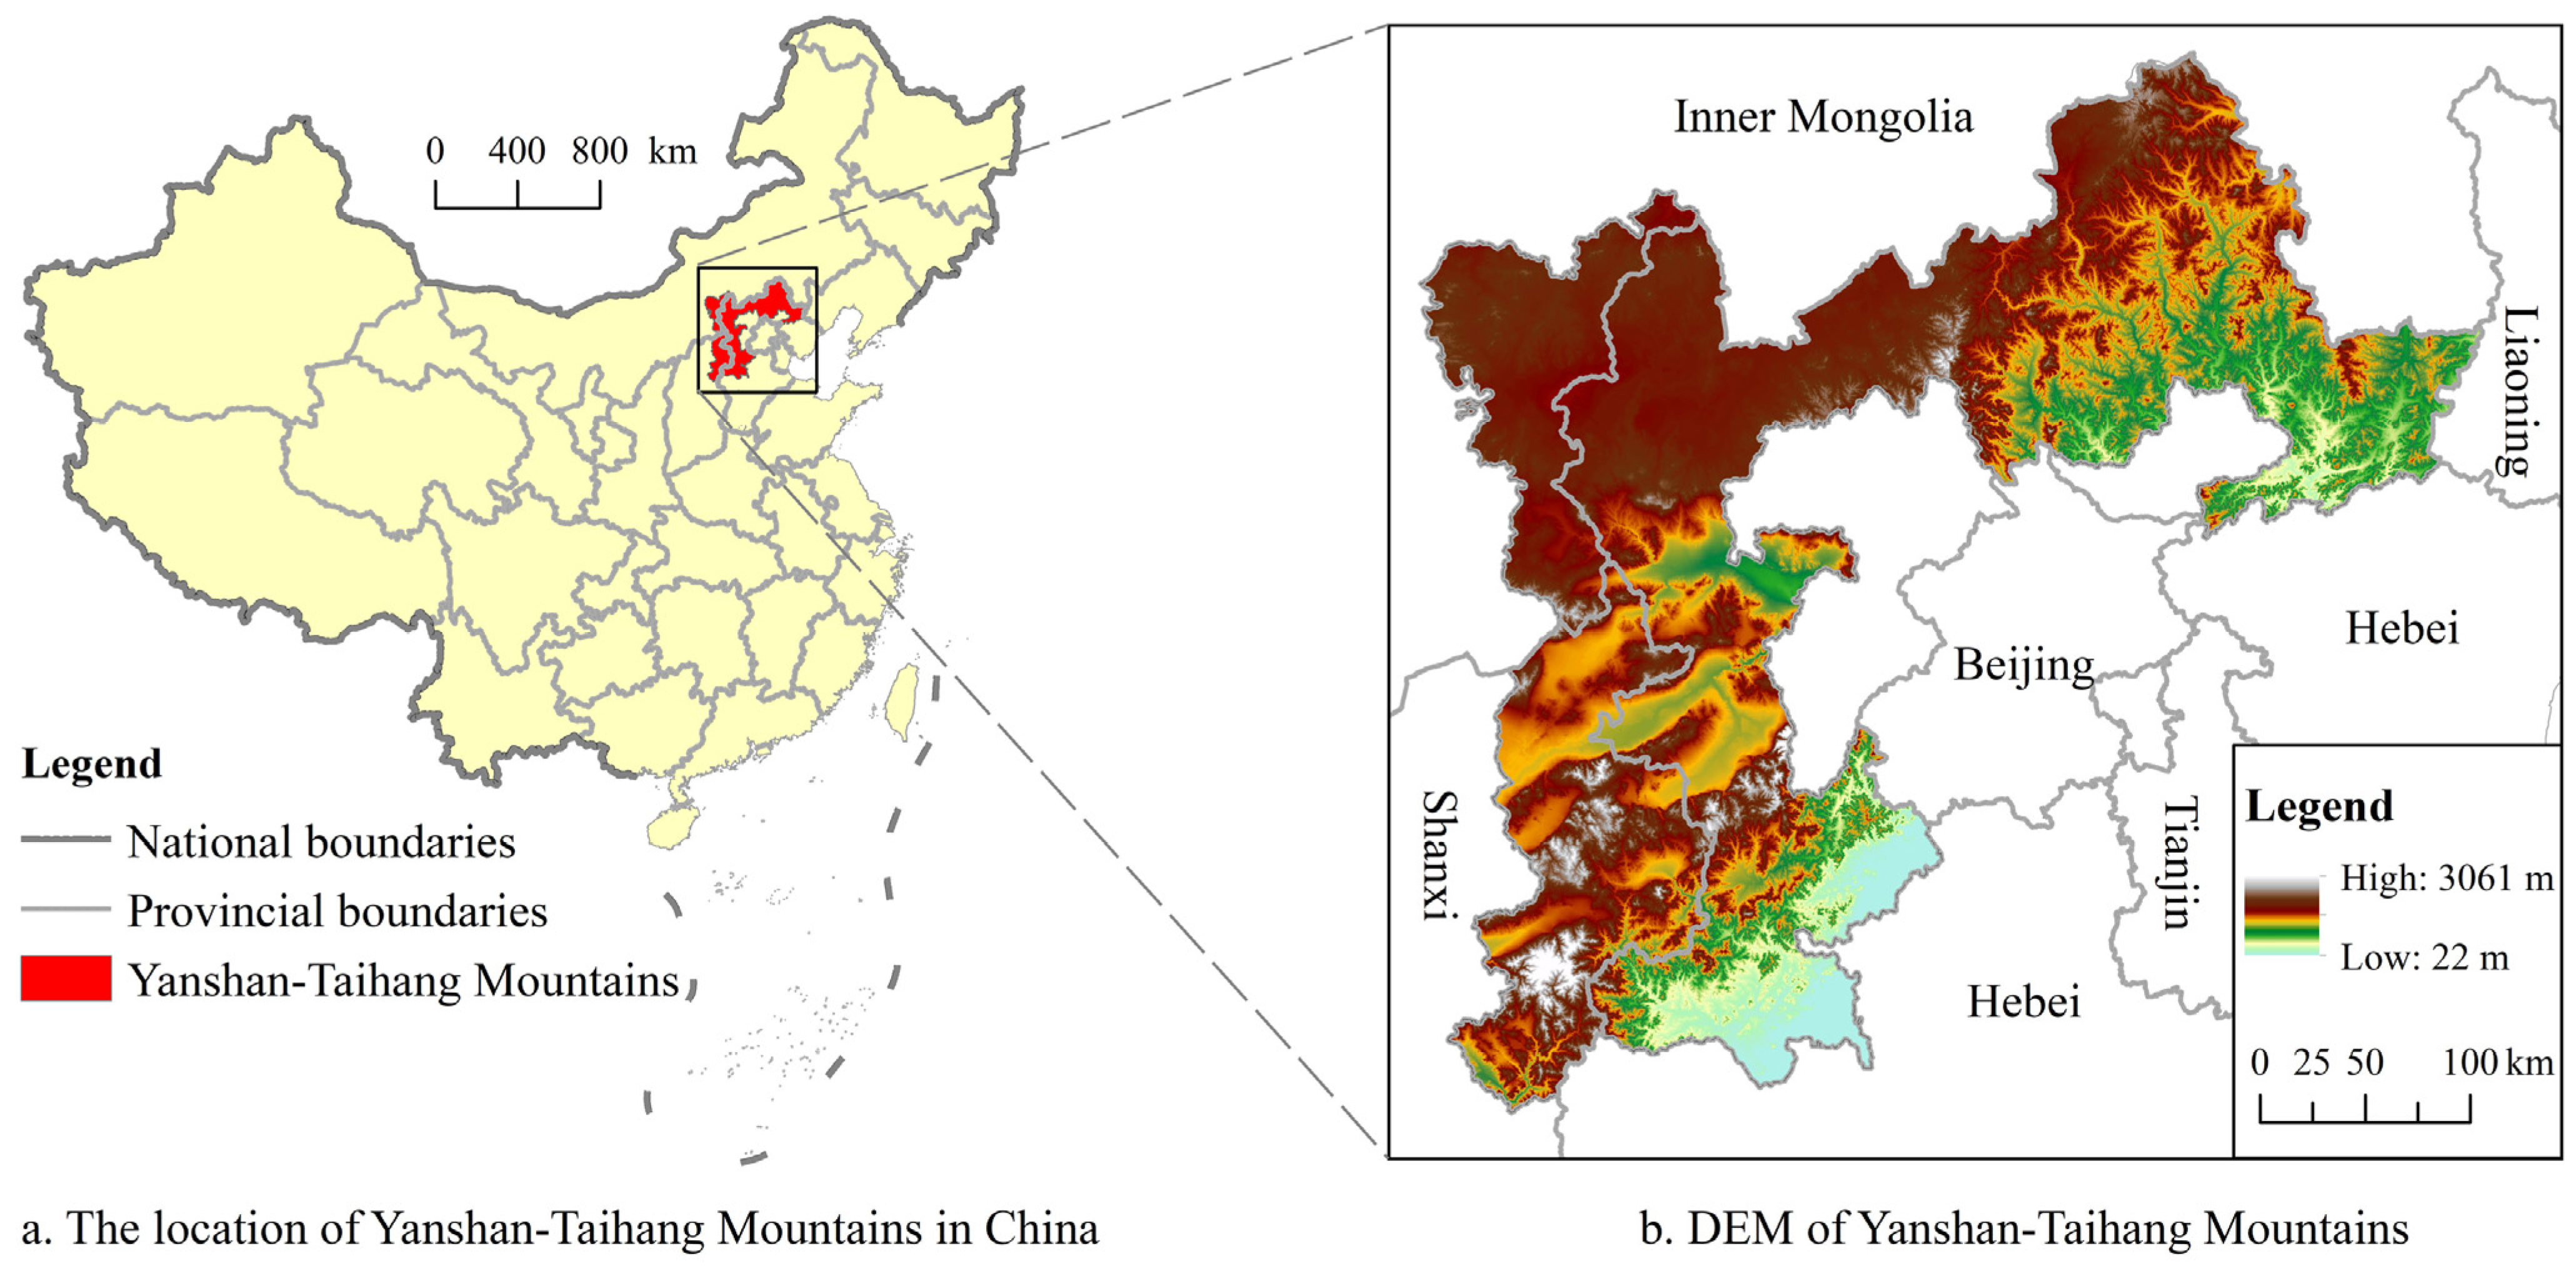
The Yanshan-Taihang Mountains are located in the hinterland of the Yanshan and Taihang Mountains, with a total area of 93,000 km2 (Figure 2). In terms of administrative division, it covers 33 counties in Hebei, Shanxi and Inner Mongolia, including 25 old revolutionary counties and 5 ethnic autonomous counties. Due to the constraints such as fragile ecology, poor infrastructure and frequent disasters, poverty has long been a prominent problem and challenge for rural development in the Yanshan-Taihang Mountains. If calculated at the constant price of 2300 yuan in 2010, the rural poverty-stricken population in the Yanshan-Taihang Mountains reached 2.19 million in 2013, with a poverty incidence of 31.58%. Generally, rural poverty in this region presents the main characteristics of large amount, wide distribution, deep degree and difficulty in poverty alleviation [57]. Over the past decades, the Yanshan-Taihang Mountains have actively promoted poverty alleviation and development based on rapid economic development and continuous policy investment. In 2020, the elimination of absolute poverty in the rural Yanshan-Taihang Mountains indicated that rural development in this region has entered a new stage of consolidating and expanding antipoverty achievements and comprehensively promoting rural revitalization.

3.2. Data Sources and Processing

This study takes a county as the basic spatial analysis unit. The administrative division data come from the National Geomatics Center of China (http://www.ngcc.cn/ngcc/) (accessed on 15 June 2022), and the DEM, NDVI and land use data are downloaded from the Resource and Environment Science and Data Center (https://www.resdc.cn/) (accessed on 15 June 2022). Socioeconomic data were collected from the China County Statistical Yearbook, China Statistical Yearbook for Regional Economy, Hebei Economic Yearbook, Shanxi Statistical Yearbook, Inner Mongolia Statistical Yearbook, and the statistical bulletins on national economic and social development of each county. Population data are obtained from tabulation on the 2000 and 2010 population census of the People’s Republic of China by county, and the main data bulletins of the seventh census of each county. In terms of the missing data, they are replaced by the data of adjacent years or the average of prefecture-level municipalities. Table 3 presents statistics of the indicators measuring RTD level and the pre-selected influencing factors. To eliminate the influence of dimensional differences on RTD level, the max–min normalization method is employed to standardize each indicator. Additionally, all data were treated as a whole and then further analyzed by year to achieve comparable results across years.

4. Empirical Results

4.1. Spatio-Temporal Patterns of RTD in Yanshan-Taihang Mountains

4.1.1. Spatio-Temporal Patterns of Quantitative Changes

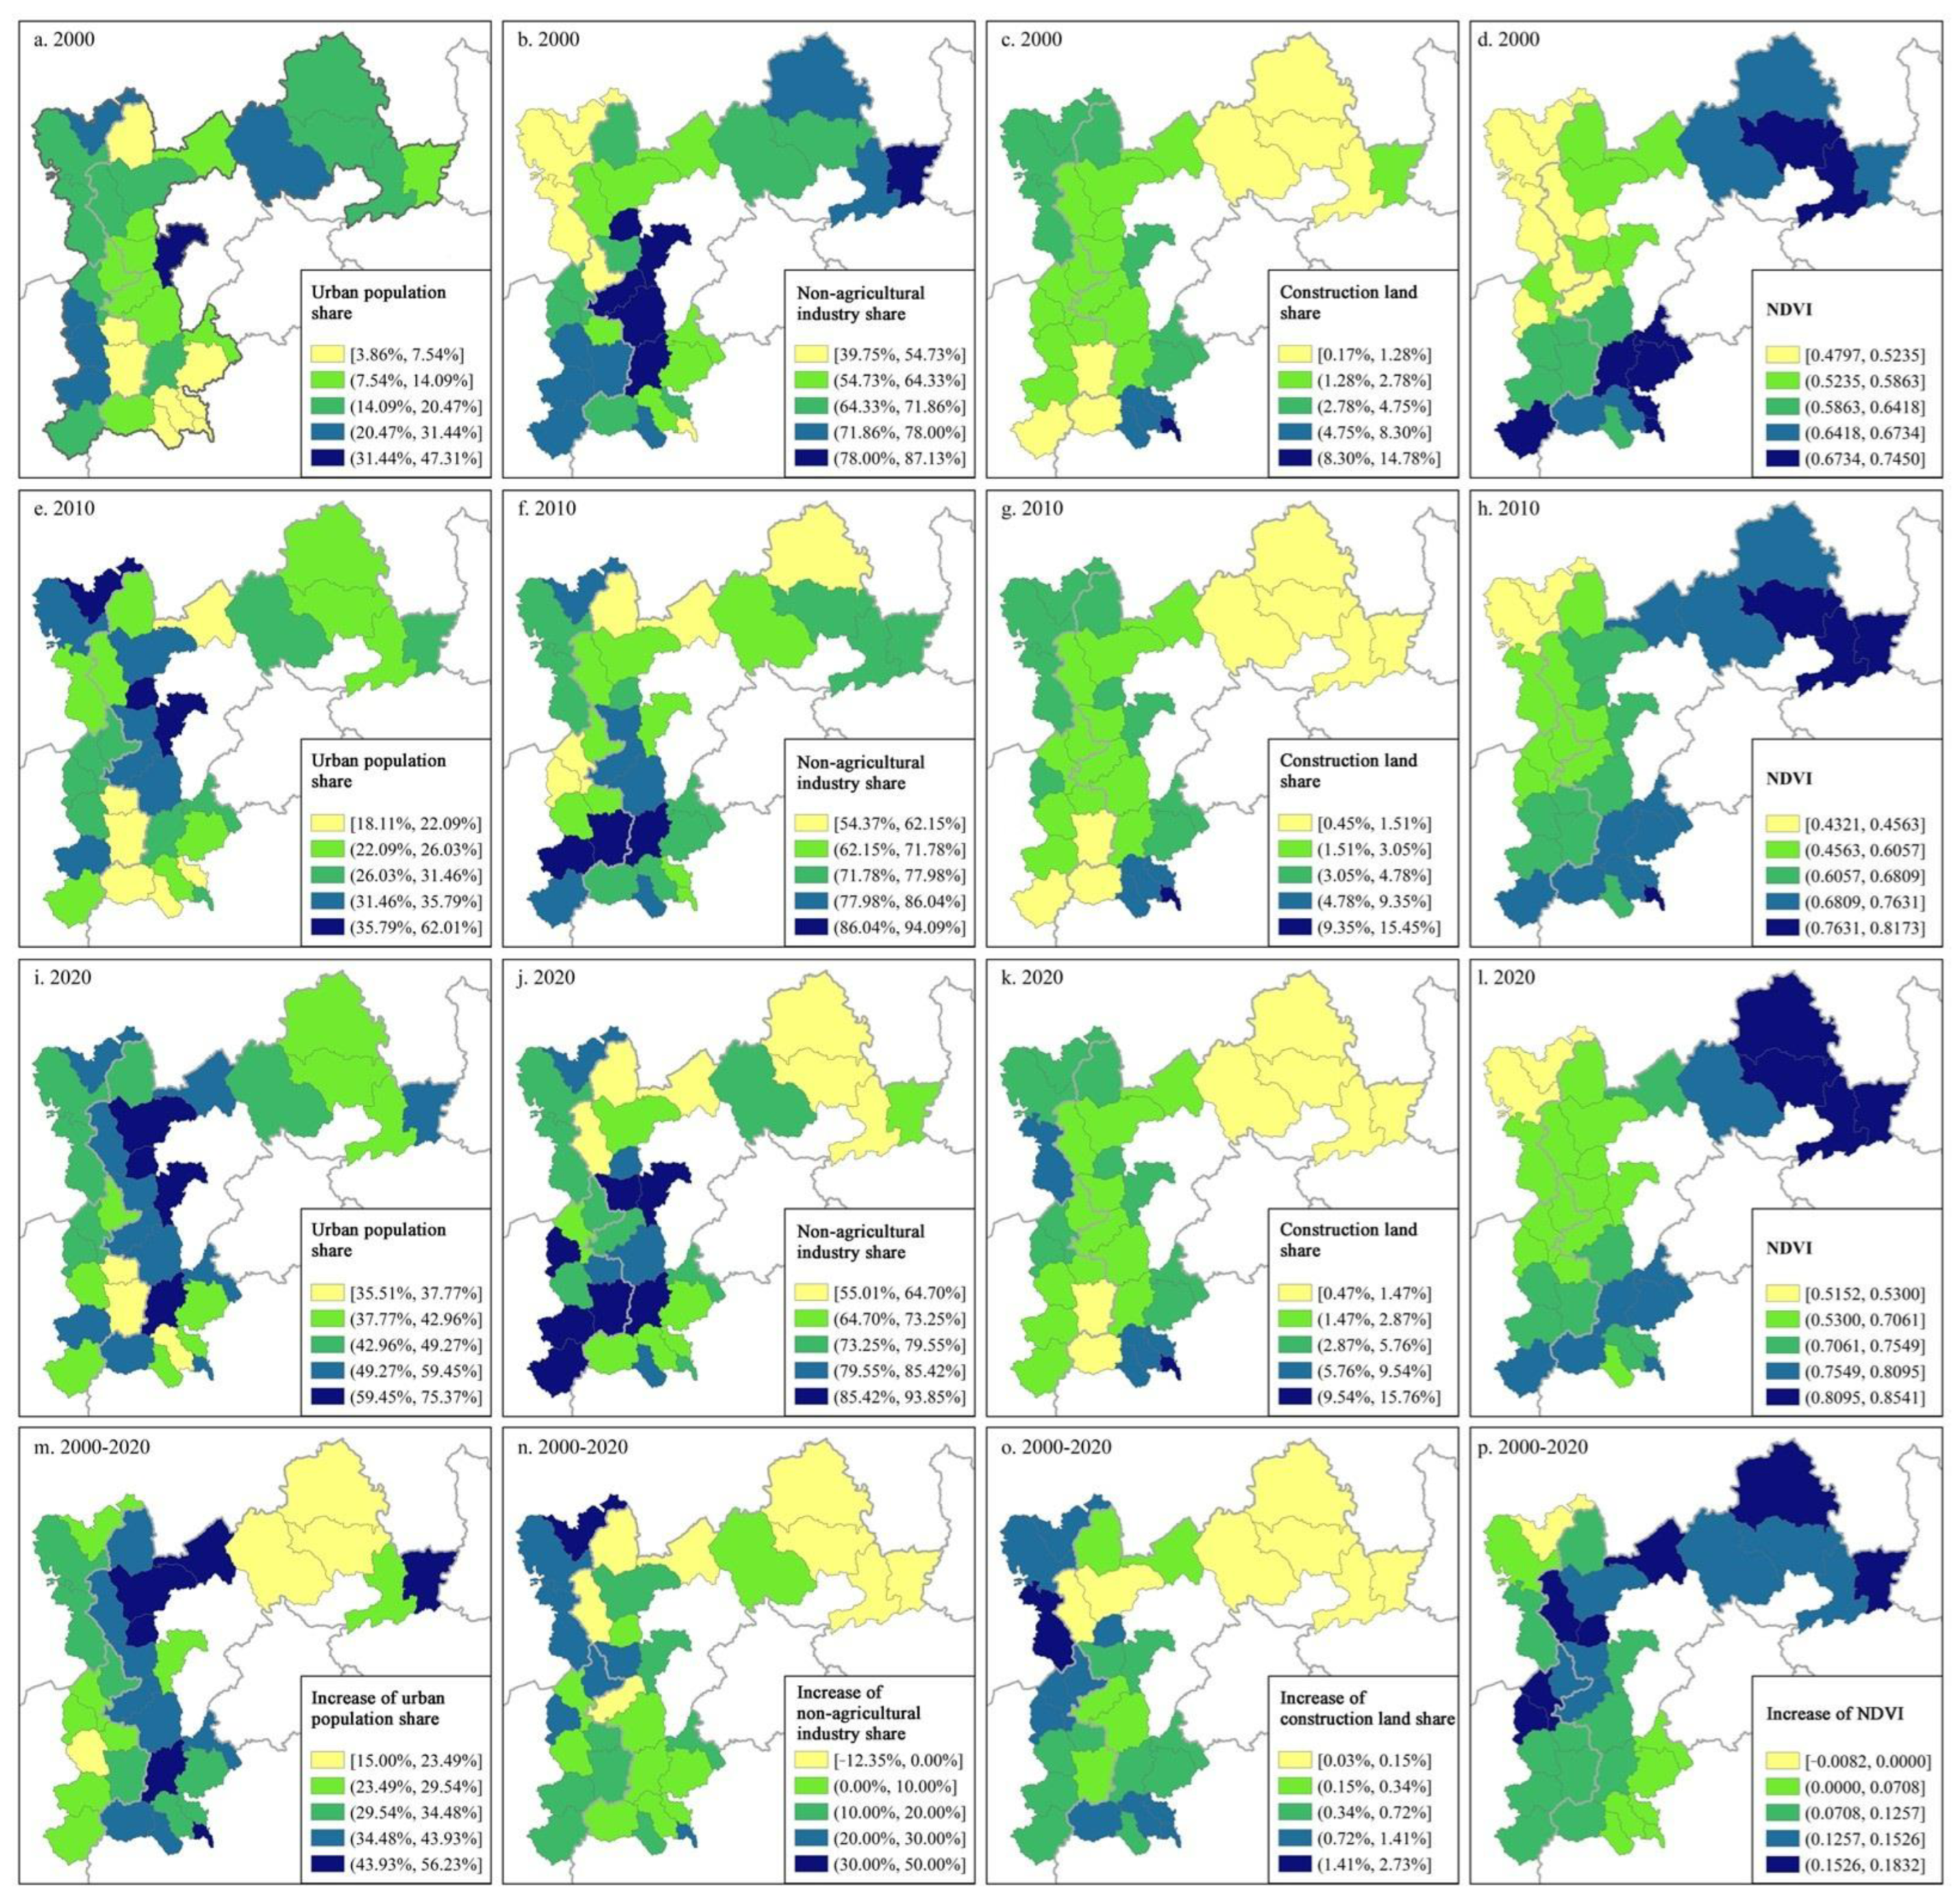
Using the four indicators of urban population share, non-agricultural industry share, construction land share and NDVI, the evolution of rural human, economic, resource and environmental elements of the Yanshan-Taihang Mountains from 2000 and 2020 is revealed to feature the quantitative changes of RTD.
(1) Urban population share
In 2000, the urban population share in the Yanshan-Taihang Mountains was generally at a low level, with most counties having a ratio of less than 20% and relatively high-value counties being scattered (Figure 3a). In 2010, the urban population share increased rapidly, with relatively high-value counties mainly located in Zhangjiakou (Figure 3e). In 2020, only Guangling, Linqiu, Tangxian and Longhua had a ratio below 40%, and the relatively high-value counties concentrated on the Hebei side of Taihang Mountains (Figure 3i). In terms of changes, most counties had higher increases in 2010–2020 than in 2000–2010. Spatially, counties with small increases were mainly distributed in the Yanshan Mountains, and counties with large increases were mainly distributed in Hebei; the highest average increase was in Hebei, and the lowest was in Shanxi (Figure 3m).
(2) Non-agricultural industry share
In the three selected time sections, the non-agricultural industry share in the counties of the Taihang Mountains was generally higher than that in the Yanshan Mountains. Specifically, the county non-agricultural industry share in 2000 and 2010 showed a decreasing trend from east to west and from south to north (Figure 3e,f). In 2020, the decreasing trend in this ratio from south to north was still obvious, but the feature of decreasing from east to west was not obvious (Figure 3j). From 2000 to 2020, counties with negative growth in the non-agricultural industry share were mainly distributed in the Yanshan Mountains, especially Weichang, Pingquan and Chengde, with a decline of more than 12 percentage points; the increase in the non-agricultural industry share in the Taihang Mountains generally showed a gradual upward trend from south to north (Figure 3n).
(3) Construction land share
Due to the location in mountainous areas and the positioning of national key ecological function zone, most counties in the Yanshan-Taihang Mountains ran at a low construction land share, and only a few counties located in the transition zone from the Taihang Mountains to the North China Plain had a relatively high construction land share. Specifically, the county construction land share showed an increasing trend from east to west and from south to north in 2000, 2010 and 2020, and the low-value counties were concentrated in the Yanshan Mountains and the deep Taihang Mountains (Figure 3c,g,k). The increase in the county construction land share in the Yanshan Mountains was generally small, while the Taihang Mountains presented a spatial characteristic of being smaller in the east than in the west, i.e., the county increase in Hebei was generally smaller than that in Shanxi and Inner Mongolia (Figure 3o).
(4) NDVI
As an important ecological security barrier in the Beijing–Tianjin–Hebei region, the NDVI of the study area has been at a relatively high level for a long time. Spatially, the county NDVI in 2000, 2010 and 2020 showed a decreasing from east to west and from north to south (Figure 3d,h,l). In terms of changes, the increase in NDVI in the Yanshan Mountains was significantly greater than that in the Taihang Mountains; except for the counties in Inner Mongolia, the increase in NDVI generally shows a divergence of increasing from south to north (Figure 3p).

4.1.2. Spatial and Temporal Patterns of RTD

Using Equation (1), this study measures the coupling coordination degree among the elements of rural regional system in each county, thus revealing RTD level in the Yanshan-Taihang Mountains from 2000 to 2020 (Figure 4). In 2000, RTD in most counties was in a disorderly state, accounting for 75.76% of the total. Therefore, rural development in the Yanshan-Taihang Mountains generally faced problems such as insufficient endogenous power, fragile ecological environment and prominent urban–rural dual structure, which determined the prevalence of rural poverty. In 2010, most counties achieved a leap in RTD status, and the ratio of counties in the state of barely and primary coupling coordination increased from 24.24% in 2000 to 84.85%. With the victory in the decisive fight against poverty, most counties in the Yanshan-Taihang Mountains reached a RTD state of coupling coordination in 2020, especially in Xuanhua and Wangdu, where RTD entered a state of advanced coupling coordination. Spatially, in 2000, the state of county RTD in the south of the study area was significantly better than that in the north; in 2010 and 2020, the county RTD showed a similar spatial pattern, i.e., RTD in the Taihang Mountains generally outperformed that in the Yanshan Mountains.
In terms of the changes in RTD level from 2000 to 2020, all counties in the Yanshan-Taihang Mountains, except Weichang, achieved a leap in RTD level (Table 4). Specifically, the number of counties with an RTD level upgraded from imminent disorder to primary coupling coordination was the largest at seven, followed by six counties with an RTD level upgraded from imminent disorder to intermediate coupling coordination. The number of counties that upgraded from mild disorder to primary coupling coordination and from barely coupling coordination to intermediate coupling coordination was both four, and the number of counties with other state transitions did not exceed three.
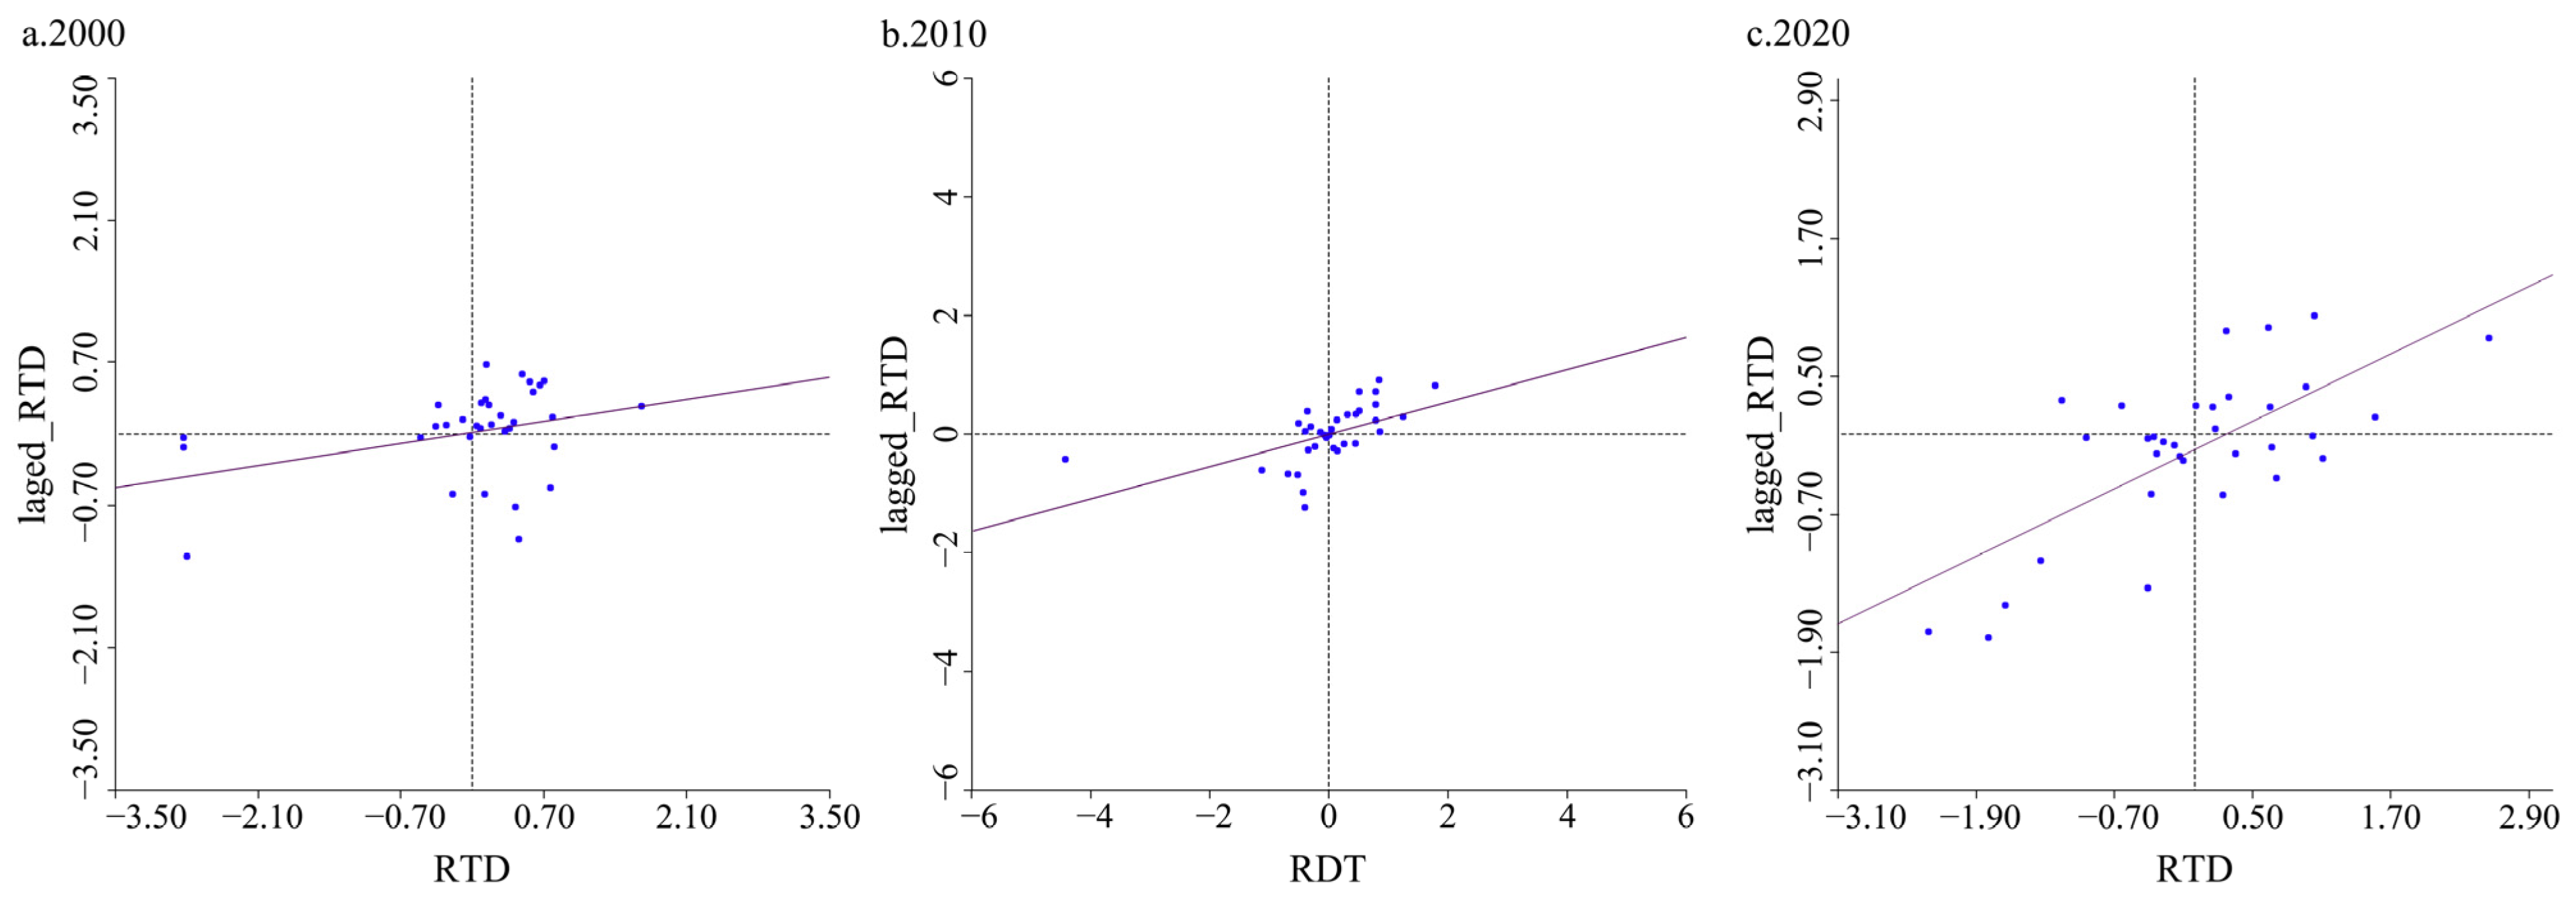
Further, Geoda was employed to analyze the spatial characteristics of county RTD level in the Yanshan-Taihang Mountains. In 2000, 2010 and 2020, the global Moran’s I of county RTD level was 0.154, 0.269 and 0.489, respectively, indicating a positive spatial correlation of RTD, and this correlation showed an increasing evolutionary trend. The Moran scatterplot showed that the number of counties in the first quadrant (high-value counties surrounded by high-value counties) decreased from 18 in 2000 to 13 in 2010 and further to 11 in 2020; the number of counties in the third quadrant (low-value counties surrounded by low-value counties) increased from 6 in 2000 to 10 in 2010 and further to 14 in 2020; the number of counties in the second quadrant (low-value counties surrounded by high-value counties) was 4, 5 and 2 in 2000, 2010 and 2020, respectively; and the number of counties in the fourth quadrant (high-value counties surrounded by low-value counties) was 5 in both 2000 and 2010, increasing to 6 in 2020 (Figure 5). In general, nearly 70% of the counties were distributed in the first and third quadrants, indicating that most counties had similar RTD level to their neighboring counties during the study period.

4.2. Factors Influencing RTD in Yanshan-Taihang Mountains

Due to the large values of average altitude, per capita GDP and per capita income of rural households, the logarithmic operation of the three independent variables was performed to facilitate calculation. Meanwhile, the data were diagnosed for multicollinearity using SPSS 23.0. The results showed that after excluding the variable of per capita income of rural households, the variance inflation coefficients of the remaining independent variables were less than 10, and the tolerance was greater than 0.10, indicating that there was no significant collinearity among the remaining independent variables and can be used for model fitting analysis. Additionally, the key parameters of the GTWR and OLS model regression were given in Table 5. According to the Akaike information criterion (AIC) and R2, the GTWR model significantly outperforms the OLS model, i.e., the GTWR model can better reveal the influence of the pre-selected independent variables on RTD.
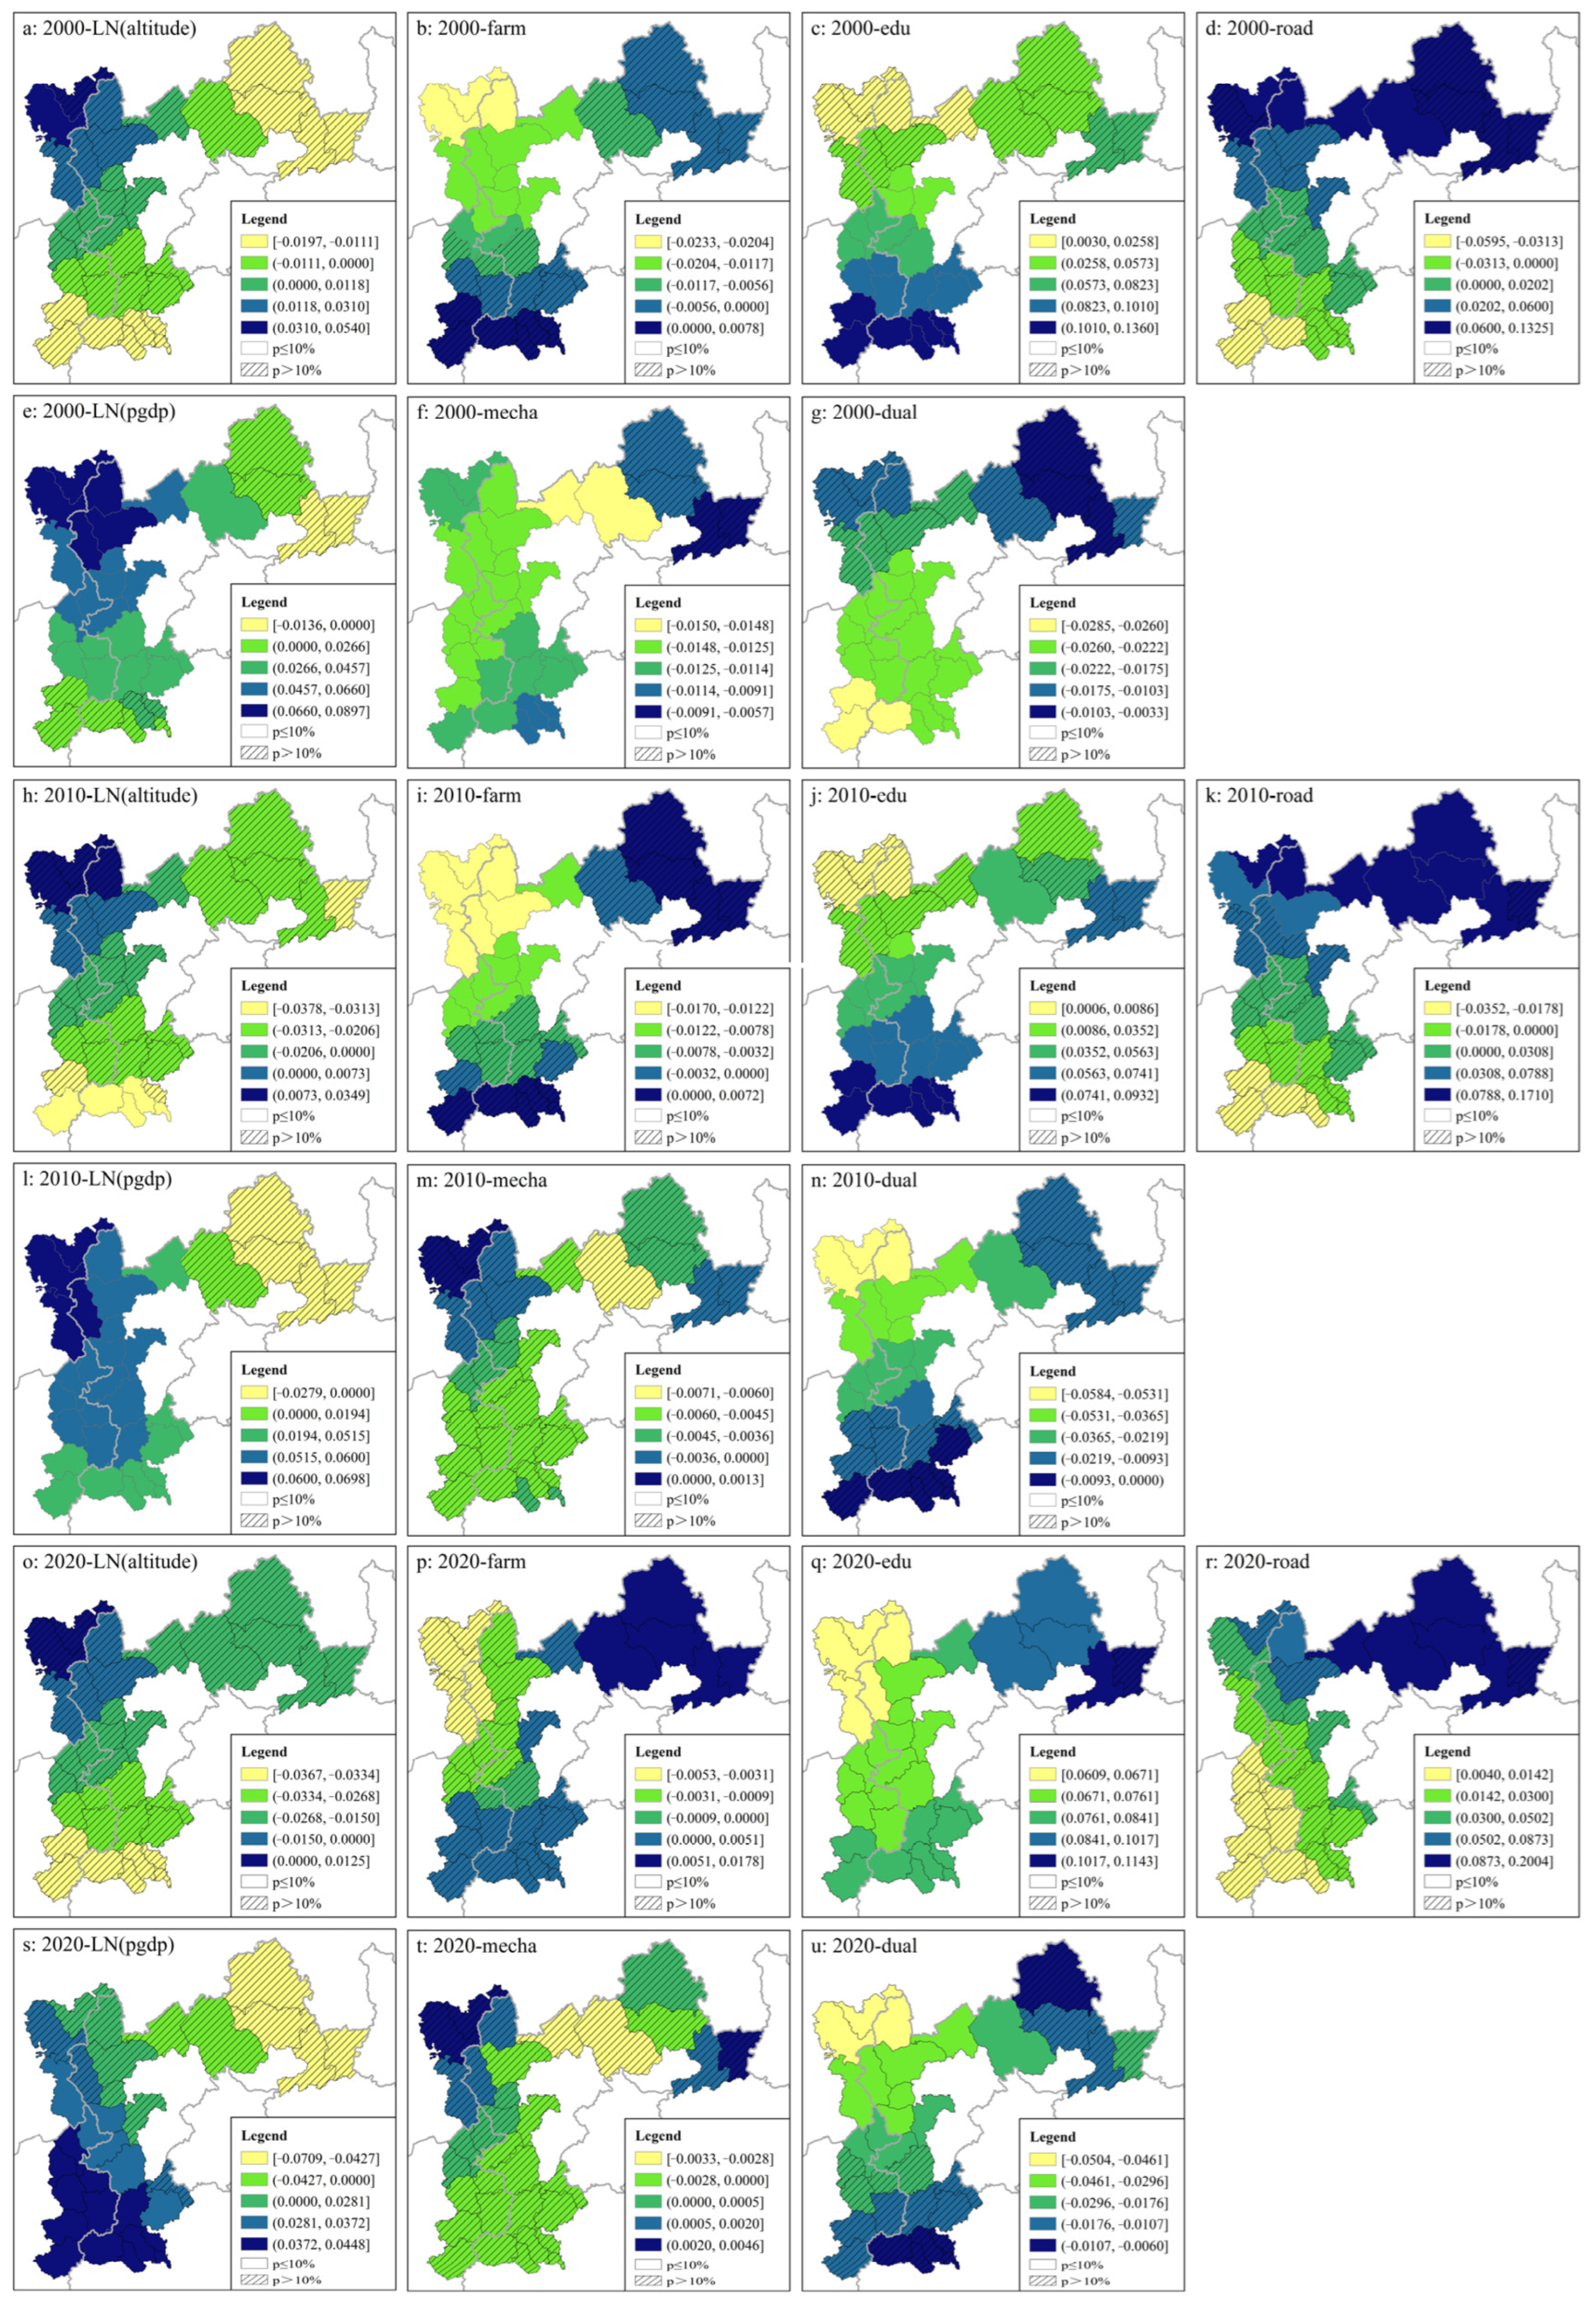
As can be seen from Figure 6, there were significant regional differences in the effects of the remaining seven independent variables on RTD of the Yanshan-Taihang Mountains.
(1)
Average altitude (altitude). Most counties had a negative effect of average elevation on RTD, but only a few counties passed the significance test. Especially in 2020, all counties failed the 10% significance test. The main reason for this was that the development of productivity made the role of natural conditions in RTD insignificant.
(2)
Per capita farmland area (farm). In 2000 and 2010, the effect of per capita farmland area on RTD was mainly negative, and the counties in the western Yanshan Mountains and northern Taihang Mountains both passed the significance test. In 2020, the impact of per capita farmland area was mainly positive, with few counties passing the significance test, concentrated in eastern Yanshan Mountains. This change reflects the diminishing role of natural factors in human activities as productivity develops.
(3)
Average years of schooling (school). The effect of average years of schooling on RTD was positive, and the counties passing the significance test in 2000 and 2010 were mainly distributed in the central and southern Taihang Mountains, and most counties in the Yanshan-Taihang Mountains passed the significance test in 2020. The average years of schooling reflect the accumulation of human capital in rural areas, and its role in RTD is becoming increasingly prominent.
(4)
Road density (road). The effect of road density on RTD was mainly positive, but only a few counties passed the significance test, mainly concentrated in the Yanshan Mountains. This was mainly because there were many cross-border roads distributed in the Taihang Mountains, which did not have a significant driving effect on RTD; while the roads in the Yanshan Mountains better played their tandem role to promote RTD.
(5)
Per capita GDP (pgdp). The effect of per capita GDP on RTD was mainly positive, and most counties passed the significance test, indicating that the county economy was an important support for RTD. Specifically, the impact of per capita GDP on RTD in 2000 was significantly positive in most counties except for those in the eastern Yanshan Mountains and southern Taihang Mountains; in 2010 and 2020, the counties with significantly positive effects were mainly located in the Taihang Mountains.
(6)
Level of agricultural mechanization (mecha). The effect of the level of agricultural mechanization on RTD was mainly negative, but the counties whose effects passed the significance test were concentrated in 2000, and all counties failed the significance test in 2010 and 2020. This was mainly due to the declining share of agriculture in rural economy caused by the restructuring of rural industrial during rapid industrialization and urbanization, which in turn led to an increasingly insignificant role of agriculture in RTD.
(7)
Urban–rural dual structure (dual). The effect of urban–rural dual structure on RTD was negative, and most counties passed the significance test, indicating that the more pronounced the urban–rural dual structure, the lower the RTD level. Spatially, the counties that passed the significance test in 2000 were mainly distributed in the Taihang Mountains, while in 2010 and 2020, they were mainly distributed in the western Yanshan Mountains and northern Taihang Mountains.

5. Discussion

5.1. Reexamining RTD and Its Influencing Factors in Poverty-Stricken Areas

Rural development has its own laws and follows a life cycle of germination, growth, maturity, and decline/leap [58,59]. The first-nature geography, dominated by natural conditions [60], plays a decisive role in the early stages of rural development. Due to the low resource and environmental carrying capacity, conflicts between rural people and environment often arise when the intensity of human activities increases, exacerbating the unsustainability of rural development and rural decline. As rural development level increases, the role of first-nature geography continues to diminish, but its fundamental supporting role remains significant [61]. Correspondingly, the role of second-nature geography, referring to human conditions [60], is increasing, i.e., rural development is shifting from a resource orientation to a knowledge and technology orientation. During this process, many rural populations are transformed into urban populations, the rural industrial structure changes from predominantly agricultural to non-agricultural, and a large amount of agricultural land is transformed into construction land. As a result, rural areas have changed from small to large in both amount and scale.
Sachs [62] once stated that “geography is destiny. If a country is geographically closed, inaccessible, environmentally vulnerable to disease and extreme weather, and has poor soil, it will be poor”. Although this statement has been challenged for overemphasizing the decisive role of natural conditions, it is true that poverty is spatially uneven. In China, most of the poor are distributed in rural areas, especially those with remote location, scarce resources, fragile ecology and poor infrastructure [57,63,64]. Meanwhile, large-scale poverty alleviation and development have led to an increasing concentration of poor people in areas with poor location conditions such as deep rocky mountains, alpine areas and ecologically fragile areas, and the effectiveness of poverty reduction achieved with the same amount of antipoverty resources has also shown a diminishing trend [57].
Escaping poverty is the greatest transformation of rural development in poverty-stricken areas, and it is also a prerequisite for their agricultural and rural modernization. Due to the multidimensional nature of poverty [65], comprehensive measures should be taken to fill the shortcomings and strengthen the weaknesses to enhance the sustainable development capacities of rural areas; on the other hand, regional industrialization and urbanization should be promoted to consolidate the support for rural poverty alleviation and development. Meanwhile, institutional reforms and policy innovations are needed to avoid excluding poor individuals and regions from socio-economic development. Over the past few decades, China’s large-scale poverty alleviation has aimed to ensure that the poor are well fed and clothed, and that their needs for compulsory education, basic healthcare and safe housing are guaranteed. Moreover, the development levels of industrialization and urbanization in poverty-stricken areas are improved to increase support for the poor to escape from poverty and promote the transformation and development of poor villages to a higher level.

5.2. Paths for RTD in Yanshan-Taihang Mountains under the Background of Rural Revitalization

Currently, the Yanshan-Taihang Mountains have achieved the leap from inadequate subsistence to full well-off status. However, the shortcomings of rural development remain prominent, resulting in the persistence of relative poverty and the risk of returning to poverty. With the transformation of China’s principal social contradictions, the rural revitalization strategy has become the general grasp of issues concerning agriculture, rural areas and farmers in the Yanshan-Taihang Mountains. In this context, targeted measures are needed to enhance the sustainable development capacities of rural areas and help modernize agriculture and rural areas and the high-quality rural development in the Yanshan-Taihang Mountains.
First, the development level of rural education needs to be improved. The government should strengthen investment in rural education, especially actively promote the development of “internet + education”, accelerate the digital transformation and intelligent upgrading of rural education, and promote the sharing of high-quality educational resources and the effective matching of educational demand and supply.
Second, the county transportation infrastructure needs to be improved. The government should promote the construction of transportation infrastructure, build a transportation network with clear functions, reasonable layout, and moderate scale, support the extension of industrial chains and the upgrading of value chains, improve the capacity and level of rural roads, and support rural development in the Yanshan-Taihang Mountains.
Third, the level and quality of county economic development need to be improved. The main function assigned by the central government determines that economic development in this region must abandon the traditional development path and rely on its ecological advantages to promote ecological industrialization and industrial ecologization. Meanwhile, it is necessary to actively promote the integrated development of primary, secondary, and tertiary industries, and build a modern industrial system through chain extension, technology penetration and policy innovation.
Fourth, system reform is needed to promote urban–rural integrated development. Focusing on improving the property rights system and optimizing resource allocation, the government should deepen the reform of land and hukou systems and accelerate the construction of mechanism for urban–rural integrated development. Meanwhile, there is an urgent need to actively promote the development of new-type urbanization, with the county-town as the carrier, and give full play to the important role of the county town in connecting cities and serving rural areas.

5.3. Suggestions for Global Poverty Alleviation and Development

Poverty means the lack of livelihood capital, and its accompanying problems such as hunger, disease and social conflict seriously hinder people’s pursuit of a better life. Therefore, poverty eradication is not only a common aspiration of all people, but also an important goal that governments strive to achieve [57,66]. From the Millennium Development Goals (MDGs) in 2000 to the Sustainable Development Goals (SDGs) in 2015, a series of programmatic documents guiding poverty alleviation and development have greatly contributed to the development of poverty-stricken areas and the reduction in the poverty-stricken population. Globally, the proportion of people living in extreme poverty declined from 36% in 1990 to 10% in 2015 [67]. However, global poverty reduction is extremely uneven due to the spatial heterogeneity of locations, with East Asia and the Pacific achieving the most notable success in poverty reduction, especially China, which contributes more than 70% of total global poverty reduction [68,69]. In South Asia and sub-Saharan Africa, factors such as conflict, a lack of natural resources, being deep inland and surrounded by hostile neighbors, and poor governance have contributed to the large number of poverty-stricken population and the slow process of poverty reduction in these regions [70]. Moreover, the COVID-19 pandemic has put global poverty reduction gains at risk, and the goal of no poverty by 2030 will not be achieved without rapid and substantial policies and measures [71]. In this context, China’s antipoverty experience provides important policy implications for other countries to overcome poverty and achieve the 2030 SDGs.
First, industrialization should be actively promoted to improve the level of regional economic development. At the same time, industrialization can also support the development of urbanization, and gradually solve the long-standing slum problems in less developed regions and countries through coordinated development with urbanization. Second, investment in education should be strengthened to transform the quantitative advantage of the population in poverty-stricken areas into a human capital advantage. On the one hand, education improves total factor productivity through human capital accumulation; on the other hand, education promotes industrial transformation and upgrading by improving people’s knowledge and skills and cultivating workers needed for industrial development. Further, the construction of transportation networks should be strengthened. It is necessary to promote the integration and coordination of various transportation, such as railways and highways, to realize smooth passenger transportation and efficient freight transportation, and improve comprehensive transportation efficiency. As a result, it is conducive to the import of external factors to make up for the shortcomings of the region and the export of superior production factors, improving the effectiveness of regional economic development. Finally, institutional innovation is needed to realize the sharing of development results. An important reason why the poor are poor is that they are excluded from socio-economic development. Therefore, it is necessary to optimize regional relations and urban–rural relations through political, economic and social system innovation, so that the poor can equally enjoy the fruits of economic development.

6. Conclusions

RTD is a dynamic process in which a rural regional system changes from one qualitative state to another on the basis of continuous quantitative changes in the elements, and the key to understanding it lies in diagnosing the structural and functional changes of the system on the basis of exploring element changes. Therefore, the quantitative analysis of RTD can be characterized by measuring the coupling coordination degree of the human, economic, resource and environmental elements of the rural regional system. From 2000 to 2020, the county urban population share, non-agricultural industry share, construction land share and NDVI in the Yanshan-Taihang Mountains increased significantly, contributing to the leap in RTD level, and the proportion of counties with RTD in a coupling coordination state increased from 24.24% to 96.97%. Spatially, there was an increasing positive spatial correlation between the county RTD levels in the Yanshan-Taihang Mountains, where the RTD status in the Taihang Mountains was significantly better than that in the Yanshan Mountains. The estimation results of the GTWR model showed that the average years of schooling, road density, per-capita GDP and urban–rural dual structure were the main factors affecting RTD in the Yanshan-Taihang Mountains, and there were obvious differences in the regression coefficients of each factor. Specifically, the urban–rural dual structure had a negative impact on RDT, while the average years of education was positive, and road density and per-capita GDP were mainly positive.
The experience of developed countries shows that without the modernization of agriculture and rural areas, there is no modernization of the whole country [72]. Therefore, developing countries should strengthen factor inputs to promote agricultural and rural development. Focusing on areas that have been lifted out of poverty, the government should strengthen the sustainability of antipoverty policies and measures, consolidate antipoverty achievements, and improve the sustainable development capacity of rural areas. Meanwhile, since most of these areas are ecologically fragile areas, actively promoting RTD to a higher level is also of great significance for realizing regional ecological protection and high-quality development.

Author Contributions

Conceptualization, Y.G.; methodology, Y.G. and W.Z.; software, W.Z.; validation, Y.G.; formal analysis, Y.G.; investigation, Y.G. and W.Z.; resources, Y.G.; data curation, Y.G.; writing—original draft, Y.G. and W.Z.; writing—review and editing, Y.G.; visualization, Y.G.; supervision, Y.G.; project administration, Y.G.; funding acquisition, Y.G. All authors have read and agreed to the published version of the manuscript.

Funding

This research was supported by the National Natural Science Foundation of China (Grant No. 42001203, 41931293).

Data Availability Statement

The associated dataset of the study is available upon request to the corresponding author.

Acknowledgments

The authors are thankful to all the reviewers and editors.

Conflicts of Interest

The authors declare no conflict of interest.

References

  1. Bai, R.; Shi, Y.; Pan, Y. Land-use classifying and identification of the production-living-ecological space of island villages: A case study of islands in the western sea area of Guangdong province. Land 2022, 5, 705. [Google Scholar] [CrossRef]
  2. Long, H.; Tu, S.; Ge, D.; Li, T.; Liu, Y. The allocation and management of critical resources in rural China under restructuring: Problems and prospects. J. Rural Stud. 2016, 47, 392–412. [Google Scholar] [CrossRef]
  3. Hu, S.; Yu, B.; Wang, M. Rural restructuring and transformation: Western experience and its enlightenment to China. Geogr. Res. 2019, 38, 2833–2845. [Google Scholar]
  4. Cloke, P. State deregulation and New Zealand’s agricultural sector. Sociol. Rural. 1989, 1, 34–48. [Google Scholar] [CrossRef]
  5. Cloke, P. Country backwater to virtual village? Rural studies and ‘the cultural turn’. J. Rural Stud. 1997, 4, 367–375. [Google Scholar] [CrossRef]
  6. Gurr, G.M.; Wratten, S.D.; Luna, J.M. Multi-function agricultural biodiversity: Pest management and other benefits. Basic Appl. Ecol. 2003, 2, 107–116. [Google Scholar] [CrossRef]
  7. Liu, Y. Urban-Rural Transformation Geography; Springer: Singapore, 2021. [Google Scholar]
  8. Long, H.; Zou, J.; Pykett, J.; Li, Y. Analysis of rural transformation development in China since the turn of the new millennium. Appl. Geogr. 2011, 3, 1094–1105. [Google Scholar] [CrossRef]
  9. Lu, F.; Wang, X.; Han, B.; Ouyang, Z.; Duan, X.; Zheng, H.; Miao, H. Soil carbon sequestrations by nitrogen fertilizer application, straw return and no-tillage in China’s cropland. Glob. Chang. Biol. 2009, 2, 281–305. [Google Scholar] [CrossRef]
  10. Sattari, S.Z.; Van Ittersum, M.K.; Giller, K.E.; Zhang, F.; Bouwman, A.F. Key role of China and its agriculture in global sustainable phosphorus management. Environ. Res. Lett. 2014, 5, 054003. [Google Scholar] [CrossRef]
  11. Liu, Y.; Zang, Y.; Yang, Y. China’s rural revitalization and development: Theory, technology and management. J. Geogr. Sci. 2020, 12, 1923–1942. [Google Scholar] [CrossRef]
  12. Guo, Y.; Zhou, Y.; Liu, Y. Targeted poverty alleviation and its practices in rural China: A case study of Fuping county, Hebei Province. J. Rural Stud. 2022, 93, 430–440. [Google Scholar] [CrossRef]
  13. Guo, Y.; Liu, Y. The process of rural development and paths for rural revitalization in China. Acta Geogr. Sin. 2021, 6, 1408–1421. [Google Scholar]
  14. Long, H.; Ma, L.; Zhang, Y.; Qu, L. Multifunctional rural development in China: Pattern, process and mechanism. Habitat Int. 2022, 121, 102530. [Google Scholar] [CrossRef]
  15. Liu, Y. Research on the urban-rural integration and rural revitalization in the new era in China. Acta Geogr. Sin. 2018, 4, 637–650. [Google Scholar]
  16. Guo, Y.; Zhou, Y.; Han, Y. Population aging in rural China: Spatial-temporal pattern and countermeasures for rural revitalization. Geogr. Res. 2019, 3, 667–683. [Google Scholar]
  17. Cai, F.; Giles, J.; O’Keefe, P.; Wang, D. The Elderly and Old Age Support in Rural China; World Bank Publications: Washington, DC, USA, 2012. [Google Scholar]
  18. Ge, D.; Long, H.; Qiao, W.; Wang, Z.; Sun, D.; Yang, R. Effects of rural–urban migration on agricultural transformation: A case of Yucheng City, China. J. Rural Stud. 2020, 76, 85–95. [Google Scholar] [CrossRef]
  19. Liu, Y.; Dai, L.; Long, H.; Woods, M.; Fois, F. Rural vitalization promoted by industrial transformation under globalization: The case of Tengtou village in China. J. Rural Stud. 2022, 95, 241–255. [Google Scholar] [CrossRef]
  20. Meessen, B.; Bloom, G. Economic transition, institutional changes and the health system: Some lessons from rural China. J. Econ. Policy Reform 2007, 3, 209–231. [Google Scholar] [CrossRef]
  21. Pei, X. The contribution of collective landownership to China’s economic transition and rural industrialization: A resource allocation model. Mod. China 2002, 3, 279–314. [Google Scholar] [CrossRef]
  22. Liu, Y.; Yang, R.; Long, H.; Gao, J.; Wang, J. Implications of land-use change in rural China: A case study of Yucheng, Shandong Province. Land Use Policy 2014, 40, 111–118. [Google Scholar] [CrossRef]
  23. Long, H.; Qu, Y.; Tu, S.; Zhang, Y.; Jiang, Y. Development of land use transitions research in China. J. Geogr. Sci. 2020, 30, 1195–1214. [Google Scholar] [CrossRef]
  24. Zhou, Y.; Li, X.; Liu, Y. Land use change and driving factors in rural China during the period 1995–2015. Land Use Policy 2020, 99, 105048. [Google Scholar] [CrossRef]
  25. Chung, H. Rural transformation and the persistence of rurality in China. Eurasian Geogr. Econ. 2013, 5–6, 594–610. [Google Scholar] [CrossRef]
  26. Zhang, R.; Li, H.; Yuan, Y. Analyzing space-time evolution of rural transition in a rapidly urbanizing region: A case study of Suzhou, China. J. Geogr. Sci. 2022, 7, 1343–1356. [Google Scholar] [CrossRef]
  27. Jiang, T.; Shi, G.; Zhang, Y. Multifunctional rural transition along China’s Yangtze River Transect: Spatial differentiation and economic relevance. Environ. Sci. Pollut. Res. 2021, 43, 60726–60740. [Google Scholar] [CrossRef] [PubMed]
  28. Wilson, G.A.; Hu, Z.; Rahman, S. Community resilience in rural China: The case of Hu Village, Sichuan Province. J. Rural Stud. 2018, 60, 130–140. [Google Scholar] [CrossRef]
  29. Yang, R.; Pan, Y. Rural vulnerability in China: Evaluation theory and spatial patterns. J. Geogr. Sci. 2021, 10, 1507–1528. [Google Scholar] [CrossRef]
  30. Guo, Y.; Wang, J. Poverty alleviation through labor transfer in rural China: Evidence from Hualong County. Habitat Int. 2021, 116, 102402. [Google Scholar] [CrossRef]
  31. Guo, Y.; Liu, Y. Poverty alleviation through land assetization and its implications for rural revitalization in China. Land Use Policy 2021, 105, 105418. [Google Scholar] [CrossRef]
  32. World Bank. Poverty and Shared Prosperity 2020: Reversals of Fortune; The World Bank: Washington, DC, USA, 2020. [Google Scholar]
  33. Moyer, J.D.; Verhagen, W.; Mapes, B.; Bohl, D.K.; Xiong, Y.; Yang, V.; McNeil, K.; Solórzano, J.; Irfan, M.; Carter, C.; et al. How many people is the COVID-19 pandemic pushing into poverty? A long-term forecast to 2050 with alternative scenarios. PLoS ONE 2022, 7, e0270846. [Google Scholar] [CrossRef]
  34. World Bank. Poverty and Shared Prosperity 2022: Correcting Course; The World Bank: Washington, DC, USA, 2022. [Google Scholar]
  35. United Nations. The Sustainable Development Goals Report 2021; United Nations: New York, NY, USA, 2021. [Google Scholar]
  36. Kangal, K. Friedrich Engels and the Dialectics of Nature; Palgrave Macmillan: Cham, Switzerland, 2020. [Google Scholar]
  37. Dafermos, M. The metaphysics of psychology and a dialectical perspective. Theory Psychol. 2021, 3, 355–374. [Google Scholar] [CrossRef]
  38. Roth, W.M. Neoformation: A dialectical approach to developmental change. Mind Cult. Act. 2017, 4, 368–380. [Google Scholar] [CrossRef]
  39. Guo, Y.; Zhou, Y.; Cao, Z. Geographical patterns and anti-poverty targeting post-2020 in China. J. Geogr. Sci. 2018, 12, 1810–1824. [Google Scholar]
  40. Chigbu, U.E. Ruralisation: A tool for rural transformation. Dev. Pract. 2015, 7, 1067–1073. [Google Scholar] [CrossRef]
  41. Liu, Y.; Long, H.; Chen, Y.; Wang, J.; Li, Y.; Li, Y.; Yang, Y.; Zhou, Y. Progress of research on urban-rural transformation and rural development in China in the past decade and future prospects. J. Geogr. Sci. 2016, 8, 1117–1132. [Google Scholar] [CrossRef]
  42. Ohlan, R. Rural transformation in India in the decade of miraculous economic growth. J. Land Rural Stud. 2016, 2, 188–205. [Google Scholar] [CrossRef]
  43. Bertalanffy, L.V. General System Theory: Foundations, Development, Applications. G. Braziller, 1968. Available online: https://repository.vnu.edu.vn/handle/VNU_123/90608 (accessed on 6 March 2022).
  44. Okoli, C.; Pawlowski, S.D. The Delphi method as a research tool: An example, design considerations and applications. Inf. Manag. 2004, 1, 15–29. [Google Scholar] [CrossRef]
  45. Zhu, Y.; Tian, D.; Yan, F. Effectiveness of entropy weight method in decision-making. Math. Probl. Eng. 2020, 2020, 3564835. [Google Scholar] [CrossRef]
  46. Gkartzios, M.; Scott, M. Placing housing in rural development: Exogenous, endogenous and neo-endogenous approaches. Sociol. Rural. 2014, 3, 241–265. [Google Scholar] [CrossRef]
  47. Terluin, I.J. Differences in economic development in rural regions of advanced countries: An overview and critical analysis of theories. J. Rural Stud. 2003, 3, 327–344. [Google Scholar] [CrossRef]
  48. Aryeetey, E. Decentralization for rural development: Exogenous factors and semi-autonomous programme units in Ghana. Community Dev. J. 1990, 3, 206–214. [Google Scholar] [CrossRef]
  49. Ray, C. Towards a meta-framework of endogenous development: Repertoires, paths, democracy and rights. Sociol. Rural. 1999, 4, 522–537. [Google Scholar] [CrossRef]
  50. High, C.; Nemes, G. Social learning in LEADER: Exogenous, endogenous and hybrid evaluation in rural development. Sociol. Rural. 2007, 2, 103–119. [Google Scholar] [CrossRef]
  51. Lowe, P.; Murdoch, J.; Ward, N. Networks in rural development: Beyond exogenous and endogenous models. Beyond Mod. 1995, 5, 87–105. [Google Scholar]
  52. Liu, Y. Geography of New Countryside Construction in China; Science Press: Beijing, China, 2011. [Google Scholar]
  53. Tu, S.; Long, H. Rural restructuring in China: Theory, approaches and research prospect. J. Geogr. Sci. 2017, 10, 1169–1184. [Google Scholar] [CrossRef]
  54. Irwin, E.G.; Isserman, A.M.; Kilkenny, M.; Partridge, M.D. A century of research on rural development and regional issues. Am. J. Agric. Econ. 2010, 2, 522–553. [Google Scholar] [CrossRef]
  55. Long, H.; Li, T.; Zou, J. Analysis of dynamical mechanism of rural transformation development in typical regions of China. Econ. Geogr. 2011, 12, 2080–2085. [Google Scholar]
  56. Huang, B.; Wu, B.; Barry, M. Geographically and temporally weighted regression for modeling spatio-temporal variation in house prices. Int. J. Geogr. Inf. Sci. 2010, 3, 383–401. [Google Scholar] [CrossRef]
  57. Liu, Y.; Liu, J.; Zhou, Y. Spatio-temporal patterns of rural poverty in China and targeted poverty alleviation strategies. J. Rural Stud. 2017, 52, 66–75. [Google Scholar] [CrossRef]
  58. Liu, Y.; Long, H.; Chen, Y.; Wang, J. Research Report on Rural Development in China: Hollowed Village and Its Renovation Strategy; Science Press: Beijing, China, 2011. [Google Scholar]
  59. Moretti, M.; De Boni, A.; Roma, R. Economic and environmental sustainability of forestry measures in Apulia Region Rural Development Plan: An application of life cycle approach. Land Use Policy 2014, 41, 284–289. [Google Scholar] [CrossRef]
  60. Krugman, P. First nature, second nature, and metropolitan location. J. Reg. Sci. 1993, 2, 129–144. [Google Scholar] [CrossRef]
  61. Marsden, T.; Banks, J.; Bristow, G. The social management of rural nature: Understanding agrarian-based rural development. Environ. Plan. A 2002, 5, 809–825. [Google Scholar] [CrossRef]
  62. Sachs, J.D. The End of Poverty: Economic Possibilities for Our Time; Penguin: New York, NY, USA, 2006. [Google Scholar]
  63. Barbier, E.B. Poverty, development, and environment. Environ. Dev. Econ. 2010, 6, 635–660. [Google Scholar] [CrossRef]
  64. Thiede, B.; Kim, H.; Valasik, M. The spatial concentration of America’s rural poor population: A postrecession update. Rural Sociol. 2018, 1, 109–144. [Google Scholar] [CrossRef]
  65. Alkire, S.; Foster, J. Counting and multidimensional poverty measurement. J. Public Econ. 2011, 7–8, 476–487. [Google Scholar] [CrossRef]
  66. Bray, R.; de Laat, M.; Godinot, X.; Ugarte, A.; Walker, R. Realising poverty in all its dimensions: A six-country participatory study. World Dev. 2020, 134, 105025. [Google Scholar] [CrossRef]
  67. Jolliffe, D.; Prydz, E.B. Societal poverty: A relative and relevant measure. World Bank Econ. Rev. 2021, 1, 180–206. [Google Scholar] [CrossRef]
  68. Liu, M.; Feng, X.; Wang, S.; Qiu, H. China’s poverty alleviation over the last 40 years: Successes and challenges. Aust. J. Agric. Resour. Econ. 2020, 1, 209–228. [Google Scholar] [CrossRef]
  69. Omar, M.A.; Inaba, K. Does financial inclusion reduce poverty and income inequality in developing countries? A panel data analysis. J. Econ. Struct. 2020, 1, 37. [Google Scholar] [CrossRef]
  70. Collier, P. The Bottom Billion: Why the Poorest Countries Are Failing and What Can Be Done about It; Oxford University Press: Oxford, MI, USA, 2008. [Google Scholar]
  71. Shulla, K.; Voigt, B.F.; Cibian, S.; Scandone, G.; Martinez, E.; Nelkovski, F.; Salehi, P. Effects of COVID-19 on the sustainable development goals (SDGs). Discov. Sustain. 2021, 2, 15. [Google Scholar] [CrossRef]
  72. Van der Ploeg, J.D.; Renting, H.; Brunori, G.; Knickel, K.; Mannion, J.; Marsden, T.; De Roest, K.; Sevilla-Guzmán, E.; Ventura, F. Rural development: From practices and policies towards theory. Sociol. Rural. 2000, 4, 391–408. [Google Scholar] [CrossRef]
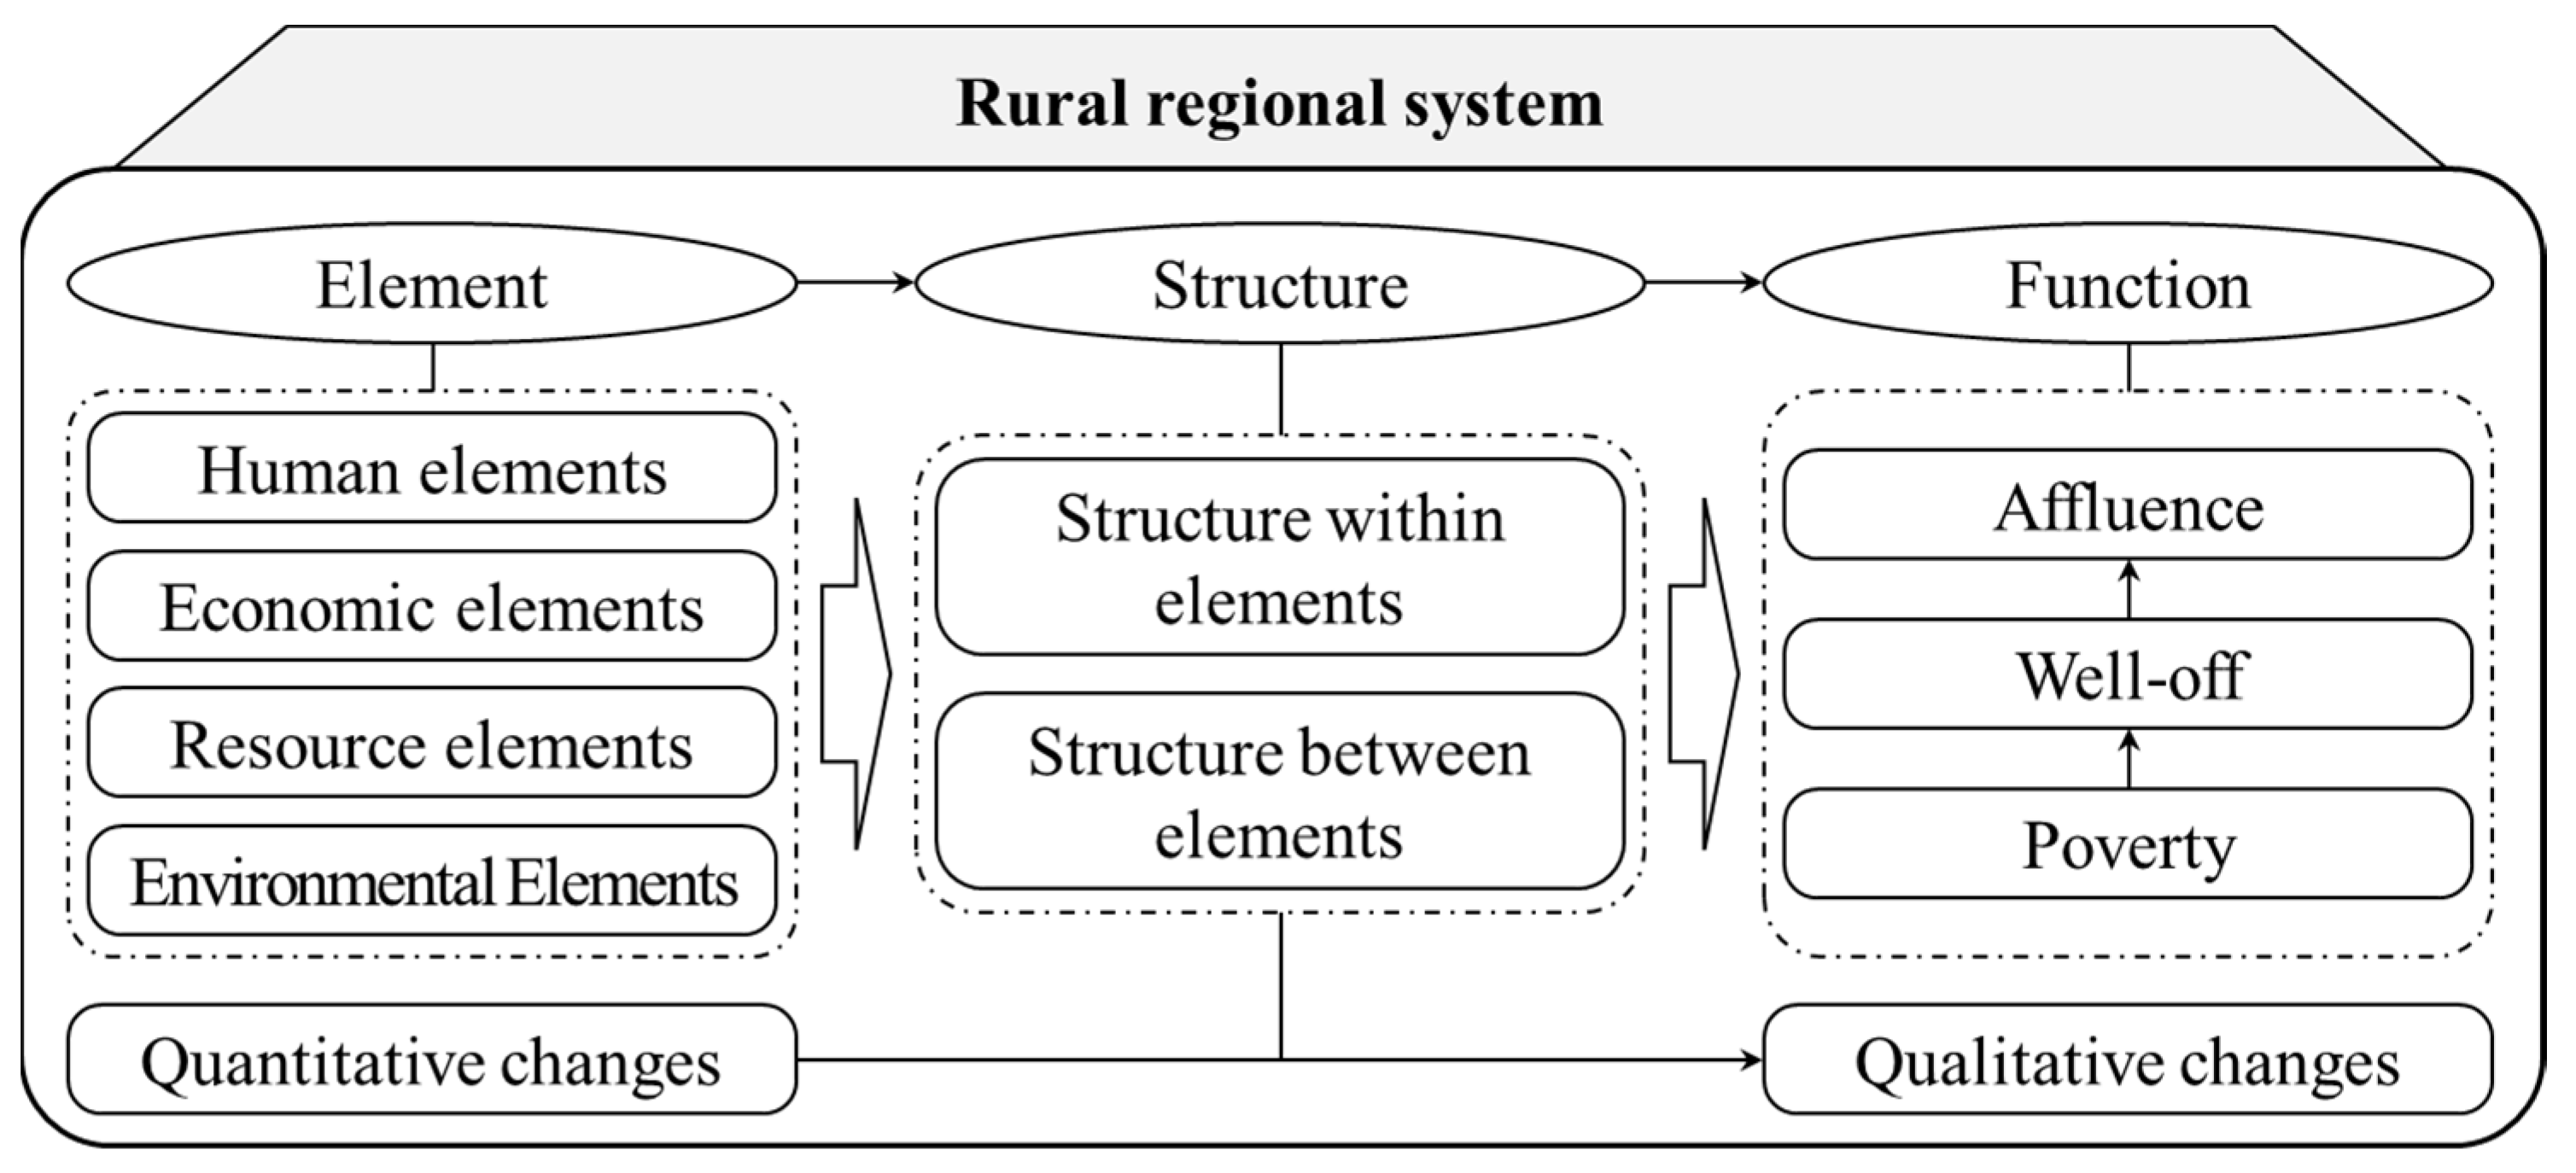
Figure 1. Theoretical framework of RTD.
Land 12 01080 g001
Figure 2. Location and DEM of Yanshan-Taihang Mountains.
Land 12 01080 g002
Figure 3. Spatio-temporal patterns of the quantitative changes of rural regional system in Yanshan-Taihang Mountains.
Land 12 01080 g003
Figure 4. Spatio-temporal patterns of RTD level in Yanshan-Taihang Mountains.
Land 12 01080 g004
Figure 5. Moran scatterplot of county RTD level in Yanshan-Taihang Mountains.
Land 12 01080 g005
Figure 6. Spatial distribution of the regression coefficient of GTWR model.
Land 12 01080 g006
Table 1. Indexes characterizing the quantitative changes of rural regional system.
DimensionIndicatorDescription
Human elementsUrban population shareUrban resident population/total resident population
Economic elementsNon-agricultural industry shareAdded-value of secondary and tertiary industries/GDP
Resource elementsConstruction land share(Total of urban and rural residential areas, transportation, industrial and mining and other land)/total area of the region
Environmental elementsNDVIAn index reflecting the status of land vegetation cover
Table 2. Pre-selection of variables influencing RTD level.
VariablesDescription
Average altitudeThe average value of DEM
Per capita farmland areaTotal farmland area/Rural registered population
Average years of schoolingAverage years of schooling for the resident population aged 6 and above
Road densityTotal length of road/Total area of the region
Per capita GDPGDP/Total resident population
Level of agricultural mechanizationTotal power of agricultural machinery/Total sown area
Per capita income of rural households Per capita disposable income of rural households
Urban–rural dual structureRatio of per capita disposable income of urban and rural households
Table 3. Statistics of the indicators measuring RTD and the pre-selected influencing factors.
TypeIndicator/VariableUnitMinimumMaximumMeanStandard Deviation
Measurement indicatorsUrban population share%3.86%62.23%29.91%15.39%
Non-agricultural industry share%39.75%94.09%72.87%10.94%
Construction land share%0.17%15.76%3.33%2.89%
NDVI-0.43210.85410.66870.0992
Pre-selected influencing factorsAverage altitudem4415001044426
Per capita farmland areamu/person0.6511.443.732.53
Average years of schoolingyear6.0210.108.190.86
Road densitykm/km20.07821.70140.59490.3217
Per capita GDPyuan/person136983,40216,63215,094
Level of agricultural mechanizationkWh/ha0.6017.374.853.07
Per capita income of rural households yuan/person95816,54355364574
Urban–rural dual structure-1.855.233.160.78
Table 4. State changes of RTD in Yanshan-Taihang Mountains.
2020
Imminent DisorderBarely Coupling CoordinationPrimary Coupling CoordinationIntermediate Coupling CoordinationAdvanced Coupling CoordinationTotal
2000Primary coupling coordination 11
Barely coupling coordination 2417
Imminent disorder1376 17
Mild disorder 14 5
Severe disorder 21 3
Total141511233
Table 5. Estimated parameters of GTWR and OLS models.
BandwidthResidual SquaresSigmaAICR2Adjusted R2Spatio-Temporal Distance Ratio
GTWR0.28590.77620.0885−136.7060.68140.65690.5418
OLS −140.14250.5035
Disclaimer/Publisher’s Note: The statements, opinions and data contained in all publications are solely those of the individual author(s) and contributor(s) and not of MDPI and/or the editor(s). MDPI and/or the editor(s) disclaim responsibility for any injury to people or property resulting from any ideas, methods, instructions or products referred to in the content.