Article

Storage and Stability of Soil Organic Carbon in Two Temperate Forests in Northeastern China

1
CAS Key Laboratory of Forest Ecology and Management, Institute of Applied Ecology, Chinese Academy of Sciences, Shenyang 110016, China
2
Qingyuan Forest CERN, National Observation and Research Station, Shenyang 110016, China
3
Key Laboratory of Isotope Techniques and Applications, Shenyang 110016, China
4
Key Laboratory of Terrestrial Ecosystem Carbon Neutrality, Shenyang 110016, China
5
Institute of Agricultural Resource and Environment, Jilin Academy of Agricultural Sciences, Changchun 130033, China
6
Department of Biological Sciences, Binghamton University—State University of New York, Binghamton, NY 13902, USA
7
Key Laboratory for City Cluster Environmental Safety and Green Development of the Ministry of Education, Guangdong University of Technology, Guangzhou 510006, China
8
Division of Terrestrial Ecosystem Research, Department of Microbiology and Ecosystem Science, University of Vienna, 1090 Vienna, Austria
*
Authors to whom correspondence should be addressed.
Land 2023, 12(5), 1019; https://doi.org/10.3390/land12051019
Submission received: 23 March 2023 / Revised: 26 April 2023 / Accepted: 3 May 2023 / Published: 6 May 2023
(This article belongs to the Special Issue Land Use Effects on Carbon Storage and Greenhouse Gas Emissions)

Abstract

:
Forests worldwide store large quantities of carbon (C), particularly in soils as soil organic C (SOC). In northeastern China, two dominant forest types, secondary mixed forest (MF) and larch plantation forest (LF), cover extensive areas. However, we lack an understanding of the patterns and the mechanisms of SOC storage and stabilization in MF and LF, especially in deep soil layers. This research aims to illustrate the vertical distribution and mineral protection of SOC over soil depth; we also used δ13C values of soil fractions to evaluate SOC stability. Samples from the surface litter (Oi), organic layer (Oa+e), and 0–40 cm mineral soils were collected from both MF and LF plots. We used two different methods to separate bulk soils into distinguished fractions: (1) macro- and micro-aggregates and the non-aggregated fraction, and (2) particulate organic matter (POM) and mineral-associated organic matter (MAOM). The C concentrations, C stocks, and δ13C of all soil fractions were determined. Our findings were as follows: (1) SOC was mainly stored in mineral soils and was 13.6% lower in LF (8609 ± 1180 g C m−2) than MF (9969 ± 2084 g C m−2). (2) In both MF and LF, the SOC stock was mainly stored in aggregates (averaged 92.7%); macroaggregates dominated in the surface layers (Oa+e layer and 0–10 cm) but microaggregates dominated in the deep layers (10–20 cm and 20–40 cm). In mineral soils, MAOM was the dominant fraction of the C stock (averaged 81.6%). (3) The proportion of C distributed in microaggregates and MAOM increased from Oa+e to the 20–40 cm layer. (4) The C/N ratios and δ13C values of MAOM were smaller and heavier compared to those of POM. Our study demonstrated that in both forests, aggregate formation and mineral association predominantly contributed to SOC storage, and large stocks of SOC were distributed in the deep soil. The increasing proportion of SOC in microaggregates and MAOM along the soil depth, most likely derived from microbial turnover and microbial necromass, influenced SOC stability in both forest types.

1. Introduction

According to IPCC (2021), the global surface air temperature increased by 1.0 °C during 2001–2020 relative to 1850–1900, and will increase by 1.4–4.4 °C by the end of this century [1]. Atmospheric carbon dioxide (CO2) abatement is a priority in order to limit climate warming. Enhancing the terrestrial ecosystem C sink is an important way to slow down the continuous increase in atmospheric CO2. Soil is the largest organic carbon pool in the terrestrial ecosystem, storing more than three times the amount of C found in both the atmosphere and in living plants [2]. In recognition of the potential of using soil as a C sink, the mechanisms used to control soil carbon sequestration and the management practices to encourage these mechanisms have attracted considerable attention [3,4,5].
Soil organic carbon (SOC)’s response to environmental disturbance may differ among ecosystems. Soil contains a mixture of heterogeneous C pools with different C sources and turnover rates [3,6,7,8,9]. Studies have emphasized that SOC accumulation was much more related to the complex interactions between organic matter and its environments rather than the recalcitrant nature of SOC [3,10]. SOC associated with macroaggregates (>250 μm) is often fresh C and a labile fraction, and SOC associated with microaggregates (53~250 μm) is much more stable than in macroaggregates (>250 μm) due to the separation of substrate and microbial activity [11]. In previous decades, the crucial role of SOC associated with the mineral soil matrix has been widely recognized [10,12,13,14,15] as being responsible for the long-term stability of SOC [16,17]. Mycorrhizal symbiosis also mediates the C distribution of soil fractions due to different plant nutrient economies and litter quality, and the impact can vary with the soil depth [15]. However, most studies investigating SOC fraction and stability focused on the upper layers (0–20 cm, or more commonly 0–10 cm or less) of the mineral soil with the highest C concentrations [18], and less on deep soils [19]. Deep soils contain a large fraction of SOC stocks and could be more sensitive to environmental disturbance [20]. Furthermore, the mechanisms leading to SOC stabilization in surface and deep soils could be quite different due to different C sources, environmental conditions, and microbial communities [21,22,23]. There is evidence that aggregate and mineral-associated protection exerted an important mechanism on the SOC dynamic in deeper soil layers [23]. Therefore, a consideration of the whole profile is needed to understand the mechanisms controlling SOC storage and stability [24]. In addition, isotope values of bulk soil are often used to explore the underlying mechanisms of C stabilization [25,26]. However, fewer data showed the δ13C pattern of soil fractions, especially the stabilized SOM fractions along soil depth, which could be more sensitive to environment conditions than bulk soils [27].
Forest ecosystems act as a large carbon sink that offsets ~25% of the yearly anthropogenic C emissions [2], thus playing a key role in balancing the global budget of greenhouse gases [28,29,30,31,32]. Reforestation and afforestation have been carried out globally for decades, and are widespread in China [30,33]. In northeastern China, secondary forests are the dominant type due to a century of excessive timber harvesting [34]. Since the 1950s, to promote rapid economic development and to meet the objectives of key Chinese forestry programs, a range of larch species (Larix olgensis, Larix kaempferi or Larix gmelinii) have been planted in northeastern China as commercial timber trees to replace the secondary forests [34]. Currently, the total area of secondary forests occupies 26.1 million ha, accounting for 78.0% of the total forest area in northeastern China (33.5 million ha; Liaoning, Jilin, and Heilongjiang province) [35]. Larch forest occupies 2.1 million ha in northeastern China, comprising 33.7% of the total area of plantation in northeastern China [35]. Compared with secondary forest, studies demonstrated that larch forest resulted in soil acidification, nutrient leaching, and soil quality decline, thereby affecting ecosystem C sequestration [36,37,38]. However, despite these efforts, there are still fewer reports on the vertical distribution of SOC lower than the 20 cm soil layer, and SOC stability mechanisms associated with aggregate formation and mineral-associated protections.
We aimed to conduct a comparative study of the two dominant forest types in the northeastern region of China. First, we quantified the vertical distribution pattern of SOC over soil depths, and, in each layer, we determined the aggregate and mineral-association contributions to SOC storage. Next, we explored the potential mechanisms of SOC stability, including whether δ13C values were different among soil factions in two forests along the soil depth. We selected both MF (secondary mixed forest) and LF (larch plantation forest) sites, and collected soils from the organic layer all the way down to 40 cm mineral soils. Soil fractions were separated for each layer, including aggregates, particulate organic matter (POM), and mineral-associated organic matter (MAOM). The concentrations, stocks, and 13C isotopic composition of SOC in both bulk soil and soil fractions were measured. We hypothesized that (1) in both MF and LF, SOC would be mainly stored in mineral soil layers, especially in deep soils; (2) SOC stability would increase with depth along the soil profile because of increasing aggregate formation and mineral-associated protection in deep soils; and (3) 13C and C/N ratios would be closely associated with SOC stabilization due to the aggregate and mineral protection of SOC.

2. Materials and Methods

2.1. Site and Soil Sampling

The study was carried out at the Qingyuan Forest CERN, National Observation and Research Station, Liaoning Province, northeastern China (41°51′ N, 124°54′ E, 500–1100 m a.s.l.). This region has a continental monsoon climate. The mean annual precipitation is approximately 800 mm, with >80% falling from June to August [39]. The mean annual temperature is 4.7 °C. The forest site was originally occupied by primary broadleaved trees and Korean pines (Pinus koraiensis) until the 1930s [36]. Subsequently, the forests were subjected to decades of unregulated timber removal. Controlled burns were used in the early 1950s to clear out the original forest and a mixture of naturally regenerated broadleaved tree species colonized the site. In the 1960s, patches of the secondary-growth forests were partially cleared for larch (Larix kaempferi) plantations. In our study site, part of the larch plantation was managed for wood production by cleaning seedlings or clones of other plants, while another part was left unmanaged, allowing natural regeneration from seeds of broadleaved trees [40]. This led to a gradual development of two distinct forest types: a larch plantation forest (hereafter referred to as larch forest—LF) and a secondary mixed forest (hereafter referred to as mixed forest—MF). The soil mechanical composition (Table 1), determined using the hydrometer method, shows a clay loamy soil, and is classified as Orthic Luvisols (brown forest soil in Chinese Soil Taxonomic System) in the World Reference Base.
Three replicate plots (each 20 m × 10 m) were selected in each forest within a <1 km2 area from the experimental station. Larix kaempferi is the only dominant canopy tree in the LF, whereas several broadleaf species coexist with Larix kaempferi in the MF, including Juglans mandshurica and Quercus mongolica. For each forest type, we calculated the relative abundance of arbuscular mycorrhizal (AM) and ectomycorrhizal (ECM) trees based on the basal area (Table 2). The mycorrhizal type of each tree species presented in the studied sites was identified according to the PlutoF database [41]. Accordingly, larch forest is considered to be ECM dominated, while mixed forest is considered to be an AM-ECM co-dominated forest. In June 2014, samples were collected from six randomly distributed quadrats (20 cm × 20 cm) in each plot for both forests. In each quadrat, forest floor samples were collected via excavation with hand spades to the top of the mineral soil, and divided into an Oi layer (standing litter) and Oa+e layer. After that, 1–2 cores (2.5 cm in diameter) were used to sample mineral soils at 0–10 cm, 10–20 cm, and 20–40 cm depths. Forest floors (Oi and Oa+e) were thin in MF, about 1~3 cm, and 3~5 cm in LF. Samples from the 6 quadrats were combined into 1 pooled sample by layer for each plot. The fresh soils were sieved (2 mm) to remove roots and rocks, homogenized by hand, and analyzed to determine their physicochemical properties or air-dried for later analyses. One bulk density profile was created outside each plot and the bulk density was calculated by dividing the weight of the dried soil (corrected by the gravel weight) by the volume of soils (100 cm3).

2.2. Soil fractionations

Aggregate size fractionation was applied to the bulk soil using the wet sieving method [42,43]. Briefly, 50 g of air-dried soil (<2 mm) was spread evenly on a 250 μm sieve, and the sieve was immersed in water for 5 min (slaking). The sieve was then moved up and down at a rate of 50 strokes for 2 min. Floatable material was decanted and saved, since it was part of the <2 mm fraction. Materials that passed through the 250 µm sieve were collected or passed through a sieve with the opening of 53 µm. The three fractions were washed into pre-weighed pans, i.e., macroaggregates (250~2000 µm), microaggregates (53~250 μm), and non-aggregated silt and clay fraction (<53 μm).
The bulk soils were also fractionated into particulate organic matter (POM) and mineral-associated organic matter (MAOM) [43,44]. Briefly, 20 g of air-dried bulk soil (<2 mm) was dispersed for 18 h with 50 mL of sodium hexametaphosphate (NaPO3)6 solution (5 g L−1) on a reciprocal shaker (180 rpm), after which the solution was passed through a 250 μm and a 53 μm sieve, and rinsed with distilled water until a clear solution was obtained. The remains on the 250 μm sieve were defined as coarse POM (cPOM, 250~2000 μm) and on the 53 μm sieve as fine POM (fPOM, 53~250 μm). The solution that passed through the 53 μm sieve was defined as MAOM.
All aggregate size classes, POM and MAOM, were transported into pre-weighed aluminum pans, oven-dried at 60 °C, weighed, and ground to a fine powder for analysis.

2.3. Analyses of Soil Physicochemical Properties

Carbon and nitrogen concentration, natural abundance of 13C (δ13C) of plant litter, bulk soils, and soil fractions were determined using an element analyzer (vario MICRO cube; Elementar Analyser Systeme GmbH, Hessen Hanau, Germany) coupled with a continuous flow isotope ratio mass spectrometer (IsoPrime 100, Isoprime Ltd., Cheadle Hulme, UK). Four kinds of amino acids were used as references: L-histidine, D-glutamic, glycine, and acetanilide. The analytical precision of this method for δ13C is 0.2‰.

2.4. Data and Analyses

The soil C stocks in the mineral soils at a specific depth were calculated as
SOCs = C ×T × BD
where SOCs represents the soil organic carbon stock (g m−2), C is the respective soil organic carbon concentration (%), T is the thickness of soil depth (cm), and BD is the bulk density (g cm−3). In this study, we used the average bulk density of three soil profiles as the estimated value of bulk density of all plots in each forest.
Statistical analyses were performed using R (v. 3.6.0, R Core Team 2019; v. 1.2.1335, RStudio Team, 2014). ANOVA was used to determine the effects of soil depth and particle size on the distribution of soil C stocks, C concentrations of soil fraction, the proportion of C stock, and δ13C values, followed by Tukey’s HSD comparison at a significance level of p < 0.05.

3. Results

3.1. Bulk Soil C Concentration and Stock

Carbon concentrations and C/N ratios decreased from the Oi layer to 20–40 cm mineral soil in both MF and LF forests (Table 1). Soil C was mainly concentrated in the mineral soils, accounting for 94.2% and 89.8% of the overall soil C stocks (from Oi to 40 cm) in MF (9969 g C m−2) and LF (8609 g C m−2), respectively. In MF, C stocks in the 0–10 cm layer were higher than those in the 10–20 cm layer, but, in LF, C stocks were similar between 0–10 cm and 10–20 cm layers. There was slightly more O-layer C stock in LF than in MF, while the opposite was true for mineral soil C stock. Overall, C stocks from Oi to 0–40 cm depth in LF were 13.6% lower than those in MF.
Soil δ13C ranged from −28‰ to −24‰ in both MF and LF (Table 1). Soil δ13C values in MF steadily increased from the surface Oi layer to the deeper mineral soil layers, but in LF there was a sharp increase in δ13C from the Oa+e layer to 0–10 cm layer, with little further change to deeper layers.

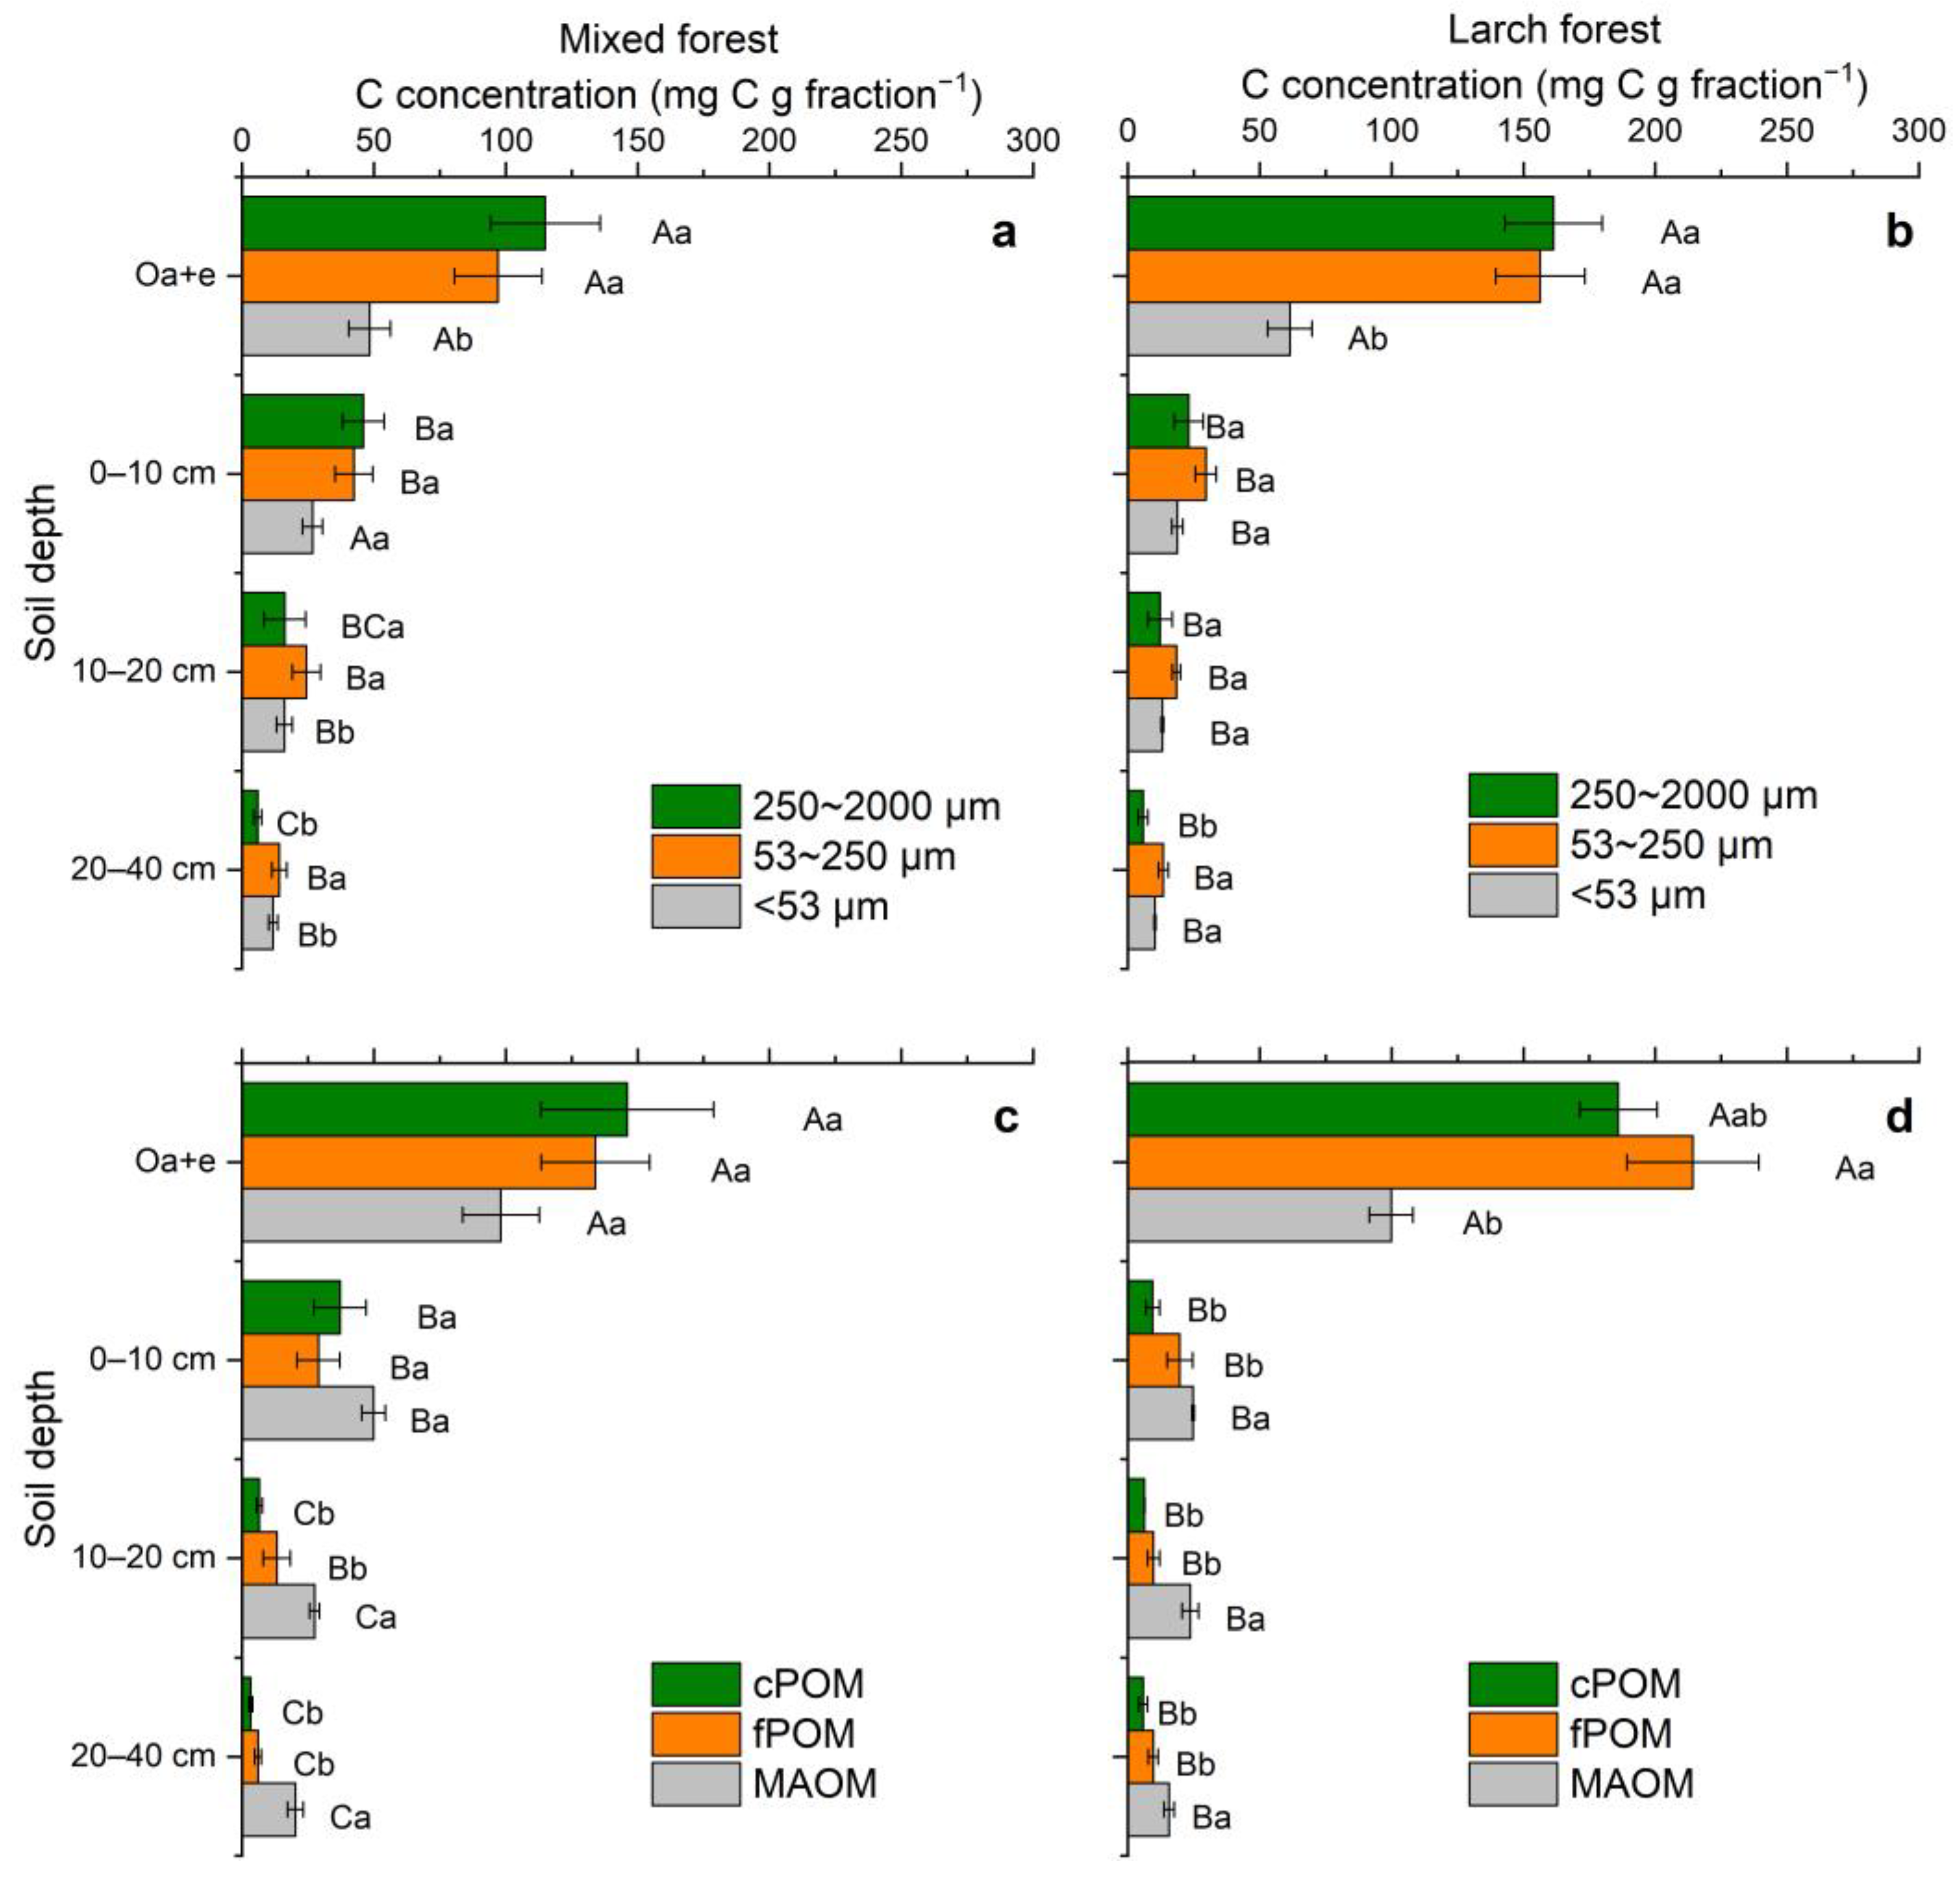
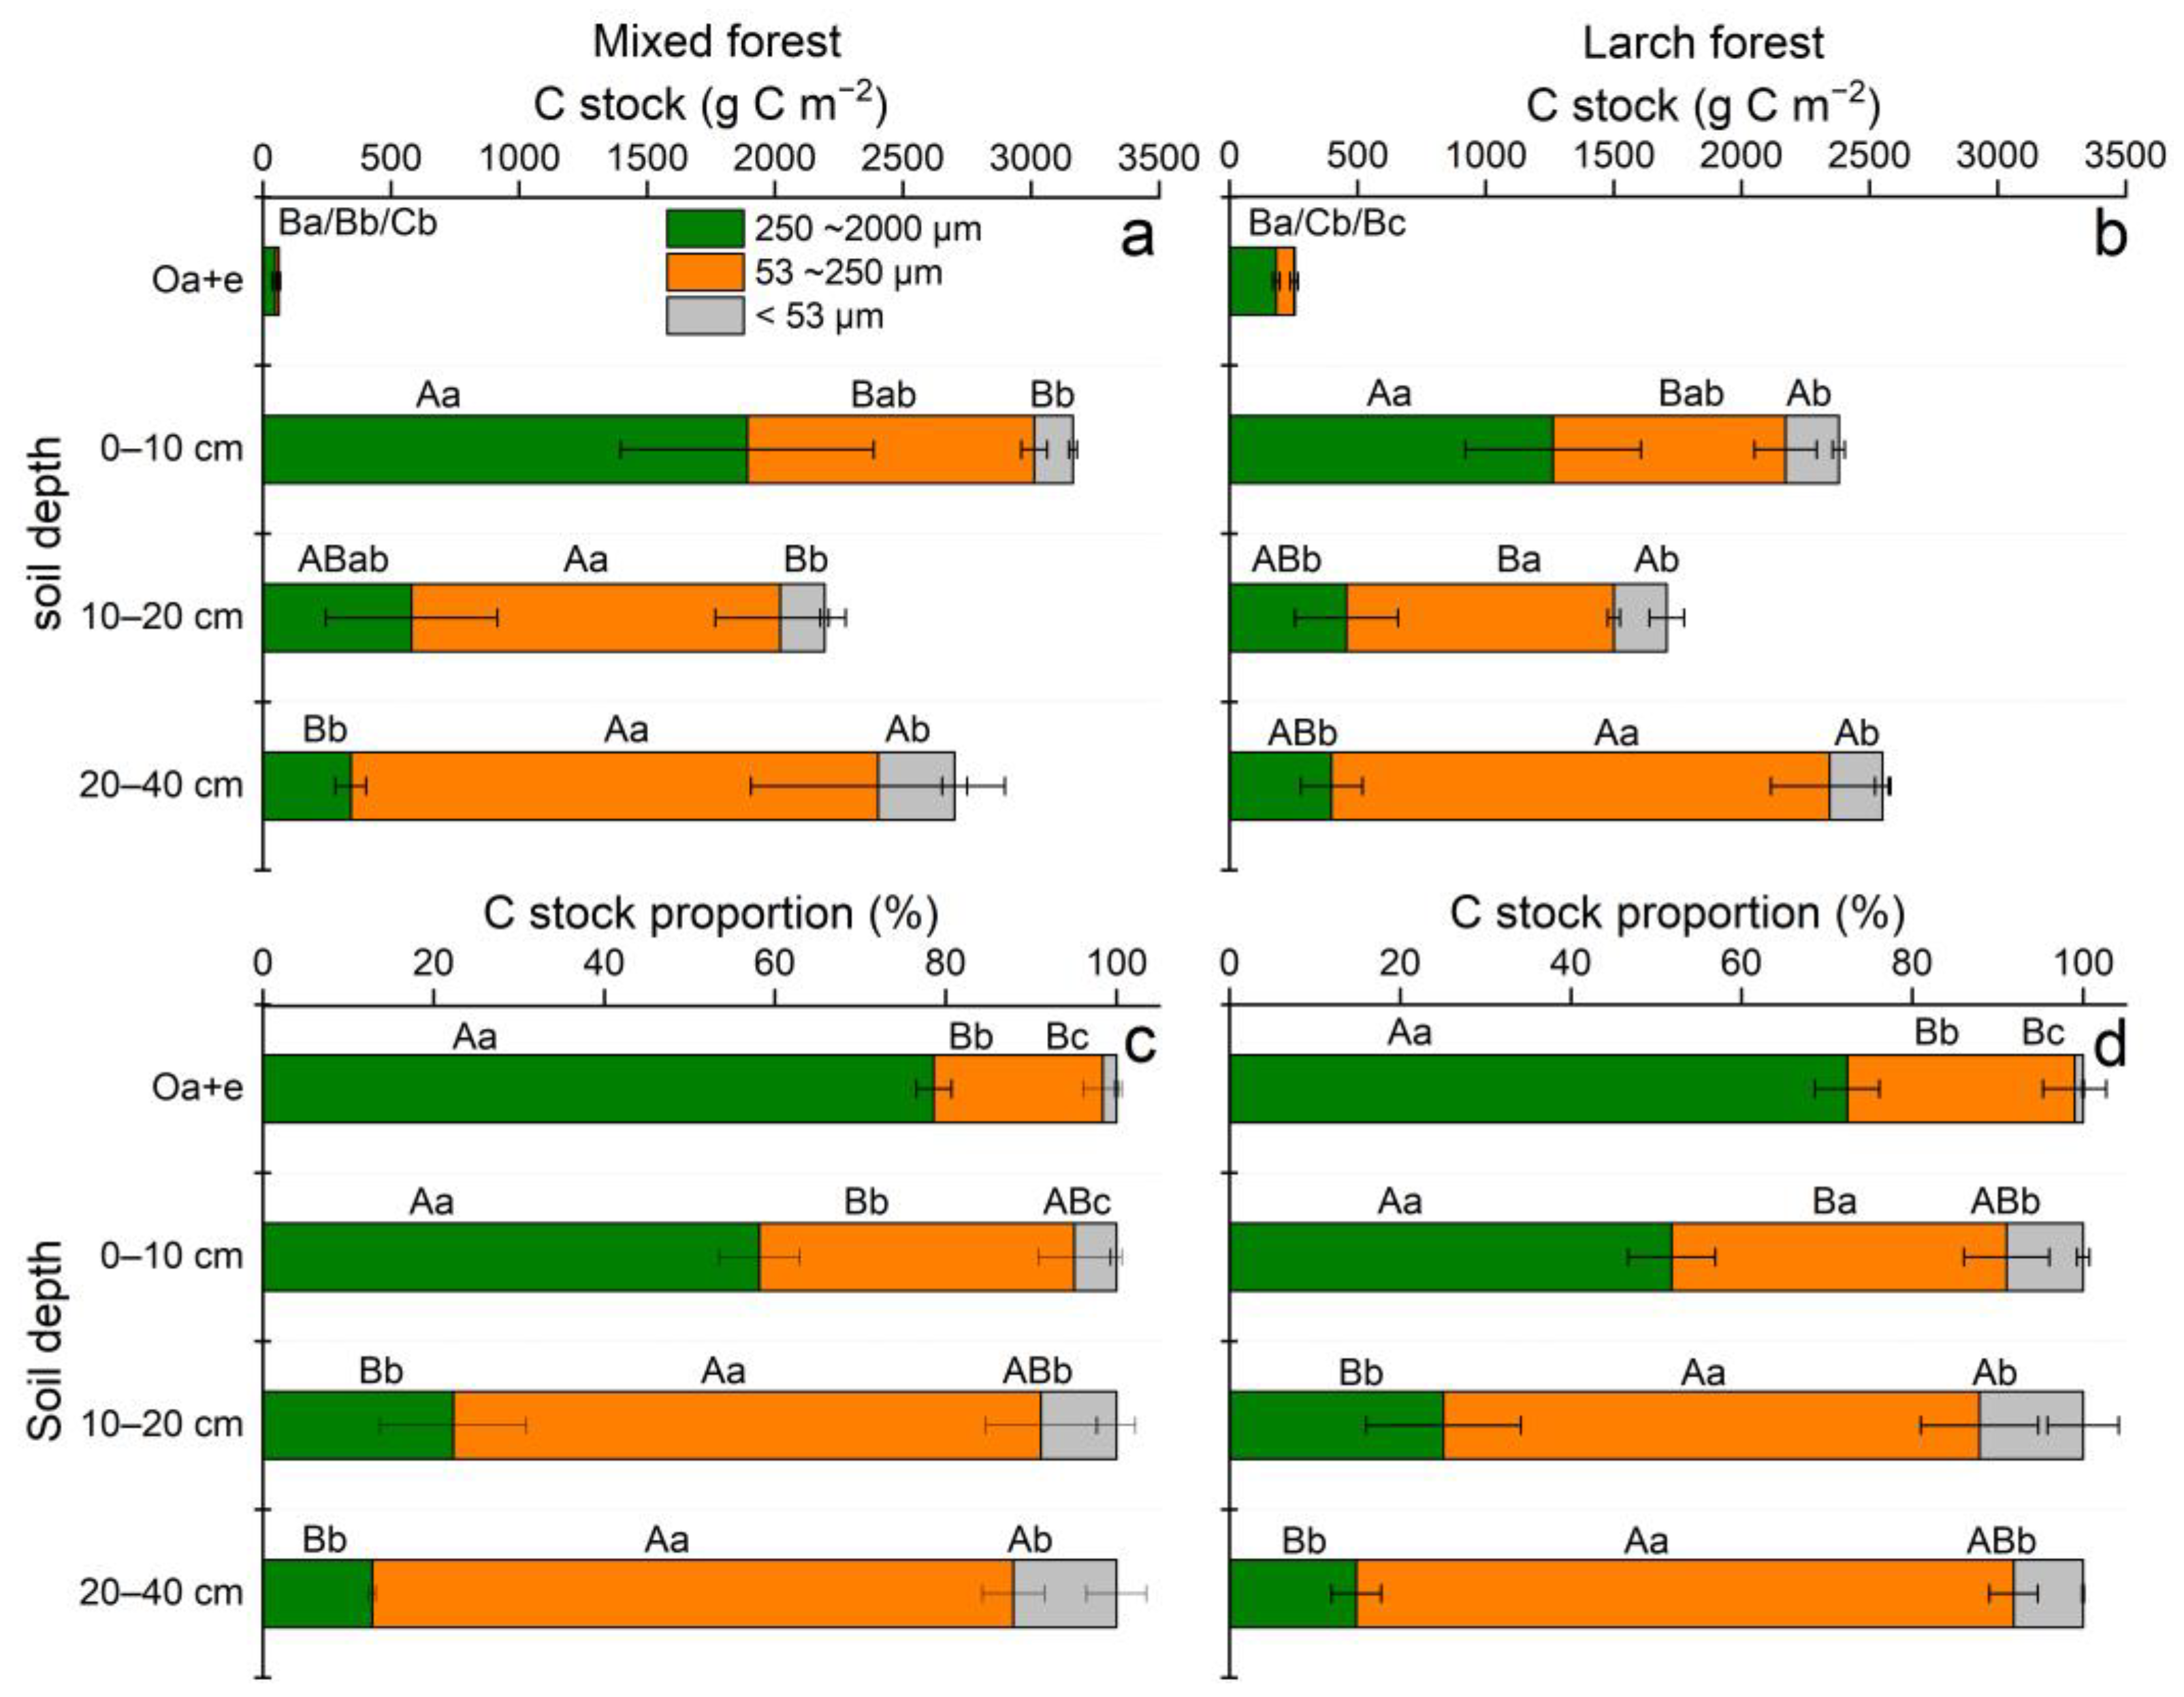
3.2. Soil Aggregates: Mass Distribution, C Concentration, and C Stock

The mass recovery using the aggregation fractionation technique was greater than 93% for all soils sampled (Table 3). The aggregate mass distribution in MF and LF was similar either among fractions (macro- and microaggregates, and non-aggregated silt and clay) or based on the soil depth. There was a significant difference among soil aggregate sizes in each depth (p < 0.05). The macroaggregate was the dominant fraction in Oa+e and the 0–10 cm layer, averaging 70% and 52% of the total soil mass, respectively. In contrast, in the 10–20 cm and 20–40 cm soil layers, the microaggregate was the dominant fraction, accounting for 52% and 59% of the total soil mass, respectively (Table 3). The non-aggregated silt and clay fraction contributed from 2.5% to 14% along the soil profile, accounting for more soil mass in the mineral soil layers than in the Oa+e layer (Table 3).
In both forests, the C concentration of aggregates decreased significantly from the Oa+e layer to the mineral soil layers (Figure 1a,b; p < 0.001). In the Oa+e layer, the C concentration was lowest in the silt and clay, but in the deeper 20–40 cm layer, it was lowest in the macroaggregates. The C stock of aggregate fractions showed a similar pattern to the distribution of soil mass, concentrated in different mineral soil depths with minimal distribution in the Oa+e layer (Figure 2a,b). The proportions of C stock distributed in macroaggregates gradually declined from 78.6% in the Oa+e layer to 12.8% in the 20–40 cm layer for MF, and from 72.4% to 14.8% for LF (Figure 2c,d). In contrast, the proportions of C stock distributed in microaggregates significantly increased from 19.8% to 75.1% and from 26.7% to 77.0% for MF and LF, respectively (Figure 2c,d). Overall, the average proportion of C protected in aggregates is 92.7% across the soil profile in both MF and LF. The proportion of C stock that accumulated in the silt and clay fraction also increased from the Oa+e layer to the 20–40 cm layer in both forests.

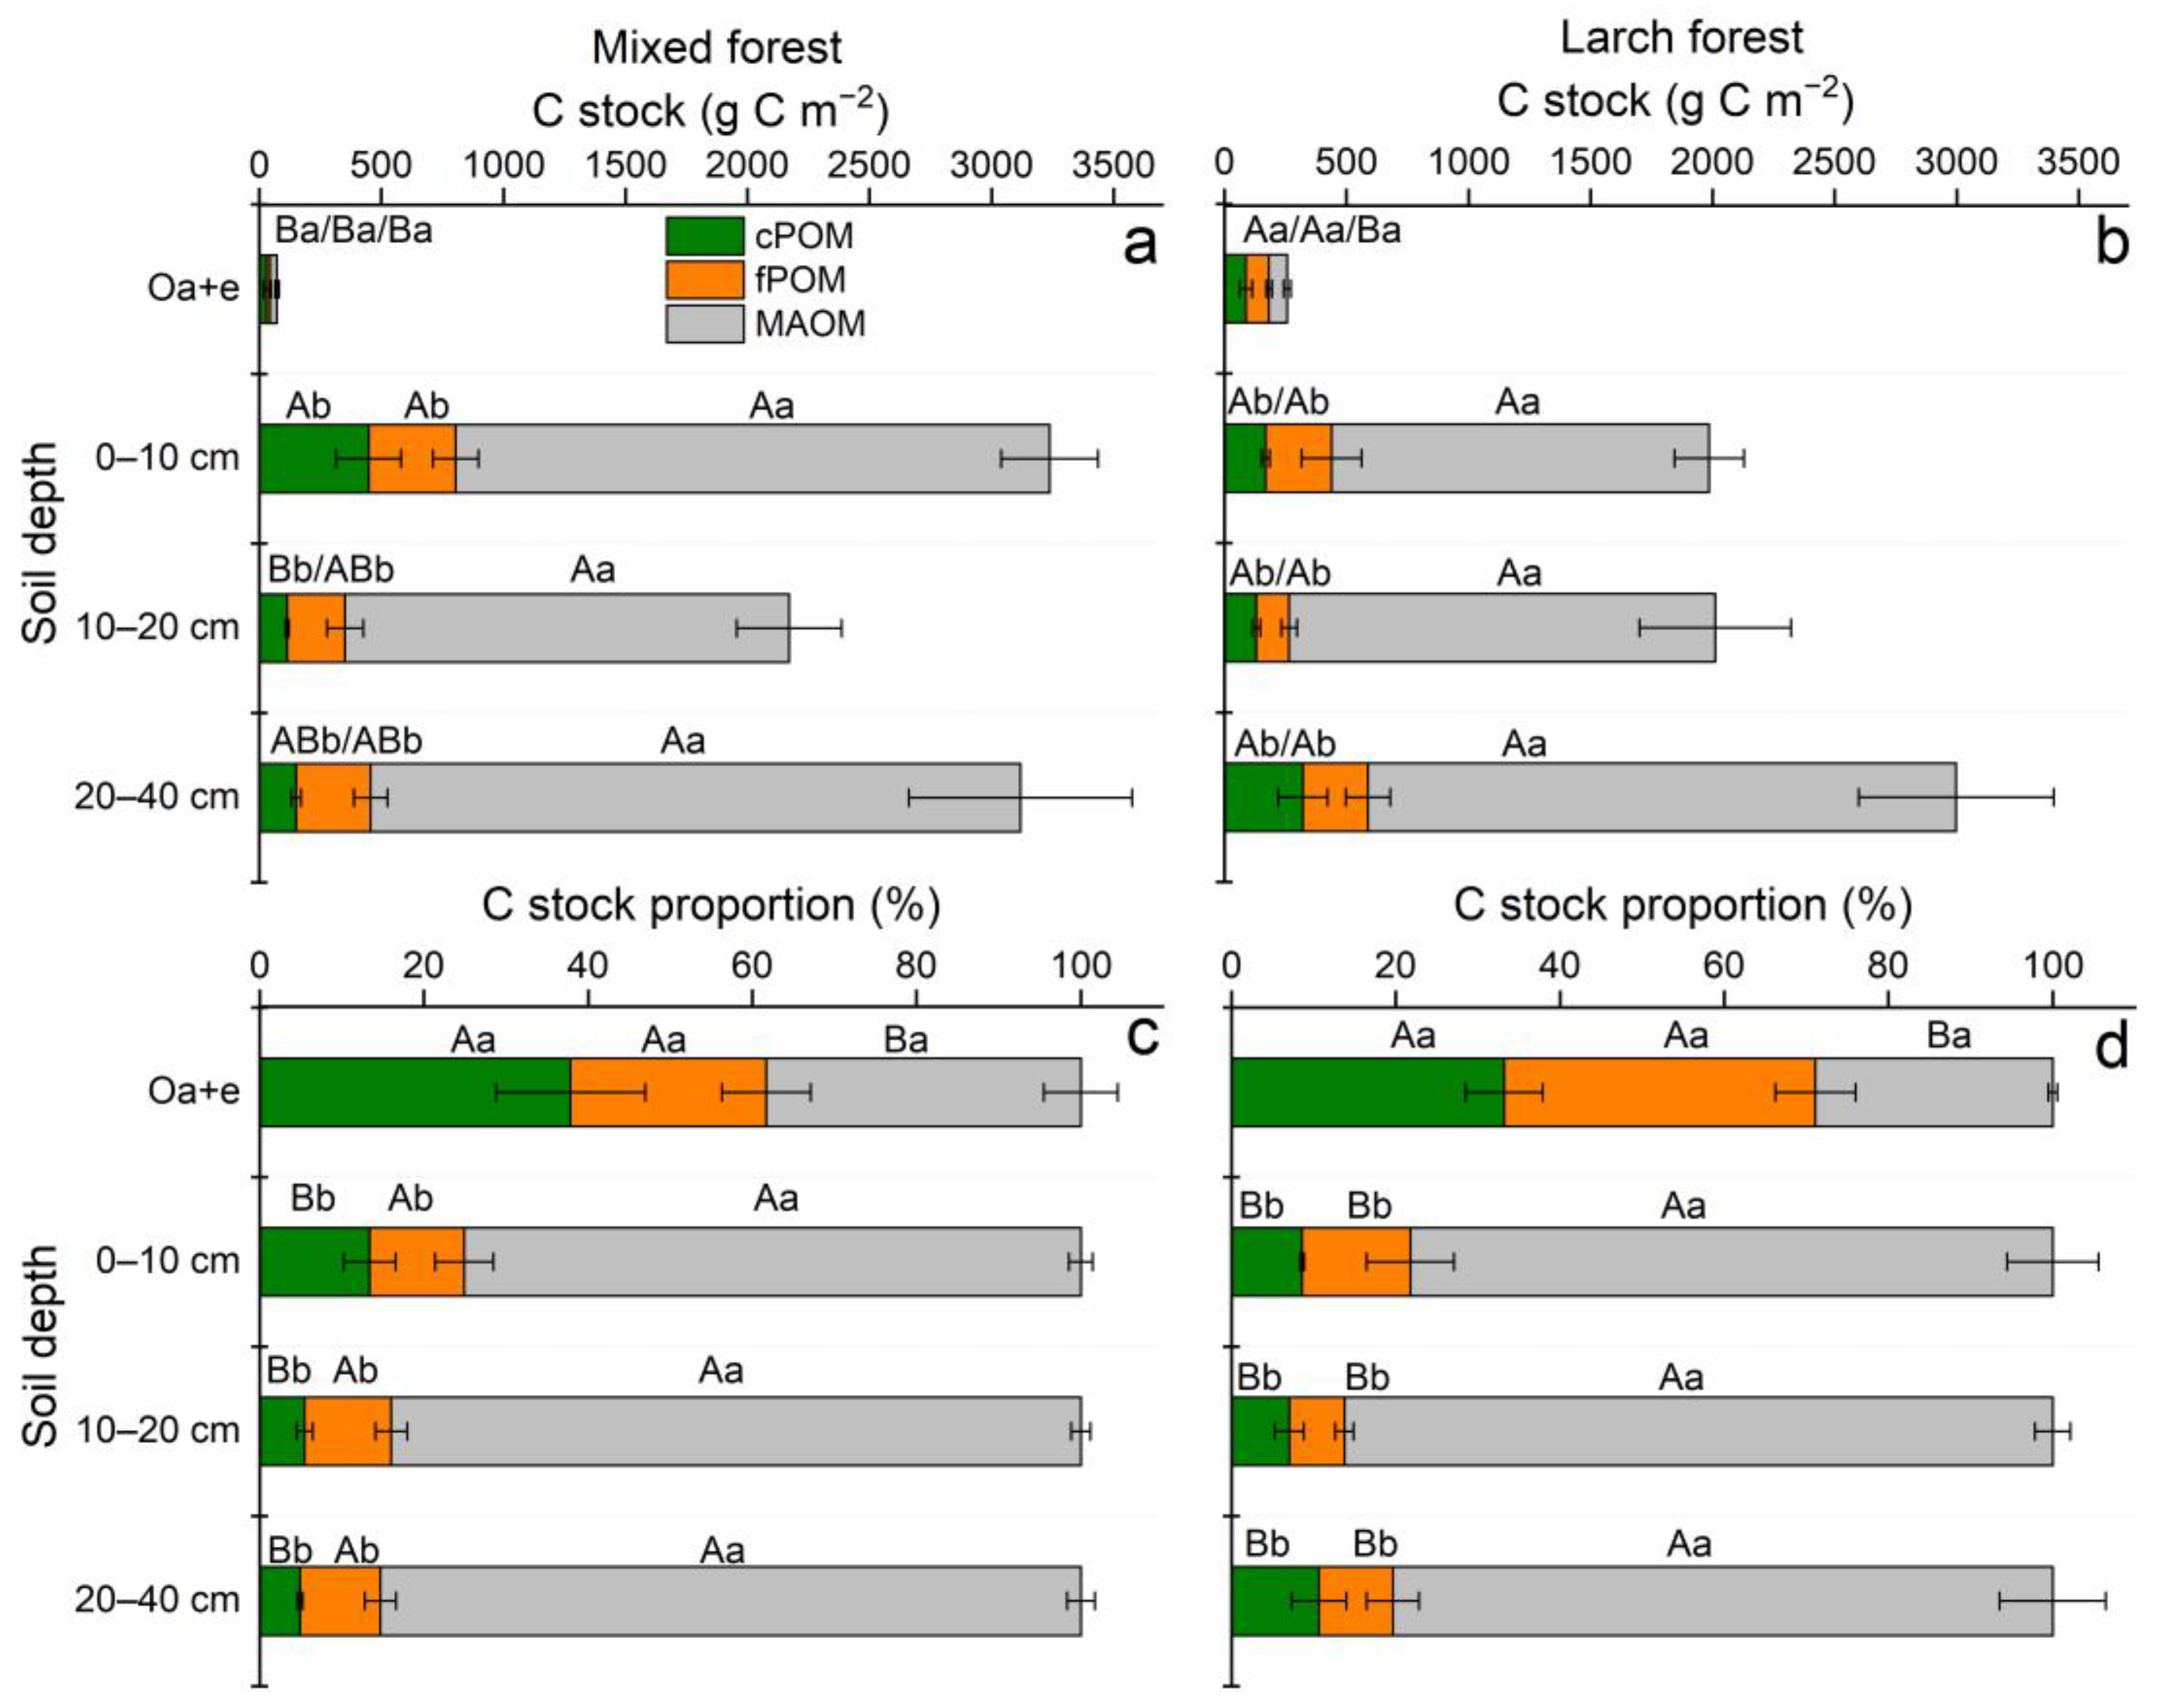
3.3. POM and MAOM: Mass Distribution, and Fraction-Based C Concentration and Stock

The mass recovery of POM and MAOM averaged 93% across the soil profile in both MF and LF (Table 3). Soil mass was significantly associated with MAOM fraction in mineral soils (Table 3; p < 0.001), even though POM was not corrected for sand mass and cPOM and fPOM contained coarse (>250 µm) and fine (>53 µm) sand, respectively. There was no difference in the C concentrations among fractions in the Oa+e layer, but C concentrations were significantly higher in the MAOM in most mineral soil layers (Figure 1c,d; p < 0.01). In both forests, the C concentrations of POM and MAOM decreased with the soil depth (Figure 1c,d). SOC stocks were strongly bound with MAOM in mineral soils (Figure 3a,b). SOC was concentrated in cPOM and fPOM only in the Oa+e layer but dominated in MAOM in mineral soils. The proportions of C stock distributed in MAOM were not different in the mineral layers along the soil’s depth, averaging at 81.6% for both MF and LF (Figure 3c,d).

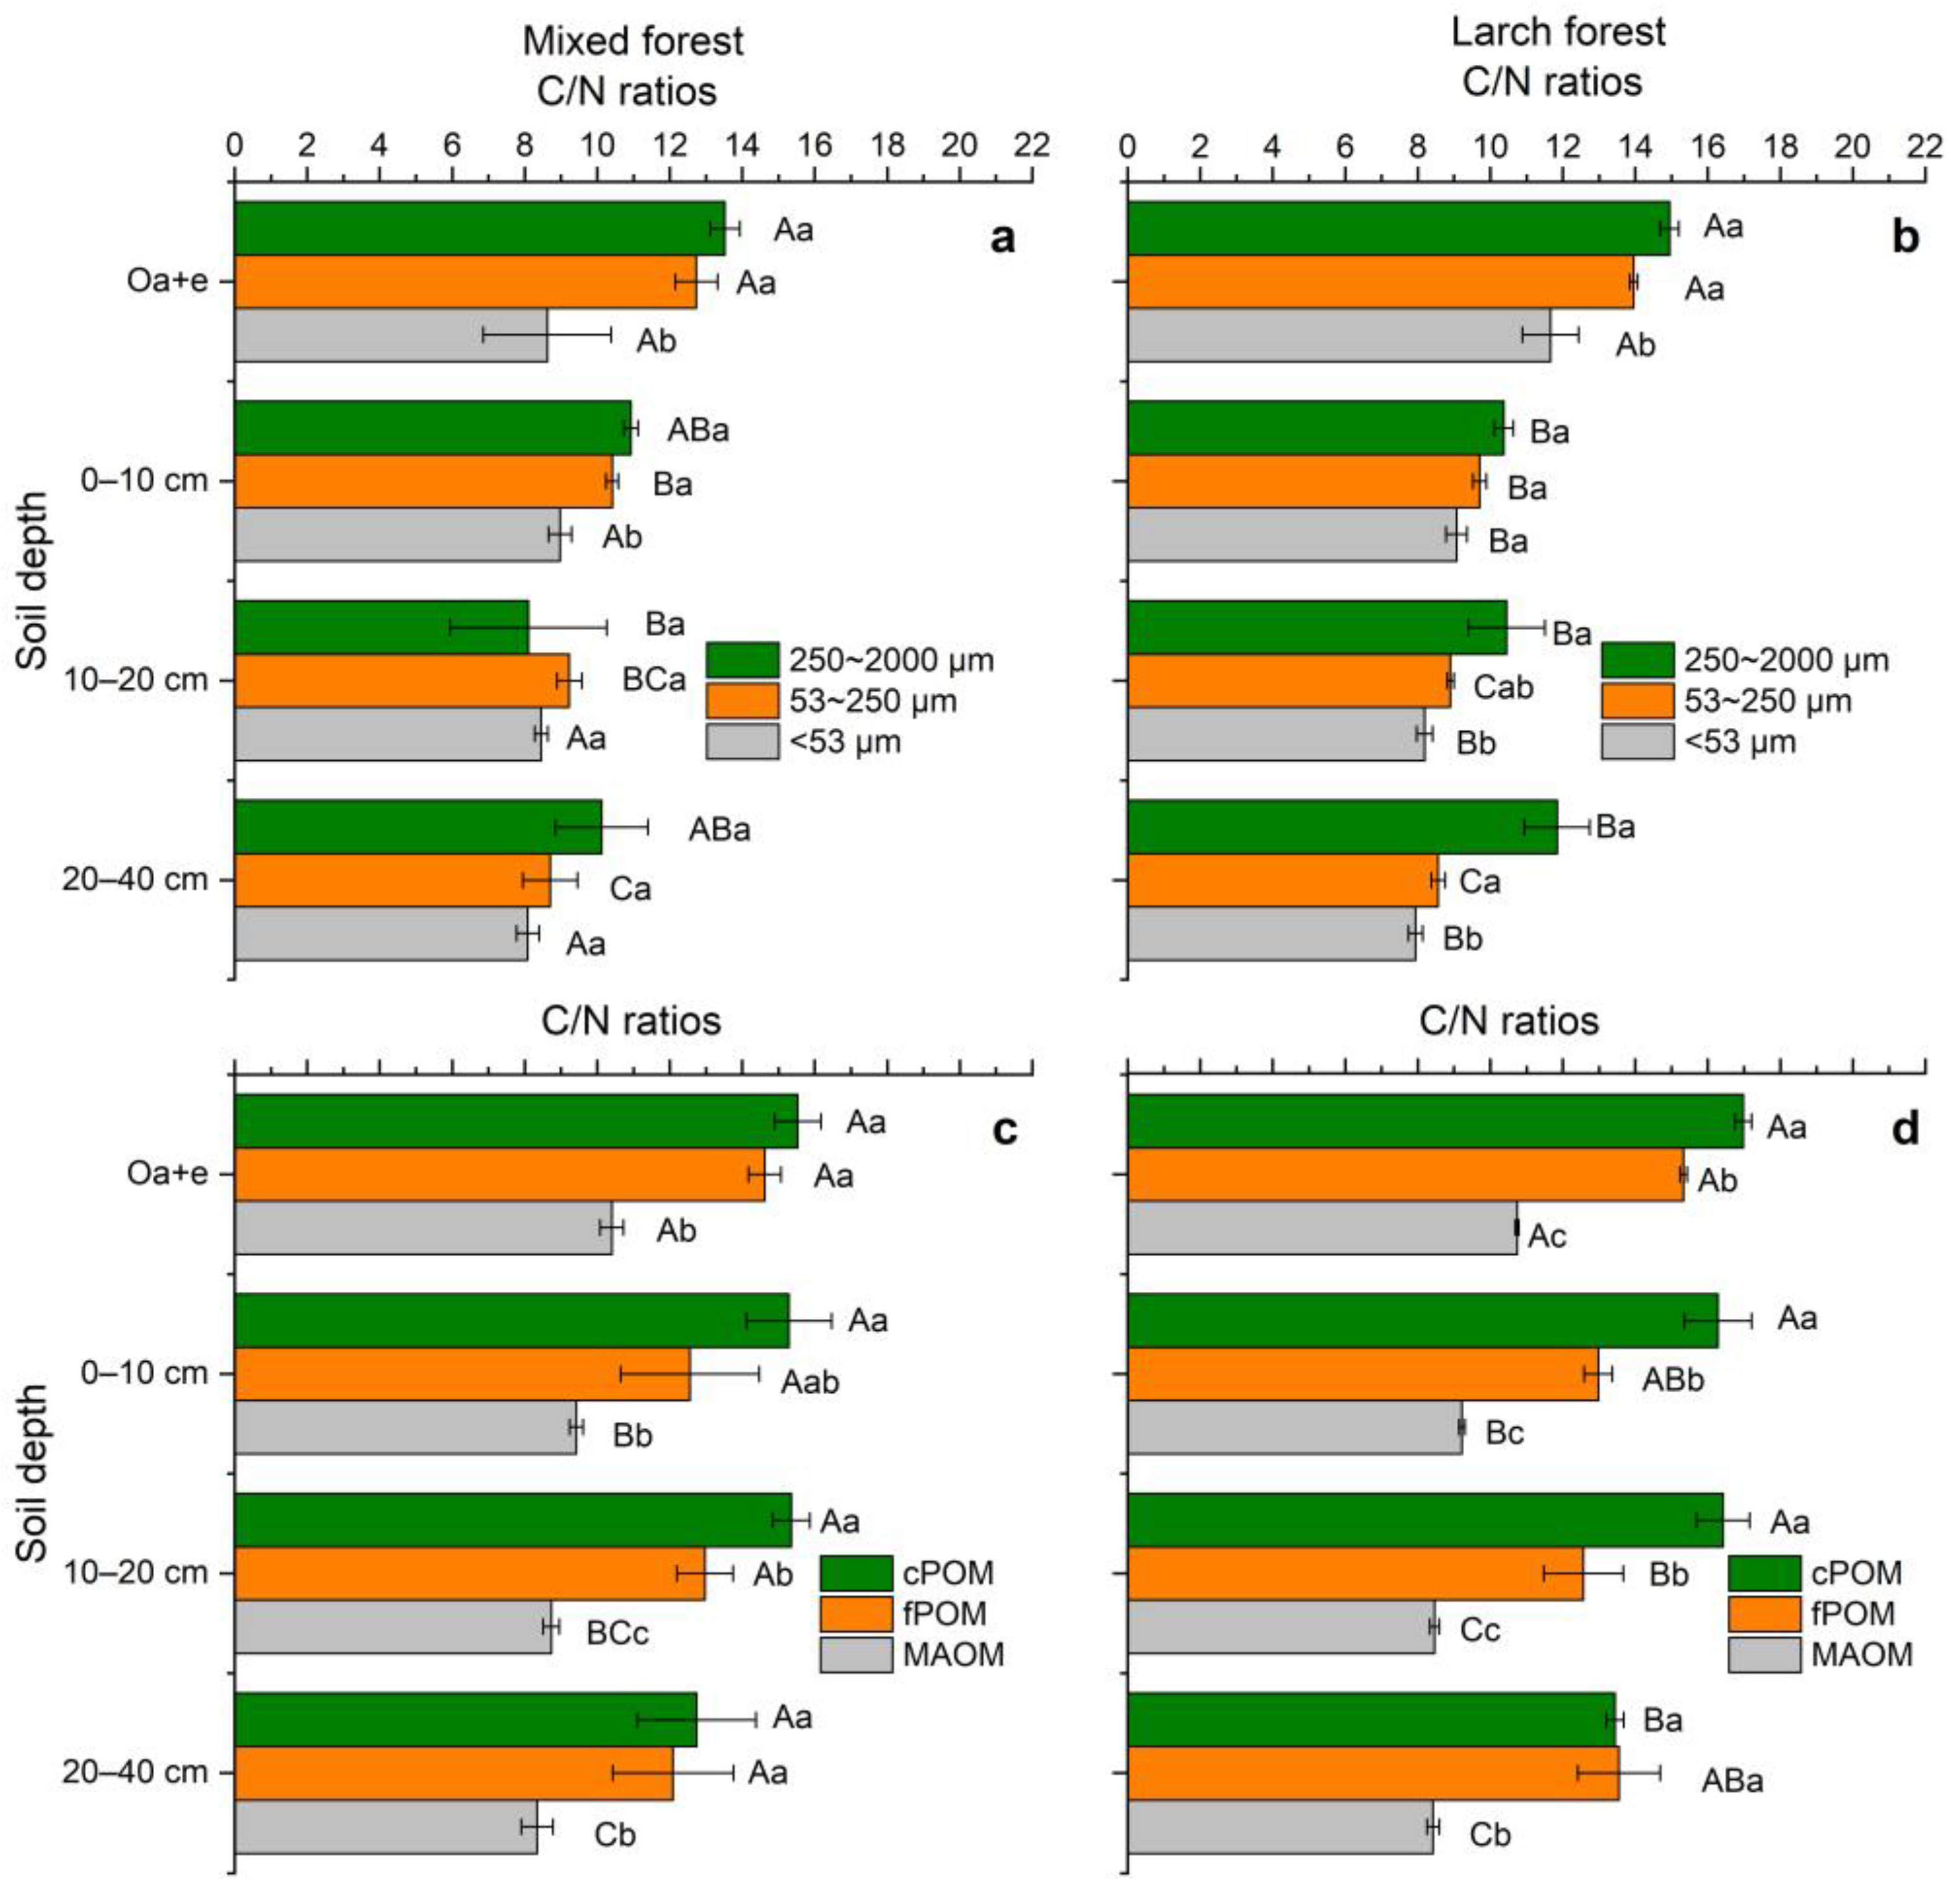
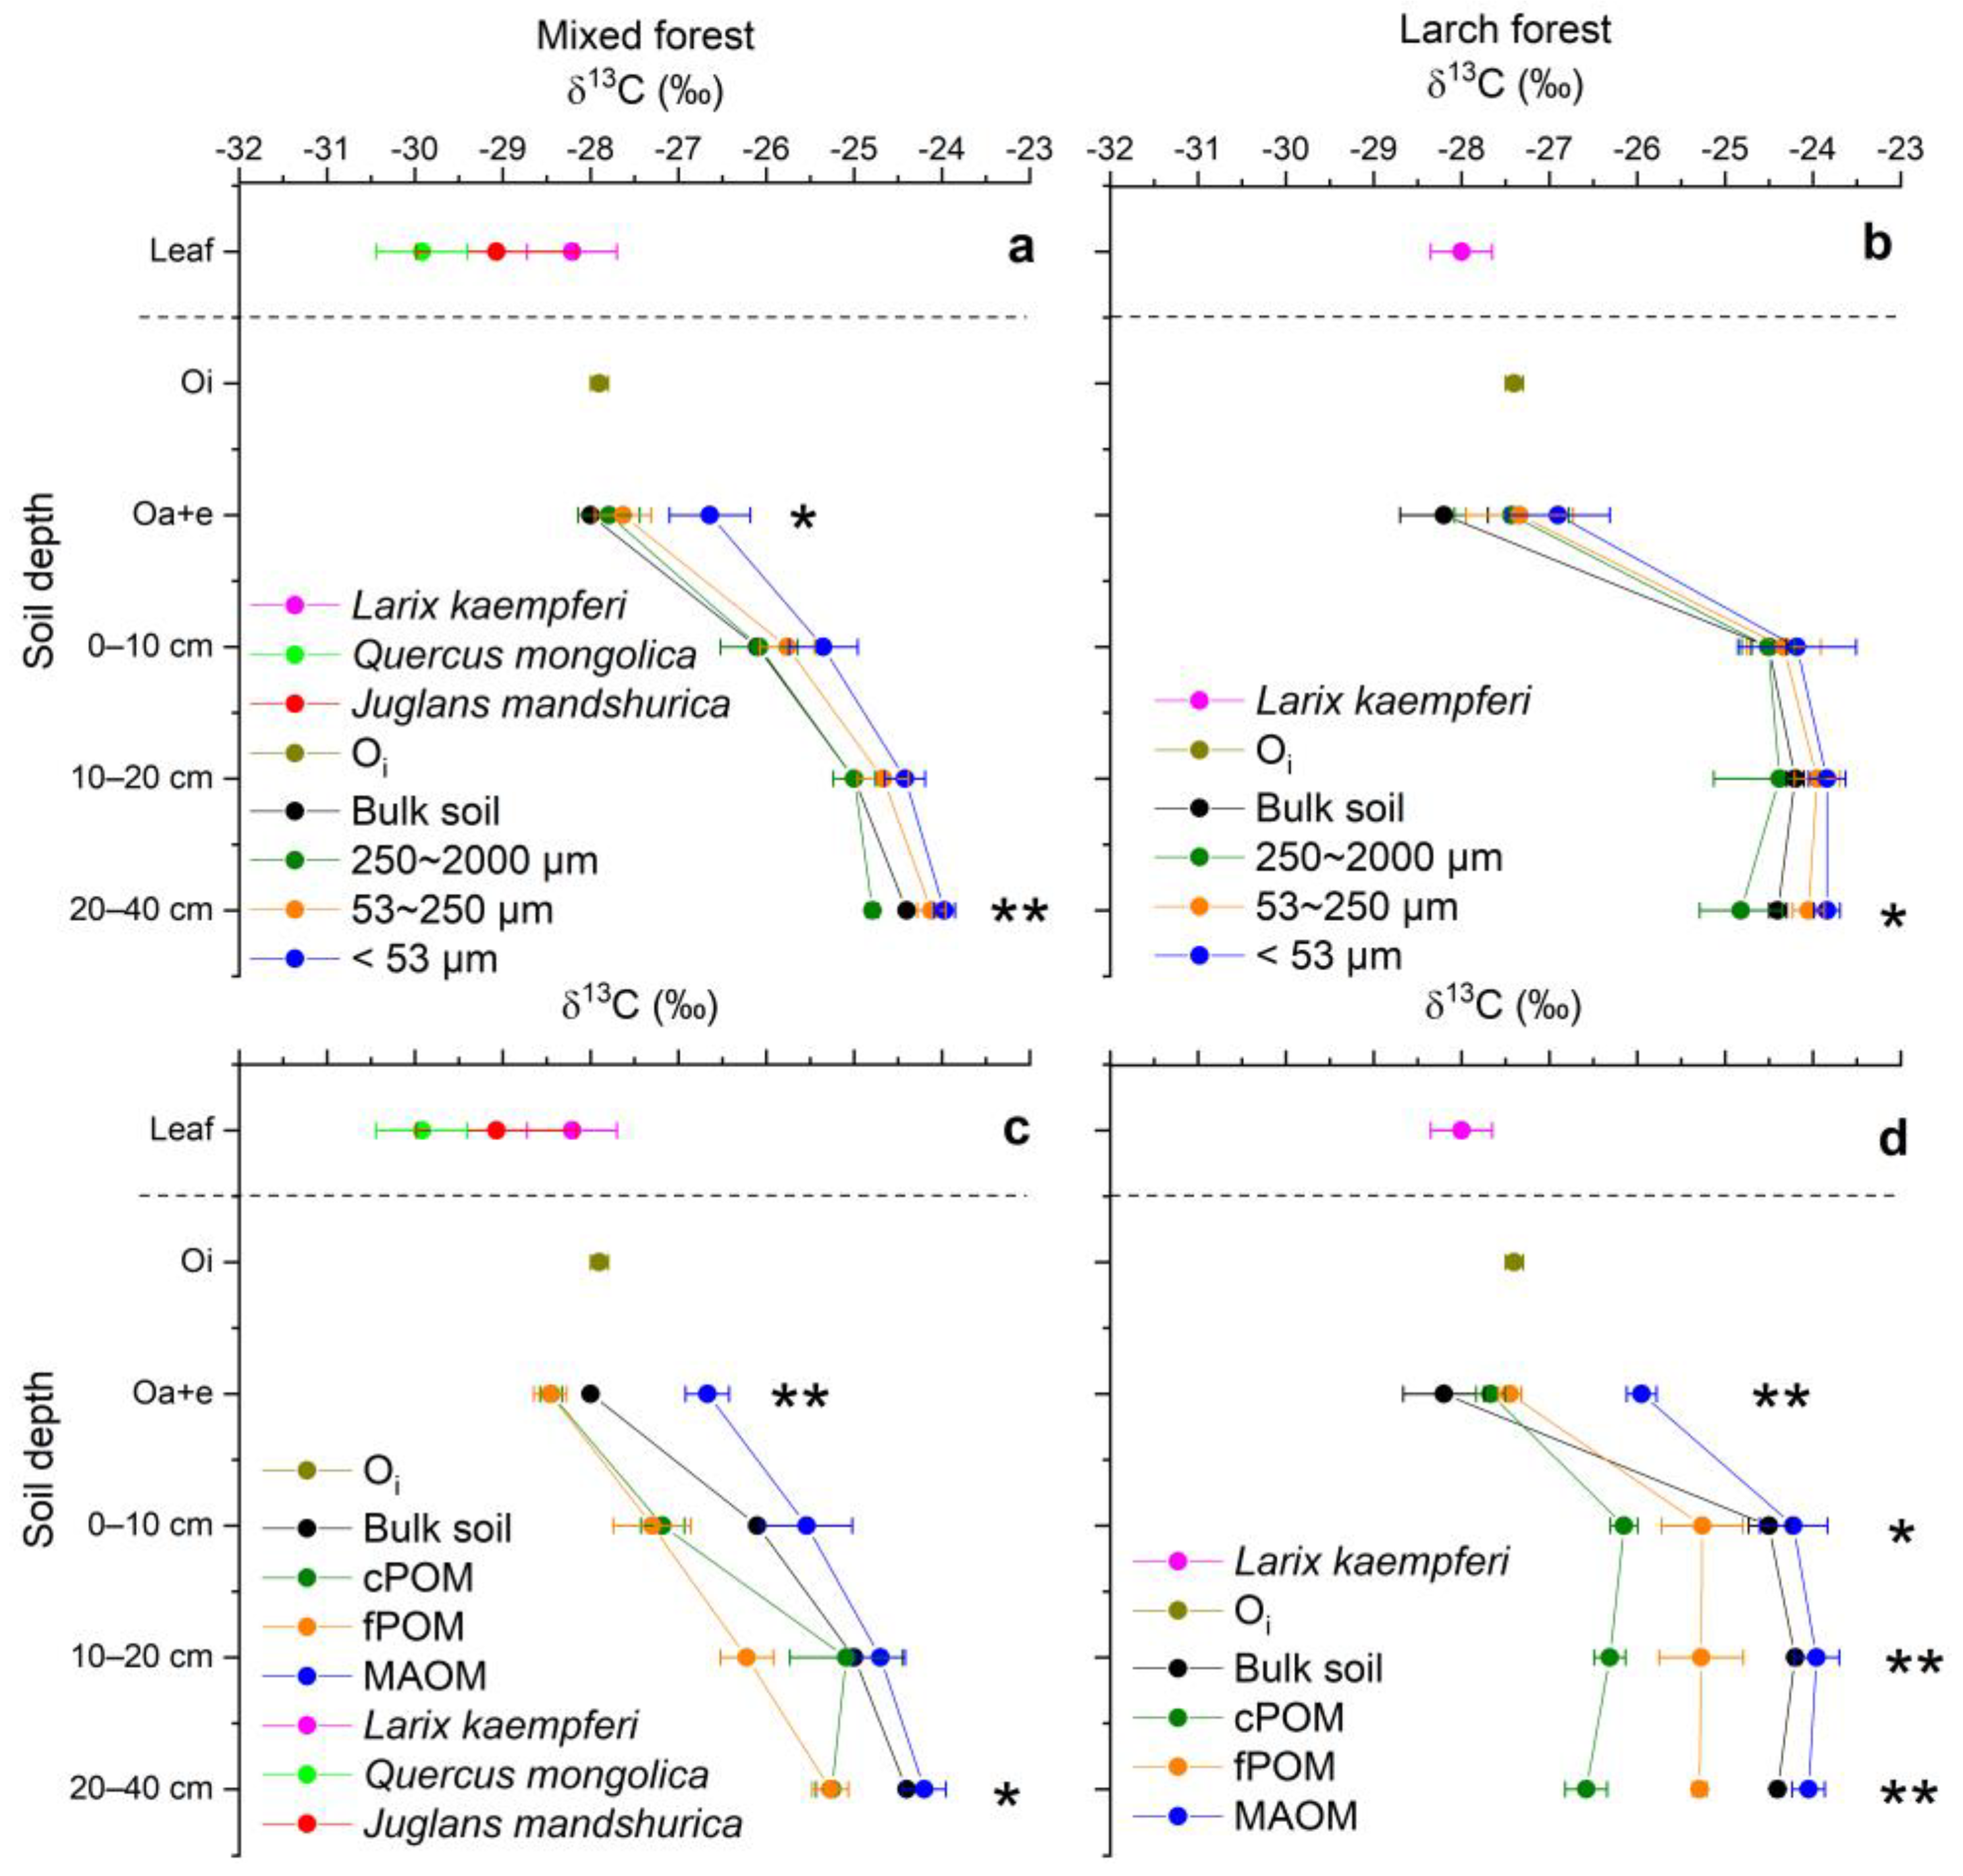
3.4. C/N Ratios and δ13C Values of Soil Aggregates, POM and MAOM

Among aggregate fractions, the C/N ratios were generally lowest in the silt and clay fraction in both MF and LF (Figure 4a,b). The C/N ratios of macroaggregates and silt and clay fraction were higher in the Oa+e layer than in mineral soils (statistically significant only in LF), but did not differ among mineral soil layers by depth. The C/N ratios of soil microaggregates decreased significantly with soil depth (Figure 4a,b; p < 0.01). The δ13C values of aggregates ranged from −27.8‰ to −23.9‰ (Figure 5a,b) and were higher than those of the plant leaf and litter. In both forests, the δ13C of aggregates was enriched the most in the silt and clay fraction and least in the macroaggregates (Figure 5a,b), but the significant differences among aggregate fractions were only observed in the Oa+e layer and in 20–40 cm soils. In accordance with the SOC of bulk soils, δ13C values of aggregate fractions in MF steadily increased from the organic layer to the deep mineral soil layers. However, in LF, there was a sharp increase in δ13C for the aggregate fractions from the organic layer to 0–10 cm mineral soils, though there was little change to the deep soils (Figure 5a,b).
Among POMs and MAOM, the C/N ratios of MAOM were lower than cPOM and fPOM in both forests. The C/N ratios of MAOM decreased significantly with the soil depth, but those of cPOM and fPOM did not change with the soil depth (Figure 4c,d; p < 0.01). The δ13C values of MAOM were heavier than those of cPOM and fPOM in both MF and LF (Figure 5c,d; p < 0.05). The δ13C values of cPOM, fPOM, and MAOM showed a consistent pattern with the δ13C of bulk soils along the soil’s depth.

4. Discussion

4.1. Soil Organic C Storage and Distribution in the Mixed Forest and Larch Forest

In both MF and LF, two dominant forest types in northeastern China, we found that mineral soils are major pools for SOC storage, accounting for 94.2% and 89.8% of the overall soil C. In surface soil layers, the SOC stock in MF was higher in the 0–10 cm layer, while in LF the SOC was higher in the Oa+e layer, reflecting different C inputs, C loss via litter decomposition, and C sequestration. Our results supported those of previous studies [45] in that SOC stocks from the forest floor to 40 cm mineral soils were lower (13.6% less) in LF compared with MF (8609 vs. 9969 g C m−2), mainly due to higher C stocks in mineral soils (0–40 cm) in MF.
The proportions of C protected in aggregates averaged 92.7% in the studied soils (Figure 2c,d), suggesting the importance of aggregation in SOC stability. The proportions of C distributed in macroaggregates in the surface layers were significantly higher than those in microaggregates (Table 3 and Figure 2), but the opposite occurred in the deeper layers (10–20 cm and 20–40 cm). The formation of macroaggregates was mainly influenced by the input of fresh C from surface litter and fine root [46,47,48]. This is supported by the higher C/N ratios and lighter δ13C of macroaggregates than microaggregates (Figure 4a,b and Figure 5a,b), although the differences were not always statistically significant. A previous study at this site found that fine root biomass was significantly higher in the 0–10 cm soil than in the deeper soil, accounting for approximately 30% in MF and 34% in LF across an 80 cm soil profile [45]. Unlike surface horizons, SOC was distributed more in the microaggregates than in the macroaggregates in deeper layers (Figure 2c,d). However, the formation mechanisms of microaggregates in deeper soils are still subject to debate. It was suggested that the formation of aggregates 53–212 μm in size could benefit from either the formation of aggregates with a size of 20–53 μm (i.e., bottom-up model) or from macroaggregates (i.e., top-down model) [49]. In addition, the lower microbial activity (mainly fungi) due to soil compaction might lead to a decline in the fractions of microaggregates compared to those of macroaggregates [50]. From the surface Oa+e layer to the 20–40 cm mineral soil layer, in both MF and LF, the macroaggregate proportion decreased, while the soil bulk density increased (Table 1 and Table 3).
The proportions of C associated with MAOM averaged 81.6% in mineral soils, highlighting the importance of SOM interactions with minerals in the soil organic complex. In addition, our results supported the findings of the previous study [51], which stated that particle size fractionation is an effective method for separating SOC into fractions with different C/N ratios and δ13C values, showing different SOC stabilization mechanisms. In both forests, C/N ratios and δ13C of MAOM were significantly heavier than POM (Figure 5c,d). This is because the C residing in MAOM had undergone a greater degree of microbial decay than POM fractions, and was thus more stable than that in POM [4,24]. In addition, the formation of MAOM involves the sorption of SOC to mineral surfaces [3,11], including silt and clay particles. It has been reported that the amount of protected SOC had a positive correlation with silt and clay contents in natural forest soils [11] and arable soils [52]. In this study, silt and clay particles accounted for 70–80% of bulk soils (Table 1), which might benefit the formation of MAOM and provide great potential for forest C sequestration in northeastern China.

4.2. Soil C Stability along Soil Depth in the Mixed Forest and Larch Forest

Our study provided strong evidence that deeper mineral soil stored a large quantity of SOC (Table 1). Soils sampled at 10–20 cm and 20–40 cm depths contributed 61.3% and 64.0% of the total soil C (including those in the surface Oi and Oa+e layers) in the MF and LF, respectively. Globally, deep soil (up to 1 m depth and between 1 and 3 m) contains a large quantity of terrestrial soil C [53], yet most soil studies are restricted to the surface soil only. The mechanisms leading to SOC stabilization between deeper and surface soils are quite different. Deep soils are older and less disturbed. At the same time, the SOC stock was lower in deeper layers than in surface layers, due to less plant C inputs from litter and root turnover. Together, these soil properties govern the formation and stability of soil organic matter along the soil’s depth. In this study, the higher SOC stability in deeper soils than surface soils were supported by the higher proportion of C distributed in microaggregates and MAOM in both forest types. The important role of the formation of aggregates and the interaction with minerals on SOC stabilization in the deeper soils has also been reported in previous grassland and forest studies [12,23].
The higher SOC stability in deeper soils was supported by the declining C/N ratios and heavier δ13C of bulk soils with soil depth, consistent with previous studies [26,54]. C/N ratios and δ13C values of relatively stabilized soil fractions (microaggregates and MAOM) showed the same pattern as bulk soils, supporting their contribution to SOC stabilization. Two important factors may be responsible for the 13C enrichment of deeper soils. One is the increasing atmospheric 13CO2 due to fossil fuel burning (Suess effect) [55], and the other is the increasing contribution of microbial-derived C [56]. The Suess effect may account for a 1.5‰ increase in δ13C along the soil depth [55]. However, there are 3.5‰ and 3‰ increases from the organic layer to 20–40 cm mineral soils for MF and LF, respectively (Table 1). Therefore, the increasing contribution of microbial-derived C along the soil’s depth could result in the increasing δ13C values in bulk soils and soil fractions, which have been proven to be highly stabilized in soils [4], and have contributed to long-term SOC accumulation [5]. Alternatively, the C/N ratios of MAOM (8.3~10.7; Figure 4) did not exceed the microbial range (fungi, 4.5~15; bacteria, 3~5), indicating a higher contribution of microbe-derived OM to the MAOM fraction in these systems [10].
Despite similar deep soil contributions to C stocks, and MAOM and microaggregates’ contribution to C stability in both MF and LF, our study found that LF had a different profile pattern of δ13C from MF, indicating different SOM formation dynamics. The 13C enrichment in the 0–10 cm soils relative to the organic layer was larger in LF (3.7‰) than in MF (1.9‰). In this study, LF can be considered an ECM-dominated forest, and MF an AM–ECM co-dominated forest (Table 3). In order to obtain nutrients (such as N) for plant growth, ectomycorrhizal fungi produce enzymes to decompose SOM [57]. This nutrient economy could promote the microbial decomposition of old SOM (priming effect), resulting in a decline in C concentrations but heavier 13C values of residual soils [58]. This effect tends to be stronger in the 0–10 cm and 10–20 cm soils in LF, partially due to the higher fine root biomass in those layers [40]. Alternatively, the slow decomposition of LF litter can reduce the C flow to deeper soil layers and may result in the accumulation of plant-based C on the surface (Table 1). Furthermore, the δ13C values of cPOM and fPOM in MF were similar except in the 10–20 cm layer, while in LF, the δ13C values of cPOM and fPOM were different. This difference indicated that the formation and turnover of cPOM and fPOM in LF could be independent of each other. Together with the higher surface SOC stock in LF, these findings suggested that the SOC turnover in LF, especially in the surface soils, could be slow and would be more vulnerable to disturbance caused by future land use and climate changes. Effective forest management practices should be considered to maintain and/or restore soil C storage in LF, such as through the reservation of shrubs to reduce C and nutrient losses [59].

5. Conclusions

We conducted a comparative study of soil C in two major types of forest in northeastern China, secondary mixed forest (MF) and larch plantation forest (LF), and found substantial SOC stocks in both forests, especially in the deeper mineral soil layers (10–20 and 20–40 cm), thus demonstrating the presence of potential terrestrial C pools in northeastern China, which is a major forest region in the nation. We found that larch forest had lower C stocks (13.6% less) than mixed forest after 50 years of forest development, indicating the higher C benefits of natural secondary forests, in addition to biodiversity ecosystem values, compared to the larch plantation. For both forests, SOC was protected by association with soil minerals and via occlusion within soil aggregates. Our results demonstrated that SOC stability increased with soil depth because of the increased C proportion in microaggregates and MAOM in deeper soils. Furthermore, the declining C/N ratios, as well as heavier δ13C values of soil fractions, indicated that the majority of SOC in deeper soils was microbially derived, which led to higher SOM stability. Our results may help to evaluate the SOC storage capacity of MF and LF in northeastern China and may have broader implications for forest SOC evaluation worldwide.

Author Contributions

Conceptualization, W.Z. and Y.F.; methodology, W.Z., Y.F. and D.L.; formal analysis, D.L., W.Z. and Y.F.; investigation, D.L., S.L., Y.W. and S.Z.; writing—original draft preparation, D.L.; writing—review and editing, W.Z. and Y.F.; visualization, D.L.; supervision, W.Z. and Y.F.; funding acquisition, W.Z., Y.F. and D.L. All authors have read and agreed to the published version of the manuscript.

Funding

This study was financially supported by the Key Research Program of Frontier Sciences of Chinese Academy of Sciences (QYZDB-SSW-DQC002), the National Natural Science Foundation of China (31528003, 31600358), the Youth Innovation Promotion Association CAS to Dongwei Liu (no. 2023204), and Natural Science Foundation of Liaoning (2023-MS-026).

Data Availability Statement

The data that support the findings of this study are available from the corresponding author upon reasonable request.

Acknowledgments

We would like to thank Chao Wang, Ruzhen Wang, Torsten Juelich, Simon Duan, and the reviewers and editors for their helpful comments and constructive suggestions which have greatly improved the quality of this paper. We thank Xiaoming Fang and Weidong Zhang for assisting with soil sampling and analysis.

Conflicts of Interest

The authors declare no conflict of interest.

References

  1. IPCC. Summary for Policymakers. In Climate Change 2021: The Physical Science Basis. Contribution of Working Group I to the Sixth Assessment Report of the Intergovernmental Panel on Climate Change; Masson-Delmotte, V., Zhai, P., Pirani, A., Connors, S.L., Péan, C., Berger, S., Caud, N., Chen, Y., Goldfarb, L., Gomis, M.I., et al., Eds.; Cambridge University Press: Cambridge, UK; New York, NY, USA, 2021. [Google Scholar]
  2. Friedlingstein, P.; O’Sullivan, M.; Jones, M.W.; Andrew, R.M.; Hauck, J.; Olsen, A.; Peters, G.P.; Peters, W.; Pongratz, J.; Sitch, S.; et al. Global Carbon Budget 2020. Earth Syst. Sci. Data 2020, 12, 3269–3340. [Google Scholar] [CrossRef]
  3. Schmidt, M.W.I.; Torn, M.S.; Abiven, S.; Dittmar, T.; Guggenberger, G.; Janssens, I.A.; Kleber, M.; Kögel-Knabner, I.; Lehmann, J.; Manning, D.A.C.; et al. Persistence of soil organic matter as an ecosystem property. Nature 2011, 478, 49–56. [Google Scholar] [CrossRef]
  4. Cotrufo, M.F.; Wallenstein, M.D.; Boot, C.M.; Denef, K.; Paul, E. The Microbial Efficiency-Matrix Stabilization (MEMS) framework integrates plant litter decomposition with soil organic matter stabilization: Do labile plant inputs form stable soil organic matter? Glob. Chang. Biol. 2013, 19, 988–995. [Google Scholar] [CrossRef]
  5. Liang, C.; Schimel, J.P.; Jastrow, J.D. The importance of anabolism in microbial control over soil carbon storage. Nat. Microbiol. 2017, 2, 17105. [Google Scholar] [CrossRef] [PubMed]
  6. Schnecker, J.; Borken, W.; Schindlbacher, A.; Wanek, W. Little effects on soil organic matter chemistry of density fractions after seven years of forest soil warming. Soil Biol. Biochem. 2016, 103, 300–307. [Google Scholar] [CrossRef]
  7. García-Palacios, P.; Crowther, T.W.; Dacal, M.; Hartley, I.P.; Reinsch, S.; Rinnan, R.; Rousk, J.; Hoogen, J.V.D.; Ye, J.-S.; Bradford, M.A. Evidence for large microbial-mediated losses of soil carbon under anthropogenic warming. Nat. Rev. Earth Environ. 2021, 2, 507–517. [Google Scholar] [CrossRef]
  8. Liu, X.J.A.; Pold, G.; Domeignoz-Horta, L.A.; Geyer, K.M.; Caris, H.; Nicolson, H.; Kemner, K.M.; Frey, S.D.; Melillo, J.M.; DeAngelis, K.M. Soil aggregate-mediated microbial responses to long-term warming. Soil Biol. Biochem. 2020, 152, 108055. [Google Scholar] [CrossRef]
  9. Chen, Y.; Han, M.; Yuan, X.; Zhou, H.; Zhao, X.; Schimel, J.P.; Zhu, B. Long-term warming reduces surface soil organic carbon by reducing mineral-associated carbon rather than “free” particulate carbon. Soil Biol. Biochem. 2023, 177, 108905. [Google Scholar] [CrossRef]
  10. Cotrufo, M.F.; Ranalli, M.G.; Haddix, M.L.; Six, J.; Lugato, E. Soil carbon storage informed by particulate and mineral-associated organic matter. Nat. Geosci. 2019, 12, 989–994. [Google Scholar] [CrossRef]
  11. Six, J.; Conant, R.T.; Paul, E.A.; Paustian, K. Stabilization mechanisms of soil organic matter: Implications for C-saturation of soils. Plant Soil 2002, 241, 155–176. [Google Scholar] [CrossRef]
  12. Schrumpf, M.; Kaiser, K.; Guggenberger, G.; Persson, T.; Kögel-Knabner, I.; Schulze, E.-D. Storage and stability of organic carbon in soils as related to depth, occlusion within aggregates, and attachment to minerals. Biogeosciences 2013, 10, 1675–1691. [Google Scholar] [CrossRef]
  13. Lavallee, J.M.; Soong, J.L.; Cotrufo, M.F. Conceptualizing soil organic matter into particulate and mineral-associated forms to address global change in the 21st century. Glob. Chang. Biol. 2020, 26, 261–273. [Google Scholar] [CrossRef] [PubMed]
  14. Poeplau, C.; Don, A.; Six, J.; Kaiser, M.; Benbi, D.; Chenu, C.; Cotrufo, M.F.; Derrien, D.; Gioacchini, P.; Grand, S.; et al. Isolating organic carbon fractions with varying turnover rates in temperate agricultural soils—A comprehensive method comparison. Soil Biol. Biochem. 2018, 125, 10–26. [Google Scholar] [CrossRef]
  15. Wu, Y.; Deng, M.; Huang, J.; Yang, S.; Guo, L.; Yang, L.; Ahirwal, J.; Peng, Z.; Liu, W.; Liu, L. Global patterns in mycorrhizal mediation of soil carbon storage, stability, and nitrogen demand: A meta-analysis. Soil Biol. Biochem. 2022, 166, 108578. [Google Scholar] [CrossRef]
  16. Gunina, A.; Kuzyakov, Y. Pathways of litter C by formation of aggregates and SOM density fractions: Implications from 13C natural abundance. Soil Biol. Biochem. 2014, 71, 95–104. [Google Scholar] [CrossRef]
  17. Han, L.; Sun, K.; Jin, J.; Xing, B. Some concepts of soil organic carbon characteristics and mineral interaction from a review of literature. Soil Biol. Biochem. 2016, 94, 107–121. [Google Scholar] [CrossRef]
  18. Rumpel, C.; Kögel-Knabner, I. Deep soil organic matter—A key but poorly understood component of terrestrial C cycle. Plant Soil 2011, 338, 143–158. [Google Scholar] [CrossRef]
  19. Crowther, T.W.; Todd-Brown, K.E.O.; Rowe, C.W.; Wieder, W.R.; Carey, J.C.; Machmuller, M.B.; Snoek, B.L.; Fang, S.; Zhou, G.; Allison, S.D.; et al. Quantifying global soil carbon losses in response to warming. Nature 2016, 540, 104–108. [Google Scholar] [CrossRef]
  20. Soong, J.L.; Castanha, C.; Pries, C.E.H.; Ofiti, N.; Porras, R.C.; Riley, W.J.; Schmidt, M.W.; Torn, M.S. Five years of whole-soil warming led to loss of subsoil carbon stocks and increased CO2 efflux. Sci. Adv. 2021, 7, abd1343. [Google Scholar] [CrossRef]
  21. Lyu, M.; Xie, J.; Ukonmaanaho, L.; Jiang, M.; Li, Y.; Chen, Y.; Yang, Z.; Zhou, Y.; Lin, W.; Yang, Y. Land use change exerts a strong impact on deep soil C stabilization in subtropical forests. J. Soils Sediments 2016, 17, 2305–2317. [Google Scholar] [CrossRef]
  22. Stone, M.M.; Plante, A.F. Relating the biological stability of soil organic matter to energy availability in deep tropical soil profiles. Soil Biol. Biochem. 2015, 89, 162–171. [Google Scholar] [CrossRef]
  23. Qin, S.; Chen, L.; Fang, K.; Zhang, Q.; Wang, J.; Liu, F.; Yu, J.; Yang, Y. Temperature sensitivity of SOM decomposition governed by aggregate protection and microbial communities. Sci. Adv. 2019, 5, eaau1218. [Google Scholar] [CrossRef] [PubMed]
  24. Mobley, M.L.; Lajtha, K.; Kramer, M.G.; Bacon, A.R.; Heine, P.R.; Richter, D.D. Surficial gains and subsoil losses of soil carbon and nitrogen during secondary forest development. Glob. Chang. Biol. 2015, 21, 986–996. [Google Scholar] [CrossRef] [PubMed]
  25. Cheng, X.; Luo, Y.; Xu, X.; Sherry, R.; Zhang, Q. Soil organic matter dynamics in a North America tallgrass prairie after 9 yr of experimental warming. Biogeosciences 2011, 8, 1487–1498. [Google Scholar] [CrossRef]
  26. Breulmann, M.; Boettger, T.; Buscot, F.; Gruendling, R.; Schulz, E. Carbon storage potential in size–density fractions from semi-natural grassland ecosystems with different productivities over varying soil depths. Sci. Total. Environ. 2016, 545–546, 30–39. [Google Scholar] [CrossRef] [PubMed]
  27. Schwendenmann, L.; Pendall, E. Effects of forest conversion into grassland on soil aggregate structure and carbon storage in Panama: Evidence from soil carbon fractionation and stable isotopes. Plant Soil 2006, 288, 217–232. [Google Scholar] [CrossRef]
  28. Frey, S.D.; Ollinger, S.; Nadelhoffer, K.; Bowden, R.; Brzostek, E.; Burton, A.; Caldwell, B.A.; Crow, S.; Goodale, C.L.; Grandy, A.S.; et al. Chronic nitrogen additions suppress decomposition and sequester soil carbon in temperate forests. Biogeochemistry 2014, 121, 305–316. [Google Scholar] [CrossRef]
  29. Houghton, R.A.; Hall, F.; Goetz, S.J. Importance of biomass in the global carbon cycle. J. Geophys. Res. Biogeosciences 2009, 114, G00E03. [Google Scholar] [CrossRef]
  30. Pan, Y.; Birdsey, R.A.; Fang, J.; Houghton, R.; Kauppi, P.E.; Kurz, W.A.; Phillips, O.L.; Shvidenko, A.; Lewis, S.L.; Canadell, J.G.; et al. A Large and Persistent Carbon Sink in the World’s Forests. Science 2011, 333, 988–993. [Google Scholar] [CrossRef]
  31. Wang, J.; Feng, L.; Palmer, P.I.; Liu, Y.; Fang, S.; Bösch, H.; O’dell, C.W.; Tang, X.; Yang, D.; Liu, L.; et al. Large Chinese land carbon sink estimated from atmospheric carbon dioxide data. Nature 2020, 586, 720–723. [Google Scholar] [CrossRef]
  32. Cabon, A.; Kannenberg, S.A.; Arain, A.; Babst, F.; Baldocchi, D.; Belmecheri, S.; Delpierre, N.; Guerrieri, R.; Maxwell, J.T.; McKenzie, S.; et al. Cross-biome synthesis of source versus sink limits to tree growth. Science 2022, 376, 758–761. [Google Scholar] [CrossRef]
  33. Piao, S.; Fang, J.; Ciais, P.; Peylin, P.; Huang, Y.; Sitch, S.; Wang, T. The carbon balance of terrestrial ecosystems in China. Nature 2009, 458, 1009–1013. [Google Scholar] [CrossRef] [PubMed]
  34. Mason, W.L.; Zhu, J.J. Silviculture of Planted Forests Managed for Multi-functional Objectives: Lessons from Chinese and British Experiences. In Challenges and Opportunities for the World’s Forests in the 21st Century; Fenning, T., Ed.; Springer: Dordrecht, The Netherlands, 2014; pp. 37–54. [Google Scholar]
  35. National Forestry and Grassland Administration. China Forest Resources Report; (In chinese). China Forestry Publisher: Beijing, China, 2019; pp. 326–397.
  36. Yang, K.; Shi, W.; Zhu, J.-J. The impact of secondary forests conversion into larch plantations on soil chemical and microbiological properties. Plant Soil 2013, 368, 535–546. [Google Scholar] [CrossRef]
  37. Ngaba, M.J.Y.; Hu, Y.-L.; Bol, R.; Ma, X.-Q.; Jin, S.-F.; Mgelwa, A.S. Effects of land use change from natural forest to plantation on C, N and natural abundance of (13)C and (15)N along a climate gradient in eastern China. Sci. Rep. 2019, 9, 16516. [Google Scholar] [CrossRef]
  38. Wang, W.; Wang, H.; Yuangang, Z.U. Temporal changes in SOM, N, P, K, and their stoichiometric ratios during reforestation in China and interactions with soil depths: Importance of deep-layer soil and management implications. For. Ecol. Manag. 2014, 325, 8–17. [Google Scholar] [CrossRef]
  39. Huang, S.; Elliott, E.M.; Felix, J.D.; Pan, Y.; Liu, D.; Li, S.; Li, Z.; Zhu, F.; Zhang, N.; Fu, P.; et al. Seasonal pattern of ammonium 15N natural abundance in precipitation at a rural forested site and implications for NH3 source partitioning. Environ. Pollut. 2019, 247, 541–549. [Google Scholar] [CrossRef] [PubMed]
  40. Li, S.; Gurmesa, G.A.; Zhu, W.; Gundersen, P.; Zhang, S.; Xi, D.; Huang, S.; Wang, A.; Zhu, F.; Jiang, Y.; et al. Fate of atmospherically deposited NH4+ and NO3− in two temperate forests in China: Temporal pattern and redistribution. Ecol. Appl. 2019, 29, e01920. [Google Scholar]
  41. Soudzilovskaia, N.A.; Vaessen, S.; Barcelo, M.; He, J.; Rahimlou, S.; Abarenkov, K.; Brundrett, M.C.; Gomes, S.I.; Merckx, V.; Tedersoo, L. FungalRoot: Global online database of plant mycorrhizal associations. New Phytol. 2020, 227, 955–966. [Google Scholar] [CrossRef]
  42. Six, J.; Elliott, E.; Paustian, K.; Doran, J.W. Aggregation and Soil Organic Matter Accumulation in Cultivated and Native Grassland Soils. Soil Sci. Soc. Am. J. 1998, 62, 1367–1377. [Google Scholar] [CrossRef]
  43. Wang, F.; Zhu, W.; Chen, H. Changes of soil C stocks and stability after 70-year afforestation in the Northeast USA. Plant Soil 2015, 401, 319–329. [Google Scholar] [CrossRef]
  44. Six, J.; Paustian, K.; Elliott, E.; Combrink, C. Soil structure and organic matter I. Distribution of aggregate-size classes and aggregate-associated carbon. Soil Sci. Soc. Am. J. 2000, 64, 681–689. [Google Scholar] [CrossRef]
  45. Yang, K.; Zhu, J.; Xu, S.; Zheng, X. Conversion from temperate secondary forests into plantations (Larix spp.): Impact on belowground carbon and nutrient pools in northeastern China. Land Degrad. Dev. 2018, 29, 4129–4139. [Google Scholar] [CrossRef]
  46. Six, J.; Bossuyt, H.; Degryze, S.; Denef, K. A history of research on the link between (micro)aggregates, soil biota, and soil organic matter dynamics. Soil Tillage Res. 2004, 79, 7–31. [Google Scholar] [CrossRef]
  47. Rasse, D.P.; Rumpel, C.; Dignac, M.-F. Is soil carbon mostly root carbon? Mechanisms for a specific stabilisation. Plant Soil 2005, 269, 341–356. [Google Scholar] [CrossRef]
  48. Clemmensen, K.E.; Bahr, A.; Ovaskainen, O.; Dahlberg, A.; Ekblad, A.; Wallander, H.; Stenlid, J.; Finlay, R.D.; Wardle, D.A.; Lindahl, B.D. Roots and Associated Fungi Drive Long-Term Carbon Sequestration in Boreal Forest. Science 2013, 339, 1615–1618. [Google Scholar] [CrossRef]
  49. Verchot, L.V.; Dutaur, L.; Shepherd, K.D.; Albrecht, A. Organic matter stabilization in soil aggregates: Understanding the biogeochemical mechanisms that determine the fate of carbon inputs in soils. Geoderma 2011, 161, 182–193. [Google Scholar] [CrossRef]
  50. Kurmi, B.; Nath, A.J.; Lal, R.; Das, A.K. Water stable aggregates and the associated active and recalcitrant carbon in soil under rubber plantation. Sci. Total. Environ. 2020, 703, 135498. [Google Scholar] [CrossRef]
  51. Garten, C.T. Comparison of forest soil carbon dynamics at five sites along a latitudinal gradient. Geoderma 2011, 167–168, 30–40. [Google Scholar] [CrossRef]
  52. Schweizer, S.A.; Bucka, F.B.; Graf-Rosenfellner, M.; Kögel-Knabner, I. Soil microaggregate size composition and organic matter distribution as affected by clay content. Geoderma 2019, 355, 113901. [Google Scholar] [CrossRef]
  53. Jackson, R.B.; Lajtha, K.; Crow, S.E.; Hugelius, G.; Kramer, M.G.; Piñeiro, G. The Ecology of Soil Carbon: Pools, Vulnerabilities, and Biotic and Abiotic Controls. Annu. Rev. Ecol. Evol. Syst. 2017, 48, 419–445. [Google Scholar] [CrossRef]
  54. Hou, Y.; Chen, Y.; Chen, X.; He, K.; Zhu, B. Changes in soil organic matter stability with depth in two alpine ecosystems on the Tibetan Plateau. Geoderma 2019, 351, 153–162. [Google Scholar] [CrossRef]
  55. Wynn, J.G.; Harden, J.W.; Fries, T.L. Stable carbon isotope depth profiles and soil organic carbon dynamics in the lower Mississippi Basin. Geoderma 2006, 131, 89–109. [Google Scholar] [CrossRef]
  56. Wang, C.; Wei, H.; Liu, D.; Luo, W.; Hou, J.; Cheng, W.; Han, X.; Bai, E. Depth profiles of soil carbon isotopes along a semi-arid grassland transect in northern China. Plant Soil 2017, 417, 43–52. [Google Scholar] [CrossRef]
  57. Averill, C.; Turner, B.L.; Finzi, A.C. Mycorrhiza-mediated competition between plants and decomposers drives soil carbon storage. Nature 2014, 505, 543–545. [Google Scholar] [CrossRef]
  58. Phillips, R.P.; Brzostek, E.; Midgley, M.G. The mycorrhizal-associated nutrient economy: A new framework for predicting carbon–nutrient couplings in temperate forests. New Phytol. 2013, 199, 41–51. [Google Scholar] [CrossRef]
  59. Yan, T.; Zhu, J.; Yang, K.; Yu, L.; Zhang, J. Nutrient removal under different harvesting scenarios for larch plantations in northeast China: Implications for nutrient conservation and management. For. Ecol. Manag. 2017, 400, 150–158. [Google Scholar] [CrossRef]
Figure 1. Carbon concentration (mean ± 1 se, n = 3) of soil aggregates, as well as soil cPOM, fPOM, and MAOM in the mixed forest (a,c) and the larch forest (b,d). Different small letters indicate significant difference among soil fractions in each soil depth, and different capital letters indicate significant difference among soil depths for each fraction in each forest at 0.05 significance level, based on Tukey HSD analysis. Data from MF and LF plots were analyzed separately.
Land 12 01019 g001
Figure 2. Soil C stock and SOC proportion of aggregate in a mixed forest (a,c) and a larch forest (b,d). Data are mean ± 1 se, n = 3. Different small letters indicate significant difference among fractions in each soil depth, and different capital letters indicate significant difference among depths for each size fraction at 0.05 significance level, based on Tukey HSD analysis. Data from MF and LF plots were analyzed separately.
Land 12 01019 g002
Figure 3. Soil C stock and proportion of cPOM, fPOM, and MAOM fractions in the mixed forest (MF: (a,c)) and the larch forest (LF: (b,d)). Data are mean ± 1 se, n = 3. Different superscript small letters indicate significant difference among fractions in each soil depth, and different superscript capital letters indicate significant difference among depths for each fraction at 0.05 significance level, based on Tukey HSD analysis. Data from MF and LF plots were analyzed separately.
Land 12 01019 g003
Figure 4. C/N ratios (mean ± 1 se, n = 3) of soil aggregate, and soil cPOM, fPOM, and MAOM fractions in the mixed forest (MF: (a,c)) and the larch forest (LF: (b,d)). Different lowercase letters indicate significant difference among soil fractions in each soil depth, and different capital letters indicate significant difference among depths for each fraction at 0.05 significance level, based on Tukey HSD analysis. Data from MF and LF plots were analyzed separately.
Land 12 01019 g004
Figure 5. δ13C values of leaf, bulk soil, and various soil fractions in the mixed forest (MF: (a,c)) and the larch forest (LF: (b,d); mean ± 1 se, n = 3). Asterisk indicates significant difference among soil fractions in each soil depth; *, p < 0.05, ** p < 0.01.
Land 12 01019 g005
Table 1. Soil texture, C concentration, soil C/N ratios, and C stocks in the mixed forest (MF) and the larch forest (LF).
Forest/
Depth
Sand (%)Silt (%)Clay (%)Bulk Density
(g cm−3)
C (mg g−1 soil)C/NC Stock (g C m−2)δ13C (‰)
MF
Oi 390.8 ± 5.7 A24.8 ± 2.1 A447 ± 58 B−27.9 ± 0.1 C
Oa+e 115.6 ± 6.9 B13.0 ± 0.3 B68 ± 14 B−28.0 ± 0.3 C
O layer 515 ± 46
0–10 cm17.2 ± 0.4 cB52.8 ± 0.5 aA30.0 ± 0.2 bA0.7 ± 0.03 A45.7 ± 8.3 C10.9 ± 0.1 BC3343 ± 608 A−26.1 ± 0.3 B
10–20 cm16.8 ± 0.6 cB54.4 ± 0.7 aA28.8 ± 0.5 bB1.0 ± 0.05 B24.0 ± 4.1 D9.7 ± 0.1 C2481 ± 426 A−25.0 ± 0.2 A
20–40 cm21.0 ± 1.5 cA 53.0 ± 1.2 aA26.0 ± 0.6 bB1.1 ± 0.08 B15.9 ± 4.7 D9.4 ± 0.2 C3630 ± 1081 A−24.4 ± 0.2 A
0–40 cm 9454 ± 2114
Total 9969 ± 2084
LF
Oi 424.9 ± 3.8 A27.5 ± 1.0 A591 ± 16 B−27.4 ± 0.1 B
Oa+e 164.1 ± 9.0 B14.3 ± 0.1 B273 ± 46 B−28.2 ± 0.5 C
O layer 864 ± 60
0–10 cm27.6 ± 1.1 bA46.4 ± 1.0 aA26.1 ± 0.1 bA1.0 ± 0.07 A23.2 ± 1.9 C9.7 ± 0.3 C2239 ± 181 A−24.5 ± 0.2 A
10–20 cm27.4 ± 1.4 bA47.7 ± 1.5 aA24.9 ± 1.2 bA1.1 ± 0.04 AB22.4 ± 5.8 C9.7 ± 0.2 C2409 ± 628 A−24.2 ± 0.1 A
20–40 cm32.7 ± 4.4 bA44.1 ± 3.1 aA23.2 ± 1.3 bA1.2 ± 0.03 B13.1 ± 2.8 C9.1 ± 0.2 C3097 ± 650 A−24.4 ± 0.1 A
0–40 cm 7745 ± 1123
Total 8609 ± 1180
Data are mean ± 1 se, n = 3. Different capital letters indicate significant differences among depths in each forest at 0.05 significance level. Different lowercase letters indicate significant differences among soil particles at 0.05 significance level.
Table 2. Vegetation composition based on mycorrhizal type in the mixed forest and the larch forest.
Mixed ForestLarch Forest
Species
/Mycorrhizal Type
Total Density
(Stems ha−1)
Biomass
(t ha−1)
Total Density
(Stems ha−1)
Biomass
(t ha−1)
Larix kaempferi (ECM)
442 ± 7668.9 ± 16.5567 ± 36147.9 ± 3.8
Juglans mandshurica (AM)
109 ± 2149.5 ± 7.833 ± 279.1 ± 5.3
Quercus mongolica (ECM)
59 ± 138.4 ± 1.7--
Other species201 ± 518.9 ± 1.2327 ± 516.9 ± 0.5
AM84 ±206.7 ± 2.1250 ± 514.7 ± 0.6
AM and ECM117 ± 242.2 ± 0.942 ± 100.6 ± 0.1
ECM--34 ± 101.6 ± 0.5
Total811 ± 53135.7 ± 13.5927 ± 72163.9 ± 3.6
Data are mean ± 1 se, n = 3. ECM: ectomycorrhizal; AM: arbuscular mycorrhizal.
Table 3. The mass distribution of soil aggregates, as well as soil cPOM, fPOM, and MAOM in the mixed forest (MF) and the larch forest (LF).
Forest/
Depth
Proportion of Total Mass of Soil Aggregates and Non-Aggregate (%) Proportion of Total Mass of POM and MAOM (%)
Macroaggre.
(250~2000 μm)
Microaggre.
(53~250 μm)
Silt and Clay
(<53 μm)
Recovery
(%)
cPOM
(250~2000 μm)
fPOM
(53~250 μm)
MAOM
(<53 μm)
Recovery
(%)
MF
  Oa+e71.2 ± 3.3 Aa21.3 ± 3.2 Cb3.5 ± 0.5 Bc96.0 ± 2.327.4 ± 4.3 Ab19.1 ± 4.3 Ab41.1 ± 2.4 Ba95.4 ± 4.3
  0–10 cm50.9 ± 4.1 Ba34.9 ± 4.0 Bb7.3 ± 0.7 ABc93.2 ± 0.714.7 ± 1.3 Bb15.7 ± 0.9 Ab61.2 ± 1.2 Aa90.9 ± 0.9
  10–20 cm28.9 ± 3.1 Cb53.7 ± 2.5 Aa10.1 ± 1.8 Ac92.7 ± 1.416.9 ± 3.6 ABb17.4 ± 1.4 Ab59.8 ± 4.5 Aa90.4 ± 2.4
  20–40 cm24.8 ± 2.0 Cb59.5 ± 2.3 Aa10.6 ± 1.6 Ac94.9 ± 1.419.9 ± 2.3 ABb 20.7 ± 0.6 Ab54.0 ± 1.4 Aa96.7 ± 3.3
LF
  Oa+e69.2 ± 3.1 Aa26.3 ± 3.9 Bb2.5 ± 0.3 Bc98.0 ± 1.326.4 ± 4.3 Aa26.1 ± 4.3 Aa42.9 ± 2.4 Ba87.6 ± 6.4
  0–10 cm53.0 ± 4.5 Ba30.4 ± 4.4 Bb10.8 ± 0.1 Ac94.1 ± 0.118.5 ± 2.9 Ab13.4 ± 5.4 Bb59.0 ± 6.2 Aa91.6 ± 1.2
  10–20 cm30.6 ± 5.5 Cb51.0 ± 3.5 Aa13.9 ± 4.4 Ac95.5 ± 0.617.7 ± 2.8 Ab11.7 ± 1.2 Bb61.0 ± 1.2 Aa94.1 ± 0.6
  20–40 cm28.4 ± 2.9 Cb58.8 ± 2.5 Aa8.2 ± 1.3 ABc95.4 ± 0.423.1 ± 4.8 Ab10.8 ± 2.0 Bb62.8 ± 4.3 Aa94.6 ± 3.3
Data are mean ± 1 se, n = 3. Mass distribution was not correct for sand: macroaggregate and cPOM contains coarse sand (>250 µm) while microaggregate and fPOM contains fine sand (>53 µm). Different superscript small letters indicate significant difference among soil fractions in each soil depth, and different superscript capital letters indicate significant difference among depths for each soil fraction in each forest at 0.05 significance level, based on Tukey HSD analysis.
Disclaimer/Publisher’s Note: The statements, opinions and data contained in all publications are solely those of the individual author(s) and contributor(s) and not of MDPI and/or the editor(s). MDPI and/or the editor(s) disclaim responsibility for any injury to people or property resulting from any ideas, methods, instructions or products referred to in the content.

