Abstract
In this study, we estimated the magnitude of soil-to-atmosphere carbon dioxide (CO2), methane (CH4), and nitrous oxide (N2O) fluxes in deciduous tree and willow coppice based agroforestry systems in hemiboreal Latvia. We studied systems combining hybrid alder, hybrid aspen, silver birch, black alder, and willow clones with perennial reed canary grass (RCG), which were established in the spring of 2011 in former cropland with mineral soil. Three different soil fertilisation practices were initially applied (control without fertilisation, fertilisation with wood ash, and sewage sludge). Measurements of fluxes of greenhouse gases were taken in both deciduous tree, willow coppice and RCG plots using a closed opaque manual chamber method, from June 2020 to October 2021. Soil CO2 fluxes (the sum of autotrophic and heterotrophic respiration) were increased in RCG plots compared to plots under willow and deciduous tree canopies, while the highest mean CH4 fluxes were found in willow coppice plots. No impact of dominant vegetation type on instantaneous soil N2O fluxes was found. Temperature was the key determinant of the magnitude of CO2 and N2O fluxes. The highest soil CO2 and N2O fluxes were detected during the summer and decreased in the following order: summer, autumn, spring, winter. There were no pronounced relationships between soil CH4 fluxes and temperature.
1. Introduction
Woody vegetation (trees and shrubs) introduction into agricultural lands (cropland and grassland) significantly alters both carbon (C) and nutrient biogeochemical cycling [1,2], including fluxes of soil-to-atmosphere greenhouse gases (GHGs) such as carbon dioxide (CO2), methane (CH4), and nitrous oxide (N2O) (e.g., [3,4]). An increasing number of studies have shown that agroforestry (AF) systems combining woody vegetation with agricultural practices on the same unit of land are among the most effective initiatives for climate change mitigation [5,6,7,8,9,10,11]. Such agroecosystems can increase soil organic C stock, [5,6,7,8,9] mainly through continuous root turnover and addition of litter to soil [7], as well as through additional sequestering and storing of atmospheric CO2 in tree and shrub biomass [10,11]. However, the basic premise of AF systems established to contribute to the mitigation of climate change determines that net GHG removals (mostly CO2 uptake through photosynthesis, accumulation in woody biomass, and increase of soil organic C stock) have to exceed GHG emissions at the ecosystem level [12,13]. In addition, it is anticipated that the area unit of an AF system—especially its long-lived components, such as the soil and woody vegetation—will accumulate greater amounts of C than the same area of solely agricultural or solely forestry systems [13]. Most of the studies on the impact of AF systems on soil GHG fluxes and soil organic C stocks have been conducted in tropical and temperate AF systems (e.g., [5,14,15]), while boreal and hemiboreal AF systems have been less explored thus far, limiting the ability to detail scientifically based recommendations for AF management strategies for these regions. In addition, Quandt et al. [16] recently emphasized the uneven geographic distribution of research in this area. This study could be highly supportive by increasing knowledge specific to hemiboreal regions, with a focus on Europe.
Soil-to-atmosphere CO2 flux is one of the key processes of C cycling in terrestrial ecosystems [17,18,19,20]. Consequently, the magnitude of soil respiration is a mandatory parameter for evaluating the C balance at the ecosystem level [21,22]. In general, soil CO2 fluxes originate from plant root (and associated rhizosphere) autotrophic respiration, and heterotrophic decomposition of soil organic matter, including plant litter driven by soil microorganisms [19,23,24]. Implementation of AF systems on agricultural land has been shown to affect both soil microbial communities [25]—and thus CO2 emissions from soil caused by soil heterotrophic respiration [19]—and vegetation cover, significantly affecting soil autotrophic respiration [20,26]. Nevertheless, soil can act as both a CO2 source and an atmospheric CO2 sink, considering that the input of organic matter mostly occurs through vegetation litter (both above and below ground), which is reflected in increased soil organic C stock [27]. The magnitude of CH4 emissions or removals is determined by the balance of bidirectional microbial processes producing CH4 (methanogenesis under anaerobic conditions) and consuming CH4 (methanotrophy under the presence of molecular oxygen (O2)) [24,27,28,29]. In dry, well-aerated soils, methanotrophy is the dominant process, and net uptake of atmospheric CH4 by the soil can thus be observed [28]. In addition, introducing trees into agricultural land may alter (lower) soil bulk density and moisture, which enhances gas diffusion and thus CH4 uptake [30,31]. The N2O is generally produced by microbial processes such as nitrification (oxidation of NH4+ to NO3−) and denitrification (reduction of NO3− to N2O and N2) [24,32], but can be produced as well as taken up by soil through other pathways [27,33]. In general, the key drivers of soil GHG fluxes (production and consumption)—i.e., the parameters controlling microbial activity and vegetation growth—include land cover, land use, and applied management practices, drainage, local and regional climate, hydrology (temperature, precipitation, groundwater level, soil moisture and aeration), and soil physical and chemical properties, including the availability of nutrients and C substrates, soil texture, C/N ratio, and pH value [4,18,24,26,34,35].
Considering Europe’s path to be climate-neutral by 2050, including the European Green Deal [36] and the Paris Agreement [37], the Commission has proposed a revision of the Land Use, Land-Use Change and Forestry (LULUCF) Regulation to ensure an increase in C removals in the LULUCF sector including cropland and grassland [38]. Thus, effective and scientifically based climate change mitigation measures are sought for the LULUCF sector. As AF systems could be a land-use alternative to traditional sole-cropping practices aimed at enhancing CO2 mitigation and soil C sequestration [7,10,16,39,40,41,42,43], AF is getting increasing attention [40]. Nevertheless, insufficient evidence remains on the key processes that determine GHG emissions in AF systems, and there is a need for more context- and region-specific emissions factors for the Intergovernmental Panel on Climate Change (IPCC) accounting system [40]. Understanding of soil GHG fluxes after establishment of AF systems in agricultural land, however, is necessary to estimate the overall mitigation effect of these systems [43]. Our objective in this study was to investigate the magnitude of soil-to-atmosphere GHG fluxes (sum of soil autotrophic and heterotrophic respiration, fluxes of CH4 and N2O at the soil–atmosphere interface) in hemiboreal deciduous tree and willow coppice-based AF systems with mineral soil in Latvia. In addition, we sought to understand how soil GHG fluxes respond to the establishment of AF systems with different dominant woody vegetation (trees and willow coppice) compared to the adjacent perennial grass cover. We hypothesize that soil-to-atmosphere GHG fluxes in hemiboreal agroforestry systems have varied significantly under different dominant vegetation type (deciduous trees, willow coppice, perennial grass) and among different initially applied soil-fertilisation.
2. Materials and Methods
2.1. Study Site
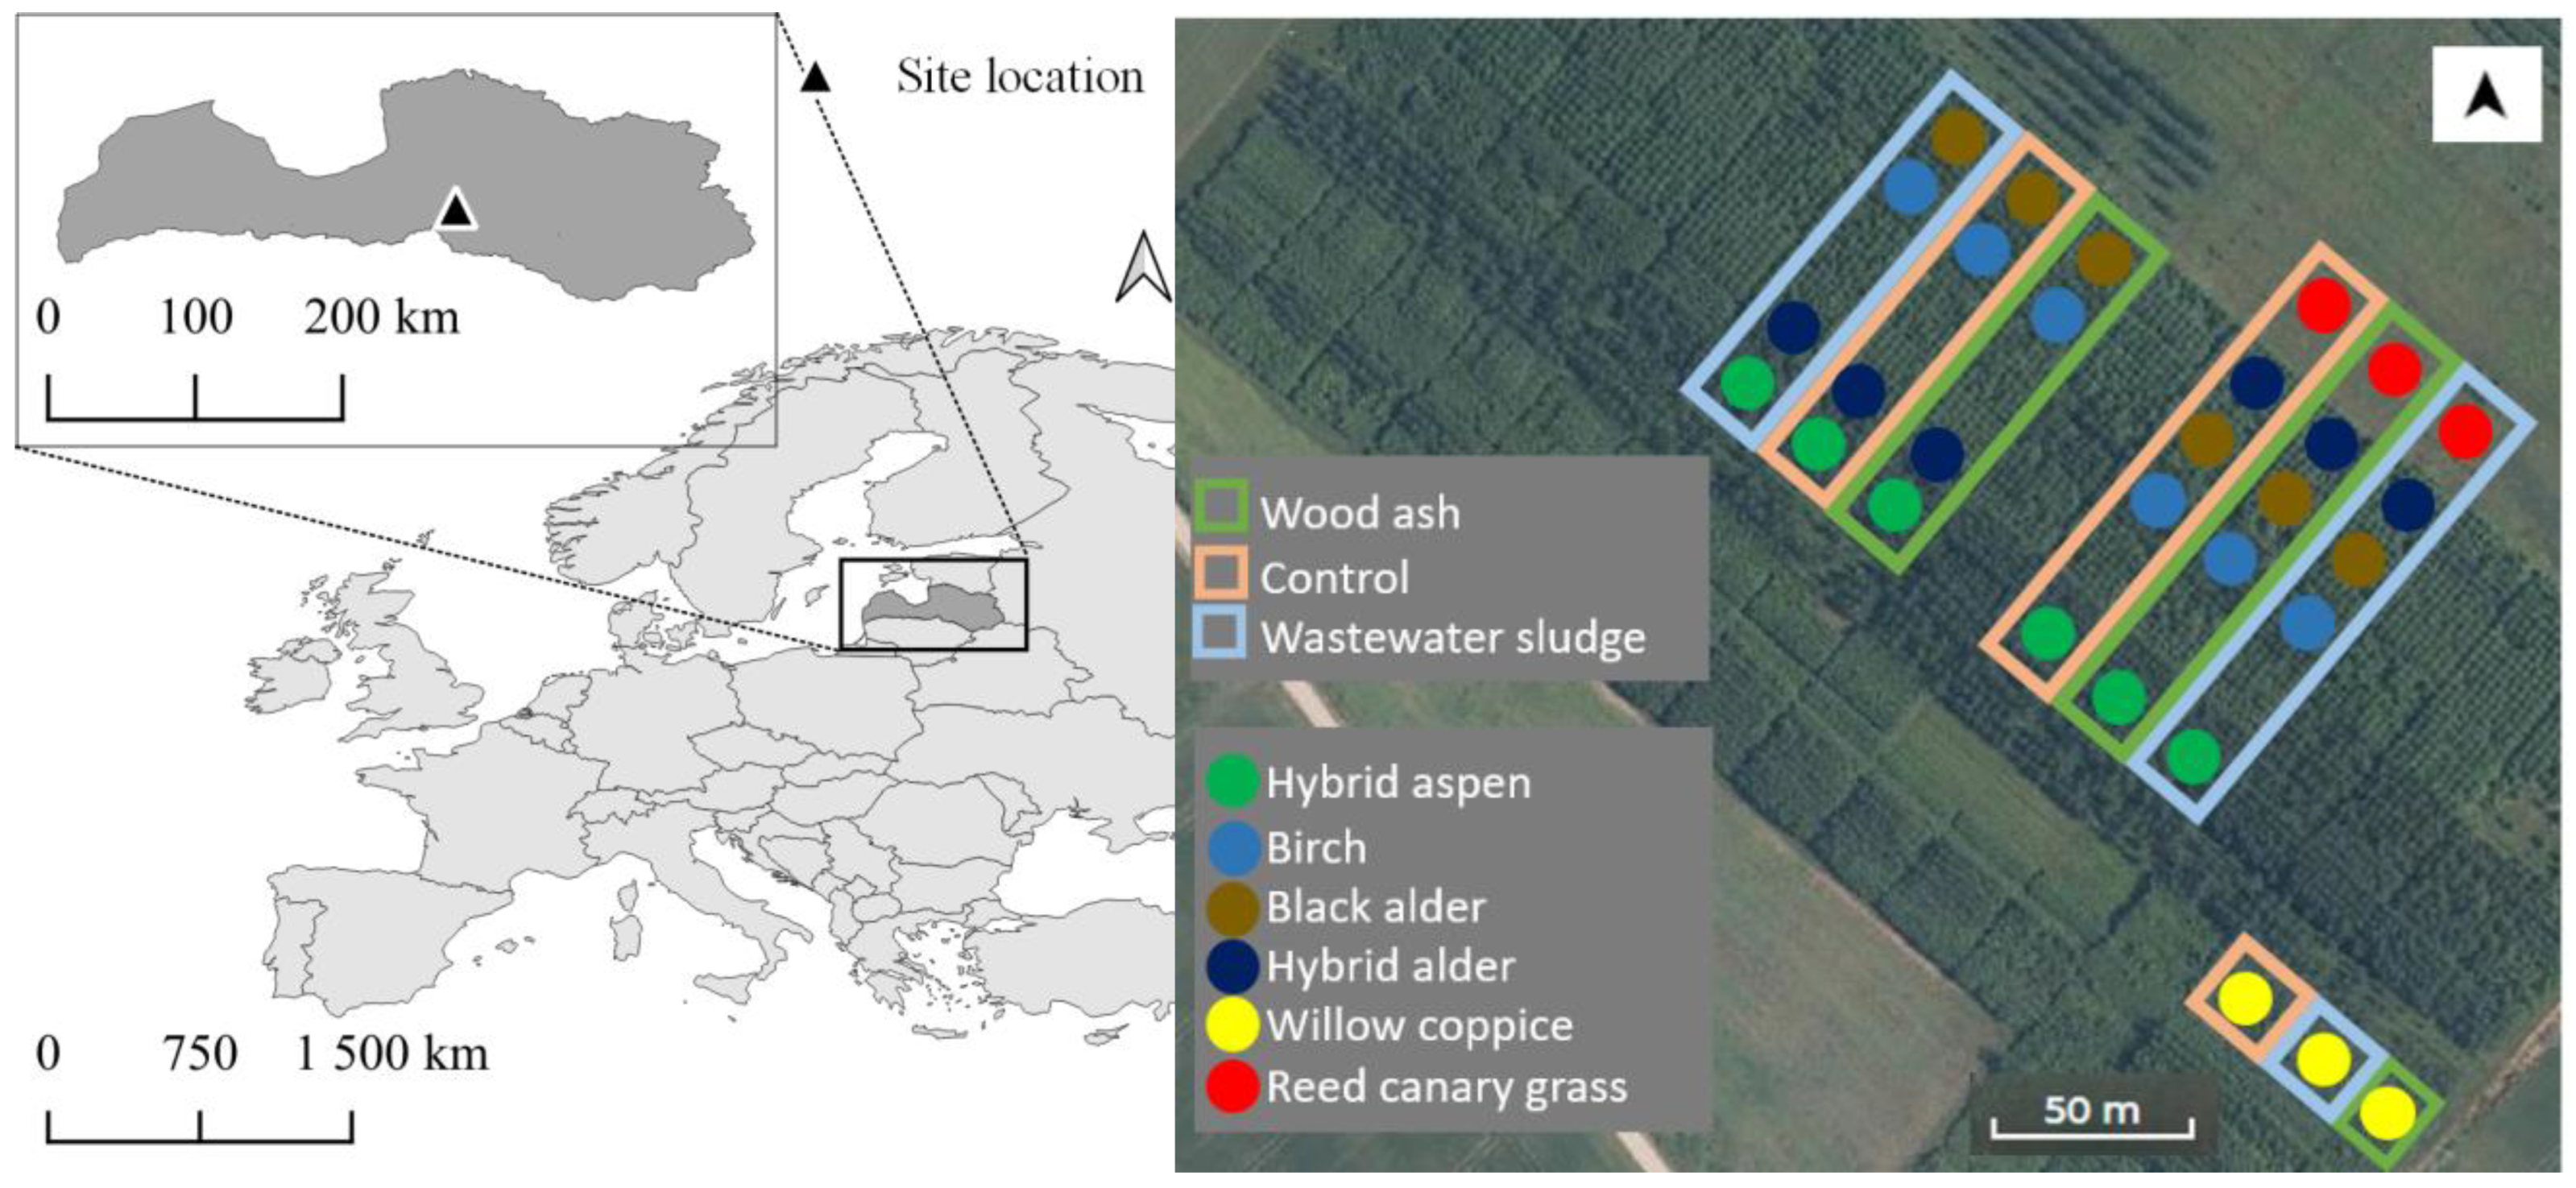
The study site (56°41‱27.0′ N, 25°08‱13.1′ E) was established on agricultural land (former cropland) with mineral soil (Luvic Stagnic Phaeozem, Hypoalbic and Mollic Stagnosol, Ruptic, Calcaric, Endosiltic [44,45]) in the Skrīveri district (central part of Latvia; Figure 1) in the spring of 2011, when the soil was ploughed for the final time. The dominant class of soil texture [46] at the site is loam and sandy loam at 0–20-cm depth, and sandy loam at 20–80-cm depth.
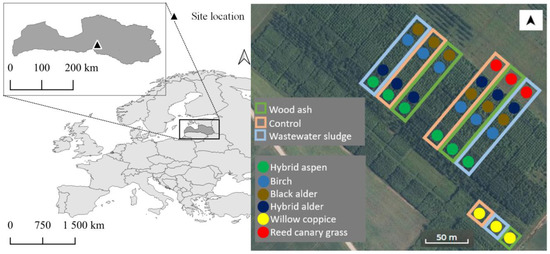
Figure 1.
Location of the study site in Latvia.
Three different soil-fertilisation management practices were applied (Table 1): (i) control without fertilisation; (ii) initial fertilisation with wood ash containing a wide range of elements in mineral form; and (iii) initial fertilisation with sewage sludge as an organic N-, P-, C-rich fertiliser containing a wide range of elements. The soil was fertilised once (in 2011); repeated soil fertilisation has not been carried out at the study site. Characterisation of deciduous tree seedlings, willow cuttings, grass (reed canary grass, RCG) seeds, and planting design is summarised in Table 2. Two GHG measurement subplots were established in each type of plot dominated by deciduous trees and their soil fertilisation management practices (24 research plots in total). One GHG measurement subplot was established in each type of plot dominated by willow coppice and RCG and their soil-fertilisation management practices (6 research plots in total). In the study area, according to the data provided by the meteorological station (Skrīveri) of the Latvian Environment, Geology and Meteorology Centre (5.5 km from the study site), the mean annual air temperature was 8.7 °C in 2020 and 6.9 °C in 2021, and the annual precipitation was 671 mm in 2020 and 897 mm in 2021. During the collection of the soil, according to the GHG flux empirical data (from June 2020 to October 2021), the mean monthly temperature ranged from −6.2 °C (February 2021) to 21.5 °C (July 2021), and the monthly precipitation total ranged from 10.8 mm (February 2021) to 179.7 mm (August 2021) [47].

Table 1.
Characterisation of initially applied soil fertilisation management practices at the study site in the spring of 2011.

Table 2.
Study site design and characterisation of tree seedlings, willow cuttings and RCG seeds.
2.2. Soil GHG Flux Measurements
Soil GHG flux measurements were conducted during the period from June 2020 to October 2021 using the closed opaque manual chamber method [48]. At each research subplot, three chamber collars were evenly installed at an inter-replicate distance of 2.5 m. The collars were installed in approximately 5 cm of soil in May 2020 (one month before the start of the collection of GHG flux samples). Ground vegetation, litter layer and root damage were avoided as much as possible during the collar installation and field surveys. Thus, the recorded GHG fluxes represent the total soil CO2 fluxes (sum of soil heterotrophic and autotrophic respiration), CH4 and N2O fluxes. At least once every six weeks, four soil flux samples were taken from each chamber (collar position) within 30 min (10 min between each sampling) after positioning chambers on the collars. A dynamic schedule of study-site visits was applied to randomise the time of day in which gas sample collection took place [48,49]. The samples were collected in 100-mL vials at 0.3 mbar under pressure and transported to the laboratory at the Latvian State Forest Research Institute ‘Silava’ (LSFRI Silava) to be tested using a Shimadzu Nexis GC-2030 gas chromatograph (Shimadzu USA manufacturing, Inc., Canby, OR, USA) [50].
To calculate soil-to-atmosphere GHG fluxes, linear GHG concentration changes over time in the chambers was assumed. A slope coefficient of linear regression constructed using results of gas chromatograph analysis of four successive gas samples taken from the chamber were used in further calculation (Equation 1) using the Ideal Gas Law. To ensure reliability of the acquired results of GHG fluxes, data quality control was performed—only slopes with determination coefficient (R2) higher than 0.7 were used for further calculation except when difference between maximum and minimum GHG concentration over time in the chamber was lower than uncertainty of the gas chromatograph method.
where flux is the instantaneous GHG (CO2, CH4 or N2O) flux, µg GHG m2 h−1; M is the molar mass of GHG, g mol−1; P is the assumption of air pressure inside the chamber, 101,300 Pa; V is the chamber volume, 0.063 m3; Slope is the GHG concentration changes over time, ppm h−1; R is the universal gas constant, 8.314 m3 Pa K−1 mol−1; T is the air temperature, K; and A is the collar area, 0.1995 m2.
During soil GHG flux sampling, several environmental factors were determined: soil temperature at 10-cm, 20-cm and 30-cm depth, using the measurement probe of a Comet data logger S0141 with a temperature sensor and a recording interval of every 10 s; air (ambient) temperature using an EMOS E0042 wireless thermometer with 0.1 °C thermal resolution. Air moisture data was provided by the closest meteorological station (Skrīveri) of the Latvian Environment, Geology and Meteorology Centre (5.5 km from the study site) [47].
2.3. Soil Sampling and Chemical Analyses
In August 2020, soil samples were taken in 9 places in each research subplot at 0–5-cm depth using a metal cylinder (5-cm diameter). Composite soil samples were collected in sealed plastic bags and transported to the LVS EN ISO 17025:2018-accredited laboratory at the LSFRI Silava and were prepared for analyses according to the LVS ISO 11464:2005 standard. pH (CaCl2) was determined according to LVS ISO 10390:2002 L/NAC:2005 L. Total and organic carbon (TC and OC, g kg−1) and total nitrogen (TN, g kg−1) contents were determined using an elementary analysis method according to LVS ISO 10694:2006 and LVS ISO 13878:1998, respectively. In addition, the OC/TN (C/N) ratio was calculated as a proxy to characterise the decomposition of soil organic matter.
2.4. Estimation of Basal Area in Deciduous Trees and Willow Coppice Plots
Basal area (m2 ha−1) was calculated using data of single tree diameters at breast height (DBH) in each deciduous tree and willow coppice plot, where individual stem basal areas were summed and divided by plot area. Tree measurements were taken in October 2021.
In addition, above-ground dry weight biomass of black alder, silver birch, hybrid alder and hybrid aspen were calculated through allometric models [51,52], where DBH and height (H) measurements were used. Biomass in plots was calculated by summing individual stem biomass with DBH > 5.99 cm.
2.5. Estimation of Above-Ground Biomass of Ground Vegetation and Total Root Biomass
In each research subplot, above-ground biomass of ground vegetation and total root biomass were estimated in four 25 × 25 cm square sample plots in August 2020. In each square sample plot, all above-ground parts of the ground vegetation were cut down with a sharp knife and collected in sealed plastic bags. All roots in the small sample plot (25 × 25 cm) were excavated to a depth of 30 cm, cleaned of soil, collected in sealed plastic bags and transported to the laboratory at LSFRI Silava. To calculate dried mass, the vegetation biomass and roots were dried in drying chambers at 105 °C.
2.6. Estimation of Biomass of Tree Above-Ground Litter
Tree above-ground litter was collected using collectors placed in each research subplot under a uniform tree canopy at 1.3-m height [53] in 2021 (September–December). The collector design comprised a solid funnel (0.5-m depth) with a bag of inert material (polyethylene) with a mesh size of 0.2 mm; the collecting area of individual traps was 0.43 m2. Litter was collected over a 4-month period.
2.7. Statistical Analysis
All statistical analyses were carried out using R [54]. Data were tested for normal distribution and variance homogeneity using a Shapiro–Wilk normality test and Quantile-Comparison Plot (function ‘qqPlot()’ from R package ‘car’). Pairwise comparisons using a Wilcoxon rank sum exact test were used to evaluate possible differences in the mean values of GHG fluxes grouped by dominant vegetation type in plots, soil-fertilisation practice, or season, with a significance level of 0.05. To relate mean GHG fluxes to research site data, simple regression analysis was used, and correlations between GHG fluxes and different environmental factors were tested with Spearman’s ρ, using a significance level of p < 0.05. All results are shown as arithmetic means ± standard error (S.E.).
3. Results
3.1. Impact of Dominant Vegetation Type and Initially Applied Soil Fertilisation on Soil GHG Fluxes
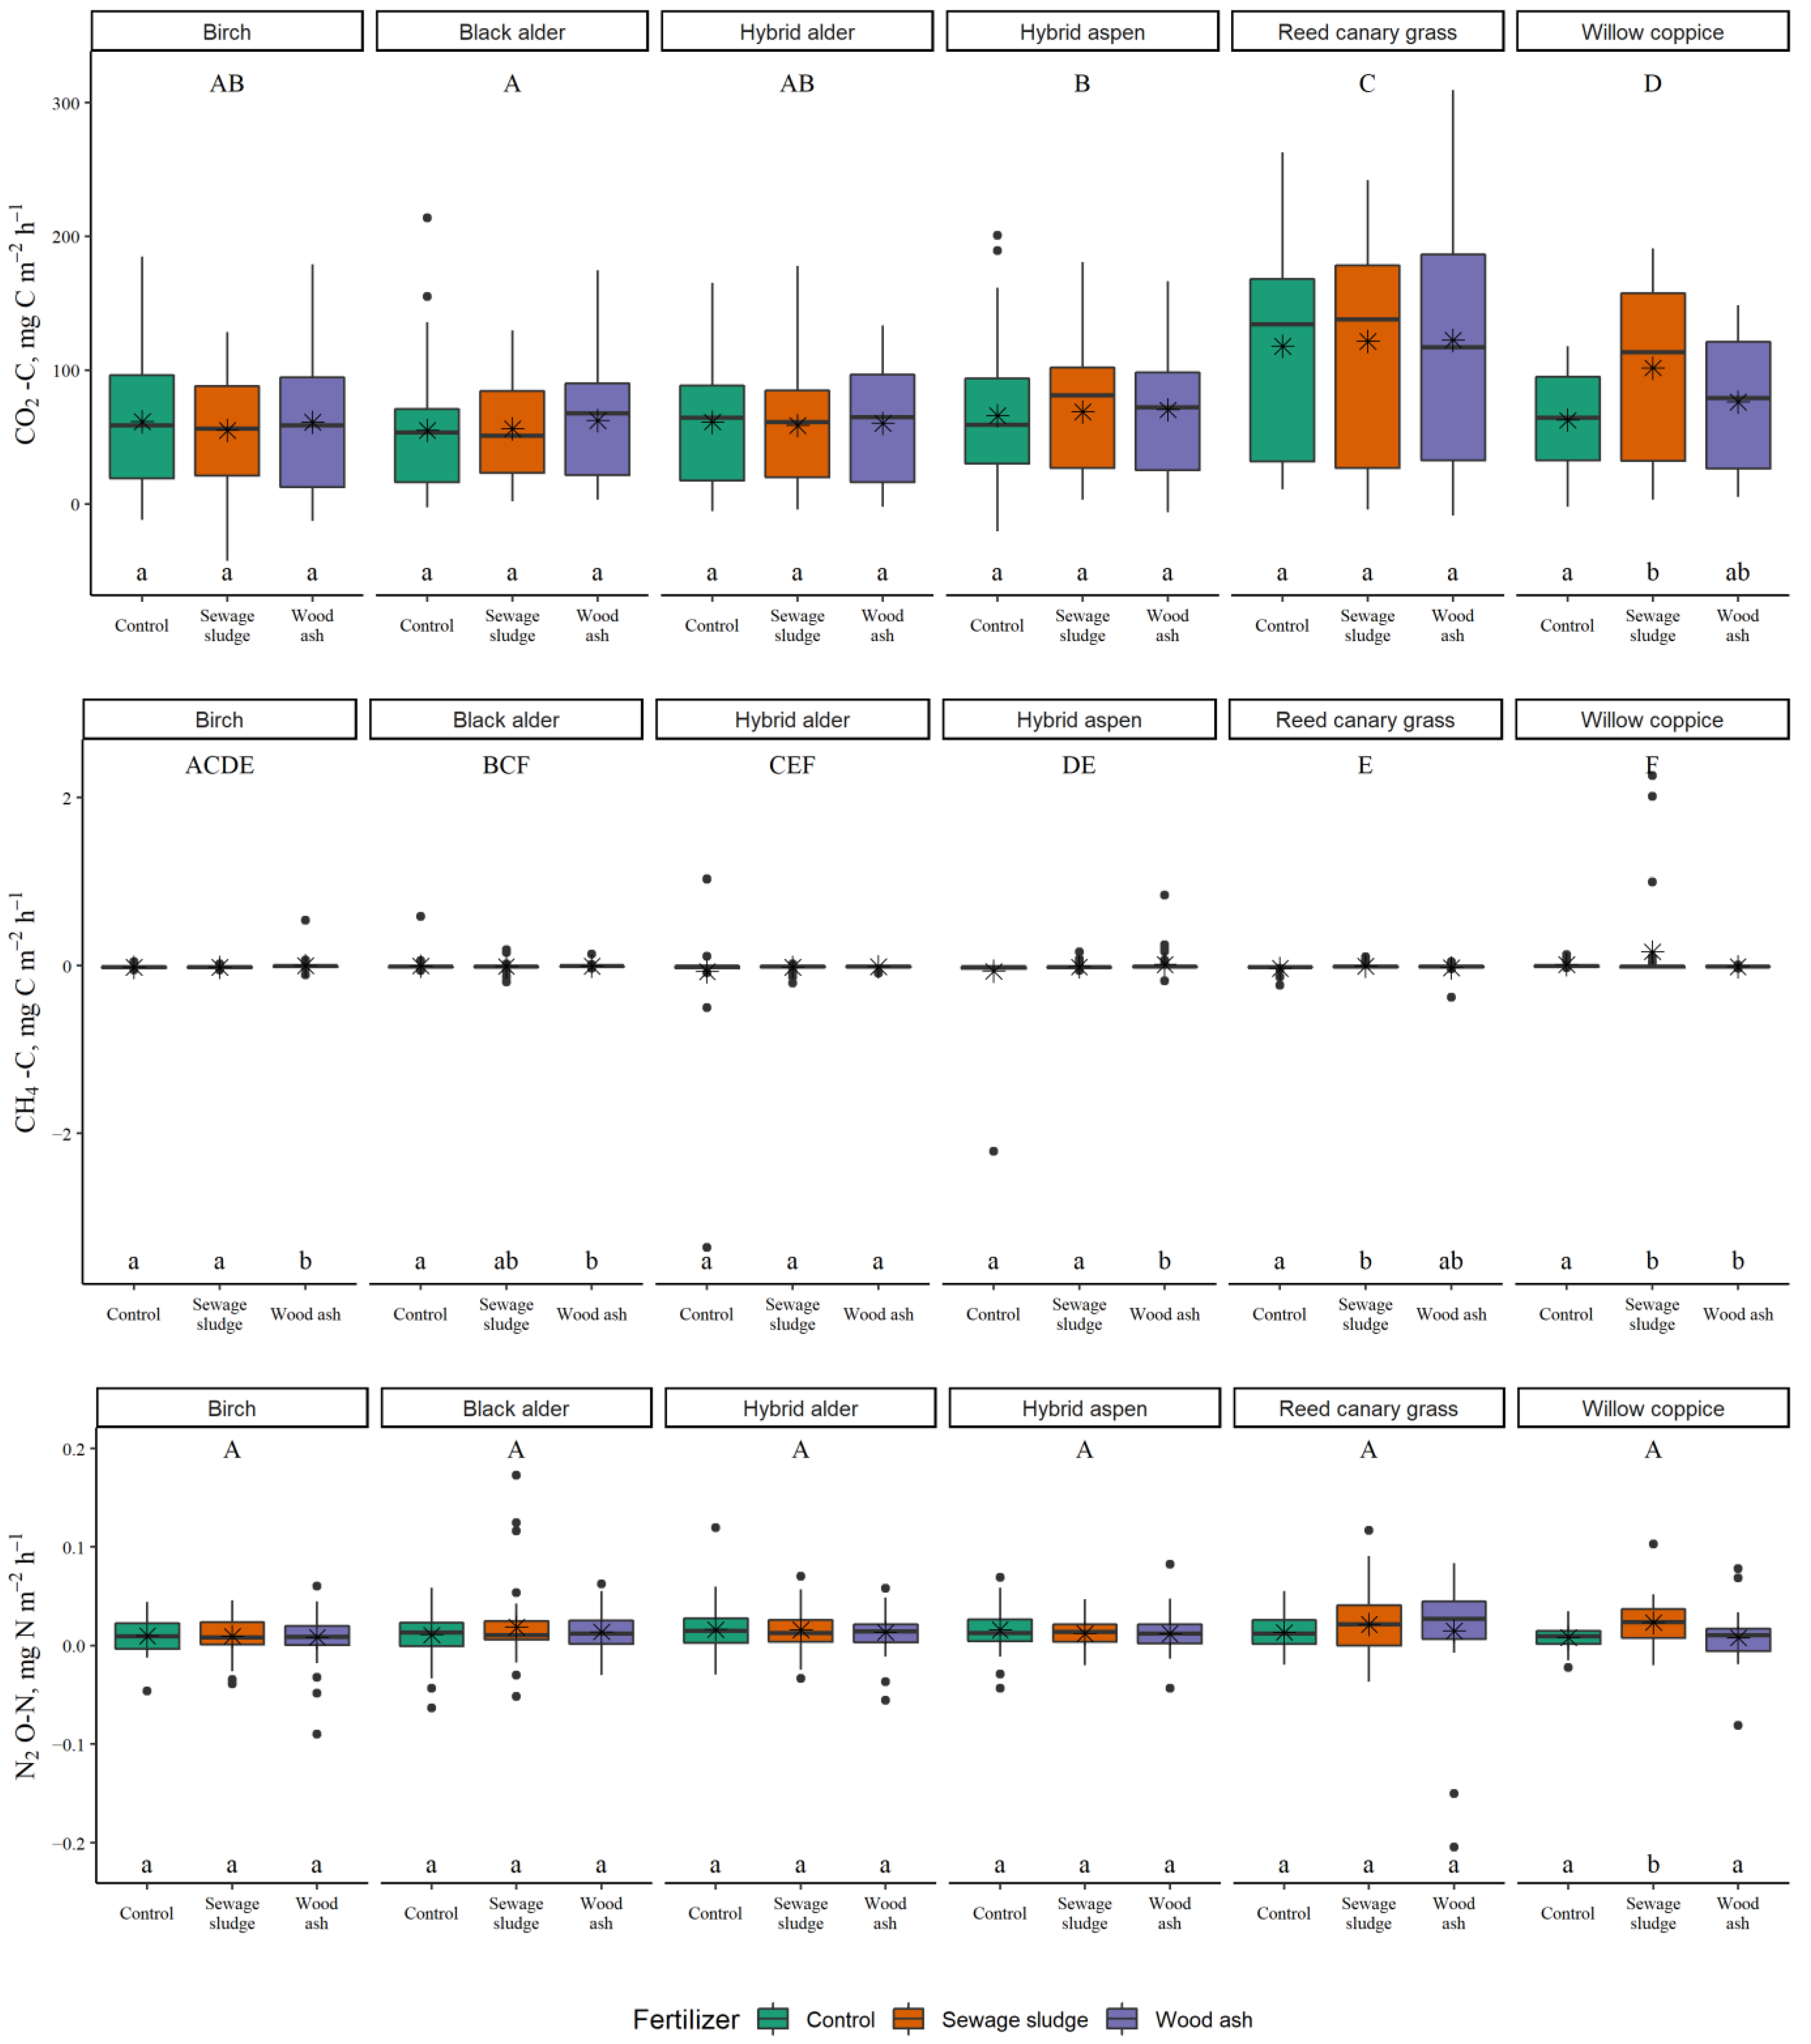
During the study period, instantaneous soil CO2 fluxes (sum of autotrophic and heterotrophic respiration) ranged from −42.4 to 309.5 mg CO2-C m−2 h−1 (Figure 2). The highest mean instantaneous CO2 fluxes were found in RCG plots, followed by plots dominated by willow coppice, while the lowest instantaneous CO2 fluxes were found in plots dominated by deciduous trees. Furthermore, a statistically significant difference in instantaneous soil CO2 fluxes between plots of different deciduous tree species was found only between plots dominated by black alder and hybrid aspen (higher instantaneous CO2 fluxes were found in plots dominated by hybrid aspen, p = 0.035). An impact of initially used soil fertilisation practice on soil CO2 fluxes was found only in plots dominated by willow coppice, where higher instantaneous soil CO2 fluxes were recorded in plots initially fertilised with sewage sludge (organic-matter-rich fertiliser, 10 t DM ha−1 dose) compared to control sites.
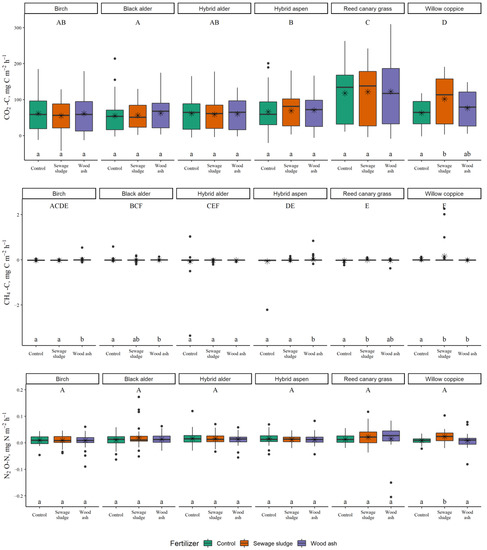
Figure 2.
Soil GHG fluxes in plots dominated by deciduous trees, willow coppice or RCG in agroforestry systems in hemiboreal Latvia during the measurement period (June 2020–October 2021), grouped by type of soil fertilisation practice. In the box plots, the median is shown by the bold line, the mean is shown by the black asterisk, the box corresponds to the lower and upper quartiles, the whiskers show the minimal and maximal values (within 150% of the interquartile range from the median) and the black dots represent outliers of the datasets. Different uppercase letters show statistically significant differences (p < 0.05) between types of dominant vegetation (all soil fertilisation management practices were pooled); different lowercase letters show statistically significant differences (p < 0.05) between soil fertilisation management practices within the same dominant vegetation.
During the study period, instantaneous soil CH4 fluxes ranged from −3.36 to 2.26 mg CH4-C m−2 h−1 (Figure 2). The highest mean instantaneous CH4 fluxes were found in plots dominated by willow coppice, in which a statistically significant difference was found compared to birch, hybrid aspen, and RCG plots (p = 0.010, p < 0.001, p = 0.028, respectively). Statistically significant differences in instantaneous soil CH4 fluxes between soil fertilisation practices were found in all plots except those dominated by hybrid alder.
During the study period, instantaneous soil N2O fluxes ranged from −0.20 to 0.17 mg N2O-N m−2 h−1 (Figure 2). No impact of dominant vegetation type on instantaneous soil N2O fluxes was found. Like the case of CO2 emissions, an impact of initially used soil fertilisation practice on soil N2O fluxes was found only in plots dominated by willow coppice, where higher instantaneous soil N2O fluxes were recorded in plots initially fertilised with sewage sludge (organic-matter-rich fertiliser, additional nitrogen (N) input of 259 kg ha−1) compared to control sites and sites initially fertilised with wood ash (mineral fertiliser, additional N input of 2.6 kg ha−1).
3.2. Impact of Seasonality and Environmental Factors (Temperature and Moisture) on Soil GHG Fluxes
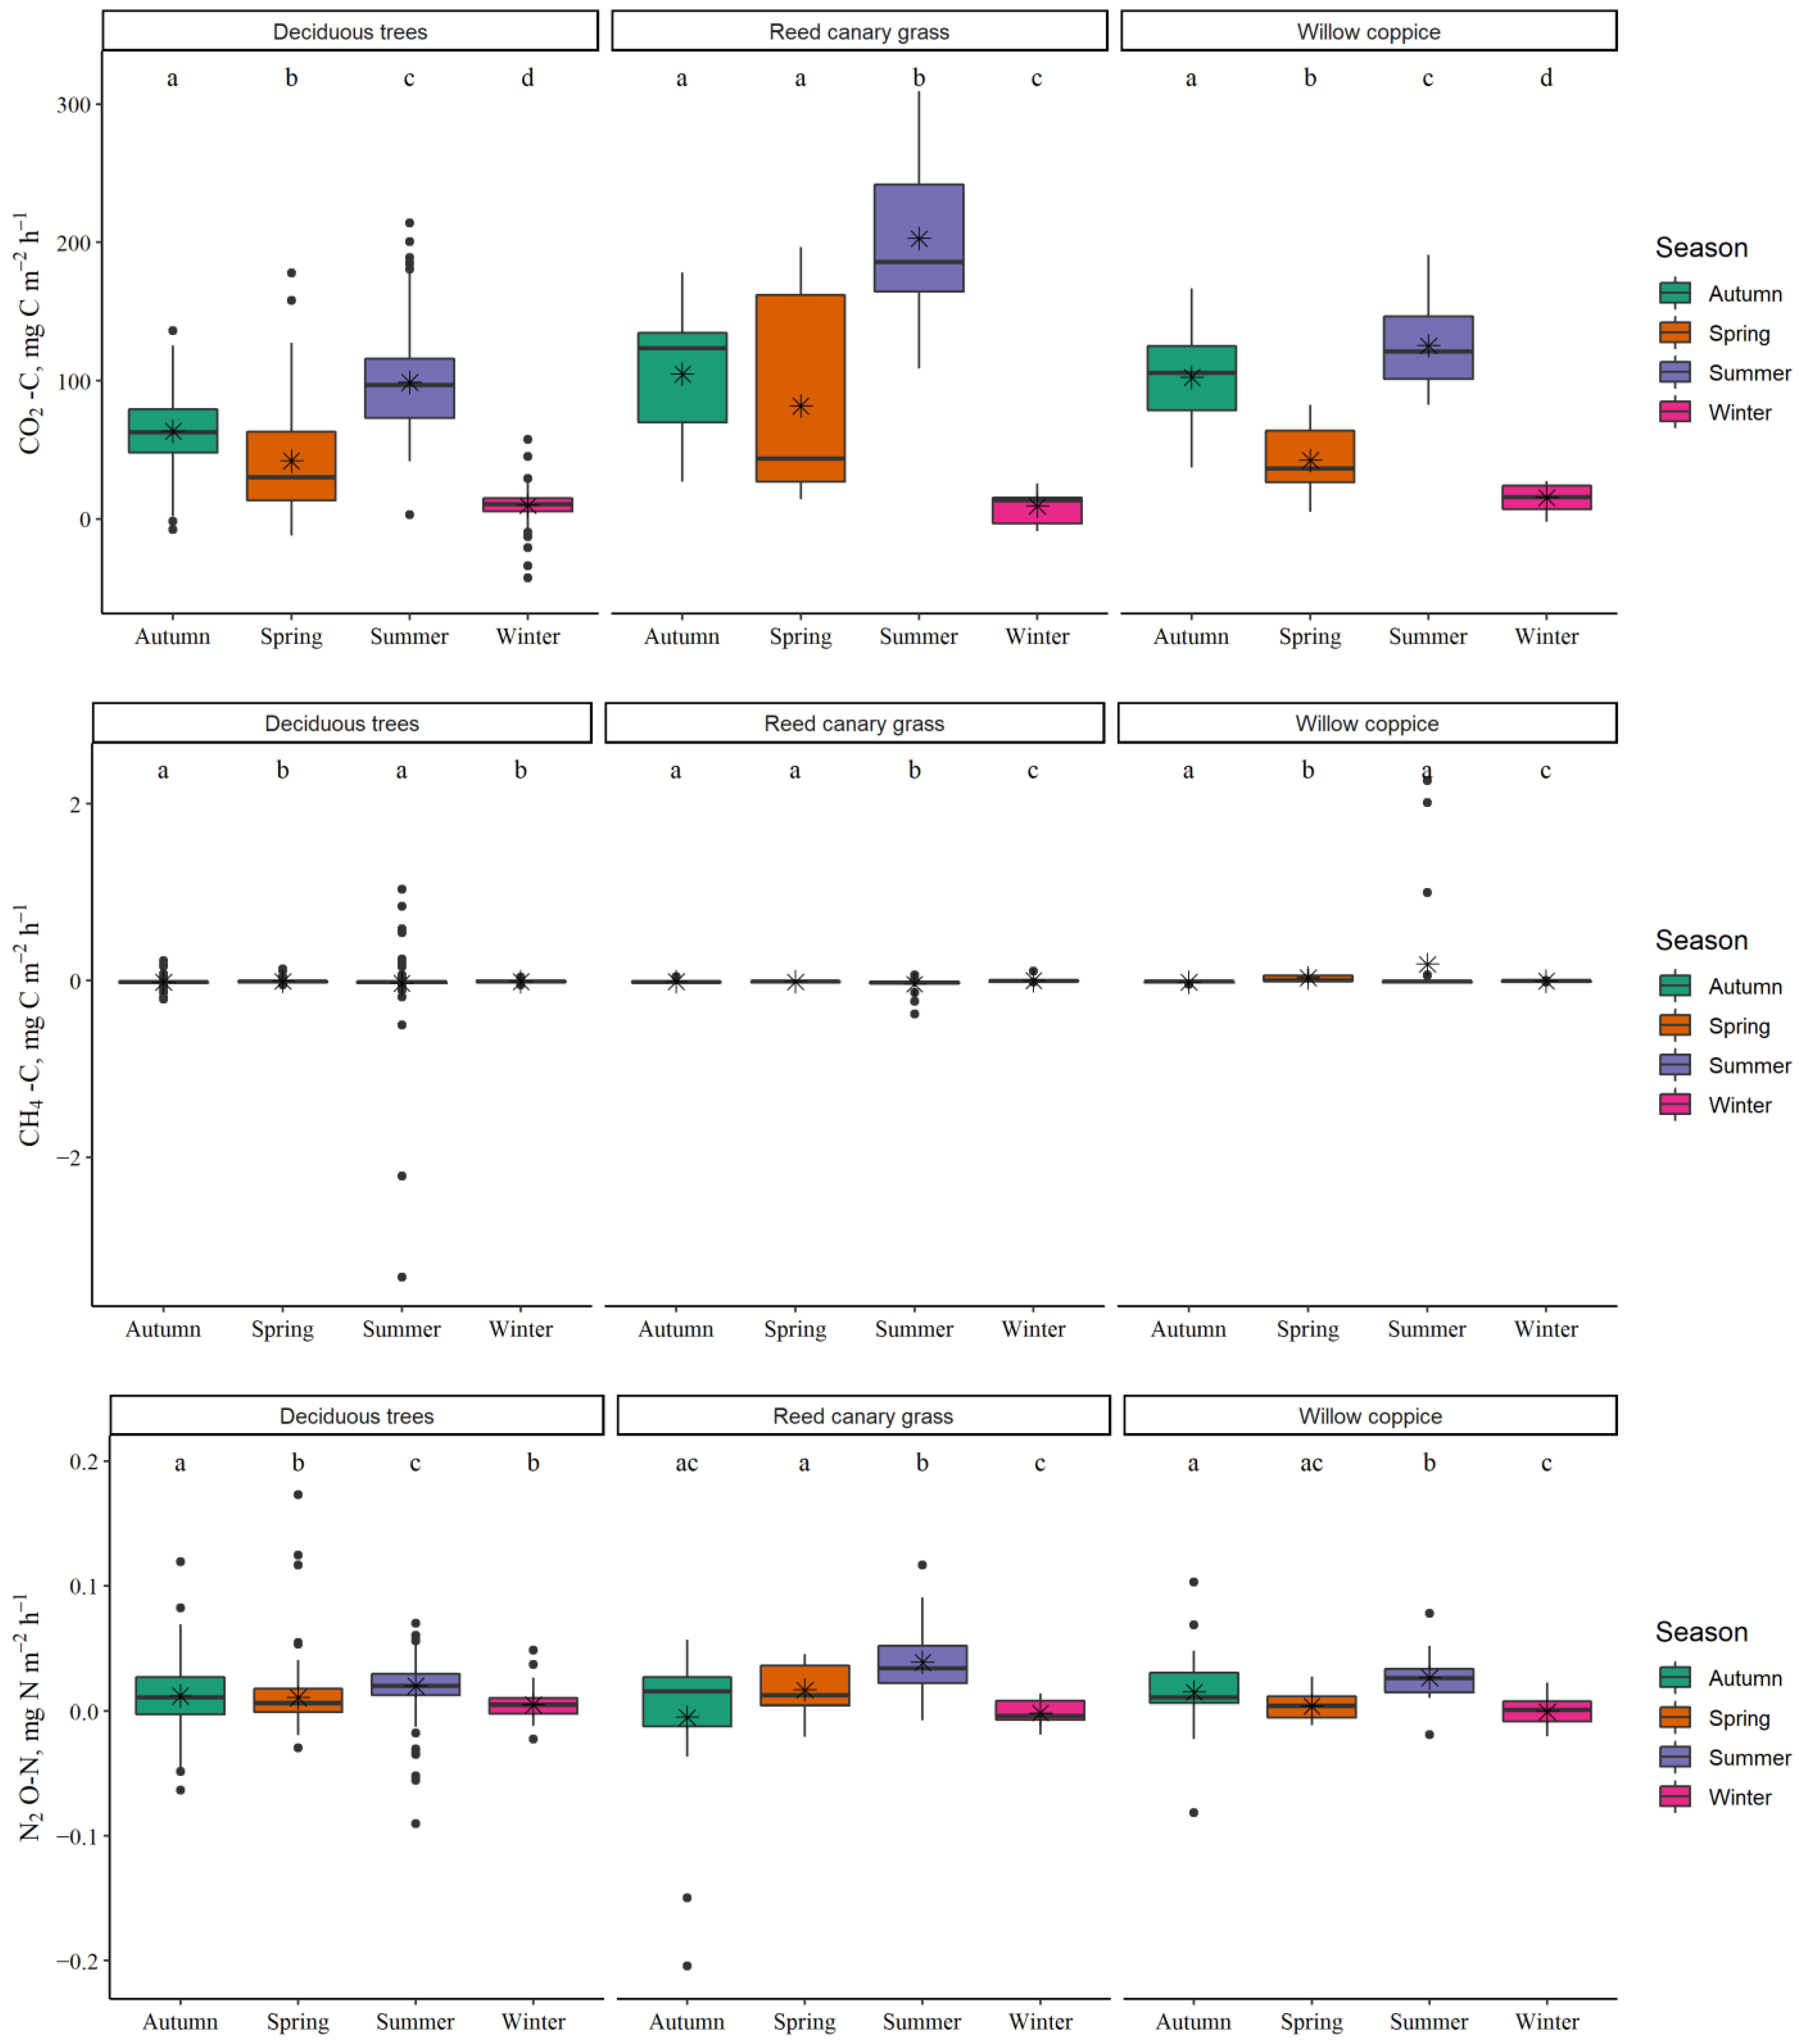
The most pronounced impact of seasonality (Figure 3) was detected on soil CO2 fluxes. The highest soil CO2 fluxes were detected during the summer season (mean values ranged from 98.9 ± 2.2 mg CO2-C m−2 h−1 in deciduous tree plots to 202.8 ± 9.2 mg CO2-C m−2 h−1 in RCG plots). In all groups of dominant vegetation type, among-season soil CO2 fluxes decreased in the following order: summer, autumn, spring, winter. In winter—when the lowest soil CO2 fluxes were recorded—mean values ranged from 9.3 ± 2.8 mg CO2-C m−2 h−1 in RCG plots to 15.4 ± 2.2 mg CO2-C m−2 h−1 in willow coppice plots. Compared to soil CO2 fluxes, a less pronounced—but still statistically significant—impact of seasonality was detected in soil N2O fluxes. Among-season soil N2O fluxes decreased in the same order as had soil CO2 fluxes. The highest soil N2O fluxes were detected during the summer season (mean values ranged from 0.020 ± 0.001 mg N2O-N m−2 h−1 in deciduous tree plots to 0.039 ± 0.005 mg N2O-N m−2 h−1 in RCG plots), while the lowest fluxes were detected in winter (mean values ranged from −0.002 ± 0.003 mg N2O-N m−2 h−1 in RCG plots to 0.005 ± 0.001 mg N2O-N m−2 h−1 in deciduous tree plots). A positive correlation between the soil CO2 and N2O flows and soil and air temperature confirmed the importance of season for the soil GHG fluxes (Table 3 and Figure S1). Equations (linear regression) describing the relationships between soil CO2 fluxes and soil and air temperature are summarised in Table 4. In Table 4, willow coppice plots with different initial soil fertilisation practice were analysed separately, due to significant differences in the magnitude of CO2 fluxes between plots with different initial soil fertilisation practices (Figure 2).
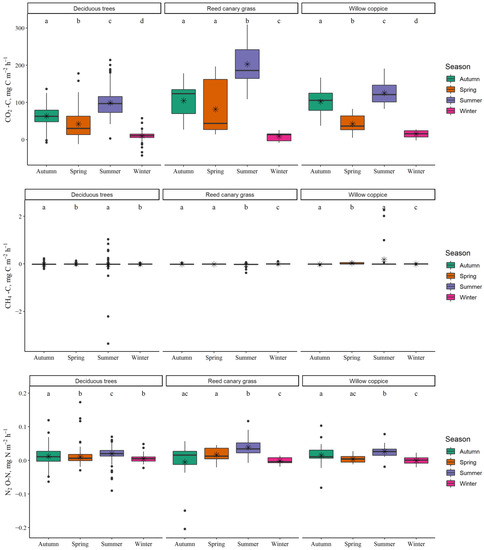
Figure 3.
The impact of seasonality on soil GHG fluxes in plots dominated by deciduous trees, willow coppice or RCG in agroforestry systems in hemiboreal Latvia during the measurement period (June 2020–October 2021). In the box plots, the median is shown by the bold line, the mean is shown by the black asterisk, the box corresponds to the lower and upper quartiles, the whiskers show the minimal and maximal values (within 150% of the interquartile range from the median) and the black dots represent outliers of the datasets. Different lowercase letters show statistically significant differences (p < 0.05) between seasons within the group of dominant vegetation.

Table 3.
Spearman’s correlation coefficients (ρ) characterising relationship between soil GHG fluxes and environmental factors (temperature and moisture), grouped by dominant vegetation type (deciduous trees, willow coppice or RCG) in plots of agroforestry systems. * p < 0.05, ** p < 0.01, *** p < 0.001, non-significant values (p > 0.05) are not shown.

Table 4.
Equations (linear regression) describe relationships between soil CO2 fluxes (mg CO2-C m−2 h−1, dependent variable) and soil and air temperature (°C, independent variable).
Although temperature was not detected as a significant affecting factor of soil CH4 fluxes (Table 3), CH4 fluxes were significantly different among the seasons (Figure 3). In deciduous tree plots, CH4 removals were observed in all seasons, with the highest removals in summer (−0.029 ± 0.019 mg CH4-C m−2 h−1). In willow coppice plots, CH4 removals were observed in winter and autumn (with the highest removals occurring in autumn: −0.014 ± 0.002 mg CH4-C m−2 h−1), while during spring and summer, CH4 emissions were observed (with the highest emissions occurring in summer: 0.187 ± 0.115 mg CH4-C m−2 h−1). In RCG plots, CH4 removals were observed in all seasons (with the highest removals occurring in summer: −0.038 ± 0.015 mg CH4-C m−2 h−1) except winter, in which slight emissions were observed (0.003 ± 0.008 mg CH4-C m−2 h−1).
3.3. Relationships between Annual Soil GHG Fluxes, Soil General Chemistry and Parameters of Vegetation Biomass
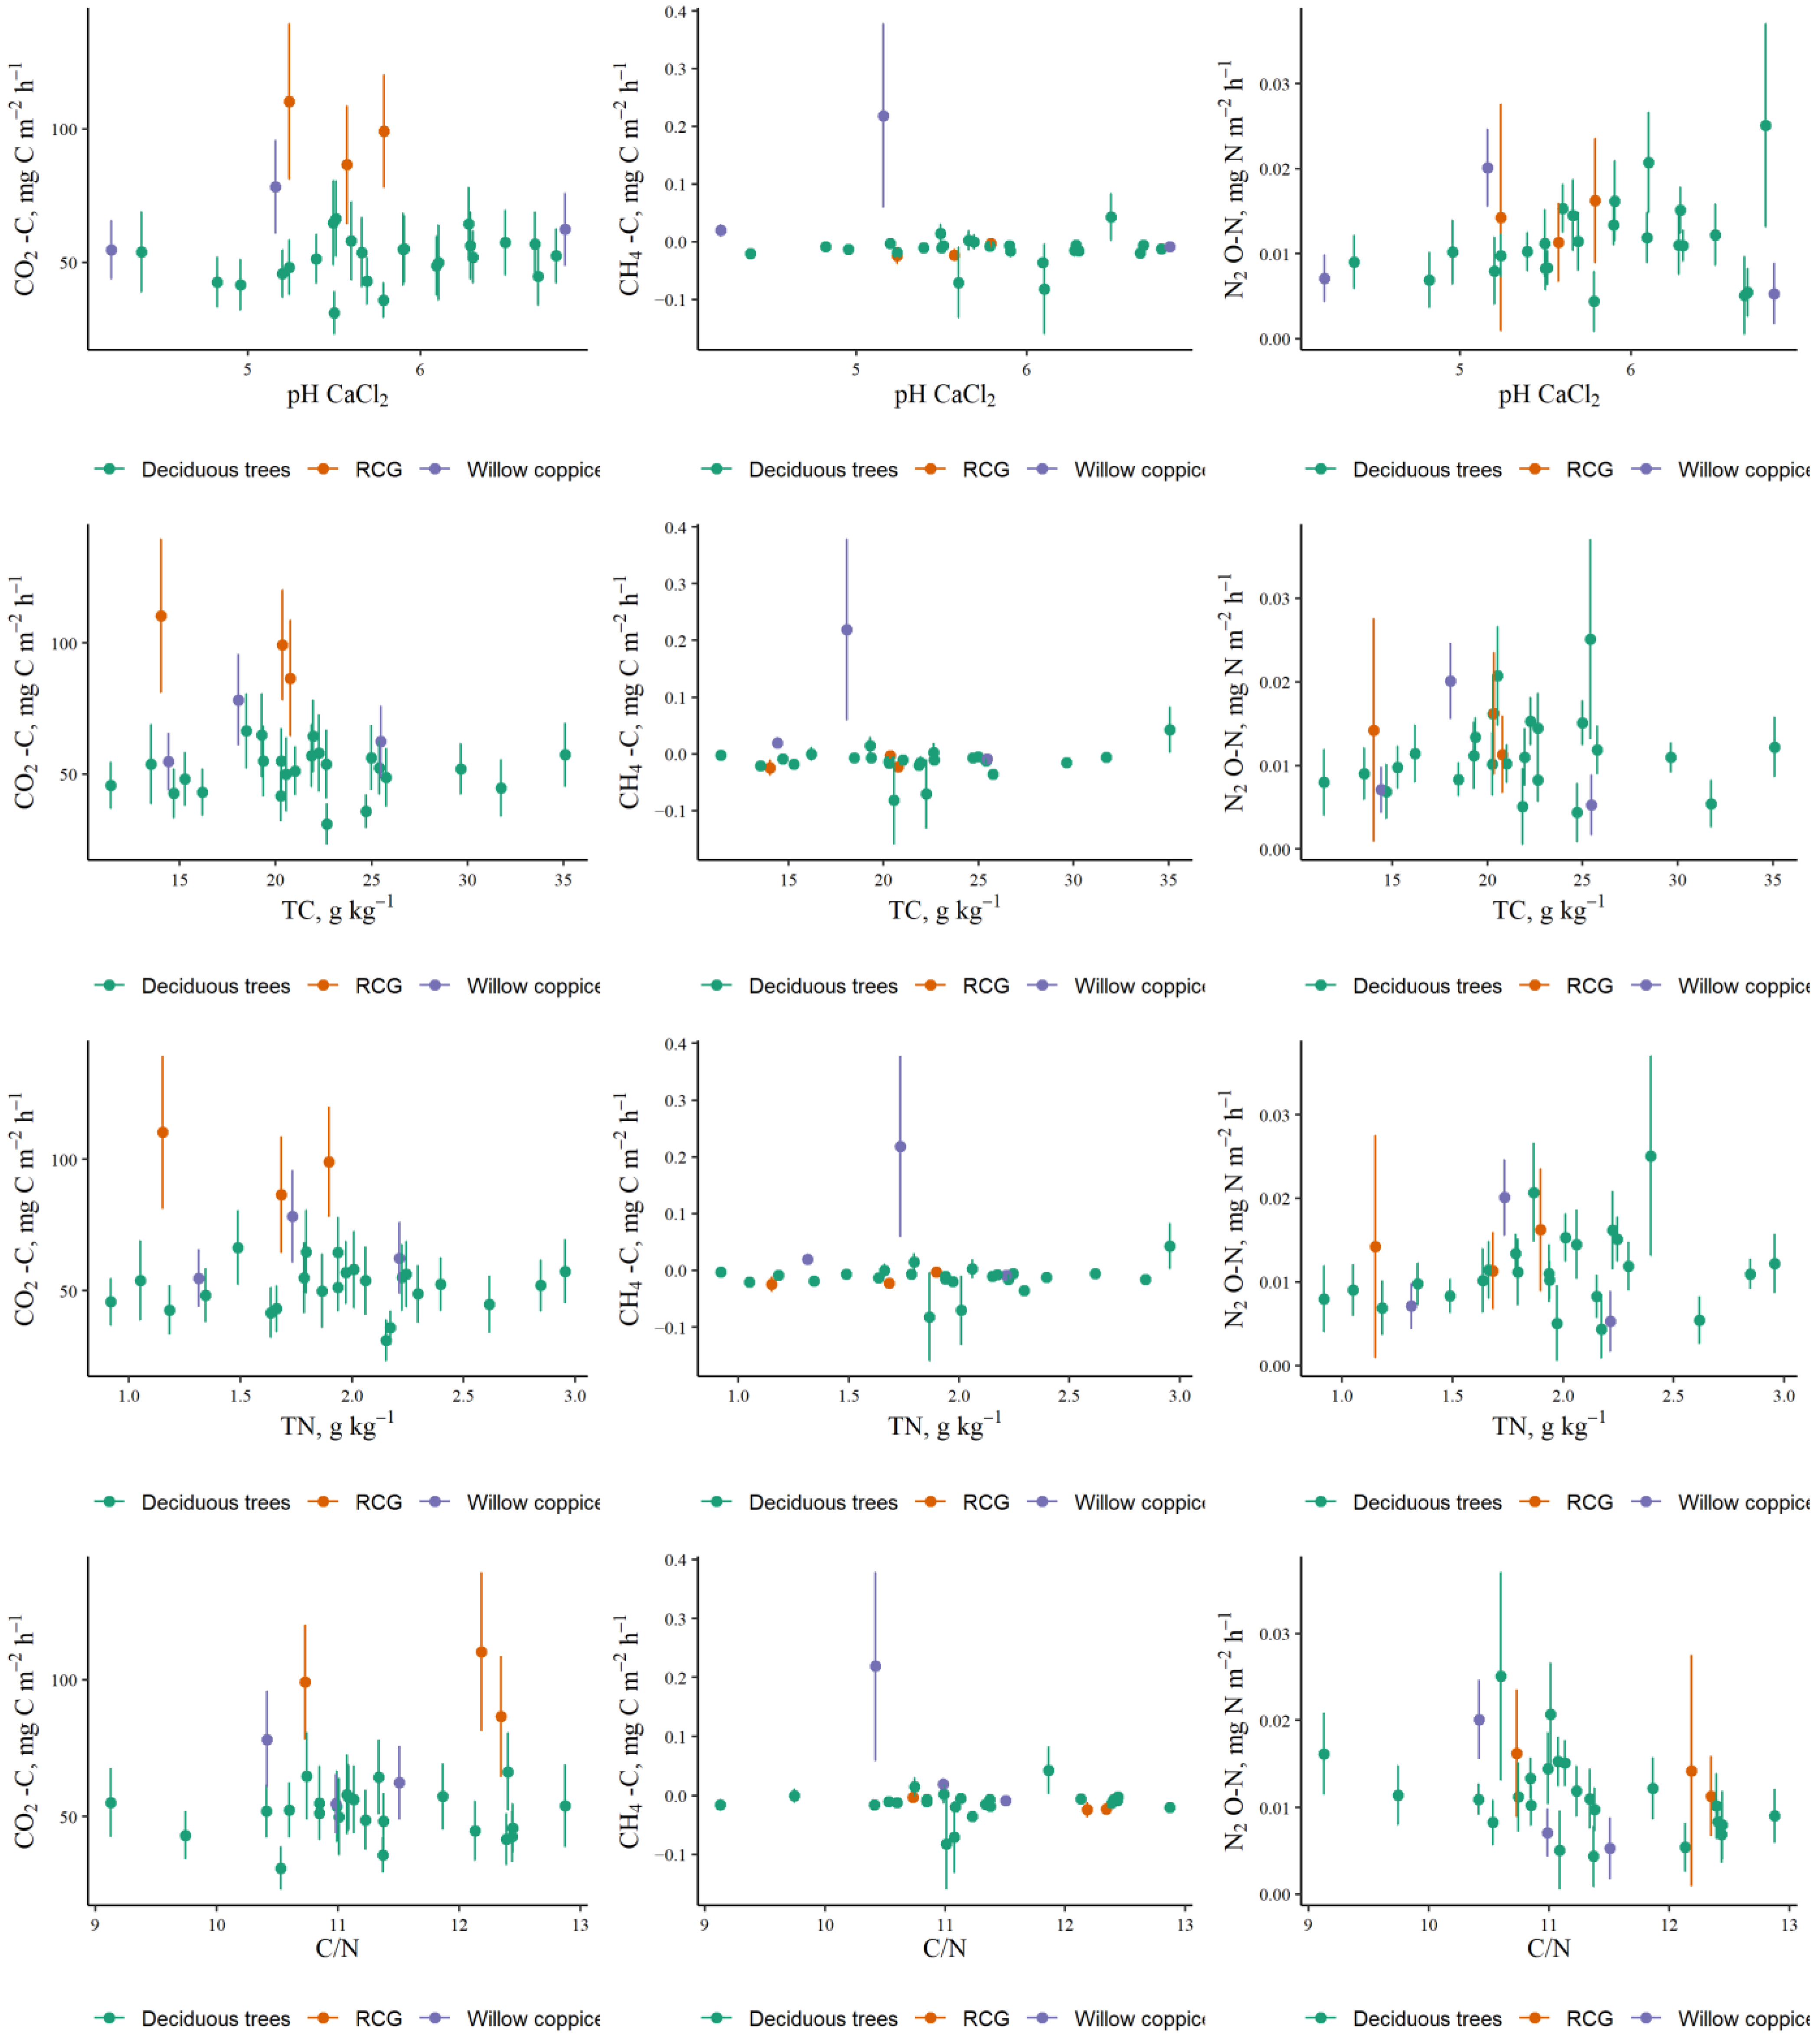
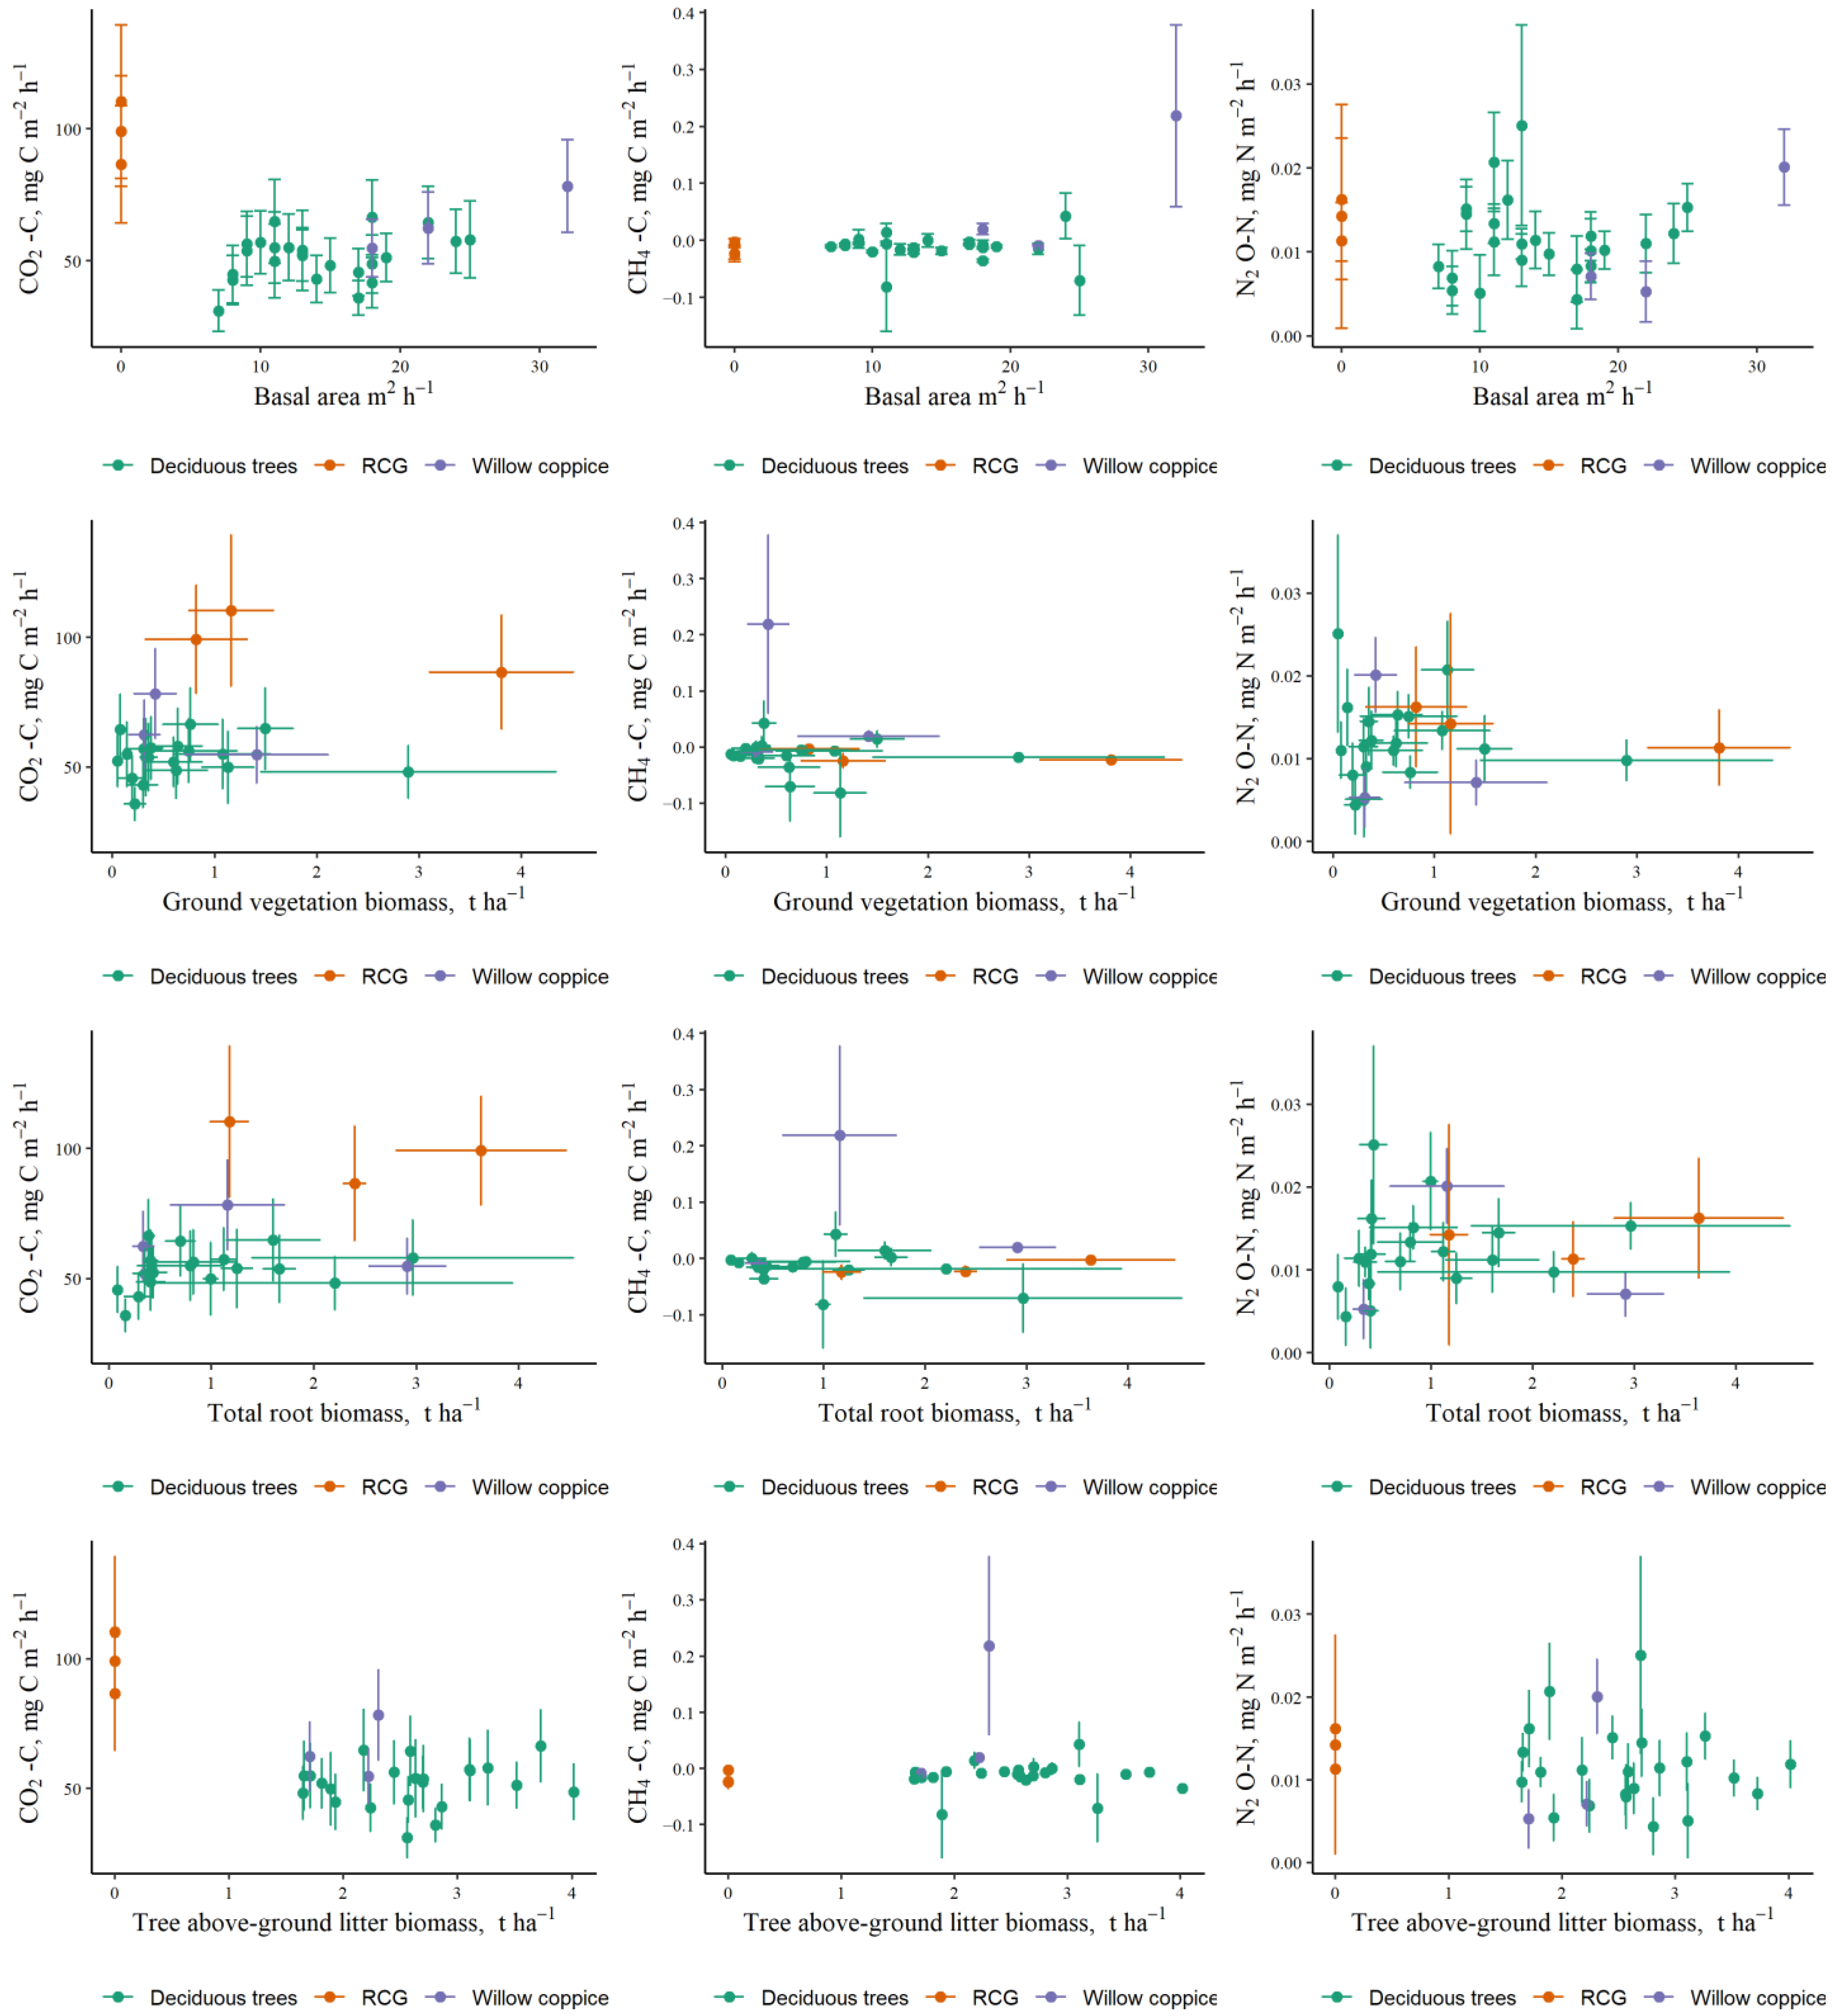
An impact of soil general chemistry on mean soil GHG fluxes was not observed (Figure 4), excluding a slight impact of soil C/N ratio on soil N2O fluxes (moderate negative correlation was found, ρ = −0.48, p = 0.008). In plots dominated by deciduous trees and willow coppice, soil CO2 fluxes positively correlated with tree above-ground biomass (ρ = 0.39, p = 0.042, Figure 5). In addition, soil CO2 fluxes positively correlated with total root biomass (ρ = 0.45, p = 0.024, Figure 5). Other correlations between soil GHG fluxes and parameters of vegetation biomass were not observed.
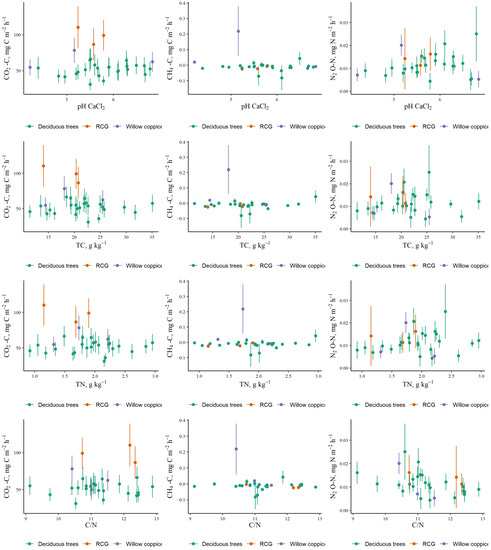
Figure 4.
Impact of soil (at 0–5 cm depth) general chemistry on mean soil GHG fluxes in plots dominated by deciduous trees, willow coppice, or RCG in agroforestry systems in hemiboreal Latvia.
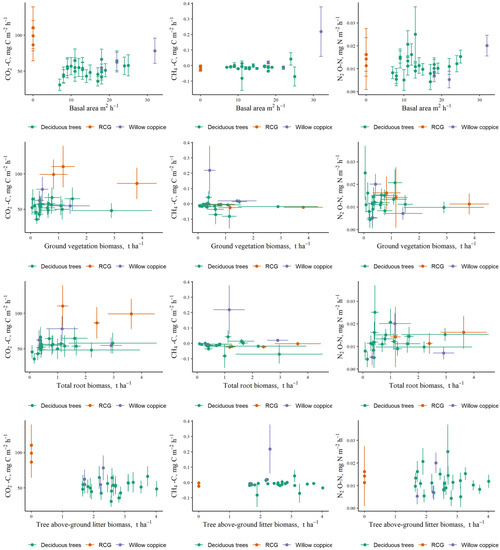
Figure 5.
Relationships between mean soil GHG fluxes and parameters of vegetation biomass in plots dominated by deciduous trees, willow coppice, or RCG in agroforestry systems in hemiboreal Latvia.
3.4. Annual GHG Fluxes
Annual CO2 flows (sum of autotrophic and heterotrophic respiration) were calculated using equations describing relationships between soil CO2 fluxes and soil temperature (Table 4). Daily mean soil temperature data for 2020 and 2021 from the closest meteorological station (Skrīveri) of the Latvian Environment, Geology and Meteorology Centre (5.5 km from the study site) calibrated (corrected) to the research site data was used. Annual CO2 flows (mean ± S.E. form 2020 and 2021) were 4.62 ± 0.08 t CO2-C ha−1 yr−1 in deciduous tree plots and 7.70 ± 0.15 t CO2-C ha−1 yr−1 in RCG plots, while annual soil CO2 flows in willow coppice plots ranged from 5.59 ± 0.10 t CO2-C ha−1 yr−1 in plots initially fertilised with wood ash to 7.01 ± 0.12 t CO2-C ha−1 yr−1 in plots initially fertilised with sewage sludge. In deciduous tree plots of agroforestry systems, annual CO2 flows were statistically significantly lower than in RCG and willow coppice plots (p = 0.001).
Annual CH4 and N2O flows were calculated as the average of the monthly average flows (expressed as kg CH4-C or N2O-N ha−1 yr−1), maintaining the contribution of all seasons in the calculation of the average value of annual soil CH4 and N2O flows. The results of the annual soil CH4 flows revealed that deciduous tree and RCG plots were CH4 sinks (with annual CH4 emissions of -1.19 ± 0.57 and -1.16 ± 0.45 kg CH4-C ha−1 yr−1, respectively), while willow coppice plots were CH4 sources (with annual CH4 emissions of 6.39 ± 6.39 kg CH4-C ha−1 yr−1). Annual soil N2O flow was 1.00 ± 0.22 kg N2O-N ha−1 yr−1 in deciduous tree plots and 1.14 ± 0.58 kg N2O-N ha−1 yr−1 in RCG plots, while annual soil N2O flows in willow coppice plots ranged from 0.46 ± 0.31 kg N2O-N ha−1 yr−1 in plots initially fertilised with wood ash, to 1.76 ± 0.40 kg N2O-N ha−1 yr−1 in plots initially fertilised with sewage sludge. Thus, deciduous tree, willow coppice, and RCG plots all acted as sources of N2O emissions. No statistically significant differences in annual CH4 and N2O fluxes between plots with different dominant vegetation type were found (p > 0.05).
4. Discussion
Within this study we investigated the magnitude of soil-to-atmosphere GHG fluxes in hemiboreal deciduous tree and willow coppice-based AF systems with mineral soil in Latvia. The proposed hypothesis that soil-to-atmosphere GHG fluxes in hemiboreal agroforestry systems varied significantly under different dominant vegetation type (deciduous trees, willow coppice, perennial grass) and among different initially applied soil fertilisation was partially confirmed and are discussed in the following paragraphs separately for CO2 (sum of autotrophic and heterotrophic respiration), CH4, and N2O fluxes.
4.1. CO2 Fluxes
The annual soil CO2 fluxes in the deciduous tree plots of the AF system (4.62 ± 0.08 t CO2-C ha−1 yr−1) and in willow coppice plots (from 5.59 ± 0.10 to 7.01 ± 0.12 t CO2-C ha−1 yr−1 depending on the initially used fertilisation practice) were similar to the ranges reported for AF systems in cropland with Phaeozem soil type (loam) (5.0–6.7 t CO2-C ha−1 yr−1 [4]), for willow coppice soils (4.6–5.0 t C ha−1 yr−1 [55]) in Germany, and for a bioenergy plantation with fast-growing Populus trees (5.89 CO2-C ha−1 yr−1 [21]) in Belgium, and slightly higher than those reported for shelterbelt soils (4.1 t CO2-C ha−1 yr−1 [7]) and hybrid poplar intercropping systems (3.7 t CO2-C ha−1 yr−1 [10]) in Canada.
4.1.1. Impact of Seasonality and Environmental Factors on CO2 Fluxes
Temperature (and thus, seasonality) was detected as a significant affecting factor of soil respiration or CO2 fluxes. Our results highlight a strong linear increase of soil CO2 fluxes with increasing temperature at all research subplots dominated by both deciduous tree, willow coppice, and RCG. This is in line with observations reported in a number of studies (e.g., [4,19,20,31,34]) and can be explained by an increase in photosynthesis and the consequent supply of carbohydrates from the leaves to the roots and rhizosphere, and with a simultaneous increase in microbial, fungal, and root activity at higher temperatures during the warmer months [43,56]. The impact of soil moisture on soil respiration (mostly parabolic relationships) has also been reported in earlier studies (e.g., [4,43,57,58]). We did not find trends between air moisture and instantaneous soil CO2 fluxes, but soil-moisture measurements were not investigated in this study.
4.1.2. Impact of Dominant Vegetation Type and Initially Applied Soil-Fertilisation on Soil CO2 Fluxes
The type and composition of vegetation—although secondary to climatic and substrate factors—is an important determinant of soil respiration rate, affecting soil respiration by influencing soil physical and chemical properties, such as microclimate and soil bulk density, the quality and quantity of dead organic matter (plant litter: detritus, which feeds soil organisms) supplied to the soil and the overall rate of root respiration [26,34,59,60]. Our results—which show significantly lower instantaneous soil CO2 fluxes in plots dominated by deciduous trees or willow coppice compared to RCG plots—support conclusions affirming the importance of vegetation type on soil CO2 fluxes, as well as conclusions asserting that soil respiration is consistently lower in tree-dominated ecosystems—including tree rows in AF systems—than in grassland or other agricultural practices under similar conditions [26,34]. This may most likely be explained by the dense rhizosphere associated with high microbial activity and higher root density and thus the amount of C allocated to the roots in grasslands [34]. In addition, we found a positive correlation between instantaneous soil CO2 fluxes and total root biomass, indirectly confirming the contribution of root respiration to total soil CO2 fluxes. At the same time, many studies were found stating that development of the root system decreases soil bulk density [61]; therefore, increased porosity can be associated with increased gas exchange, and thus with higher GHG emissions [62]. Similarly, a positive influence of rooting on annual soil CO2 efflux has previously been found; for instance, on a bioenergy plantation of fast-growing Populus trees [21]. However, our finding contrasts with that of Shao, who did not observe any significant differences in average soil CO2 fluxes between cropland AF and monoculture systems [4], and with that of Peichl et al. [10], Bailey et al. [63], Medinski et al. [43], and Amadi et al. [7,31], who found higher soil CO2 fluxes under trees than in the adjacent agricultural areas. Higher soil CO2 fluxes under trees were explained by enhanced tree-root respiration and microbial activity due to modified microclimate and the litter cover providing a continuous source of available organic matter [7].
Vegetation also influences soil respiration rates through differences in the quantity and quality of litter produced (dead organic matter supplied to the soil); the availability of organic substrate is a critical factor for microbial growth, and, thus, soil respiration increases with increasing production of plant litter [26,56]. In our study, the lack of correlations between mean soil CO2 fluxes and biomass of tree above-ground litter across subplots was probably due to the local scale of the study (there is less variation in soil respiration rates among nearby stands than at broader geographic scales, as emphasised, for instance, by Raich and Tufekcioglu [26]). Nevertheless, in the willow coppice plots, the higher annual soil CO2 flows in plots initially fertilised with sewage sludge (compared to control sites) can be explained by the additional input of organic matter through initial fertilisation and the higher input of litter, as evidenced by the study results. Furthermore, more intensive mineralization of organic compounds by microorganisms has been observed in areas with greater availability of N sources [62], as it is in our plots initially fertilised with sewage sludge (relatively the highest N input through initial fertilisation, Table 1). In addition, in the plots dominated by deciduous trees and willow coppice, we found a positive correlation between soil CO2 fluxes and basal area, characterising the net primary productivity of above-ground tree parts. A higher primary production usually results in higher litter production supplied to the soil; thus, a greater amount of C substrates are available for soil microorganisms, leading to a positive correlation between soil heterotrophic respiration and gross primary production [19].
4.2. CH4 Fluxes
The annual soil CH4 uptake (removal) rates in the deciduous tree AF-system plots and RCG plots (1.19 ± 0.57 and 1.16 ± 0.45 kg CH4-C ha−1 yr−1, respectively) were similar to that reported for AF systems in cropland with a Phaeozem soil type (loam) (0.8–1.0 kg CH4-C ha−1 yr−1 [4]), for poplar short rotation coppice (0.5–1.2 kg CH4-C ha−1 yr−1 [30]) and for miscanthus and willow coppice (0.0–0.3 and 0.6–0.9 kg CH4-C ha−1 yr−1, respectively [55]) in Germany. Kim et al. calculated, based on a compilation of 26 data sets from 15 peer-reviewed publications of net changes in CH4 emissions, that soils under AF oxidise 1.6 ± 1.0 kg CH4 ha−1 yr−1 [6]. In contrast to the deciduous tree and RCG plots, the willow coppice plots estimated within this study were CH4 sources (with annual CH4 emissions of 6.39 ± 6.39 kg CH4-C ha−1 yr−1).
4.2.1. Impact of Seasonality and Environmental Factors on CH4 Fluxes
Although significant differences in instantaneous soil CH4 fluxes between seasons were found, our study and most others (e.g., [7]) did not observe any strong relationship between instantaneous soil CH4 fluxes and temperature. Only moderate negative correlations between soil CH4 fluxes and soil temperature were found in the RCG plots. Previous studies have demonstrated that temperature was more important in CH4-source soils [64].
Higher mean soil CH4 fluxes (emissions) in willow coppice plots can be explained by periodically high groundwater level, specifically in willow coppice plots, creating anoxic conditions. Previous studies have demonstrated that soil moisture is the dominant soil CH4-flux controlling factor (e.g., [7]) especially in CH4-sink soils [64]. Soil moisture influences methanogenic activity and CH4 oxidation by restricting O2 diffusivity from the atmosphere into the soil, thus allowing soil CH4 fluxes [4,29]. An earlier study showed larger soil CH4 uptakes when soil water content was low [4]. Within this study, soil moisture was not monitored.
4.2.2. Impact of Dominant Vegetation Type and Initially Applied Soil Fertilisation on Soil CH4 Fluxes
In general, tree introduction in agricultural land may alter CH4 fluxes from soil, due to increased sources of methanogenic substrate (labile carbohydrates: appropriate materials for the process of CH4 production), increased soil organic C promoting CH4 oxidation, and shifts in methanotroph community structure and activity [65]. Studies on soil CH4 fluxes in AF systems have shown that the introduction of woody vegetation into cropping systems may significantly increase soil CH4 consumption [7]. Like Kim et al. [6,66], we did not find a significantly higher CH4 uptake in the deciduous tree AF-system plots compared to their adjacent RCG plots. At the study site, woody vegetation introduction on agricultural land promoted a decrease in soil bulk density [67]. Theoretically, the lower soil bulk density and greater microporosity promotes gas diffusivity (soil aeration) and thus increases CH4 consumption by methanotrophs [6,7,10]. Like soil moisture, soil bulk density was not measured in this study but should be included in future studies.
Statistically significant differences in instantaneous soil CH4 fluxes between soil-fertilisation practices were found in all plots except those dominated by hybrid alder. Higher mean soil CH4 fluxes (emissions) in plots initially fertilised with sewage sludge (relatively the highest N input through initial fertilisation, Table 1) were found in the willow coppice and RCG plots. This probably can be attributed to the inhibition effect of nitrogen fertiliser on CH4-oxidizing bacteria due to the competence between NH4+ and CH4 at the enzymatic level [29,68,69].
4.3. N2O Fluxes
In AF systems, the annual soil N2O fluxes in deciduous tree plots (1.00 ± 0.22 kg N2O-N ha−1 yr−1), willow coppice plots (from 0.46 ± 0.31 to 1.76 ± 0.40 kg N2O-N ha−1 yr−1 depending on initial fertilisation practice), and RCG plots (1.14 ± 0.58 kg N2O-N ha−1 yr−1) were similar to those reported for shelterbelt soils (0.65 kg N2O-N ha−1 yr−1 [7]) in Canada, for poplar short rotation coppice and grassland (<0.1 and 0.8 kg N2O-N ha−1 yr−1 [30]) and for miscanthus and willow coppice (−0.05–1.41 and −0.001–0.05 kg N2O ha−1 yr−1, respectively [55]), in Germany. The abovementioned Kim et al. meta-analysis calculated that soils under AF emitted 7.7 ± 3.3 kg N2O ha−1 yr−1 [6], emphasising that AF type determines the difference in soil N2O fluxes between AF and adjacent agricultural land.
4.3.1. Impact of Seasonality and Environmental Factors on N2O Fluxes
Like the case of soil CO2 fluxes among seasons, we recorded decreases of soil N2O fluxes in the following order: summer, autumn, spring, winter. The highest soil N2O fluxes were detected during the summer (with mean values ranging from 0.020 ± 0.001 to 0.039 ± 0.005 mg N2O-N m−2 h−1), while the lowest fluxes were detected in winter (mean values ranged from −0.002 ± 0.003 to 0.005 ± 0.001 mg N2O-N m−2 h−1), highlighting the importance of temperature for biological processes determining soil N2O fluxes. Amadi et al. found increased N2O emissions in spring (following thawing of frozen soils), when a cumulative effect involving soil moisture, the presence of surplus N from fertilization, and substrate for the soil microbial community due to residue decomposition promoted denitrification, facilitating N2O emissions [7].
4.3.2. Impact of Dominant Vegetation Type and Initially Applied Soil Fertilisation on Soil N2O Fluxes
Tree presence in agricultural land can affect the soil microbial community and inhibit the denitrification process in the soil due to tree root uptake of residual N and the moderating effect on microclimate caused by taking up excess soil water [7,31,70]. Several studies have found higher soil N2O emissions in conventional monocropping systems compared to tree-based AF systems, because they did not receive N fertilizer (e.g., [31,71,72]). Among the plots dominated by different deciduous tree species, willow coppice, and RCG that we studied, significant differences in instantaneous soil N2O fluxes were not detected.
As in the case of soil CO2 fluxes, an impact of initially used soil fertilisation practices was found only in plots dominated by willow coppice, where higher instantaneous soil N2O fluxes were recorded in plots initially fertilised with sewage sludge (with which the comparatively largest amount of additional N was initially applied). This agrees with Kavdir et al. [73] and Gauder et al. [55], who also found remarkable differences in observed soil N2O fluxes between N-fertilisation regimes. Thus, the presence of available N in saturated soils has been considered a favorable condition for increased soil N2O emissions [31]. In addition, among numerous abiotic factors and physicochemical soil properties that affect the production and consumption of N2O in soils, several studies have found that annual N2O fluxes were more closely related to the soil C/N ratio than to other parameters [74]. Although soil C/N ratio in the study sites had a narrow range—from 9.1 to 12.9—we found a slight impact of soil C/N ratio on soil N2O fluxes (a moderate negative correlation was found). In general, the detected soil C/N ratio range in the study sites corresponded to the soil C/N ratio values (~11) at which the highest N2O fluxes are expected [24].
4.4. Limitations of the Study and Necessity for Further Research
This study supported the knowledge of soil-to-atmosphere GHG fluxes in AF systems specific to hemiboreal regions. Nevertheless, to quantify the total climate change mitigation potential of these land use systems and to analyze more deeply the factors causing the differences in GHG emissions, several missing aspects of the study and necessity for further research were identified. Missing aspects include soil moisture and soil bulk density measurements which should be included in future studies. To delineate region-specific CO2 emissions factors for AF systems in agricultural land with mineral soil for the IPCC accounting system, continuation of the study would have to include quantitative estimation of the contribution of autotrophic and heterotrophic respiration to total soil respiration and C input through above and below ground litter of vegetation. Additionally, it is necessary to include in the further study different type of hemiboreal AF systems (e.g., shelterbelts, buffer strips and hedges) with different soil types including those with organic soils.
5. Conclusions
In hemiboreal AF systems with mineral soil combining deciduous trees and willow coppice with adjacent perennial grass cover, temperature is the most important determinant of instantaneous soil-to-atmosphere CO2 (sum of autotrophic and heterotrophic respiration) and N2O fluxes, while there were no pronounced relationships between temperature and soil CH4 fluxes. Consequently, the highest soil CO2 and N2O fluxes were detected during the summer. Dominant vegetation type is also an important determinant of soil-to-atmosphere GHG fluxes. Among the studied AF systems, RCG plots showed a significantly higher mean instantaneous CO2 flux compared to other plots, while the highest mean instantaneous CH4 fluxes were found in plots dominated by willow coppice, but no impact of dominant vegetation type on instantaneous soil N2O fluxes was found. Screening of relationships between annual soil GHG fluxes, soil general chemistry, and parameters of vegetation highlighted a slight impact (negative correlation) of soil C/N ratio on soil N2O fluxes, but soil CO2 fluxes positively correlated with total root biomass and, in plots dominated by deciduous trees and willow coppice, soil CO2 fluxes positively correlated with basal area. Particularly in willow coppice AF systems, higher instantaneous soil GHG fluxes were recorded in plots initially fertilised with organic matter and N-rich fertiliser (sewage sludge) compared to control sites and sites initially fertilized with mineral fertiliser (wood ash).
Supplementary Materials
The following supporting information can be downloaded at: https://www.mdpi.com/article/10.3390/land12030715/s1, Figure S1: Relationships between soil CO2 and N2O fluxes and soil and air temperature, grouped by dominant vegetation type (deciduous trees, willow coppice or RCG) in plots of agroforestry systems.
Author Contributions
Conceptualization, D.L., A.B. (Andis Bārdulis) and K.M.; methodology, D.L. and K.M.; software, A.B. (Andis Bārdulis); validation, A.B. (Arta Bārdule) and D.P.; investigation, A.B. (Andis Bārdulis), D.P. and K.M.; resources, D.L.; data curation, K.M., A.B. (Andis Bārdulis) and D.P.; writing—original draft preparation, A.B. (Andis Bārdulis), D.P., K.M. and A.B. (Arta Bārdule); writing—review and editing, D.L. and A.B. (Arta Bārdule); visualization, A.B. (Andis Bārdulis), D.P. and K.M.; supervision, D.L.; project administration, A.B. (Andis Bārdulis), K.M. and D.L.; funding acquisition, A.B. (Andis Bārdulis), D.L. and K.M. All authors have read and agreed to the published version of the manuscript.
Funding
This research was funded by: (1) the European Regional Development Fund’s (ERDF) Post-doctoral research project “Evaluation of climate change mitigation potential of agroforestry systems with mineral and organic soils” (No. 1.1.1.2/VIAA/4/20/684) (Andis Bārdulis’ and Dana Purviņa’s contribution, measurements and analyses of deciduous trees AF systems) and (2) the European Regional Development Fund’s (ERDF) project “Elaboration of innovative White Willow—perennial grass agroforestry systems on marginal mineral soils improved by wood ash and less demanded peat fractions amendments” (No. 1.1.1.1/19/A/112) (Arta Bardule’s and Kristaps Makovskis’ contribution, measurements and analyses of willow coppice AF systems), and (3) the European Regional Development Fund’s (ERDF) project “Climate change mitigation potential of trees in shelter belts of drainage ditches in cropland and grassland”(No. 1.1.1.1/21/A/030) (Dagnija Lazdina’s contribution, analyses of deciduous trees environmental impact, productivity and GHG capture potential).
Data Availability Statement
Data available on request made to the corresponding author Andis Bārdulis.
Acknowledgments
Field measurements of soil GHG fluxes and Kristaps Makovskis’ contribution was funded by the EEA and Norway Grants project “Sustainable use of soil resources in the changing climate (SUCC)” (No. 1.4-6/19/2). Article processing charge was funded by the ERDF project “Climate change mitigation potential of trees in shelter belts of drainage ditches in cropland and grassland” (No. 1.1.1.1/21/A/030). We thank the Latvia University of Life Science and Technologies (Agriculture Institute) for maintenance of experimental—demo area established as joint activity during the ERDF project “Elaboration of models for establishment and management of multifunctional plantations of short rotation energy crops and deciduous trees” (No. 2010/0268/2DP/2.1.1.2.0/10/APIA/VIAA/118) (2010-2013). Many thanks to the personnel of the LSFRI Silava Genetic Resource Centre (Krišs Bitenieks and Dainis Edgars Ruņģis), Forest Regeneration and Establishment research group and Laboratory of Forest Environment for their help in soil sampling, field measurements and conducting the sample analyses. We also thank Jānis Ivanovs (LSFRI Silava) for helping to prepare Figure 1.
Conflicts of Interest
The authors declare no conflict of interest.
References
- Nair, P.K.R.; Buresh, R.J.; Latt, C.R. Nutrient cycling in tropical agroforestry systems: Myths and science. In Agroforestry in Sustainable Agricultural Systems; Buck, I.E., Fernandes, E.C.M., Eds.; Lewis Publishers Inc.: Boca Raton, FL, USA, 1999; pp. 1–31. [Google Scholar]
- Selecky, T.; Bellingrath-Kimura, S.D.; Kobata, Y.; Yamada, M.; Guerrini, I.A.; Umemura, H.M.; Dos Santos, D.A. Changes in carbon cycling during development of successional agroforestry. Agriculture 2017, 7, 25. [Google Scholar] [CrossRef]
- Shi, M.; Li, Q.; Zhang, H.; Sun, J.; Zhang, J.; Song, X. Agroforestry alters the fluxes of greenhouse gases of Moso bamboo plantation soil. Environ. Res. Lett. 2022, 17, 115003. [Google Scholar] [CrossRef]
- Shao, G. Soil Greenhouse Gas (N2O, CO2 and CH4) Fluxes from Cropland Agroforestry and Monoculture Systems. Ph.D. Thesis, Georg-August-Universität Göttingen, Göttingen, Germany, 2022. [Google Scholar]
- Cardinael, R.; Chevallier, T.; Barthès, B.G.; Saby, N.P.A.; Parent, T.; Dupraz, C.; Bernoux, M.; Chenu, C. Impact of alley cropping agroforestry on stocks, forms and spatial distribution of soil organic carbon—A case study in a Mediterranean context. Geoderma 2015, 259–260, 288–299. [Google Scholar] [CrossRef]
- Kim, D.G.; Kirschbaum, M.U.F.; Beedy, T.L. Carbon sequestration and net emissions of CH4 and N2O under agroforestry: Synthesizing available data and suggestions for future studies. Agric. Ecosyst. Environ. 2016, 226, 65–78. [Google Scholar] [CrossRef]
- Amadi, C.C.; Van Rees, K.C.J.; Farrell, R.E. Soil-atmosphere exchange of carbon dioxide, methane and nitrous oxide in shelterbelts compared with adjacent cropped fields. Agric. Ecosyst. Environ. 2016, 223, 123–134. [Google Scholar] [CrossRef]
- Pardon, P.; Reubens, B.; Reheul, D.; Mertens, J.; De Frenne, P.; Coussement, T.; Janssens, P.; Verheyen, K. Trees increase soil organic carbon and nutrient availability in temperate agroforestry systems. Agric. Ecosyst. Environ. 2017, 247, 98–111. [Google Scholar] [CrossRef]
- De Stefano, A.; Jacobson, M.G. Soil carbon sequestration in agroforestry systems: A meta-analysis. Agrofor. Syst. 2018, 92, 285–299. [Google Scholar] [CrossRef]
- Peichl, M.; Thevathasan, N.V.; Gordon, A.M.; Huss, J.; Abohassan, R.A. Carbon sequestration potentials in temperate tree-based intercropping systems, southern Ontario, Canada. Agrofor. Syst. 2006, 66, 243–257. [Google Scholar] [CrossRef]
- Tefera, Y.; Hailu, Y.; Siraj, Z. Potential of agroforestry for climate change mitigation through carbon sequestration: Review paper. Agric. Res. Technol. Open Access J. 2019, 22, 556196. [Google Scholar]
- Montagnini, F.; Nair, P.K.R. Carbon sequestration: An underexploited environmental benefit of agroforestry systems. Agrofor. Syst. 2004, 61, 281–295. [Google Scholar]
- Upson, M.A. The Carbon Storage Benefits of Agroforestry and Farm Woodlands. Ph.D. Thesis, Cranfield University, Cranfield, UK, July 2014. [Google Scholar]
- Franzluebbers, A.J.; Chappell, J.C.; Shi, W.; Cubbage, F.W. Greenhouse gas emissions in an agroforestry system of the southeastern USA. Nutr. Cycl. Agroecosyst. 2017, 108, 85–100. [Google Scholar] [CrossRef]
- Toppo, P.; Raj, A. Role of agroforestry in climate change mitigation. J. Pharmacogn. Phytochem. 2018, 7, 241–243. [Google Scholar]
- Quandt, A.; Neufeldt, H.; Gorman, K. Climate change adaptation through agroforestry: Opportunities and gaps. Curr. Opin. Environ. Sustain. 2023, 60, 101244. [Google Scholar] [CrossRef]
- Högberg, P.; Nordgren, A.; Högberg, M.N.; Ottosson-Löfvenius, M.; Bhupinderpal-Singh; Olsson, P.; Linder, S. Fractional contributions by autotrophic and heterotrophic respiration to soil-surface CO2 efflux in Boreal forests. In The Carbon Balance of Forest Biomes; Griffiths, H., Jarvis, P.G., Eds.; Taylor & Francis Group: Abingdon, UK, 2005; pp. 251–267. [Google Scholar]
- Phillips, C.L.; Nickerson, N. Soil respiration. In Reference Module in Earth Systems and Environmental Sciences; Elsevier: Amsterdam, The Netherlands, 2015. [Google Scholar]
- Tang, X.; Du, J.; Shi, Y.; Lei, N.; Chen, G.; Cao, L.; Pei, X. Global patterns of soil heterotrophic respiration—A meta-analysis of available dataset. CATENA 2020, 191, 104574. [Google Scholar] [CrossRef]
- Tang, X.; Pei, X.; Lei, N.; Luo, X.; Liu, L.; Shi, L.; Chen, G.; Liang, J. Global patterns of soil autotrophic respiration and its relation to climate, soil and vegetation characteristics. Geoderma 2020, 369, 114339. [Google Scholar] [CrossRef]
- Verlinden, M.S.; Broeckx, L.S.; Wei, H.; Ceulemans, R. Soil CO2 efflux in a bioenergy plantation with fast-growing Populus trees—Influence of former land use, inter-row spacing and genotype. Plant Soil 2013, 369, 631–644. [Google Scholar] [CrossRef]
- Li, C.; Peng, Y.; Nie, X.; Yang, Y.; Yang, L.; Li, F.; Fang, K.; Xiao, Y.; Zhou, G. Differential responses of heterotrophic and autotrophic respiration to nitrogen addition and precipitation changes in a Tibetan alpine steppe. Sci. Rep. 2018, 8, 16546. [Google Scholar] [CrossRef]
- Epron, D. Separating autotrophic and heterotrophic components of soil respiration: Lessons learned from trenching and related root-exclusion experiments. In Soil Carbon Dynamics: An Integrated Methodology; Kutsch, W., Bahn, M., Heinemeyer, A., Eds.; Cambridge University Press: Cambridge, UK, 2010; pp. 157–168. [Google Scholar]
- Oertel, C.; Matschullat, J.; Zurba, K.; Zimmermann, F.; Erasmi, S. Greenhouse gas emissions from soils—A review. Geochemistry 2016, 76, 327–352. [Google Scholar] [CrossRef]
- Beule, L.; Lehtsaar, E.; Corre, M.D.; Schmidt, M.; Veldkamp, E.; Karlovsky, P. Poplar rows in temperate agroforestry croplands promote bacteria, fungi, and denitrification genes in soils. Front. Microbiol. 2019, 10, 3108. [Google Scholar] [CrossRef]
- Raich, J.W.; Tufekcioglu, A. Vegetation and soil respiration: Correlations and controls. Biogeochemistry 2000, 48, 71–90. [Google Scholar] [CrossRef]
- Butterbach-Bahl, K.; Sander, B.O.; Pelster, D.; Díaz-Pinés, E. Quantifying greenhouse gas emissions from managed and natural soils. In Methods for Measuring Greenhouse Gas Balances and Evaluating Mitigation Options in Smallholder Agriculture; Rosenstock, T., Rufino, M., Butterbach-Bahl, K., Wollenberg, L., Richards, M., Eds.; Springer: Cham, Switzerland, 2016; pp. 71–96. [Google Scholar]
- Dutaur, L.; Verchot, L.V. A global inventory of the soil CH4 sink. Glob. Biogeochem. Cycles 2007, 21, GB4013. [Google Scholar] [CrossRef]
- Dlamini, J.; Cardenas, L.M.; Tesfamariam, E.H.; Dunn, R.M.; Hawkins, J.M.B.; Blackwell, M.S.A.; Evans, J.; Collins, A.L. Soil methane (CH4) fluxes in cropland with permanent pasture and riparian buffer strips with different vegetation. J. Plant. Nutr. Soil Sci. 2021, 185, 132–144. [Google Scholar] [CrossRef]
- Walter, K.; Don, A.; Flessa, H. Net N2O and CH4 soil fluxes of annual and perennial bioenergy crops in two central German regions. Biomass Bioenergy 2015, 81, 556–567. [Google Scholar] [CrossRef]
- Amadi, C.C.; Farrell, R.E.; Van Rees, K.C.J. Greenhouse gas emissions along a shelterbelt-cropped field transect. Agric. Ecosyst. Environ. 2017, 241, 110–120. [Google Scholar] [CrossRef]
- Ussiri, D.; Lal, R. Soil Emission of Nitrous Oxide and Its Mitigation; Springer: Dordrecht, The Netherlands, 2013; pp. 63–89. [Google Scholar]
- Wachiye, S.; Merbold, L.; Vesala, T.; Rinne, J.; Räsänen, M.; Leitner, S.; Pellikka, P. Soil greenhouse gas emissions under different land-use types in savanna ecosystems of Kenya. Biogeosciences 2020, 17, 2149–2167. [Google Scholar] [CrossRef]
- Schaufler, G.; Kitzler, B.; Schindlbacher, A.; Skiba, U.; Sutton, M.A.; Zechmeister-Bolternstern, S. Greenhouse gas emissions from European soils under different land use: Effects of soil moisture and temperature. Eur. J. Soil Sci. 2010, 61, 683–696. [Google Scholar] [CrossRef]
- Huang, X.; Lu, X.; Zhou, G.; Shi, Y.; Zhang, D.; Zhang, W.; Hosseini Bai, S. How land-use change affects soil respiration in an alpine agro-pastoral ecotone. CATENA 2022, 214, 106291. [Google Scholar] [CrossRef]
- A European Green Deal. Available online: https://commission.europa.eu/strategy-and-policy/priorities-2019-2024/european-green-deal_en (accessed on 1 March 2023).
- The Paris Agreement. Available online: https://unfccc.int/process-and-meetings/the-paris-agreement (accessed on 1 March 2023).
- Land Use and Forestry Regulation for 2021–2030. Available online: https://climate.ec.europa.eu/eu-action/forests-and-agriculture/land-use-and-forestry-regulation-2021-2030_en (accessed on 1 March 2023).
- Sharma, H.; Pant, K.S.; Bishist, R.; Gautam, K.L.; Ludarmani; Dogra, R.; Kumar, M.; Kumar, A. Estimation of biomass and carbon storage potential in agroforestry systems of north western Himalayas, India. CATENA 2023, 225, 107009. [Google Scholar] [CrossRef]
- Golicz, K.; Bellingrath-Kimura, S.; Breuer, L.; Wartenberg, A.C. Carbon accounting in European agroforestry systems—Key research gaps and data needs. Curr. Res. Environ. Sustain. 2022, 4, 100134. [Google Scholar] [CrossRef]
- Cardinael, R.; Cadisch, G.; Gosme, M.; Oelbermann, M.; van Noordwijk, M. Climate change mitigation and adaptation in agriculture: Why agroforestry should be part of the solution. Agric. Ecosyst. Environ. 2021, 319, 107555. [Google Scholar] [CrossRef]
- Kay, S.; Rega, C.; Moreno, G.; den Herder, M.; Palma, J.H.N.; Borek, R.; Crous-Duran, J.; Freese, D.; Giannitsopoulos, M.; Graves, A.; et al. Agroforestry creates carbon sinks whilst enhancing the environment in agricultural landscapes in Europe. Land Use Policy 2019, 83, 581–593. [Google Scholar] [CrossRef]
- Medinski, T.V.; Freese, D.; Böhm, C. Soil CO2 flux in an alley-cropping system composed of black locust and poplar trees, Germany. Agrofor. Syst. 2015, 89, 267–277. [Google Scholar] [CrossRef]
- Kārkliņš, A.; Rancāne, S. Augsnes Apraksts, Reģ. Nr. AI0103; LLU Augsnes un Augu Zinātņu Institūts: Skrīveri, Latvija, 2012; pp. 1–2. [Google Scholar]
- Kārkliņš, A.; Rancāne, S. Augsnes Apraksts, Reģ. Nr. AI0104; LLU Augsnes un Augu Zinātņu Institūts: Skrīveri, Latvija, 2012; pp. 1–2. [Google Scholar]
- FAO. World Reference Base for Soil Resources 2014: International Soil Classification System for Naming Soils and Creating Legends for Soil Maps; Food and Agriculture Organization of the United Nations: Rome, Italy, 2015; p. 203. [Google Scholar]
- Latvian Environment, Geology and Meteorology Centre. Meteorological Network. Available online: https://videscentrs.lvgmc.lv/ (accessed on 7 February 2023).
- Pavelka, M.; Acosta, M.; Kiese, R.; Altimir, N.; Brümmer, C.; Crill, P.; Darenova, E.; Fuß, R.; Gielen, B.; Graf, A.; et al. Standardisation of chamber technique for CO2, N2O and CH4 fluxes measurements from terrestrial ecosystems. Int. Agrophysics 2018, 32, 569–587. [Google Scholar] [CrossRef]
- Darenova, E.; Pavelka, M.; Acosta, M. Diurnal deviations in the relationship between CO2 efflux and temperature: A case study. CATENA 2014, 123, 263–269. [Google Scholar] [CrossRef]
- Loftfield, N.; Flessa, H.; Augustin, J.; Beese, F. Automated gas chromatographic system for rapid analysis of the atmospheric trace gases methane, carbon dioxide, and nitrous oxide. J. Environ. Qual. 1997, 26, 560–564. [Google Scholar] [CrossRef]
- Liepiņš, J.; Lazdiņš, A.; Liepiņš, K. Equations for estimating above- and belowground biomass of Norway spruce, Scots pine, Birch spp. and European aspen in Latvia. Scand. J. For. Res. 2018, 33, 58–70. [Google Scholar] [CrossRef]
- Liepiņš, J.; Liepiņš, K.; Lazdiņš, A. Equations for estimating the above- and belowground biomass of grey alder (Alnus incana (L.) Moench.) and common alder (Alnus glutinosa L.) in Latvia. Scand. J. For. Res. 2021, 36, 389–400. [Google Scholar] [CrossRef]
- Ukonmaanaho, L.; Pitman, R.; Bastrup-Birk, A.; Breda, N.; Rautio, P. Sampling and analysis of litterfall. In Manual on Methods and Criteria for Harmonized Sampling, Assessment, Monitoring and Analysis of the Effects of Air Pollution on Forests, I, Part XIII; UNECE and ICP Forests Programme Co-ordinating Centre, Ed.; Thünen Institute for Forests Ecosystems: Eberswalde, Germany, 2016; 14p. [Google Scholar]
- R Core Team. The R Project for Statistical Computing. Available online: https://www.R-project.org (accessed on 7 February 2023).
- Gauder, M.; Butterbach-Bahl, K.; Graeff-Hönninger, S.; Claupein, W.; Wiegel, R. Soil-derived trace gas fluxes from different energy crops—Results from a field experiment in Southwest Germany. GCB Bioenergy Bioprod. Sustain. Bioeconomy 2012, 4, 289–301. [Google Scholar] [CrossRef]
- Kuzyakov, Y.; Gavrichkova, O. REVIEW: Time lag between photosynthesis and carbon dioxide efflux from soil: A review of mechanisms and controls. Glob. Change Biol. 2010, 16, 3386–3406. [Google Scholar] [CrossRef]
- Smith, K.A.; Ball, T.; Conen, F.; Dobbie, K.E.; Massheder, J.; Rey, A. Exchange of greenhouse gases between soil and atmosphere: Interactions of soil physical factors and biological processes. Eur. J. Soil Sci. 2003, 54, 779–791. [Google Scholar] [CrossRef]
- Hursh, A.; Ballantyne, A.; Cooper, L.; Maneta, M.; Kimball, J.; Watts, J. The sensitivity of soil respiration to soil temperature, moisture, and carbon supply at the global scale. Glob. Change Biol. 2017, 23, 2090–2103. [Google Scholar] [CrossRef] [PubMed]
- Laganière, J.; Angers, D.; Paré, D. Carbon accumulation in agricultural soils after afforestation: A meta-analysis. Glob. Change Biol. 2010, 16, 439–453. [Google Scholar] [CrossRef]
- Zhang, X.; Adamowski, J.F.; Deo, R.C.; Xu, X.; Zhu, G.; Cao, J. Effects of afforestation on soil bulk density and pH in the Loess Plateau, China. Water 2018, 10, 1710. [Google Scholar] [CrossRef]
- Wang, W.-J.; Qiu, L.; Zu, Y.-G.; Su, D.-X.; An, J.; Wang, H.-Y.; Zheng, G.-Y.; Sun, W.; Chen, X.-Q. Changes in soil organic carbon, nitrogen, pH and bulk density with the development of larch (Larix gmelinii) plantations in China. Glob. Change Biol. 2011, 17, 2657–2676. [Google Scholar]
- Sánchez-Navarro, V.; Shahrokh, V.; Martínez-Martínez, S.; Acosta, J.A.; Almagro, M.; Martínez-Mena, M.; Boix-Fayos, C.; Díaz-Pereira, E.; Zornoza, R. Perennial alley cropping contributes to decrease soil CO2 and N2O emissions and increase soil carbon sequestration in a Mediterranean almond orchard. Sci. Total Environ. 2022, 845, 157225. [Google Scholar] [CrossRef]
- Bailey, N.J.; Motavalli, P.P.; Udawatta, R.P.; Nelson, K.A. Soil CO2 emissions in agricultural watersheds with agroforestry and grass contour buffer strips. Agrofor. Syst. 2009, 77, 143–158. [Google Scholar] [CrossRef]
- Whalen, S.C.; Reeburgh, W.S. Moisture and temperature sensitivity of CH4 oxidation in boreal soils. Soil Biol. Biochem. 1996, 28, 1271–1281. [Google Scholar] [CrossRef]
- Dou, X.; Zhou, W.; Zhang, Q.; Cheng, X. Greenhouse gas (CO2, CH4, N2O) emissions from soils following afforestation in central China. Atmos. Environ. 2016, 126, 98–106. [Google Scholar] [CrossRef]
- Kim, D.-G.; Isenhart, T.M.; Parkin, T.B.; Schultz, R.C.; Loynachan, T.E. Methane flux in cropland and adjacent riparian buffers with different vegetation covers. J. Environ. Qual. 2010, 39, 97–105. [Google Scholar] [CrossRef]
- Bardule, A. Micro and Macro Element Flows in Short Rotation Hybrid Aspen (Populus tremuloides Michx. × Populus tremula L.) Plantation in Agricultural Land. Ph.D. Thesis, University of Latvia, Riga, Latvia, 19 December 2019. [Google Scholar]
- Bédard, C.; Knowles, R. Physiology, biochemistry, and specific inhibitors of CH4, NH4+, and CO oxidation by methanotrophs and nitrifiers. Microbiol. Rev. 1989, 53, 68–84. [Google Scholar] [CrossRef]
- Veldkamp, E.; Koehler, B.; Corre, M.D. Indications of nitrogen-limited methane uptake in tropical forest soils. Biogeosciences 2013, 10, 5367–5379. [Google Scholar] [CrossRef]
- Allen, S.C.; Jose, S.; Nair, P.K.R.; Brecke, B.J.; Nkedi-Kizza, P.; Ramsey, C.L. Safety-net role of tree roots: Evidence from a pecan (Carya illinoensis K. Koch)—Cotton (Gossypium hirsutum L.) alley cropping system in the southern United States. For. Ecol. Manag. 2004, 192, 395–407. [Google Scholar] [CrossRef]
- Beaudette, C.; Bradley, R.L.; Whalen, J.K.; McVetty, P.B.E.; Vessey, K.; Smith, D.L. Tree-based intercropping does not compromise canola (Brassica napus L.) seed oil yield and reduces soil nitrous oxide emissions. Agric. Ecosyst. Environ. 2010, 139, 33–39. [Google Scholar] [CrossRef]
- Drewer, J.; Finch, J.W.; Lloyd, C.R.; Baggs, E.; Skiba, U. How do soil emissions of N2O, CH4 and CO2 from perennial bioenergy crops differ from arable annual crops? GCB Bioenergy 2011, 4, 408–419. [Google Scholar] [CrossRef]
- Kavdir, Y.; Hellebrand, H.J.; Kern, J. Seasonal variations of nitrous oxide emission in relation to nitrogen fertilization and energy crop types in sandy soil. Soil Tillage Res. 2008, 98, 175–186. [Google Scholar] [CrossRef]
- Yao, Z.; Yan, G.; Ma, L.; Wang, Y.; Zhang, H.; Zheng, X.; Wang, R.; Liu, C.; Wang, Y.; Zhu, B.; et al. Soil C/N ratio is the dominant control of annual N2O fluxes from organic soils of natural and semi-natural ecosystems. Agric. For. Meteorol. 2022, 327, 109198. [Google Scholar] [CrossRef]
Disclaimer/Publisher’s Note: The statements, opinions and data contained in all publications are solely those of the individual author(s) and contributor(s) and not of MDPI and/or the editor(s). MDPI and/or the editor(s) disclaim responsibility for any injury to people or property resulting from any ideas, methods, instructions or products referred to in the content. |
© 2023 by the authors. Licensee MDPI, Basel, Switzerland. This article is an open access article distributed under the terms and conditions of the Creative Commons Attribution (CC BY) license (https://creativecommons.org/licenses/by/4.0/).

